
Submitted:
10 April 2025
Posted:
11 April 2025
You are already at the latest version
Abstract
Blood samples and testing are routine in health care. Presently there is a growing interest in using tear samples in place of blood. Tear samples can be obtained non-invasively and collection does not require the skills of a trained phlebotomist. Red blood cells and other cells are not present in tears which avoids centrifugation. Importantly, basal tears samples contain most of the biomarkers present in blood. The difficulty is the small volume of basal tears which is about 7 μL in each eye. At present any contact with the eye results in additional reflex tears with a different chemical composition. The small tear samples are collected with capillary tubes and then sent out for amplified assays, such as enzyme-linked immunosorbent assay (ELISA) or polymerase chain reaction (PCR). The results are not available for days or a week and therefore less useful in an ophthalmology office. We propose the use of a contact lens which contains bound antibodies for fluorescence immunoassays. At present, the lenses could be removed from the patient for point-of-care measurements at the bedside. To prove this concept is possible we performed a three-protein layer capture assay which mimics an immunoassay. For convenience we used lysozyme (Lys) which spontaneously coats silicon hydrogel (SiHG) contact lenses (CL). Anti-lysozyme IgG was the second layer captured, anti-lysozyme was considered to be the target biomarker. The third layer was rhodamine or Alexa Fluor-labeled Ab against the IgG Fc region, considered to be the detection anti-body. The multiple protein layers were stable and did not wash off the SiHG lenses. These results strongly suggest the contact lens can be used for capture immunoassays for a wide variety of biomarkers.
Keywords:
Contact Lens
; Silicon Hydrogel Lenses
; Lysozyme
; Biomarker Detecting Tears
; Fluorescein
1. Introduction
Blood samples are used for diagnostic testing [1,2]. Apart from conventional electrolyte panels, specific assays are used to detect a wide variety of biomarkers linked to heart disease, bladder disease, lung disease, pancreatic cancer, breast cancer, and diabetic retinopathy [3,4,5,6,7,8]. The list of known biomarkers in blood is extensive [9,10,11,12], additional novel biomarkers are frequently reported [13,14]. Other fluids are used for biomarker diagnostic purposes including urine, saliva, and mucosal secretions [20,21]. Siliva is known to possess proteases that have the capability to degrade some biomarkers. The use of urine biomarkers for prostate cancer detection is influenced by the pH of urine, which might impact the observed concentrations of several other biomarkers [22,23]. There have been advances in biomarker detection methods, such as surface plasmon resonance (SPR), 2D chromatography, enzyme-linked immunosorbent assay (ELISA), plasmonic nanoparticles, and liquid chromatography with tandem mass spectrometry (LC-MS/MS) [15,16,17,18,19].
Venous blood samples are considered the most efficient approach for identifying biomarkers and conducting blood tests [24,25].The procedure of extracting blood samples from a vein can be complicated, mostly linked to the following challenges: (i) access to veins is a complex task that requires the participation of skilled healthcare professionals, (ii) the act of collecting blood samples requires clinical ability and adherence to sterile procedures, (iii) Other factors that can complicate the patient's age and weight, and (iv) errors in handling the blood can occur, including clotting, inaccuracies in dilution, and variations in biomarker levels [24,25,26,27,28]. The factors mentioned above are referred to as pre-analytical variability and are believed to be responsible for approximately 90% of diagnostic errors [27]. These problems are even more difficult for lumbar punctures, which require patient sedation. The collection of blood samples using needles is convenient but there is a need for improved methods of collecting body fluid samples for diagnostics.
Collecting tear fluid is a non-invasive method, and tear samples contain a wide range of biomarkers, potentially including all those found in blood [29,30,31]. According to Mitalee et. al., there are more than 100 distinct biomarkers that may be found in tear fluid [29]. A limiting factor in using tears is the difficulty of obtaining an unperturbed sample. The total volume of tears for one eye is about 7 μL [32,33]. Tear samples are commonly acquired by the use of capillary tubes or adsorbent paper strips similar to those used to measure tear output. The samples are sent out to measure electrolyte concentrations or specific biomarker testing [34,35]. Importantly, the eyes are sensitive and any physical contact results in a rapid physical change in the type of tears produced [36,37]. Basal tear fluid, reflex tears, and emotional tears each have a different composition of proteins [38,39]. Because of the small tear volumes available for analysis the biomarker assays are performed using highly sensitive methods such as ELISA, SPR, fluorescence, electrochemical, LC-MS/MS and nanosensors [40,41,42].
Currently, there is a growing trend towards the use of tear fluids for different applications. The identification of biomarkers in tear fluids is a potential alternative to blood-based biomarker detection [30,43,44,45,46]. Because tears do not contain red blood cells and most other circulating cells are removed from tears the samples are already partially purified. Tear films consist of numerous components that create a physical barrier against particles, bacteria, and viruses [43,44,45,46]. Tear films are provided by the constant production of fresh tear fluid by continuous secretions from the lacrimal, Meibomian and reflex glands. Except for a possible short time delay, the tears are in rapid equilibrium with blood [46,47,48]. Tears could be used for biomarker detection if appropriate technology was available for the samples. The processing of the tear samples for such measurements is time consuming and requires a sophisticated apparatus [49,50]. Consequently, such measurements are not currently applicable for point-of-care applications.
Contact lenses (CLs) have many beneficial characteristics for biosensing applications [51,52,53,54]. In addition, CLs establish direct touch with ocular tears and the corneal epithelium. CLs are considered a minimally invasive technologies, are small, light, inexpensive, and portable, and may include a variety of sensors [52,53,54,55,56]. The close connection of the many components of the eye and CLs made it possible to develop lenses that can serve as continuous monitoring platforms. Recent studies demonstrated a correlation between glucose levels in tears and blood glucose level with a delay of 10-20 minutes.
Multiple groups have worked on embedding sensors into contact lenses. Google attempted to make a glucose-sensitive contact lens using embedded electronics [52]. This lens used the standard approach with glucose oxidase, electrochemical detection, and radio frequency induction for power (Figure 1). The GlucoLens was announced in 2014 with participation by Novartis, Alphabet, and other companies [51,52,53,54,55,56]. The GlucoLens project was dropped in November 2018. Another example is Mojo Vision, Inc., which started work on a more advanced smart-contact lens in July 2017 and by July 2022, had support from 32 companies [56,57,58]. The Mojo lens was promised to display augmented readily to the wearers. This project was abandoned in January 2023, but Mojo announced new funding to make smart contact lenses [56,57,58]. Other companies were developing contact lenses to detect glaucoma or for image display (Figure 1). However, all these methods require embedding components into the lenses. Few if any of these projects resulted in a final product. These commercial and private efforts demonstrate the difficulty of placing the needed electronics or photonic components within a contact lens. If one of these electronic lenses was successful and designed for long term wear, the components would need to be embedded in a wide variety of contact lens polymers for different patients.
Our approach to making a sensing or biomarker contact lens (BM-CL) is very different from previous efforts. We do not place any electronics or specialized optical components within the lens (Figure 2). The only active components in our BM-CL are fluorescent proteins bound to the contact lens. This approach can be used with most contact lenses in current use, but our experiments found the silicone hydrogel (SiHG) lenses to be most suitable and SiHG lenses are widely used and acceptable to most patients [59,60,61,62]. The fabrication of such lenses can use the extensive publication library on binding proteins to surfaces. Biomarker identification is facilitated by the increasing number of recombinant mono-cloned antibodies which have been developed by industry and private laboratories [63,64,65]. Our approach to surface-labeled contact lenses allows applications beyond biomarkers and extends to most of the electrolytes in tears and glucose [59,60,61,62]. Our unique approach also allows separate measurements on each side of a contact lens, the pre-lens tear film (PLTF) and the post-lens tear film (PoLTF) [62] which may allow selective observation of ocular surface diseases on sensitive epithelia corneal cells (Figure 3A). In this work, we developed a fluorescent immunoassay for the detection of lysozyme on the surfaces of CLs. CLs underwent the first lysozyme coating procedure. To measure fluorescence, a fluorescence immunoassay was established for the lenses, which examined lysozyme uptake and the interaction of primary and secondary antibodies on the lens surface. It is expected that BM-CLs will ultimately serve as a specific coating or antibody conjugation designed to target and identify a wide range of biomarkers.
2. Materials and Methods
We used widely available proteins and antibodies to develop contact lens-based pseudo-immunofluorescence assay. In this study, we used lysozyme (Lys) (Cat. No. 89833, MW 14.38 kDa) and fluorescein-labeled lysozyme (F-Lys) (Cat. No. LS1-FC-1) from ThermoFisher Scientific (USA) and Nanocs (USA), respectively. Lys binds spontaneously to SiHG lenses, and we considered Lys or F-Lys to be the capture protein. We obtained the primary antibodies from Abcam (USA): unlabeled anti-lysozyme antibody (Anti-Lys) (Clone No. EPR2994(2), host-Mouse) and fluorescein-conjugated anti-lysozyme antibody (F-anti-Lys) (Clone No. LZ598-10G9, host-Mouse) (Figure 3B). The F-Lys Ab was considered to be the target antigen to be captured. As detection antibodies, rhodamine red-labeled goat anti-rabbit IgG (Rh-anti-IgG) (Cat. No. R-6394) and Alexa Fluor 647-labeled goat anti-human IgG (AF-anti-IgG) (Cat. No. A-21445) were obtained from ThermoFisher Scientific (USA). Phosphate buffer saline (PBS) pH 7.2 was used for sample dilution and fluorescence measurements throughout this work.
2.1. Selection of Silicone Hydrogel (SiHG) Contact Lens
We selected commercially available and widely used silicone hydrogel (SiHG) Lotrafilcon A (Lot A) (Air Optix lenses from Alcon, USA) contact lenses and Comfilcon A (ConA) Bioaffinity lens from Cooper Vision. The SiHG lenses exhibited distinct chemical and physical characteristics, as detailed in the Supplementary Materials (Table S1). SiHG lenses contain continuous regions of silicone from the front to the back of the lens, and both are expected to have interface regions for binding of hydrophobic binding (Figure S1). Notably, about 65% of new prescriptions are for these SiHG lenses [66,67]. For comparison Table S1 also lists properties for a standard hydrogel (HG) lens. The HG lens displayed lower oxygen transport (Dk) and are worn for shorter periods of time. In previous reports we showed that SiHG lenses can bind either hydrophobic species or highly charged poly-lysine [59,60,61,62]. In the present report we use lysozyme which has a high positive charge and binds strongly to SiHG lenses. The experiments in this report were performed using the Lot A lenses, but similar results were obtained with the ConA lenses (not shown).
2.2. Fluorescence Measurements
Fluorescence measurements were performed using a photon counting spectrofluorometer, the FluoTime 300 from PicoQuant, GMBH. A pulsed laser diode was used for excitation of 470 nm at 40 MHz using an amplified fiber laser for excitation at 532 nm. Some emission spectra and intensities were measured using a Varian Cary Eclipse 4 spectrofluorometer. Intensity and lifetime images of the lenses, and scans across the central axes of the lenses, were performed using an Alba 5 time-resolved laser scanning confocal microscope from ISS, Inc. Excitation was at 473 nm using a 20x objective. A 25 nm pinhole was used for confocal measurements. The observed size was approximately 0.5 mm in diameter with 256 x 256 pixels. The scan across the lenses were measured at intervals of 0.5 mm over the 13 mm lens diameter, with the focus of the objective lens adjusted to the height (z-axis) location in the lens.
3. Results
3.1. SiHG Lens Selection and Lysozyme Binding to Lenses
We used silicone hydrogel (SiHG) lenses, which are easily available and are known for their higher oxygen permeability (DK). The increased DK value is due to the presence of silicone-rich areas, as silicone facilitates oxygen diffusion. Moreover, because of their higher silicone composition, SiHG lenses exhibit significant permeability to water and ions present in tears [59,60,61,62]. This permeability is due to the presence of a semi-interpenetrating polymer network (IPN) with continuous channels of essentially pure water or tear fluid from the front to back surfaces of the lens (Table S1 and Figure S1 in SM). The optical purity of the lenses is due to the size of the water channels being smaller than visible wavelengths, while the structure of the IPN indicates the presence of interface regions transitioning from non-polar to polar within the lens [59,60,61,62]. We have previously developed two methods to attach fluorophores to SiHG lenses, such as (i) the hydrophobic regions of SiHG lenses by covalently linking ion-sensitive fluorophores (ISFs) to long-chain hydrocarbons (i.e., C16 or C18) and (ii) conjugating ISFs to the highly charged polymer poly-L-lysine, which binds rapidly to SiHG lenses [59,60,61,62]. For both methods, the probes could not be washed out of the lenses after weeks in buffer solution, and the binding seems to be irreversible in aqueous solution. In contrast to the SiHG lenses the probes washed out quickly from HG lenses. SiHG lenses are made using polymers that contain free carboxyl groups giving the lens a net negative charge [59,60,61,62]. CLs become coated with proteins after insertion into the eye and localization in the central aqueous layer of the tear film occurs when worn by patients. Human serum albumin (HSA) and Lys are the two proteins that are most often found in tears [68,69]. The binding of Lys molecules to the surface of the lenses was facilitated by the positive charge of Lys at a pH of 7. Notably, Lys is a protein with a size of ∼14.3 kDa consisting of 129 residues. A simple dip experiment was conducted to examine the binding rates of Lys molecules to the lenses at short time intervals (Figure 4A amd 5).
3.2. Tear Flow Across an Eye and Contact Lens
The use of contact lenses to detect biomarkers will require an understanding of tear flow across the eye. Tears originate in the lacrimal and Meibomian glands and flow across the eye to be collected in the lacrimal sac (Figure 3A). Basal level tears are produced at a rate of 1 to 2 microliters (µl) per minute, and the total volume of tears in one eye is replaced in 7 to 9 minutes. The tear film is a complex structure which protects the cornea epithelium. The tear film is hydrophobic near the corneal surface and the outer surface is covered with a lipid layer to reduce the rate of water evaporation. Physical contact with the eye results in a rapid increase in reflex or emotional tears, which has a different composition than basal tears. The remarkable stability of tear films is demonstrated upon the insertion of a contact lens. The contact is quickly localized in the aqueous region of the tear film between the outer layer of lipid and water and the corneal epithelial. This results in two aqueous layers called the PLTF and PoLTF [62].
At this early stage of tear-biomarker research it is not practical to create a precise physical model for tear flow. The PLTF and PoLTF have been reported to be 2 to 8 µm thick. Reported microfluid devices have a minimum sample thickness of 25 µm for completely flat surfaces [71]. The tears can flow along different pathways, above and below the diameter of the lens, and above and below the lens in the PLTF and PoLTF. It would be difficult to create a physical model for tear flow. For these reasons we decided to use a much simpler method to measure protein binding to contact lenses. We used a sample dip rinse and fluorescence measurement to detect the binding of each protein layer to the contact lenses (Figure 4).
The protein binding to Lot A lenses can be effectively accomplished by this simple dipping technique. Lot A lenses were immersed in a phosphate-buffered saline (PBS) buffer solution containing a concentration of 2.25 µM of fluorescein isothiocyanate (FITC) labeled lysozyme (F-Lys) (NanoCS, USA) for a period of 3 minutes (Figure 4A). Then, the lens was subjected to a 3-minute rinsing process using PBS buffer. The lens was then carefully inserted into a cuvette that was filled with PBS buffer (Figure 5A). The contact lens was restrained diagonally in the cuvette, and we attempted to place the lens in the same position after each dip and rinse step. The procedure was replicated systematically at consistent intervals of 3 plus 3 minutes until the intensity of the emission spectrum and/or intensity reached a steady state (Figure 5B). The ISS laser scanning confocal microscope was employed to image the emission of the entire lens before and after the labeling steps. The Lot A lenses were non-fluorescent before labeling and uniformly fluorescent after the labeling steps (insert Figure 5B). The lenses were labeled on both the inner and outer surfaces. Similar results were found for the Con A lenses (not shown).
For clarify we note that the Lot A lens was dipped multiple times into the same 2 ml solution of F-Lys. There was some decrease in volume after each step. For this reason the emission intensities in Figure 5 may be affected by depletion of F-Lys in the labeling solution. As discussed previously, point-of-care testing requires fluorescence measurements which are independent of total intensity or intensity fluctuations [72,73]. The lifetime of F-Lys was measured in the central region during the binding process (Figure 6A). After complete binding measurements were made at 0.5 mm increments the contact lens along the x-axis across the contact lens (Figure 6B). In both cases the intensity varied by more than 10-fold, but the lifetime remained completely constant. This result indicates the lifetime measurements will not require precise lens placement in an external reading device. If needed a reference fluorophore could be added to the SiHG lens for wavelength-ratiometric measurements and/or for determination of the amount of protein bound to the lens.
3.3. Binding of Antibodies to the Contact Lens
In this initial experiment we considered lysozyme to be the capture protein. The next step was to determine if a second protein could be captured on the CL. For this purpose, we used unlabeled lysozyme as the capture protein and fluorescence-labeled anti-lysozyme (F-anti-Lys) as the target protein or the biomarker protein. The Lys-coated lenses were first washed for four hours in PBS and then exposed to a 2 µg/ml solution of F-anti-Lys for 40 minutes (Figure 7). After 8 cycles of binding and rinsing the emission intensity of F-anti-Lys reached a limiting intensity. The lifetime of F-anti-Lys remained constant throughout the binding process (Figure 7).
We used this same lens, coated with Lys and F-anti-Lys to determine if the Rh-anti-IgG detection Ab would bind to the lens with two protein layers (Figure 8). In this experiment the Rh-anti-IgG is considered to be the detection Ab which would be used after the lens is removed from the patient. For this experiment we used an excitation wavelength of 532 nm to avoid fluorescein excitation, but there was still a contribution from fluorescein which has an extinction coefficient of about 2% of its maximal value (1600 M-1 cm-1 compared to 90,000 m-1 cm-1 at its absorbance maximum. The amount of background from F-anti-Lys varied in similar experiments (Figure S2), but the Rh-anti-Ig detection Ab could always be reliably measured. The F-anti-IgG background is the reason the emission maxima shift in Figures 8 and Figure S2. The rate of Rh-anti-Lys binding was strongly dependent on its concentration (Figure 8B). As expected for a biomolecular reaction the binding ratio (from the initial data points) was approximately 5.6-fold faster for a 6.3-fold increase in the Rh-anti-IgG concentration.
To avoid the fluorescence background from fluorescein we made two changes to the experiment. The F-Lys-IgG was replaced with unlabeled Lys-IgG. Additionally, we used a detector Ab labeled with AlexaFluor 647, which has longer absorption and emission maxima than rhodamine. Binding of the detection Ab could now be observed without any unwanted background fluorescence (Figure 9 and S3). The insert in Figures 9 and S3 show the lenses were labeled with the detection Ab. The lifetimes of AF-anti-IgG were found to be the intensity at various portions of the lens (Figure S4).
4. Discussion
The results described above strongly suggest that capture immunoassay can be performed using SiHG contact lenses. As presently designed the biomarker contact lens (BM-CL) will be placed on the patient’s eye for a given period of time, then removed and the emission measured with a nearby fluorescence spectrofluoremeter. Many such devices have been reported using cell phones or other array detectors [74,75,76] and point-of-care measurements are readily available. The excitation light will most likely came from an external source, such as an electroluminescent (EL) panel which are available with single color or multi-color output such as those used in computer servers. Such panels are available at low cost less than $10. The cell phone detectors will require careful setting of the lens and detector to override the automatic features using the cell phone controls or by using dedicated apps [77,78]. Because the BM-CL will be removed from the patient prior to measurement, other types of probes can be used for detection. The so-called time-resolved immunoassay can be performed using long-lifetime lanthanides bound to the detection antibody. In this case the incident light is turned off prior to integrating the long live lanthanide emission [79,80]. The enzyme-amplified ELISA assays could also be used [81]. Recently, an all-organic nanoparticle has been described with decay times of 200 to 300 ms [82]. The authors designed a pocket size reader, without optical filters, costing less than $20.
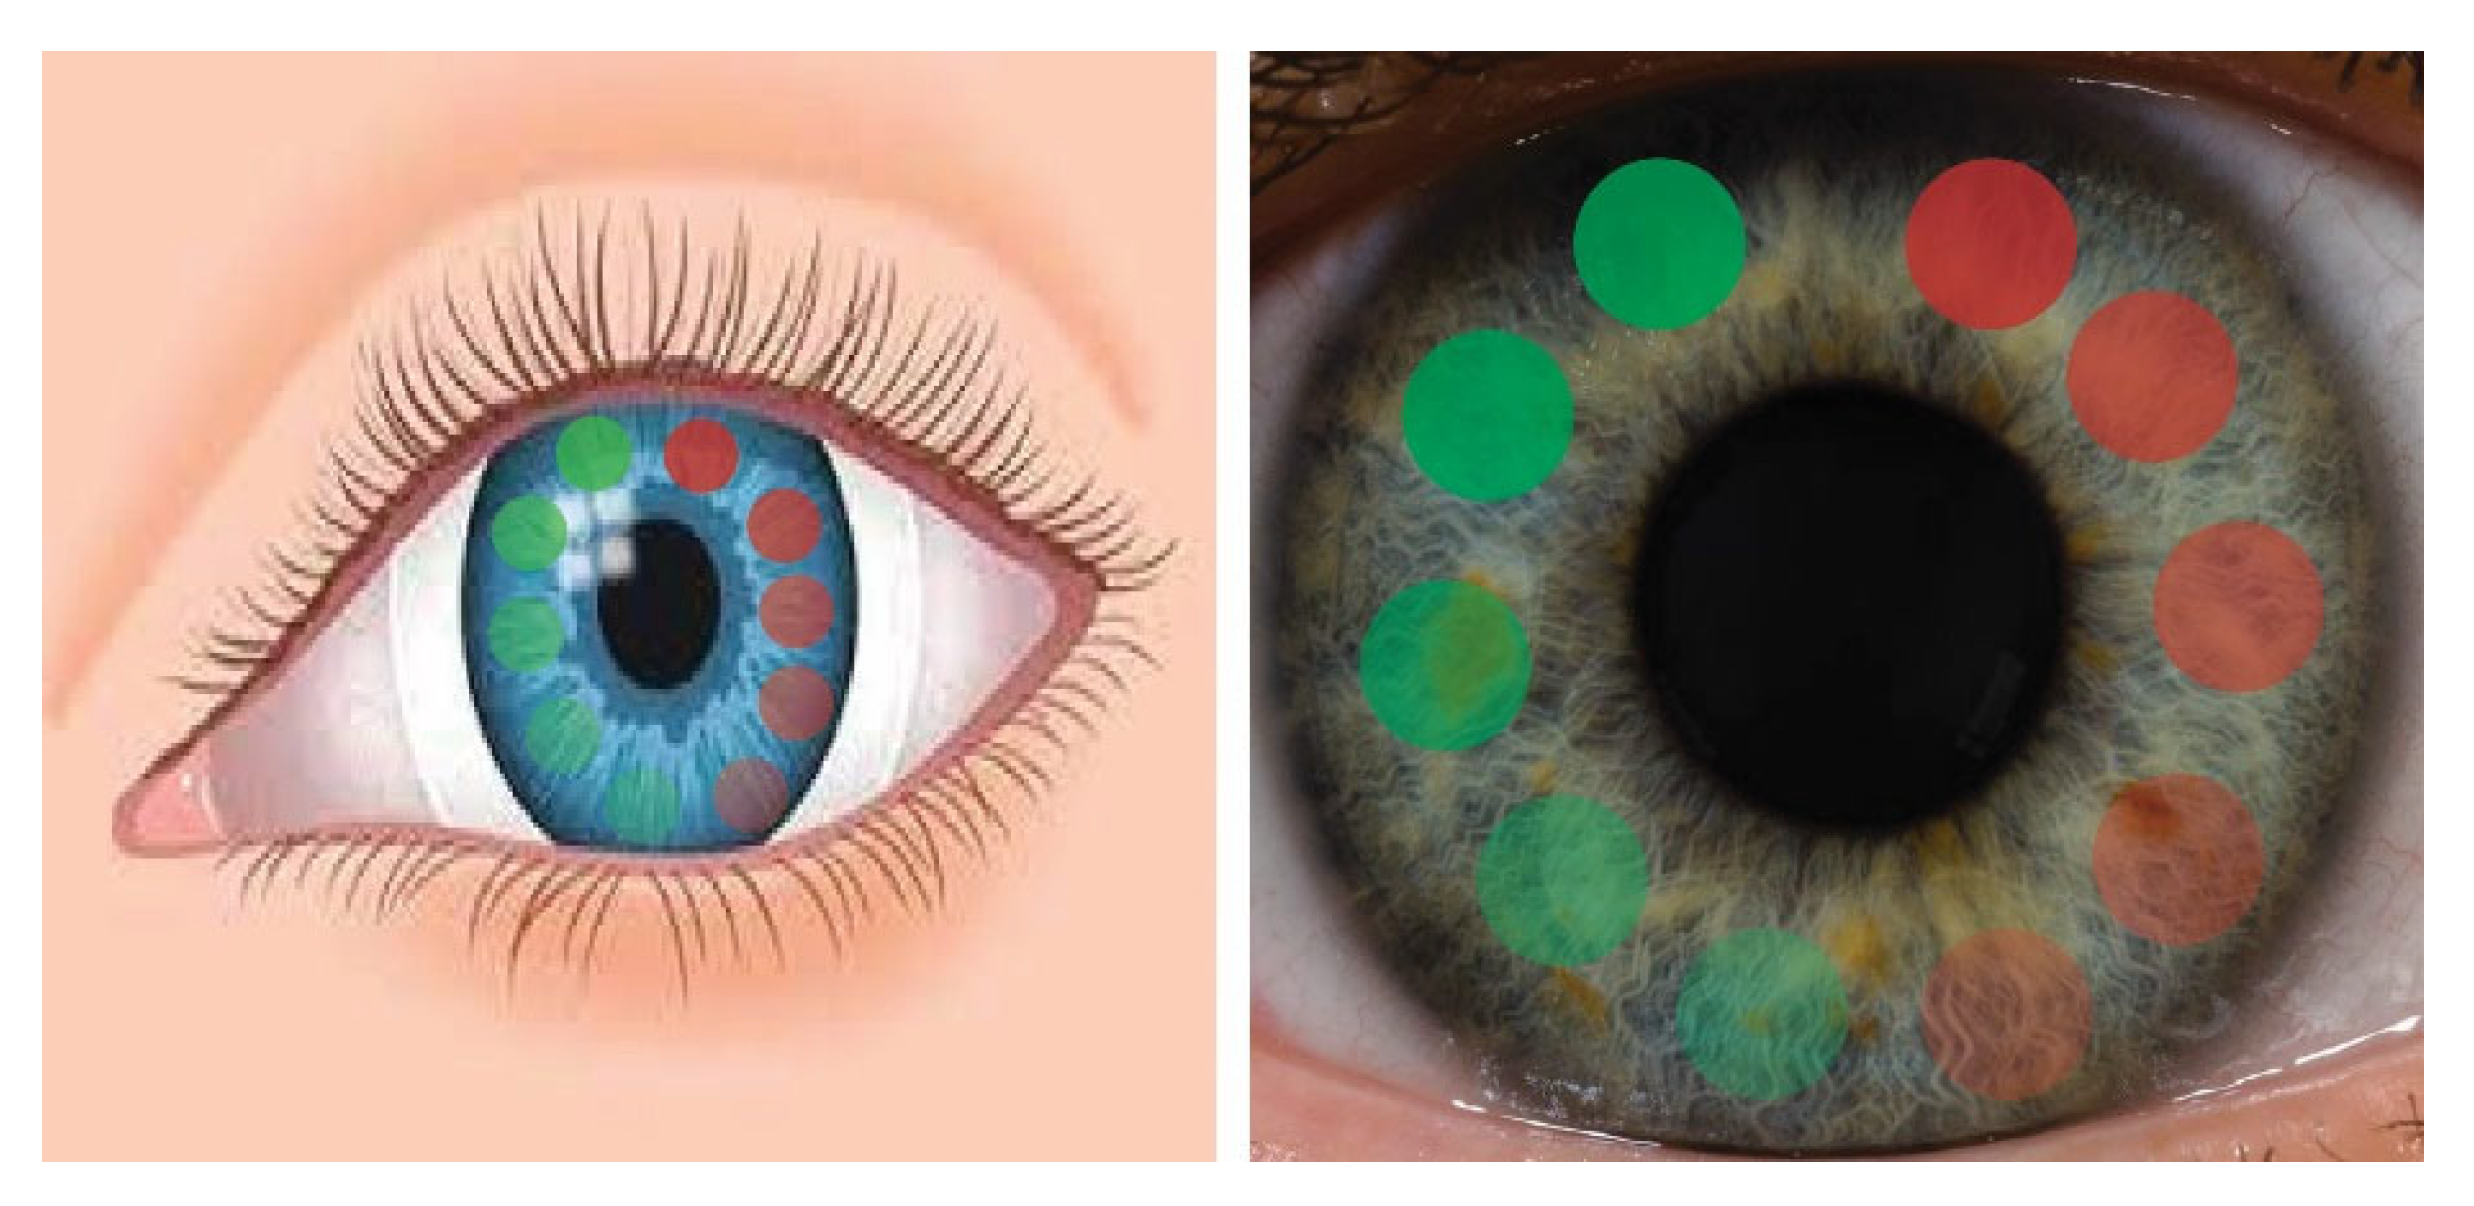
Our approach to basal tear biomarker assays has many potential advantages. While biomarkers can result from disease in any part of the body [83,84,85,86,87], the initial use of this BM-CL will be for detection and diagnosis of ocular surface disease (OSD) (Figure 10). Many OSD are known including dry eye disease (DED), inflammation of the eyelid (Blephartis), inflammation due to allergies (Conjuntivitis), membrane gland dysfunction (MGD), glioma or some injury to the delicate corneal surface.
The usefulness of our BM-CL can be seen by presently used tests in an ophthalmology office. The OSD mentioned above resulted in elevated levels of matrix metallprotease-9 in tears (MMP-9), which is one of the many MMP9s responsible for tissue remodeling [83,84,85,86,87]. Any damage of inflammation of the cornea results in high levels of MMP-9 which digest the tight junctions and allows mixing of tears with the stroma. At present, MMP-9 in tears is measured in two ways. Both methods require a sample of basal level tears which are collected with a capillary tube. Because of the small volume sensitive methods are sent out for amplified assays such as ELISA or PCR. The results are not returned for days or a week, and therefore not useful in a typical ophthalmology office visit.
Use of the SCL for clinical testing will require a decision about the time to leave the lens on the eye. This time will depend on the concentration of MMP-9 or other target analytes, the flow rate of the tears and the efficiency of MMP-9 binding during a passage over or under the lens. At this time, it is not known the fraction of tear fluid which passes across the lens (by the PLTF or PoLTF) or around the control lens. Mixing occurs in the PLTF and PoLTF dye to blinking [88]. Commercial contact lens can have different surface treatments [89,90] which can affect binding efficiency. We expect the biomarkers binding efficiency to be high for several reasons. In other testing with flow devices the binding efficiency was found to increase in thinness or smaller spaces [91,92,93]. This effect is probably the result of transitional diffusion in the film which results in repeated collision with the CL surface.Another potential advantage of the SCL is high sensitivity detection of low concentration biomarkers. For example, if the lens remains on the eye for 30 minutes the tear volume will be exchanged about four times, and a low concentration biomarker could be collected from a large volume of tear flow.
In summary, we have demonstrated that a three-layer protein capture assay could be accomplished with a commercial SiHG contact lens. At present, we imagine the SCL will be removed from the eye and then exposed to the labeled detection Ab. Since this concept has not been tested in-vivo there is much to learn about the performance of these lenses. Point-of-care measurements, whether in-vivo or after lens removal, are most accurately performed by a wavelength-ratiometric or lifetime-based measurement. This could be accomplished by placement of a reference fluorophore in the SiHG to serve as an intensity or lifetime standard. SiHG lenses are known to bind hydrophobic fluorophores or fluorophores with hydrophobic side chains. We are hopeful these results contribute to the increasing use of tears for diagnostic testing.
Supplementary Materials
The following supporting information can be downloaded at the website of this paper posted on Preprints.org, Table S1: Technical data for contact lenses, Figure S1: Schematic for two silicone hydrogel, Figure S2: Time-dependent measurements of detection Ab (Rh-Anti IgG), Figure S3: Time-dependent measurements of AF-Anti IgG, and Figure S4: Confocal microscopy and FILM.
Author Contributions
Conceptualization, K.S. and J.L.; methodology, K.S.; software, K.S.; validation, K.S., J.L. and E.A.R.; formal analysis, K.S.; investigation, K.S. and J.L.; resources, J.L.; data curation, K.S. and J.L.; writing—original draft preparation, K.S. and J.L.; writing—review and editing, K.S., E.A.R., and J.L.; visualization, K.S., and J.L.; supervision, E.A.R., and J.L.; project administration, K.S., E.A.R., and J.L.; funding acquisition, J.L..
Funding
The authors thank the National Institute of General Medical Science for support by R35 GM 144147.
Acknowledgments
The authors thank the National Institute of General Medical Science for support by R35 GM 144147.
References
- Hubbard, J.D. A Concise Review of Clinical Laboratory Science, Lippincott, Williams & Wilkins 2011, 410 pp.
- Goljan, E.F.; Sloka, K.I. Rapid Review Laboratory Testing in Clinical Medicine, Mosby Elsevier 2007, 460 pp.
- Qureshi, A.; Gurbuz, Y.; Niazi, J.H. Biosensors for cardiac biomarkers detection; A review. Sensors Actua B. 2012, 171, 62–76. [Google Scholar] [CrossRef]
- Tan, W.S.; Tan, W.P.; Tan, M.-Y.; Khetrapal, P.; Dong, L.; deWinter, P.; Feber, A.; Kelly, J.D. Novel urinary biomarkers for the detection of bladder cancer: A systematic review. Cancer Treat. Rev. 2000, 69, 399–52. [Google Scholar] [CrossRef]
- Khanmohammadi, A.; Aghaie, A.; Vahedi, E.; Quzvini, A.; Ghanei, M.; Afkhami, A.; Hajian, A.; Bagheri, H. Electrochemical biosensors for the detection of lung cancer biomarkers; A review. Talanta 2020, 206, 120251. [Google Scholar] [CrossRef] [PubMed]
- Misek, D.E.; Patwa, T.H.; Lubman, D.M.; Simeone, D.M. Early detection and biomarkers in pancreatic cancer. J. Natl. Comp. Cancer Net. 2007, 5, 1034–1041. [Google Scholar] [CrossRef]
- Daily, A.; Ravishankan, P.; Harms, S.; Klimberg, V.S. Using tears as a non-invasive source for easy detection of breast cancer. Plos One. 2022, 17, e0267676. [Google Scholar] [CrossRef]
- Csosz, E.; Boross, P.; Csutak, A.; Berta, A.; Toth, F.; Poliska, S.; Torok, Z.; Tozser, J. Quantiative analysis of proteins in the tear fluid of patients with diabetic retinopathy. Proteome J. 2012, 75, 2196–2204. [Google Scholar] [CrossRef]
- Rahbari, R.; Van Niewaal, J.; Bleavins, M.R. (Eds). Biomarkers in Drug Discovery and Development: Handbook of Practice, Application and Strategy, 2020. [Google Scholar]
- Huang, L.; Tian, S.; Zhao, W.; Liu, K.; Ma, X.; Guo, J. Multiplexed detection of biomarkers in lateral-flow immunoassays. Analyst. 2020, 145, 2828–2840. [Google Scholar] [CrossRef] [PubMed]
- Mishur, R.J.; Rea, S.L. Applications of mass spectrometry to metabolomics and metabonomics: Detection of biomarkers of aging and of age-related diseases. Mass Spec. Rev. 2011, 31, 70–95. [Google Scholar] [CrossRef]
- Srinivas, P.R.; Kramer, B.S.; Srivastava, S. Trends in biomarker research for cancer detection. The Lancet Oncol. 2001, 2, 698–704. [Google Scholar] [CrossRef]
- Bisig, B.; Gaulard, P.; deLeval, L. New biomarkers in T-cell lymphomas. Clin. Haematology. 2012, 25, 13–28. [Google Scholar] [CrossRef]
- Costello, E.; Greenhalf, W.; Neoptolemos, J.P. New biomarkers and targets in pancreatic cancer and their application to treatment. Nature Rev. 2012, 9, 435–444. [Google Scholar] [CrossRef] [PubMed]
- Perera, G.S.; Ahmed, T.; Heiss, L.; Walia, S.; Bhaskaran, M.; Sriram, S. Rapid and selective biomarker detection with conductometric sensors. Small. 2021, 17, 2005582–1. [Google Scholar] [CrossRef]
- Nimse, S.B.; Sonawane, M.D.; Song, K.-S.; Kim, T. Biomarker detection technologies and future directions. Analyst. 2016, 141, 740–755. [Google Scholar] [CrossRef] [PubMed]
- Haitao, J.L.; Xu, J.; Zhao, X.; Song, S.; Xue, Z.; Wu, Y.S.; Gopinath, S.C.; Lakshmipriya, T.; Zhang, H. Silica/antibody conjugated microcomb electrode sensor for cardiac biomarker analysis. Appl. Physics. 2021, 127, 110. [Google Scholar]
- Liu, R.; Ye, X.; Cui, T. Recent progress of biomarker detection sensors. Mech. Eng. 2020, 38, 7949037. [Google Scholar] [CrossRef] [PubMed]
- De La Rica, R.; Stevens, M.M. Plasmonic ELISA for the ultrasensitive detection of disease biomarkers with the naked eye. Nature Nanotech. 2012, 7, 821–824. [Google Scholar] [CrossRef]
- Feng, Y.; Li, Q.; Chen, J.; Yi, P.; Xu, X.; Fan, Y.; Cui, B.; Yu, Y.; Li, X.; Du, Y.; Chen, Q.; Zhang, Z.; Zhou, X.; Zhang, P. Salivary protease spectrum in oral cancer. Intl. J. Oral Sci. 2019, 11, 7. [Google Scholar] [CrossRef]
- Kennedy, S.; Davis, C.; Abrams, W.R.; Billings, P.C.; Nagashanmugam, T.; Friedman, H.; Malamud, D. Submandibular salivary proteases: lack of a role in anti-HIV activity. J. Dent. Res. 1998, 77, 15–19. [Google Scholar] [CrossRef]
- Roobol, M.J.; Haese, A.; Bjartell, A. Tumour markers in prostate cancer III: Biomarkers in urine. Acta Oncologica 2011, 50, 85–89. [Google Scholar] [CrossRef]
- Youhe, G. Urine - an untapped goldmine for biomarker discovery? Sci. China Life Sci. 2013, 56, 1145–1146. [Google Scholar]
- Corrie, S.R.; Coffey, J.W.; Islam, J.; Markey, K.A.; Kendall, M.A.F. Blood, sweat, and tears: developing clinically relevant protein biosensors for integrated body fluid analysis. Analyst. 2015, 140, 4350–4364. [Google Scholar] [CrossRef] [PubMed]
- Sebbane, M.; Claret, P.G.; Lefebvre, S.; Mercier, G.; Rubenovitch, J.; Jreige, R.; Eledjam, J.J.; de La Coussaye, J.E. Predicting peripheral venous access difficulty in the emergency department using body mass index and a clinical evaluation of venous accessibility. J. Emerg. Med. 2013, 44, 299–305. [Google Scholar] [CrossRef] [PubMed]
- Jacobson, A.F.; Winslow, E.H. Variables influencing intravenous catheter insertion difficulty and failure: An analysis of 339 intravenous catheter insertions. Heart and Lung 2005, 34, 345–359. [Google Scholar] [CrossRef] [PubMed]
- Lippi, G.; Guidi, C.; Mattiuzzi, C.; Plebani, M. Preanalytical variability: the dark side of the moon in laboratory testing. Clin. Chem. 2006, 44, 358–365. [Google Scholar] [CrossRef]
- Randall, S.A.; McKay, M.J.; Molloy, M.P. Evaluation of blood collection tubes using selected reaction monitoring MS: implications for proteomic biomarker studies 2010, 10, 2050–2056.
- Tamhane, M.; Cabrera-Ghayoun, S.; Abelian, G.; Viswanath, V. Review of biomarkers in ocular matrices: Challenges and opportunities. Pharm. Res. 2019, 36, 40. [Google Scholar] [CrossRef]
- Von Thun Und, H. M.; Funke, S.; Grus, F.H. Tears as a source of biomarkers for ocular and systemic diseases. Exp. Eye Res. 2013, 117, 126–137. [Google Scholar] [CrossRef]
- Bachhuber, F.; Huss, A.; Senel, M.; Tumani, H. Diagnostic biomarkers in tear fluid: from sampling to preanalytical processing. Sci. Rep., 2021, 11, 10064–8. [Google Scholar] [CrossRef]
- Bachman, W.G.; and Wilson, G. Essential ions for maintenance of the corneal epithelial surface. Invest. Oph. Vis. Sci. 1985, 26, 1484–1488. [Google Scholar]
- Wilcos, M.D.P.; Argueso, P.; Georgiew, G.A.; Holopainen, J.M.; Laurie, G.W.; Millar, T.J.; Papas, E.B.; Rolland, J.P.; Schmidt, T.A.; Stahl, U.; Suarez, T.; Subbaraman, L.N.; Uçakhan, O.O.; Jones, L. TFOS DEWS II tear film report. Ocul. Surf. 2017, 15, 366–403. [Google Scholar] [CrossRef]
- Versura, P.; Campos, E.C. TearLab osmosarity system for diagnosing dry eye. Exp. Rev. Mol. Diagn. 2014, 13, 119–129. [Google Scholar] [CrossRef]
- Rentka, A.; Koroskenvi, K.; Harsfalvi, J.; Szekanecz, Z.; Szucs, G.; Kzodrary, P.; Kemeny-Beke, A. Evaluation of commonly used tear sampling methods and their relevance in subsequent biochemical analysis. Ann. Clin. Biochem. 2017, 54, 521–529. [Google Scholar] [CrossRef] [PubMed]
- Fullard, R.J.; Snyder, C. Protein levels in nonstimulated and stimulated tears of normal human subjects. Inv. Oph. Vis. Sci., 1990, 31, 1119–1126. [Google Scholar]
- Pandit, J.C.; Nagyova, B.; Bron, A.J.; Tiffany, J.M. Physical properties of stimulated and unstimulated tears. Exp. Eye Res. 1999, 68, 247–253. [Google Scholar] [CrossRef]
- Fullard, R.J.; Tucker, D.L. Changes in human tear protein levels with progressively increasing stimulus. Inves. Oph. Vis. Sci. 1991, 32, 2290–2301. [Google Scholar]
- Stuchell, R.N.; Feldman, J.J.; Farris, R.L.; Mandel, J.D. The effect of collection technique on tear composition. Inves. Ophthal. Vis. Sci. 1984, 25, 374–377. [Google Scholar]
- Zhan, X.; Li, J.; Guo, Y.; Golubnitschaja, O. Mass spectrometry analysis of human tear fluid biomarkers specific for ocular and systemic diseases in the context of 3P medicine. EPMA J. 2021, 12, 449–475. [Google Scholar] [CrossRef]
- Winiarczyk, M.; Biela, K.; Michalak, K.; Winiarczyk, D.; Mackiewicz, J. Changes in tear proteomic profile in ocular diseases. Intl. J. Environ. Res. 2022, 19, 13341. [Google Scholar] [CrossRef]
- Ponzini, E.; Santambrogio, C.; DePalma, A.; Mauri, P.; Tavazzi, S.; Grandori, R. Mass spectrometry-based tear proteomics for noninvasive biomarker discovery. Mass. Spec. Rev. 2021, 41, 842–860. [Google Scholar] [CrossRef]
- Adigal, S.S.; Rizvi, A.; Rayaroth, N.V.; John, R.V.; Barik, A.; Shandari, S. Human tear fluid analysis for clinical applications: progress and prospects. Exp. Rev. Mol. Diagn. 2021, 21, 767–787. [Google Scholar] [CrossRef]
- Nandi, S.K.; Singh, D.; Upadhay, J.; Gupta, N.; Dhiman, N.; Mittal, S.K.; Mahindroo, N. Identification of tear-based protein and non-protein biomarkers. Its application in diagnosis of human diseases using biosensors. Intl. J. Biol. Macro. 2021, 193, 838–846. [Google Scholar] [CrossRef]
- Zihara, M.; Kubota, N.; Kadowaki, T. Study of the correlation between tear glucose concentrations and blood glucose concentrations. Clin. Diabetes. 2018, 67, 944P. [Google Scholar]
- Baca, J.T.; Taormina, R.; Feingold, E.; Finegold, D.N.; Grabowski, J.J.; Asher, S.A. Mass spectral determination of fasting tear glucose concentrations in nondiabetic volunteers. Clin. Chem. 2007, 53, 1370–1372. [Google Scholar] [CrossRef] [PubMed]
- Aihara, M.; Kubota, N.; Minami, T.; Shirakawa, R.; Sakurai, Y.; Hayashi, T.; Iwamoto, M.; Takamoto, I.; Kubota, T.; Suzuki, R.; Usami, S.; Jinnouchi, H.; Aihara, M.; Yamauchi, T.; Sakata, T.; Kadowaki, T. Association between tear and blood glucose concentrations: Random intercept model adjusted with confounders in tear samples negative for occult blood. J. Diab. Inves. 2021, 12, 266–276. [Google Scholar] [CrossRef] [PubMed]
- Li, B.; Sheng, M. , Li, J.; Yan, G.; Lin, A.; Wang, W.; Chen, Y. Tear proteomic analysis of Sjogren syndrome patients with dry eye syndrome by two-dimensional nano liquid chromatography coupled with tandem mass spectrometry. Sci. Rep. 2014, 4, 1–6. [Google Scholar]
- Saljyothi, A.V.; Angayarkanni, N.; Syama, C.; Utpal, T.; Shweta, A.; Bhaskar, S.; Geetha, I.K.; Vinay, P.S.; Thennarasu, M.; Sivakumar, R.M.; Prema, P. Two-dimensional electrophoretic analysis of human tears: collection method in dry eye syndrome. Electro. 2010, 31, 3420–3427. [Google Scholar]
- Bachhuber, F.; Huss, A.; Senel, M.; Tumani, H. Diagnostic biomarkers in tear fluid: from sampling to preanalytical processing. Sci. Rep. 2021, 11, 10064. [Google Scholar] [CrossRef]
- Lardinois, F. Google unveils smart contact lens that diabetics measure their glucose levels 2014. https://www.bbc.com/news/technology-25771907.
- Google halts glucose sensing contact lens 2018, https://www.bbc.com/news/technology-46262520.
- McDermott, J.; Levine, B. Glucose-sensing contact lens development on hold, 2023), https://diatribe.org/glucose-sensing-contact-lens-development-hold.
- Farr, C. Alphabet stops its project to create a glucose-measuring contact lens for diabetes patients 2018, https://www.cnbc.com/2018/11/16/alphabet-verily-stops-smart-lens-glucose-measuring-contact-lens.
- Mojo Lens. The world’s first true smart contact lens 2023, https://www.mojo.vision.
- Mojo vision smart contact lenses are now “feature complete”. 2022, https://skarredghost.com/2022/03/30/mojo-vision-smart-contact-lenses-feature-complete/.
- Clark, M. Another company has stopped working on smart contact lenses, The Verge. 2023, https://www.theverge.com/2023/1/7/23543224/mojo-vision-smart-contact-lens-microled.
- Gregory, W.D. Soft Lens Material Choices and Selection. Con. Lens Spec. 2012, 27, 38–41. [Google Scholar]
- Badugu, R.; Reece, E.A.; Lakowicz, J.R. Glucose-sensitive silicone hydrogel contact lens toward tear glucose monitoring. J. Biomed. Optics. 2018, 23, 057005–1/9. [Google Scholar] [CrossRef]
- Badugu, R.; Jeng, B.H.; Reece, E.A.; Lakowicz, J.R. Contact lens to measure individual ion concentrations in tears and applications to dry eye disease. Anal. Biochem. 2018, 542, 84–94. [Google Scholar] [CrossRef]
- Badugu, R.; Szmacinski, H.; Reece, E.A.; Jeng, B.H.; Lakowicz, J.R. Sodium-sensitive contact lens for diagnostics of ocular pathologies. Sensors Actuators B. 2021, 331, 129434. [Google Scholar] [CrossRef]
- Lakowicz, J.R.; Badugu, R.; Sivashanmugan, K.; Reece, A. Remote Measurements of Tear Electrolyte Concentrations on Both Sides of an Inserted Contact Lens. Chemosensors 2023, 11, 463. [Google Scholar] [CrossRef] [PubMed]
- Godawat, R.; Konstantinov, K.; Rohani, M.; Warikoo, V. End-to-end integrated fully continuous production of recombinant monoclonal antibodies. J. Biotech. 2015, 213, 13–19. [Google Scholar] [CrossRef] [PubMed]
- Adams, C.W.; Allison, D.E.; Flagella, K.; Presta, L.; Clarke, J.; Dybdal, N.; McKeever, K.; Sliwkowski. Humanization of a recombinant monoclonal antibody to produce a therapeutic HER dimerization inhibitor, pertuzumab. Cancer Immunol Immunother. 2006, 55, 717–727. [Google Scholar] [CrossRef]
- DeLuca, K.F.; Mick, J.E.; Ide, A.H.; Lima, W.C.; Sherman, L.; Schaller, K.L.; Anderson, S.M.; Zhao, N.; Stasevich, T.J.; Varma, D.; Nilsson, J.; DeLuca, J.G. Generation and diversification of recombinant monoclonal antibodies. Elife. 2021, 10, e72093. [Google Scholar] [CrossRef]
- Silicone hydrogels - What are they and how should they be used in everyday practice? Bausch & Lomb, CIBA Vision, Contact Lens Monthly, No. 5726, vol. 218.
- Gromacki, S.J. Compliance with daily disposable contact lenses, Contact Lens Spectrum/Special Edition 2013, p. 13.
- Gachon, A.M.; Richard, J.; Dastugue, B. Human tears: normal protein pattern and individual protein determinations in adults. Curr. Eye Res. 1983, 2, 301–8. [Google Scholar] [CrossRef] [PubMed]
- You, J.; Willcox, M.D.; Madigan, M.C.; Wasinger, V.; Schiller, B.; Walsh, B.J.; Graham, P.H.; Kearsley, J.H.; Li, Y. Tear fluid protein biomarkers. Adv. Clin. Chem. 2013, 62, 151–96. [Google Scholar]
- Steudle, A.; Pleiss, J. Modelling of lysozyme binding to a cation exchange surface at atomic detail: the role of flexibility. Biophys J. 2011, 100, 3016–24. [Google Scholar] [CrossRef]
- Bell, N.A.W.; Molloy, J.E. Microfluidic flow-cell with passive flow control for microscopy applications. PLOS One 2020, 15, 1–13. [Google Scholar] [CrossRef]
- Bambot, S.B.; Romauld, M.M.; Carter, G.M.; Sipior, J.; Terpetchnig, E.; Lakowicz, J.R. Sensing oxygen through skin using red diode laser and fluorescence lifetimes. Biosensors Bioelec. 1995, 10, 643–652. [Google Scholar] [CrossRef]
- Szmacinski, H.; Lakowicz, J.R. Optical measurements of pH using fluorescence lifetimes and phase-modulation fluorometry. Anal. Chem. 1993, 65, 1668–1674. [Google Scholar] [CrossRef]
- Zhao, W.; Tian, W.S.; Huang, L.; Dong, L.; Guo, J. A smart-phone based biomedical sensory system. Analyst 2020, 145, 2875–2891. [Google Scholar] [CrossRef]
- Shimizu, E.; Ogawa, Y.; Yazu, H.; Aketa, N.; Yang, F.; Yamane, M.; Sato, S.; Kawakami, Y.; Tsubota, K. Smart Eye Camera: An innovative technique to evaluate tear film breakup time in murine dry eye disease model. PLoS One 2019, 14, e0215130. [Google Scholar] [CrossRef]
- Yelleswarapu, V.R.; Jeong, H.H.; Yadavali, S.; Issadore, D. Ultra-high throughput detection of fluorescent droplets using a cell phone camera and time domain encoded optofluidics. Lab Chip 2017, 17, 1083–1094. [Google Scholar] [CrossRef] [PubMed]
- Wargocki, P.; Deng, W.; Anwer, A.G.; Goldys, E.M. Medically relevant assays with a simple smartphone and tablet based fluorescence detection system. Sensors. 2015, 5, 11653–11664. [Google Scholar] [CrossRef]
- Wang, L.J.; Sun, R.; Vasile, T.; Chang, Y.C.; Li, L. High-throughput optical sensing immunoassays on smartphone. Anal. Chem. 2016, 88, 8302–8308. [Google Scholar] [CrossRef]
- Diamandis, E.P. Immunoassays with time-resolved fluorescence spectroscopy: principles and applications. Clin. Biochem. 1988, 21, 139–150. [Google Scholar] [CrossRef] [PubMed]
- Degen, P.; Podesta, A.; Montagnoli, G. Time-resolved fluoroimmunoassay. Mol. Biotechnol. 1999, 13, 215–222. [Google Scholar] [CrossRef]
- Aydin, S. A short history, principles, and types of ELISA, and our laboratory experience with peptide/protein analytes using ELISA. Peptides 2015, 72, 4–15. [Google Scholar] [CrossRef] [PubMed]
- Guo, J., Zhou. Afterflow nanoprobe-enabled quantitative lateral flow immunoassay by a palm-size device for household healthcare. Anal. Chem 2024, 96, 4891–4900. [Google Scholar] [CrossRef]
- Huang, H. Matrix metalloproteinase-9 (MMP-9) as a cancer biomarker and MMP-9 biosensors. Sensors 2018, 18, 3249. [Google Scholar] [CrossRef]
- Dahl, R.; Titlestad, I.; Lindqvist, A.; Wielders, P.; Wray, H.; Wang, M.; Samuelsson, V.; Mo, J.; Holt, A. Effects of an oral MMP-9 and -12 ihibitor, AZD1236, on biomarkers in moderate/severe COPD: a randomized controlled trial. Pul. Pharm. Therap. 2012, 25, 169–177. [Google Scholar] [CrossRef] [PubMed]
- Thorsen, S.B.; Christensen, S.L.; Wurtz, S.O.; Lundberg, M.; Nielsen, B.S.; Vinther, L.; Knowles, M.; Gee, N.; Fredriksson, S.; Moller, S.; Brunner, N.; Schrofl, A.-S.; Stenvang, J. Plasma levels of the MMP-9: TIMP-1 complex as prognostic biomarker in breast cancer: a retrospective study. BMC Cancer 2013, 13, 598. [Google Scholar] [CrossRef]
- Nagase, H.; Woessner, J.F. Matrix metalloproteinases. J. Biol. Chem. 1999, 274, 21491–21494. [Google Scholar] [CrossRef]
- Zitka, O.; Kukacka, J.; Krizkova, S.; Huska, D.; Adam, V.; Masarik, M.; Prusa, R.; Kizek, R. Matrix metalloproteinases. Curr. Med. Chem. 2010, 17, 3751–3768. [Google Scholar] [CrossRef] [PubMed]
- Creech, J.L.; Chauhan, A.; Radke, C.J. Dispersive mixing in the posterior tear film under a soft contact lens. Ind. Eng. Chem. Res., 2001, 40, 3015–3026. [Google Scholar] [CrossRef]
- Wang, L.; Sun, B.; Ziemer, K.S.; Garabino, F.A.; Carrier, R.L. Chemical and physical modifications to poly(dimethylsiloxane) surfaces affect adhesion of caco-2 cells. J. Biomed. Mater Res. A. 2010, 15, 1260–1271. [Google Scholar] [CrossRef] [PubMed]
- https://www.lens.com/eyestyle/featured/the-best-selling-contact-lenses-of-2020-bonus-the-most-popular-brands.
- Goldstein, B.; mymya, D.; He, X.; Pined, A.R.; Wofsy, C. The influence of transport on the kinetics of binding to surface receptors: application to cells and BIAcore. J. Mol. Recog. 1999, 12, 293–299. [Google Scholar] [CrossRef]
- Squires, T.M.; Messinger, R.J.; Manalis, S.R. Making it stick: convection, reaction and diffusion in surface-based biosensors. Nature Biotech. 2008, 26, 417–426. [Google Scholar] [CrossRef]
- Beygi, M.A.; Krishnamurthy, V.; Cornell, B. Multiple surface-based biosensors for enhanced molecular detection in fluid flow systems. IEEE Sens. J. 2013, 3, 1265–1273. [Google Scholar] [CrossRef]
Figure 1.
Typical smart contact lenses. (A) Google Glucose lens, (B) Valtronic lens to monitor for glaucoma, (C) Fast Company for image display and (D) Mojo Vision for augmented reality.
Figure 1.
Typical smart contact lenses. (A) Google Glucose lens, (B) Valtronic lens to monitor for glaucoma, (C) Fast Company for image display and (D) Mojo Vision for augmented reality.
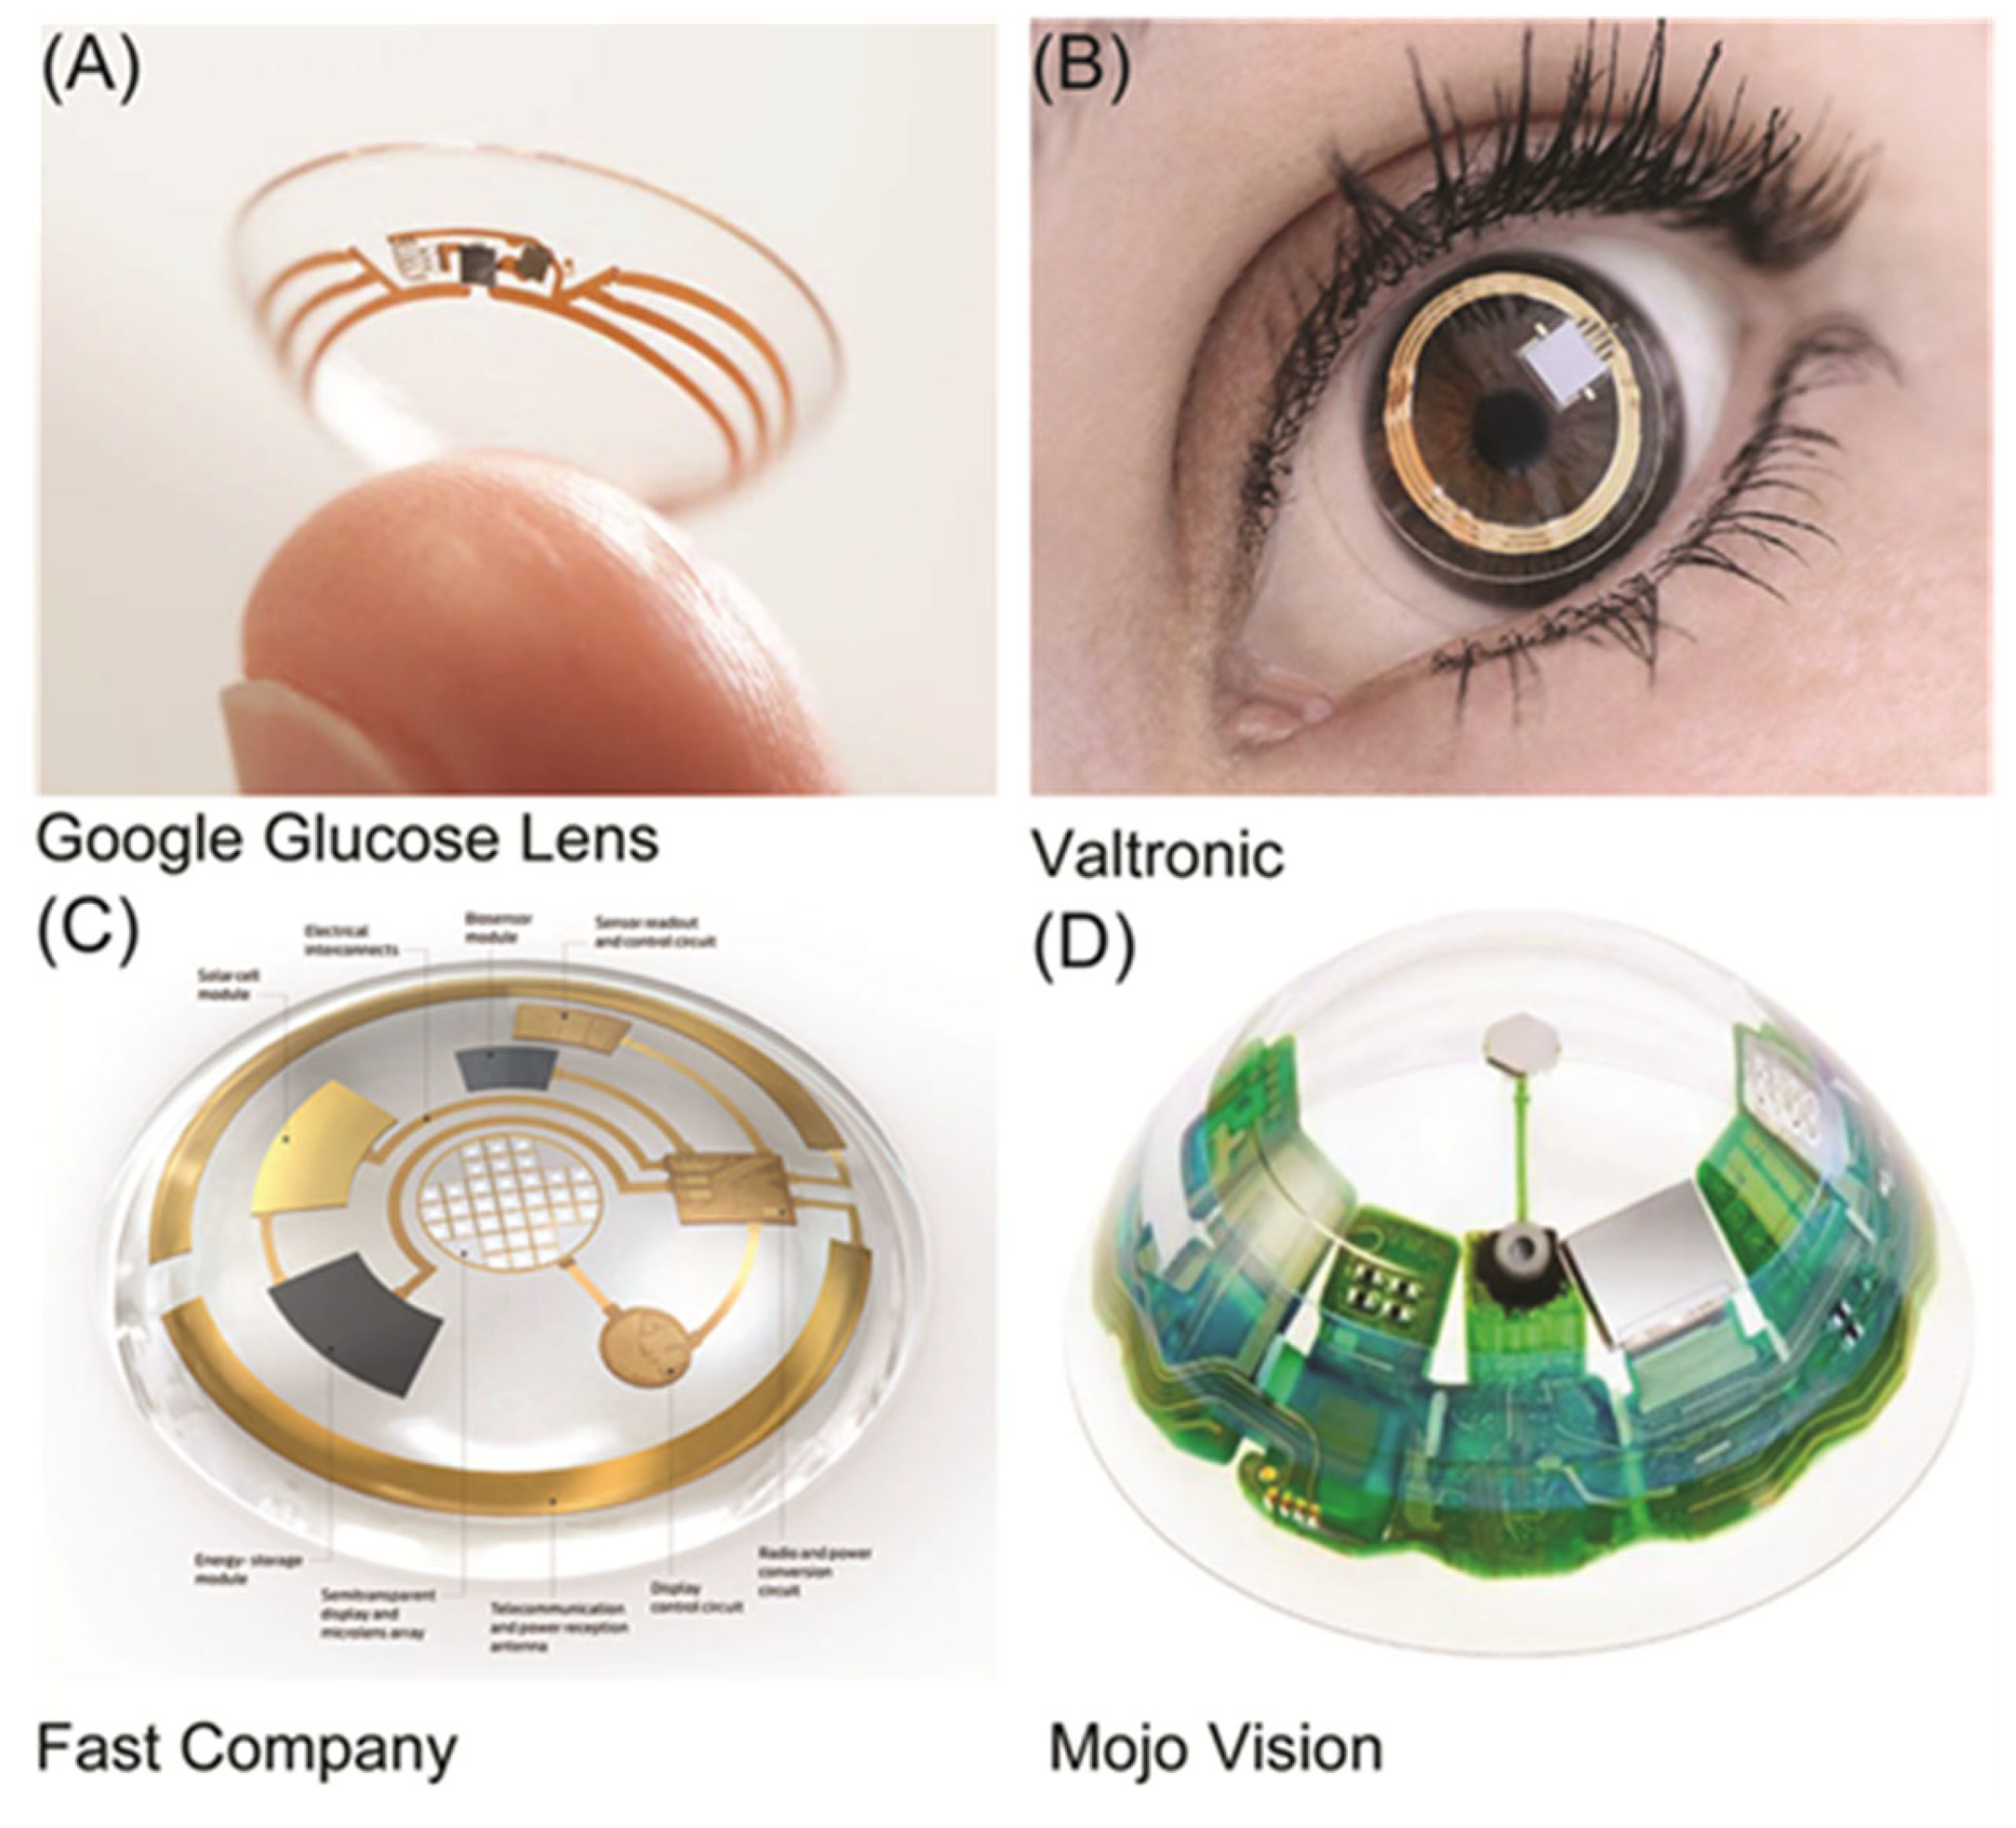
Figure 2.
Top, biomarker concentration measured using a smart contact lens with embedded electronic components. Bottom, biomarker concentration measured using emission of BM-CL with electronics outside lens.
Figure 2.
Top, biomarker concentration measured using a smart contact lens with embedded electronic components. Bottom, biomarker concentration measured using emission of BM-CL with electronics outside lens.
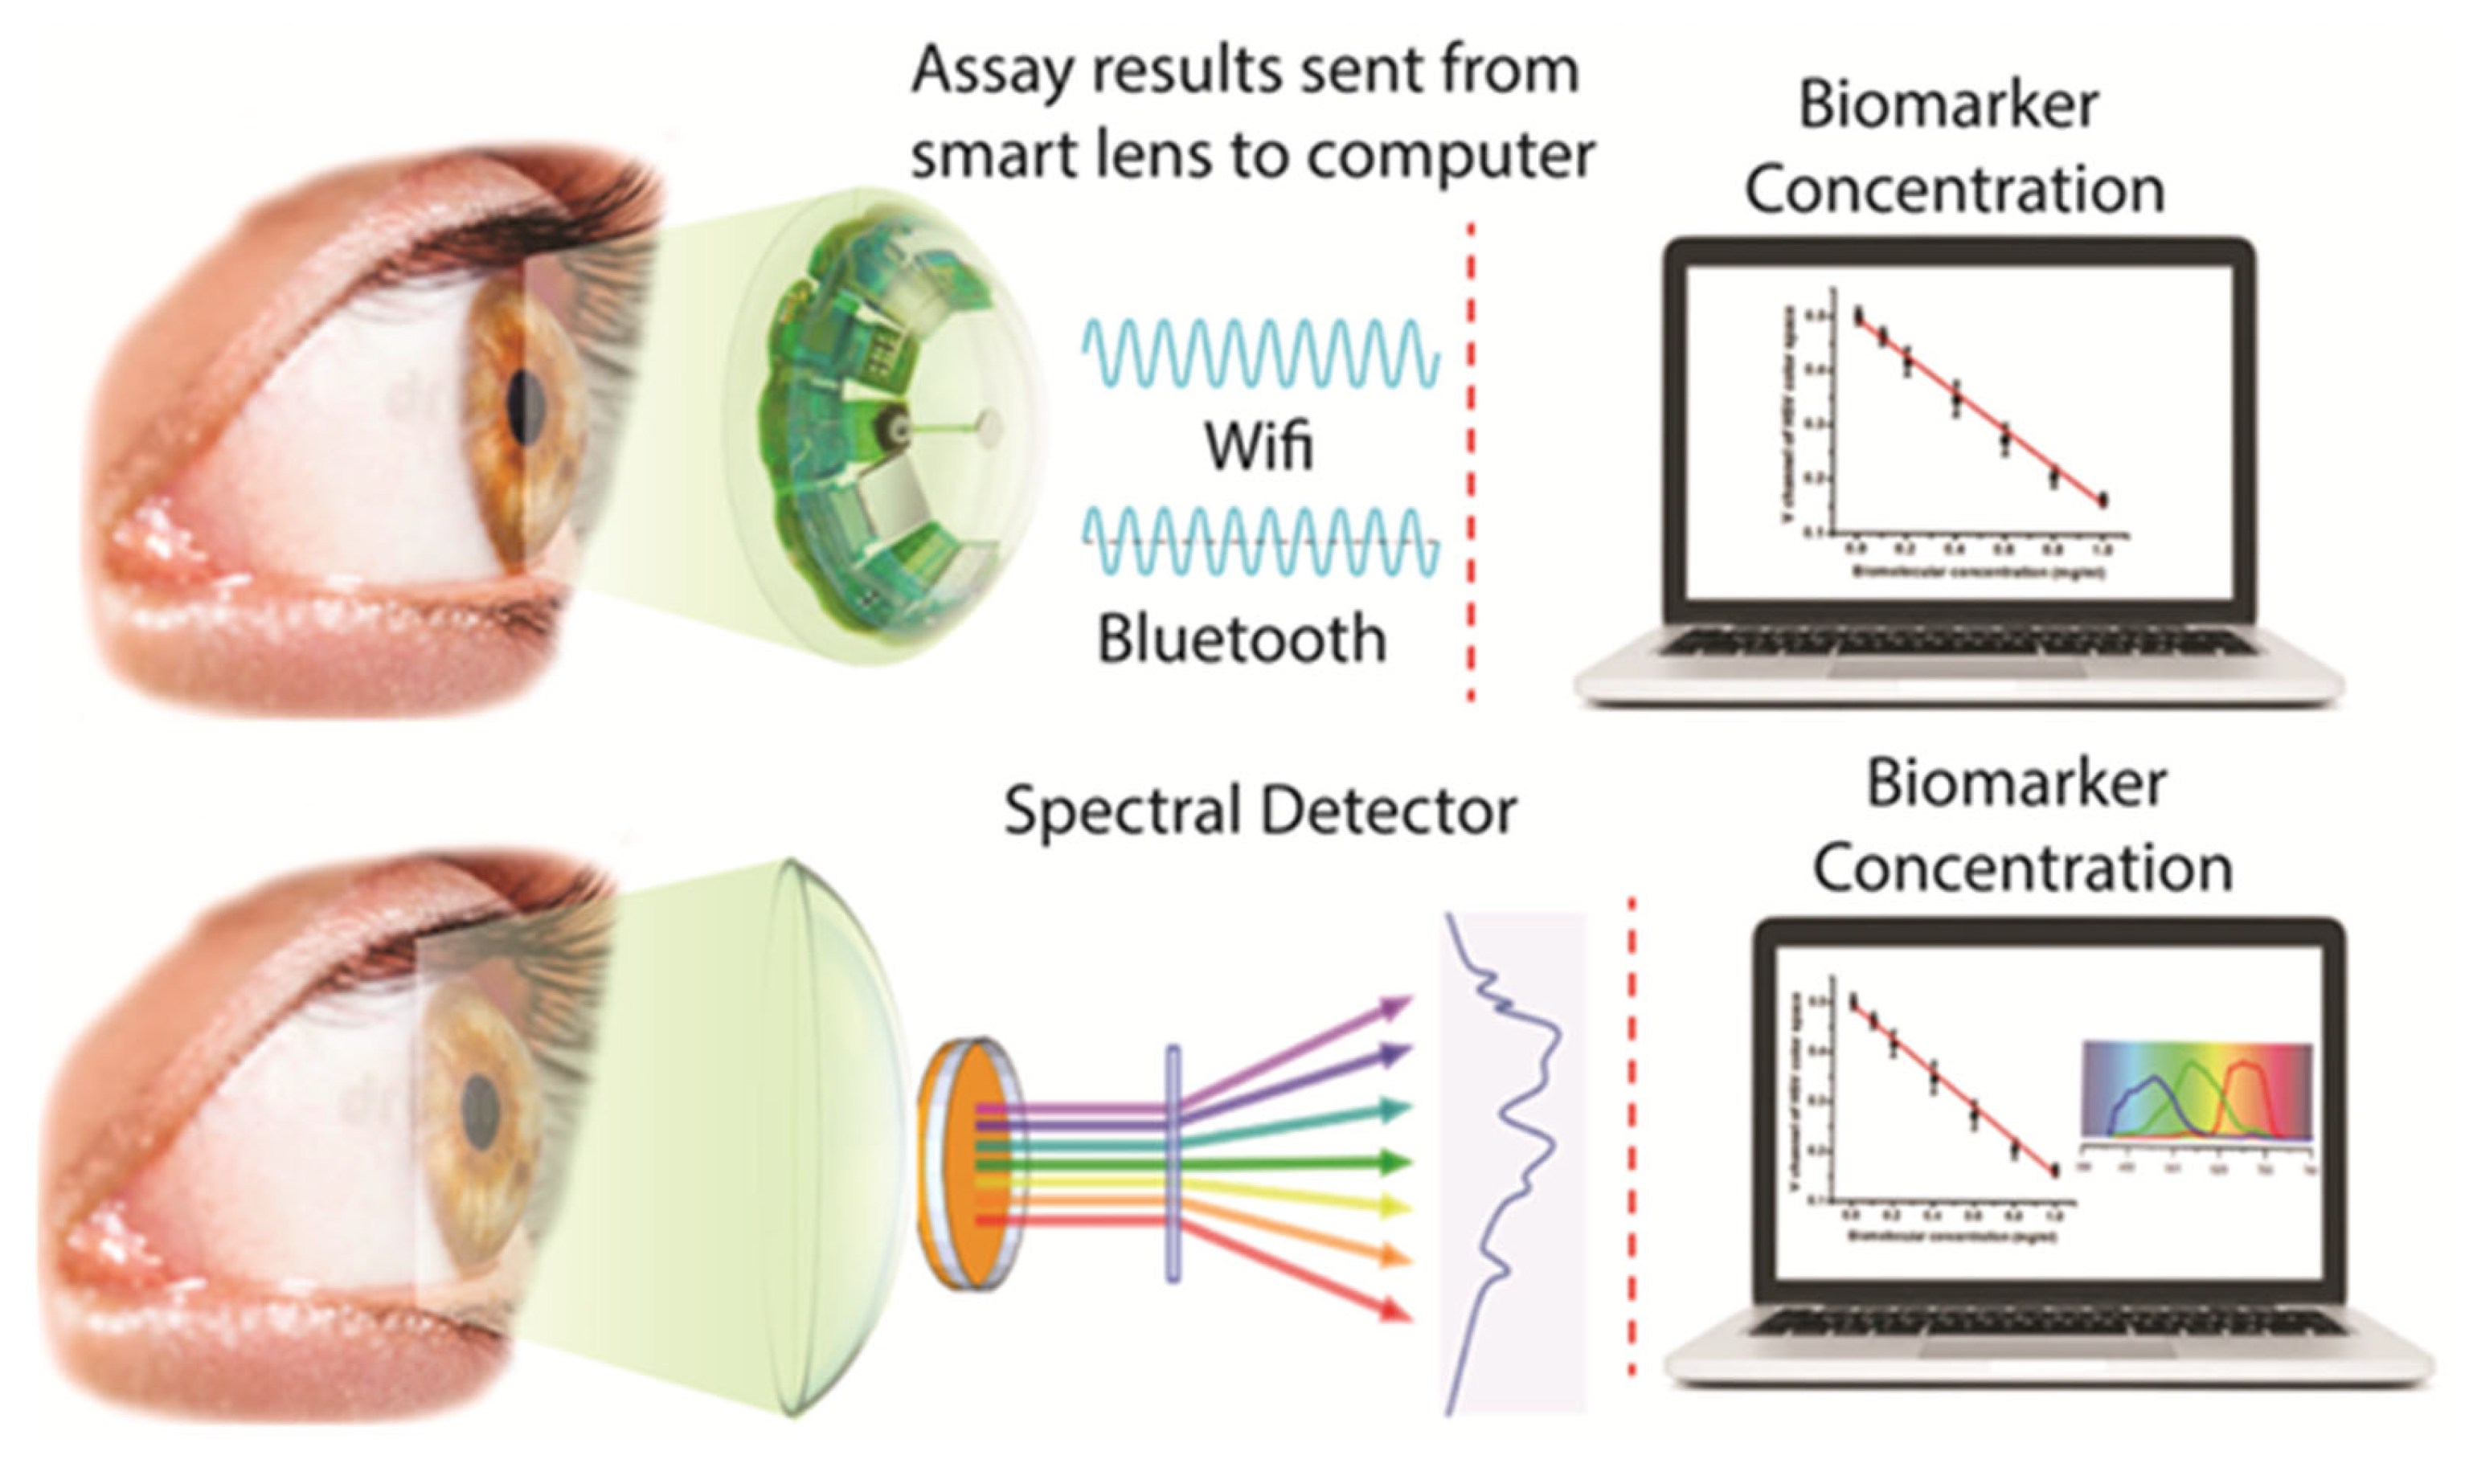
Figure 3.
A) The cornea's structure with a contact lens (blue) localized in the center aqueous portion of the tear film. B) Role of protein used in the present paper.
Figure 3.
A) The cornea's structure with a contact lens (blue) localized in the center aqueous portion of the tear film. B) Role of protein used in the present paper.
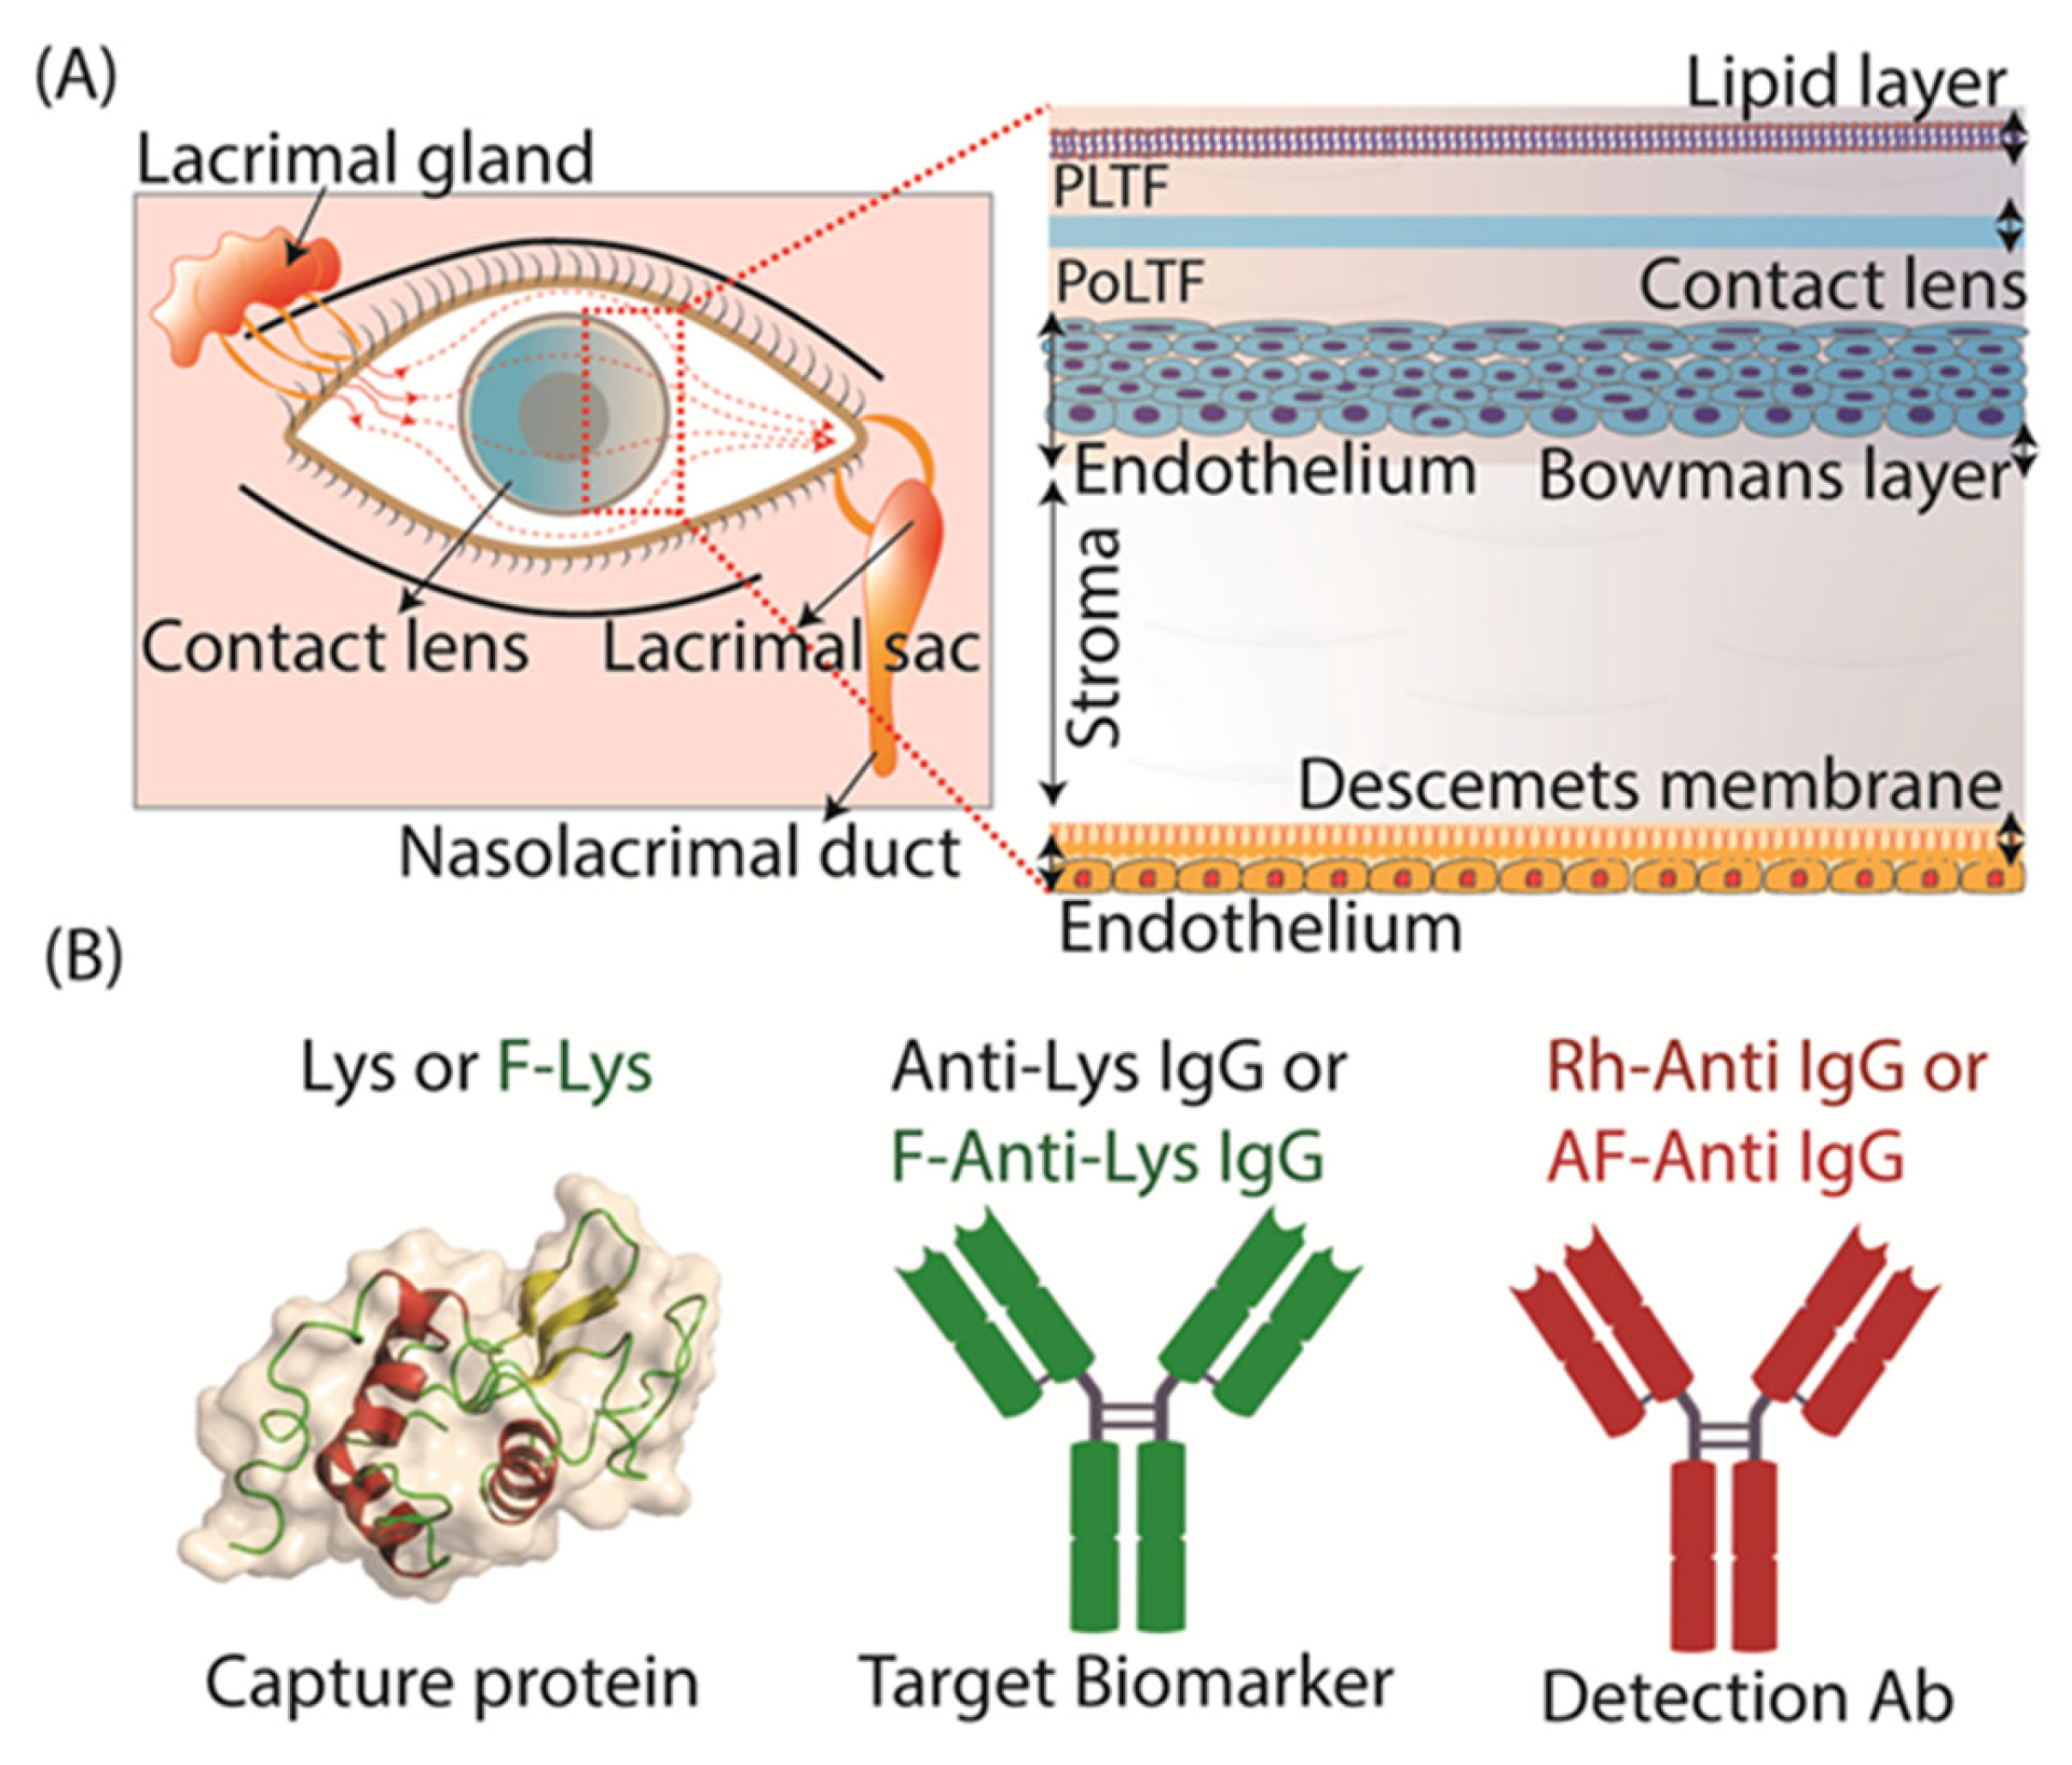
Figure 4.
The experimental design used for the detection of Lys or F-Lys binding Lot A lenses by fluorescence measurement. (A) F-Lys binding to lens, (B) F-Anti Lys binding to Lys-lens, (C,D) Detection of F-Anti Lys or anti Lys on lens using secondary Ab (Rh-Anti IgG or AF-Anti IgG).
Figure 4.
The experimental design used for the detection of Lys or F-Lys binding Lot A lenses by fluorescence measurement. (A) F-Lys binding to lens, (B) F-Anti Lys binding to Lys-lens, (C,D) Detection of F-Anti Lys or anti Lys on lens using secondary Ab (Rh-Anti IgG or AF-Anti IgG).
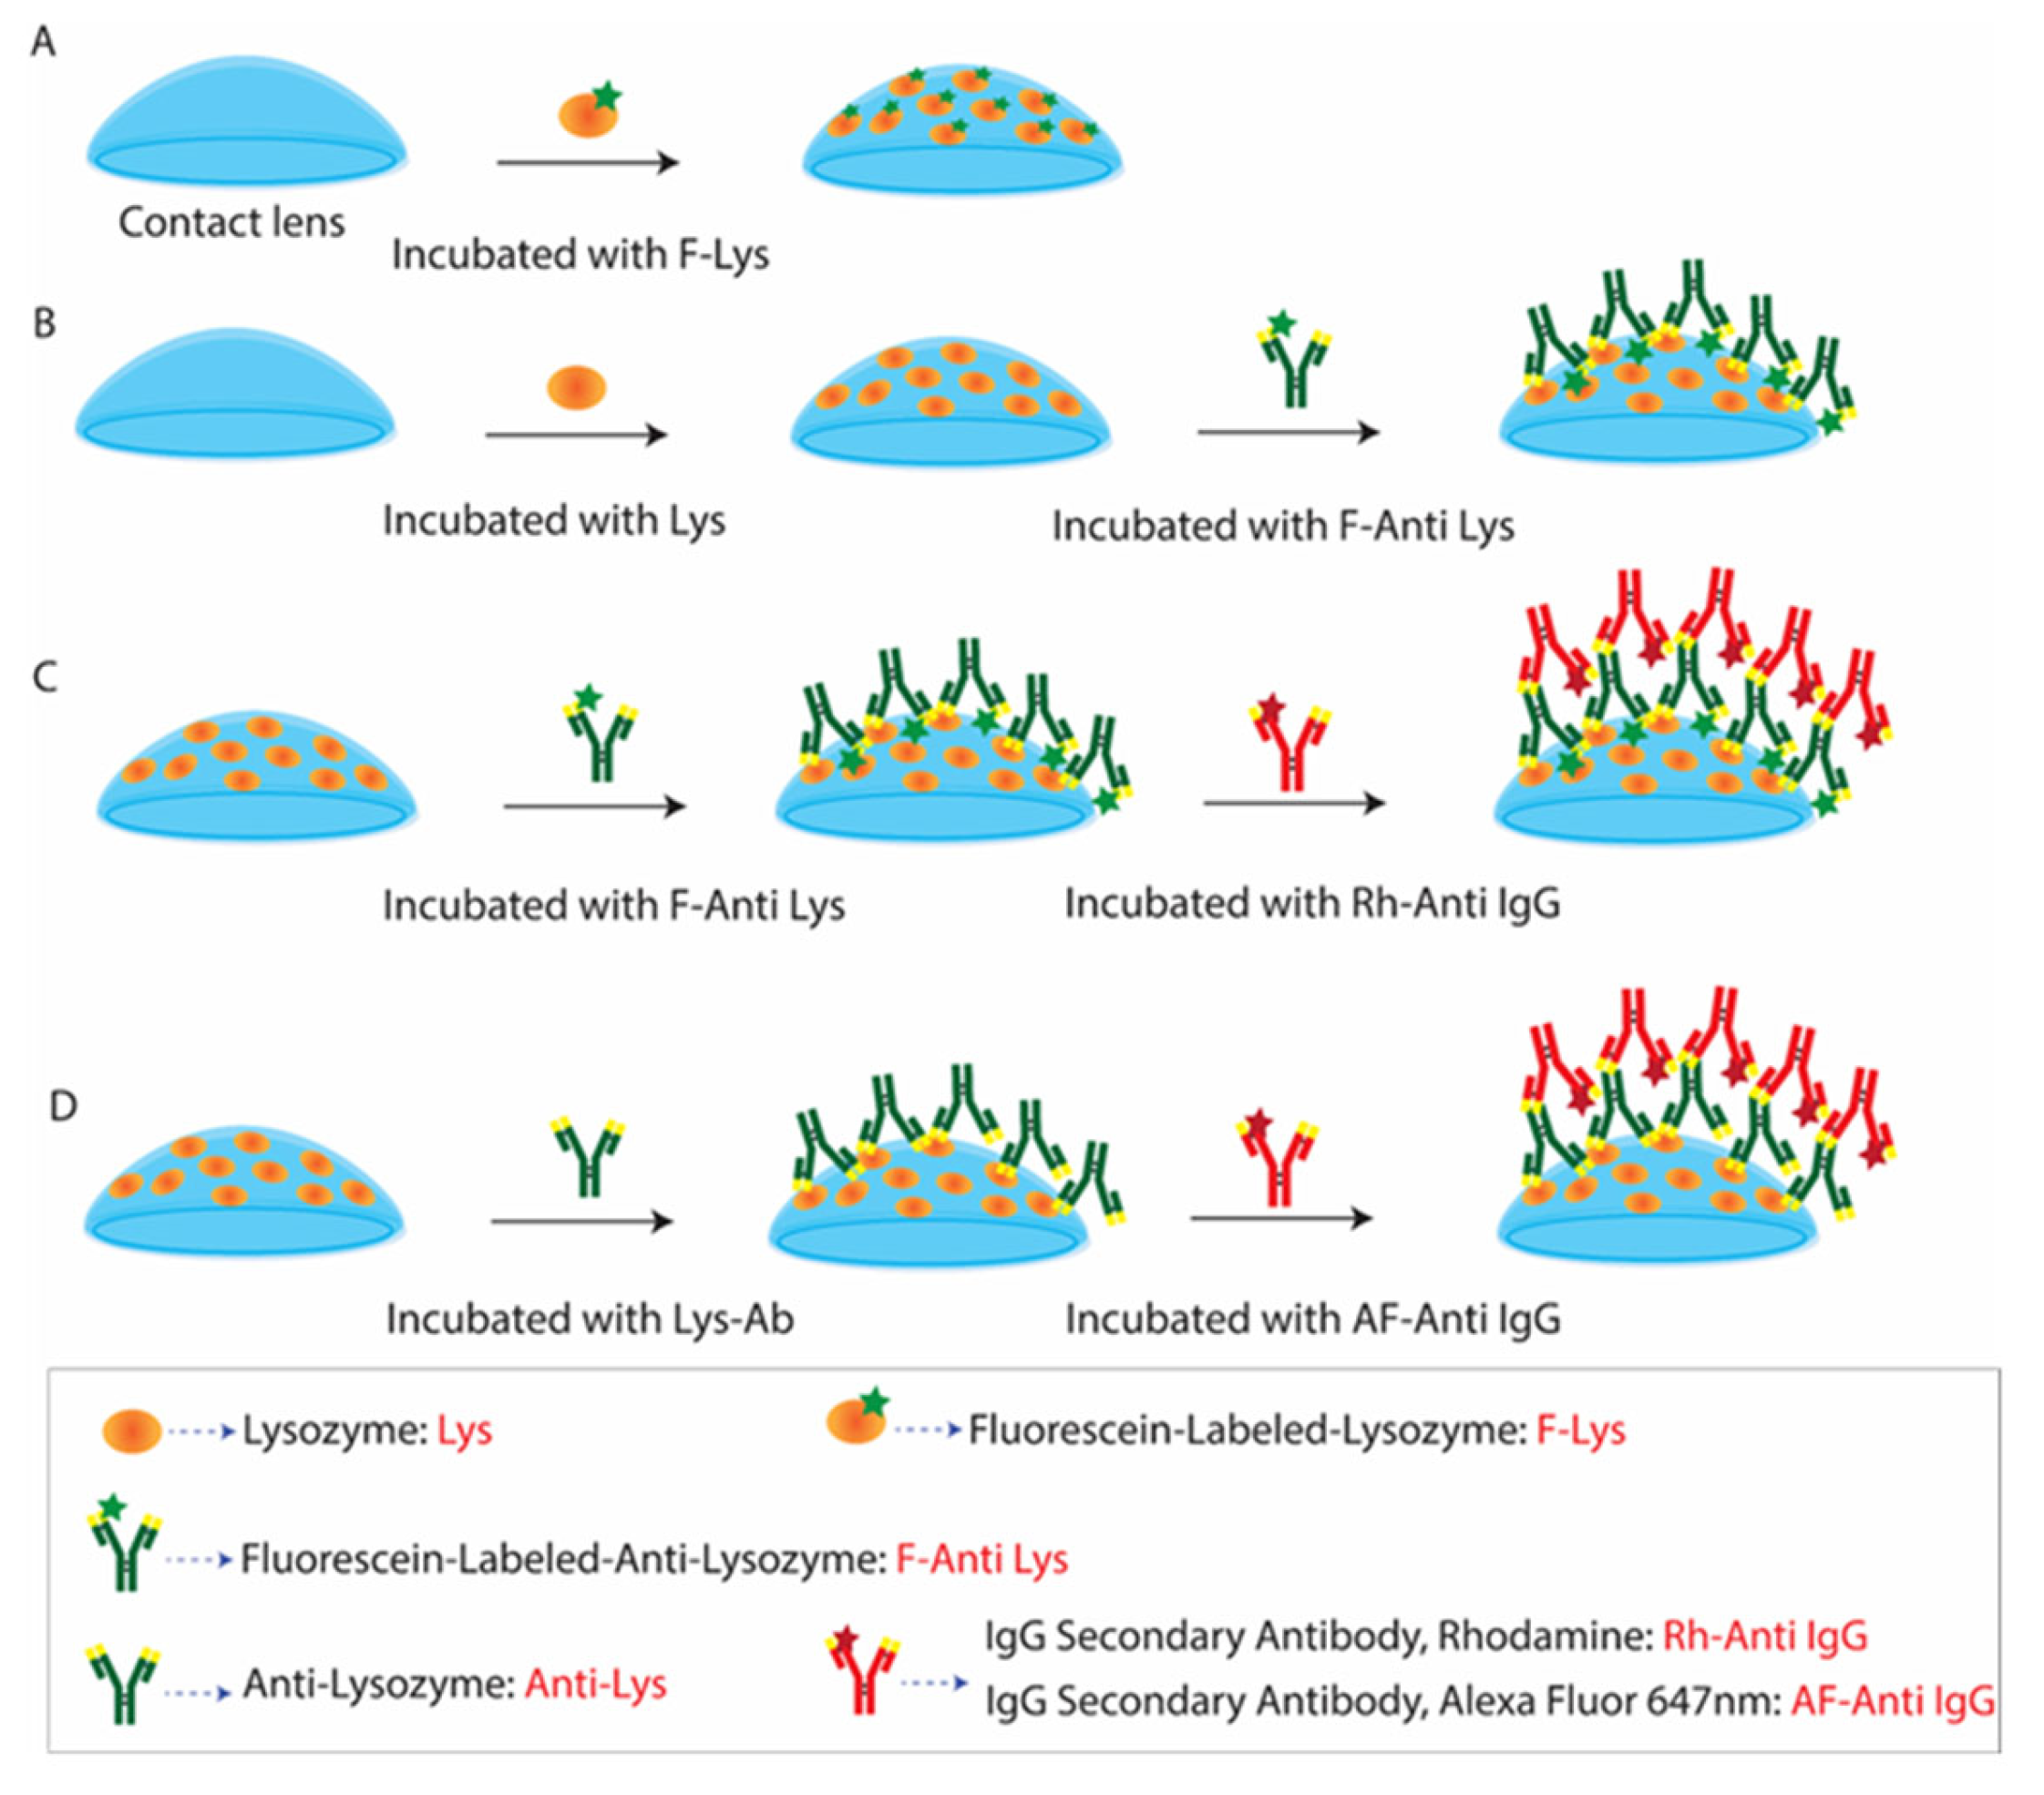
Figure 5.
(A) The procedure used to prepare F-Lys coated on a Lot A lens: every three minutes, a lens sample is incubated with F-Lys, subsequently washed with buffer solution, and the emission spectra are measured. The incubation cycles continued until the contact lens sample reached a constant intensity. Emission spectra and time-dependent intensities of F-Lys lens by using a spectrofluorometer (B). The inserted images show the F-Lys on the Lot A lens at 0 minutes and 75 minutes.
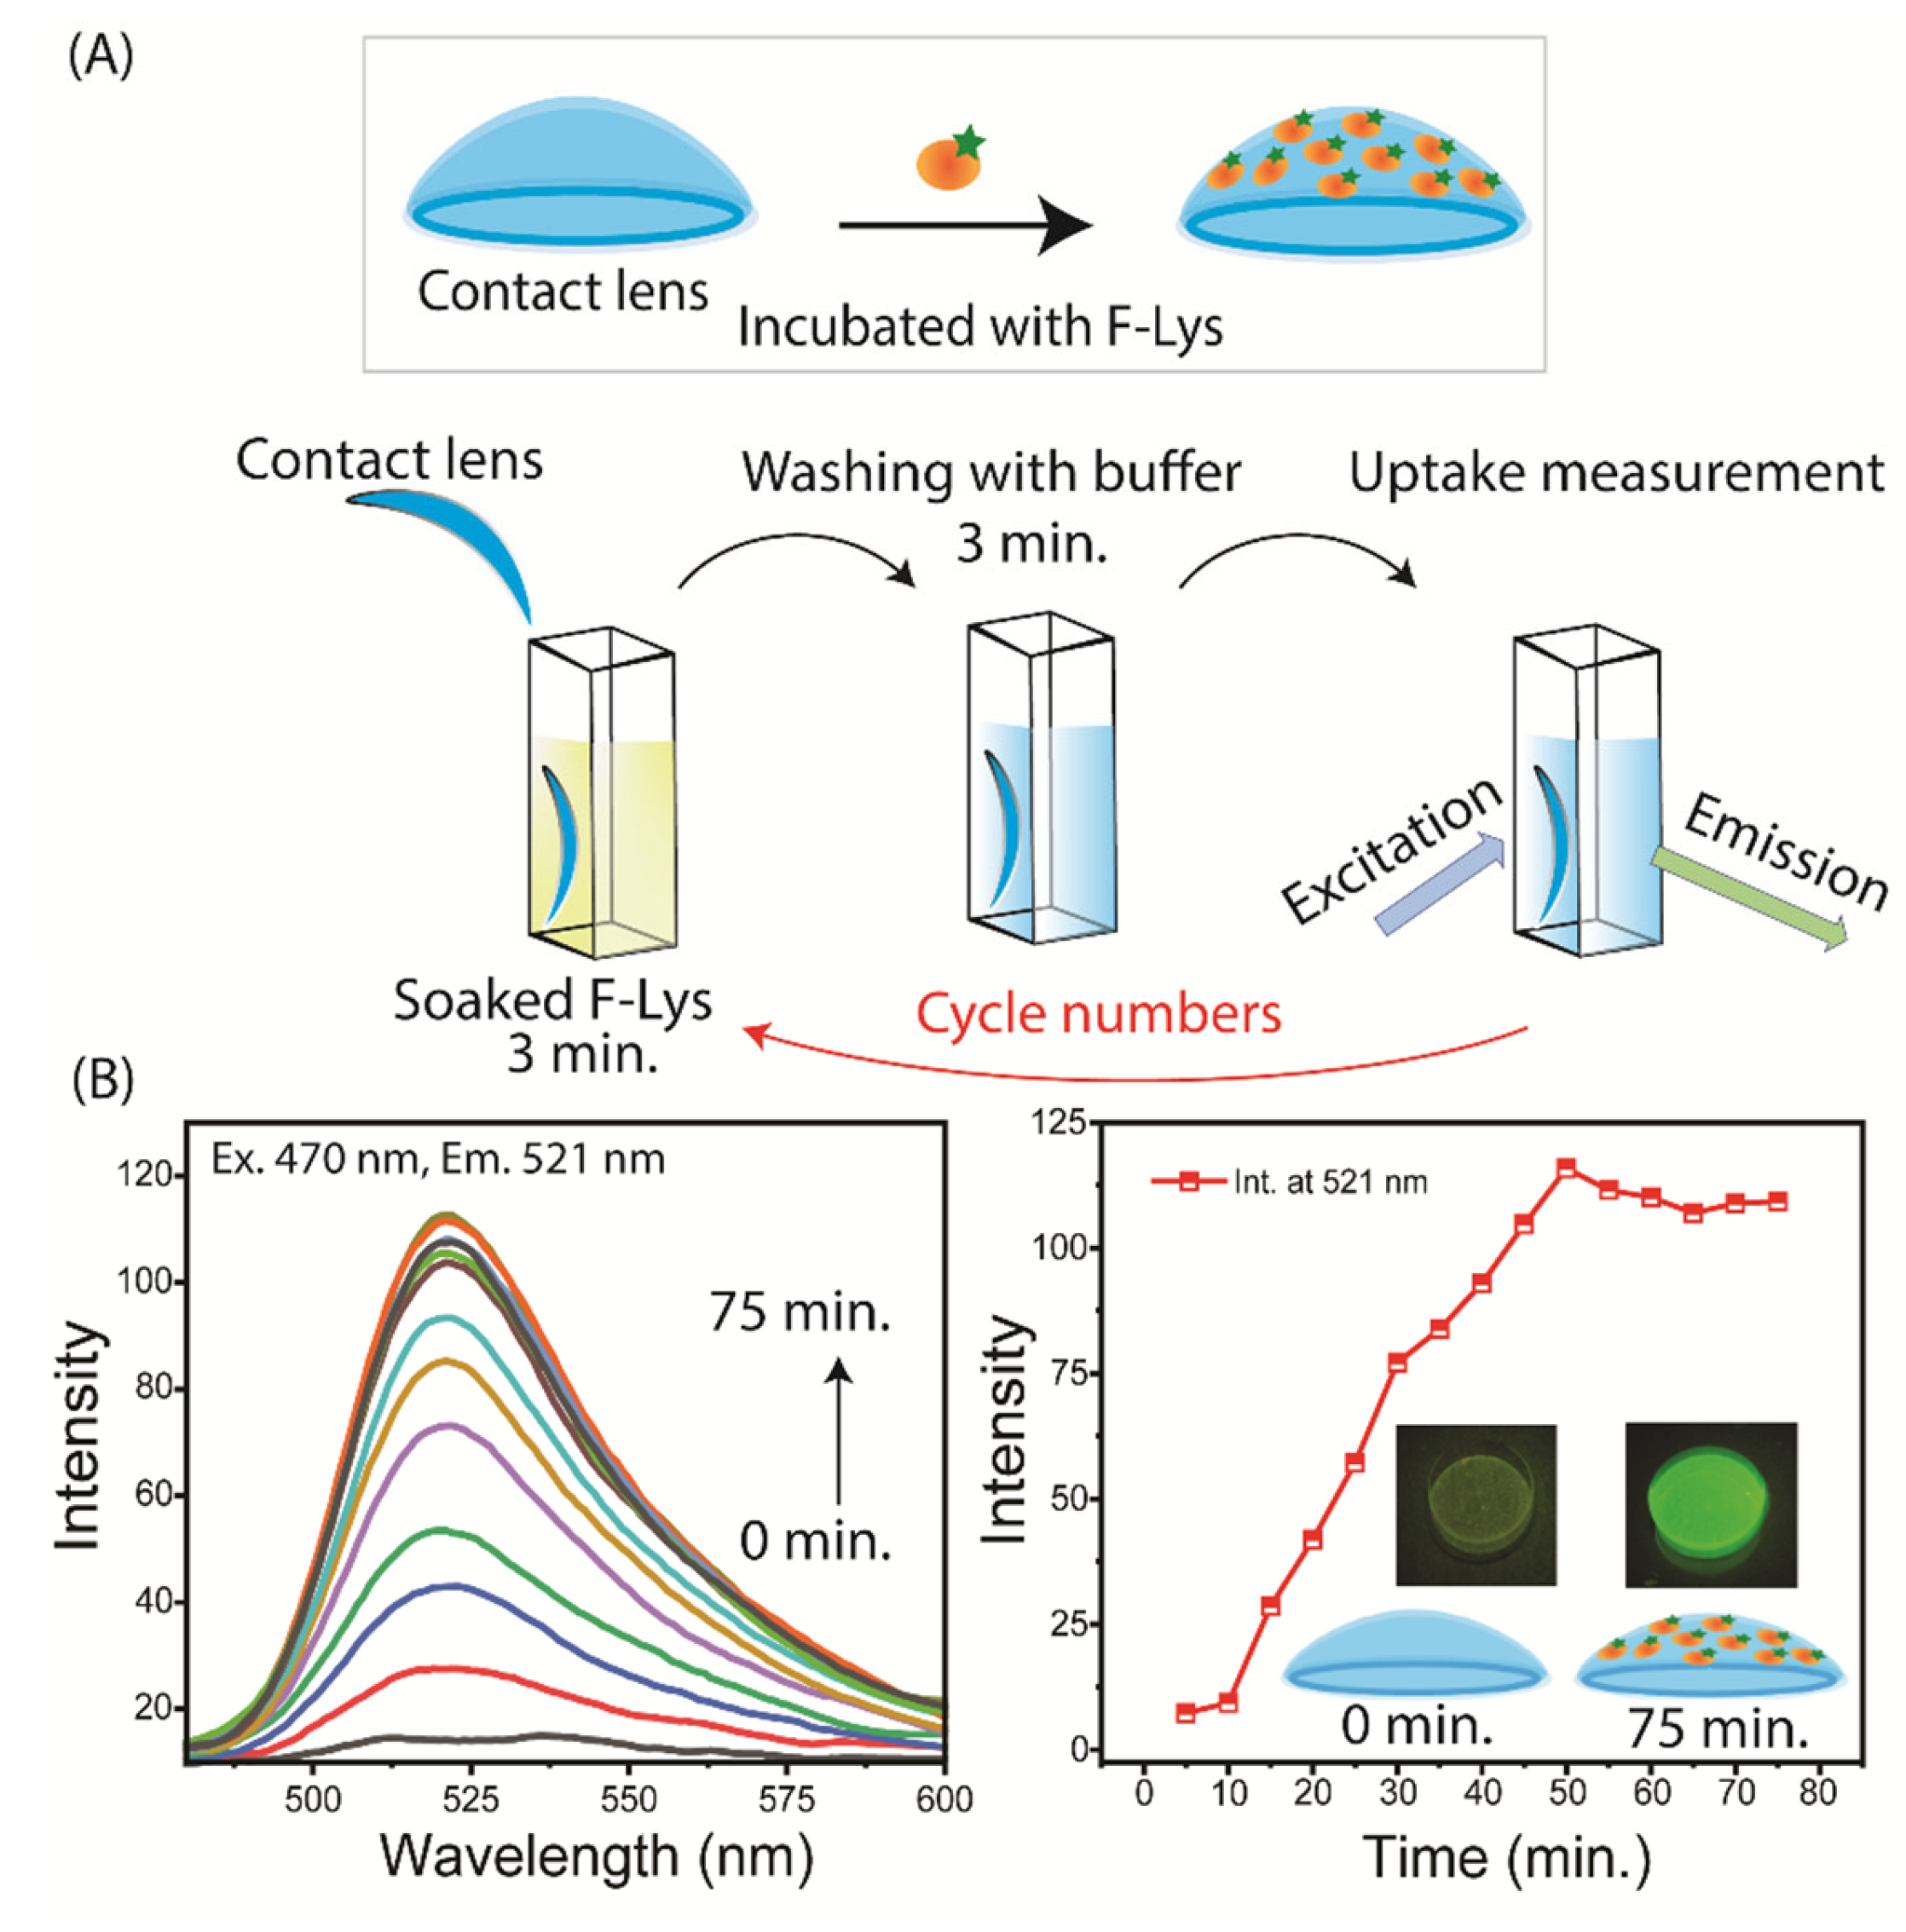
Figure 6.
(A) Time-dependent intensities and lifetime for F-Lys binding to the contact lens. The central area measured diameter was near 0.50 mm. (B) The intensity and lifetime measurements were obtained using the F-Lys lens, moved at intervals of 0.50 mm across the contact lens. The objective focus was adjusted for the locations of the lens.
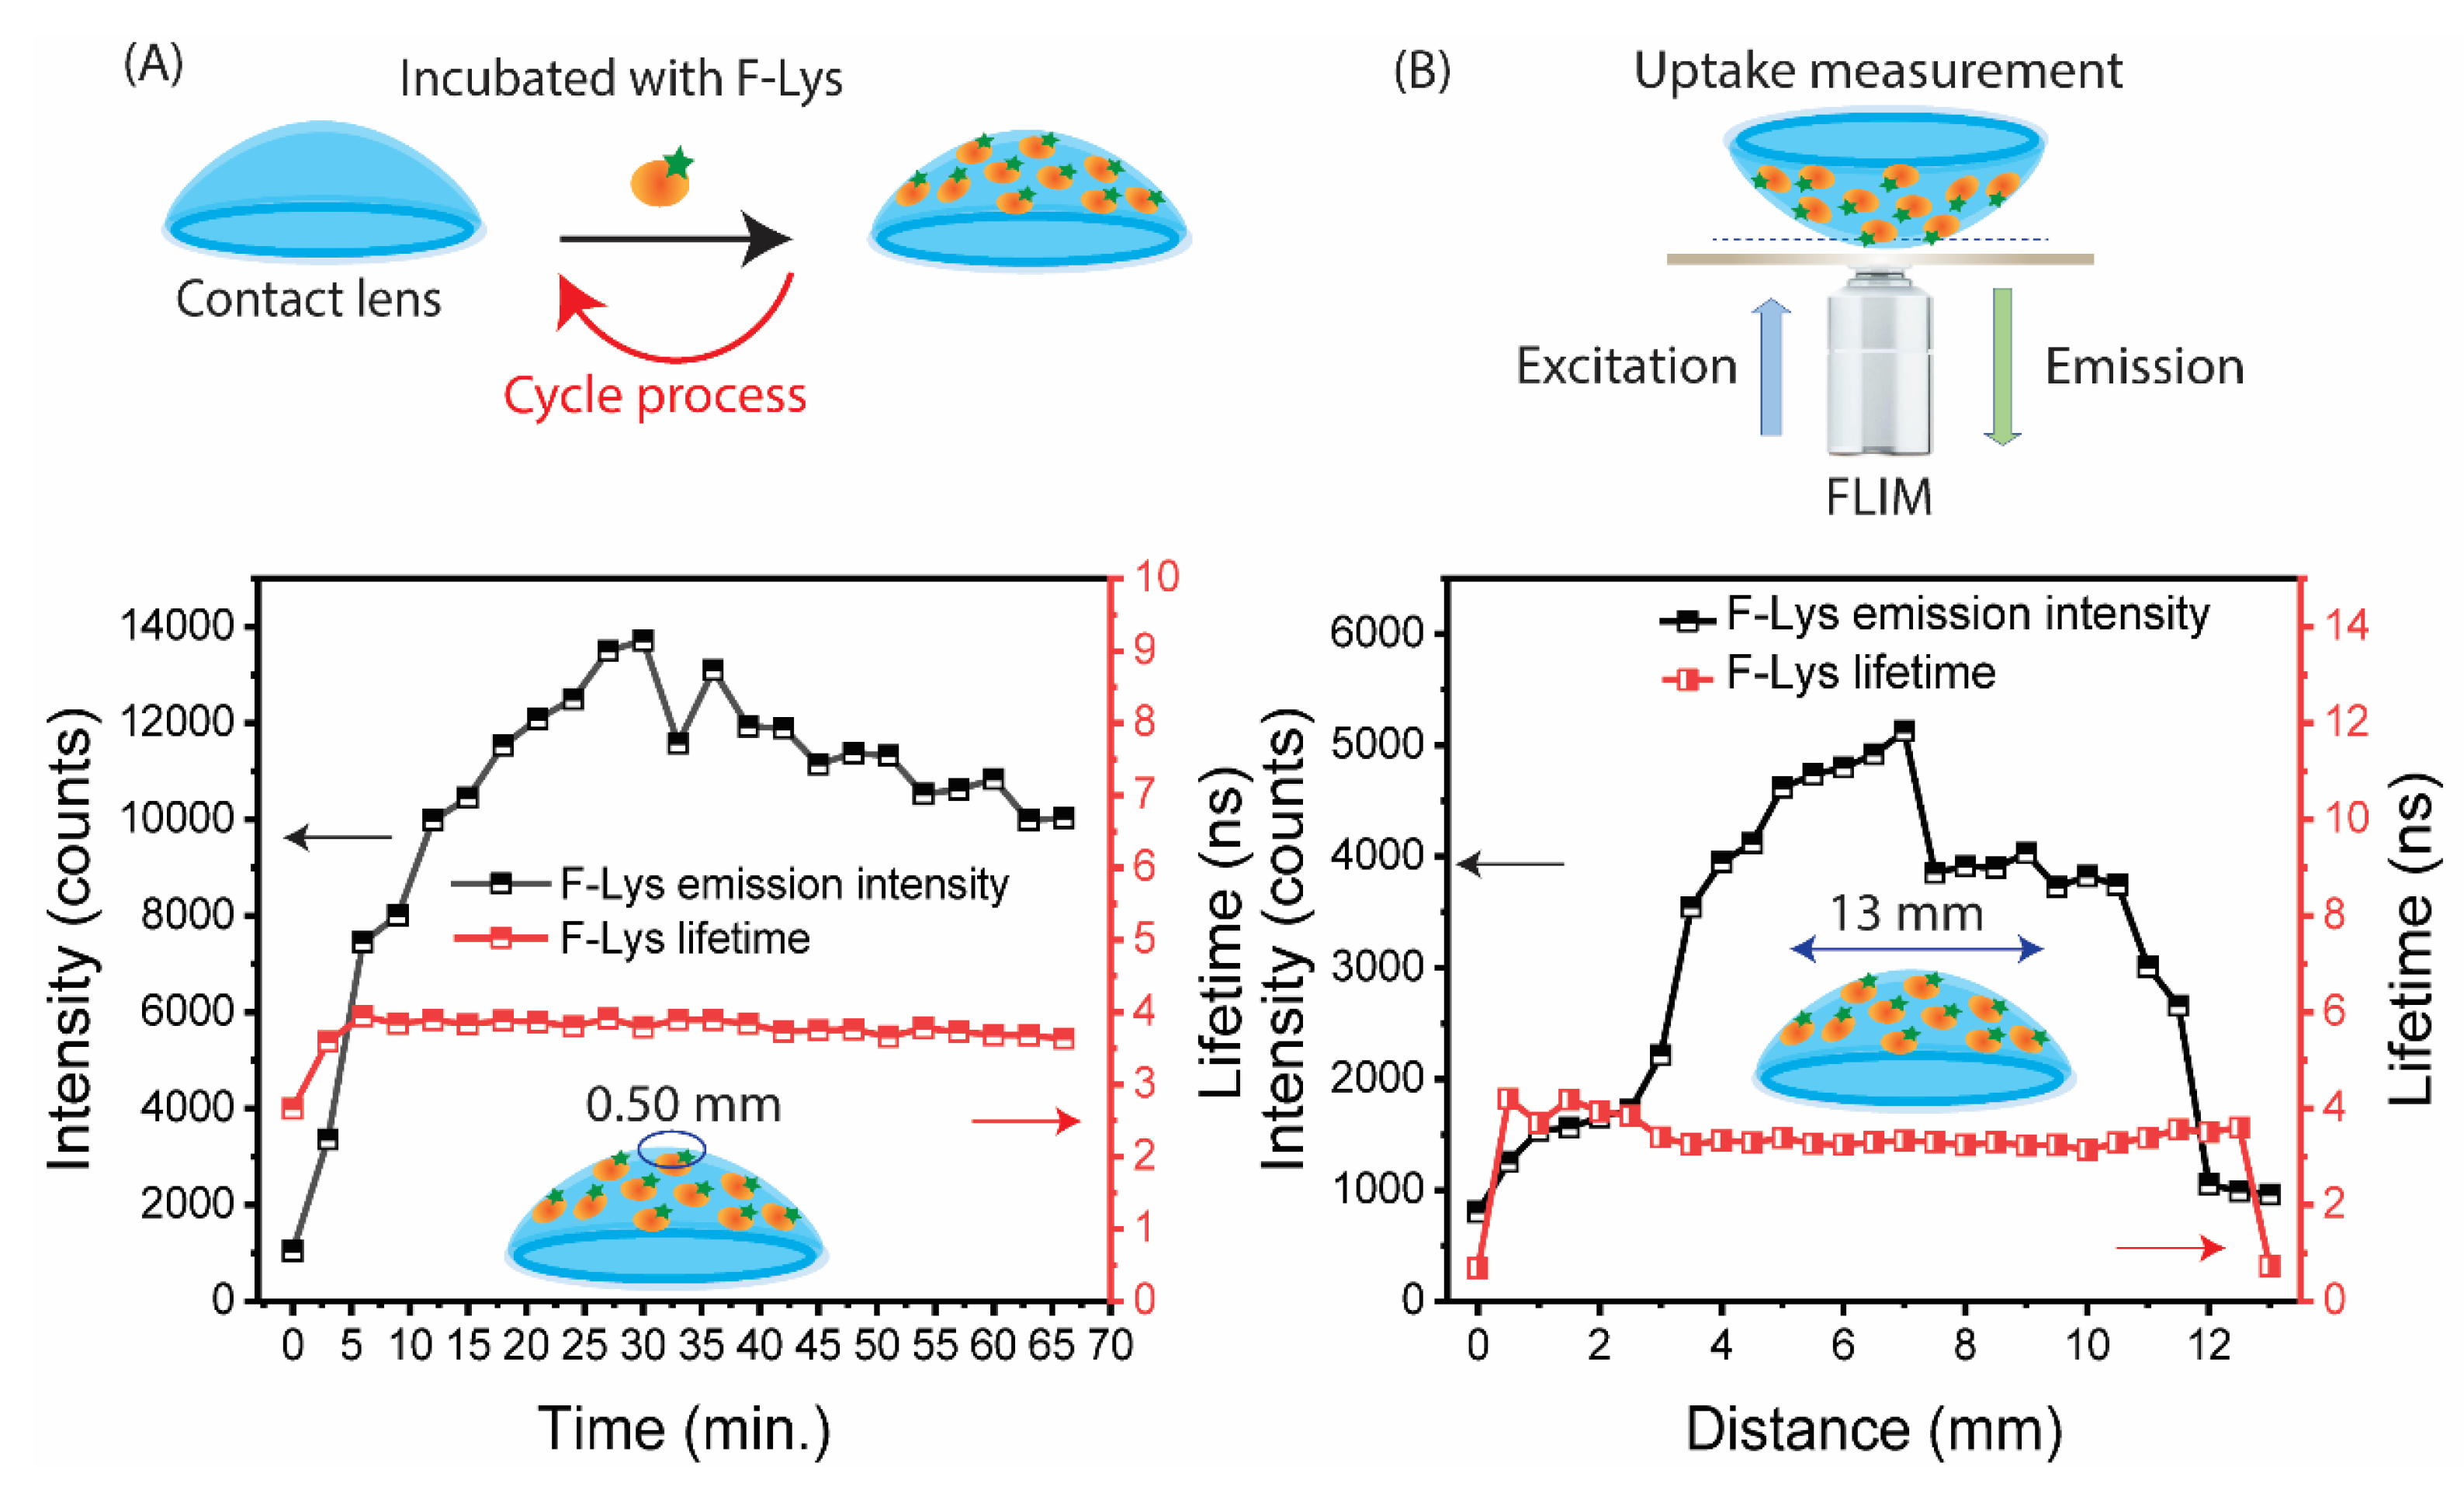
Figure 7.
Time-dependent measurements of F-anti Lys binding to a Lys coated lens. The measurements were stopped at reaching a constant intensity. (A) emission spectra; (B) intensity and lifetime.
Figure 7.
Time-dependent measurements of F-anti Lys binding to a Lys coated lens. The measurements were stopped at reaching a constant intensity. (A) emission spectra; (B) intensity and lifetime.
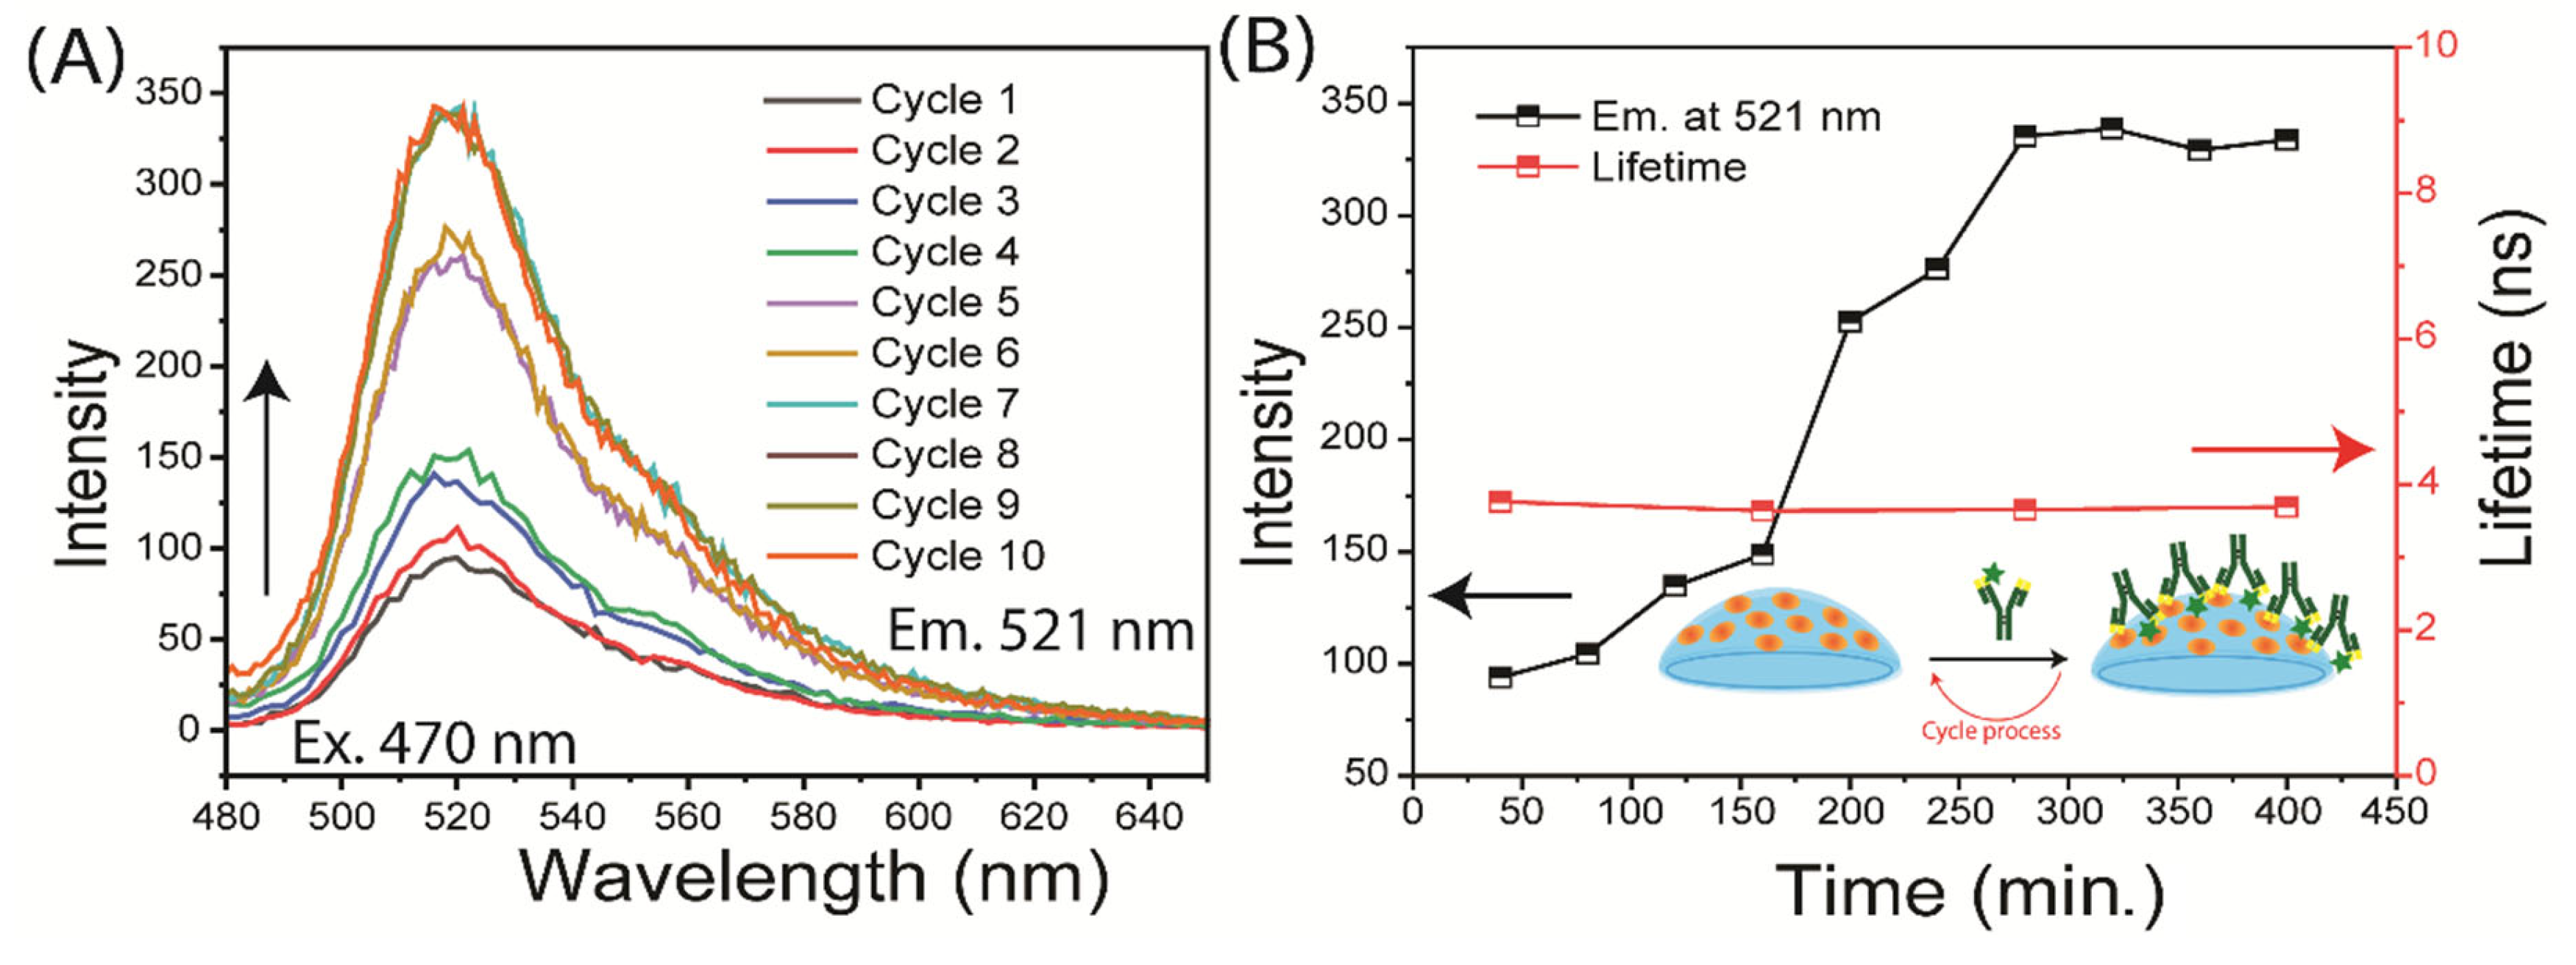
Figure 8.
Time-dependent measurements of detection Ab (Rh-Anti IgG) binding to a F-Anti-Lys coated contact lens. The measurements stopped after reaching a constant emission intensity, (A) emission spectra; (B) intensity. The insert shows the emission image of the lens after cycle 1 for each Rh-Anti IgG concentrations.
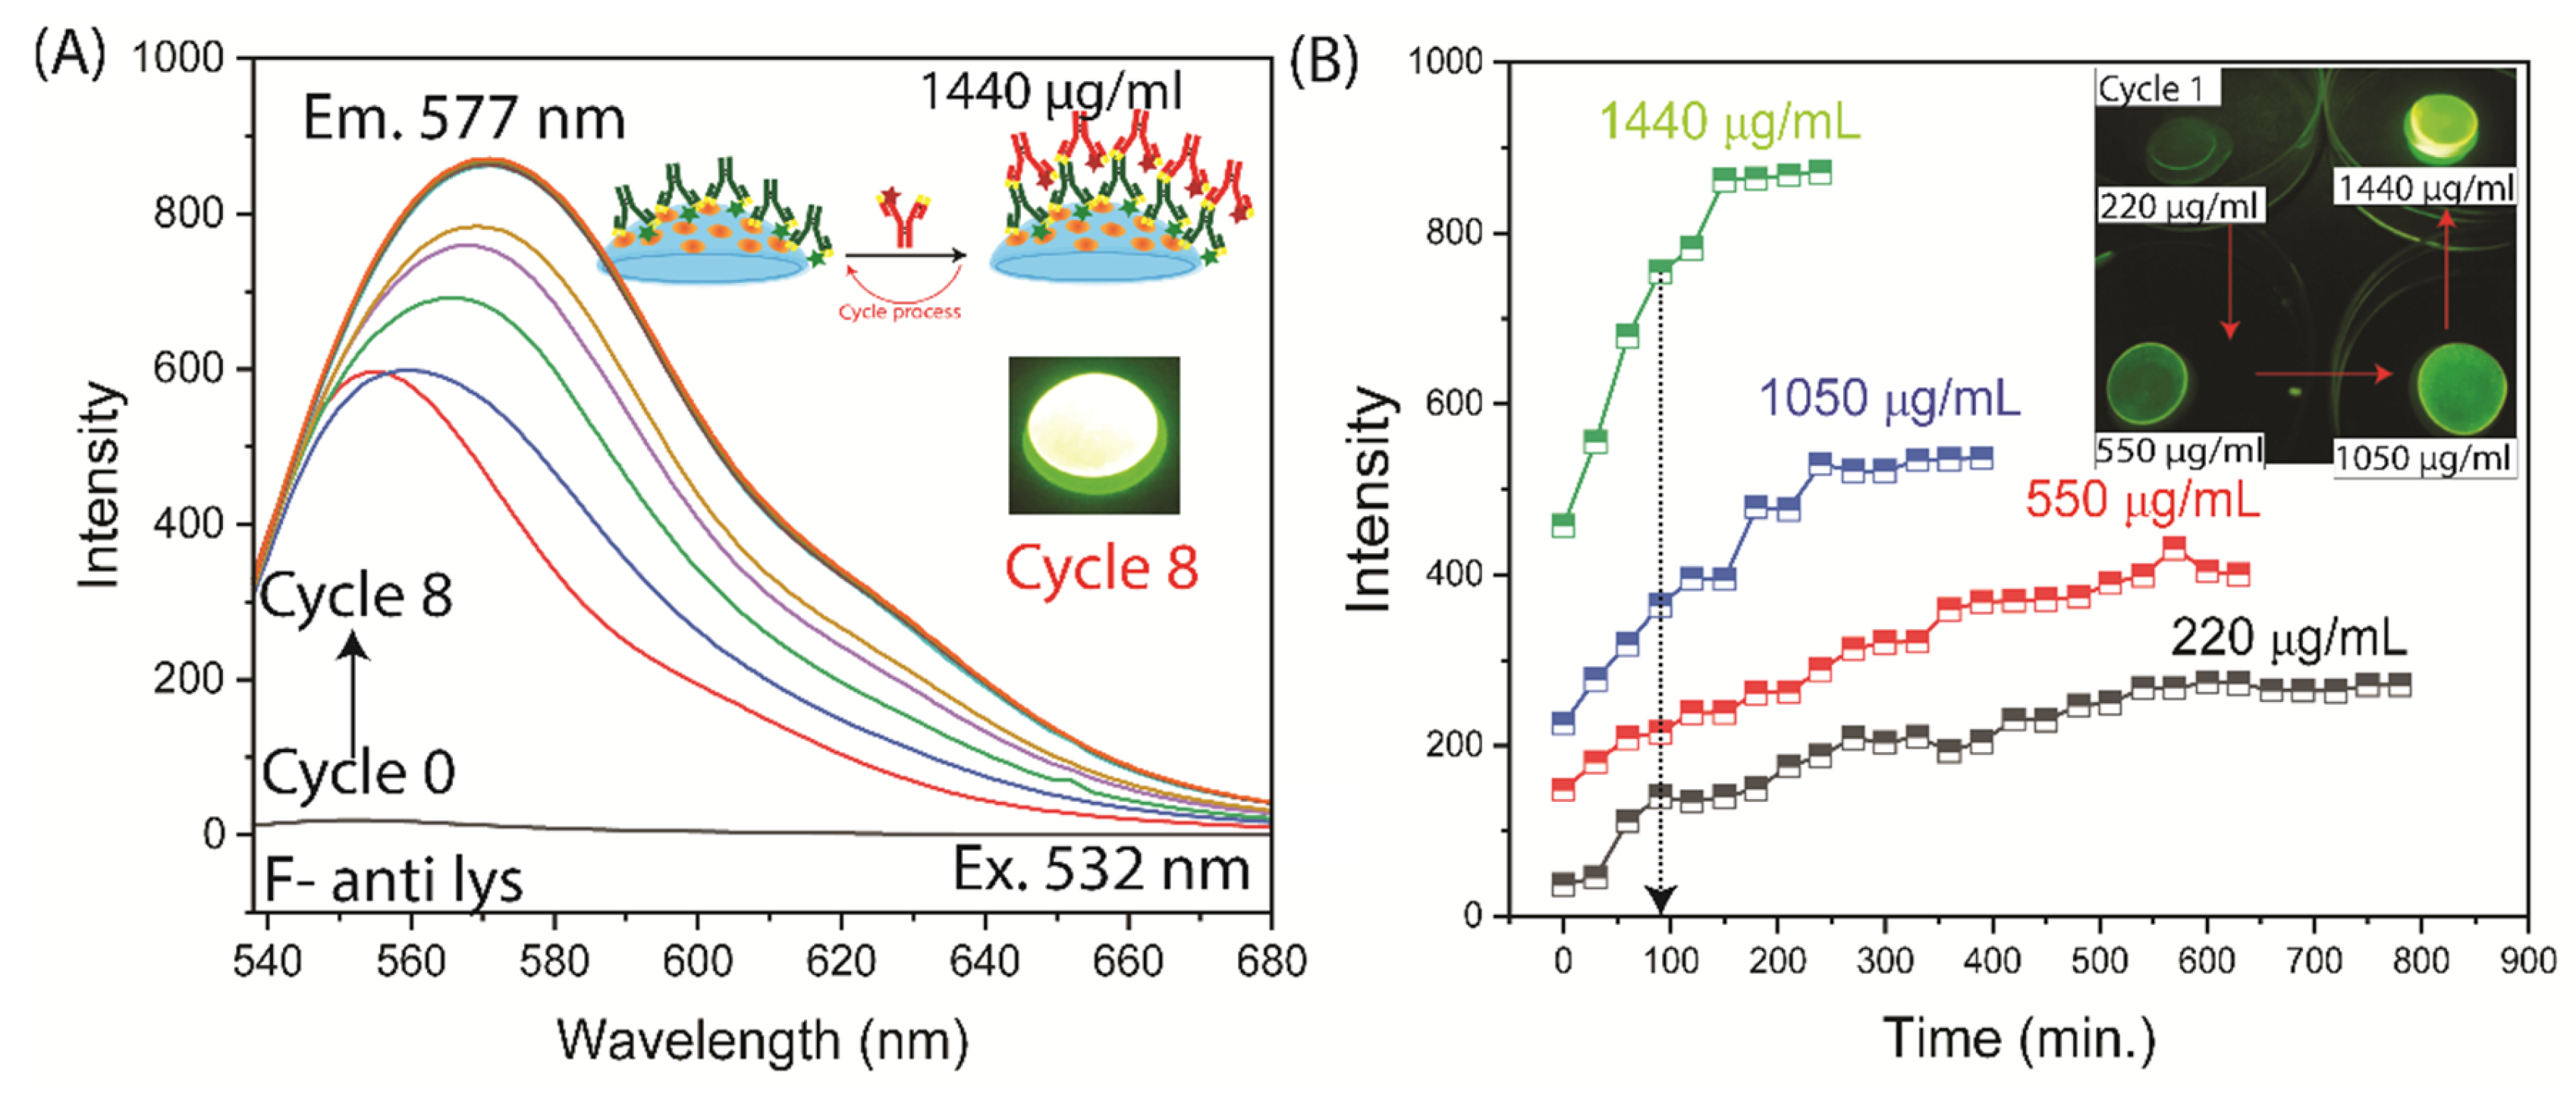
Figure 9.
Time-dependent measurements of AF-Anti IgG binding to an Anti-Lys coated contact lens. The measurements stopped after reaching a constant emission intensity, (A) emission spectra; (B) intensities. The insert shows the emission image of the lens at after incubated with AF-Anti IgG (Cycle 14). The time-dependent at 50 µg/mL was measured but not shown.
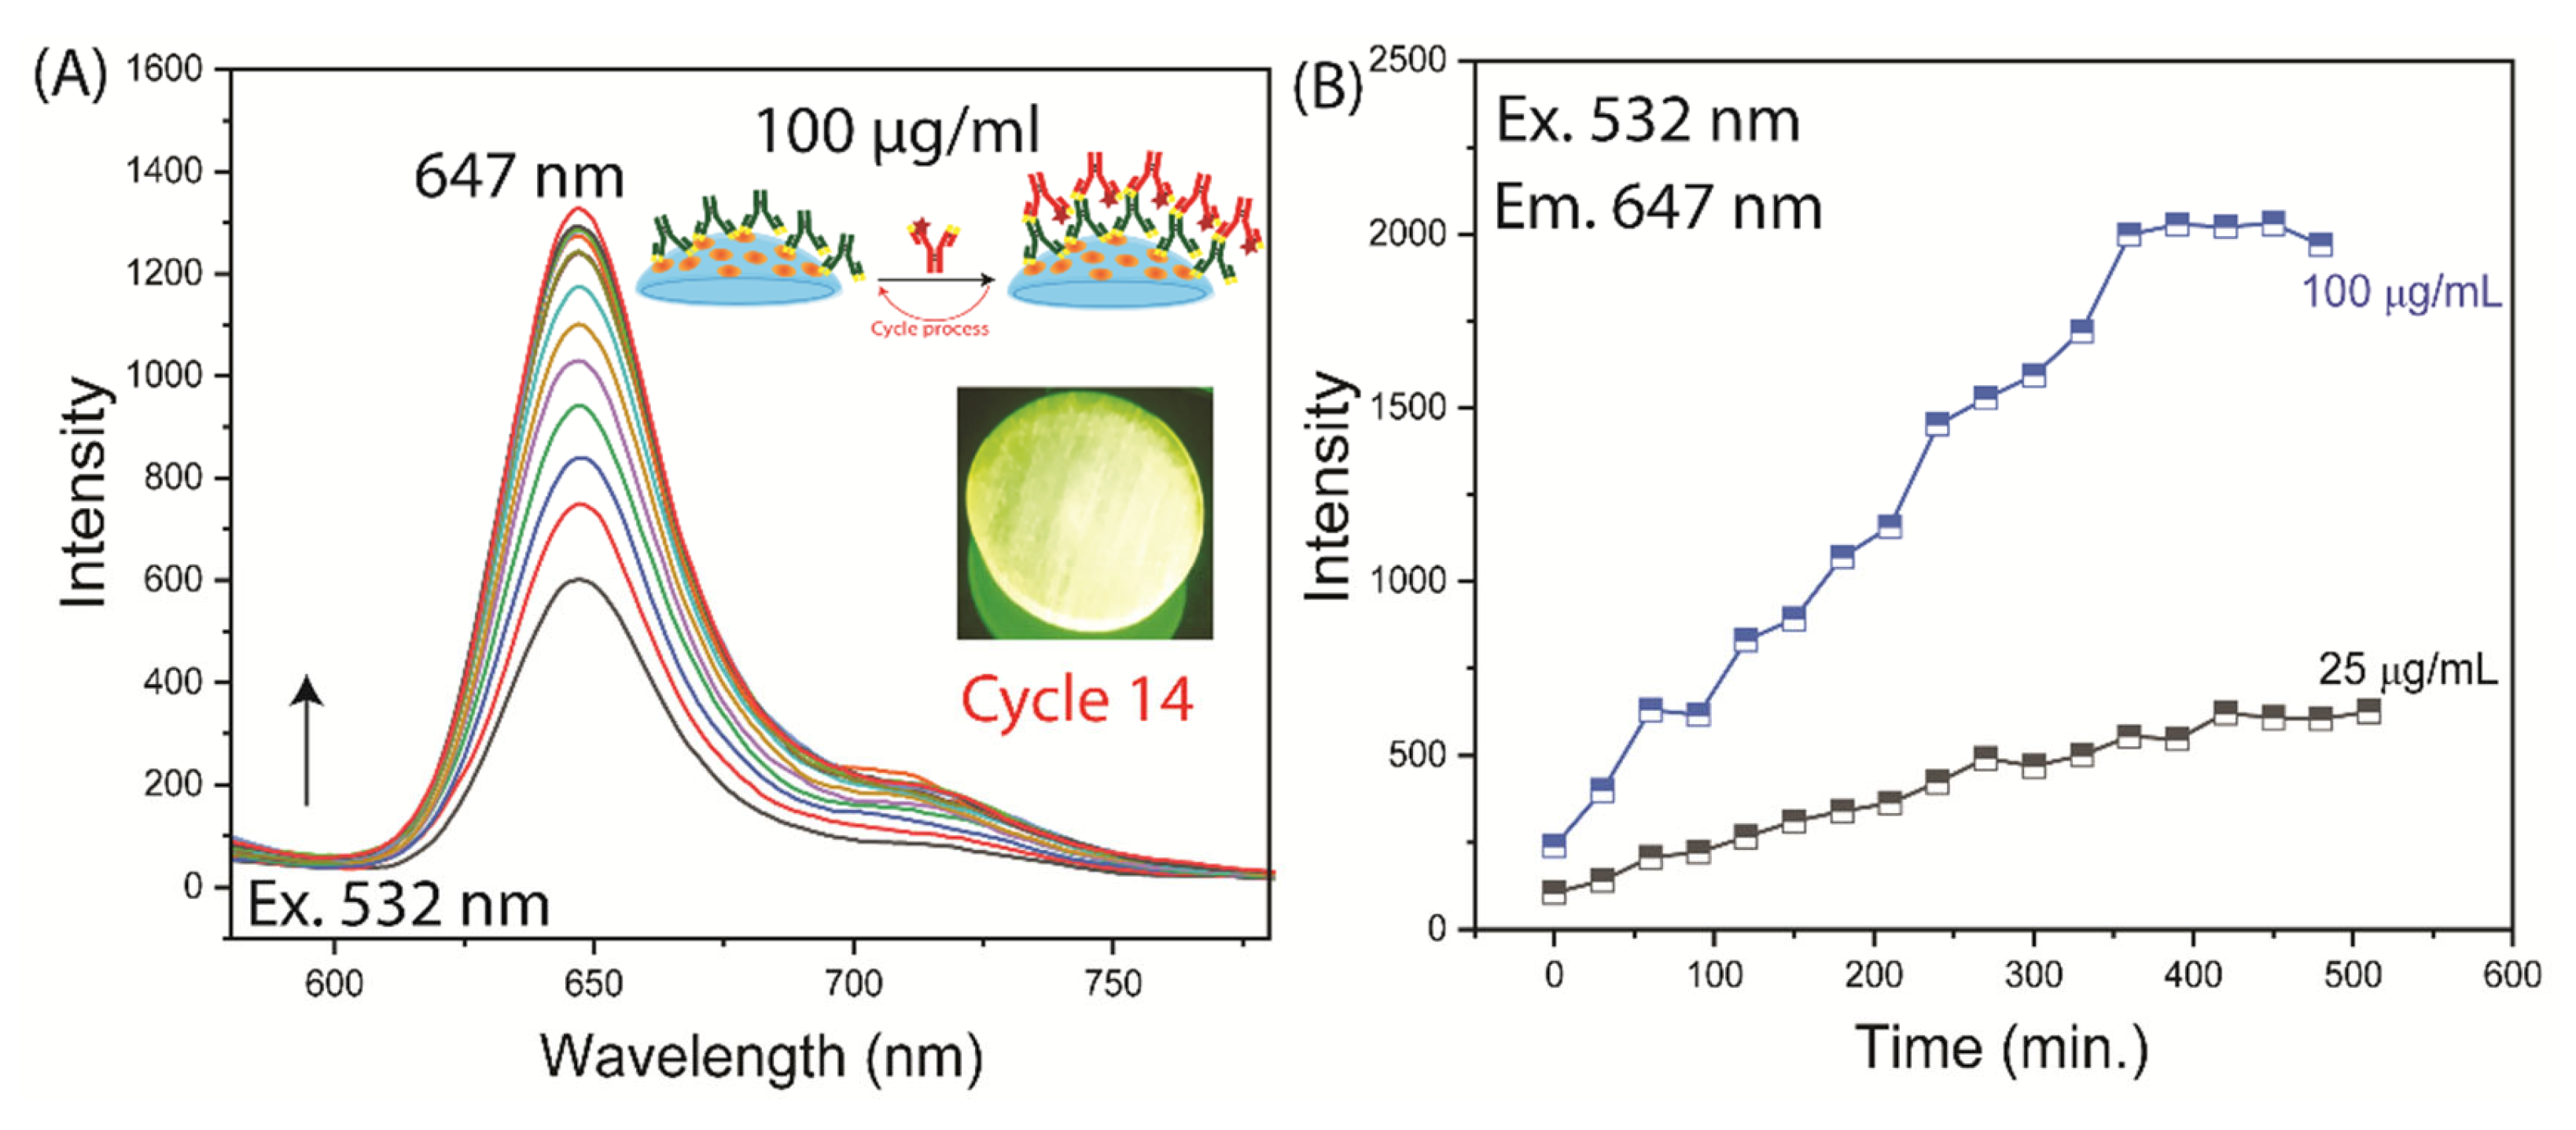
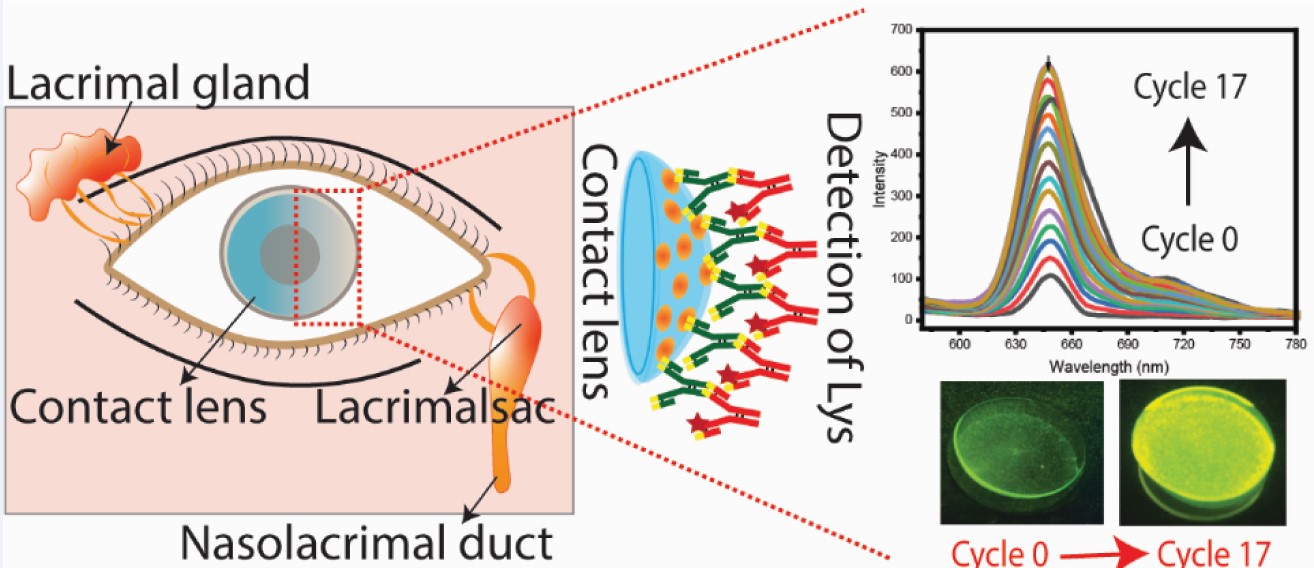
Figure 10.
Contact lens to measure MMP-9 over an expected concentration range. Green, contact lens with variable surface concentration of anti-MMP9. Red, control spots with ranges intensity.
Figure 10.
Contact lens to measure MMP-9 over an expected concentration range. Green, contact lens with variable surface concentration of anti-MMP9. Red, control spots with ranges intensity.
Disclaimer/Publisher’s Note: The statements, opinions and data contained in all publications are solely those of the individual author(s) and contributor(s) and not of MDPI and/or the editor(s). MDPI and/or the editor(s) disclaim responsibility for any injury to people or property resulting from any ideas, methods, instructions or products referred to in the content. |
© 2025 by the authors. Licensee MDPI, Basel, Switzerland. This article is an open access article distributed under the terms and conditions of the Creative Commons Attribution (CC BY) license (http://creativecommons.org/licenses/by/4.0/).
Copyright: This open access article is published under a Creative Commons CC BY 4.0 license, which permit the free download, distribution, and reuse, provided that the author and preprint are cited in any reuse.


