
Submitted:
10 June 2025
Posted:
10 June 2025
You are already at the latest version
Abstract
Human activities cause land use change and affect ecosystem service value and carbon emissions. It is of great significance to explore the relationship between ecosystem service value and land use carbon emissions to promote regional low-carbon development and promote the construction of ecological civilization. The Loess Plateau is selected as the study area, and the ecosystem service value (ESV) and land use carbon emissions in the study area are estimated by using the land use data of five periods from 2000 to 2020. The spatio-temporal characteristics and correlation between the two are analyzed, and the sustainable development capacity of the ecosystem is evaluated based on the four-quadrant model. The results show that: (1) From 2000 to 2020, the ecosystem service value of the Loess Plateau increased from 579.032 billion yuan to 582.470 billion yuan, an overall increase of only 0.15%. (2) The carbon emissions from land use in the Loess Plateau increased from 1.37 ×10⁸t during the study period increased to 4.58×10⁸t, with an average annual growth rate of 6.20%. Energy consumption in the process of industrialization and urbanization is the main factor for its growth. (3) There is a certain spatial positive correlation between ecosystem service value and land use carbon emissions, and the regional scope and distribution of significant correlation between 2000 and 2020 have little change. (4) The intensity of ecosystem service value and land use carbon emissions at the county scale change steadily over time. Most counties are located in the general area of ecosystem sustainable development capacity, indicating that there is a certain room for improvement in ecosystem sustainable development capacity. The research results can provide reference for the formulation of regional refined ecological management and differentiated carbon emission reduction policies.
Keywords:
ecosystem services
; carbon emission
; land use change
; four-quadrant model
; the Loess Plateau
1. Introduction
Ecosystem services encompass the diverse benefits that ecosystems offer directly or indirectly to support human survival and advancement [1]. The United Nations Millennium Ecosystem Assessment categorizes these services into four groups: supply services, regulation services, support services, and cultural services [2], emphasizing the intimate connection between ecosystem services and human well-being. As an effective index to measure ecosystem services, ecosystem service value plays an important role in carrying out ecosystem monitoring and management and formulating ecological environment protection policies [3,4]. With the development of the economy, a large number of man-made greenhouse gas emissions aggravate global warming, which brings great challenges to the natural ecological environment and the sustainable development of the economy and society [5]. Under the current situation of global warming, carbon neutrality, as a key measure to address climate change and achieve sustainable development, has become a global hot topic and has received extensive attention from scholars at home and abroad [6,7,8,9]. As a key factor in global environmental change, land use change can directly affect ecosystem services [10] and ecosystem carbon emissions and carbon sequestration processes [11,12] by changing ecosystem structure, function and ecological processes. With the acceleration of urbanization, the increase of urban population and the expansion of built-up area aggravate the change of land use [13]. On the one hand, land use change affects the value of ecosystem services by affecting the structure and function of ecosystems [14]. On the other hand, it also affects land use carbon emissions by affecting land use types and structures the world’s largest carbon emitter [16], China’s carbon emissions will reach 106.7 billion tons in 2020, accounting for about 30.7% of global total carbon emissions [17]. Among them, carbon emissions related to land use change account for about 33% of anthropogenic carbon emissions, second only to carbon emissions from fossil fuel combustion [18]. In order to cope with climate change, the Chinese government has proposed to achieve ‘carbon peak’ by 2030 and ‘carbon neutrality’ by 2060. Therefore, under the goal of ‘double carbon’, it is of great significance to explore the spatial and temporal correlation model between ecosystem services and land use change, to coordinate economic development and ecological environment protection, to formulate differentiated ecological compensation policies, and to build a low-carbon land spatial pattern [19].
Since the 1990s, land use/cover change (LUCC) has gradually become a research hotspot of scholars at home and abroad. The impact of LUCC on ecosystem service value (ESV) and carbon emissions at different spatial scales has become an important issue in the field of ecological environment. In terms of the impact of land use change on ESV, the existing research mainly focuses on the evaluation of ecosystem service value [20], the feedback mechanism between ecosystem services and land use [21], the spatial and temporal evolution characteristics and interrelationship analysis of the two [22], and the scenario prediction of future changes [23]. For example, Rudolf et al. [24] estimated the ESV of 10 major biomes in the world and found that there were significant differences in the service value between different land use types, and land use change may cause greater damage to the positive externalities of the ecosystem. In terms of land use carbon emissions, the research mainly focuses on the mechanism of carbon emissions, influencing factors, effect analysis [25] and spatial and temporal evolution characteristics [26]. On this basis, some scholars have further explored the decoupling relationship between land use carbon emissions and economic development and the low-carbon optimization path, and the research paradigm has gradually developed from a single direction to a multi-dimensional and multi-disciplinary cross-integration direction. However, the existing research mainly focuses on different scales such as national [27,28], provincial [29,30], municipal [31,32] and county [33,34], focusing on the single aspect of ecosystem services or land use change. The discussion on the spatial and temporal relationship between ecosystem service value and land use carbon emissions is still relatively weak, and further research is needed.
As the largest loess-covered area in the world, the Loess Plateau has obvious environmental problems such as soil drying, soil erosion, insufficient vegetation cover and water shortage [35]. It is one of the most fragile areas of China’s ecological environment. With the rapid expansion of urban space, the land use pattern in the Loess Plateau has undergone profound changes, and the ecosystem service function is weak. Therefore, this study takes the Loess Plateau as the research area, and evaluates the ecosystem service value and land use carbon emissions of 340 counties (districts) in the region from 2000 to 2020 based on the five-period land use data from 2000 to 2020. By constructing a four-quadrant model between ecosystem service value intensity and land use carbon emission intensity, the relationship between the two is discussed, which provides theoretical support for ecosystem protection and carbon emission reduction policy formulation in the Loess Plateau.
2. Materials and Methods
2.1. Study Area
The Loess Plateau region includes the whole region of Shanxi Province and Ningxia Hui Autonomous Region and parts of Inner Mongolia Autonomous Region, Shaanxi Province, Gansu Province, Qinghai Province and Henan Province (Figure 1). According to the data of the seventh national census in 2020, the permanent population of the Loess Plateau is 115 million, accounting for 8.15% of the total population of the country. The population density is 181 per square kilometer on average, 33 more than the national average. The Loess Plateau has a large population and a large intensity of social and economic activities. Since the 21 st century, with the acceleration of industrialization and urbanization, the land use and land cover types in the region have changed significantly, which has caused great changes in regional ecosystems and carbon emissions [36,37].
2.2. Data
In this study, 2000 was selected as the research base period, and the interval was 5 years. The data used in the study mainly include land use data from 2000 to 2020, area, yield and price of main crops planted in the study area, energy consumption data and socio-economic data of land use carbon emissions. Land use data comes from the resource and environment data cloud platform of the Chinese Academy of Sciences (https://www.resdc.cn/), with a spatial resolution of 1 km. According to the land resources and their utilization attributes, the land use/land cover data are reclassified into 6 first-level categories of cropland, forest, grassland, waters, construction land and unutilized land, and then subdivided into 23 second-level categories according to the natural attributes of land resources. The data of the area, yield and price of the main crops are derived from the statistical yearbook of the provinces in the study area and the ‘National Agricultural Product Cost-Benefit Information Compilation’. The energy consumption and socio-economic data of land use carbon emissions are derived from the statistical yearbook of the provinces in the study area, the seventh national census bulletin and the ‘China Energy Statistics Yearbook’ (2023).
2.3. Methods
2.3.1. Calculation Model of Ecosystem Service Value
In this study, the ecosystem service value of the Loess Plateau was quantitatively evaluated based on the Chinese terrestrial ecosystem service value equivalent table per unit area established by Gaodi Xie [38]. According to the actual situation of the Loess Plateau and the previous research methods [39], the ecosystem service value equivalent table of the study area was constructed (Table 1), and it was corrected based on the grain yield and price data of the study area. The data of planting area, yield and purchase price of wheat, corn and soybean from 2000 to 2020 were obtained from the provincial statistical yearbooks. The average yield (2394.11 kg/hm2) and average purchase price (2.71 yuan/kg) of main crops for many years were calculated. According to the principle that the equivalent coefficient of economic value of one standard ecosystem service value equivalent factor is 1/7 of the economic value of food production per unit area of farmland [40], the economic value of the equivalent factor of farmland ecosystem service value per unit area in the Loess Plateau is calculated to be 926.86 yuan/hm2. Based on this, the ecosystem service value coefficient per unit area of different land use types in the Loess Plateau is obtained, and then the ecosystem service value and its intensity are calculated:
where is the value of ecosystem services; is the area of land use type; is the ecosystem service value coefficient; is the area of the th county.
2.3.2. Calculation Model of Land Use Carbon Emissions
Land use carbon emissions include direct carbon emissions and indirect carbon emissions. The former mainly refers to the carbon emissions caused by the current land use, and the latter mainly refers to the total amount of anthropogenic carbon emissions carried by land use types [41]. The Loess Plateau mainly involves six types of land use types: cropland, forest, grassland, waters, construction land and unutilized land. The carbon source and carbon sink capacity of different land use types are also different. In this study, the direct carbon emission and indirect carbon emission of land use were combined with the previous research results [42,43] and the actual situation of the study area. The carbon emission effect of land use in the Loess Plateau was calculated based on the carbon emission (absorption) coefficient of various land use types. Specifically, the direct carbon emission coefficient method is used to measure the carbon emission (absorption) of cropland, forest, grassland, waters and unutilized land. The calculation formula is:
where is the direct carbon emissions; is the carbon emissions of different land use types; is the area of each land use type (hm2); is the carbon emission or absorption coefficient of each land use type (Table 2), where the emission is positive and the absorption is negative.
The indirect estimation method is used to calculate the carbon emissions of construction land. As the main carbon source, the carbon emission coefficient of construction land is difficult to determine due to the influence of human life and production activities. Therefore, i t can only be simply estimated by the carbon emission coefficient of energy consumption in the process of construction land utilization. Through the ‘China Energy Statistics Yearbook’ (2023) and the ‘2006 IPCC Guidelines for National Greenhouse Gas Inventories’, the standard coal conversion coefficient and carbon emission coefficient of various energy sources are obtained (Table 3). According to the standard coal conversion coefficient, the energy consumption is converted into tons of standard coal, and then the carbon emission of construction land is calculated according to the carbon emission coefficient. The calculation formula is:
where is the carbon emission of construction land; is the carbon emissions generated by various energy consumption; is a variety of energy consumption; is the standard coal conversion coefficient of various energy sources; is the carbon emission coefficient of various energy sources. The calculation formula of land use carbon emission intensity is:
where is the land use carbon emission intensity of the th administrative unit; is the total carbon emissions; and are the sum of carbon emissions of cropland, forest, grassland, waters and unutilized land and the carbon emissions of construction land; is the area of administrative unit.
2.3.3. Bivariate Spatial Autocorrelation Analysis
Spatial autocorrelation analysis is an important method to reflect the spatial correlation of geographical elements, which can be divided into global spatial autocorrelation and local spatial autocorrelation [47]. This study uses the bivariate global spatial autocorrelation method to analyze the spatial relationship between ecosystem services and land use carbon emissions. The calculation formula is:
where is the Moran’s index of bivariate global spatial autocorrelation of ecosystem services s and land use carbon emissions e; and are the ecosystem service value and land use carbon emissions of the ith evaluation unit. In order to analyze the spatial correlation between the various parts of the study area, the LISA cluster map is used for local spatial autocorrelation analysis. Local spatial correlation can be divided into five types: HH type, HL type, LH type, LL type and NN type. In general, when > 0, HH type/LL type indicates that the attribute values of the spatial unit are higher/lower than those of the surrounding areas, and the comprehensive spatial difference is small. When < 0, LH/HL type indicates that the spatial unit with lower/higher attribute value is higher/lower than that of the surrounding provinces, and the comprehensive spatial difference is large. The NN type shows no significant correlation.
2.3.4. Evaluation of Regional Land Sustainable Development Capacity
The four-quadrant model was originally based on the theory of supply and demand, and was used as a tool to analyze the changes in the real estate market. Later, it was gradually applied to other disciplines and fields [48,49,50]. In this study, a four-quadrant model was used to analyze the relationship between ecosystem service value intensity and land use carbon emission intensity, and based on this, the spatial and temporal differentiation characteristics of regional land sustainable development capacity were evaluated. The model takes the ecosystem service value intensity as the horizontal axis and the land use carbon emission intensity as the vertical axis to construct a four-quadrant model. The natural breakpoint method in ArcGIS is used to divide the ecosystem service value and land use carbon emissions into four intervals respectively. According to the relationship between the two, the sustainable development ability of the ecosystem is divided into four zones: high quality, good, general and poor [51] (Figure 2).
3. Results
3.1. Assessment of Ecosystem Service Value
According to the calculation, the economic value of the food production service function provided by the farmland ecosystem per unit area in the Loess Plateau is 926.86 yuan/hm2. Based on this, the table of ecosystem service value coefficient per unit area of different land use types in the Loess Plateau (Table 4) and the table of ecosystem service value per unit area from 2000 to 2020 (Table 5) were obtained. On the whole, in 2000, 2005, 2010, 2015 and 2020, the total value of ecosystem services in the Loess Plateau was 579.032 billion yuan, 582.005 billion yuan, 580.072 billion yuan, 579.466 billion yuan and 582.470 billion yuan, respectively. The total value showed a slow upward trend with an average annual growth rate of only 0.15%. From the perspective of land use types, the value of cropland, grassland and unutilized land decreased as a whole, while the value of forest and waters increased as a whole. Among them, forest and grassland are the main components of the total ecosystem service value. The sum of the ecosystem service values of the two land use types accounts for nearly 80% of the total value. Although the value coefficient of waters is the highest among the six land use types, its service value accounts for less than 15% because of its small area.
From the perspective of spatial pattern, the value of ecosystem services in the Loess Plateau has obvious spatial differences (Figure 3). The high ecosystem service value areas are mainly distributed in the western and southern parts of Inner Mongolia and the central and northern parts of Shaanxi Province. The land use types in these areas are mainly forest and grassland; The low ecosystem service value areas are mainly distributed in the central part of Shanxi Province, the western part of Shaanxi Province, and the Guanzhong Plain, Weihe River Basin and other surrounding areas in the central and southern parts of the study area. These areas are mainly used for construction land and cropland. The land use type is low, and the unit ecosystem service value is low. From the perspective of county scale, the proportion of ecosystem service value changes in different counties from 2000 to 2020 is quite different. Compared with 2000, in 2020, the ecosystem service value of 193 counties in the Loess Plateau has been improved to varying degrees. These counties are mainly distributed in the central, southeastern and northwestern parts of the study area; At the same time, the value of ecosystem services in 192 counties also decreased, especially in Erqi District of Zhengzhou City, Luoyang City, Xigong District and other counties in Henan Province. The value of ecosystem services decreased by more than 50% (Figure 4).
3.2. Analysis of Temporal and Spatial Variation of Land Use Carbon Emissions
According to the land use data and energy consumption data of the Loess Plateau from 2000 to 2020, the carbon emissions of different land use modes in each county of the Loess Plateau from 2000 to 2020 were calculated, and the total carbon emissions of the Loess Plateau were obtained by summing them (Table 6). From the perspective of total amount, the total carbon emissions in the Loess Plateau showed an increasing trend from 2000 to 2020, from 13714.39 × 104t in 2000 to 45844.48 × 104t in 2020, with an average annual growth rate of 6.20%. Among them, construction land is the main land use type that leads to the increase of carbon emissions in the Loess Plateau, increasing from 13516.86 × 104t to 45723.90 × 104t from 2000 to 2020; Compared with construction land, the total carbon emission of cropland is small and shows a downward trend with the decrease of its area. From 2000 to 2020, the carbon emission of cropland in the Loess Plateau decreased by 54.16 × 10⁴t; Forest is the main carbon sink in the Loess Plateau. The carbon absorption of forest increased from 598.30 × 10⁴t in 2000 to 620.75 × 10⁴t in 2020. However, due to the sharp increase of carbon emissions from construction land, the carbon emissions offset by forest carbon sink are less. In addition, grassland, waters and unutilized land have less carbon absorption.
From the perspective of spatial pattern, there are large spatial differences in land use carbon emissions in counties of the Loess Plateau (Figure 5). From 2000 to 2020, the annual average carbon emission of Lingwu City, Yinchuan City, Ningxia Hui Autonomous Region, with the largest annual average carbon emission, was 912.62 × 10⁴t, which was 10.89 times the average level of counties in the whole Loess Plateau. In addition, the 50 counties with the largest carbon emissions contributed 50.70% of the total carbon emissions of all counties in the study area. These counties are mainly distributed in the Hetao Plain and Guanzhong Plain in the northern and southeastern parts of the study area, and the carbon emissions of counties in the southwestern part of the Loess Plateau are relatively small. On the whole, the total amount of carbon emissions in the Loess Plateau shows a spatial pattern: Shanxi > Inner Mongolia > Shaanxi > Henan > Ningxia > Gansu > Qinghai.
3.3. Correlation Analysis Between Ecosystem Service Value and Land Use Carbon Emissions
The results of bivariate global spatial autocorrelation analysis of ecosystem service value and land use carbon emissions in the Loess Plateau showed that (Table 7), in each year from 2000 to 2020 was positive, and the P value was less than 0.05, which indicated that there was a positive correlation between ecosystem service value and land use carbon emissions in the Loess Plateau, showing the coexistence of ‘high emission-high value’. This is mainly due to the simultaneous advancement of ecological restoration policies and economic development. On the one hand, the large-scale Grain-for-Green Project has improved the ecosystem function; on the other hand, activities such as resource development and urban expansion have significantly increased carbon emissions. The spatial superposition of the two leads to the synergistic evolution of ecology and emissions in local areas showing a trend of increasing spatial correlation. At the same time, after a slight decline in 2005, Moran’s I increased and tended to be stable after 2010, indicating that the spatial correlation between the two gradually increased and the spatial distribution pattern tended to agglomerate.
The bivariate LISA diagram of ecosystem service value and land use carbon emissions in the Loess Plateau was drawn using GeoDa software (Figure 6). From the time point of view, in 2000, there were 17 high-high aggregation areas, 32 low-low aggregation areas, 10 low-high aggregation areas and 24 high-low aggregation areas in the study area. By 2020, there were 19 high-high aggregation areas, 33 low-low aggregation areas, 18 low-high aggregation areas and 22 high-low aggregation areas. The spatial distribution pattern of the significant correlation areas in the two decades was relatively stable. From the spatial point of view, the high-high gathering area is located in Fugu County, Hongsibao District, Pingluo County and other places in the transition zone between urban built-up area and mountain forest, and the Ordos Plateau in the northern part of the study area is relatively stable; The low-low aggregation area indicates that the ecosystem service value and carbon emissions in this part of the region are low. It is concentrated in the northern part of the Weihe River and the junction of Shaanxi and Shanxi provinces in the central part of the study area, and is scattered in Linxia County and Gangu County of Gansu Province, Gonghe County and Guinan County of Qinghai Province. The land use types in these areas are mainly cropland and grassland, while the construction land and forest account for a relatively small proportion; The low-high aggregation area represents the area with low ecosystem service value and large carbon emissions. It is scattered in the study area, mainly distributed in the central urban areas of large and medium-sized cities such as Baotou City, Datong City and Ordos City. The proportion of construction land in these areas is absolutely dominant, and the proportion of other types of land is relatively small, resulting in low value of ecosystem services. At the same time, due to the high concentration of population and industry, energy consumption is intensive, and carbon emissions are significantly higher; The high and low gathering areas are mainly distributed in the southern and western parts of the study area. The land use types in these areas are mainly forest and grassland, and the construction land is scattered.
3.4. Evaluation of Ecosystem Sustainable Development Ability Based on Four Quadrant Model
Based on the four-quadrant model, the sustainable development capacity of the ecosystem in each county of the Loess Plateau in 2000 and 2020 was evaluated (Figure 7). The number and area of counties in the third quadrant of the study area are the largest. In 2000 and 2020, the number of counties in the third quadrant is 291 and 285 respectively, and the total area is 48.71 × 10⁴km2 and 48.11 × 10⁴km2 respectively, indicating that the sustainable development ability of the ecosystem in most areas is general and the progress space is large; In addition, in 2000 and 2020, the number of counties in the first quadrant increased from 1 to 3, and the area increased from 0.75 km2 to 4.99 km2, with an increase of 4.24 km2; The number of counties with high quality (fourth quadrant) of ecosystem sustainable development capacity changed from 93 in 2000 to 92 in 2020, but the area increased by 0.59 × 10⁴ km2. The number of counties with poor ecosystem sustainable development capacity reached 5 in 2020, with a total area of 54.72 km2. From the perspective of spatial distribution pattern, the high-quality and good areas of ecosystem sustainable development ability are mainly distributed in counties with forest and grassland as the main land use types, while the general and poor areas of ecosystem sustainable development ability are mostly concentrated in cropland and areas with a high proportion of construction land in river valley plain.
In order to further explore the changing trend of the sustainable development capacity of the Loess Plateau ecosystem, this study divides the changes into five levels based on the changes in the quadrants of each county in 2000 and 2020: significant improvement, improvement, no change, decline and significant decline (Figure 8). From 2000 to 2020, there were 8, 0 and 363 counties with significant improvement, improvement and no change, respectively, accounting for 99.53% of the total, indicating that the ecological quality was relatively stable during this period; However, there are also 14 counties with decreased ecosystem sustainability. Among them, Huimin District, Kundulun District and Kangbashi District of Inner Mongolia Autonomous Region, Dengfeng City and Hubin District of Henan Province, Dongxiang Autonomous County of Gansu Province, and Jinyuan District of Shanxi Province are the administrative units with significant decline in the sustainable development capacity of the ecosystem in the study area. Relevant measures need to be taken to reduce carbon emissions and optimize ecological quality.
4. Discussion
In this study, the temporal and spatial variation characteristics of ecosystem service value and land use carbon emissions in the Loess Plateau and the relationship between them were analyzed. From 2000 to 2020, the net carbon emissions of the Loess Plateau showed a rapid growth trend, and the sharp increase in carbon emissions from construction land was the dominant factor in the change of land use carbon emissions. This is consistent with the research results of Zhao Wenting et al.using Shanxi Province as the research area [52] and Li Yuling et al. using Shaanxi Province as the research area [41]. Since the 21 st century, with the acceleration of industrialization and urbanization in China, the level of carbon emissions in the Loess Plateau has continued to rise. Shanxi, Shaanxi and Inner Mongolia are the concentrated distribution areas of coal resources. The process of coal mining and utilization contributes about 60% ~ 70% of the total carbon emissions [53,54]. Different from the rapid increase of carbon emissions, the total value of ecosystem services in the Loess Plateau changed little from 2000 to 2020, but its spatial distribution pattern changed greatly. On the one hand, among the six land use types selected in this study, the ecosystem service value coefficient of forest and waters is the highest. Thanks to the promotion of a series of ecological greening projects and the continuous ecological management of the Yellow River Basin, the area of forest in the Loess Plateau increased from 8.48 × 10⁴km2 in 2000 to 9.82 × 10⁴km2 in 2020, an increase of 15.86%, and the area of waters increased from 1.02 × 10⁴km2 to 1.96 × 10⁴km2. The area has nearly doubled in the past 20 years. These increases mainly occur in the counties with mountainous and hilly terrain in the central and eastern parts of the study area. The ecosystem service value of most counties in this region has also been increased to a certain extent; On the other hand, after 2000, the Loess Plateau has entered a period of rapid development of urbanization. In the past 20 years, the area of construction land has increased by 92.25%, and it mainly occurs in the Wei River Valley in the southeast of the Loess Plateau-Fen River Valley and the Hetao Plain in the northwest. These areas are densely populated, food demand and energy consumption are large, human activities have a greater impact on the ecological environment, and the counties with general and poor ecosystem sustainable development capabilities are mostly distributed in these areas. For the counties with low ecosystem service value and large carbon emissions in the Loess Plateau, we should focus on strengthening ecological restoration and environmental governance, optimizing industrial structure, improving land use efficiency, and promoting the transformation of the energy system to low-carbon, so as to achieve the dual goals of regional ecological function improvement and carbon emission control.
Land use change is a key factor affecting the evolution of ecosystem structure and function. Although a large number of studies have focused on this issue at home and abroad, most of the previous studies started from independent administrative units, and the systematic discussion on the relationship between ecosystem service value and land use carbon emissions was relatively limited. Compared with the existing research, the innovation of this paper is mainly reflected in the following two aspects: First, this study selects the Loess Plateau as the research object. On the one hand, the region has complex terrain, vertical and horizontal gullies, and is located in the transition zone from coastal to inland. The spatial heterogeneity of natural geographical conditions is large, and it is suitable to explore the spatial and temporal differentiation characteristics of ecosystem service value and land use carbon emissions at the county scale. On the other hand, the Loess Plateau has experienced rapid urbanization since the 21st century, and the land use pattern has evolved significantly. It is urgent to explore its impact mechanism on the ecosystem and carbon emissions, so as to provide theoretical support for ecological protection and low-carbon policy formulation. Secondly, this study systematically discusses the spatial and temporal differentiation characteristics of ecosystem service value and carbon emission and their correlation, and constructs an evaluation method of sustainable development ability of ecosystem at county scale, in order to improve the scientific and overall planning of ecological environment protection and carbon emission reduction policy formulation.
At the same time, this study still has some limitations. First of all, this study uses the value equivalent factor method to estimate the ecosystem service value of different land use types in the Loess Plateau, and revises the equivalent factor table according to the actual situation of the Loess Plateau. However, the natural ecosystem types are far more complex and diverse than the six land use types selected in the study, and the estimation results may have certain errors. Secondly, when calculating the carbon emissions of land use at the county level, due to the limitation of data collection, this study refers to the practice of Liu Chang et al. [55]. Based on the data of the seventh national census, the top-down distribution of carbon emissions in each province may ignore the differences in carbon emissions caused by differences in industrial structure, residents’ consumption habits and income levels. The standard coal conversion coefficient and carbon emission coefficient of various energy sources refer to the 2006 IPCC Guidelines for National Greenhouse Gas Inventories, which may not be fully applicable to this study area. Developing an accurate carbon emission estimation model based on the region is a direction that can be deepened in the future.
5. Conclusions
(1) From 2000 to 2020, the total value of ecosystem services in the Loess Plateau showed a gradual growth trend, from 579.032 billion yuan in 2000 to 582.470 billion yuan in 2020. The overall growth level was low, with an overall increase of only 0.15%. The high ecosystem service value areas are mainly distributed in the western and southern parts of Inner Mongolia, the central and northern parts of Shaanxi Province, and the low ecosystem service value areas are mainly distributed in the central part of Shanxi Province, the western part of Shaanxi Province, and the Guanzhong Plain, Weihe River Basin and other surrounding areas in the central and southern parts of the study area.
(2) From 2000 to 2020, the net carbon emissions and carbon emission intensity of counties in the Loess Plateau showed a rapid growth trend. The increase of carbon emissions from construction land caused by energy consumption is the main reason for the rapid growth of carbon emissions from land use, which is closely related to economic and social development. In addition, there are large spatial differences in land use carbon emissions, and the 50 counties with the largest carbon emissions contribute 50.70% of the total carbon emissions.
(3) There is a certain positive correlation between the value of ecosystem services and land use carbon emissions in the Loess Plateau, but the bivariate global Moran’s I shows an overall upward trend, showing that the spatial distribution tends to agglomerate. The results of bivariate LISA analysis show that the regional spatial distribution pattern with significant correlation in the Loess Plateau from 2000 to 2020 is relatively stable, and the spatial distribution is closely related to land use types.
(4) The ecosystem service value intensity and land use carbon emission intensity in the Loess Plateau are generally coordinated and stable over time. Most counties are located in the general area of ecosystem sustainable development capacity, indicating that there is a large space for the improvement of ecosystem sustainable development capacity. A small number of counties are located in high-quality areas, and the counties with good and poor sustainable development capacity of ecosystems are the least.
Author Contributions
Conceptualization, Y.Y. and H.W.; data curation, Y.Y.; formal analysis, Y.Y.; funding acquisition, H.W.; investigation, H.W.; methodology, Y.Y. and C.G.; project administration, H.W. and J.W.; resources, H.W. and J.W.; software, Y.Y.; supervision, H.W. and J.W.; validation, Y.Y. and C.G.; visualization, Y.Y. and C.G.; writing - original draft preparation, Y.Y. and C.G. writing - -review and editing, H.W. and Y.G.;
Funding
This research was funded by the Philosophy and Social Science Program of Inner Mongolia Autonomous Region Natural Science Foundation Project 2025LHMS04020.
Data Availability Statement
Data are contained within the article.
Acknowledgments
The authors sincerely thank the support of the funding, and are also deeply grateful to the editors and reviewers for their critical comments, which greatly improved the quality of this manuscript.
Conflicts of Interest
The authors declare no conflicts of interest.
References
- Costanza, R.; d’Arge, R.; de Groot, R.; etc. The value of the world’s ecosystem services and natural capital. Nature. 1997, 387, 253-260. [CrossRef]
- Assessment, M.E.; Ecosystems and human well-being: synthesis. 2005: Ecosystems and Human Well Being Synthesis.
- Wang, H.L.; Gao, Y.N.; Wang, Z.Y.; etc. Urban ecological management division based on ecosystem services: a case study of Shenzhen City. Acta Ecologica Sinica. 2020, 40, 8504-8515. (In Chinese)
- Wu, J.S.; Wang, Y.L.; Zhang, X.F.; etc. Application of landscape ecology in territory optimization. Journal of Natural Resources. 2020, 35, 14-25. (In Chinese)
- Grimm, Nancy B.; Faeth, Stanley H.; Golubiewski, Nancy E.; etc. Global change and the ecology of cities. Science. 2008, 319, 756-760. [CrossRef]
- Tian, S.Q.; Wang, S.J.; Bai, X.Y.; etc. Global patterns and changes of carbon emissions from land use during 1992–2015. Environmental Science and Ecotechnology. 2021, 7, 17-28. [CrossRef]
- Li, L.H.; Zhang, Y.; Zhou, T.J.; etc. Mitigation of China’s carbon neutrality to global warming. Nature Communications. 2022, 13, 5315. [CrossRef]
- Broadstock, David.; Ji, Q.; Managi, Shunsuke.; etc. Pathways to carbon neutrality: Challenges and opportunities. Resources Conservation and Recycling. 2021, 169, 105472. [CrossRef]
- Yu, B.Y.; Zhao, G.P.; An, R.Y.; etc. Research on China’ s CO2 Emission Pathway under Carbon Neutral Target. Journal of Beijing Institute of Technology (Social Sciences Edition). 2021, 23, 17-24. (In Chinese)
- Fu, B.J.; Zhang, L.W. Land-use change and ecosystem services: concepts, methods and progress. Progress in Geography. 2014, 33, 441-446. (In Chinese)
- Ostle, N.J.; Levy, P.E.; Evans, C.D.; etc. UK land use and soil carbon sequestration. Land Use Policy. 2009, 26, S274-S283. [CrossRef]
- Sun, H.; Liang, H.M.; Chang, X.L.; etc. Land Use Patterns on Carbon Emission and Spatial Association in China. Economic Geography. 2015, 35, 154-162. (In Chinese)
- Meng, L.T.; Sun, Y.; Zhao, S.Q. Comparing the spatial and temporal dynamics of urban expansion in Guangzhou and Shenzhen from 1975 to 2015: A case study of pioneer cities in China’s rapid urbanization. Land Use Policy. 2020, 97, 104753. [CrossRef]
- Bai, Y.; Wong, Christina P.; Jiang, Bo.; etc. Developing China’s Ecological Redline Policy using ecosystem services assessments for land use planning. Nature Communications. 2018, 9, 3034. [CrossRef]
- Zhou, Y.; Chen, M.X.; Tang, Z.P.; etc. Urbanization, land use change, and carbon emissions: Quantitative assessments for city-level carbon emissions in Beijing-Tianjin-Hebei region. Sustainable Cities and Society. 2021, 66, 102701. [CrossRef]
- Ke, N.; Lu, X.H.; Kuang, B.; etc. Regional disparities and evolution trend of city-level carbon emission intensity in China. Sustainable Cities and Society. 2023, 88, 104288. [CrossRef]
- Ke, N.; Lu, X.H.; Zhang, X.P.; etc. Urban land use carbon emission intensity in China under the "double carbon" targets: spatiotemporal patterns and evolution trend. Environmental Science and Pollution Research. 2023, 30, 18213-18226. [CrossRef]
- Ma, X.Z.; Wang, Z. Progress in the study on the impact of land-use change on regional carbon sources and sinks. Acta Ecologica Sinica. 2015, 35, 5898-5907. (In Chinese)
- Wang, D.; Jing, Y.D.; Han, S.M.; etc. Spatio-temporal relationship of land-use carbon emission and ecosystem servicevalue in Nansi Lake Basin based upon a grid square. Acta Ecologica Sinica. 2022, 42, 9604-9614. (In Chinese)
- Peng, J.; Hu, X.X.; Zhao, M.Y.; etc. Research progress on ecosystem service trade-offs: From cognition to decision-making. Acta Geographica Sinica. 2017, 72, 960-973. (In Chinese)
- Suwarno, Aritta.; Hein, Lars.; Weikard, Hans-Peter.; etc. Land-use trade-offs in the Kapuas peat forest, Central Kalimantan, Indonesia. Land Use Policy. 2018, 75, 340-351. [CrossRef]
- Zhao, Y.; Yang, H.; Zhu, C.; etc. Spatial and Temporal Distribution of the Ecosystem Provisioning Service and Its Correlation with Food Production in the Songhua River Basin, Northeastern China. Land. 2024, 13, 451. [CrossRef]
- Qi, Y.; Zhang, P.; Liu, L.; etc. Multi-scenario optimization of land use structure and prediction of ecosystem service value in Guanzhong Plain urban agglomeration. The journal of applied ecology. 2023, 34, 2507-2517. [CrossRef]
- de Groot, R.; Brander L.; van der Ploeg S.; etc. Globalestimates of the value of ecosystems and their services inmonetary units. Ecosystem Services. 2012, 1, 50-61. (In Chinese)
- Yang, S.; Zheng, X.Z. Spatio-temporal relationshipbetween carbon emission and ecosystem service valueunder land use change: a case study of the GuanzhongPlain urban agglomeration, China. Frontiers in Environmental Science. 2023, 11, 1241781.
- Lin, Q.W.; Zhang, L.; Qiu, B.K.; etc. Spatiotemporal Analysis of Land Use Patterns on Carbon Emissions in China. Land. 2021, 10, 141. [CrossRef]
- Sun, W.; Huang, C.C. How does urbanization affect carbon emission efficiency? Evidence from China. Journal of Cleaner Production. 2020, 272, 122828. [CrossRef]
- Xie, G.D.; Zhang, C.X.; Zhang, C.S. The value of ecosystem services in China. Resources Science. 2015, 37, 1740-1746. (In Chinese)
- Yuan, Y.; Chuai, X.W.; Xiang, C.Z.; etc. Carbon emissions from land use in Jiangsu, China, and analysis of the regional interactions. Environmental Science and Pollution Research. 2022, 29, 44523-44539. (In Chinese)
- Zhang, Z.P.; Xia, F.Q.; Yang, D.G.; etc. Spatiotemporal characteristics in ecosystem service value and its interaction with human activities in Xinjiang, China. Ecological Indicators. 2020, 110, 105826. [CrossRef]
- Wei, J.F.; Xia, L.L.; Chen, L.; etc. A network-based framework for characterizing urban carbon metabolism associated with land use changes: A case of Beijing city, China. Journal of Cleaner Production. 2022, 371, 133695. [CrossRef]
- Liu, L.C.; Liu, C.F.; Wang, C.; etc. Supply and demand matching of ecosystem servicesin loess hilly region: A case study of Lanzhou. Acta Geographica Sinica. 2019, 74, 1921-1937. (In Chinese)
- Li, C.L.; Li, Y.Q.; Shi, K.F.; etc. A Multiscale Evaluation of the Coupling Relationship between Urban Land and Carbon Emissions: A Case Study of Chongqing, China. International Journal of Environmental Research and Public Health. 2020, 17, 3416. [CrossRef]
- Yang, Z.; Zhan, J.Y.; Wang, C.; etc. Coupling coordination analysis and spatiotemporal heterogeneity between sustainable development and ecosystem services in Shanxi Province, China. Science of The Total Environment. 2022, 836, 155625. [CrossRef]
- Hu, C.H.; Zhang, Z.H. Discussing of the critical threshold of equilibrium sediment transport in the Yellow River andthe degree of soil erosion control in the Loess Plateau. Shuili Xuebao. 2020, 51, 1015-1025. (In Chinese)
- Wang, D.; Liang, Y.J.; Peng, S.Z.; etc. Integrated assessment of the supply–demand relationship of ecosystem services in the Loess Plateau during 1992–2015. Ecosystem Health and Sustainability. 2022, 8, 200-213. [CrossRef]
- Su, Y.L.; Zhang, Y.F. Study on Effects of Carbon Emission by Land Use Patterns of Shaanxi Province. Journal of Soil and Water Conservation. 2011, 25, 152-156. (In Chinese)
- Xie, G.D.; Zhang, C.X.; Zhang, L.M.; etc. Improvement of the Evaluation Method for Ecosystem ServiceValue Based on Per Unit Area. Journal of Natural Resources. 2015, 30, 1243-1254. (In Chinese)
- Wu, J.S.; Huang, Q.; Cao, Q.W. Effects of basic ecological control line policy on ecosystem services value in Shenzhen. Acta Ecologica Sinica. 2018, 38, 3756-3765. (In Chinese)
- Xie, G.D.; Lu, C.X.; Leng, Y.F. Ecological assets valuation of the Tibetan Plateau. Journal of Natural Resources. 2003, 18, 189-196. (In Chinese)
- Li, Y.L.; Li, S.P.; Qi, J.J. Influencing Factors on Carbon Emissions of Land Uses and Analysis of Their Decoupling Effects in Shaanxi Province. Research of Soil and Water Conservation. 2018, 25, 382-390. (In Chinese)
- Wu, A.B.; Zhao, Y.X.; Guo, X.P.; etc. Spatio-temporal Differentiation of Carbon Emissions in the Beijing-Tianjin-Hebei Region Based on Land Use and Nighttime Light Data. Geography and Geo-Information Science. 2022, 38, 36-42. (In Chinese)
- Li, Y.; Huang, X.J.; Zhen, F. Effects of land use patterns on carbon emission in Jiangsu Province. Transactions of the CSAE. 2008, 24, 102-107. (In Chinese)
- Zhao, X.C.; Zhu, X.; Zhou, Y.Y. Effects of land uses on carbon emissions and their spatial-temporal patterns in Hunan Province. Acta Scientiae Circumstantiae. 2013, 33, 941-949. (In Chinese)
- Wang, L. Research for decomposition results of impact factors about carbon emission by land use patterns in Yancheng City. Ecological Science. 2015, 34, 122−128. (In Chinese)
- Fang, J.Y.; Guo, Z.D.; Pu, S.L.; etc. Estimation of carbon sequestration in terrestrial vegetation in China from 1981 to 2000. Science in China Press. 2007, 37, 804-812. (In Chinese)
- Chen, D.L.; Lu, X.H.; Liu, X.; etc. Measurement of the eco-environmental effects of urban sprawl: Theoretical mechanism and spatiotemporal differentiation. Ecological Indicators. 2019, 105, 6-15. [CrossRef]
- Juan, Z. Mu, X.M.; Wang, F.; etc. Using four-quadrant model to discuss water resource value theory. Research of Soil and Water Conservation. 2008, 15, 134-136. (In Chinese)
- Ma, S.C.; Xie, F.F.; Ding, C.; etc. Spatio-temporal change of landscape ecological quality and influencing factors based on four-quadrant model in overlapped area of cropland and coal production. Transactions of the CSAE. 2020, 36, 259-268. (In Chinese)
- Wang, R.T.; Tang, X.Y.; Liu, Z.Y.; etc. Study on the impact of COVID-19 on the homestay industry —— Based on the four-quadrant model. China Market. 2021, 08, 59-62. (In Chinese)
- Sun, Y.X.; Liu, S.L.; Shi, F.N.; etc. Spatio-temporal variations and coupling of human activity intensity and ecosystem services based on the four-quadrant model on the Qinghai-Tibet Plateau. Science of The Total Environment. 2020, 743, 140721.
- Zhao, W.T.; Luo, S.Z.; Yuan, X.H.; etc. Spatiotemporal pattern and influencing factors of carbon emissions at county level in Shanxi Province. Environmental Science &Technology. 2022, 45, 226-236. (In Chinese)
- Ren, S.H.; Xie, Y.C.; Jiao, X.M.; etc. Characteristics of Carbon Emissions During Coal Development and Technical Approaches for Carbon Neutral Development. Advanced Engineering Sciences. 2022, 54, 60-68. (In Chinese)
- Liu, J.L.; Wang, K.; Zou, J.; etc. The implications of coal consumption in the power sector for China’s CO2 peaking target. Applied Energy. 2019, 253, 113518. [CrossRef]
- Liu, C.; Sun, Y.; Li, L.L. The estimation and spatial distribution of the carbon emissions of county units in China. Environmental Pollution & Control. 2020, 42, 113-119. (In Chinese)
Figure 1.
Figure 1. Study area.
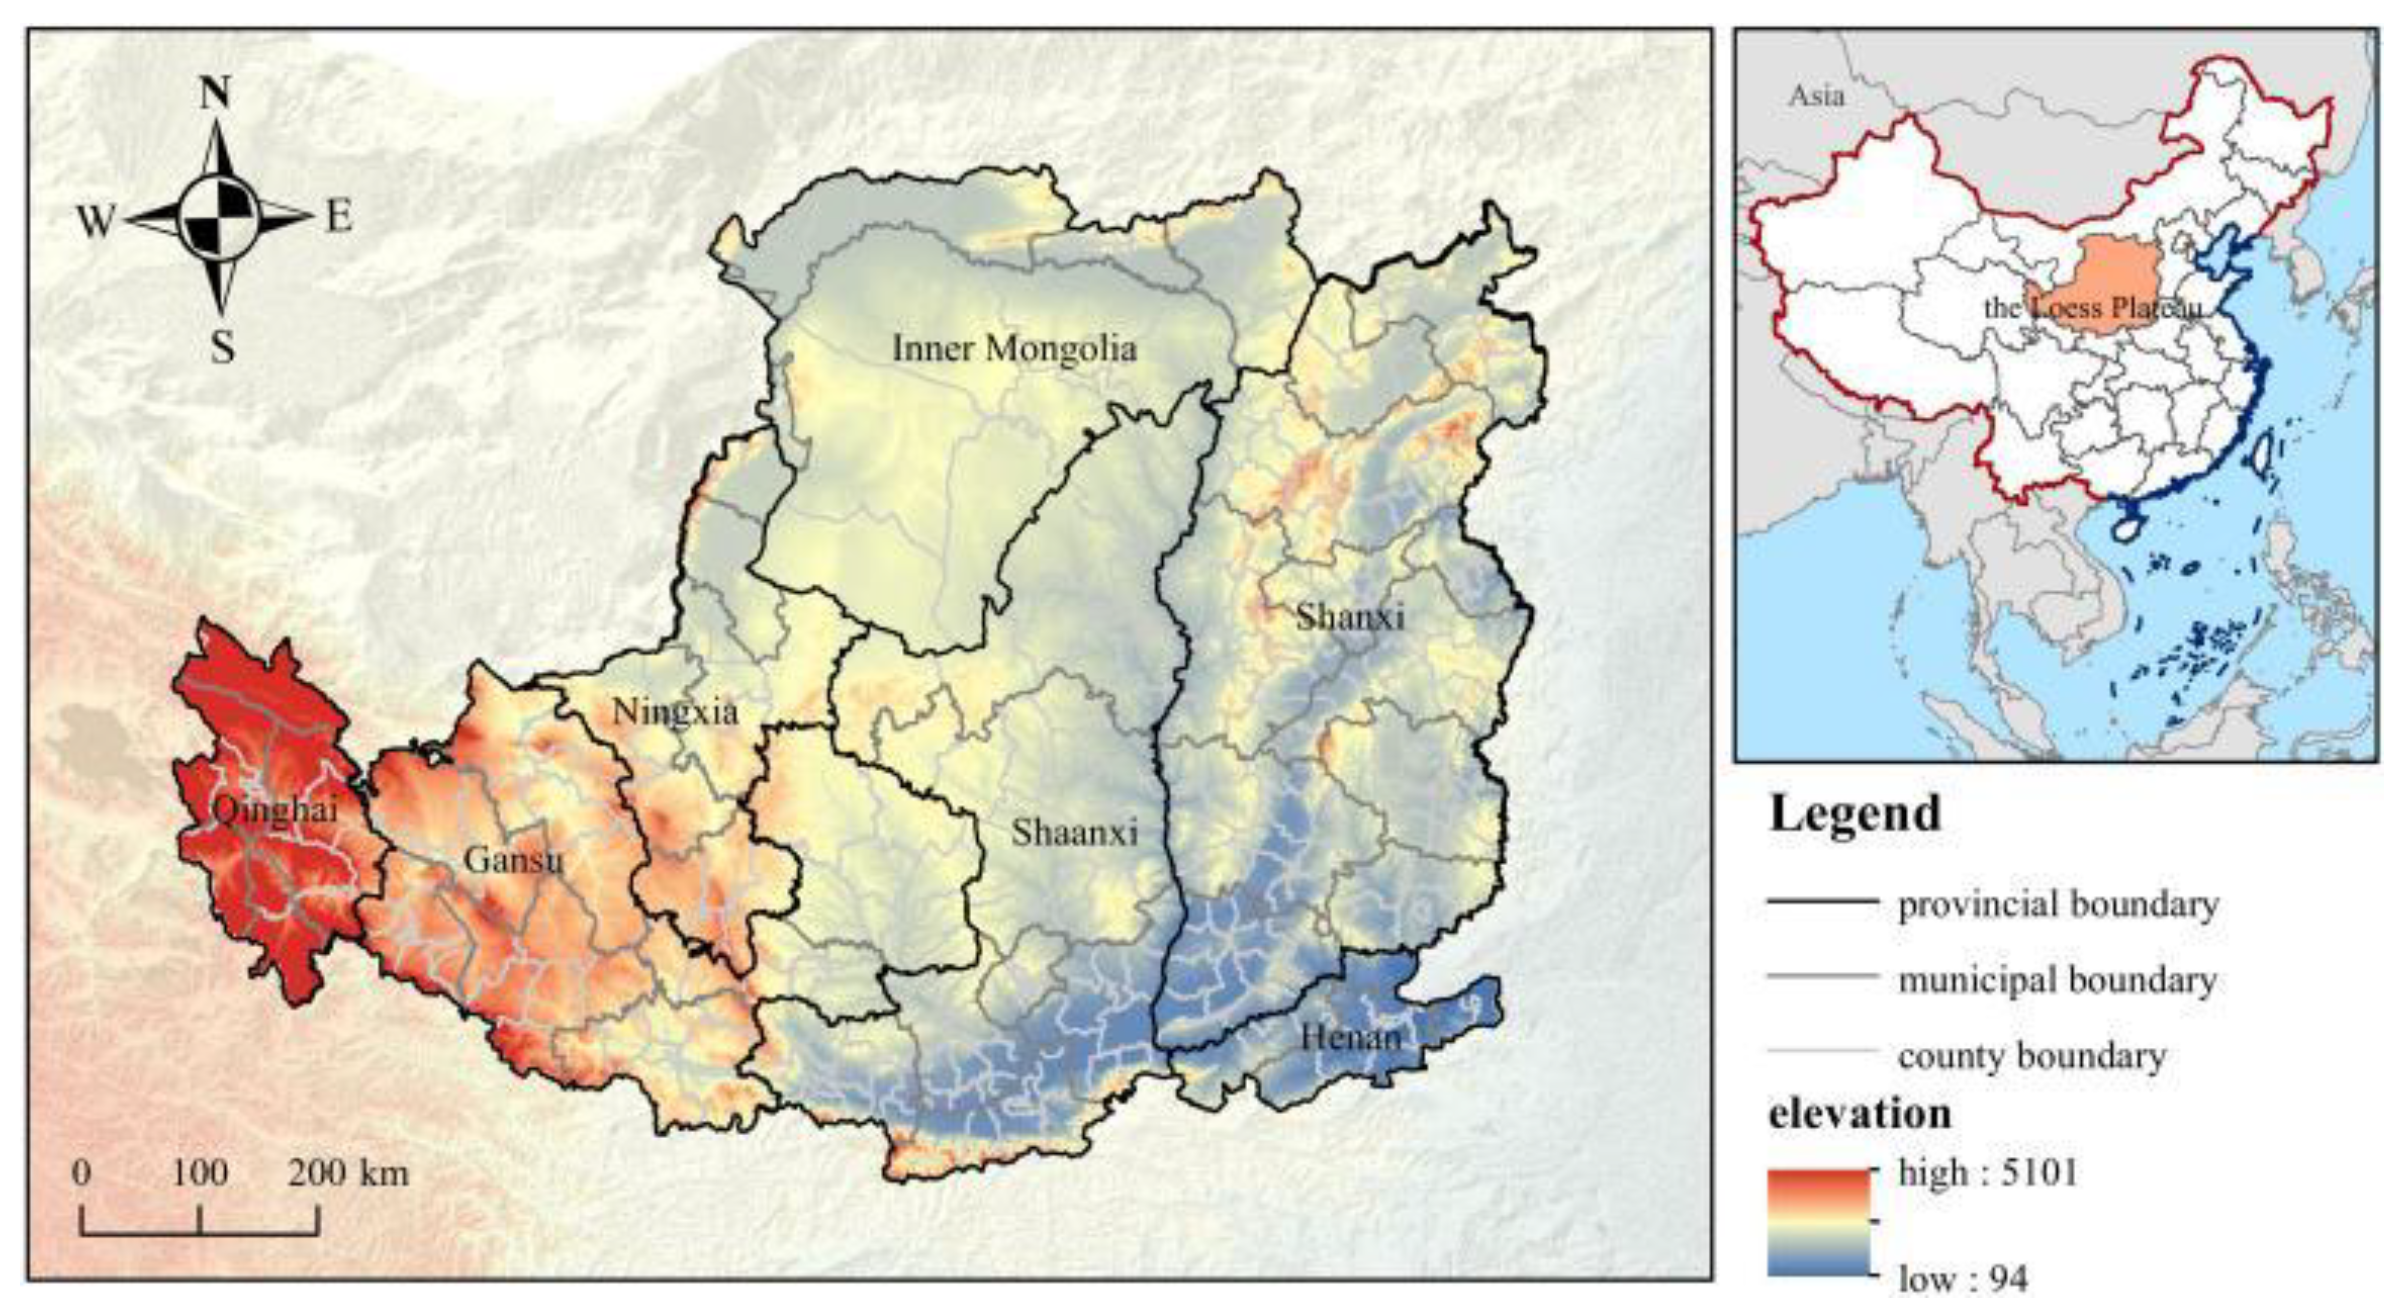
Figure 2.
Four-quadrant model of regional land sustainable development capacity.
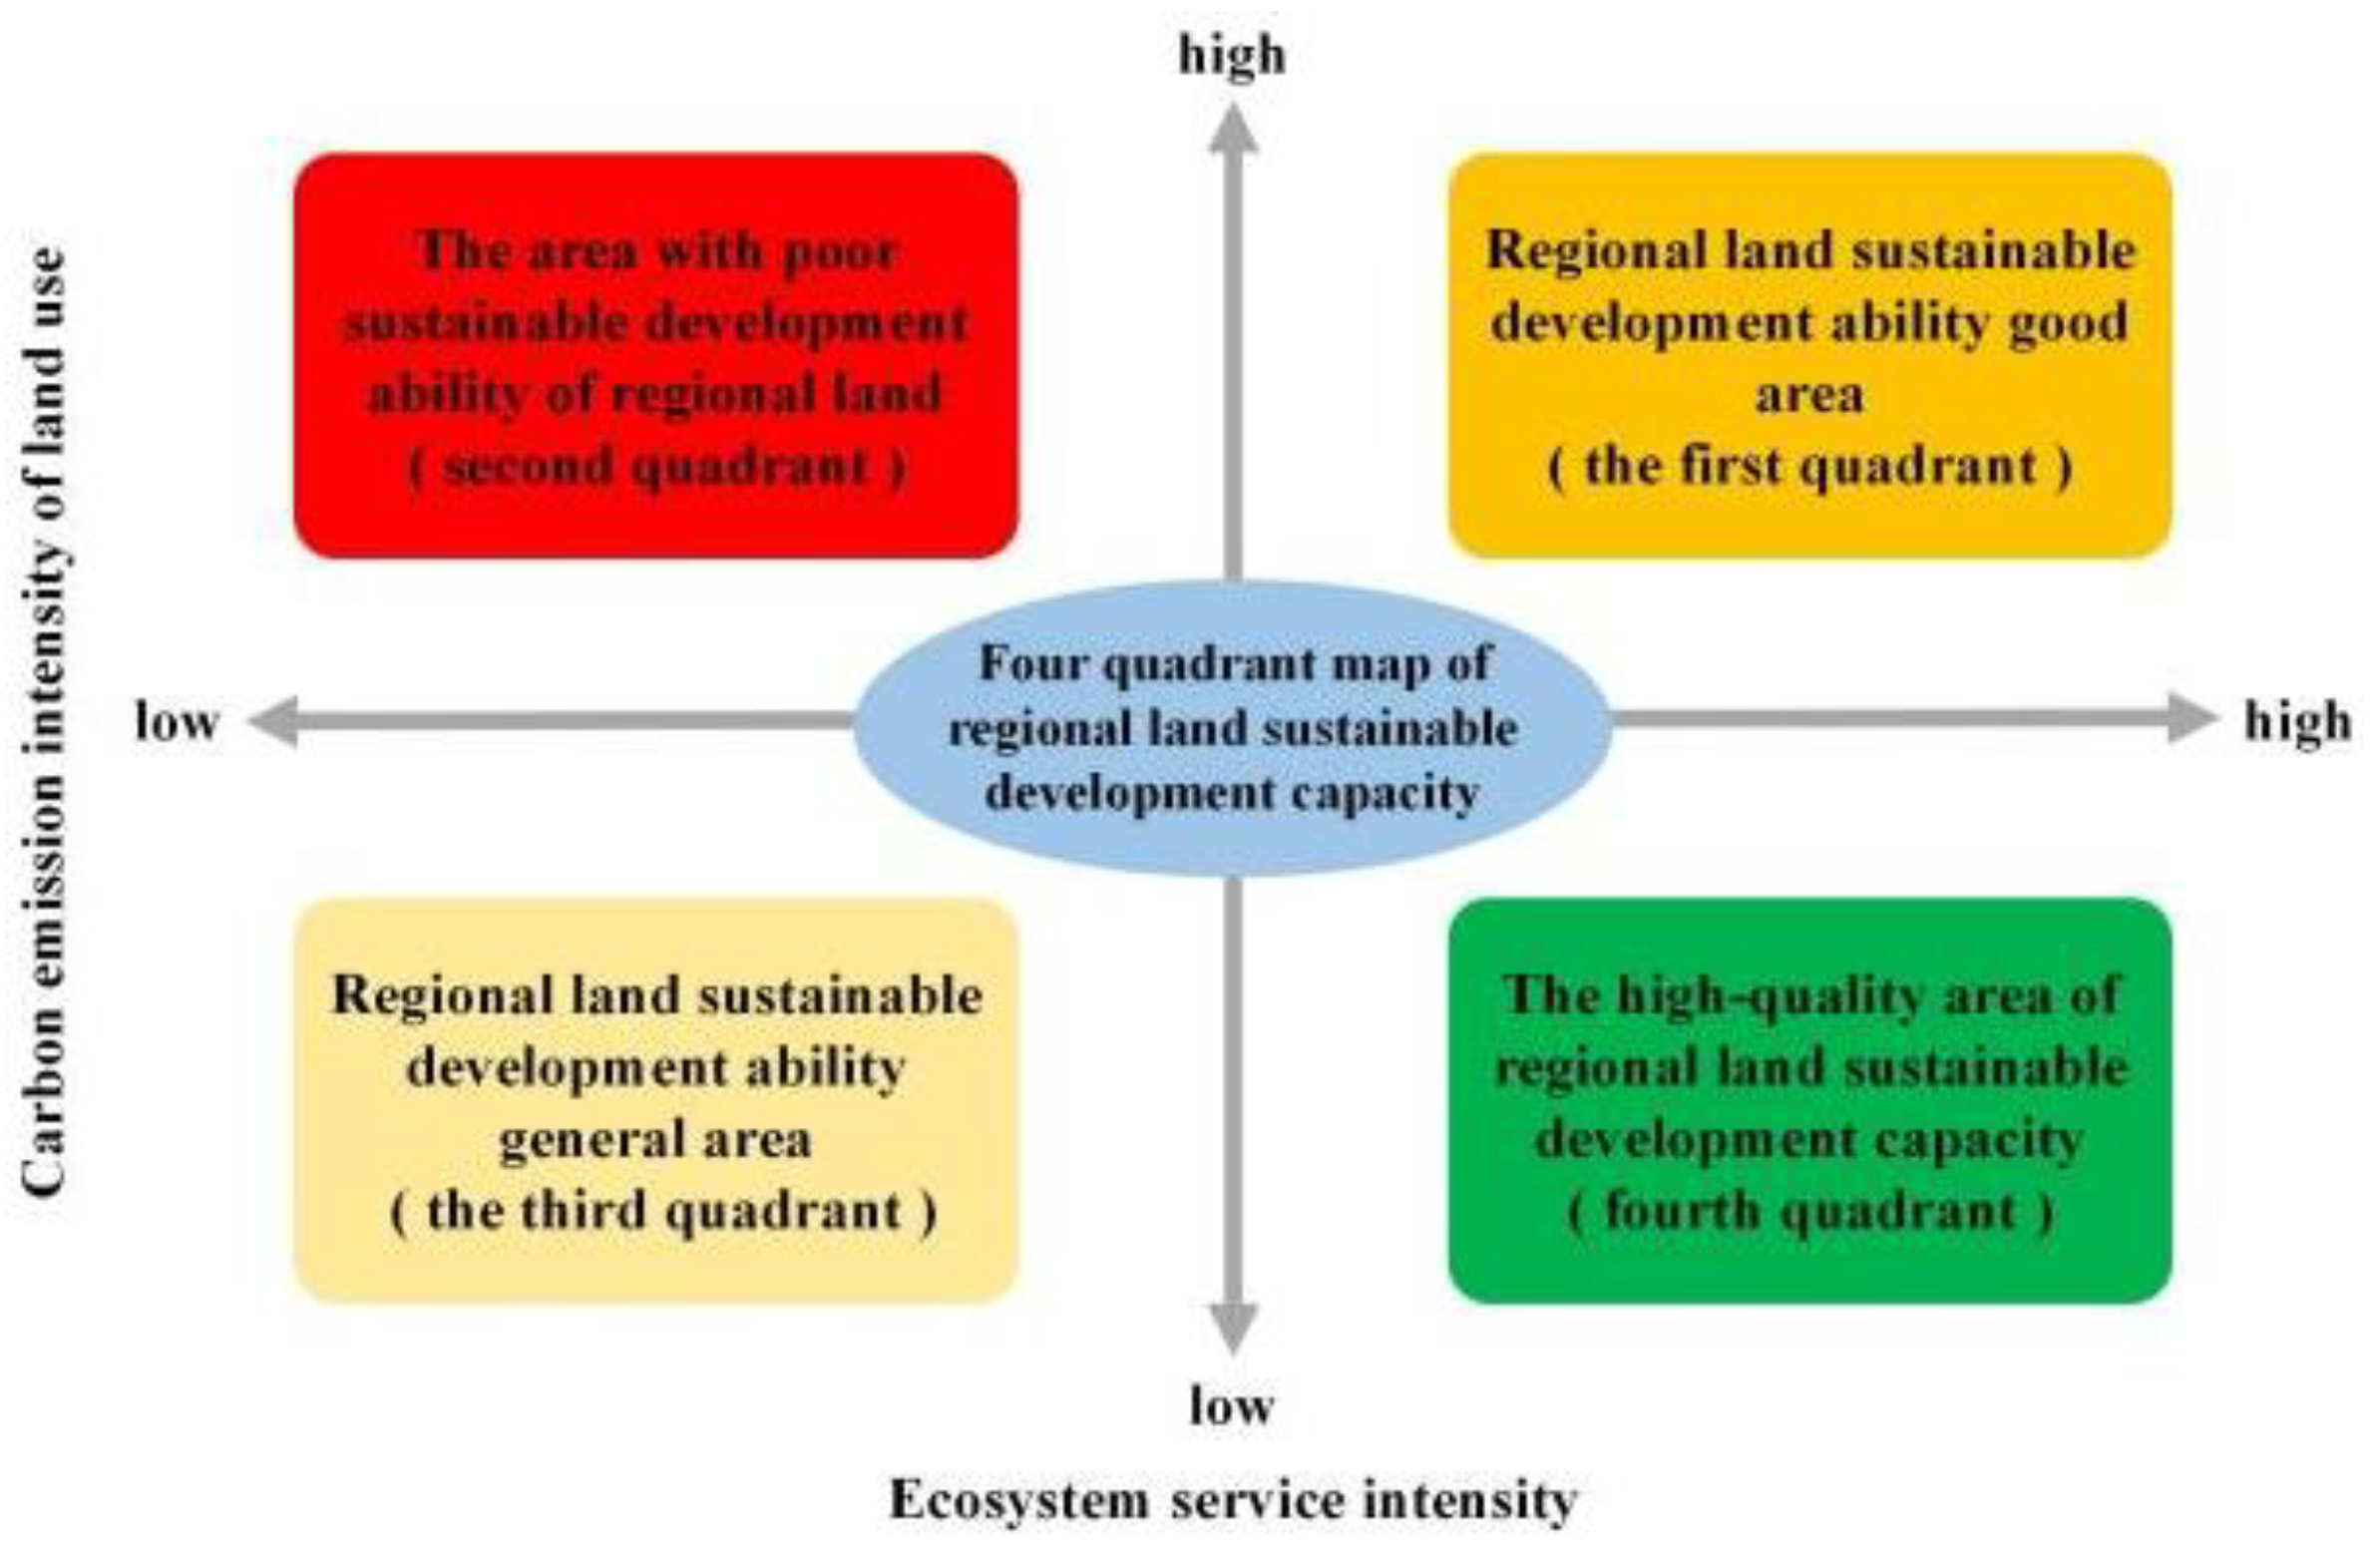
Figure 3.
Spatial pattern change of ecosystem service value in the Loess Plateau from 2000 to 2020: (a) Spatial pattern of ecosystem service value in 2000; (b) Spatial pattern of ecosystem service value in 2005; (c) Spatial pattern of ecosystem service value in 2010; (d) Spatial pattern of ecosystem service value in 2015; (e) Spatial pattern of ecosystem service value in 2020.
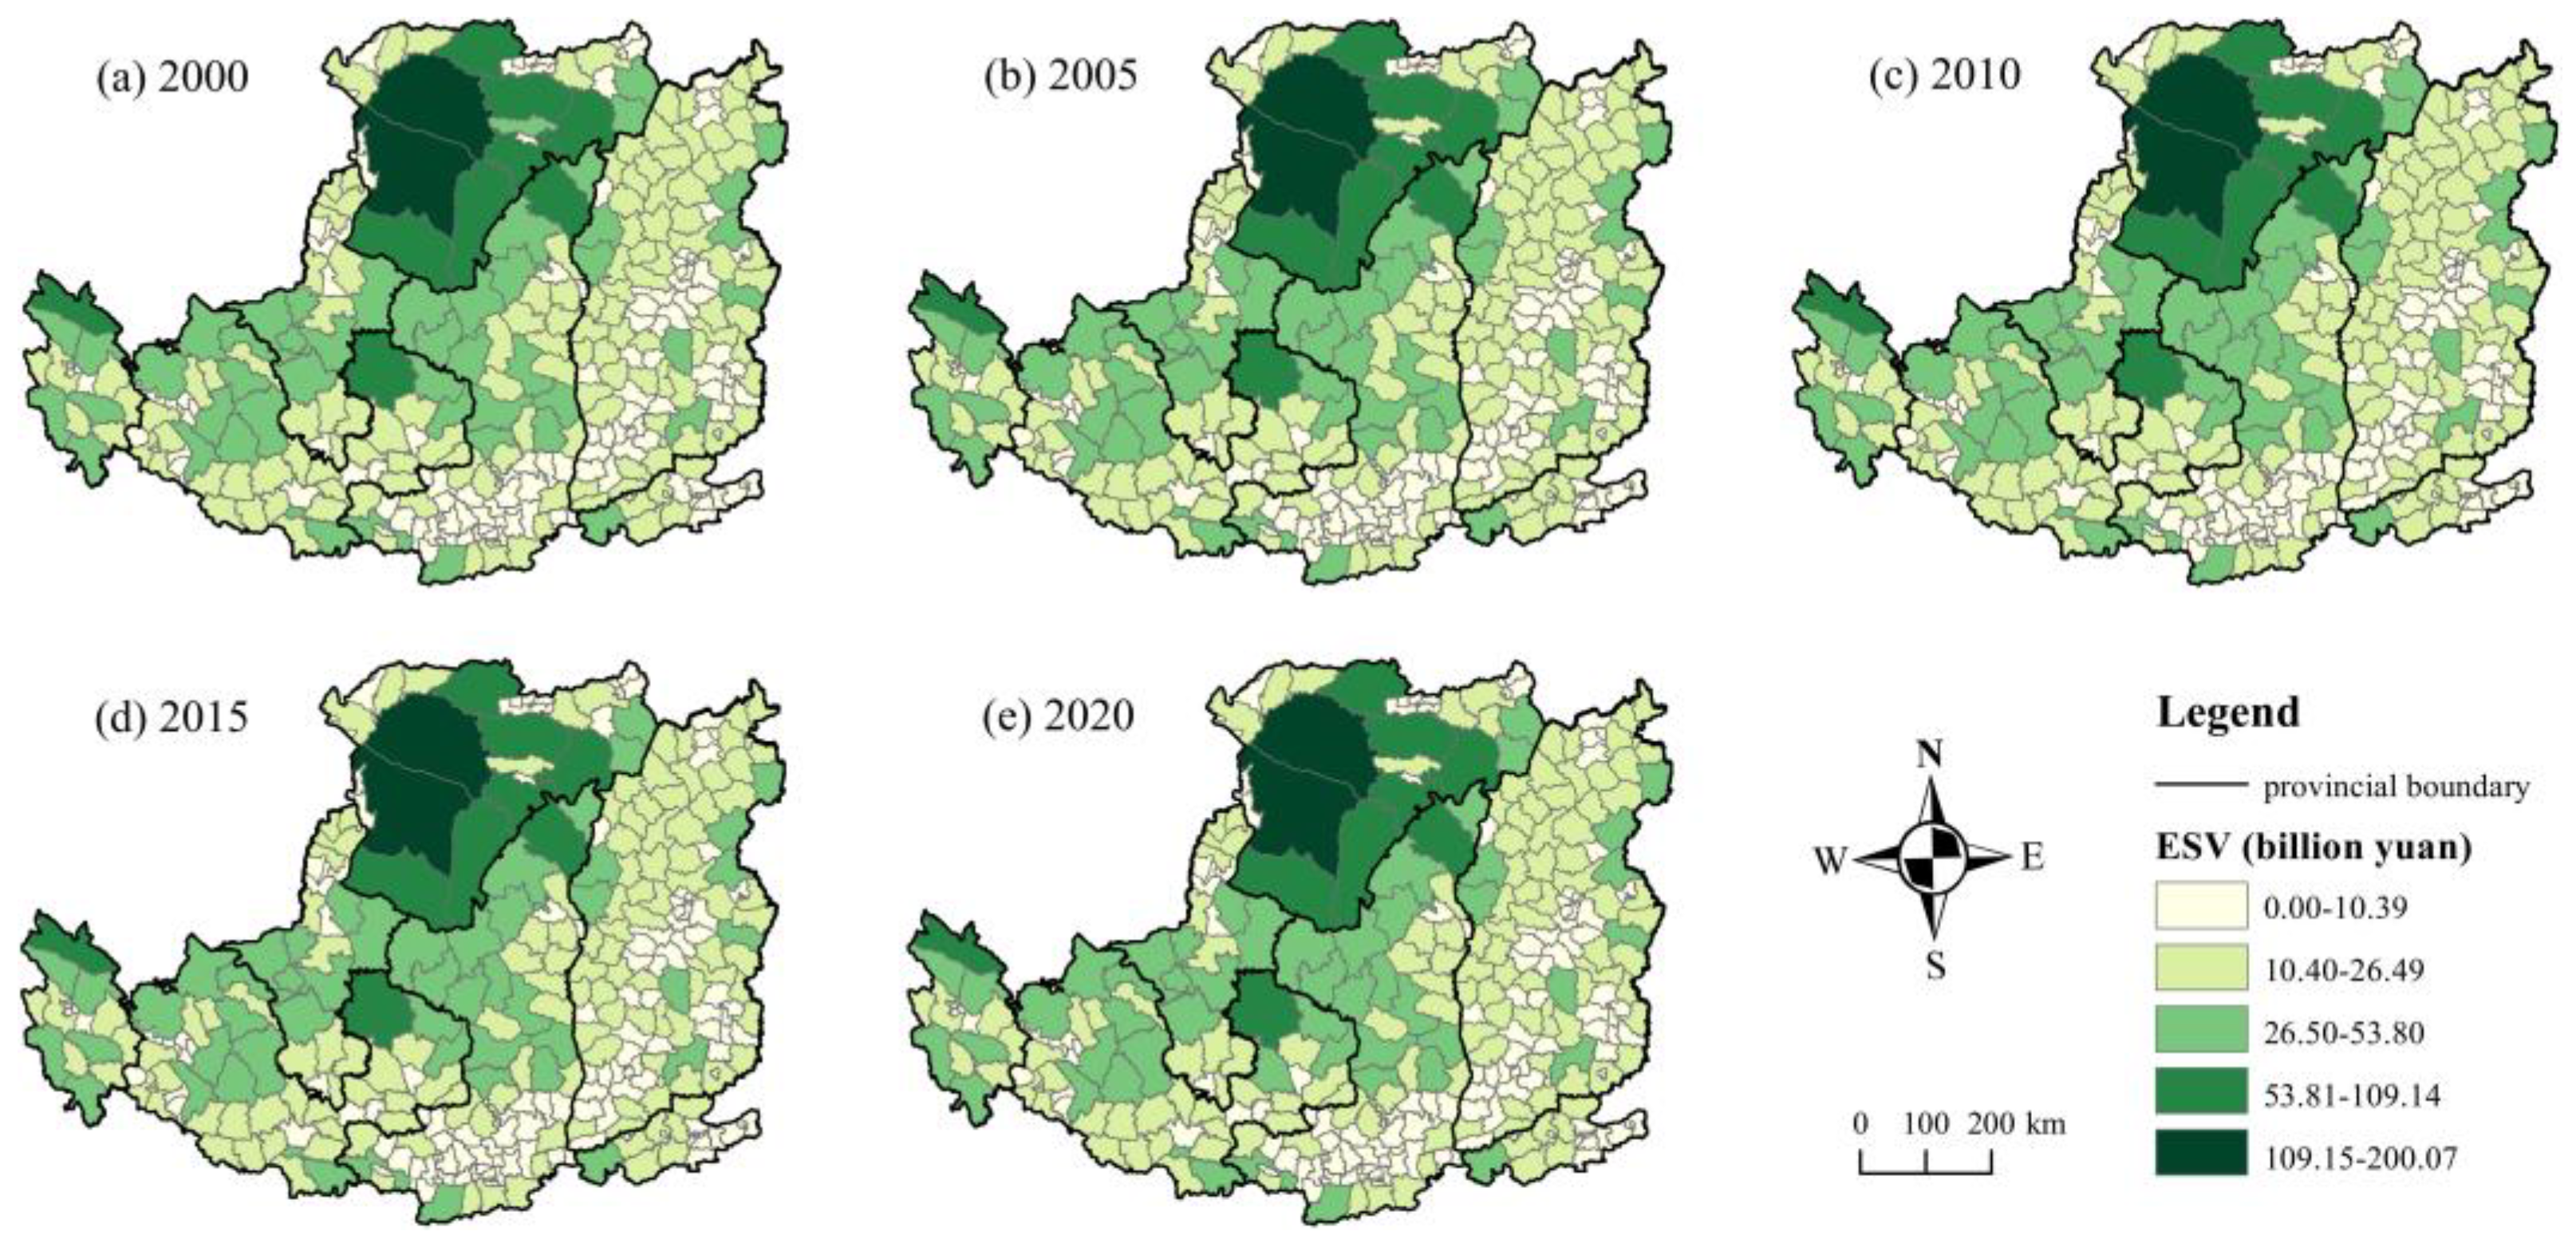
Figure 4.
Change rates of ecosystem service value in various counties of the Loess Plateau from 2000 to 2020.
Figure 4.
Change rates of ecosystem service value in various counties of the Loess Plateau from 2000 to 2020.
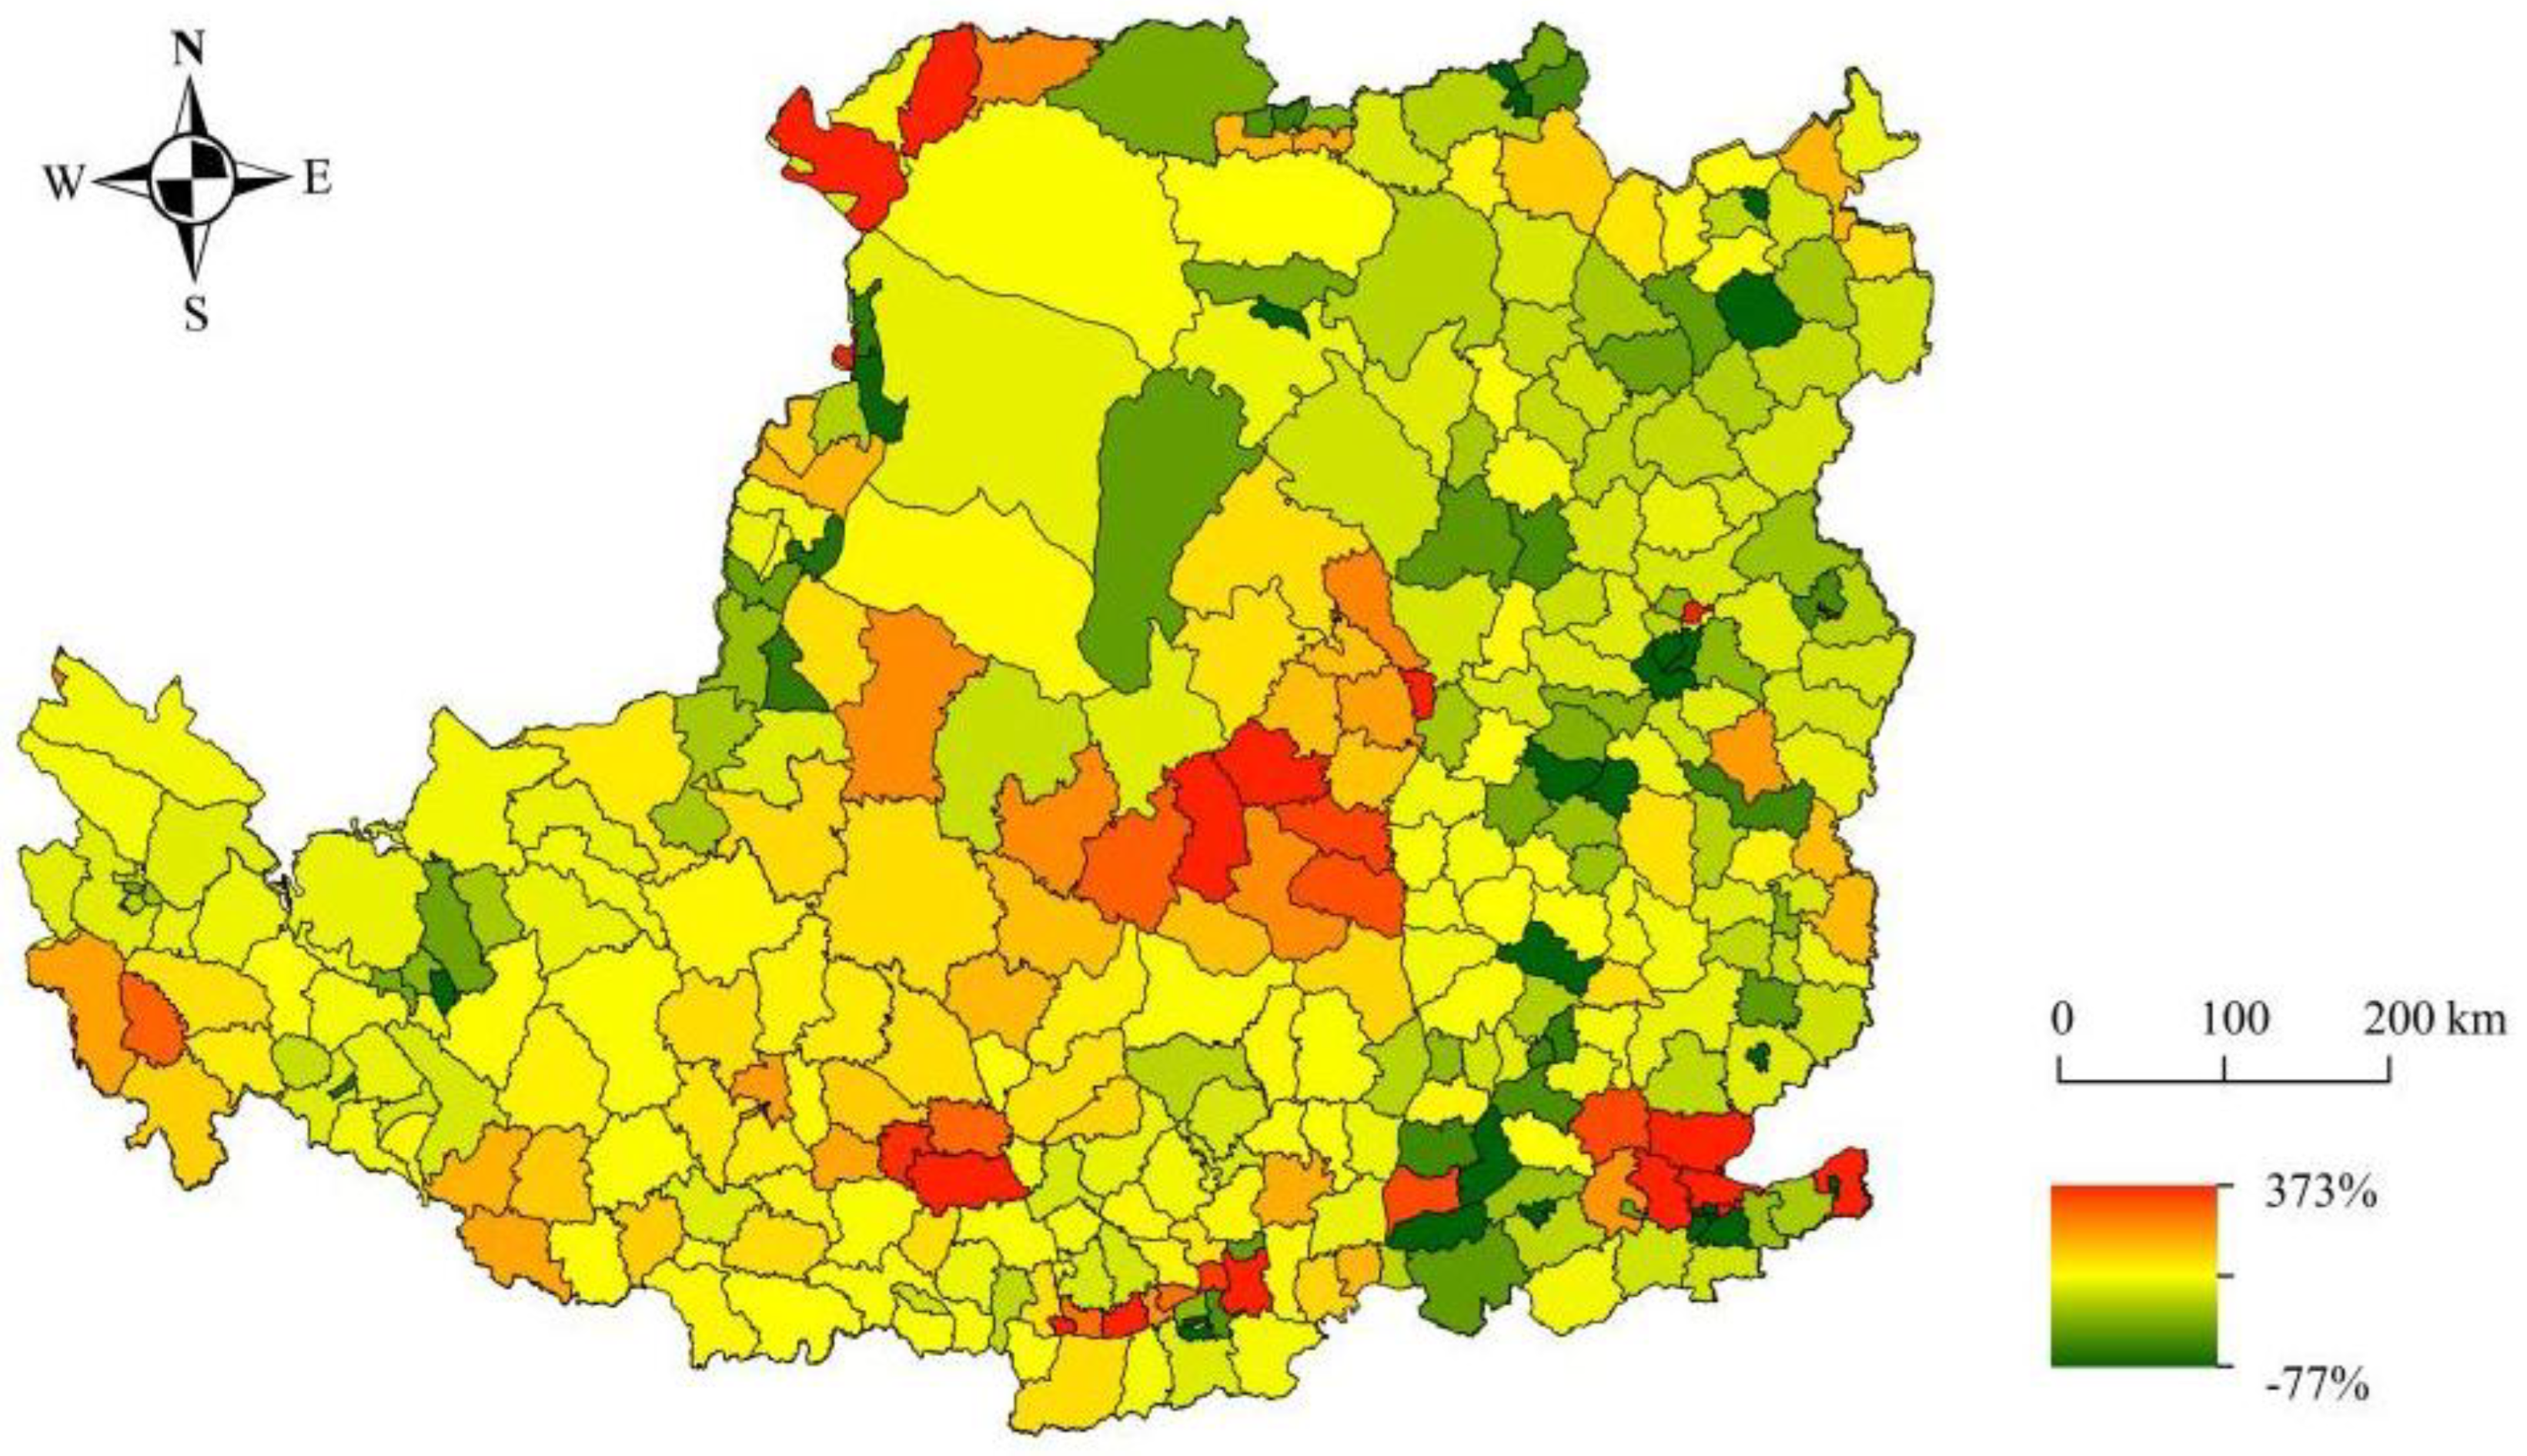
Figure 5.
Changes of carbon emissions from land use in various counties of the Loess Plateau from 2000 to 2020: (a) Carbon emissions from land use in various counties in 2000; (b) Carbon emissions from land use in various counties in 2005; (c) Carbon emissions from land use in various counties in 2010; (d) Carbon emissions from land use in various counties in 2015; (e) Carbon emissions from land use in various counties in 2020.
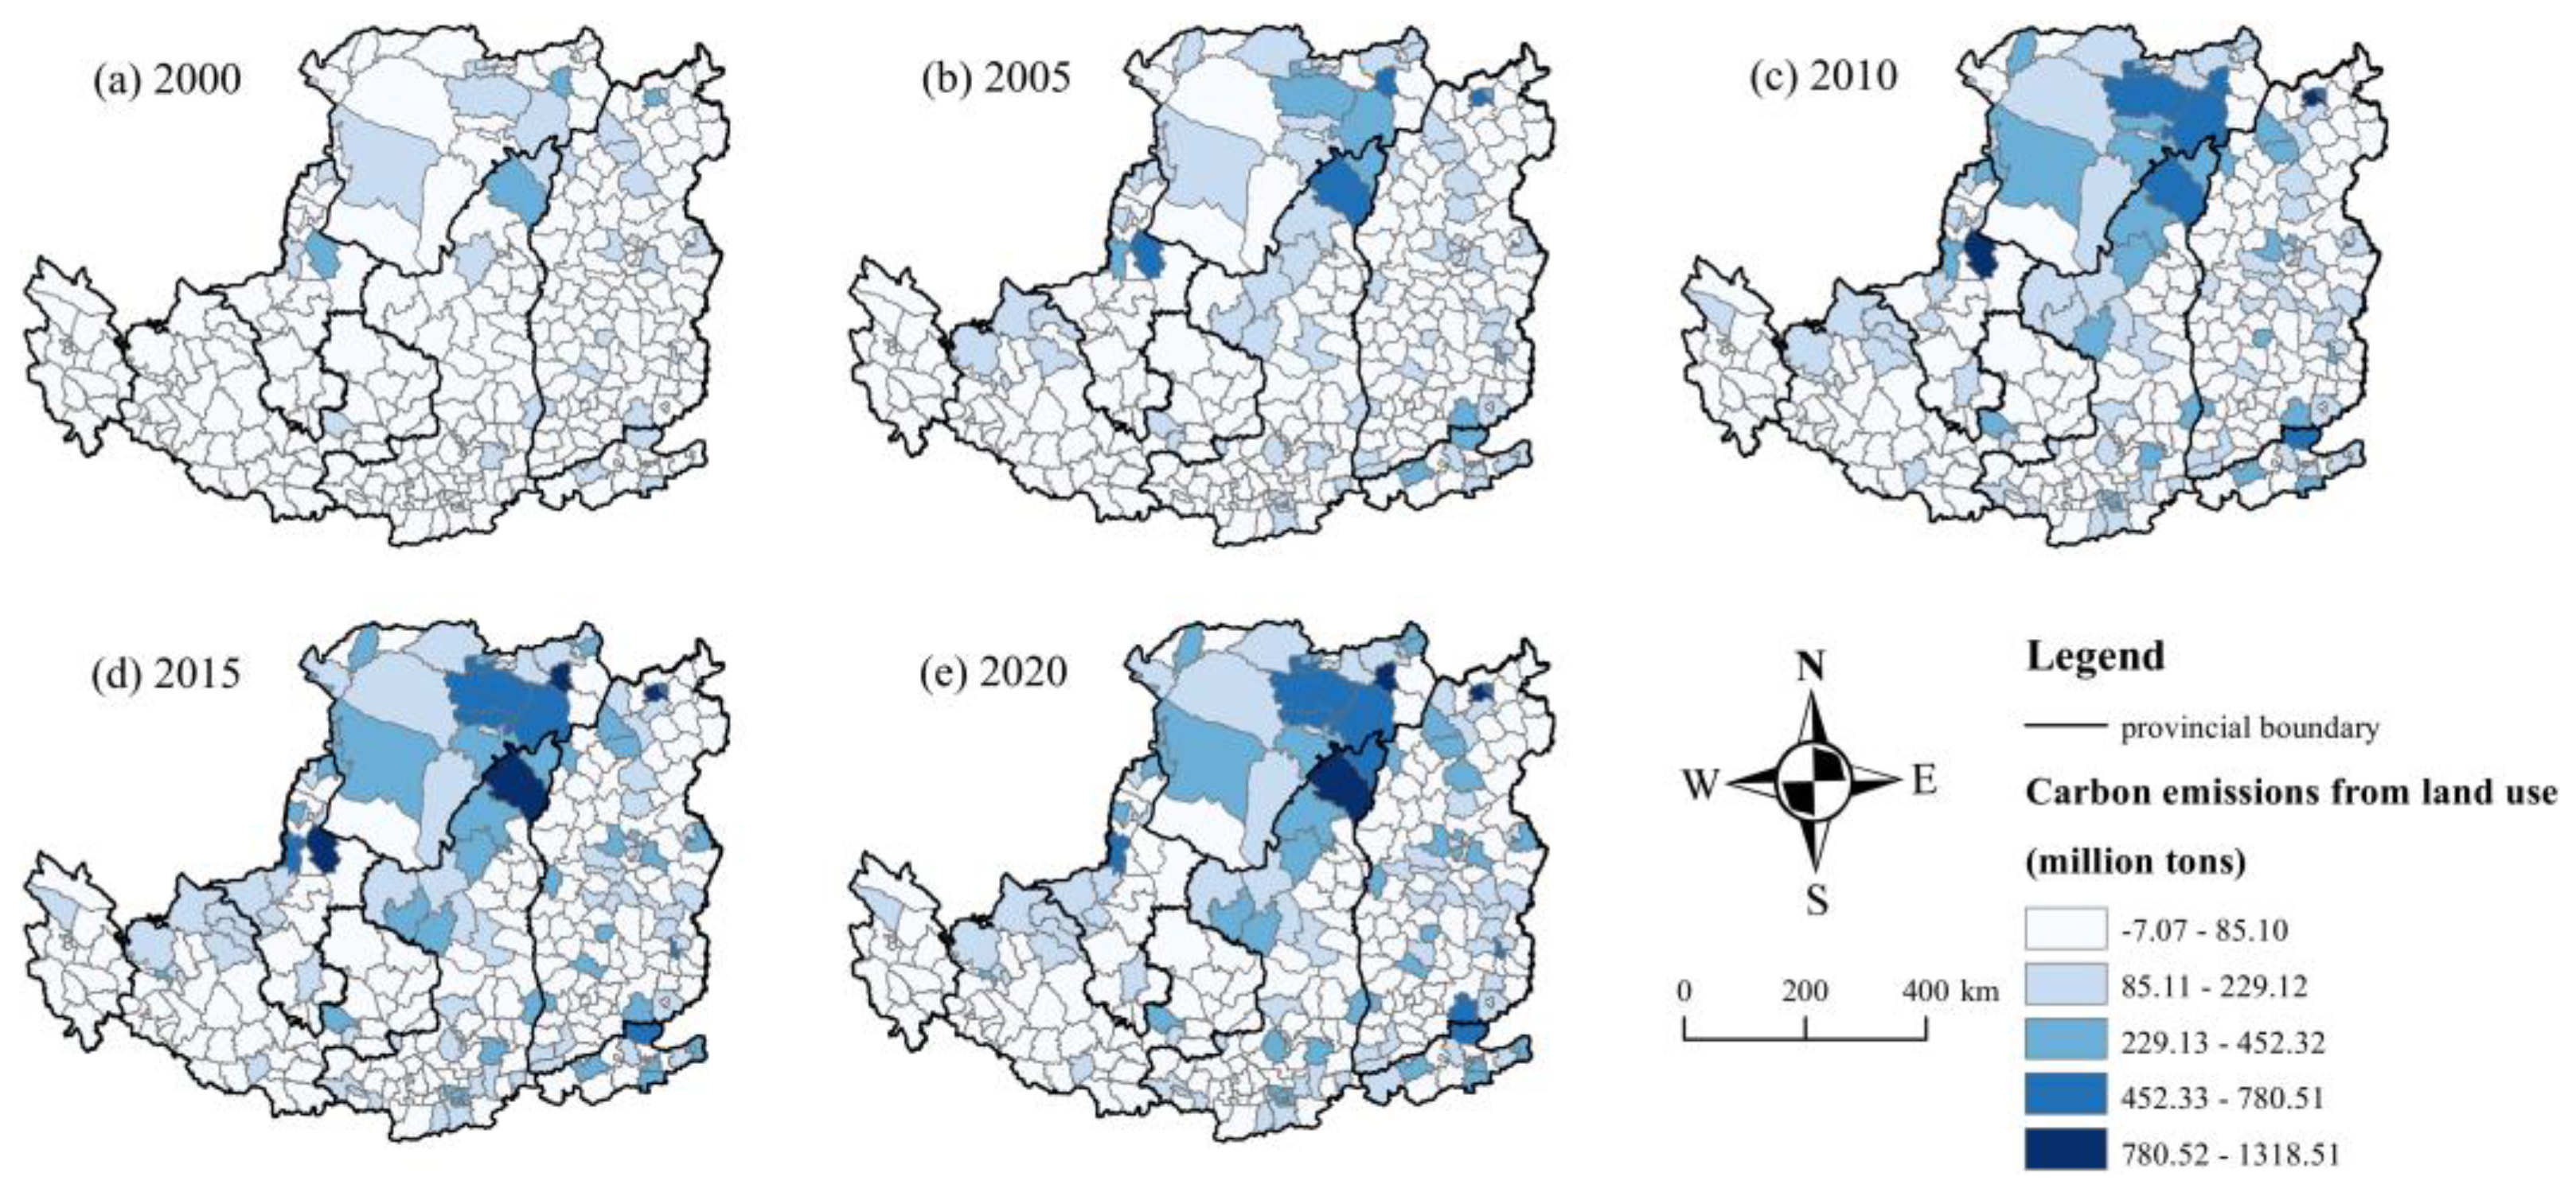
Figure 6.
Spatial autocorrelation distribution of ESV and land use carbon emissions in counties of the Loess Plateau from 2000 to 2020: (a) Spatial autocorrelation distribution of ESV and land use carbon emissions in counties in 2000; (b) Spatial autocorrelation distribution of ESV and land use carbon emissions in counties in 2005; (c) Spatial autocorrelation distribution of ESV and land use carbon emissions in counties in 2010; (d) Spatial autocorrelation distribution of ESV and land use carbon emissions in counties in 2015; (e) Spatial autocorrelation distribution of ESV and land use carbon emissions in counties in 2020.
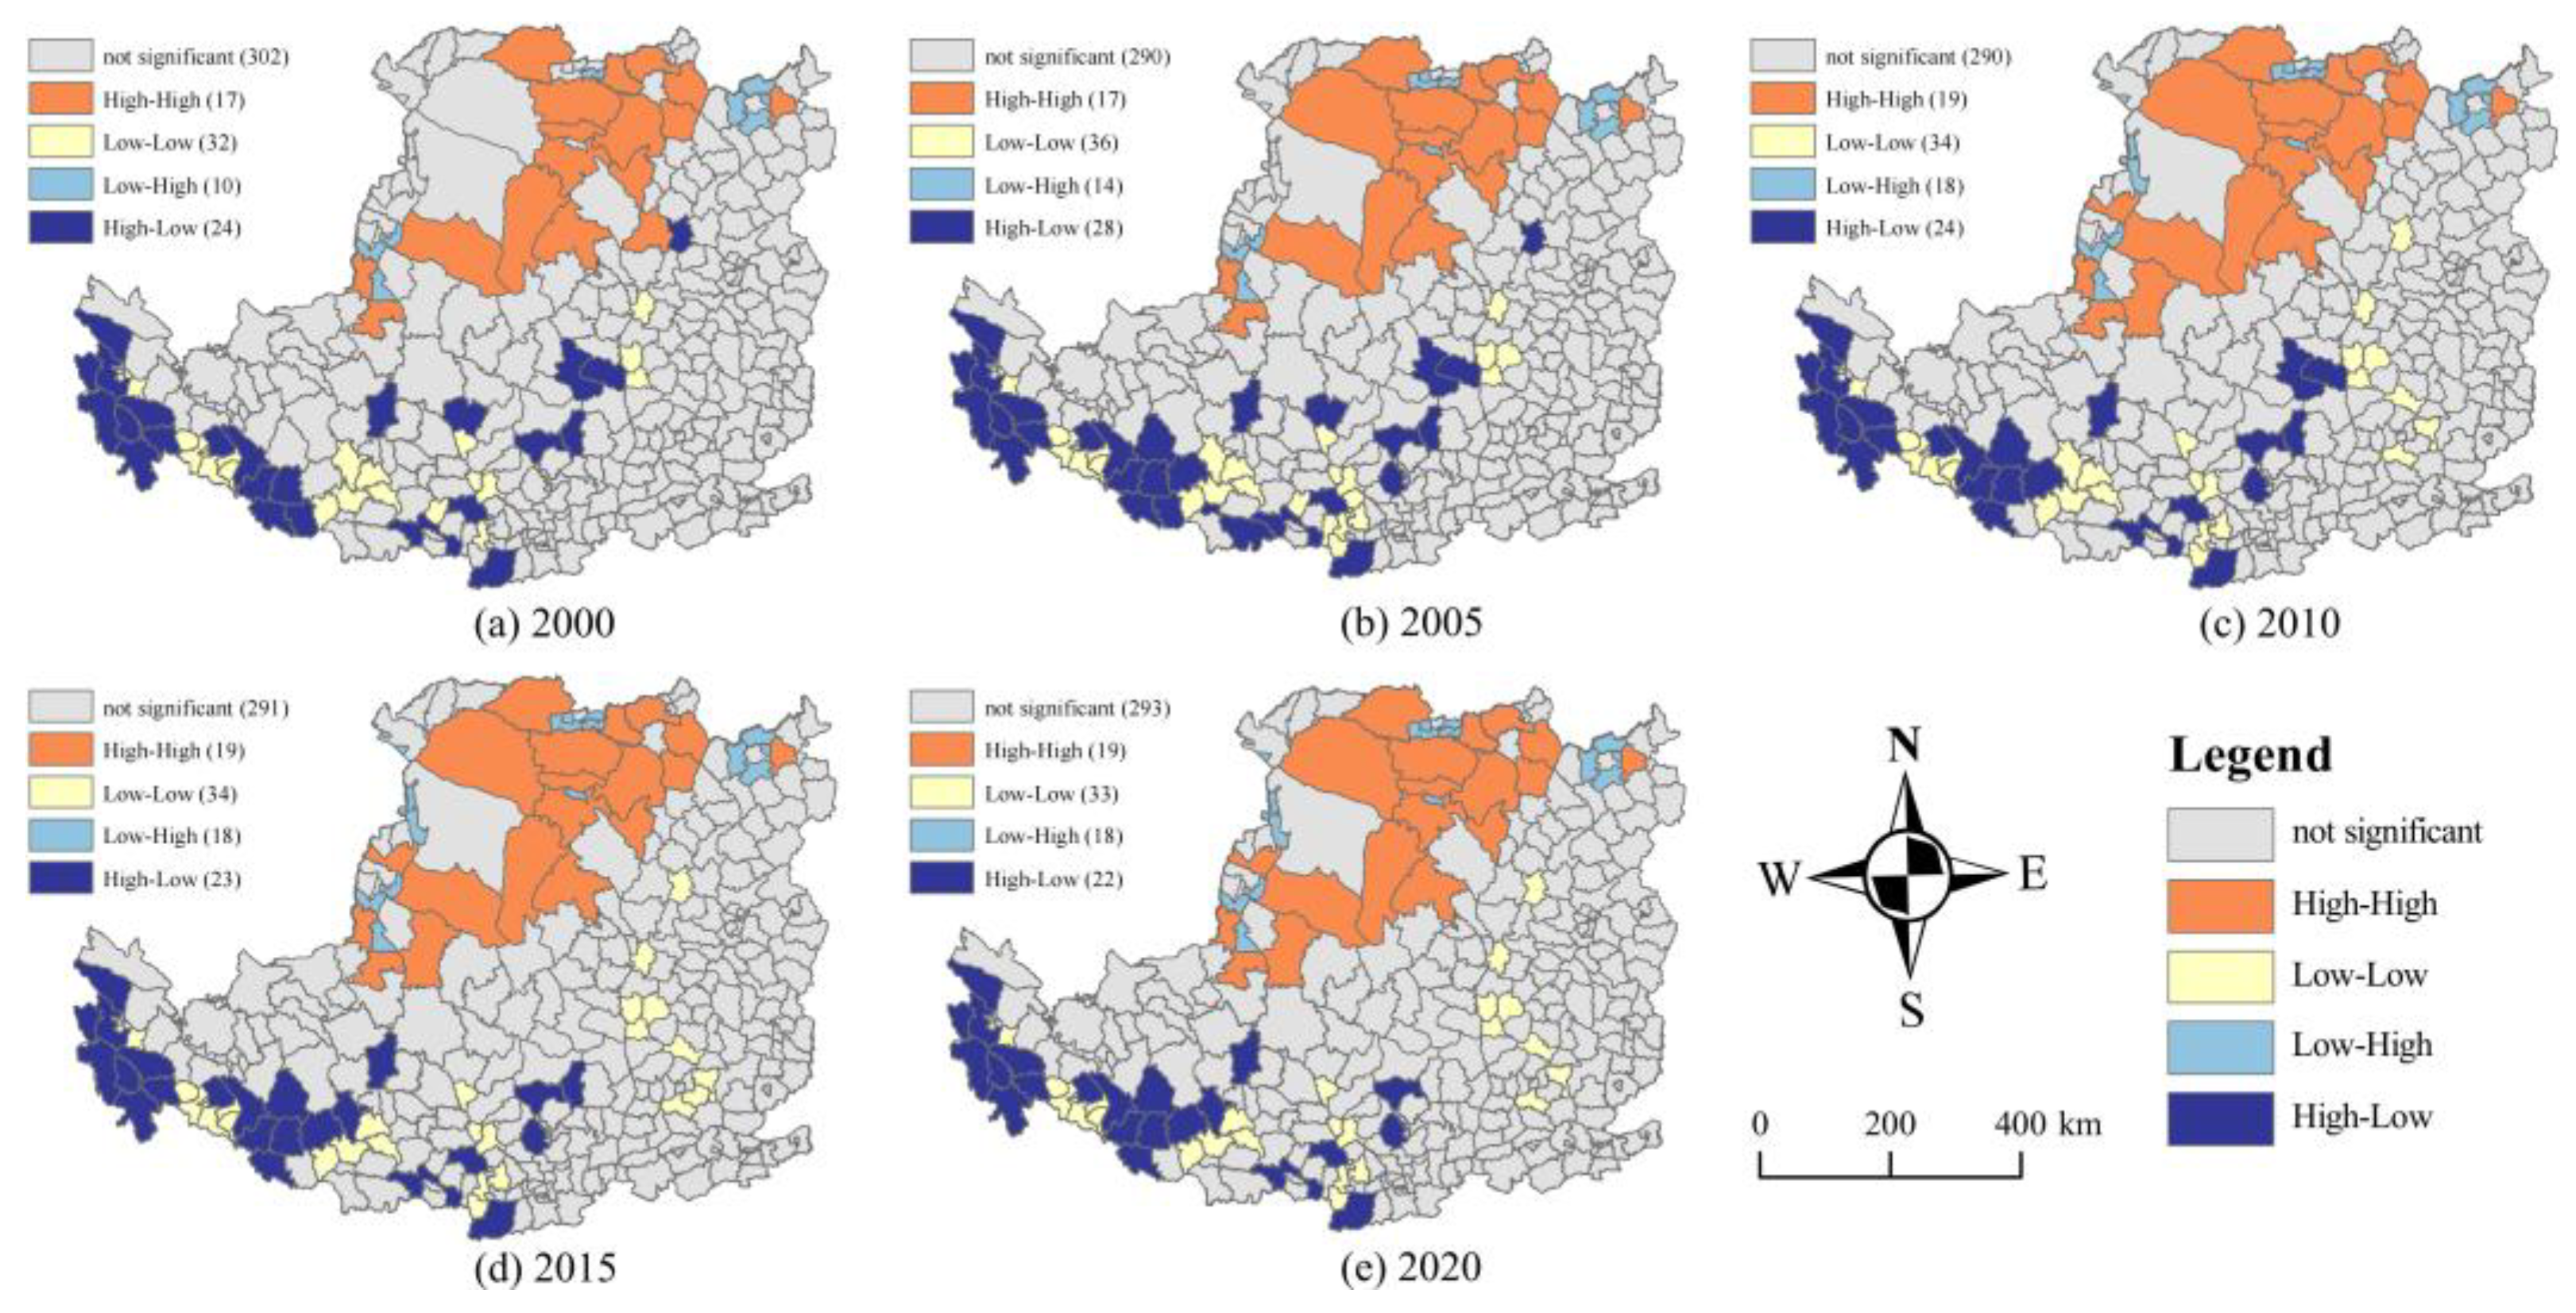
Figure 7.
The four-quadrant model of sustainable development capacity of ecosystem on the Loess Plateau for 2000 and 2020: (a) The four-quadrant model of sustainable development capacity of ecosystem in 2000; (b) The four-quadrant model of sustainable development capacity of ecosystem in 2020.
Figure 7.
The four-quadrant model of sustainable development capacity of ecosystem on the Loess Plateau for 2000 and 2020: (a) The four-quadrant model of sustainable development capacity of ecosystem in 2000; (b) The four-quadrant model of sustainable development capacity of ecosystem in 2020.
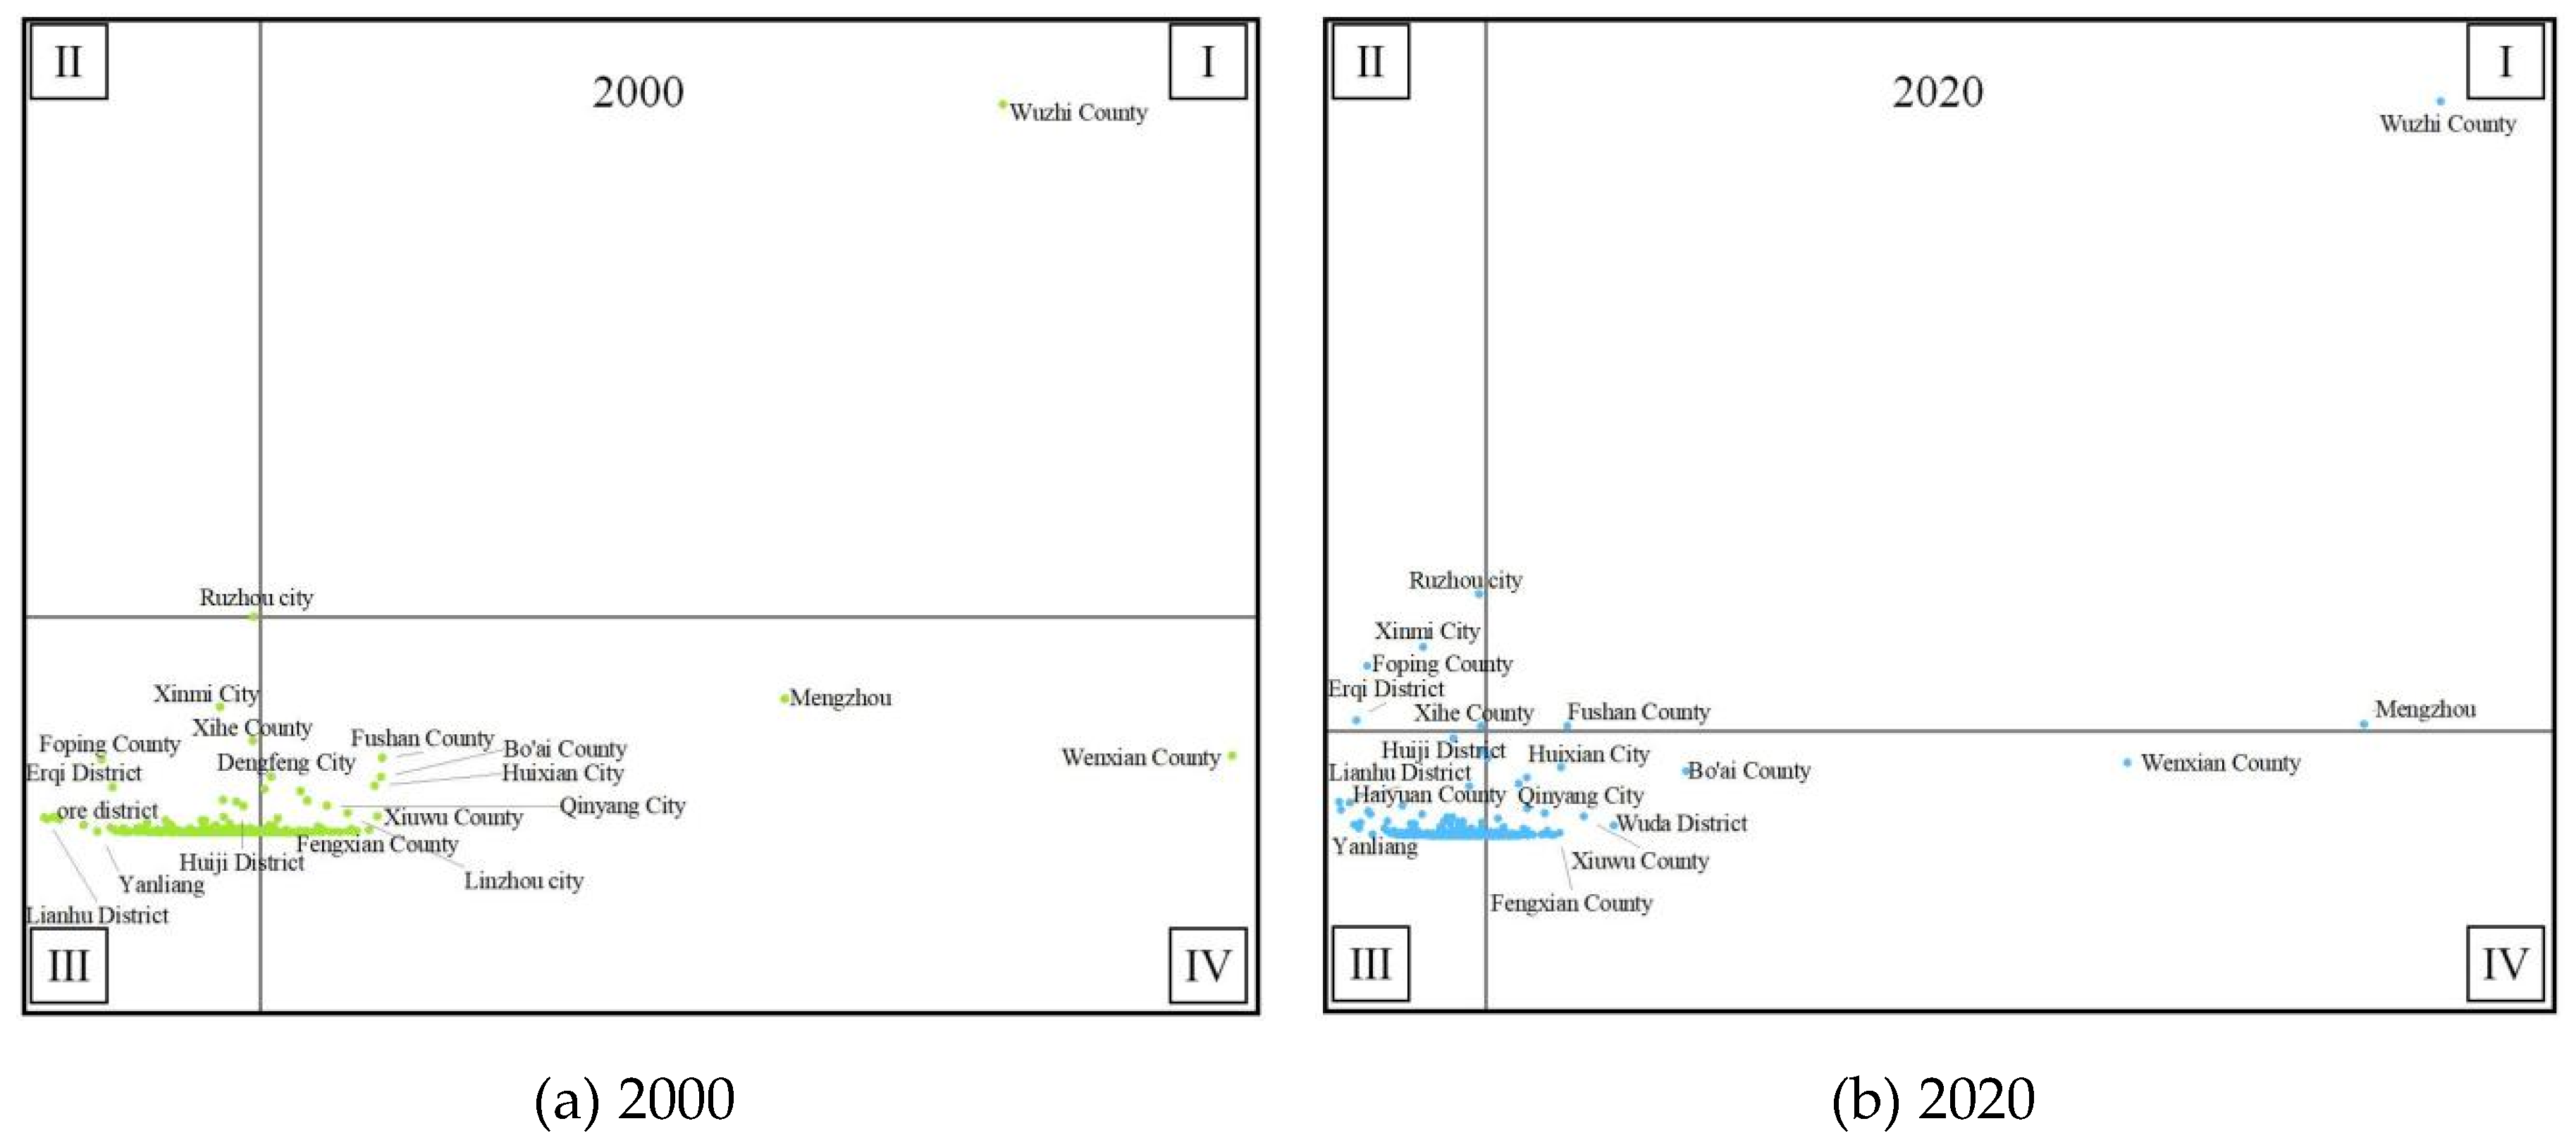
Figure 8.
Changes in sustainable development capacity of ecosystems in various counties on the Loess Plateau from 2000 to 2020: (a) Four quadrant diagram of ecosystem sustainable development capacity in 2000; (b) Four quadrant diagram of ecosystem sustainable development capacity in 2020; (c) The change of ecosystem sustainable development ability from 2000 to 2020.
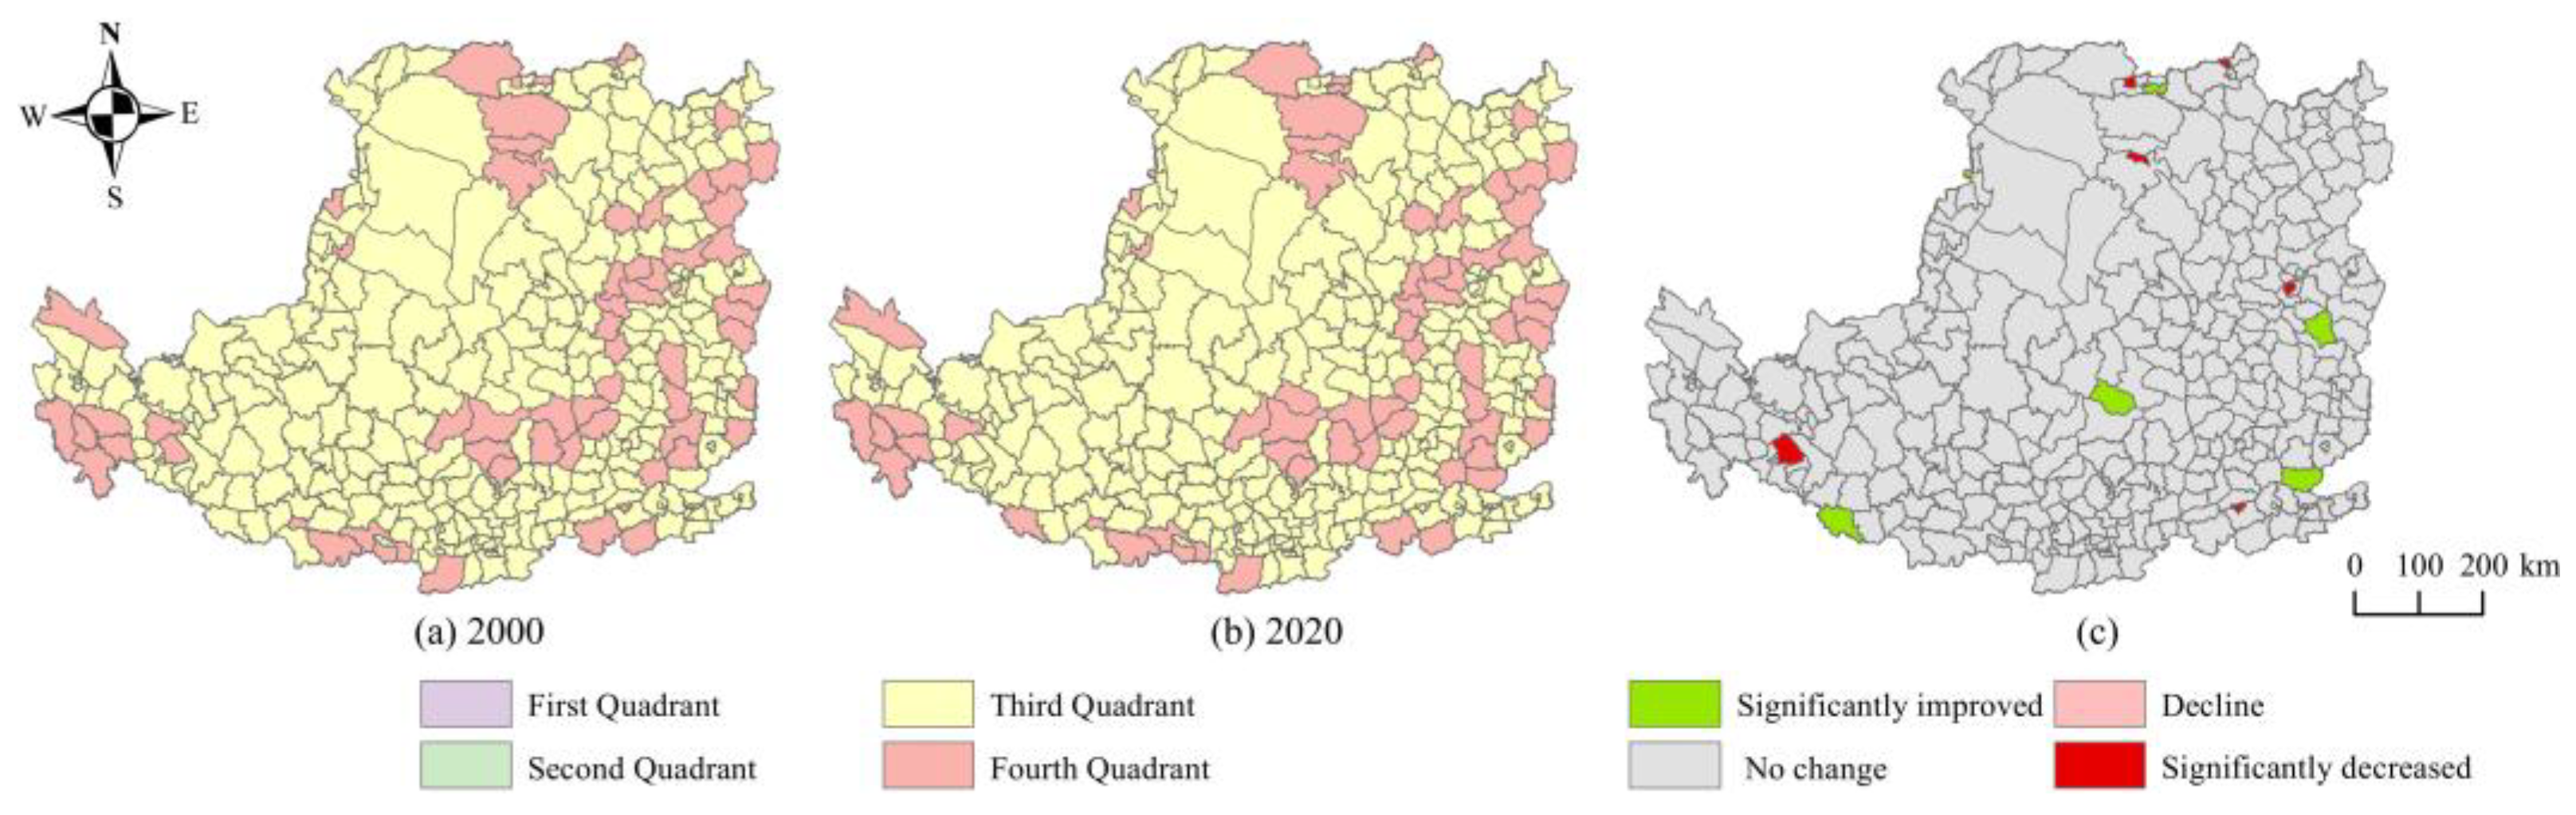

Table 1.
Ecosystem service value equivalent per unit area.
| Ecosystem classification | Cropland | Forest | Grassland | waters | Construction land | Unutilized land |
|---|---|---|---|---|---|---|
| Raw materials | 0.40 | 0.54 | 0.34 | 0.37 | 0.00 | 0.03 |
| Water supply | 0.02 | 0.28 | 0.19 | 5.44 | 0.00 | 0.02 |
| Gas regulation | 0.67 | 1.76 | 1.21 | 1.34 | 0.00 | 0.11 |
| Climate regulation | 0.36 | 5.27 | 3.19 | 2.95 | 0.00 | 0.10 |
| environmental purification | 0.10 | 1.57 | 1.05 | 4.58 | 0.00 | 0.31 |
| Hydrological regulation | 0.27 | 3.81 | 2.34 | 63.24 | 0.00 | 0.21 |
| Soil disposition | 1.03 | 2.14 | 1.47 | 1.62 | 0.00 | 0.13 |
| Nutrient cycle | 0.12 | 0.16 | 0.11 | 0.13 | 0.00 | 0.01 |
| Biodiversity | 0.13 | 1.95 | 1.34 | 5.21 | 0.00 | 0.12 |
| Aesthetic landscape | 0.06 | 0.86 | 0.59 | 3.31 | 0.00 | 0.05 |
Table 2.
Carbon emission coefficient of different land use types (t·hm-2).
| Land use type | Cropland | Forest | Grassland | waters | Unutilized land |
|---|---|---|---|---|---|
| Carbon emission coefficient | 0.422 | -0.644 | -0.021 | -0.218 | -0.005 |
| Reference | Zhao, X.C. etc. [44] | Wang, L. etc. [45] | Fang, J.Y. etc. [46] | Li, Y.L. etc. [41] | Wang, L. etc. [45] |
Table 3.
The standard coal conversion coefficient and carbon emission coefficient of various energy sources.
Table 3.
The standard coal conversion coefficient and carbon emission coefficient of various energy sources.
| Energy types | Coal | Hard coke | Crude oil | Fuel oil | Gasoline | Kerosene | Natural gas |
|---|---|---|---|---|---|---|---|
| Standard coal coefficient | 0.7143 | 0.9714 | 1.4286 | 1.4286 | 1.4714 | 1.4714 | 1.3301 |
| Carbon emission coefficient | 0.7559 | 0.8550 | 0.5857 | 0.6185 | 0.5538 | 0.5714 | 0.4483 |
Table 4.
Ecosystem service value coefficient per unit area of different land use types in the Loess Plateau (yuan/hm2).
Table 4.
Ecosystem service value coefficient per unit area of different land use types in the Loess Plateau (yuan/hm2).
| Class of ESV | Cropland | Forest | Grassland | Waters | Construction land | Unutilized land |
|---|---|---|---|---|---|---|
| Raw materials | 370.74 | 497.41 | 318.22 | 338.30 | 0.00 | 27.81 |
| Water supply | 18.54 | 256.43 | 176.10 | 5042.12 | 0.00 | 18.54 |
| Gas regulation | 621.00 | 1631.27 | 1118.41 | 1237.36 | 0.00 | 101.95 |
| Climate regulation | 333.67 | 4881.46 | 2956.68 | 2729.60 | 0.00 | 92.69 |
| environmental purification | 92.69 | 1452.08 | 976.29 | 4240.38 | 0.00 | 287.33 |
| Hydrological regulation | 250.25 | 3531.34 | 2165.76 | 58609.99 | 0.00 | 194.64 |
| Soil disposition | 954.67 | 1986.57 | 1362.48 | 1501.51 | 0.00 | 120.49 |
| Nutrient cycle | 111.22 | 151.39 | 105.04 | 115.86 | 0.00 | 9.27 |
| Biodiversity | 120.49 | 1810.47 | 1238.90 | 4828.94 | 0.00 | 111.22 |
| Aesthetic landscape | 55.61 | 794.01 | 546.85 | 3067.91 | 0.00 | 46.34 |
| Sum | 2928.88 | 16992.43 | 10964.75 | 81711.98 | 0.00 | 1010.28 |
Table 5.
Ecosystem service value of different land use types in the Loess Plateau from 2000 to 2020 (billion yuan).
Table 5.
Ecosystem service value of different land use types in the Loess Plateau from 2000 to 2020 (billion yuan).
| 2000 | 2005 | 2010 | 2015 | 2020 | |
|---|---|---|---|---|---|
| Cropland | 60.492 | 59.311 | 58.297 | 58.079 | 56.733 |
| Forest | 157.865 | 161.637 | 163.287 | 162.912 | 163.790 |
| Grassland | 285.323 | 284.167 | 285.842 | 285.163 | 284.570 |
| Waters | 71.016 | 72.420 | 68.559 | 69.254 | 73.214 |
| Construction land | 0.000 | 0.000 | 0.000 | 0.000 | 0.000 |
| Unutilized land | 4.336 | 4.469 | 4.087 | 4.058 | 4.164 |
| Sum | 579.032 | 582.005 | 580.072 | 579.466 | 582.470 |
Table 6.
Carbon emissions from land use in the Loess Plateau from 2000 to 2020 (104t).
| Years | Cropland | Forest | Grassland | Waters | Unutilized land | Construction land | Net carbon emissions |
|---|---|---|---|---|---|---|---|
| 2000 | 871.58 | -598.30 | -54.65 | -18.95 | -2.15 | 13516.86 | 13714.39 |
| 2005 | 854.56 | -612.59 | -54.42 | -19.32 | -2.21 | 24132.59 | 24298.61 |
| 2010 | 839.95 | -618.84 | -54.75 | -18.29 | -2.02 | 35854.82 | 36000.87 |
| 2015 | 836.82 | -617.43 | -54.62 | -18.48 | -2.01 | 41369.13 | 41513.41 |
| 2020 | 817.42 | -620.75 | -54.50 | -19.53 | -2.06 | 45723.90 | 45844.48 |
Table 7.
Bivariate global Moran’s I statistic of the Loess Plateau from 2000 to 2020.
| Years | 2000 | 2005 | 2010 | 2015 | 2020 |
|---|---|---|---|---|---|
| Moran’s I | 0.054 | 0.045 | 0.08 | 0.079 | 0.079 |
| P | <0.05 | <0.05 | <0.05 | <0.05 | <0.05 |
| z | 2.2679 | 1.9266 | 3.4090 | 3.3615 | 3.3884 |
Disclaimer/Publisher’s Note: The statements, opinions and data contained in all publications are solely those of the individual author(s) and contributor(s) and not of MDPI and/or the editor(s). MDPI and/or the editor(s) disclaim responsibility for any injury to people or property resulting from any ideas, methods, instructions or products referred to in the content. |
© 2025 by the authors. Licensee MDPI, Basel, Switzerland. This article is an open access article distributed under the terms and conditions of the Creative Commons Attribution (CC BY) license (http://creativecommons.org/licenses/by/4.0/).
Copyright: This open access article is published under a Creative Commons CC BY 4.0 license, which permit the free download, distribution, and reuse, provided that the author and preprint are cited in any reuse.


