Submitted:
09 June 2025
Posted:
10 June 2025
You are already at the latest version
Abstract
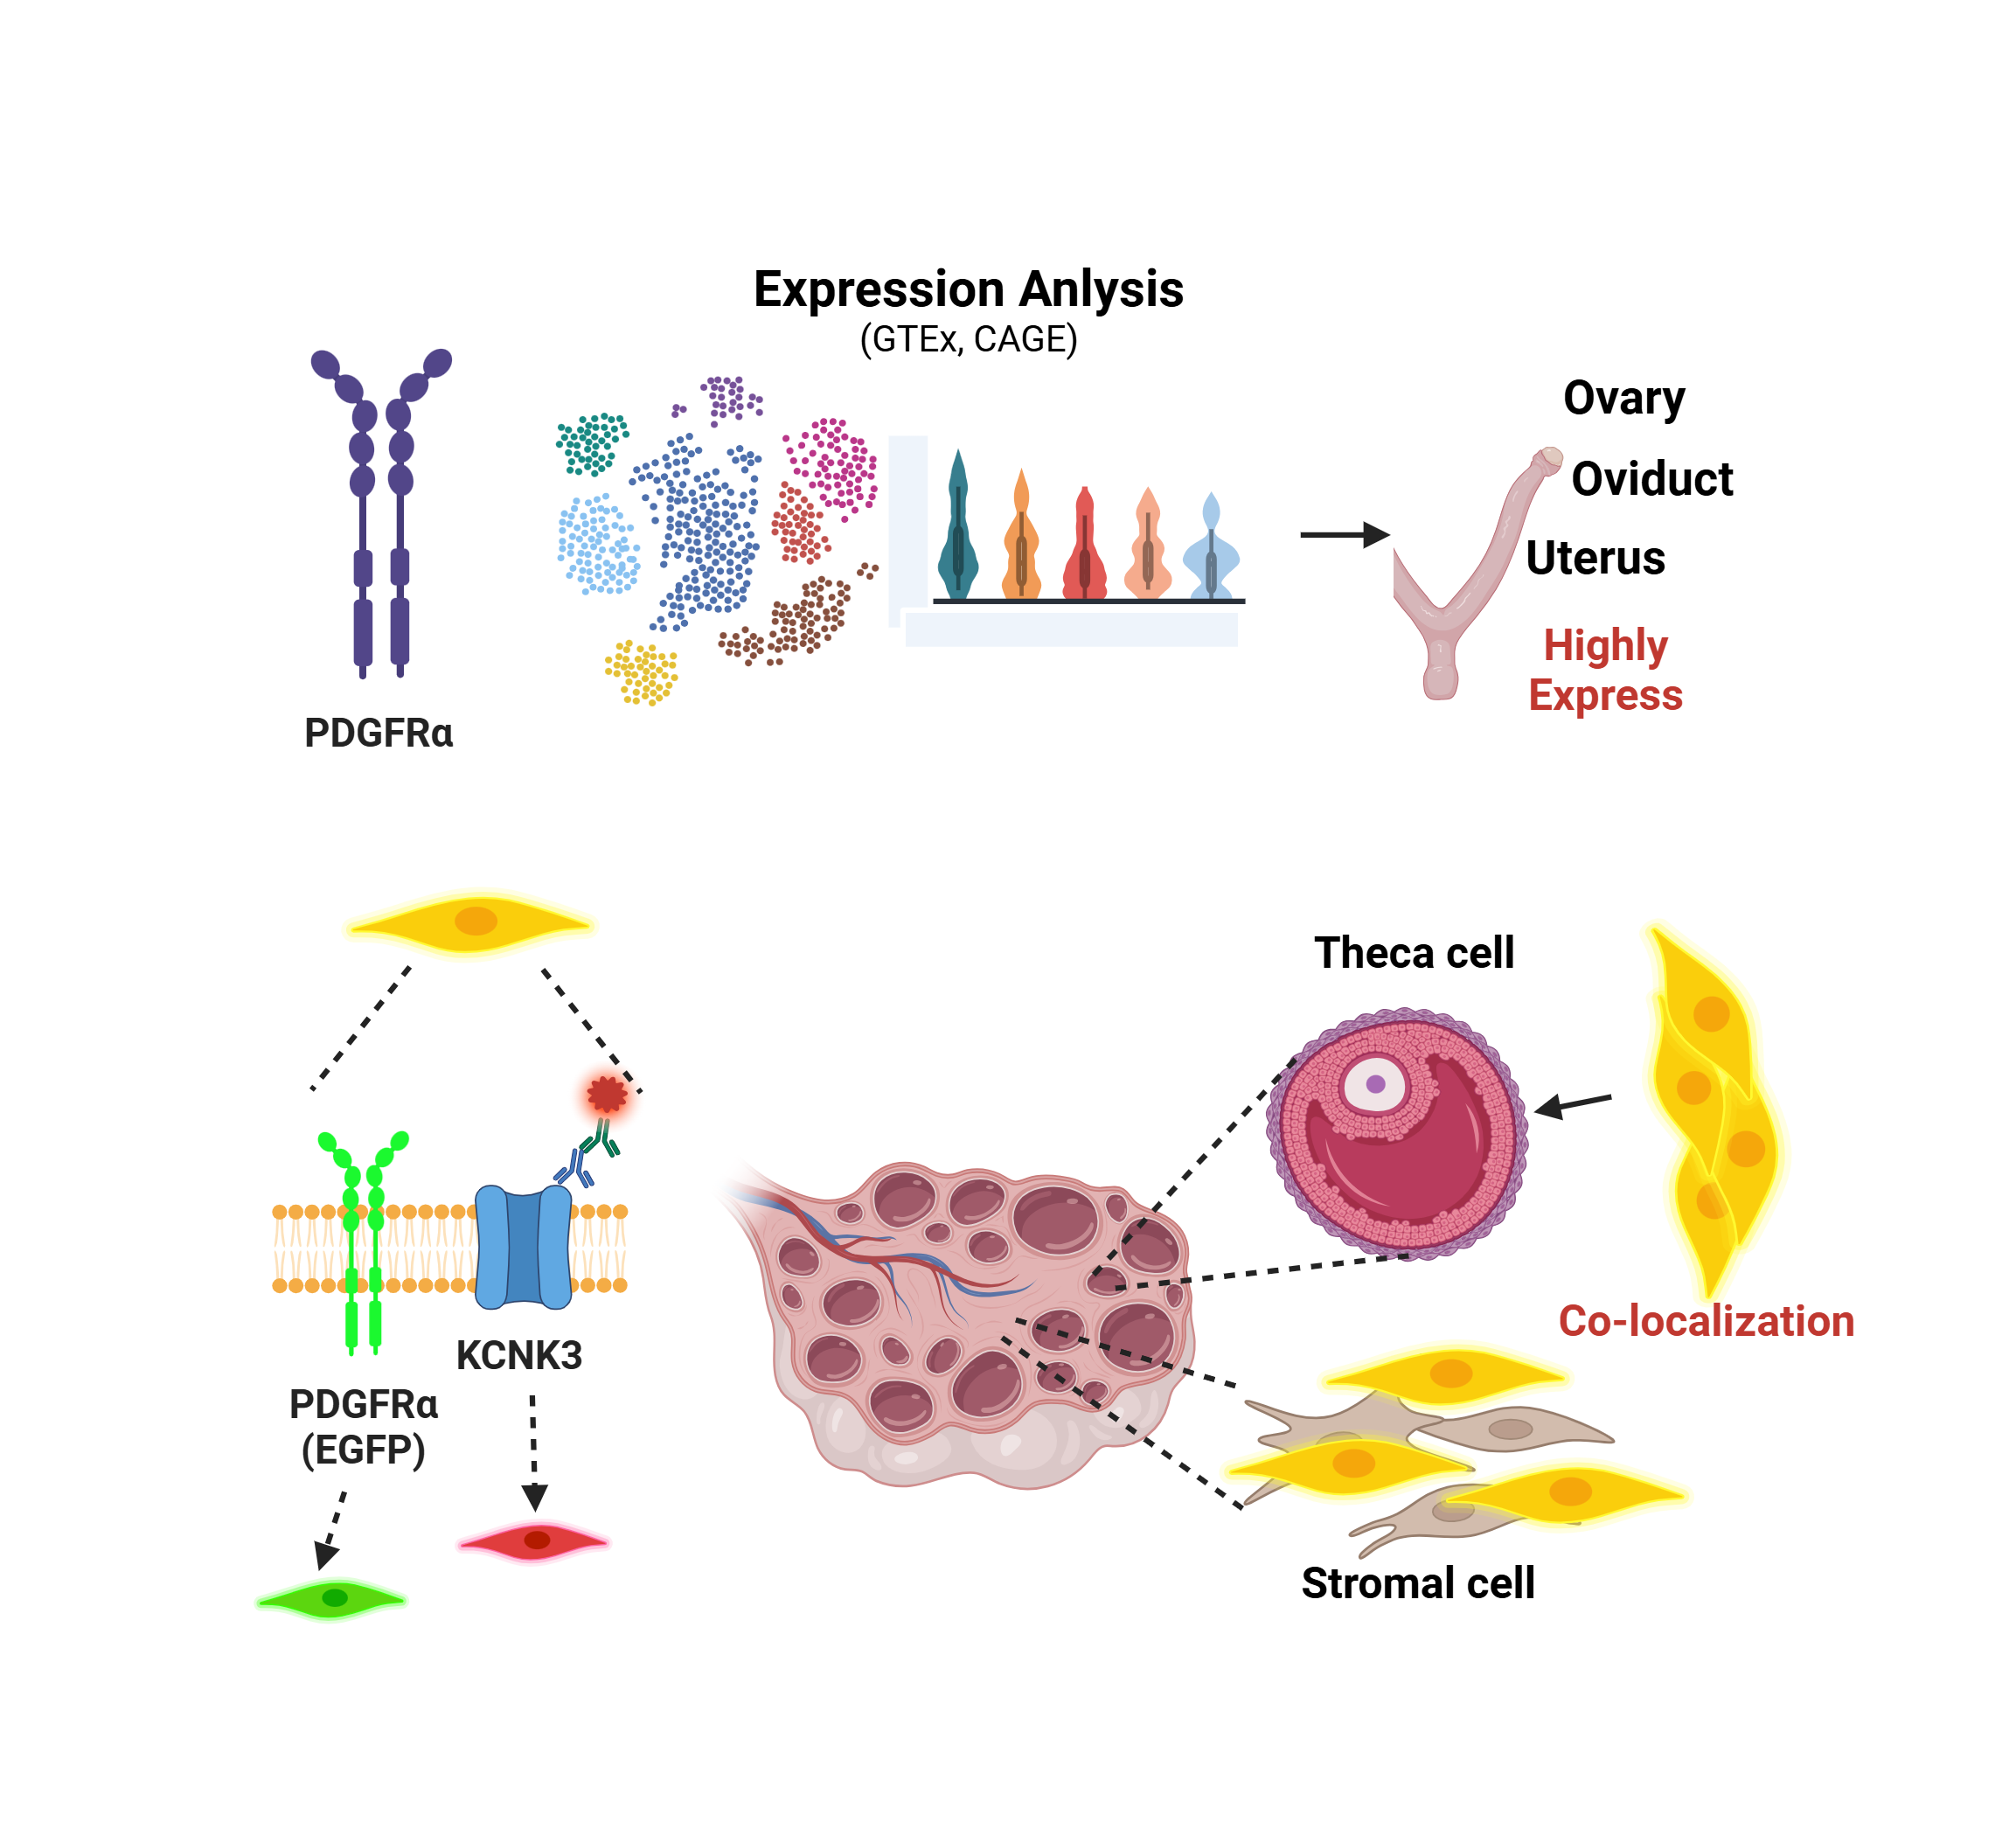
Background/Objectives: Platelet-derived growth factor receptor alpha (PDGFRα) is a receptor involved in cell growth and differentiation, with unclear roles in ovarian tissues and potential interactions with potassium two pore domain channel subfamily K member 3 (KCNK3). This study aims to map PDGFRα expression across mouse tissues and to explore its co-expression with KCNK3 in the ovary. Methods: We visualized PDGFRα expression using RNA-seq data from the genotype-tissue expression (GTEx) BodyMAP across 54 human tissues and cap analysis of gene expression (CAGE) data for various mouse tissues. In PDGFRαEGFP mice expressing EGFP in PDGFRα+ cells, histological and fluorescence imaging were used to assess ovarian expression. Immunohistochemistry determined the co-localization of PDGFRα and KCNK3, and qPCR quantified their mRNA levels in the ovary, oviduct, and uterus. Results: PDGFRα showed high expression in human and mouse female reproductive tissues, particularly the ovary. In the PDGFRαEGFP mouse model, PDGFRα was primarily found in the thecal layer and stromal cells, not in granulosa cells or oocytes. Immunohistochemistry indicated that 90.2 ± 8.7% of PDGFRα+ cells also expressed KCNK3 in the ovarian stroma. qPCR revealed lower PDGFRα and KCNK3 expression in the ovary compared to the oviduct and uterus. Conclusions: This study shows that PDGFRα is predominantly expressed in ovarian stromal and theca cells and is highly co-localized with KCNK3, implying a novel role for PDGFRα+ cells in maintaining ionic balance and potentially influencing follicular development and ovarian physiology.
Keywords:
ovary
; platelet-derived growth factor receptor alpha
; potassium channel subfamily K member 3
; theca cells
1. Introduction
Platelet-derived growth factors (PDGFs) are dimeric proteins capable of forming homodimers (AA, BB, CC, DD) or heterodimers. PDGF-AA, PDGF-AB, and PDGF-BB interact with PDGF receptor alpha (PDGFRα), while PDGF-BB primarily binds to PDGF receptor beta (PDGFRβ) [1-3]. Specifically, PDGF-A, PDGF-B, and PDGF-C engage with PDGFRα, while PDGF-B and PDGF-D associate with PDGFRβ, initiating cellular responses by activating tyrosine kinase receptors [1,4,5]. Upon activation, PDGFRα and PDGFRβ promote cell proliferation, migration, vascular permeability, and wound healing [6,7].
The Human Protein Atlas reports the highest expression of PDGFRα mRNA in the human ovary, according to the consensus, HPA, GTEx, and FANTOM5 datasets, with the highest protein expression observed in the endometrium and ovary (as of August 26, 2024, source). Similarly, RNA-Seq cap analysis of gene expression (CAGE) from the RIKEN FANTOM5 project in mice tissue shows high expression levels in the uterus and ovary (Expression Atlas, August 26, 2024). PDGFRβ is also highly expressed in the ovary, while its expression levels are slightly lower than that of PDGFRa.
Earlier studies have identified PDGF ligands and receptors in oocytes within primordial, primary, and early-developing follicles, contributing to the maturation of primordial follicles [8,9]. PDGFs and other growth agents have been recognized as critical modulators in transitioning from primordial to primary follicles, with variations in mRNA expression levels supporting their role [10]. PDGFs act as angiogenic factors, recruiting smooth muscle cells and pericytes to stabilize and reinforce blood vessels, a process crucial for ovarian function [9,11,12]. New blood vessels are developed in the ovary, which is crucial for supplying nutrients and hormones, follicular growth, and corpus luteum development [13-15]. Consequently, disruptions in PDGF signaling may result in menstrual irregularities, amenorrhea, and infertility and potentially contribute to ovarian cancer development [16,17]. An increasing amount of evidence highlights the critical role of PDGF signaling and expression in ovarian function across variable species.
The Tandem of P domains in a weak inward rectifying K+ channel-related Acid-Sensitive K+-1 (TASK-1/KCNK3) channel, a member of the two-pore domain K+ channel, is prominently expressed in PDGFRα+ cells in mice [18]. KCNK3 channels play a crucial role in establishing and maintaining the resting membrane potential of cells. They are susceptible to changes in oxygen levels and pH [19]. Additionally, KCNK3 channel activity is inhibited by various hormones, including norepinephrine, serotonin, substance P, and thyrotropin-releasing hormone [20]. In the testis, KCNK3 is expressed in Leydig and peritubular cells of adult mice, and PDGFRα is expressed in those cells [21]. Co-localization of PDGFRα and KCNK3 in these cells suggests that PDGFRα+ cells may regulate intracellular calcium signaling and maintain ionic homeostasis [22].
In this study, we aimed to analyze the expression levels and patterns of PDGFRα in reproductive organs using PDGFRαEGFP mice, which are genetically modified to express enhanced green fluorescent protein under the PDGFRα promotor, allowing precise visualization of PDGFRα-positive cells.
2. Materials and Methods
Transcriptomic Data Analysis of PDGFRα Expression
To analyze the tissue-specific expression of PDGFRα across various human tissues, Human BodyMap RNA-seq data were obtained from the Genotype-Tissue Expression (GTEx) project. The dataset was accessed through the database of Genotypes and Phenotypes (dbGaP) under accession number phs000424.v8.p2. This analysis included transcriptomic data from 54 non-diseased tissues, representing nearly 1,000 individuals. Differential expression analysis focused explicitly on PDGFRα in various female tissues. For comparative analysis in mice, transcriptomic data were sourced from the Mouse Genome Informatics (MGI) database as part of the Functional Annotation of the Mammalian Genome 5 (FANTOM5) project. Cap Analysis of Gene Expression (CAGE) was utilized to determine the differential expression of PDGFRα across various female tissues in mice, providing insights into the tissue-specific expression patterns.
Animal models and housing conditions
This model was previously utilized in our study to investigate the expression pattern of PDGFRα in mouse testis, which provides a foundational basis for the current experiments [21]. For this study, we used heterozygous PDGFRαEGFP male mice (B6.129S4-Pdgfratm11(EGFP)Sor/J, Stock No. 007669, aged 6-7 weeks) and wild-type (WT) females of the same age, both procured from Jackson Laboratory (Bar Harbor, ME, USA). The PDGFRαEGFP mouse line carries an H2B-eGFP fusion gene under the control of the native Pdgfra promoter, resulting in fluorescence that mirrors the endogenous expression pattern of PDGFRα. Since homozygous expression of this gene leads to embryonic lethality, breeding was carried out using heterozygous PDGFRαEGFP males mated with WT females to ensure the production of viable offspring for genotyping and experimental purposes. For the experiments described in this study, six 12-week-old heterozygous PDGFRαEGFP females were utilized. All mice were housed under specific-pathogen-free conditions with a controlled 12-hour light-dark cycle at a temperature range of 20-24℃ and a humidity level of 50-60%. The mice had ad libitum access to food and sterile water. All animal experiments were performed according to ethical guidelines approved by the Gyeongsang National University Animal Care and Use Committee under protocol number (GNU-240527-M0112).
Hematoxylin and eosin (H&E) staining
Histological examination of ovarian tissues was conducted using H&E staining, following the protocol outlined in a previous study [23]. Ovarian tissues were fixed overnight at 4°C in 4% paraformaldehyde and then washed with 0.1 M PBS. The tissues were subsequently embedded in paraffin and sectioned into 5 μm-thick slices. The paraffin sections were air-dried on gelatin-coated slides, deparaffinized, and rinsed with tap water. The sections were stained with hematoxylin for 5 minutes, followed by staining with eosin for another 5 minutes. A graded series of ethanol (70% to 100%, each for 3 minutes) was used for dehydration, and sections were cleared with xylene. The slides were mounted using a Permount mounting medium (Fisher Chemical, Geel, Belgium). The stained sections were examined and photographed using an Olympus BX61VS microscope (Tokyo, Japan). To ensure consistency, five different sections from each sample were analyzed.
Immunohistochemistry (IHC)
Following deparaffinization, tissue sections were permeabilized with 0.1% Triton X-100 in PBS for 10 minutes at room temperature. After three washes with 1× PBS, sections were incubated for 60 minutes at room temperature in a blocking solution containing 1.5% bovine serum albumin (BSA) in 1× PBS. For KCNK3 detection, sections were incubated overnight at 4 °C with an Alexa Fluor® 405-conjugated anti-KCNK3 monoclonal antibody (1:200; Novus Biologicals, Centennial, CO, USA). After incubation, tissues were washed three times with cold 1× PBS and mounted using Gel/Mount™ (Biomeda Corp., Foster City, CA, USA). Images were captured using a confocal laser scanning microscope (Olympus). To assess co-localization of 17α-hydroxylase (CYP17A1) and PDGFRα, permeabilized ovarian sections were incubated overnight at 4 °C with an anti-CYP17A1 antibody (1:200; Santa Cruz Biotechnology, Dallas, TX, USA; sc-374244). After three 5-minute PBS washes, a fluorophore-conjugated secondary antibody (anti-mouse TEXAS Red, 1:500; Thermo Fisher Scientific, Carlsbad, CA, USA) was applied for 2 hours at room temperature. Sections were then rewashed in PBS (3 × 5 minutes), mounted with Gel/Mount™ (Biomeda Corp.) and visualized using confocal microscopy.
RNA isolation and quantitative real-time PCR
Mouse tissues were immediately frozen in liquid nitrogen upon collection and stored in a deep freezer until further use. For RNA extraction, the frozen tissues were homogenized in TRIzol reagent (Invitrogen, Thermo Fisher Scientific), and total RNA was isolated following the manufacturer's instructions. The isolated RNA was then reverse transcribed into complementary DNA (cDNA) using the RevertAid First Strand cDNA Synthesis Kit (Invitrogen), with oligo(dT) (18-mer) primers. The synthesized cDNA was used as a template for quantitative real-time PCR (qRT-PCR), performed with the amfiSure qGreen Q-PCR Master Mix (2X) (GenDEPOT, Altair, TX, USA). The specific primers used for the reactions are listed in Table 1. All qRT-PCR reactions were performed on a QIAquant 96 2plex system (Qiagen, Hilden, Germany). The relative expression levels of PDGFRα or KCNK3 were normalized to GAPDH and calculated using the 2-ΔΔCt method to determine fold changes.
Statistical analysis
Data are expressed as the mean ± standard deviation (S.D.). Group differences were evaluated using one-way ANOVA followed by post hoc Bonferroni correction, performed with OriginPro 2020 software (OriginLab Corp., MA, USA). A p-value < 0.01 was considered statistically significant.
3. Results
3.1. Dynamic expression patterns of PDGFRα in human and mouse tissues
To explore the expression patterns of PDGFRα across various human tissues, we visualized RNA-seq transcriptomic data from the GTEx BodyMAP obtained from the GTEx database. Using RNA-seq quantification tools available on the GTEx portal, we generated expression profiles of PDGFRα from a dataset comprising 1,000 human samples across 54 different organs and tissue types, such as female reproductive tissues, spleen, adipose tissue, respiratory system, gastrointestinal tract, kidney, urinary bladder, muscle tissues, proximal digestive tract, skin, pancreas, endocrine tissues, brain, male reproductive tissues, liver, and eyes (Figure 1A). Gene expression levels are quantified as transcripts per million (TPM). We specifically visualized PDGFRα expression in female reproductive tissues, including the ovary, endocervix, fallopian tube, endometrium of the uterus, ectocervix, vagina, and breast. The human ovary exhibited the highest normalized TPM (nTPM) levels (Figure 1B).
Similarly, we visualized Cap Analysis of Gene Expression (CAGE) data for PDGFRα expression across a range of mouse tissues from public datasets. These tissues included the uterus, urinary bladder, skin, ovary, vagina, adrenal gland, aorta, axillary lymph node, corpus striatum, epididymis, prostate gland, spinal cord, tongue, lung, cerebellum, cerebral cortex, corpora quadrigemina, diencephalon, eyeball (camera-type eye), hippocampus, medulla oblongata, stomach, olfactory brain, submandibular gland, spleen, intestine, colon, and vesicular gland (Figure 1C). These data indicate that PDGFRα expression is predominantly higher in female tissues, particularly in the ovary, compared to other tissue types in humans and mice. Moreover, expression levels in human reproductive organs were notably higher than in corresponding mouse tissues, such as the ovary and uterus.
Expression pattern of PDGFRα in PDGFRαEGFP mouse ovary
In the ovaries obtained from the PDGFRαEGFP mouse model, H&E staining revealed typical ovarian histology, including the presence of secondary follicles. Secondary follicles are characterized by multiple layers of granulosa cells and the cumulus oophorus (CO) surrounding the oocyte. Small fluid-filled spaces, indicating early antral formation, were also observed within these follicles. The theca interna around the granulosa cell layer was clearly visible, with no detectable pathological changes (Figure 2A, n = 3).
The PDGFRαEGFP mouse model is engineered to express EGFP in the nuclei of PDGFRα+ cells, allowing for the visualization of PDGFRα expression in various tissues. In this model, the EGFP signal indicates the presence of PDGFRα+ cells [18]. The fluorescence images (green) highlight the EGFP expression in the nuclei of PDGFRα+ cells. PDGFRα expression is predominantly observed in the thecal layer (TL) surrounding the granulosa cells in the stroma throughout the ovarian cortex. There is an absence of fluorescence in granulosa cells and oocytes (Figure 2B).
Co-localization of PDGFRα and KCNK3 in the ovary
Immunohistochemical analysis showed that KCNK3 is expressed in PDGFRα+ cells within the ovarian stroma (Figure 3A). In the negative control (NC), where the anti-KCNK3 antibody was omitted, only PDGFRα expression was observed in the stroma without KCNK3 expression (Figure 3A). Quantitative analysis showed that 90.2 ± 8.7% of PDGFRα+ cells also expressed KCNK3, indicating that most KCNK3+ cells are PDGFRα+ cells (Figure 3B, n = 4).
To determine the mRNA levels of PDGFRα in the ovary, quantitative PCR (qPCR) analysis was conducted and compared with the oviduct and uterus. The qPCR results indicated that PDGFRα expression in the ovary was lower than in both the oviduct and uterus. There was no significant difference in PDGFRα expression levels between the oviduct and uterus. Like PDGFRα, KCNK3 expression levels were lower in the ovary than in the oviduct and uterus (Figure 3C, p < 0.01). As shown in Figure 3D, PDGFRα was found to co-localize with 17α-hydroxylase (CYP17A1), a well-established marker of theca cells, in the thecal layer, supporting the presence of PDGFRα⁺ cells in this region. This finding confirms that a subset of theca cells expresses PDGFRα, suggesting its potential involvement in the steroidogenic function of these cells. The negative control (NC) showed no detectable non-specific staining, confirming the specificity of the immunostaining.
4. Discussion
This study analyzes PDGFRα expression patterns across various human and mouse tissues using publicly available datasets. RNA expression data from the Human Protein Atlas reveal distinct tissue-specific expression profiles for PDGFRα, with a predominant presence in female reproductive tissues, particularly in the ovary. Similarly, CAGE data for mice show that PDGFRα is predominantly expressed in female tissues, particularly in the uterus and ovary. However, the expression levels of PDGFRα in human reproductive organs, such as the ovary and uterus, were markedly higher than those observed in corresponding mouse tissues. These differences may reflect species-specific regulatory mechanisms and underscore the need for careful cross-species comparisons when interpreting gene expression data.
This study aimed to investigate the expression of PDGFRα in the mouse ovary using PDGFRαEGFP mice to assess whether PDGFRα is highly expressed in the ovary, though at lower levels compared to the human ovary. Histological analysis of the PDGFRαEGFP mouse model revealed a typical ovarian architecture indicative of normal ovarian development. Fluorescence imaging further demonstrated that PDGFRα expression was localized in ovarian cortex stromal cells, including the thecal layers. The lack of PDGFRα expression in granulosa cells and oocytes suggests that PDGFRα has a more specific role in the ovarian stromal compartment, particularly in the thecal cells, which are involved in steroidogenesis and follicle support. Previous studies have shown that PDGFRα is a gene specifically enriched in theca cells [24,25].
Theca cells play a critical role in folliculogenesis, contributing to several essential processes. They are primarily responsible for synthesizing androgens, which are converted into estrogens by granulosa cells, providing the hormonal support necessary for follicle development [26]. Theca cells also engage in crosstalk with granulosa cells and oocytes, facilitating communication and coordination during follicular growth. Additionally, they offer structural support to the growing follicle as it progresses through its developmental stages toward producing a mature, fertilizable oocyte. Theca cells are fundamental for follicular growth by supplying all the androgens needed for estrogen production, a key factor for follicle maturation. In follicles that successfully ovulate, theca cells undergo hormone-dependent differentiation to become luteinized thecal cells in the corpus luteum, contributing to progesterone production necessary for maintaining early pregnancy [26].
Ovarian stem/progenitor cells, crucial for folliculogenesis and tissue repair following ovulation, express PDGFRα. PDGFRα+ cells are specifically located in the interstitial compartment. LY6A+ and PDGFRα+ cells differentiate into steroidogenic cells expressing CYP11A1 and CYP17A1, primarily producing androgens and exhibiting characteristics similar to theca cells [27]. Our previous study observed PDGFRα expression in Leydig cells but not in germ or Sertoli cells [21]. These findings suggest that PDGFRα is closely linked to regulating androgenic hormone production, as Leydig and theca cells are key producers of testosterone.
KCNK3 channels, which co-localize with PDGFRα in Leydig cells, are also present in ovarian stromal cells, including theca cells, indicating a role for KCNK3 in androgen hormone production. Our previous study showed that KCNK3 is highly expressed in Leydig cells compared to Sertoli cells. In Leydig cells, blocking KCNK3 led to apoptosis, suggesting that KCNK3 activation is linked to cell proliferation [22]. KCNK3 is also the most prominently expressed K+ channel in mouse jejunal PDGFRα+ cells [18], exhibiting more hyperpolarized membrane potentials than smooth muscle cells in the gastrointestinal tract [28]. This suggests that KCNK3 channels may contribute to maintaining hyperpolarized membrane potentials in PDGFRα+ cells. The regulation of membrane potential and cell proliferation through KCNK3 is likely associated with androgen hormone regulation in PDGFRα+ cells, such as theca cells. Additionally, the co-expression of PDGFRα and KCNK3 in ovarian stromal cells suggests potential functional interactions between these two proteins in ovarian physiology.
Quantitative PCR analysis revealed that the expression levels of PDGFRα and KCNK3 were lower in the ovary than in the oviduct and uterus. This differential expression pattern suggests that while PDGFRα and KCNK3 play essential roles in the ovary, their functions may be more pronounced or have distinct regulatory roles in other reproductive tissues, such as the oviduct and uterus. The similar expression trends of PDGFRα and KCNK3 across these tissues support the idea of a coordinated regulatory mechanism that may be crucial for maintaining tissue-specific physiological processes, particularly in the female reproductive system. PDGFRα is likely expressed in fibroblasts and smooth muscle cells within the stroma of the fallopian tubes. It is also expected to be expressed in stromal cells, fibroblasts, and uterine smooth muscle cells in the uterus. This expression pattern may account for the higher levels of PDGFRα in the fallopian tubes and uterus compared to the ovaries. PDGFRα plays a crucial role in cell proliferation, tissue regeneration, and angiogenesis [29,30], suggesting that its expression may be significantly elevated under proliferative or pathological conditions of the endometrium. Additionally, KCNK3 could serve as a marker for PDGFRα+ cells and may also be involved in modulating the known functions of PDGFRα.
5. Conclusions
In conclusion, this study highlights the distinct expression patterns of PDGFRα across human and mouse tissues, with the ovary showing high expression in both species, although more pronounced in humans. In the PDGFRαEGFP mouse model, PDGFRα was localized primarily to thecal cells in the ovarian stroma, suggesting a role in steroidogenesis and follicular development. Additionally, significant co-localization of PDGFRα and KCNK3 in the ovary points to potential functional interactions in regulating reproductive physiology. These findings suggest that PDGFRα and KCNK3 play critical roles in ovarian function and may be involved in broader reproductive processes.
Author Contributions
Conceptualization, E.-A.K. and D.K..; methodology, S.H., C.-W.K., I.A.C., J.K.S., D.K.L., D.K.; software, B.A. and D.K.; validation, D.-K.L. and D.K.; formal analysis, S.K. and D.K.; investigation, B.A., E.-J.K., J.-M.K. and D.K.; data curation, D.K.; writing—original draft preparation, E.-A.K. and D.K.; writing—review and editing, D.K.; visualization, B.A. and D.K.; supervision, D.-K.L. and D.K.; project administration, E.-J.K.; funding acquisition, D.K. All authors have read and agreed to the published version of the manuscript.
Funding
This study was supported by the Basic Science Research Program through the National Research Foundation of Korea (RS-2023-00219399 to Dawon Kang and 2022R1F1A1062897 to Eun-A Ko) and the Glocal University 30 Project Fund of Gyeongsang National University in 2025.
Institutional Review Board Statement
The animal study was approved by the Institutional Ethics Committee of Gyeongsang National University (protocol code GNU-240527-M0112 and 2024.05.27).
Data Availability Statement
Publicly available transcriptomic datasets used in this study were obtained from the Genotype-Tissue Expression (GTEx) project (https://gtexportal.org/home/) and the FANTOM5 Cap Analysis of Gene Expression (CAGE) dataset (https://fantom.gsc.riken.jp/5/). The accession number for the GTEx data is phs000424.v8.p2. Additional experimental data generated during this study (e.g., qPCR, immunostaining) are available from the corresponding author upon reasonable request.
Conflicts of Interest
The authors declare no conflicts of interest.
Abbreviations
The following abbreviations are used in this manuscript:
| KCNK3 PDGFRα TASK-1 |
potassium two pore domain channel subfamily K member 3 Platelet-derived growth factor receptor alpha Tandem of P domains in a weak inward rectifying K+ channel-related Acid-Sensitive K+-1 |
References
- Heldin, C.H.; Westermark, B. Mechanism of action and in vivo role of platelet-derived growth factor. Physiol Rev 1999, 79, 1283–1316. [Google Scholar] [CrossRef]
- LaRochelle, W.J.; Jeffers, M.; McDonald, W.F.; Chillakuru, R.A.; Giese, N.A.; Lokker, N.A.; Sullivan, C.; Boldog, F.L.; Yang, M.; Vernet, C.; et al. PDGF-D, a new protease-activated growth factor. Nat Cell Biol 2001, 3, 517–521. [Google Scholar] [CrossRef] [PubMed]
- Li, X.; Ponten, A.; Aase, K.; Karlsson, L.; Abramsson, A.; Uutela, M.; Backstrom, G.; Hellstrom, M.; Bostrom, H.; Li, H.; et al. PDGF-C is a new protease-activated ligand for the PDGF alpha-receptor. Nat Cell Biol 2000, 2, 302–309. [Google Scholar] [CrossRef]
- Gray, K.; Eitzman, B.; Raszmann, K.; Steed, T.; Geboff, A.; McLachlan, J.; Bidwell, M. Coordinate regulation by diethylstilbestrol of the platelet-derived growth factor-A (PDGF-A) and -B chains and the PDGF receptor alpha- and beta-subunits in the mouse uterus and vagina: potential mediators of estrogen action. Endocrinology 1995, 136, 2325–2340. [Google Scholar] [CrossRef] [PubMed]
- Kypta, R.M.; Goldberg, Y.; Ulug, E.T.; Courtneidge, S.A. Association between the PDGF receptor and members of the src family of tyrosine kinases. Cell 1990, 62, 481–492. [Google Scholar] [CrossRef]
- Liu, Z.L.; Chen, H.H.; Zheng, L.L.; Sun, L.P.; Shi, L. Angiogenic signaling pathways and anti-angiogenic therapy for cancer. Signal Transduct Target Ther 2023, 8, 198. [Google Scholar] [CrossRef] [PubMed]
- Zymek, P.; Bujak, M.; Chatila, K.; Cieslak, A.; Thakker, G.; Entman, M.L.; Frangogiannis, N.G. The role of platelet-derived growth factor signaling in healing myocardial infarcts. J Am Coll Cardiol 2006, 48, 2315–2323. [Google Scholar] [CrossRef]
- Nilsson, E.E.; Detzel, C.; Skinner, M.K. Platelet-derived growth factor modulates the primordial to primary follicle transition. Reproduction 2006, 131, 1007–1015. [Google Scholar] [CrossRef]
- Pascuali, N.; Scotti, L.; Abramovich, D.; Irusta, G.; Di Pietro, M.; Bas, D.; Tesone, M.; Parborell, F. Inhibition of platelet-derived growth factor (PDGF) receptor affects follicular development and ovarian proliferation, apoptosis and angiogenesis in prepubertal eCG-treated rats. Mol Cell Endocrinol 2015, 412, 148–158. [Google Scholar] [CrossRef]
- Kezele, P.R.; Ague, J.M.; Nilsson, E.; Skinner, M.K. Alterations in the ovarian transcriptome during primordial follicle assembly and development. Biol Reprod 2005, 72, 241–255. [Google Scholar] [CrossRef]
- Shen, Y.; Xu, M.; Ren, L.; Li, X.; Han, X.; Cao, X.; Yao, J.; Yan, B. A novel retinoic acid drug, EYE-502, inhibits choroidal neovascularization by targeting endothelial cells and pericytes. Sci Rep 2023, 13, 10439. [Google Scholar] [CrossRef] [PubMed]
- Saddouk, F.Z.; Kuzemczak, A.; Saito, J.; Greif, D.M. Endothelial HIFalpha/PDGF-B to smooth muscle Beclin1 signaling sustains pathological muscularization in pulmonary hypertension. JCI Insight 2024, 9. [Google Scholar] [CrossRef] [PubMed]
- Redmer, D.A.; Doraiswamy, V.; Bortnem, B.J.; Fisher, K.; Jablonka-Shariff, A.; Grazul-Bilska, A.T.; Reynolds, L.P. Evidence for a role of capillary pericytes in vascular growth of the developing ovine corpus luteum. Biol Reprod 2001, 65, 879–889. [Google Scholar] [CrossRef]
- Fraser, H.M. Regulation of the ovarian follicular vasculature. Reprod Biol Endocrinol 2006, 4, 18. [Google Scholar] [CrossRef]
- Mattar, D.; Samir, M.; Laird, M.; Knight, P.G. Modulatory effects of TGF-beta1 and BMP6 on thecal angiogenesis and steroidogenesis in the bovine ovary. Reproduction 2020, 159, 397–408. [Google Scholar] [CrossRef]
- Pascuali, N.; Scotti, L.; Oubina, G.; de Zuniga, I.; Gomez Pena, M.; Pomilio, C.; Saravia, F.; Tesone, M.; Abramovich, D.; Parborell, F. Platelet-derived growth factor B restores vascular barrier integrity and diminishes permeability in ovarian hyperstimulation syndrome. Mol Hum Reprod 2020, 26, 585–600. [Google Scholar] [CrossRef] [PubMed]
- Gao, J.; Song, Y.; Huang, X.; Wang, D.; Wang, H. The expression of platelet-derived growth factor, epidermal growth factor, and insulin-like growth factor-II in patients with polycystic ovary syndrome and its correlation with pregnancy outcomes. Ann Palliat Med 2021, 10, 5671–5678. [Google Scholar] [CrossRef]
- Ha, S.E.; Lee, M.Y.; Kurahashi, M.; Wei, L.; Jorgensen, B.G.; Park, C.; Park, P.J.; Redelman, D.; Sasse, K.C.; Becker, L.S.; et al. Transcriptome analysis of PDGFRalpha+ cells identifies T-type Ca2+ channel CACNA1G as a new pathological marker for PDGFRalpha+ cell hyperplasia. PLoS One 2017, 12, e0182265. [Google Scholar] [CrossRef]
- Kim, D.; Cavanaugh, E.J.; Kim, I.; Carroll, J.L. Heteromeric TASK-1/TASK-3 is the major oxygen-sensitive background K+ channel in rat carotid body glomus cells. J Physiol 2009, 587, 2963–2975. [Google Scholar] [CrossRef]
- Talley, E.M.; Lei, Q.; Sirois, J.E.; Bayliss, D.A. TASK-1, a two-pore domain K+ channel, is modulated by multiple neurotransmitters in motoneurons. Neuron 2000, 25, 399–410. [Google Scholar] [CrossRef]
- Woo, M.S.; Kim, E.-J.; Lee, D.K.; Lee, C.E.; Ko, E.-A.; Kang, D. Analysis of platelet-derived growth factor receptor alpha expression in adult mouse testis. J Anim Reprod Biotechnol 2024, 39, 81–87. [Google Scholar] [CrossRef]
- Woo, M.S.; Kim, E.-J.; Prayoga, A.H.; Kim, Y.; Kang, D. Expression of TASK-1 channel in mouse Leydig cells. J Anim Reprod Biotechnol 2023, 38, 291–299. [Google Scholar] [CrossRef]
- Siregar, A.S.; Nyiramana, M.M.; Kim, E.-J.; Shin, E.-J.; Kim, C.-W.; Lee, D.; Hong, S.-G.; Han, J.; Kang, D. TRPV1 Is Associated with Testicular Apoptosis in Mice. J Anim Reprod Biotechnol 2019, 34, 7. [Google Scholar] [CrossRef]
- Abedel-Majed, M.A.; Romereim, S.M.; Davis, J.S.; Cupp, A.S. Perturbations in Lineage Specification of Granulosa and Theca Cells May Alter Corpus Luteum Formation and Function. Front Endocrinol (Lausanne) 2019, 10, 832. [Google Scholar] [CrossRef] [PubMed]
- Aoyama, M.; Shiraishi, A.; Matsubara, S.; Horie, K.; Osugi, T.; Kawada, T.; Yasuda, K.; Satake, H. Identification of a New Theca/Interstitial Cell-Specific Gene and Its Biological Role in Growth of Mouse Ovarian Follicles at the Gonadotropin-Independent Stage. Front Endocrinol (Lausanne) 2019, 10, 553. [Google Scholar] [CrossRef]
- Young, J.M.; McNeilly, A.S. Theca: the forgotten cell of the ovarian follicle. Reproduction 2010, 140, 489–504. [Google Scholar] [CrossRef]
- Wen, X.; Wang, J.; Qin, M.; Wang, H.; Xu, J.; Guan, X.; Shan, D.; Chen, P.; Xie, J.; Shao, J.; et al. Characterization of ovarian progenitor cells for their potential to generate steroidogenic theca cells in vitro. Reproduction 2024, 168. [Google Scholar] [CrossRef]
- Sanders, K.M.; Ward, S.M.; Koh, S.D. Interstitial cells: regulators of smooth muscle function. Physiol Rev 2014, 94, 859–907. [Google Scholar] [CrossRef]
- Solinc, J.; Ribot, J.; Soubrier, F.; Pavoine, C.; Dierick, F.; Nadaud, S. The Platelet-Derived Growth Factor Pathway in Pulmonary Arterial Hypertension: Still an Interesting Target? Life (Basel) 2022, 12. [Google Scholar] [CrossRef]
- Strell, C.; Rodriguez-Tomas, E.; Ostman, A. Functional and clinical roles of stromal PDGF receptors in tumor biology. Cancer Metastasis Rev 2024. [Google Scholar] [CrossRef]
Figure 1.
PDGFRα expression in human and mouse tissues based on public datasets. (A) Violin plot highlighting the top 15 tissue types with the highest PDGFRα expression levels in humans. (B) PDGFRα expression in seven female tissue types in humans. (C) Bar graph representing PDGFRα expression across 29 different tissue types in mice.
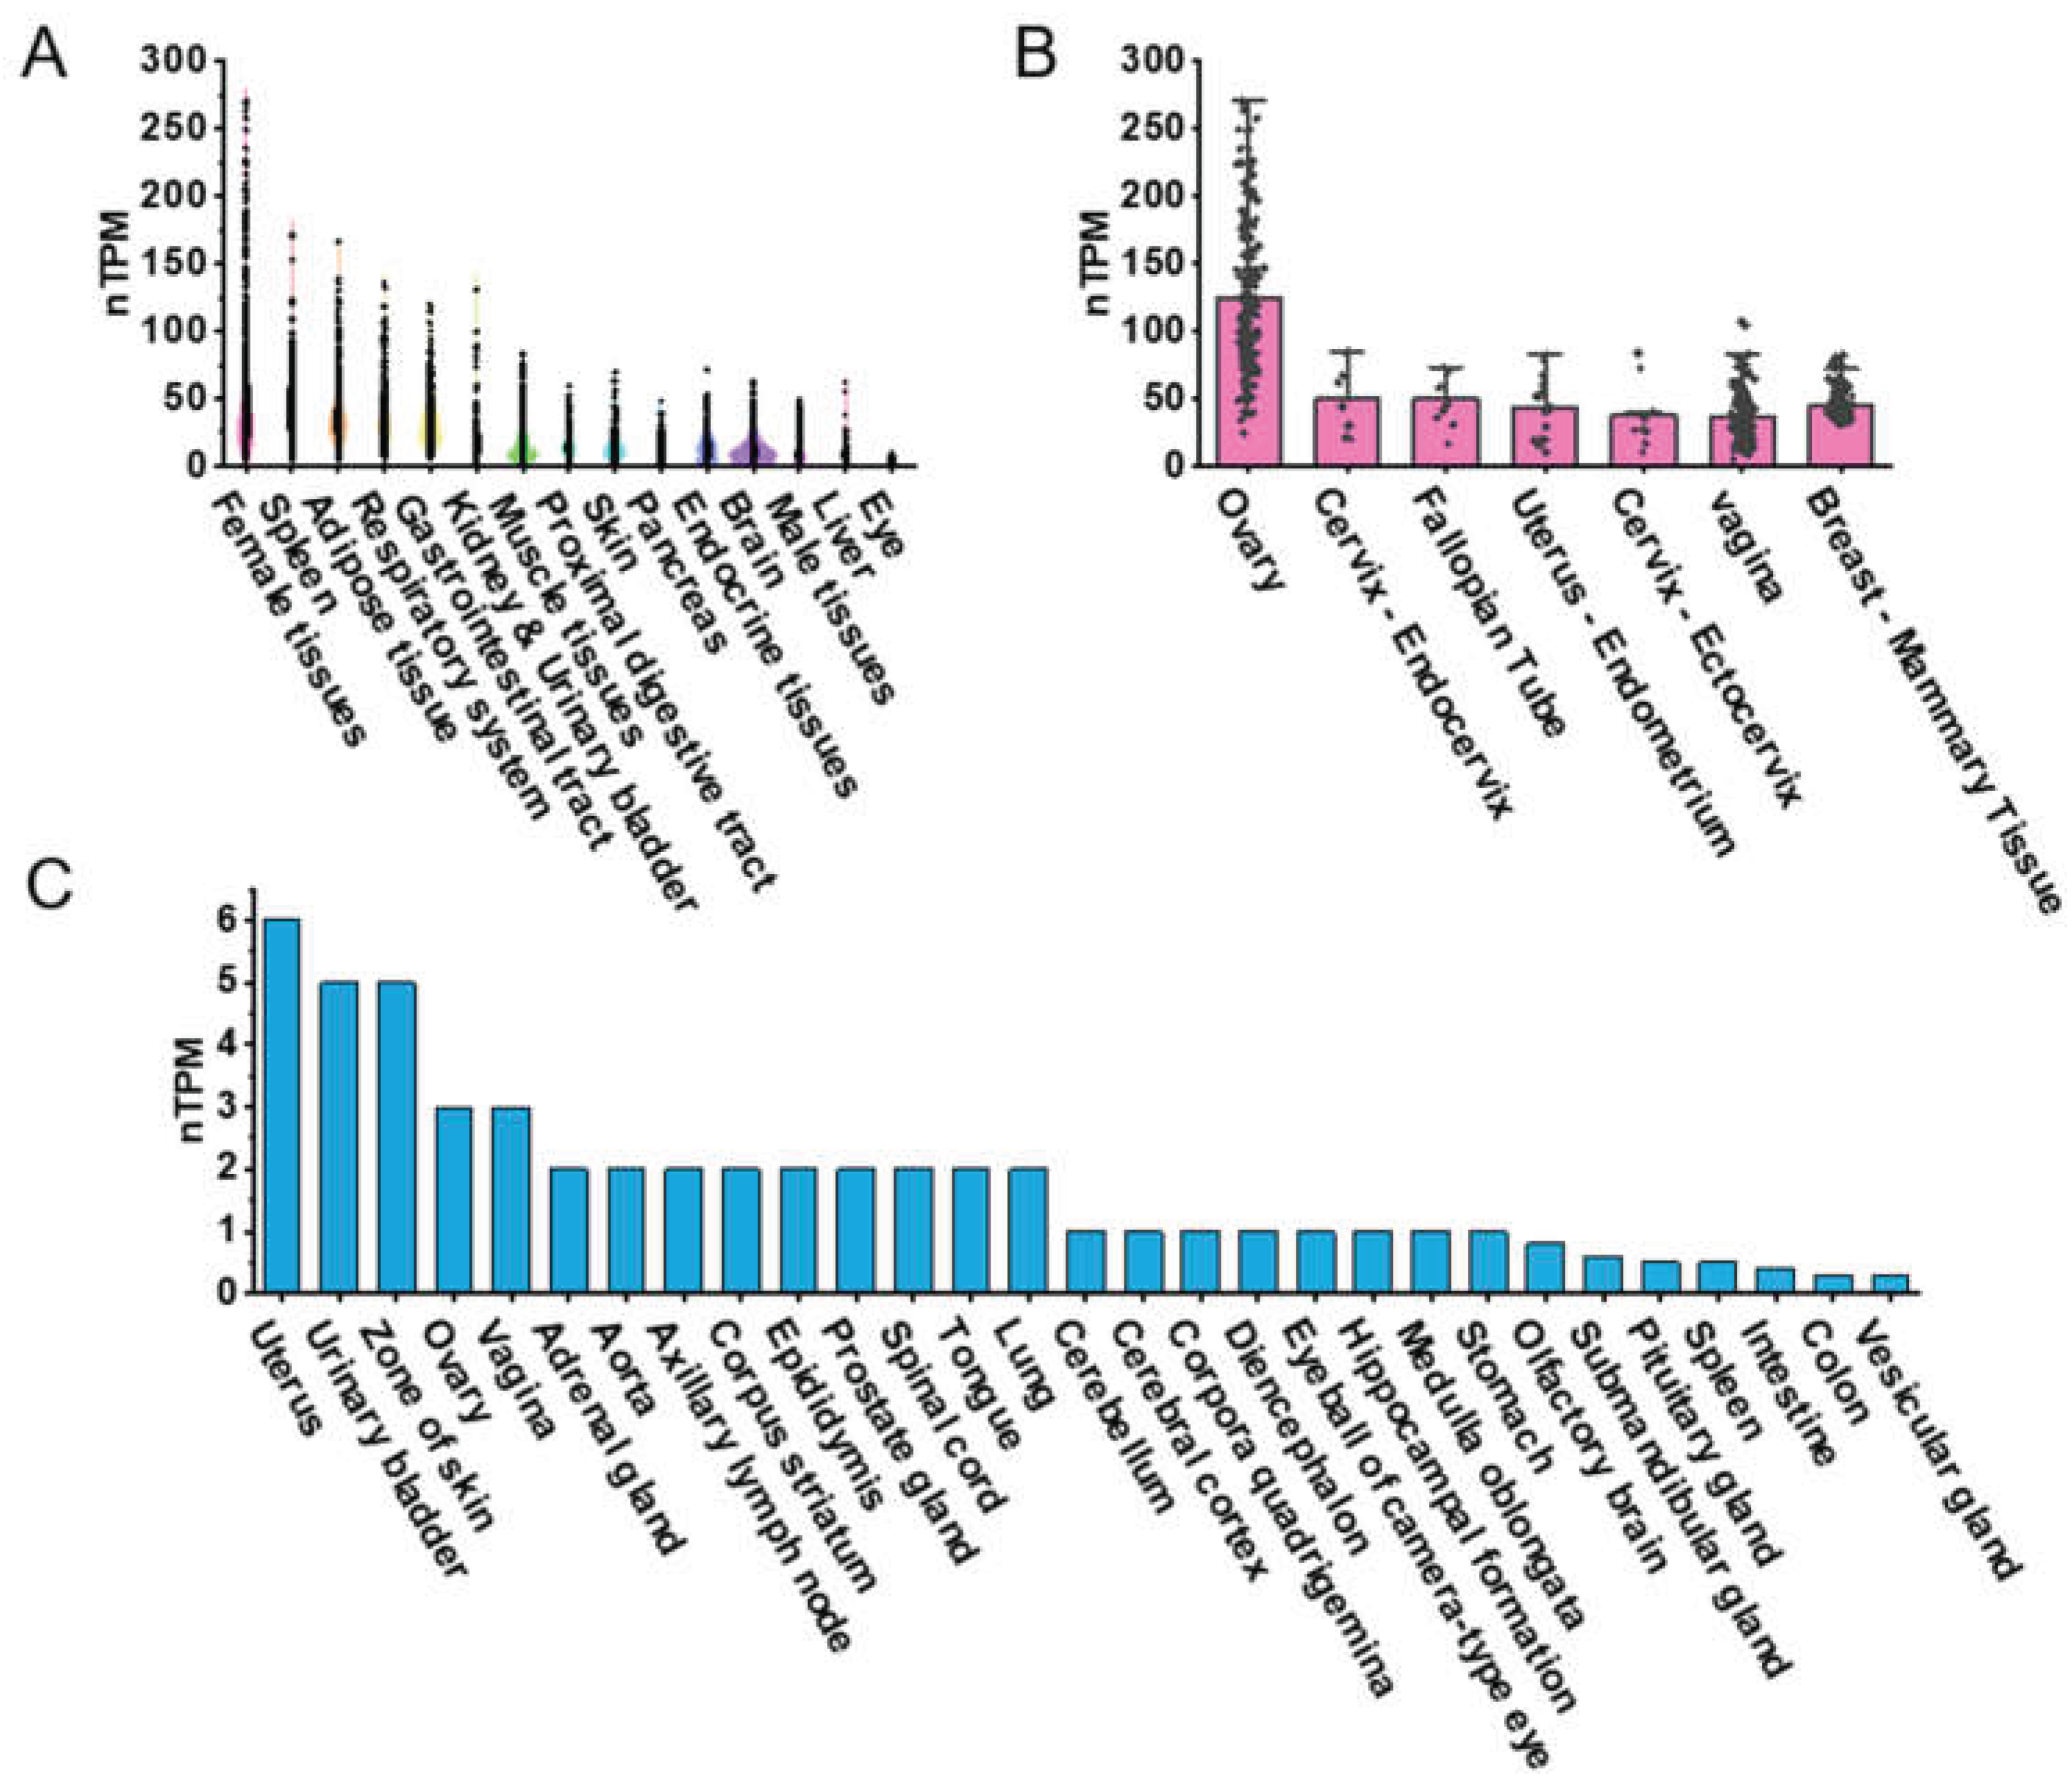
Figure 2.
Analysis of ovarian tissue sections from PDGFRαEGFP mice. (A) Hematoxylin and Eosin (H&E) stained image displaying the overall ovarian histology, with clearly identified secondary follicles (indicated by arrows). Granulosa cells (GL) surround the oocyte (O), along with the cumulus oophorus (CO). The theca layers (TL) surrounding the follicles are visible. FA represents the follicular antrum, and TA represents the tunica albuginea. NC represents the negative control, where no anti-KCNK3 antibody treatment was applied. Scale bar, 200 μm. (B) Fluorescent imaging of ovarian tissues from PDGFRαEGFP mice. The top panels show fluorescence imaging, and the bottom panels show corresponding brightfield images. Scale bar, 50 μm.
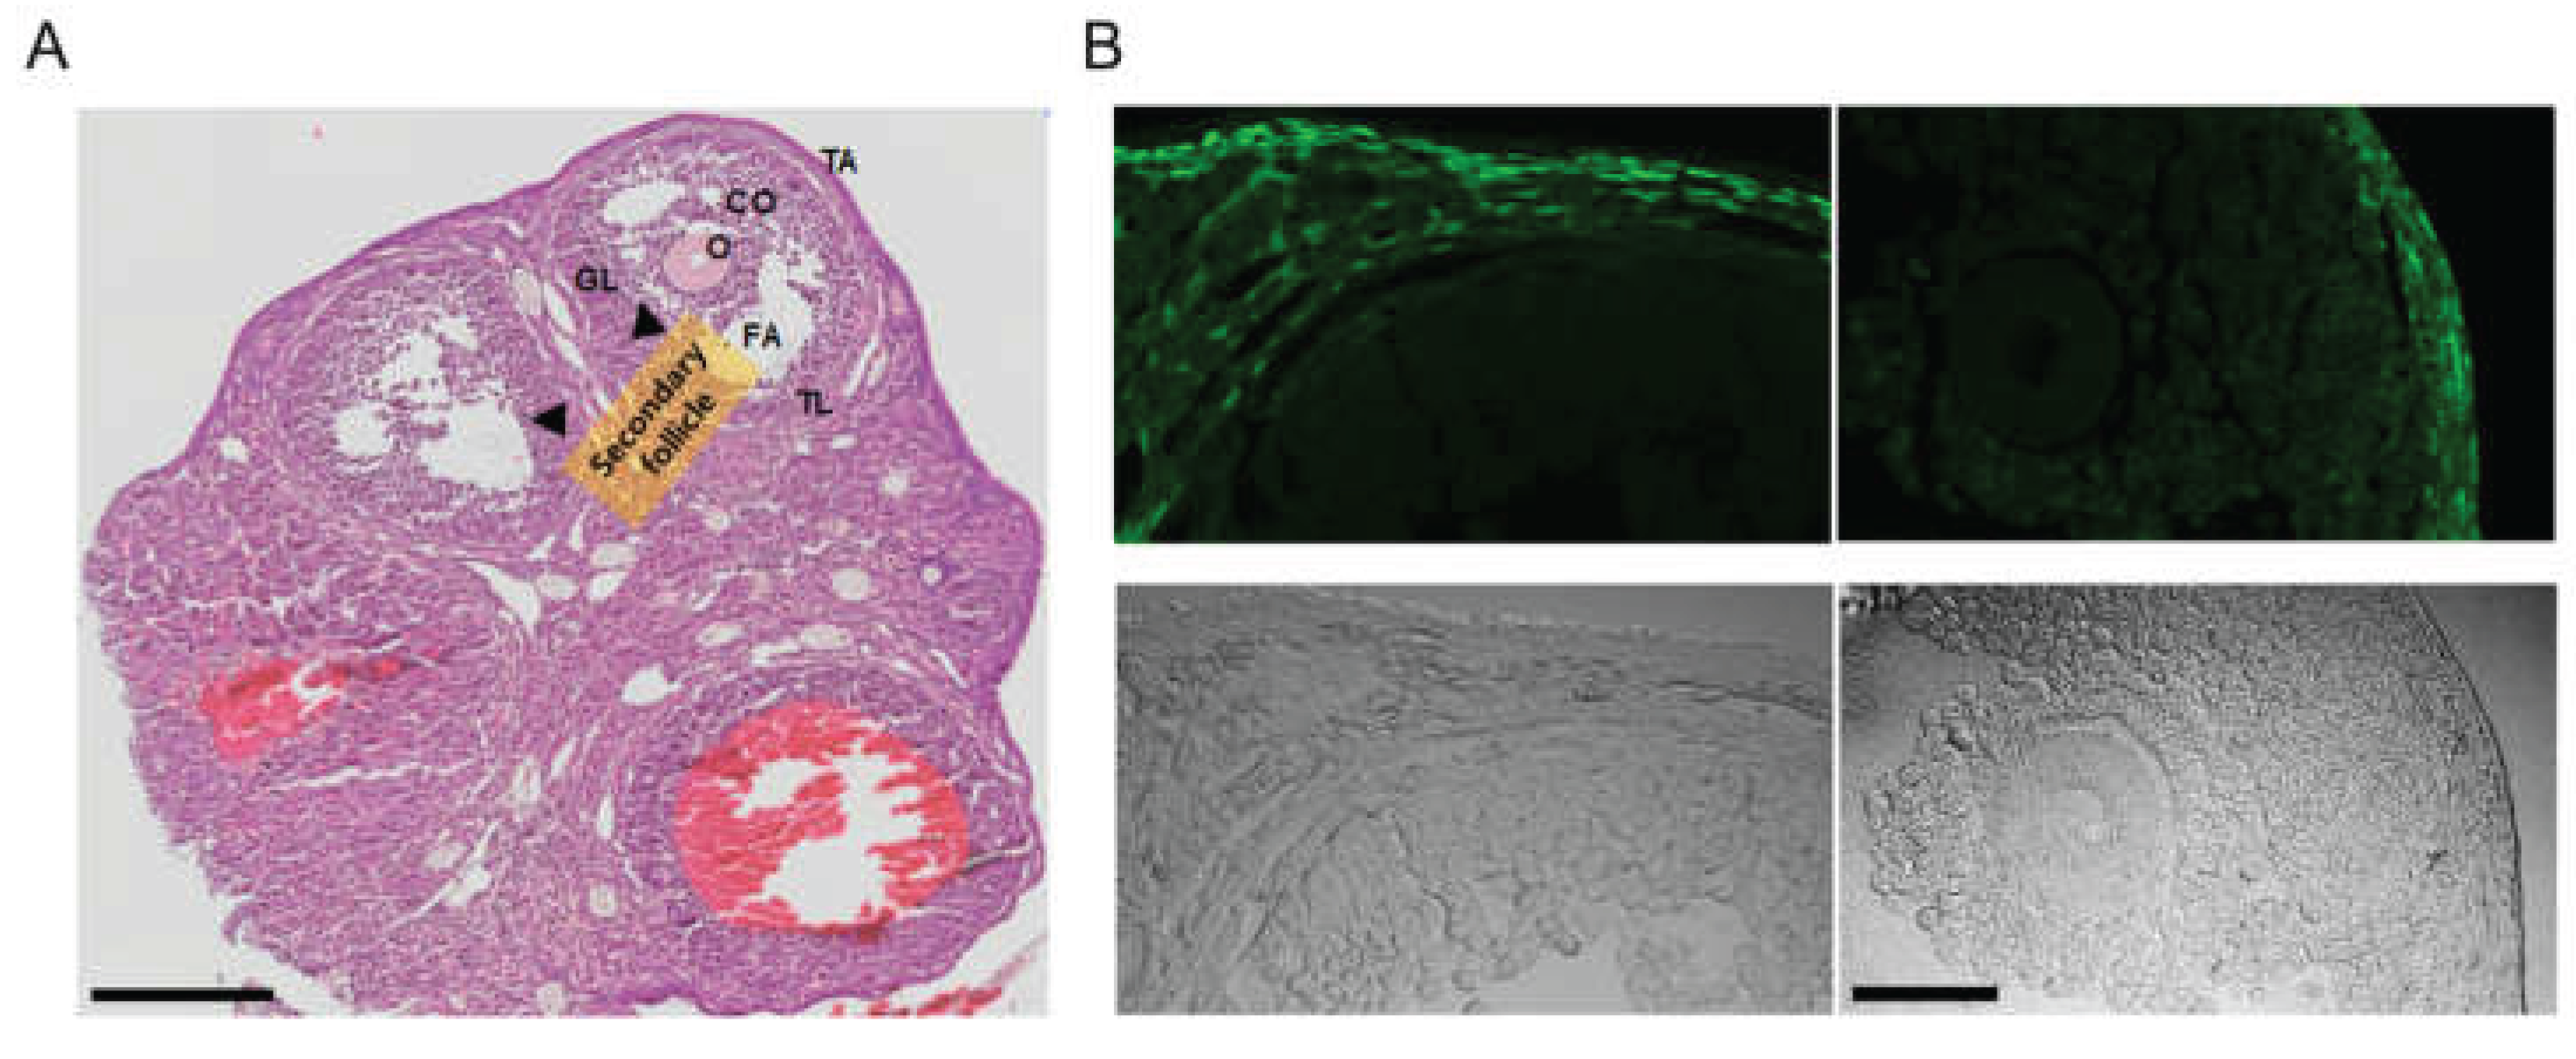
Figure 3.
Co-localization of KCNK3 and PDGFRα in ovarian tissue sections from PDGFRαEGFP mice. (A) Co-localization of PDGFRα (green) and KCNK3 (blue) in ovarian tissues. Merged and differential interference contrast (DIC) images are shown to visualize cell structure. Scale bar, 50 μm. (B) Bar graph showing the percentage of KCNK3 co-localization with PDGFRα+ cells. (C) PDGFRα and KCNK3 transcript expression levels in mice's ovary, oviduct, and uterus. Each bar represents the mean ± S.D. for four to eight samples. **p < 0.01 compared to the ovary. (D) Co-localization of PDGFRα and CYP17A1 in the thecal layer. PDGFRα (green) is expressed in ovarian stromal and thecal cells, while CYP17A1 (red) marks theca cells explicitly. Merged images indicate partial co-localization of PDGFRα and CYP17A1. DIC: Differential interference contrast image. NC: Negative control. Scale bar, 50 µm.
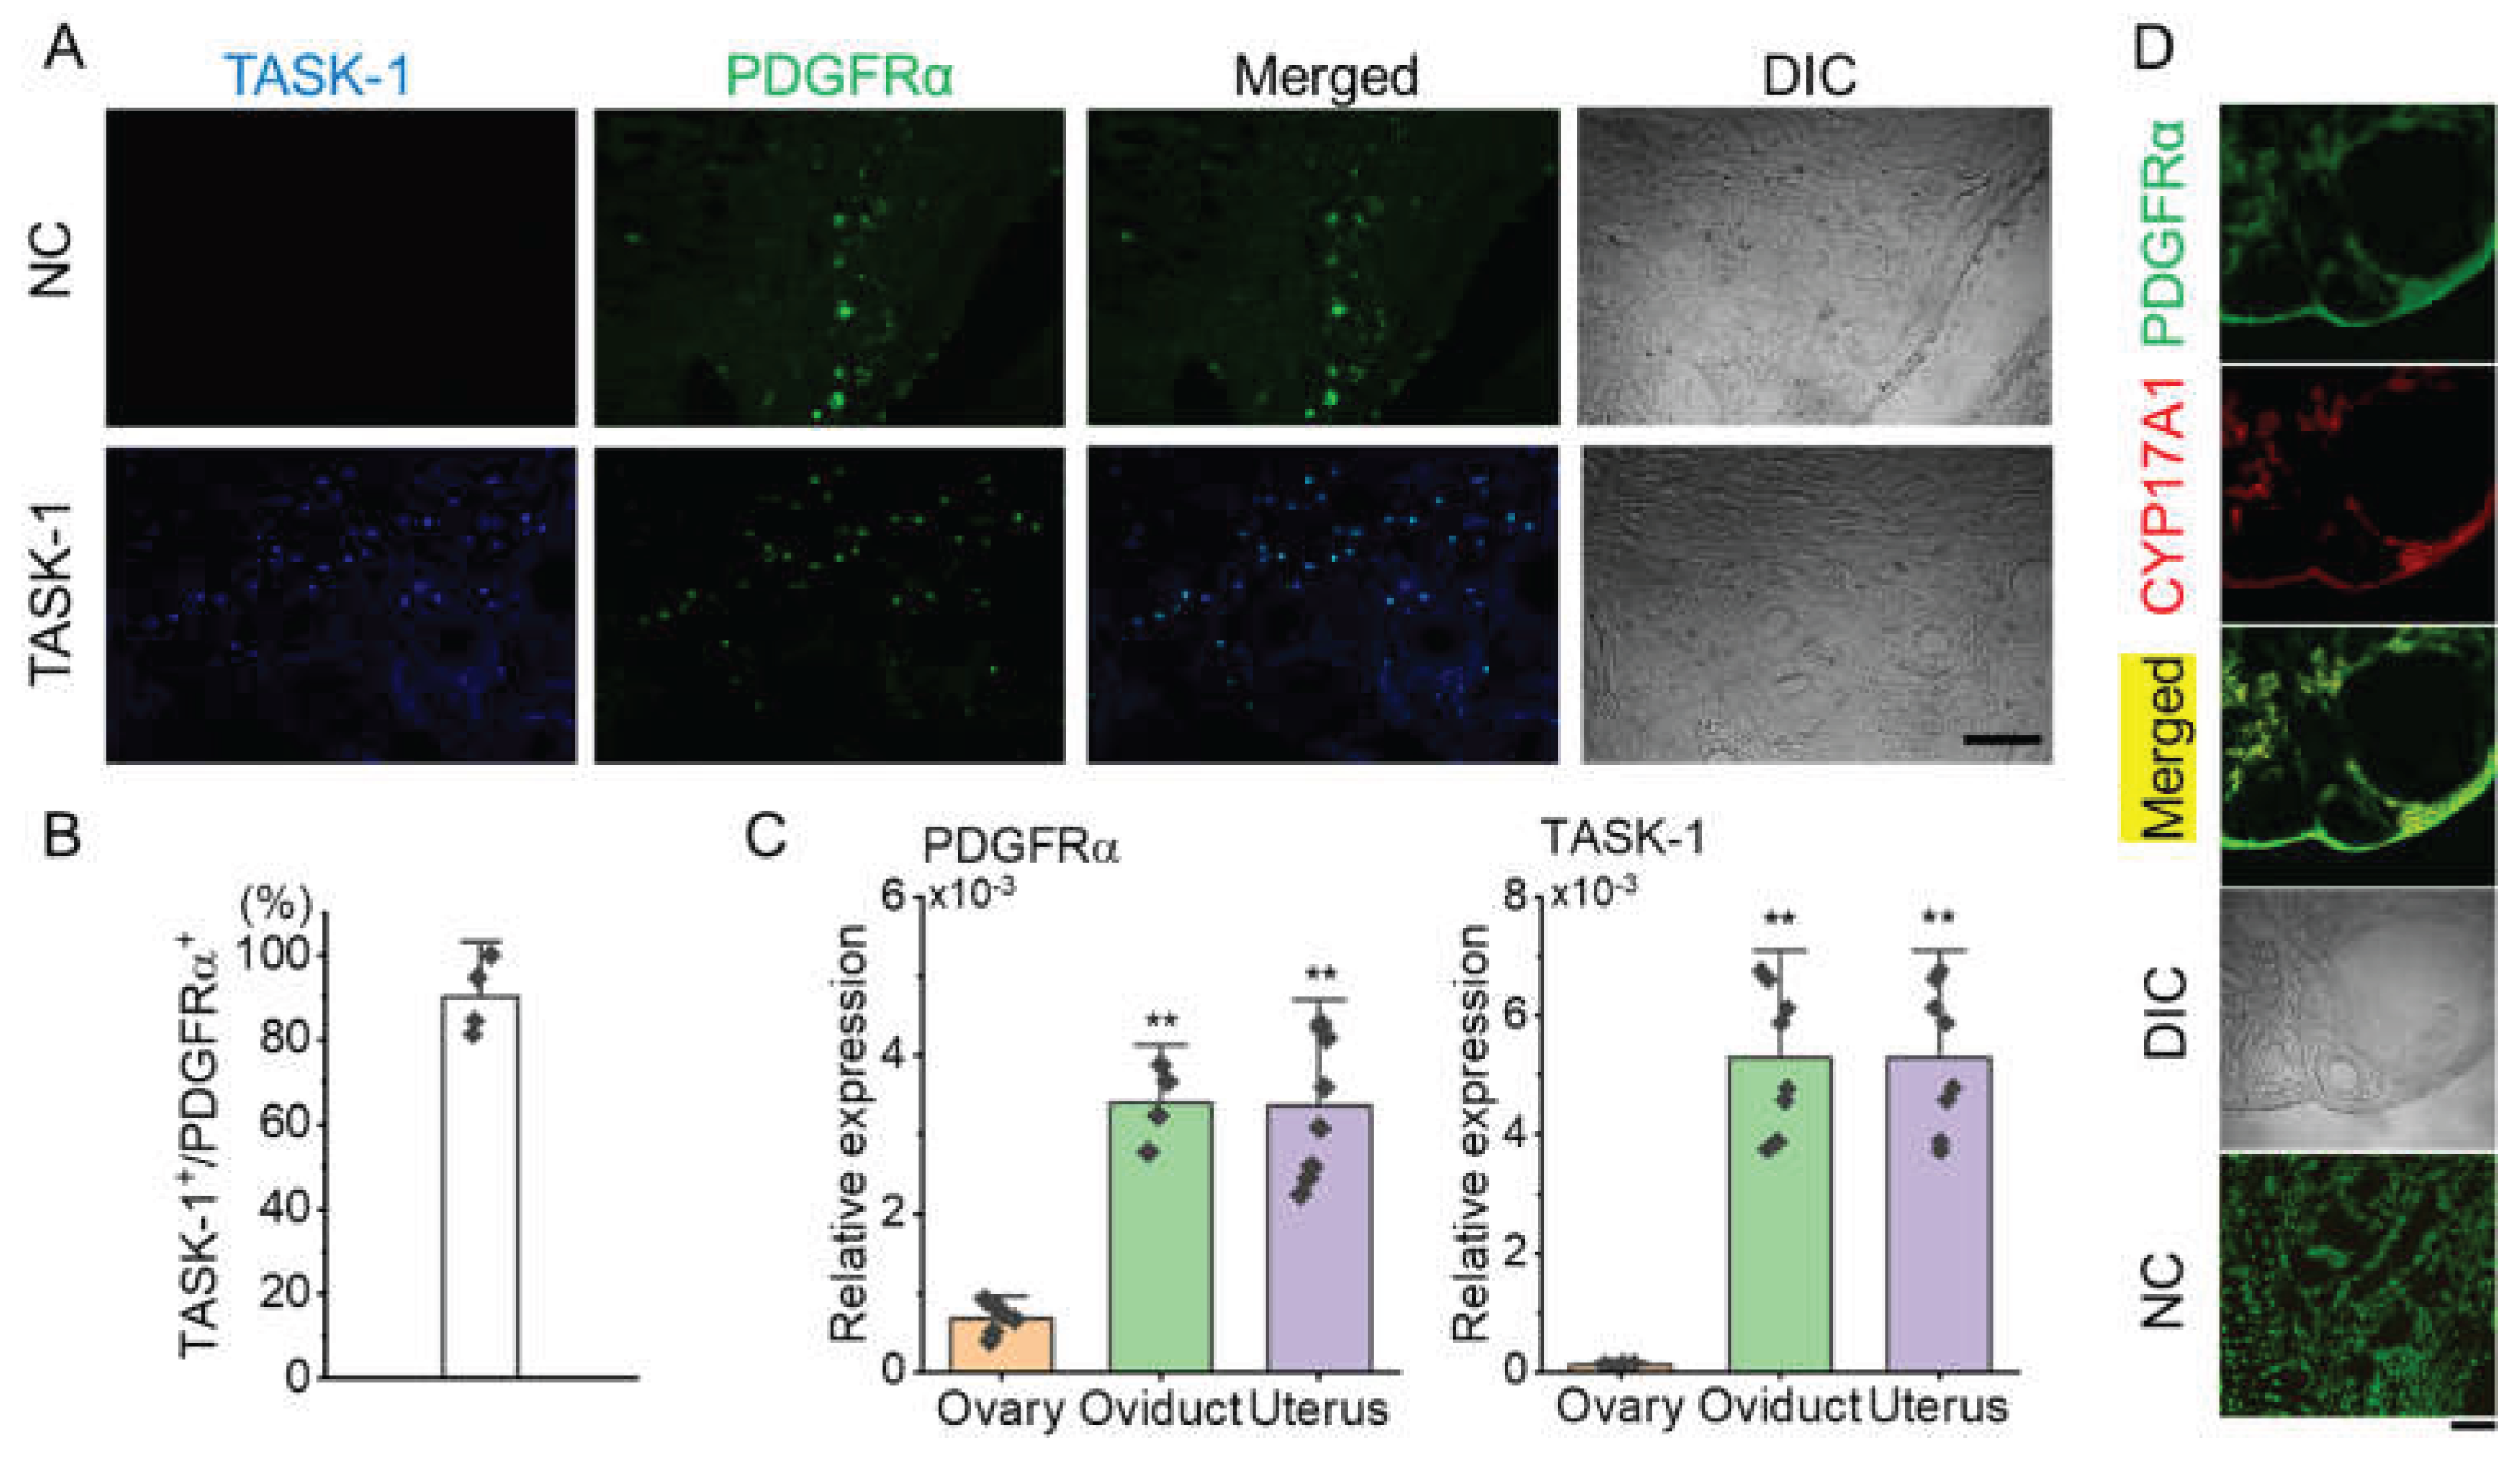

Table 1.
Primer sequences used for qPCR.
| Gene Name | Species | GenBank Accession Numbers |
Primer Sequences (5′–3′) | Expected size (bp) |
|---|---|---|---|---|
| Pdgfra | Mouse | BC053036.1 | F: TGCGGGTGGACTCTGATAATGC R: GTGGAACTACTGGAACCTGTCTCG |
235 |
| KCNK3 | Mouse | NM_001083316.2 | F: TCCTTCTACTTCGCCATCACC R: AGGCTCTGGAACATGACTAGTGT |
137 |
| Gapdh | Mouse | GU214026.1 | F: AC CAGAAGACTGTGGATGG R: CACATTGGGGGTAGGAACAC |
171 |
Disclaimer/Publisher’s Note: The statements, opinions and data contained in all publications are solely those of the individual author(s) and contributor(s) and not of MDPI and/or the editor(s). MDPI and/or the editor(s) disclaim responsibility for any injury to people or property resulting from any ideas, methods, instructions or products referred to in the content. |
© 2025 by the authors. Licensee MDPI, Basel, Switzerland. This article is an open access article distributed under the terms and conditions of the Creative Commons Attribution (CC BY) license (http://creativecommons.org/licenses/by/4.0/).
Copyright: This open access article is published under a Creative Commons CC BY 4.0 license, which permit the free download, distribution, and reuse, provided that the author and preprint are cited in any reuse.


