
Submitted:
06 June 2025
Posted:
09 June 2025
You are already at the latest version
Abstract
Bioactive glasses are known for their surface reactivity and ability to bond with bone tissue through the formation of hydroxyapatite. This study investigates the effects of substituting ultrapure water with natural geothermal waters from the Azores in the sol–gel synthesis of 45S5 and MgO-modified bioglasses. Using high-resolution X-ray photoelectron spectroscopy (XPS), we examined how the mineral composition of the waters influenced the chemical environment and network connectivity of the glass surface. The presence of trace ions such as Mg²⁺, Sr²⁺, Zn²⁺, and B³⁺ altered the silicate structure, as evidenced by binding energy shifts and peak deconvolution in O 1s, Si 2p, P 2p, Ca 2p, and Na 1s spectra. Thermal treatment further promoted polymerization and reduced hydroxylation. Our findings suggest that mineral-rich waters act as functional agents, modulating the reactivity and structure of bioactive glass surfaces in eco-sustainable synthesis routes.
Keywords:
X-ray photoelectron spectroscopy (XPS)
; sol-gel synthesis
; 45S5 bioactive glass
; geothermal waters
; surface and structural analysis
1. Introduction
Bioactive glasses are a class of biomaterials that have garnered significant attention for their ability to establish a strong bond with bone tissue through both mechanical interlocking and chemical integration. This biointegration is predominantly driven by the formation of a surface layer of hydroxyapatite (HA)—a calcium phosphate phase that closely resembles the mineral component of human bone—upon immersion in physiological fluids [1]. Since the development of Bioglass® 45S5—a quaternary system composed of 45%SiO₂-24,5%Na₂O-24,5%CaO-6%P₂O₅ (wt%)—in the 1960s, these materials have become central to regenerative medicine due to their ability to chemically bond with bone and promote osteogenesis [2]. The modification of 45S5 bioactive glass with MgO has been previously highlighted to modulate surface reactivity and enhance bioactivity [3]. During dissolution in physiological environments, 45S5 forms a silica-rich layer that facilitates the nucleation and growth of an apatite-like phase (Ca₁₀(PO₄)₆(OH)₂) at the glass-tissue interface. The kinetics of this process, and the quality of the resulting layer, are influenced by the glass’s chemical composition and network structure.
Mg, as an alkaline earth element, has been shown to enhance the bioactivity of bioactive glass systems by promoting hydroxyapatite formation, potentially through strong interactions with phosphate groups. Moreover, Mg²⁺ can act both as a network modifier—increasing non-bridging oxygens and altering dissolution rates—and, under some conditions, as a network former, affecting glass durability. For these reasons, MgO was incorporated into the 45S5 formulation in this study, to evaluate its impact on structural reorganization, surface chemistry (via XPS), and potential implications for bioactivity. This approach is supported by literature demonstrating that even small additions of MgO (1–5 mol%) can significantly affect the reactivity and biointegration performance of sol-gel derived bioglasses [3]. Surface chemistry and local bonding environments are critical factors that govern bioactivity. X-ray photoelectron spectroscopy (XPS) is therefore employed as a powerful tool to probe surface composition, chemical states, and subtle shifts in binding energies caused by ion incorporation and network modifications, providing insights into the mechanisms of biointegration.
A key feature of these glasses is their bioactivity, defined as the ability of a material to elicit a biological response that leads to the formation of a stable bond between tissue and the material surface. In vitro assessments of this property often focus on the material's capacity to form a polycrystalline layer of carbonated hydroxyapatite (HCA) when exposed to simulated body fluid (SBF), a feature formalized in ISO 23317 for the evaluation of medical implants [4,5]. The formation of this HCA layer not only promotes osteoblast adhesion and proliferation but also provides a conducive environment for subsequent mineralization and tissue ingrowth.
Advancements in bioactive glass research have emphasized the importance of composition and surface characteristics in modulating biological responses. In particular, sol-gel synthesis has emerged as a powerful route for producing highly porous glasses with tunable chemistry and high specific surface area, enhancing the rate and extent of HCA layer formation [6]. Traditionally, sol-gel methods employ ultrapure water and synthetic catalysts like HCl to hydrolyze metal alkoxides. However, emerging methods aim to simplify the synthesis process and introduce biofunctional elements using alternative, naturally enriched aqueous media [7].
Following previous work that demonstrated the viability of replacing distilled water with naturally occurring geothermal waters from Furnas (São Miguel Island, Azores, Portugal) in the sol-gel synthesis of bioactive glasses such as 45S5, 77S and 58S [7], the present study advances this concept by focusing exclusively on the surface structural effects observable by X-ray Photoelectron Spectroscopy (XPS). Rather than conducting in vitro bioactivity assays or engaging in multi-technique characterization, this work focuses exclusively on how the ionic composition of the synthesis water modifies the local chemical environment at the glass surface. Each water, with its distinct pH and trace element profile, has the potential to induce ion exchange, network disruption, and surface reorganization—phenomena that manifest in XPS core-level spectra as binding energy shifts, peak broadening, and asymmetry.
These mineral-rich waters, extensively characterized in [8], exhibit an acidic pH suitable for sol-gel catalysis [9] and contain major elements such as Na⁺, K⁺, Ca²⁺, Mg²⁺, SO₄²⁻, SiO₂, and Cl⁻. While elements like Na⁺ and Ca²⁺ play structural roles in modifying the glass network and dissolution kinetics, others such as SO₄²⁻ and Cl⁻ contribute to the ionic strength and reactivity of the synthesis medium. In addition to these major constituents, trace elements including Zn²⁺, Sr²⁺, Cu²⁺, Mn²⁺, B³⁺ and Li⁺ are present at low concentrations but are known to independently promote osteogenesis, angiogenesis, and antimicrobial activity [10]. These ions are summarized in Table 1 for their biofunctional relevance.
Among the waters tested, “Água Azeda” and “Água de Prata” were identified as particularly suitable for sol-gel synthesis, due to their moderately acidic pH (5.09 and 5.33, respectively) and higher concentrations of several biologically active ions [7,8].
Although the direct detection of these trace ions by XPS is limited due to their low surface abundance, their presence can still influence the local electronic structure. These effects manifest as subtle changes in core-level spectra—namely, binding energy shifts, peak broadening, or asymmetry in regions such as O 1s, Si 2p, Ca 2p, and Na 1s. High-resolution XPS is particularly sensitive to such alterations, making it a powerful tool for probing ion incorporation and network restructuring at the atomic scale. These structural effects are known to impact glass dissolution and, consequently, its bioactivity.
The structure of silicate glasses can be described using Qⁿ structural units, where Q represents a SiO₄ tetrahedral unit and n indicates the number of bridging oxygens (BO) per tetrahedron. There are five types of Qⁿ units, ranging from Q⁰ (no BO) to Q⁴ (four BO), each reflecting a different degree of network connectivity. Conventional glasses typically contain a high proportion of Q⁴ and Q³ units, which corresponds to a highly connected, three-dimensional network. Inverted glasses, including many bioactive glasses, are mainly composed of Q² chains terminated by Q¹ units, indicating a less connected and more open glass network. The relative abundance of Q² and Q³ units depends on the glass composition—especially the SiO₂ content—and the type of network modifiers (such as Ca²⁺, Na⁺, or Mg²⁺), which reduce the network connectivity by generating non-bridging oxygens (NBO). Although the theoretical network connectivity (NC) can be calculated from the glass composition, it does not fully account for the influence of these modifiers [21]. The structural and functional behavior of bioactive glasses is influenced not only by their chemical composition, but also by the distribution of electronic states and local bonding environments within the amorphous network. The network connectivity is defined as the average number of bridging oxygen (BO) atoms bound to a network-forming cation, where a BO atom is defined as an oxygen atom which is chemically bound to two network polyhedrons. Oxygen atoms which do not connect two network polyhedrons are called non-bridging oxygen (NBO) atoms [22]. The inclusion of network modifiers introduces variations in ionic field strength, coordination number, and local bond polarization, which influences the formation of non-bridging oxygens (NBOs), medium-range order, and the rigidity of the glass matrix. These changes modify the electronic structure and alter the electrostatic potential surrounding the core-level electrons. X-ray Photoelectron Spectroscopy (XPS) offers a sensitive probe into these atomic-scale phenomena by detecting shifts in binding energy, variations in full-width at half maximum (FWHM), and peak asymmetry—all signatures of local structural and electronic perturbations. This study therefore combines the chemical sensitivity of XPS with a physics-informed interpretation to uncover how sol-gel chemistry and ionic media influence the local atomic and electronic structure of bioactive glasses.
2. Materials and Methods
2.1. Materials
Bioactive glasses were synthesized via the sol-gel method using high-purity chemical precursors. Tetraethyl orthosilicate (TEOS, Si(OC₂H₅)₄, ≥98%, Sigma-Aldrich) was used as the silica source, while calcium nitrate tetrahydrate (Ca(NO₃)₂·4H₂O, ≥99%, Sigma-Aldrich) served as the calcium source. Triethyl phosphate (TEP, (C₂H₅O)₃PO, ≥99%, Sigma-Aldrich) was employed as the phosphorus precursor. Magnesium nitrate (Mg(NO₃)₂, ≥99%, Sigma-Aldrich) and sodium nitrate (NaNO₃, ≥99%, Sigma-Aldrich) were also used as sources of magnesium and sodium, respectively. All reagents were used as received, without further purification.
The aqueous media used for sol-gel hydrolysis included both deionized water (resistivity ≥18.2 MΩ·cm) and two naturally mineralized geothermal waters:
- Prata water, collected from a geothermal spring in the Furnas volcanic area (São Miguel Island, Azores), at UTM 649365 E / 4182020 N (WGS 84), and
- Azeda water, collected from a nearby spring within the same Furnas hydrothermal system, at UTM 649452 E / 4182034 N (WGS 84)
Both geothermal waters were freshly collected in sterile, acid-washed containers and stored at 4 °C until use. Prior to synthesis, the waters were passed through 0.22 µm sterile syringe filters (Nylon membrane, 0.22 µm pore size, 30 mm diameter; VWR International, Radnor, PA, USA), to remove suspended solids and microorganisms without altering the dissolved ionic content. No chemical adjustments were made, preserving their natural pH and composition. Figure 1 summarizes the chemical profiles of the waters, based on data previously characterized in [8], which were selected owing to their distinctive mineralogical composition and acidic pH values.
2.2. Geothermal Water Composition and Relevance to Sol-Gel Synthesis
Waters are naturally occurring from geothermal spring located in the Furnas volcanic complex, on São Miguel Island in the Azores archipelago (Portugal). This region is characterized by intense hydrothermal activity, resulting in a unique profile of mineral-rich acidic waters that emerge from deep volcanic aquifers [8].
2.2.1. Geochemical Context of Prata Water
Among the waters tested, Água de Prata presents a unique mineral profile that supports its use in the sol-gel synthesis of bioactive glasses. It exhibits a moderately acidic pH of 5.33, which remains compatible with acid-catalyzed sol-gel synthesis. Its mineral composition is notable for elevated levels of biologically relevant ions. Notably, it contains 25.3 mg/L of Sr²⁺, known to stimulate osteogenic activity, and 20.1 mg/L of Zn²⁺, with well-documented antibacterial and bone-healing properties. The water also provides 12 mg/L of Li⁺, potentially beneficial for neuroprotection and anti-inflammatory responses, and 22 mg/L of B³⁺, an element involved in cartilage and bone metabolism. While Fe (2200 mg/L) and Al (593 mg/L) concentrations are relatively high and may require monitoring for cytotoxicity, their presence reflects the deep geochemical processes active in this hydrothermal environment. The exceptionally high Mo content (867 mg/L)—the highest among all sampled waters—adds further interest, as molybdenum may influence redox regulation or enzymatic activity [10].
2.2.2. Geochemical Context of Azeda Water
Água Azeda, in contrast, exhibits stronger acidity and greater mineral complexity. It is renowned for its low pH, typically around 5.09. This strongly acidic environment is highly compatible with acid-catalyzed sol-gel synthesis and facilitates the incorporation of a broad range of ions into the glass matrix. Água Azeda stands out due to its exceptionally high content of Mg²⁺ (187 mg/L), a divalent cation known to enhance enzymatic activity and influence bone metabolism. It also contains B³⁺ (25 mg/L) and Zn²⁺ (17 mg/L), both of which contribute to bone health and antibacterial properties. The spring’s elevated Fe concentration (4560 mg/L) and Al levels (1010 mg/L) highlight the aggressive nature of the water, posing challenges in terms of potential cytotoxicity but also presenting opportunities for structural modification of the glass. Importantly, Água Azeda contains trace amounts of Mn²⁺, Cu²⁺, and Ba²⁺, elements that can contribute to redox modulation, antimicrobial effects, and potential cellular responses [10].
2.3. Synthesis of Bioactive Glasses: 45S5® and 45S5®/MgO
2.3.1. Sample Description
Four bioglass samples were synthesized and studied in this work:
- Sample 7: 45S5 synthesized using deionized water acidified with HCl (control);
- Sample 4: 45S5 synthesized with Água de Prata,
- Sample 4700: sample 4 subsequently heat-treated at 700°C;
- Sample 10: a modified formulation in which P₂O₅ in 45S5 was replaced by 6 wt% MgO.
2.3.2. Synthesis Procedure
The synthesis of 45S5® bioactive glass was conducted via the sol-gel method, employing deionized water (Di) as the control synthesis medium, alongside two distinct geothermal waters—Azeda and Prata. Precursor solutions were prepared following standardized weight percentages of SiO₂, CaO, Na₂O, and P₂O₅. Specifically, silicon tetraethoxide (TEOS) was hydrolyzed in an ethanol-water mixture, followed by the sequential addition of calcium nitrate, sodium nitrate, and triethyl phosphate (TEP). For the 45S5®/MgO formulation, magnesium nitrate was used in place of TEP to incorporate MgO. The resulting gels were dried at ambient conditions for 15 days and subsequently aged at 60 for 7 days to eliminate residual solvents. Only Sample 4 was further subjected to thermal treatment at 700°C for 2 hours to achieve vitrification.
Samples synthesized with Água de Prata yielded transparent gels and glasses, demonstrating greater compatibility with the original 45S5® formulation when compared to those prepared with geothermal waters. In contrast, samples prepared with Água Azeda exhibited increased translucency and improved performance when incorporated into the 45S5® formulation containing 6 wt% MgO. The synthesis process is schematically illustrated in Figure 2.
2.4. XPS
X-ray photoelectron spectroscopy (XPS) analyses were performed on the glass samples using an ESCALAB 250 spectrometer equipped with dual anode sources (Al/Mg), operated with a monochromatic Al Kα radiation source (photon energy hν = 1486.6 eV). The XR5 Gun was configured with a 500 μm spot size, operating at 15 kV and 150 W. To compensate for surface charging effects inherent to dielectric materials, a low-energy electron flood gun was employed during acquisition. Prior to high-resolution spectral acquisition, surface contaminants were removed via ion sputtering using a 3 keV Ar⁺ beam for 5 minutes. All measurements were conducted under ultra-high vacuum (UHV) conditions, with the analysis chamber pressure maintained below 8 × 10⁻⁹ mbar to minimize scattering of emitted photoelectrons. The spectra were calibrated by setting the binding energy of the C 1s peak to 284.8 eV [23]. XPS spectra were acquired with a step size of 1.0 eV for survey scans and 0.1 eV for high-resolution scans. Survey spectra were collected with a pass energy of 150 eV, while all high-resolution spectra — including those corresponding to the O 1s, Si 2p, P 2p, Na 1s, Ca 2p, and Mg 1s regions — were obtained using a pass energy of 20 eV. Elemental identification in the survey spectra was carried out using the XPS Peak 4.1 software. Peak fitting and spectral analysis were conducted in Origin17® software, using manual baseline correction and Gaussian function fitting. Due to the limited inelastic mean free path of photoelectrons, XPS is inherently surface-sensitive, providing compositional and chemical state information of the outermost layers of the glass surface.
3. Results and Discussion
3.1. XPS Analysis
In order to interpret the surface chemistry of the synthesized glasses, XPS data were analyzed following a systematic workflow (Figure 3) comprising two main stages. First, wide-range survey spectra were acquired to identify the elemental composition of each sample, detect any surface contaminants, and highlight differences related to the use of distinct water sources and synthesis conditions. This provided an overview of the chemical elements present on the surface and served as a baseline for deeper investigation. Second, high-resolution spectra of selected core levels — including O 1s, Si 2p, P 2p, Ca 2p, Na 1s, and, where applicable, Mg 1s — were collected and subsequently analyzed in detail. This included side-by-side comparison, spectral overlay, and deconvolution into individual chemical environments, allowing for the identification of shifts in binding energy, peak broadening, and changes in chemical state indicative of structural rearrangements or ion substitution. The results of this multi-step analysis are presented in the following sections and discussed in relation to the ionic profile and mineral complexity of the synthesis waters employed.
3.1.1. Survey
Survey XPS spectra of the sol-gel-derived bioactive glasses synthesized with different water sources reveal significant compositional and structural distinctions among the samples. All spectra show characteristic peaks of the main glass constituents—O 1s, Si 2p, P 2p, Ca 2p, and Na 1s—along with minor signals associated with synthesis reagents or trace elements introduced through the synthesis media. Variations in peak intensity, shape, symmetry, and full-width at half maximum (FWHM) reflect differences in both elemental distribution and the degree of local atomic ordering, network relaxation, and electronic environment [24]. These spectral features provide insight into the effects of water composition and synthesis conditions on the surface chemistry and physical structure of the materials, as illustrated in Figure 4.
In Sample 7, synthesized with deionized water (as a reference for the traditional 45S5 sol-gel glass), the survey spectrum presents the expected major peaks, including a strong O 1s signal at ~532.8 eV, narrow and intense Si 2p (~103.4 eV), a well-resolved Ca 2p doublet (~347.0 / 350.6 eV), and a symmetric P 2p at ~133.5 eV. A pronounced Na 1s peak at ~1072 eV further confirms good retention of this network modifier. In addition to these, Sample 7 uniquely exhibits two additional peaks in the low binding energy region: one near ~198 eV and another between ~155–165 eV. The former is attributed to Cl 2p, resulting from the HCl used to catalyze the sol-gel reaction. Its presence suggests incomplete removal of chloride species during drying or gelation. The second low-energy feature may stem from a Cl Auger satellite or minor sulfur species (e.g., S 2p), potentially introduced via reagent impurities or laboratory atmosphere [25]. Most notably, Sample 7 shows a distinct N 1s signal at ~400 eV—absent or weak in the other samples—corresponding to surface-bound nitrate (NO₃⁻) from the sodium and calcium nitrate precursors [26]. Since the synthesis used deionized water, lacking competing multivalent cations, electrostatic stabilization of these anions on the surface is enhanced, unlike in mineral water-based samples, where ionic exchange processes with cations like Mg²⁺ and Ca²⁺ may suppress nitrate adsorption. Together, these features confirm that even in a nominally “clean” system, reagent-derived anions can leave detectable surface residues.
Sample 4, synthesized with Água Prata, exhibits survey features closely resembling Sample 7, including strong O, Si, Ca, and P signals, but with slightly broadened Na 1s and O 1s peaks. This subtle broadening may be attributed to modifications in the local coordination environment or minor electronic redistribution induced by trace elements in the geothermal water. This suggests some ionic interaction from trace elements present in the geothermal water, but without major perturbation of the glass network.
Notably, no Cl or N peaks are observed, indicating more complete removal or displacement of these species. The absence of Mg-related peaks confirms the moderate ionic profile of Água Prata.
In Sample 4700—also synthesized with Água Prata but subjected to thermal treatment—the survey spectrum shows sharper and more intense Si 2p and Ca 2p peaks, consistent with increased network ordering and densification. The O 1s peak is more symmetric, indicating a greater fraction of bridging oxygens (BOs) [22,27]. These changes not only reflect improved structural ordering but also suggest a redistribution of bonding environments and local charge density. No residual Cl or N peaks are present, reinforcing the effect of both ionic balance in the water and heat-induced structural reorganization in reducing surface contamination.
In stark contrast, Sample 10—synthesized with highly mineralized Água Azeda and MgO addition—displays clear differences. A strong Mg 1s peak near ~1303 eV is exclusive to this sample, confirming magnesium incorporation. The Na 1s peak is strongly attenuated, likely due to ion exchange with Mg²⁺ and other multivalent cations (e.g., Fe³⁺, Zn²⁺) abundant in Água Azeda. The Ca 2p and P 2p peaks are both broadened and reduced in intensity, suggesting partial substitution or interference by competing cations. These spectral shifts also imply modification of the local electrostatic environment around core-level electrons and changes in bonding symmetry [24].
The O 1s peak exhibits significant asymmetry, reflecting increased presence of non-bridging oxygens (NBOs) and disrupted silicate-phosphate network connectivity. Altogether, these features suggest that Sample 10 underwent physical reorganization of its short- and medium-range structure, with consequences for both chemical composition and electronic structure at the surface. These changes are typical of glasses undergoing modifier ion substitution [28,29], where foreign multivalent cations displace native Na⁺/Ca²⁺ species, leading to altered local environments.
The survey spectra strongly suggest that the synthesis water composition and thermal treatment influence the surface chemistry of the glasses. Deionized water tends to yield a compositionally cleaner surface, although enriched in Cl⁻ and NO₃⁻, likely stemming from precursor residues. Água Prata appears to introduce trace elements with potential benefits and, when combined with thermal treatment, enhances structural definition. Água Azeda, on the other hand, promotes marked structural changes, seemingly through extensive ion exchange involving magnesium, leading to a spectral signature with modifier depletion and increased network disorder.
3.1.2. O 1s Core-Level Analysis
The O 1s core-level spectra of the four samples were carefully analyzed to investigate the chemical environment of oxygen atoms and assess the influence of water composition and thermal treatment on glass structure. As shown in Figure 5, all samples display a dominant O 1s peak centered between ~531.0 and 532.8 eV, primarily reflecting contributions from bridging oxygens (BOs, e.g. Si–O–Si) and non-bridging oxygens (NBOs, such as Si–O⁻), associated with network modifiers like Na⁺, Ca²⁺, and Mg²⁺ [22]. The overlaid spectra in Figure 6 allow direct comparison of peak position, shape, and asymmetry.
Sample 7, synthesized with deionized water, serves as a reference since it shares the same base composition as Samples 4 and 4700. It exhibits the broadest and most symmetric O 1s peak, centered at the lowest binding energy among all samples. This shape suggests a relatively balanced distribution of BOs and NBOs, and a structurally homogeneous network with diffuse local disorder typical of sol-gel-derived glasses in the absence of ionic perturbation. Sample 4, synthesized with Água Prata, presents a narrower and slightly asymmetric peak with a mild shoulder at lower binding energies. Although compositionally equivalent to Sample 7, the difference in water source likely introduced ionic species (e.g., Sr²⁺, Zn²⁺) that mildly perturbed the network, increasing the fraction of NBOs and slightly altering the electronic environment. These cations replace native Na⁺ and Ca²⁺ network modifiers, increasing structural disorder and reactivity [30]. Sample 4700, also synthesized with Água Prata but subjected to thermal treatment, displays a more pronounced left-side asymmetry, with a higher binding energy maximum. Instead of the expected narrowing due to densification, the appearance of a distinct shoulder at lower energies suggests persistent structural heterogeneity or the generation of new reactive oxygen environments. These may arise from partial network relaxation or residual reorganization processes post-heating. Finally, Sample 10, which differs from the others by replacing P₂O₅ with MgO in its composition and using Água Azeda, shows a peak shape similar to that of Sample 4. The O 1s envelope is slightly asymmetric toward lower binding energies, suggesting a moderate level of NBOs. The absence of phosphate simplifies the spectrum, while the presence of Mg²⁺ and waterborne ions may contribute to local structural variations, although not to the same extent as seen in thermally treated samples.
The observed variations in O 1s peak shape and width across samples reflect differences not only in network connectivity and modifier content but also in local bonding symmetry and electronic charge distribution. The position of the O 1s maximum shifts between samples, with Sample 4700 at the highest binding energy and Sample 7 at the lowest, indicating changes in the average oxygen bonding environment. The peak asymmetry, particularly in Samples 4 and 4700, reflects the degree of non-bridging oxygen formation and structural perturbation linked to both water composition and post-synthesis treatment. The spectra reveal how even subtle differences in synthesis conditions modulate the network structure, with mineral water-derived ions and thermal effects playing distinct roles in disrupting or modifying the silicate framework.
To further clarify the structural differences, the O 1s spectra were deconvoluted. This analysis resolves the total peak into components typically attributed to bridging oxygens (BO), non-bridging oxygens (NBO), and, in some cases, minor contributions from surface hydroxyls or adsorbed species.
The deconvoluted O 1s spectra, shown in Figure 7 and summarized in Table 2, reveal distinct differences in the relative contributions of bridging oxygens (Si–O–Si), non-bridging oxygens (Si–O⁻), and surface hydroxyl groups (Si–OH) across the samples, reflecting the impact of synthesis conditions and thermal treatment.
Sample 4, synthesized with Água Prata, displays a dominant Si–OH contribution (68.4%), accompanied by a relatively small fraction of Si–O⁻ (16.3%) and a minor Si–O–Si component (15.3%). This distribution suggests a highly disrupted silicate network, likely due to the presence of multivalent cations (e.g., Sr²⁺, Zn²⁺) introduced by the mineral water, which promote the formation of terminal –OH and NBOs at the expense of network connectivity. Upon thermal treatment (Sample 4700), this distribution changes dramatically: the Si–O–Si fraction becomes predominant (77%), with Si–OH reduced to 21% and Si–O⁻ nearly absent (2%). This shift reflects significant network densification and re-polymerization upon heating, as hydroxyl groups condense to form bridging linkages, decreasing reactivity and hydroxylation, and the glass matrix becomes more ordered.
In contrast, Sample 7, prepared with deionized water, exhibits a very high Si–OH content (75%) and a moderate amount of Si–O–Si (25%), characteristic of sol–gel glasses that remain hydrated and structurally open due to the absence of ionic modifiers.
Sample 10, with a distinct formulation (replacement of P₂O₅ by MgO) and synthesized using Água Azeda, shows a near balance between Si–OH (49.2%) and Si–O–Si (50.8%), suggesting moderate hydroxylation and structural polymerization. The lack of a distinct Si–O⁻ peak may result from a reduced presence of strong network modifiers or a different ion distribution associated with Água Azeda. The spectrum remains similar in shape to Sample 4, but the reduced hydroxyl signal and absence of NBOs indicate a more ordered network.
3.1.3. Si 2p Core-Level Analysis
High-resolution Si 2p spectra were analyzed to assess the structural state of silicon within the glass network and its response to variations in synthesis conditions. As shown in Figure 8, all samples exhibit a primary Si 2p peak centered near ~103.4 eV, characteristic of silicon in fully oxidized tetrahedral coordination (Si⁴⁺) within SiO₄ units. The overlaid spectra in Figure 9 highlight differences in peak sharpness and subtle shifts in binding energy, reflecting variations in silicate network connectivity and local electronic environments.
Samples 4, 4700, and 10 exhibit narrow and well-defined Si 2p peaks, indicating relatively ordered silicon environments and a higher degree of network polymerization. These findings are consistent with their O 1s spectra, where a higher proportion of bridging oxygens (Si–O–Si) was observed, particularly in Samples 4700 and 10. This correlation supports the interpretation that enhanced structural coherence at the oxygen level translates into more resolved silicon environments.
Conversely, Sample 7, synthesized with deionized water, presents the broadest and least resolved Si 2p signal. This broadened profile suggests a more disordered network and a wider distribution of Si bonding geometries. Notably, this sample also displayed the highest proportion of surface hydroxyls (Si–OH) and a comparatively lower fraction of bridging oxygens in the O 1s deconvolution. These features point to a less cross-linked network with a greater number of terminal Si–O⁻ or Si–OH units, which contribute to the electronic inhomogeneity detected in the Si 2p signal.
Therefore, the Si 2p results complement and reinforce the O 1s analysis, collectively suggesting that synthesis conditions (such as ionic content of the water and post-synthesis heat treatment) not only affect oxygen speciation but also significantly modulate the silicon coordination environment and network order.
The observed spectral differences reveal a strong interplay between network connectivity (as indicated by BO/NBO ratios) and the electronic structure of silicon, as probed by the Si 2p core level.
To gain deeper insight into the differences in silicon coordination and local disorder, the Si 2p spectra of Samples 7 and 4700 were deconvoluted. These two samples were chosen as structural extremes: Sample 7, representing a less condensed network with higher disorder, and Sample 4700, reflecting a more densified and ordered structure due to thermal treatment. Figure 10 presents the deconvoluted Si 2p spectra of both samples.
The Si 2p spectrum of Sample 4700 displayed two distinct components at 103.1 eV (70.6%) and 103.7 eV (29.4%), attributed to Q³ and Q⁴ environments, respectively. These species are indicative of a highly polymerized silicate network, enriched in bridging oxygens (BOs) and exhibiting greater structural order. This assignment agrees with the reduced hydroxyl content previously observed in the O 1s spectrum and reflects the formation of densified silicate domains through thermal treatment [22]. The presence of a significant high-BE Q⁴ component suggests extensive Si–O–Si crosslinking characteristic of fully connected silicate tetrahedra.
In contrast, Sample 7 exhibited two broader components centered at 102.4 eV (82.4%) and 103.3 eV (17.6%), corresponding to overlapping Q²/Q³ and Q³/Q⁴ species, respectively. These features indicate a less polymerized and more disordered network, rich in non-bridging oxygens (NBOs) and terminal silanol groups (Si–OH). This interpretation is consistent with the high fraction of Si–OH and NBOs detected in the O 1s spectra, confirming a loosely connected silicate structure. The lower binding energy component is mainly associated with Q² or Q³ environments, which are characteristic of open, low-connectivity silicate networks.
These assignments align with previous studies, where Si 2p components near ~102.4 eV and ~103.3 eV were linked to less polymerized Q²/Q³ units and intermediate Q³/Q⁴ transitions, respectively, in silicate systems undergoing structural reorganization [22]. The comparison clearly illustrates a shift toward higher binding energy and polymerization from Sample 7 to Sample 4700, reflecting the increasing degree of network connectivity, dominated by bridging oxygens (BOs).
Peak assignments are based on the Qⁿ classification of silicate structural units, where:
- Q² corresponds to Si(OSi)₂(OH)₂,
- Q³ to Si(OSi)₃(OH),
- and Q⁴ to fully connected Si(OSi)₄ species.
These results highlight the strong correlation between silicon’s core-level electronic environment and the extent of silicate network polymerization. The progression from Q²/Q³-dominated spectra in Sample 7 to Q³/Q⁴-rich spectra in Sample 4700 highlights the significant structural reorganization induced by post-synthesis thermal treatment. Moreover, this analysis corroborates the trends observed in the O 1s data, offering complementary atomic-scale evidence of the evolving glass network structure. A summary of these findings is presented in Table 3.
3.1.4. P 2p Core-Level Analysis
High-resolution P 2p spectra were examined to assess the local chemical environment of phosphorus within the silicate-phosphate network and to evaluate how synthesis conditions and thermal treatment influence phosphate incorporation. P 2p spectra were acquired only for phosphorus-containing samples; Sample 10 was excluded from this analysis due to its phosphate-free formulation. As shown in Figure 11, all analyzed samples exhibit a P 2p envelope centered around ~133.5 eV, consistent with phosphorus in fully oxidized tetrahedral coordination (PO₄³⁻ units). The overlaid spectra in Figure 12 reveal substantial differences in peak shape, width, and symmetry, which reflect variations in the phosphate environment and its interaction with the surrounding matrix.
Sample 7, synthesized with deionized water, displays the most intense P 2p peak among all samples, despite its relatively broad and symmetric profile. This suggests that phosphate groups are present in higher relative surface concentration but are embedded in a structurally under consolidated network. The absence of thermal treatment likely results in incomplete condensation and greater variability in local bonding geometries. While the chemical environment is clean and free of interfering multivalent cations, the local electrostatic environment remains less defined, as indicated by the broadened peak. This spectral profile reflects strong P–O bonding within PO₄³⁻ units distributed in electronically diverse coordination shells.
Sample 4, prepared using Água Prata, exhibits the lowest P 2p intensity and a broader, less defined envelope compared to Sample 4700. Although ions such as Sr²⁺ or Zn²⁺ may act as stabilizers, they can also introduce electrostatic heterogeneity through local charge imbalance or competition for coordination, thereby broadening the spectral response. The reduced signal may reflect a lower surface availability of phosphate species or a suppressed photoemission yield due to modifier interaction.
Sample 4700, synthesized with the same water but subjected to thermal treatment, shows an intermediate P 2p intensity but the narrowest and most symmetric peak of all samples. This spectral sharpening indicates enhanced phosphate network ordering and stabilization via heat-induced compaction and the removal of labile surface species. The reduced peak asymmetry and increased definition are consistent with improved local symmetry, decreased electrostatic fluctuations, and uniform bonding conditions around phosphorus atoms.
The evolution of the P 2p signal across these samples illustrates how both structural and electronic factors influence the spectroscopic response. Thermal treatment promotes phosphate consolidation and charge stabilization (Sample 4700), while the chemical complexity of the water source introduces ionic perturbations and electrostatic heterogeneity (Sample 4). The observed correlation between spectral broadening and local disorder, as well as peak sharpening with structural densification, underscores the dual role of the P 2p signal as both a chemical and physical probe of network integrity. These findings highlight how core-level line shapes can be used to infer local symmetry, charge distribution, and relaxation mechanisms in phosphate-bearing silicate glasses.
Given the pronounced asymmetry and broadening observed in the P 2p spectrum of Sample 4, a deconvolution was performed to resolve potential contributions from multiple phosphate environments. In contrast, the sharper and more symmetric peaks observed in Samples 7 and 4700 suggest a chemically homogeneous phosphorus environment, dominated by tetrahedral PO₄³⁻ units, and therefore did not warrant additional spectral fitting. Figure 13 shows the deconvoluted P 2p spectrum of Sample 4, revealing two components centered at approximately 132.5 eV and 133.6 eV. The main peak at 132.5 eV (dominant in intensity) is attributed to fully oxidized phosphate units (PO₄³⁻), in line with the expected structure of silicate–phosphate glasses.
The minor component at 133.6 eV, though much less intense, indicates the presence of perturbed phosphate environments, likely resulting from the interaction with network-modifying cations such as Sr²⁺ and Zn²⁺ from the Água Prata synthesis medium. These ions can distort local charge distributions and alter the electronic environment of phosphate groups, thereby shifting the binding energy slightly higher.
This spectral profile aligns with previous XPS studies reporting that even a single apparent P 2p peak may consist of overlapping contributions from chemically distinct phosphate species. Bonding variations involving Si–O–P, O–P–O, or P–O–metal linkages (e.g., P–O–Na, P–O–Ca) may lead to subtle shifts that are not always resolvable without deconvolution [31].
In this context, the dual-component spectrum of Sample 4 reflects a chemically heterogeneous phosphate environment, shaped by the ionic composition of the synthesis water. In contrast, Samples 7 and 4700 showed no such heterogeneity and were adequately modeled with a single PO₄³⁻ peak, consistent with a more uniform coordination state.
These two phosphate environments are summarized in Table 4. The main peak at ~132.5 eV corresponds to fully oxidized, tetrahedrally coordinated PO₄³⁻ units, whereas the minor component at ~133.6 eV likely arises from phosphate groups interacting with network-modifying cations (e.g., Sr²⁺ or Zn²⁺), leading to a slight shift in binding energy due to local charge redistribution and coordination variability.
3.1.5. Ca 2p Core-Level Analysis
High-resolution Ca 2p spectra were analyzed to investigate the chemical environment and coordination states of calcium across the different glass compositions. All samples exhibit the characteristic spin–orbit doublet of Ca 2p₃/₂ and Ca 2p₁/₂, located near 347.2 eV and 350.7 eV, respectively, consistent with divalent calcium species. However, variations in peak width, intensity, and symmetry were observed among the samples, reflecting differences in local ordering, bonding environments, and the influence of synthesis conditions. These spectral variations are clearly illustrated in Figure 14, which compares the high-resolution Ca 2p spectra across all samples.
Sample 4700, prepared with Água Prata and subjected to thermal treatment, displays the narrowest and most intense Ca 2p doublet, indicating a highly ordered coordination environment. The spectral sharpness suggests that thermal densification promotes network consolidation and electrostatic uniformity around Ca²⁺ ions, leading to enhanced photoemission definition.
Sample 4, also prepared with Água Prata but without thermal treatment, exhibits broader and less intense peaks. This intermediate behavior highlights the competing effects of ionic complexity in the synthesis medium and the absence of thermal consolidation, which limits structural organization and increases chemical heterogeneity.
Sample 10, synthesized with Água Azeda and no phosphate precursors, serves as a phosphate-free control. Its spectrum is sharper than those of Samples 4 and 7, and no signs of phosphate-associated components are present. This simpler spectral profile reflects a chemically uniform Ca–O–Si coordination environment and reinforces its role as a reference for silicate bonding without interference from phosphate species.
Sample 7, prepared using deionized water and phosphate precursors, displays the broadest and most asymmetric Ca 2p spectrum, indicating a highly disordered local environment and the coexistence of multiple calcium coordination states.
To better highlight differences in line shape and intensity, Figure 15 shows the normalized Ca 2p spectra overlaid. The spectrum of Sample 4700 is notably the sharpest and most intense, consistent with high coordination order due to thermal treatment. In contrast, the broader and less defined profiles of Samples 7 and 10 reflect increased structural disorder and electrostatic heterogeneity.
Given the pronounced broadening and asymmetry observed in the Ca 2p spectra of Samples 4 and 7, a deconvolution procedure was applied to resolve overlapping contributions from distinct calcium environments (Figure 16). However, samples 4700 and 10 did not require deconvolution. The narrow, symmetric profiles observed in these samples suggest chemically uniform calcium coordination environments. In Sample 4700, thermal treatment stabilizes the network, while in Sample 10, the absence of phosphate simplifies the coordination to Ca–O–Si only.
Deconvolution of the Ca 2p spectra revealed the presence of three distinct components. In both samples, the primary Ca 2p₃/₂ signal appears at ~346.6–347.5 eV, assigned to calcium coordinated with phosphate groups (Ca–O–P), and is accompanied by its Ca 2p₁/₂ spin–orbit counterpart near 350.4–350.7 eV. However, Sample 7 exhibits a third, lower binding energy feature at 345.5 eV, absent in Sample 4, which is interpreted as calcium in a more weakly bound or hydrated environment—possibly related to surface Ca(OH)₂ or non-integrated Ca²⁺ species resulting from sol-gel processing in ultrapure water. In Sample 4, the Ca–O–P environment dominates (58.8%), with a smaller contribution (9.6%) assigned to calcium incorporated into the silicate network (Ca–O–Si). The absence of the low-BE component suggests a more stabilized coordination framework, likely supported by the presence of multivalent cations (e.g., Sr²⁺, Zn²⁺) from the mineral-rich synthesis medium, which may compete with calcium for phosphate binding and promote structural integration.
In contrast, Sample 7 shows a more heterogeneous calcium distribution, with substantial contributions from both Ca–O–P (48.3%) and the low-BE disordered component (25.9%), reflecting incomplete coordination and structural hydration. This behavior is typical of sol–gel glasses formed in the absence of ionic competition or post-synthetic stabilization.
The Ca–O–P environments identified here — representing calcium phosphate coordination reflect local bonding between Ca²⁺ and PO₄³⁻ groups in disordered, amorphous regions within the sol–gel matrix. These phosphate-rich domains are typical of glasses synthesized without thermal treatment, where limited condensation allows for nanoscale segregation or clustering of modifier cations around phosphate species.
In Sample 7, the exclusive detection of Ca–O–P environments (alongside the disordered species) reflect the chemically simple nature of the synthesis medium — ultrapure water without multivalent cations. Under these conditions, calcium displays strong affinity for phosphate groups, leading to preferential coordination as Ca–O–P clusters. The lack of Sr²⁺, Zn²⁺, or other modifiers prevents redistribution of Ca²⁺ into the silicate network. Moreover, the absence of thermal treatment limits network densification and inhibits calcium incorporation into silicate domains, which explains the absence of a distinct Ca–O–Si component in the deconvolution. The quantitative contributions of the different calcium environments in both samples are summarized in Table 5.
This interpretation aligns with previous findings [32], which show that although the Ca 2p doublet is typically the dominant spectral feature, deconvolution is often necessary to uncover underlying heterogeneity—such as surface carbonates, phosphate coordination, or partial network integration. These effects are particularly pronounced in low-temperature sol–gel systems, where limited thermal energy hinders the stabilization of well-defined coordination environments.
3.1.6. Na 1s Core-Level Analysis
The high-resolution Na 1s spectra provide insight into sodium incorporation, surface retention, and ionic dynamics in the glass matrices. As shown in Figure 17, all samples display a Na 1s signal centered around ~1071.5 eV, characteristic of Na⁺ acting as a network modifier [22].
The overlaid normalized spectra in Figure 18 reveal significant differences in intensity and peak shape, reflecting both synthesis conditions and the ionic competition present during gel formation.
Sample 4700, synthesized with Água Prata and subjected to thermal treatment, exhibits the most intense Na 1s peak, indicating enhanced sodium retention near the surface. However, this peak is broader compared to Sample 4, suggesting increased local structural or electronic heterogeneity. This broadening likely results from thermal treatment inducing sodium redistribution into multiple coordination environments, possibly influenced by competing multivalent cations (e.g., Sr²⁺, Zn²⁺) present in the mineral-rich synthesis water. These factors lead to a wider distribution of Na–O bond characteristics, reflected in the broadened Na 1s peak.
Sample 4, synthesized under similar conditions but without thermal treatment, presents a narrower and less intense Na 1s peak. The narrower peak suggests a more uniform sodium environment, likely due to reduced ionic mobility and redistribution during gelation and drying. The lower peak intensity indicates less sodium retained at or near the surface, consistent with a less consolidated glass structure.
Sample 10, synthesized with Água Azeda, exhibits a moderately intense and asymmetric Na 1s signal. This suggests partial substitution or competitive interaction between Na⁺ and multivalent cations such as Mg²⁺ and possibly Fe³⁺ from the water. These ions may displace sodium from its typical modifier role or alter the surrounding oxygen coordination, disrupting charge balance and increasing variability in sodium’s local environment. The broader peak aligns with greater structural disorder and non-uniform electrostatic potential at Na⁺ sites, indicating increased heterogeneity.
Sample 7, synthesized with deionized water and no thermal treatment, exhibits the weakest and broadest Na 1s signal. Despite the chemical purity of the medium, the absence of thermal consolidation likely results in an open, under-condensed structure that allows Na⁺—a highly mobile species—to migrate away from the surface or reside in poorly coordinated, weakly bound environments. The reduced intensity and broad peak envelope reflect a low surface sodium density coupled with elevated electronic and structural disorder [33].
These observations indicate that the Na 1s peak serves as a sensitive probe for sodium coordination and mobility in glass systems. Similar to findings by Barr (1990) in aluminosilicate glasses—where increasing the Si/Al ratio enhanced the ionicity of the Na–O bond and thereby increased Na⁺ exchangeability—it is plausible that comparable effects arise here due to multivalent cations introduced via mineral-rich waters. Ions such as Mg²⁺, Sr²⁺, Zn²⁺, or Fe³⁺ may act as competitive modifiers or local electrostatic disruptors, increasing Na–O bond polarization and enhancing sodium mobility or lowering binding energy. These effects are reflected in the observed peak asymmetry and broadening [34].
Although some Na 1s peaks show asymmetry and broadening, no spectral deconvolution was performed. This choice is justified by the fact that Na⁺ typically exists in a single predominant chemical state in silicate glasses [22] and does not produce multiple chemically distinct contributions within the Na 1s region. Instead, variations in peak shape are interpreted as indicators of local structural heterogeneity rather than distinct chemical states requiring deconvolution. Unlike elements such as Si or O—where distinct bonding environments can be resolved via peak fitting—the Na 1s signal is generally less informative when deconvoluted and may lead to misleading interpretations if over-analyzed [35].
3.1.7. Mg 1s Core-Level Analysis
The high-resolution Mg 1s spectrum of Sample 10 is presented in Figure 20. A single, well-defined peak centered at ~1302–1303 eV indicates that Mg²⁺ is present in a stable, fully oxidized state, incorporated uniformly into the glass matrix. The slight asymmetry towards lower binding energies may reflect minor variations in the local coordination environment, but no evidence of multiple chemical states or significant peak broadening was observed, and thus spectral deconvolution was not required. The spectral profile supports the interpretation that Mg²⁺ acts primarily as a network modifier or structural stabilizer within the glass. Indeed, it has been shown that Mg²⁺ can promote local network densification by occupying specific coordination environments and compensating for non-bridging oxygens, thereby enhancing the compactness and mechanical integrity of the silicate structure [36]. In phosphate-free glass systems such as Sample 10, magnesium is expected to act primarily as a network modifier or structural stabilizer. Its presence may contribute to increased local packing density, altered cation ratios (e.g., Na⁺/Ca²⁺), and enhanced electrostatic balance within the silicate network. The localized occurrence of Mg in this composition reinforces its structural role in shaping the final properties of the glass.
3.1.8. Summary of Core-Level Trends
The high-resolution XPS analyses of the O 1s, Si 2p, P 2p, Ca 2p, and Na 1s core levels provide a comprehensive picture of the surface structure and local bonding environments across the synthesized bioactive glass compositions. Despite the amorphous nature of these materials, the electronic signatures reveal systematic chemical trends that reflect underlying physical principles governing atomic coordination and network formation.
One of the most striking observations lies in the evolution of the O 1s spectra, where the relative intensity of non-bridging oxygens (NBOs) decreases upon thermal treatment. This spectral narrowing and shift toward lower binding energies correspond to the condensation of hydroxyl-rich species into Si–O–Si bridges, as predicted by sol–gel polymerization kinetics. From a physical standpoint, this reflects a transition from higher energy, loosely bound surface states (with significant electron lone-pair contributions) toward more covalently bonded, lower-energy orbital overlaps. The resulting reduction in electronic disorder enhances the local dielectric environment and improves core-level resolution. In the Si 2p region, thermal consolidation and network modifier effects are equally evident. Shifts to lower binding energy and decreased FWHM values indicate a progressive enrichment in Q³ and Q⁴ units — a signature of increasing polymerization and three-dimensional network integrity. This reflects both the electrostatic stabilization of Si⁴⁺ centers by bridging oxygens and a reduction in final-state screening effects, as network compactness increases the average local electron density. The silicate network thus transitions from fragmented, NBO-rich chains to more interconnected units with greater structural coherence. The P 2p core-level signals show that phosphate species, though retained in the network, are highly sensitive to the presence of modifying cations. The deconvolution profiles suggest a dual population: regular tetrahedral PO₄³⁻ units and distorted phosphates influenced by interactions with cations such as Sr²⁺ and Zn²⁺. These interactions cause localized distortion and charge redistribution, leading to small chemical shifts in binding energy. From a quantum-mechanical perspective, this represents modulation of the local potential field around phosphorus centers, affecting the core-level relaxation energies.
In the Ca 2p spectra, both binding energy shifts and peak multiplicity are observed, which correlate directly with coordination diversity. The presence of Ca–O–P and Ca–O–Si environments, and in some cases surface-hydrated Ca species, reflects the sensitivity of calcium to local ionic competition and structural disorder. In untreated glasses, particularly those synthesized in deionized water, calcium remains loosely coordinated, forming clusters with phosphate due to electrostatic preference. In contrast, when trace elements are present in the synthesis medium, as with Água Prata, calcium is redistributed into the silicate network. These shifts are governed by differences in cation field strength and polarizability, which influence not only bond stability but also core-hole screening during photoemission, resulting in measurable variations in binding energy.
The Na 1s spectra further support the dynamic behavior of alkali modifiers. Sodium, with its low field strength and high mobility, exhibits consistent binding energies but variable intensity, likely due to partial leaching or exchange with divalent cations during gelation. This behavior aligns with its role as a charge compensator for non-bridging oxygens, which decrease upon thermal consolidation.
Altogether, these trends demonstrate that the local electronic structure of bioactive sol–gel glasses is not static but highly responsive to both the chemical complexity of the synthesis medium and post-synthetic thermal evolution. The observed shifts in core-level energies, changes in peak symmetry, and deconvolution patterns reflect a complex interplay of local coordination geometry, electronic relaxation dynamics, and ion-mediated structural reorganization. These effects are rooted in fundamental physical interactions, such as Coulombic attraction, orbital hybridization, and photoelectron screening, which govern the chemical state sensitivity of XPS.
This multi-level spectroscopic insight reveals that natural waters, far from being inert solvents, act as active structural agents that shape the glass network at the atomic scale, reinforcing the potential of environmentally integrated sol–gel routes for fine-tuning surface reactivity in bioactive glasses.
A condensed summary of the core-level observations and structural implications for selected samples is presented in Table 6, integrating compositional and processing parameters with XPS-based interpretations.
4. Conclusions
This study demonstrates that the substitution of ultrapure water with geothermal waters in the sol–gel synthesis of bioactive glasses significantly alters the structural and chemical characteristics of the final material. High-resolution XPS revealed that:
- The presence of multivalent trace elements in waters such as Água Prata and Água Azeda leads to local rearrangements in the silicate and phosphate networks.
- Thermal treatment enhances network consolidation, reducing hydroxylation and promoting Q⁴-like domains.
- Modifier ions introduced via mineral waters can replace native Na⁺ and Ca²⁺, leading to complex surface chemistries that potentially enhance bioactivity.
These findings support the use of geothermal waters as eco-functional synthesis media, offering a route to tailor glass properties through natural ionic environments without the need for synthetic additives. Future studies may explore the biological responses to these materials to validate their functional performance in regenerative applications.
Author Contributions
Conceptualization, H.C.V. and M.G.M.; methodology, H.C.V.; software, H.C.V.; validation, H.C.V., M.G.M. and R.O.; formal analysis, H.C.V.; investigation, H.C.V.; resources, H.C.V.; data curation, H.C.V.; writing—original draft preparation, H.C.V.; writing—review and editing, H.C.V., M.G.M. and R.O.; visualization, H.C.V.; supervision, H.C.V.; project administration, H.C.V.; funding acquisition, M.G.M. All authors have read and agreed to the published version of the manuscript.
Funding
This research received no external funding
Conflicts of Interest
The authors declare no conflicts of interest.
References
- Hench, L. L. (1991). Bioceramics: From Concept to Clinic. Journal of the American Ceramic Society, 74(7), 1487–1510. [CrossRef]
- Ślośarczyk A, Paszkiewicza Z, Paluszkiewicz C. FTIR and XRD evaluation of carbonated hydroxyapatite powders synthesized by wet methods. J Mol Struct. 2005;744–747:657–61.
- Salim, S. A. S., Mohamad, H., & Noor, S. N. F. M. (2018). Influence of MgO on Sol-Gel Derived SiO2-CaO-Na2O-P2O5 Bioglass System. Journal of Physics: Conference Series, 1082, 012034. [CrossRef]
- Vasconcelos, H. C. (2016). Glasses as biomaterials. In H. C. Vasconcelos & M. C. Gonçalves (Eds.), Overall aspects of non-traditional glasses: Synthesis, properties and applications (pp. 19–38). Bentham Science Publishers. [CrossRef]
- Mizuno M. Implants for surgery: in vitro evaluation for apatite forming ability of implant materials. ISO ISO/DIS 23317, International Organization for Standardization, Geneva, Switzerland. 2014.
- Gerhardt, L.-C., & Boccaccini, A. R. (2010). Bioactive glass and glass-ceramic scaffolds for bone tissue engineering. Materials, 3(7), 3867–3910. [CrossRef]
- Meu capitulo arqupelagos.
- Cruz, J. V., Freire, P., & Costa, A. (2010). Mineral waters characterization in the Azores archipelago (Portugal). Journal of Volcanology and Geothermal Research, 190(3-4), 353–364. [CrossRef]
- Hench, L. L., & West, J. K. (1990). The sol-gel process. Chemical Reviews, 90(1), 33–72. [CrossRef]
- Cacciotti, I. (2015). Cationic and Anionic Substitutions in Hydroxyapatite. Handbook of Bioceramics and Biocomposites, 1–68. [CrossRef]
- Hung, C.-C., Chaya, A., Liu, K., Verdelis, K., & Sfeir, C. (2019). The role of magnesium ions in bone regeneration involves the canonical Wnt signaling pathway. Acta Biomaterialia. [CrossRef]
- Qiao, Y., Zhang, W., Tian, P., Meng, F., Zhu, H., Jiang, X., … Chu, P. K. (2014). Stimulation of bone growth following zinc incorporation into biomaterials. Biomaterials, 35(25), 6882–6897. [CrossRef]
- Kołodziejska, B., Stępień, N., & Kolmas, J. (2021). The Influence of Strontium on Bone Tissue Metabolism and Its Application in Osteoporosis Treatment. International Journal of Molecular Sciences, 22(12), 6564. [CrossRef]
- Aurélie Jacobs, Guillaume Renaudin, Christiane Forestier, J.-M. Nedelec, Stéphane Descamps. Biological properties of copper-doped biomaterials for orthopedic applications: A review of antibacterial, angiogenic and osteogenic aspects. Acta Biomaterialia, 2020, 117, pp.21-39. [CrossRef]
- Rondanelli M, Faliva MA, Peroni G, Infantino V, Gasparri C, Iannello G, Perna S, Riva A, Petrangolini G, Tartara A. Pivotal role of boron supplementation on bone health: A narrative review. J Trace Elem Med Biol. 2020 Dec;62:126577. Epub 2020 Jun 6. [CrossRef] [PubMed]
- Wong, S. K., Chin, K.-Y., & Ima-Nirwana, S. (2020). The Skeletal-Protecting Action and Mechanisms of Action for Mood-Stabilizing Drug Lithium Chloride: Current Evidence and Future Potential Research Areas. Frontiers in Pharmacology, 11. [CrossRef]
- Chen Z, Zhang W, Wang M, Backman LJ, Chen J. Effects of Zinc, Magnesium, and Iron Ions on Bone Tissue Engineering. ACS Biomater Sci Eng. 2022 Jun 13;8(6):2321-2335. Epub 2022 May 31. [CrossRef] [PubMed]
- Ribeiro, A. M., Flores-Sahagun, T. H. S., & Paredes, R. C. (2015). A perspective on molybdenum biocompatibility and antimicrobial activity for applications in implants. Journal of Materials Science, 51(6), 2806–2816. [CrossRef]
- Qi, L.; Zhao, T.; Yan, J.; Ge, W.; Jiang, W.; Wang, J.; Gholipourmalekabadi, M.; Lin, K.; Wang, X.; Zhang, L. Advances in magnesium containing bioceramics for bone repair. Biomater Transl. 2024, 5(1), 3-20.
- Exley, C. (2016). The toxicity of aluminium in humans. Morphologie, 100(329), 51–55. [CrossRef]
- Alzahrani, A.S. (2022) A Review of Glass and Crystallizations of Glass-Ceramics. Advances in Materials Physics and Chemistry, 12, 261-288. [CrossRef]
- Dziadek, M., Zagrajczuk, B., Jelen, P., Olejniczak, Z., & Cholewa-Kowalska, K. (2016). Structural variations of bioactive glasses obtained by different synthesis routes. Ceramics International, 42(13), 14700–14709. [CrossRef]
- Watts, J. F., & Wolstenholme, J. (2019). An Introduction to Surface Analysis by XPS and AES. [CrossRef]
- Bagus, P. S., Ilton, E. S., & Nelin, C. J. (2013). The interpretation of XPS spectra: Insights into materials properties. Surface Science Reports, 68(2), 273–304. [CrossRef]
- Moulder, J. F., Stickle, W. F., Sobol, P. E., & Bomben, K. D. (1992). Handbook of X-ray photoelectron spectroscopy. Perkin-Elmer Corporation: Eden Prairie.
- Shao, X.-B., Xing, Z.-W., Liu, S.-Y., Miao, K.-X., Qi, S.-C., Peng, S.-S., Liu, X.-Q., & Sun, L.-B. (2024). Atomically dispersed calcium as solid strong base catalyst with high activity and stability. Green Energy & Environment, 9(10), 1619–1626. [CrossRef]
- Nesbitt, H. W., Bancroft, G. M., Henderson, G. S., Ho, R., Dalby, K. N., Huang, Y., & Yan, Z. (2011). Bridging, non-bridging and free (O²⁻) oxygen in Na₂O–SiO₂ glasses: An X-ray photoelectron spectroscopic (XPS) and nuclear magnetic resonance (NMR) study. Journal of Non-Crystalline Solids, 357(1), 170–180. [CrossRef]
- Foix, D., Martinez, H., Gonbeau, D., Granier, D., Pradel, A., & Ribes, M. (2005). Thiogermanate glasses—influence of the modifier cation—a combined XPS and theoretical study. Phys. Chem. Chem. Phys., 7(1), 180–186. [CrossRef]
- Sreenivasan, H., Kinnunen, P., Adesanya, E., Patanen, M., Kantola, A. M., Telkki, V.-V., … Illikainen, M. (2020). Field Strength of Network-Modifying Cation Dictates the Structure of (Na-Mg) Aluminosilicate Glasses. Frontiers in Materials, 7. [CrossRef]
- Lin, S., Ionescu, C., Pike, K. J., Smith, M. E., & Jones, J. R. (2009). Nanostructure evolution and calcium distribution in sol–gel derived bioactive glass. Journal of Materials Chemistry, 19(9), 1276. [CrossRef]
- Massiot, P., Centeno, M. A., Gouriou, M., Domínguez, M. I., & Odriozola, J. A. (2003). Sol–gel obtained silicophosphates as materials to retain caesium at high temperatures. J. Mater. Chem., 13(1), 67–74. [CrossRef]
- Massera, J., Mishra, A., Guastella, S., Ferraris, S., & Verné, E. (2016). Surface functionalization of phosphate-based bioactive glasses with 3-aminopropyltriethoxysilane (APTS). Biomedical Glasses, 2(1), 1–10. [CrossRef]
- Roy B, Baier F, Rosin A, Gerdes T, Schafföner S. Structural characterization of the near-surface region of soda–lime–silica glass by X-ray photoelectron spectroscopy. Int J Appl Glass Sci. 2023; 14: 229–239. [CrossRef]
- Barr, T. L. (1990). The nature of the relative bonding chemistry in zeolites: An XPS study. Zeolites, 10(8), 760–765. [CrossRef]
- Serra, J., González, P., Liste, S., Serra, C., Chiussi, S., León, B., … Hupa, M. (2003). FTIR and XPS studies of bioactive silica based glasses. Journal of Non-Crystalline Solids, 332(1-3), 20–27. [CrossRef]
- Deng, B., Shi, Y., Zhou, Q., & Bauchy, M. (2022). Revealing the structural role of MgO in aluminosilicate glasses. Acta Materialia, 222, 117417. [CrossRef]
Figure 1.
Summary of the chemical compositions of the geothermal waters: Água de Prata and Água Azeda (Furnas, São Miguel Island (Açores), Portugal).
Figure 1.
Summary of the chemical compositions of the geothermal waters: Água de Prata and Água Azeda (Furnas, São Miguel Island (Açores), Portugal).
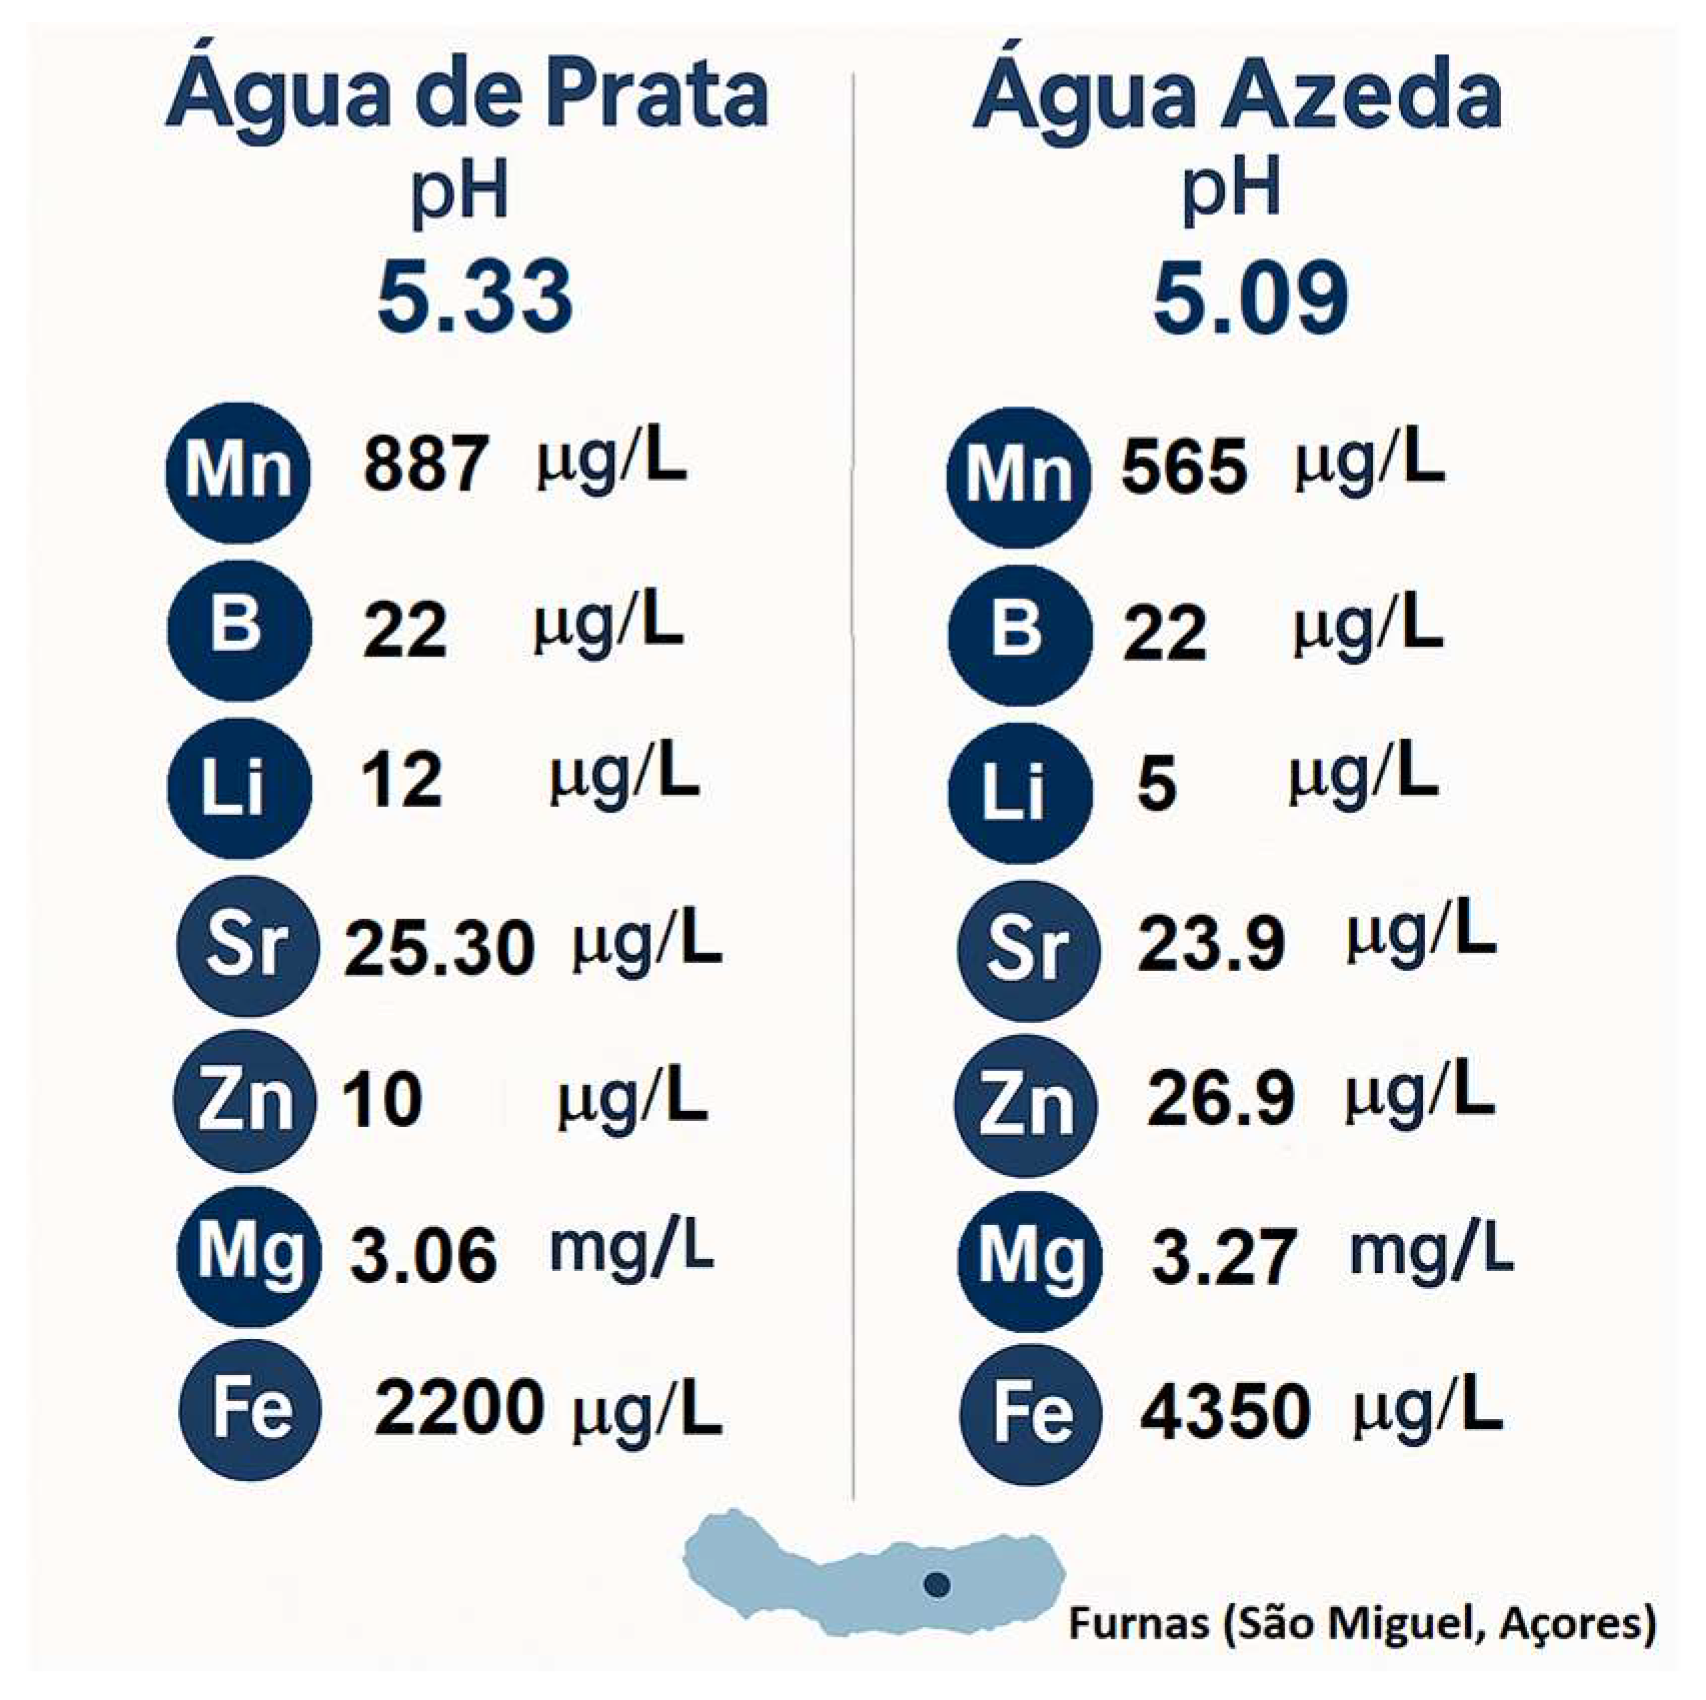
Figure 2.
Schematic representation of the sol-gel synthesis process for 45S5® bioactive glass and its modified formulation (45S5®/MgO) using deionized water, Água de Prata, and Água Azeda as synthesis media.
Figure 2.
Schematic representation of the sol-gel synthesis process for 45S5® bioactive glass and its modified formulation (45S5®/MgO) using deionized water, Água de Prata, and Água Azeda as synthesis media.
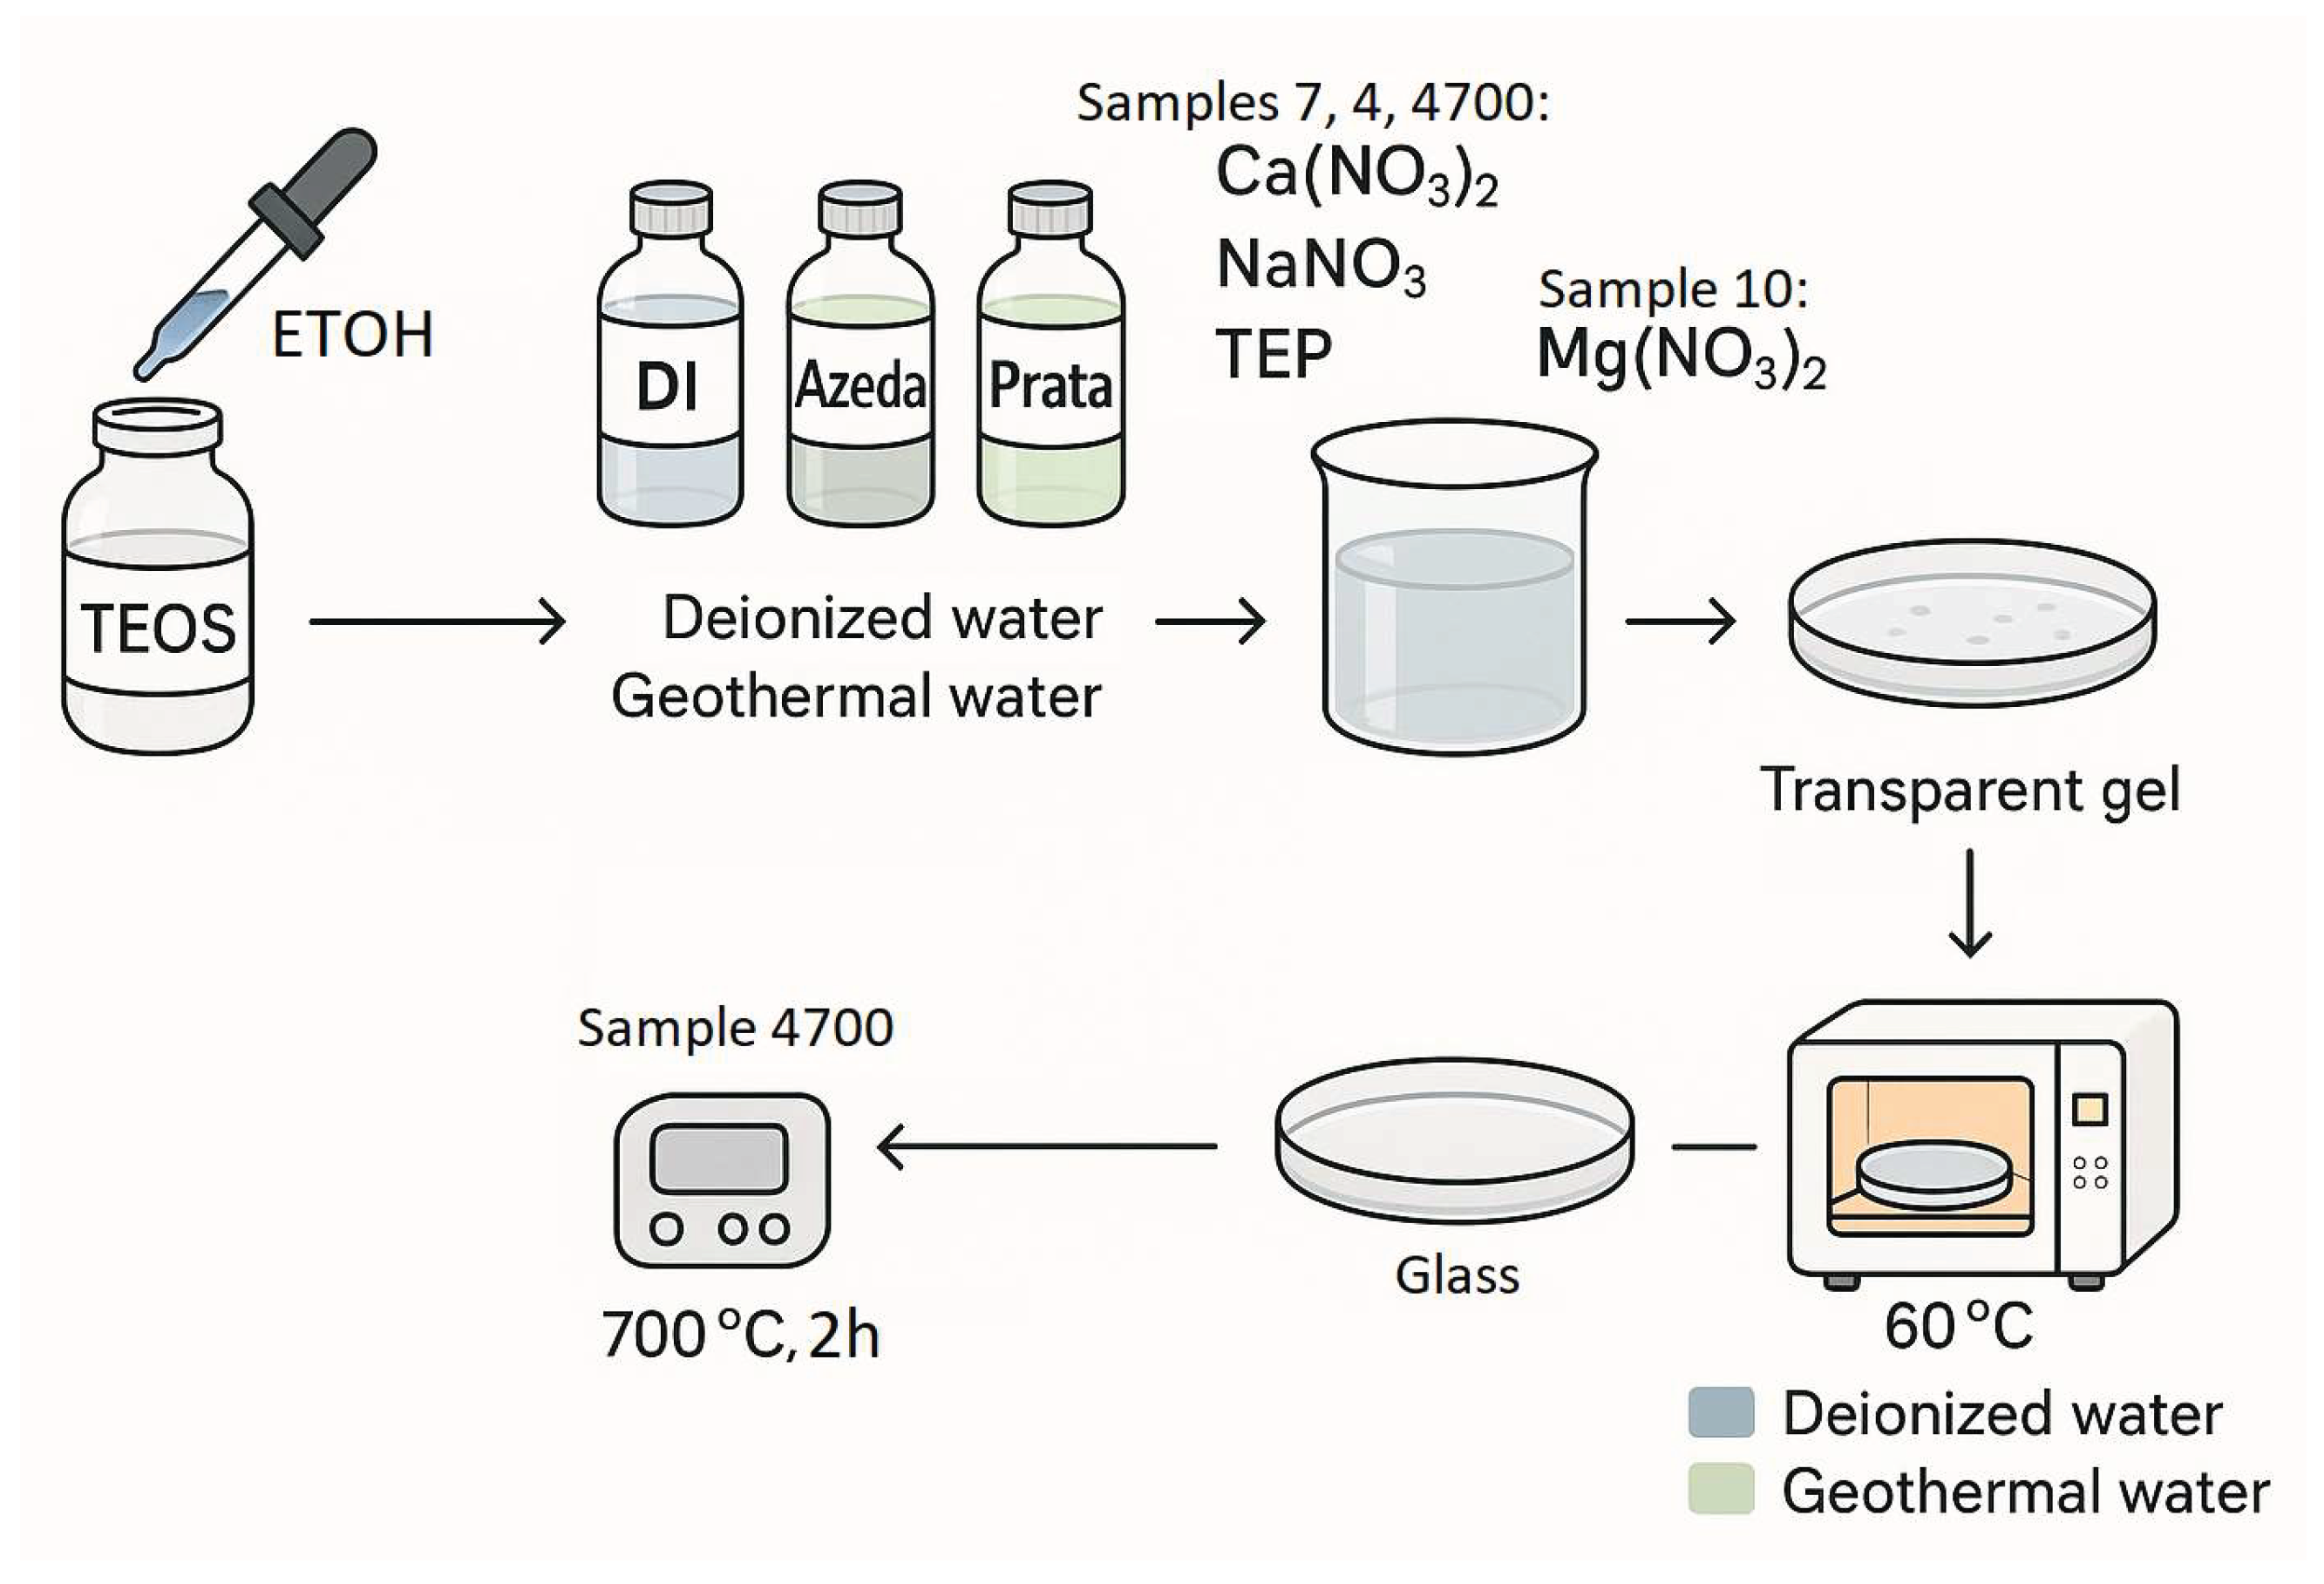
Figure 3.
Schematic workflow of the XPS analysis applied to sol-gel-derived bioglasses in this study. The procedure includes an initial survey spectrum to identify elemental composition, followed by high-resolution core-level acquisition for detailed chemical analysis. Comparative steps involve side-by-side and overlay examination of spectra to detect shifts and broadening, culminating in peak deconvolution for chemical state resolution. The findings are then interpreted and correlated with the ionic profiles of the synthesis waters.
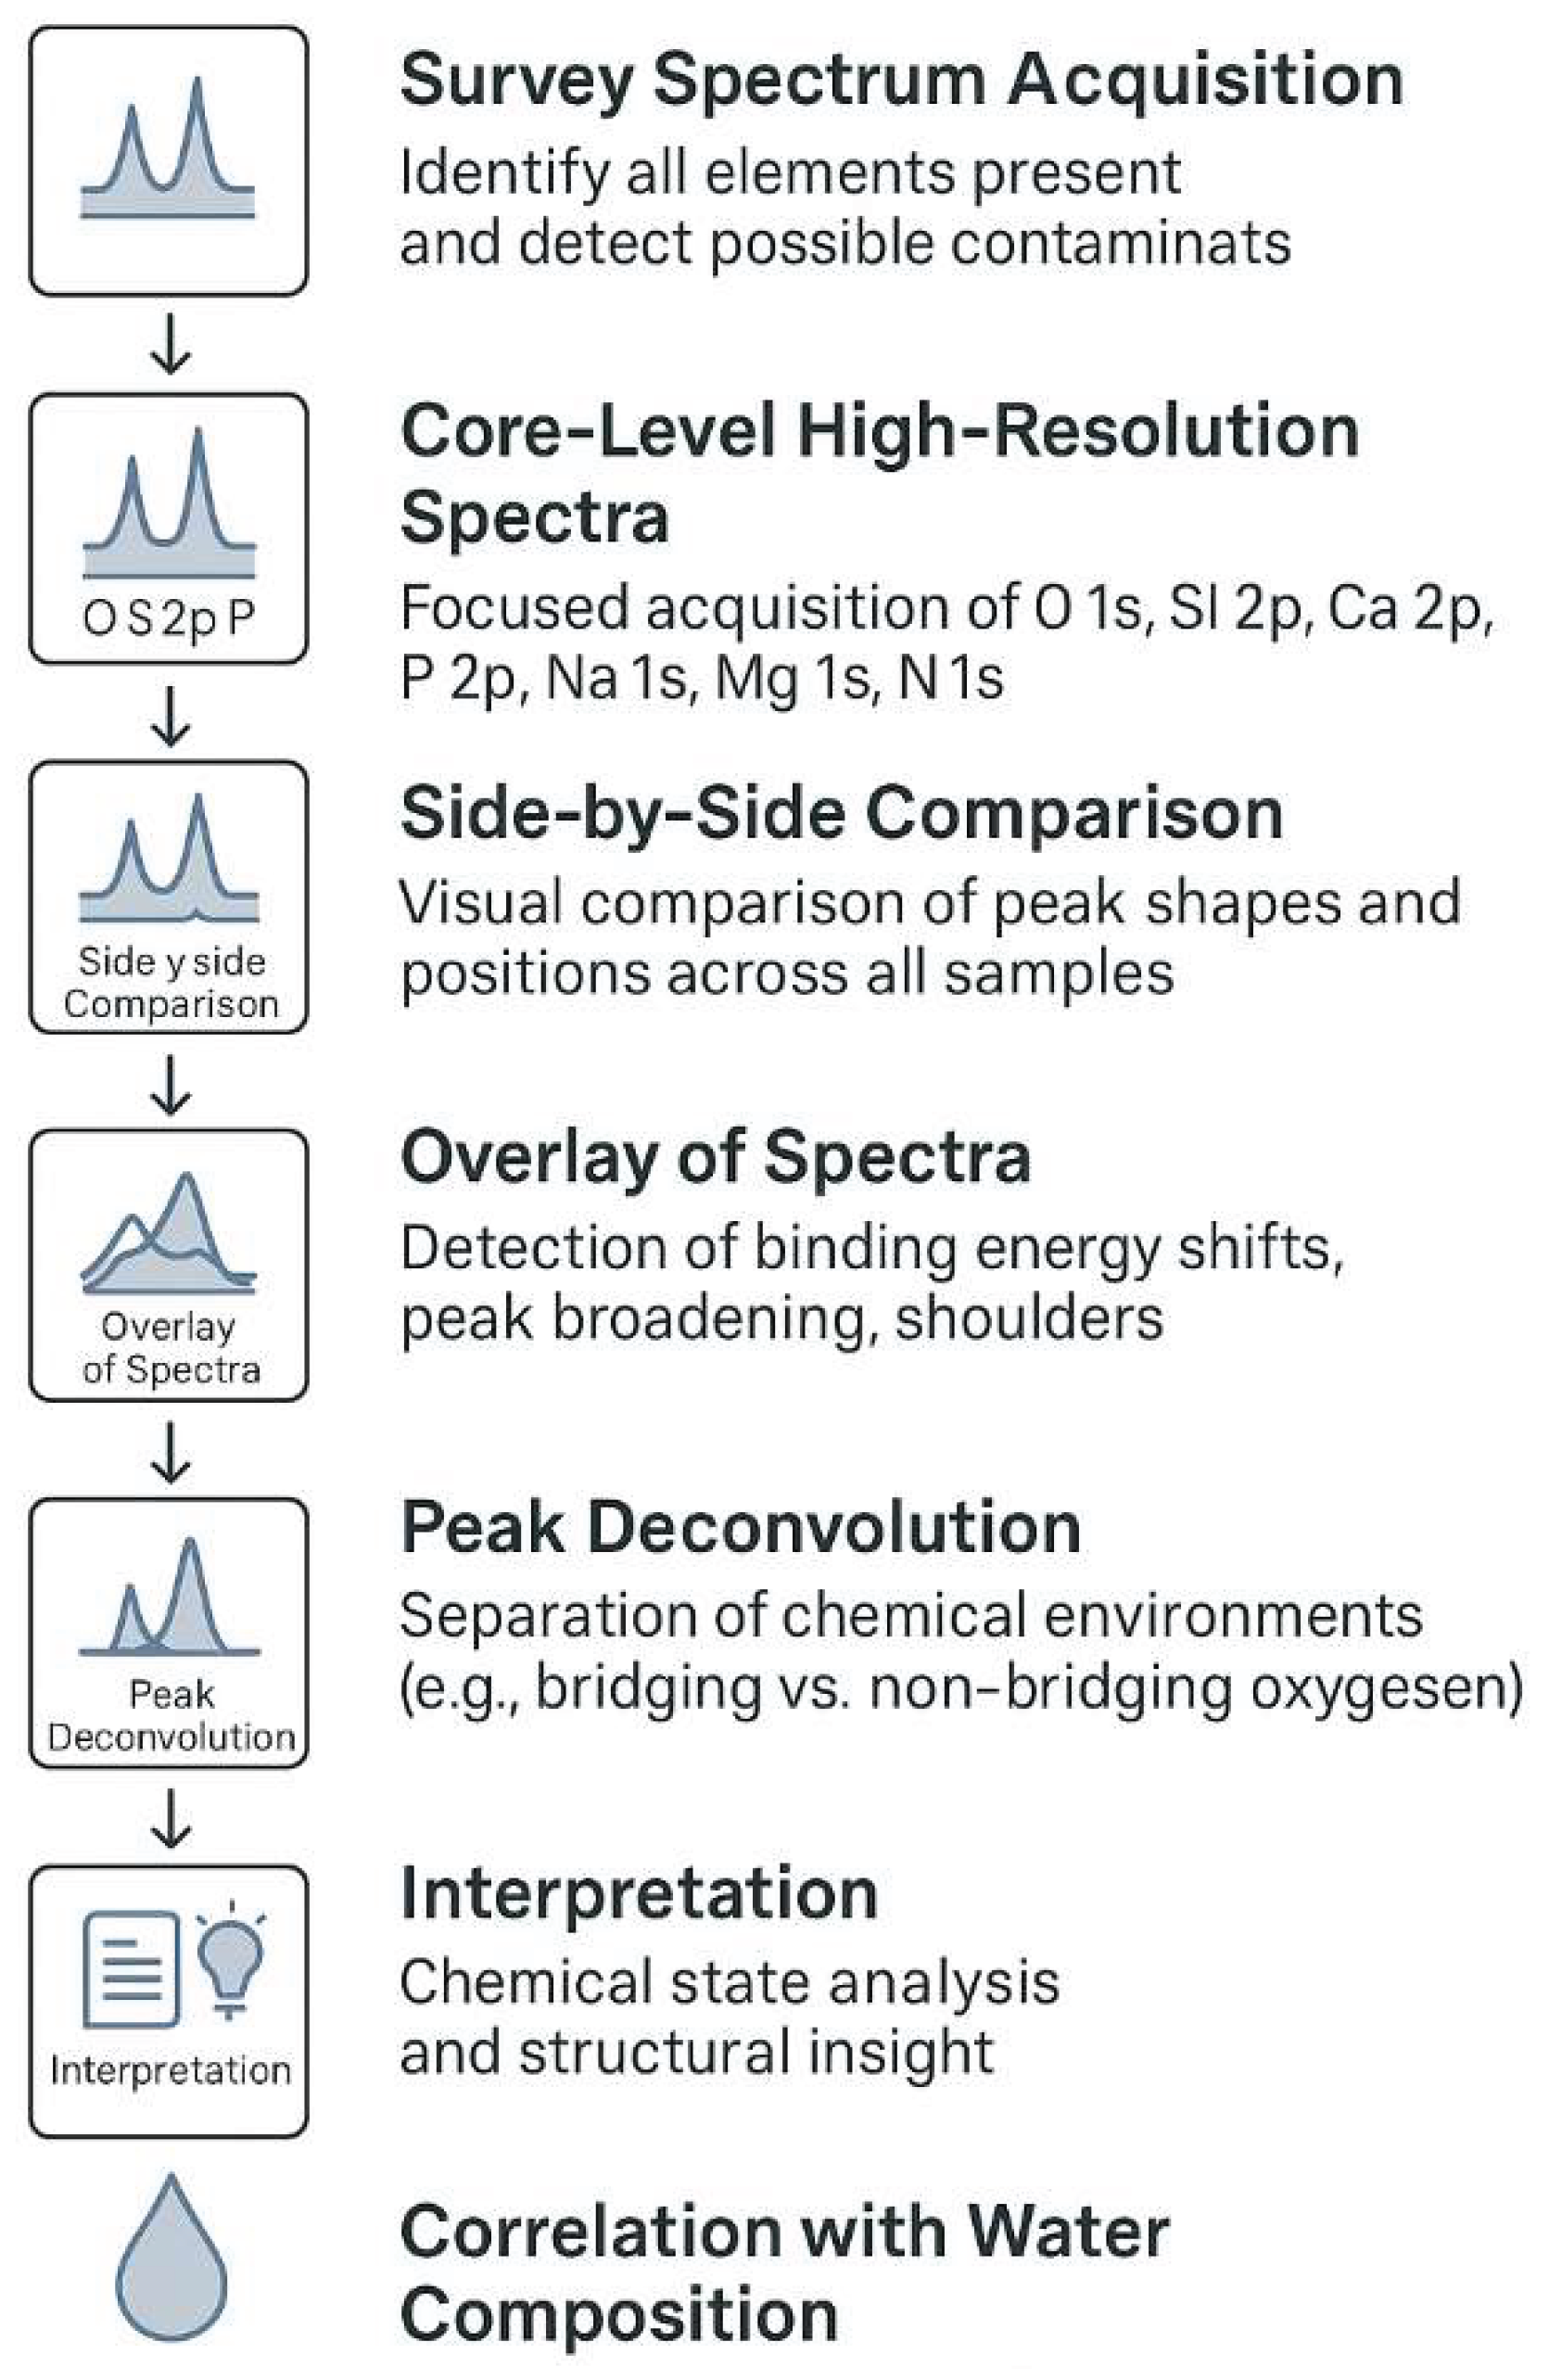
Figure 4.
Survey XPS spectra of the four bioactive glass samples synthesized with different water sources: Sample 7 (deionized water), Sample 4 and Sample 4700 (Água Prata), and Sample 10 (Água Azeda with MgO). The main peaks corresponding to O 1s, Si 2p, Ca 2p, P 2p, and Na 1s are present in all samples.
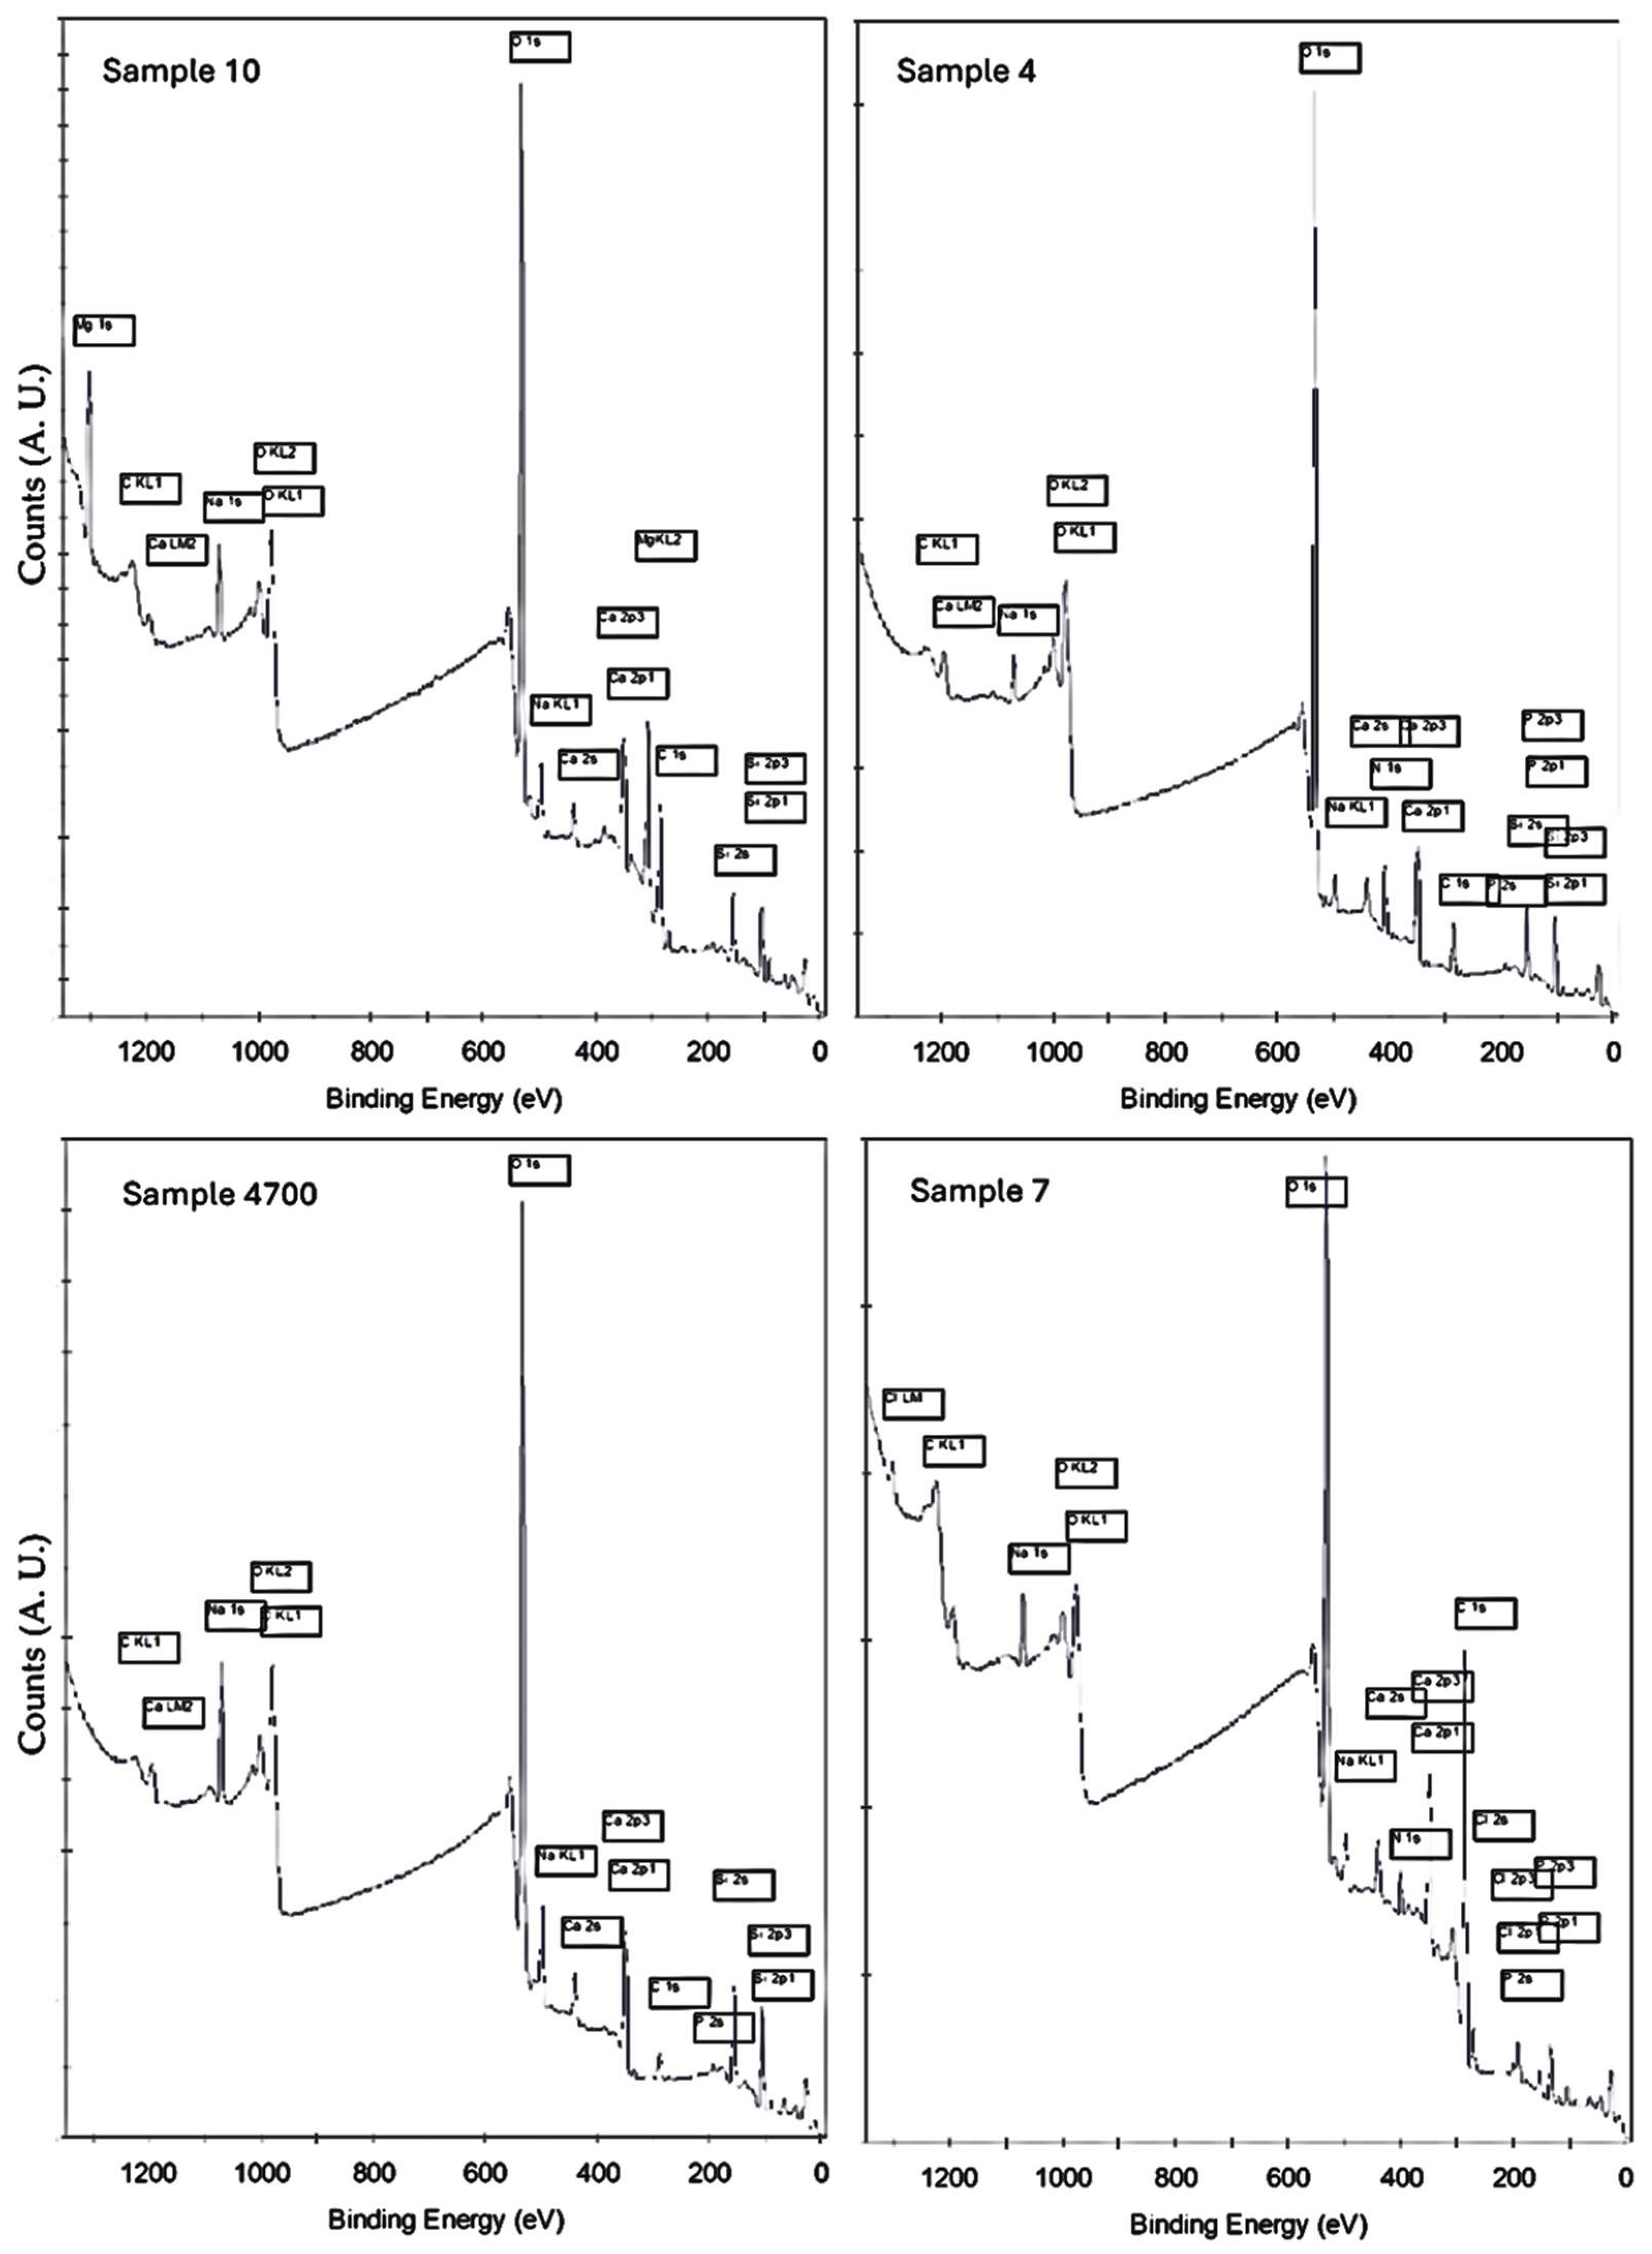
Figure 5.
High-resolution O 1s spectra of all samples: Sample 7 (deionized water), Sample 4 and 4700 (Água Prata), and Sample 10 (Água Azeda).
Figure 5.
High-resolution O 1s spectra of all samples: Sample 7 (deionized water), Sample 4 and 4700 (Água Prata), and Sample 10 (Água Azeda).
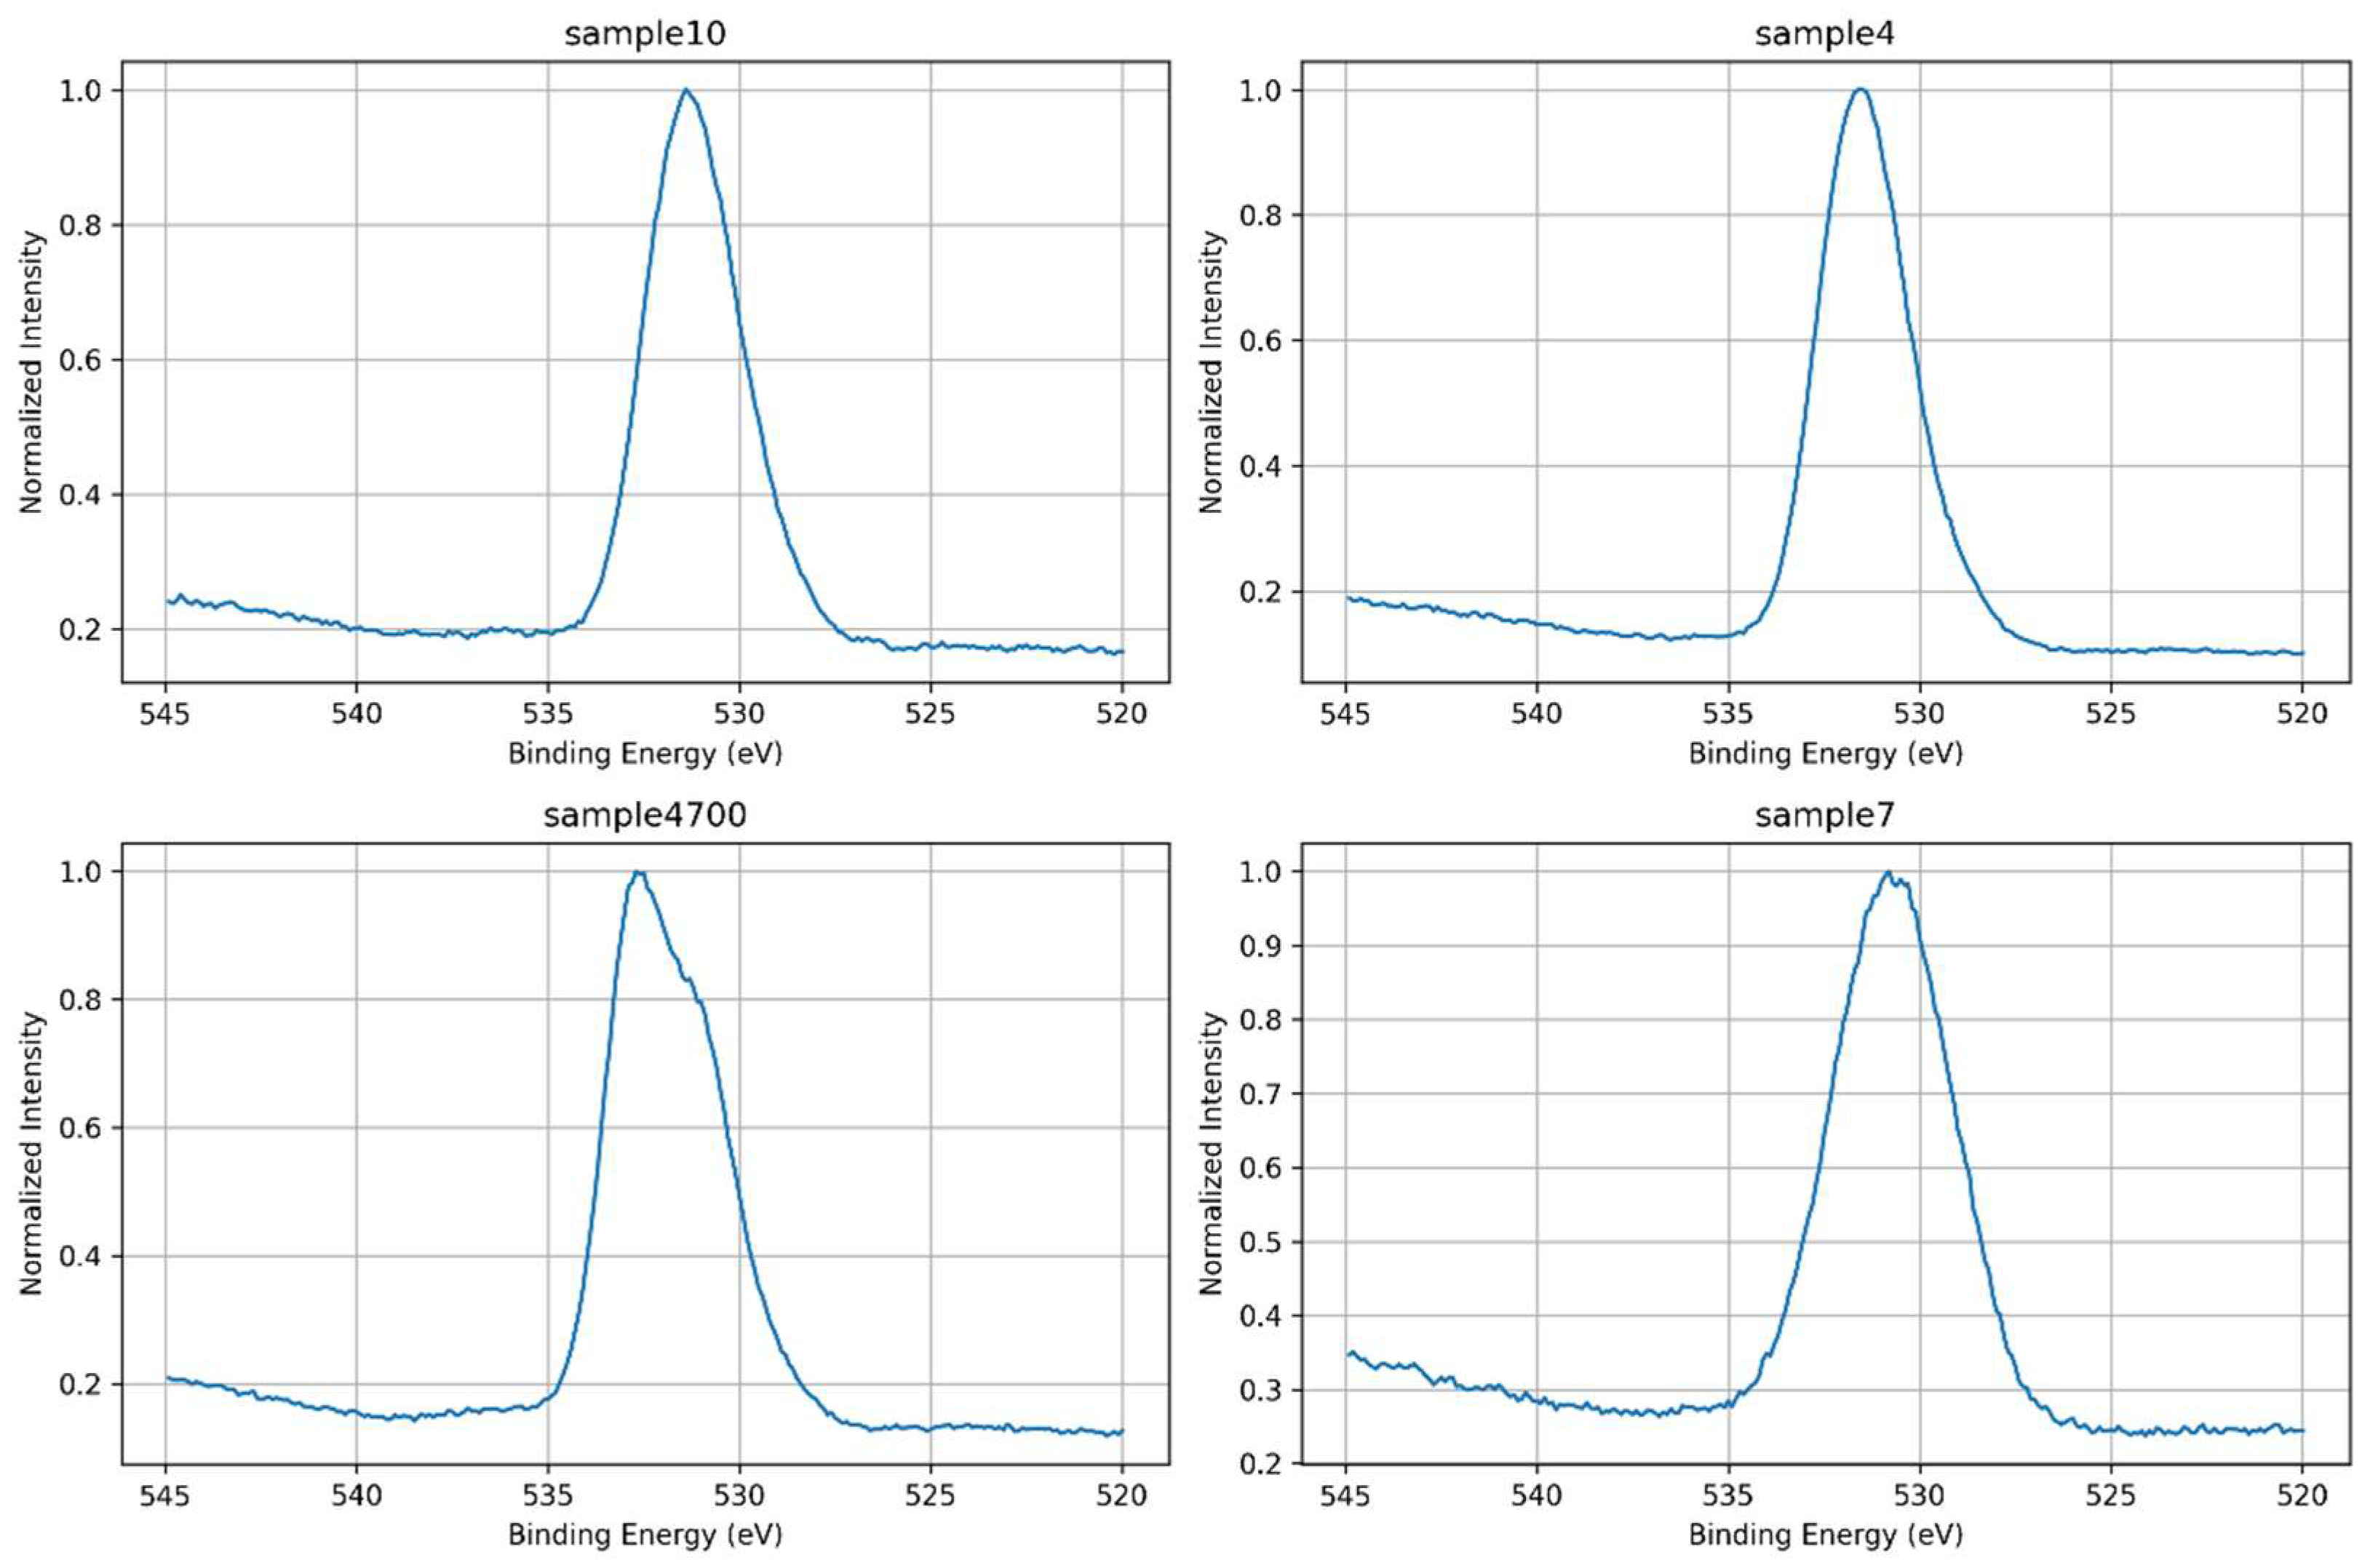
Figure 6.
Overlay of normalized O 1s spectra for all samples. The differences in peak shape and symmetry reflect the influence of synthesis water composition and thermal treatment on the oxygen environment.
Figure 6.
Overlay of normalized O 1s spectra for all samples. The differences in peak shape and symmetry reflect the influence of synthesis water composition and thermal treatment on the oxygen environment.
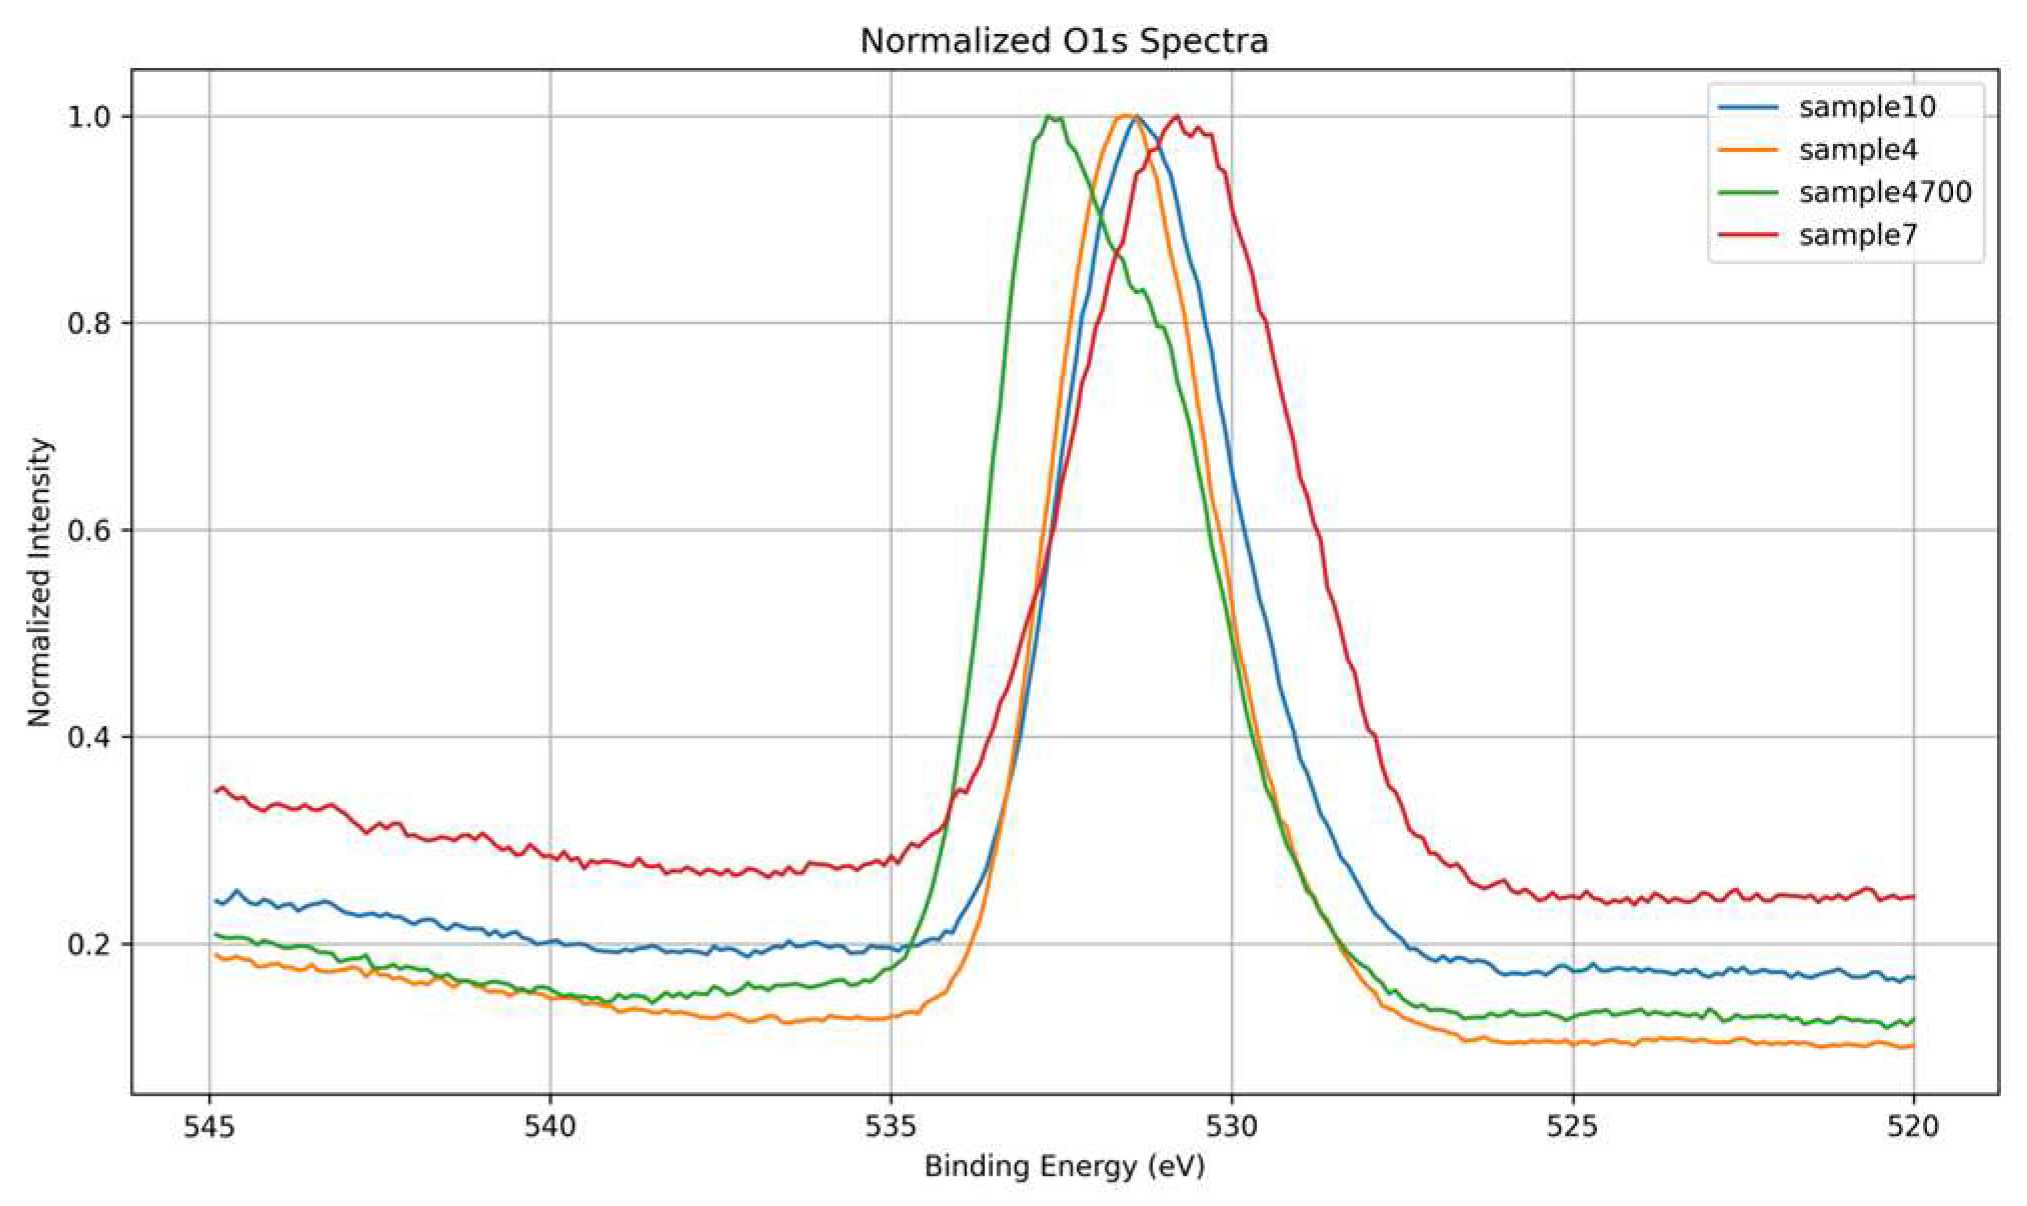
Figure 7.
Deconvoluted O 1s spectra for Samples 4 (Água Prata), 4700 (Água Prata + thermal treatment), 7 (deionized water) and 10 (Água Azeda). The fitted peaks correspond to bridging oxygens (Si–O–Si), non-bridging oxygens (Si–O⁻), and hydroxyl groups (Si–OH). Differences in peak shape and component areas reflect changes in network connectivity and local structure due to water composition and heat treatment.
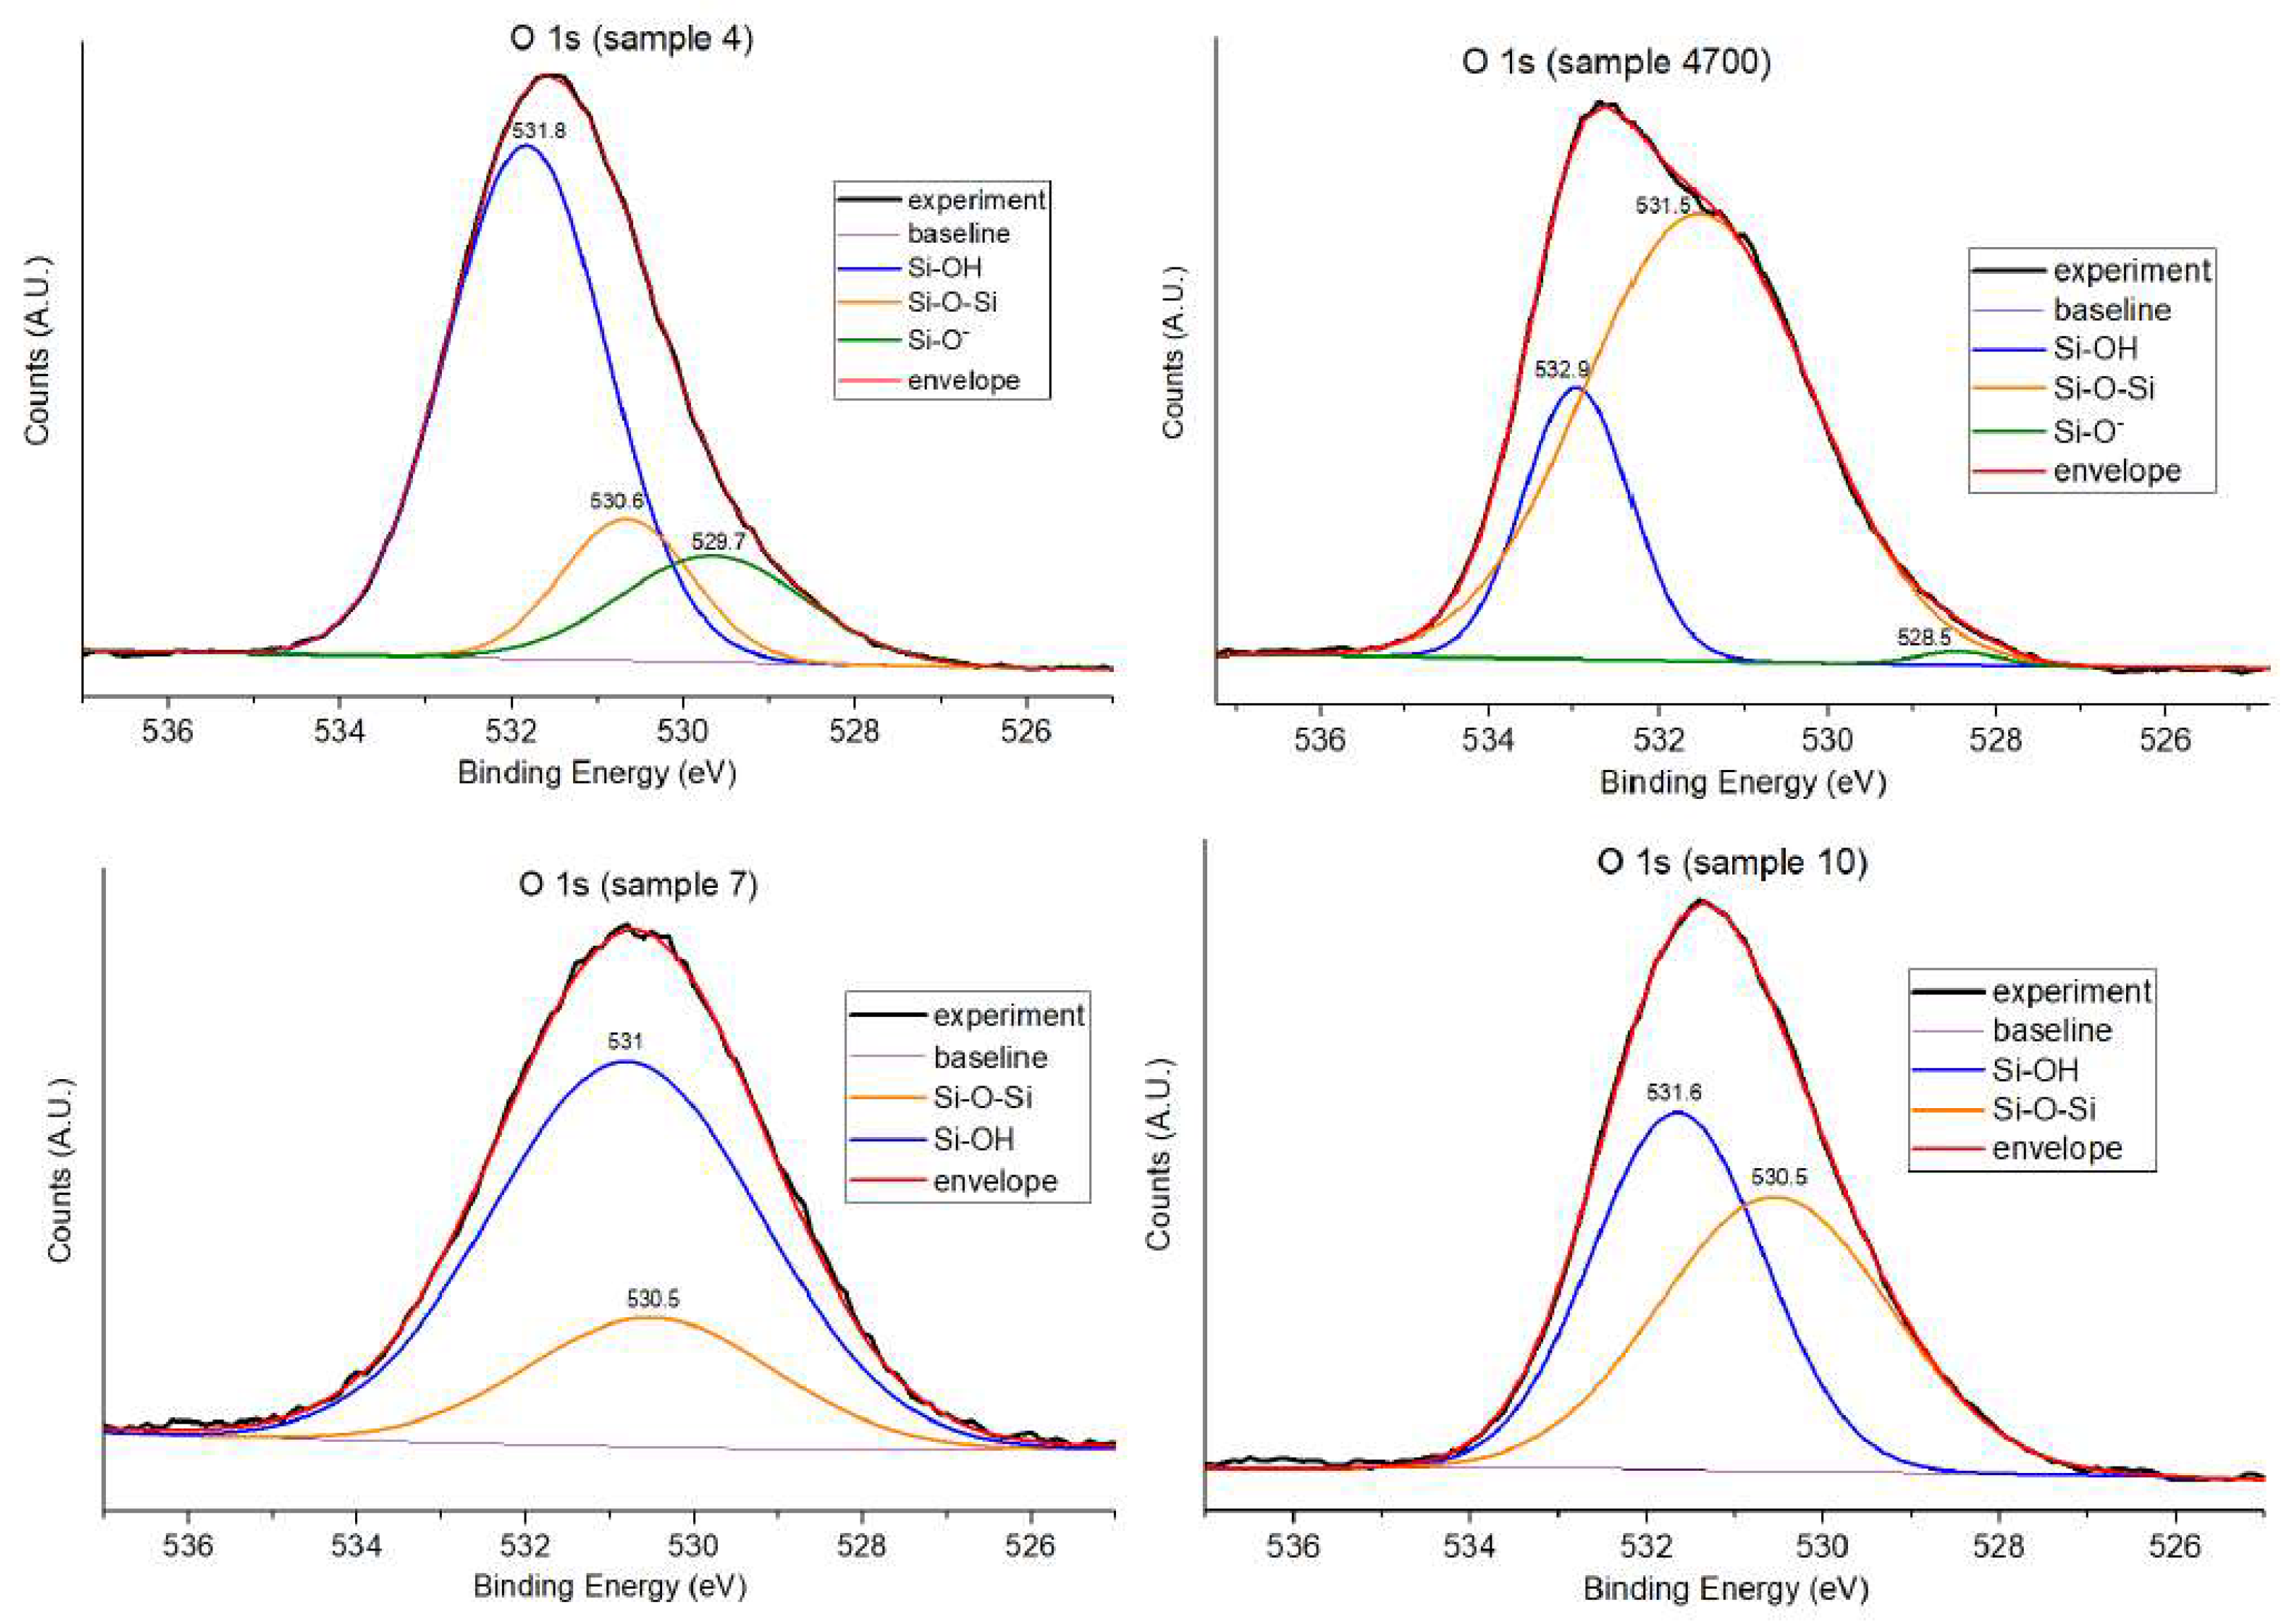
Figure 8.
High-resolution Si 2p spectra of all bioactive glass samples displayed side by side: Sample 7 (deionized water), Sample 4 and 4700 (Água Prata), and Sample 10 (Água Azeda). The peak near ~103.4 eV corresponds to Si⁴⁺ in tetrahedral SiO₄ units.
Figure 8.
High-resolution Si 2p spectra of all bioactive glass samples displayed side by side: Sample 7 (deionized water), Sample 4 and 4700 (Água Prata), and Sample 10 (Água Azeda). The peak near ~103.4 eV corresponds to Si⁴⁺ in tetrahedral SiO₄ units.
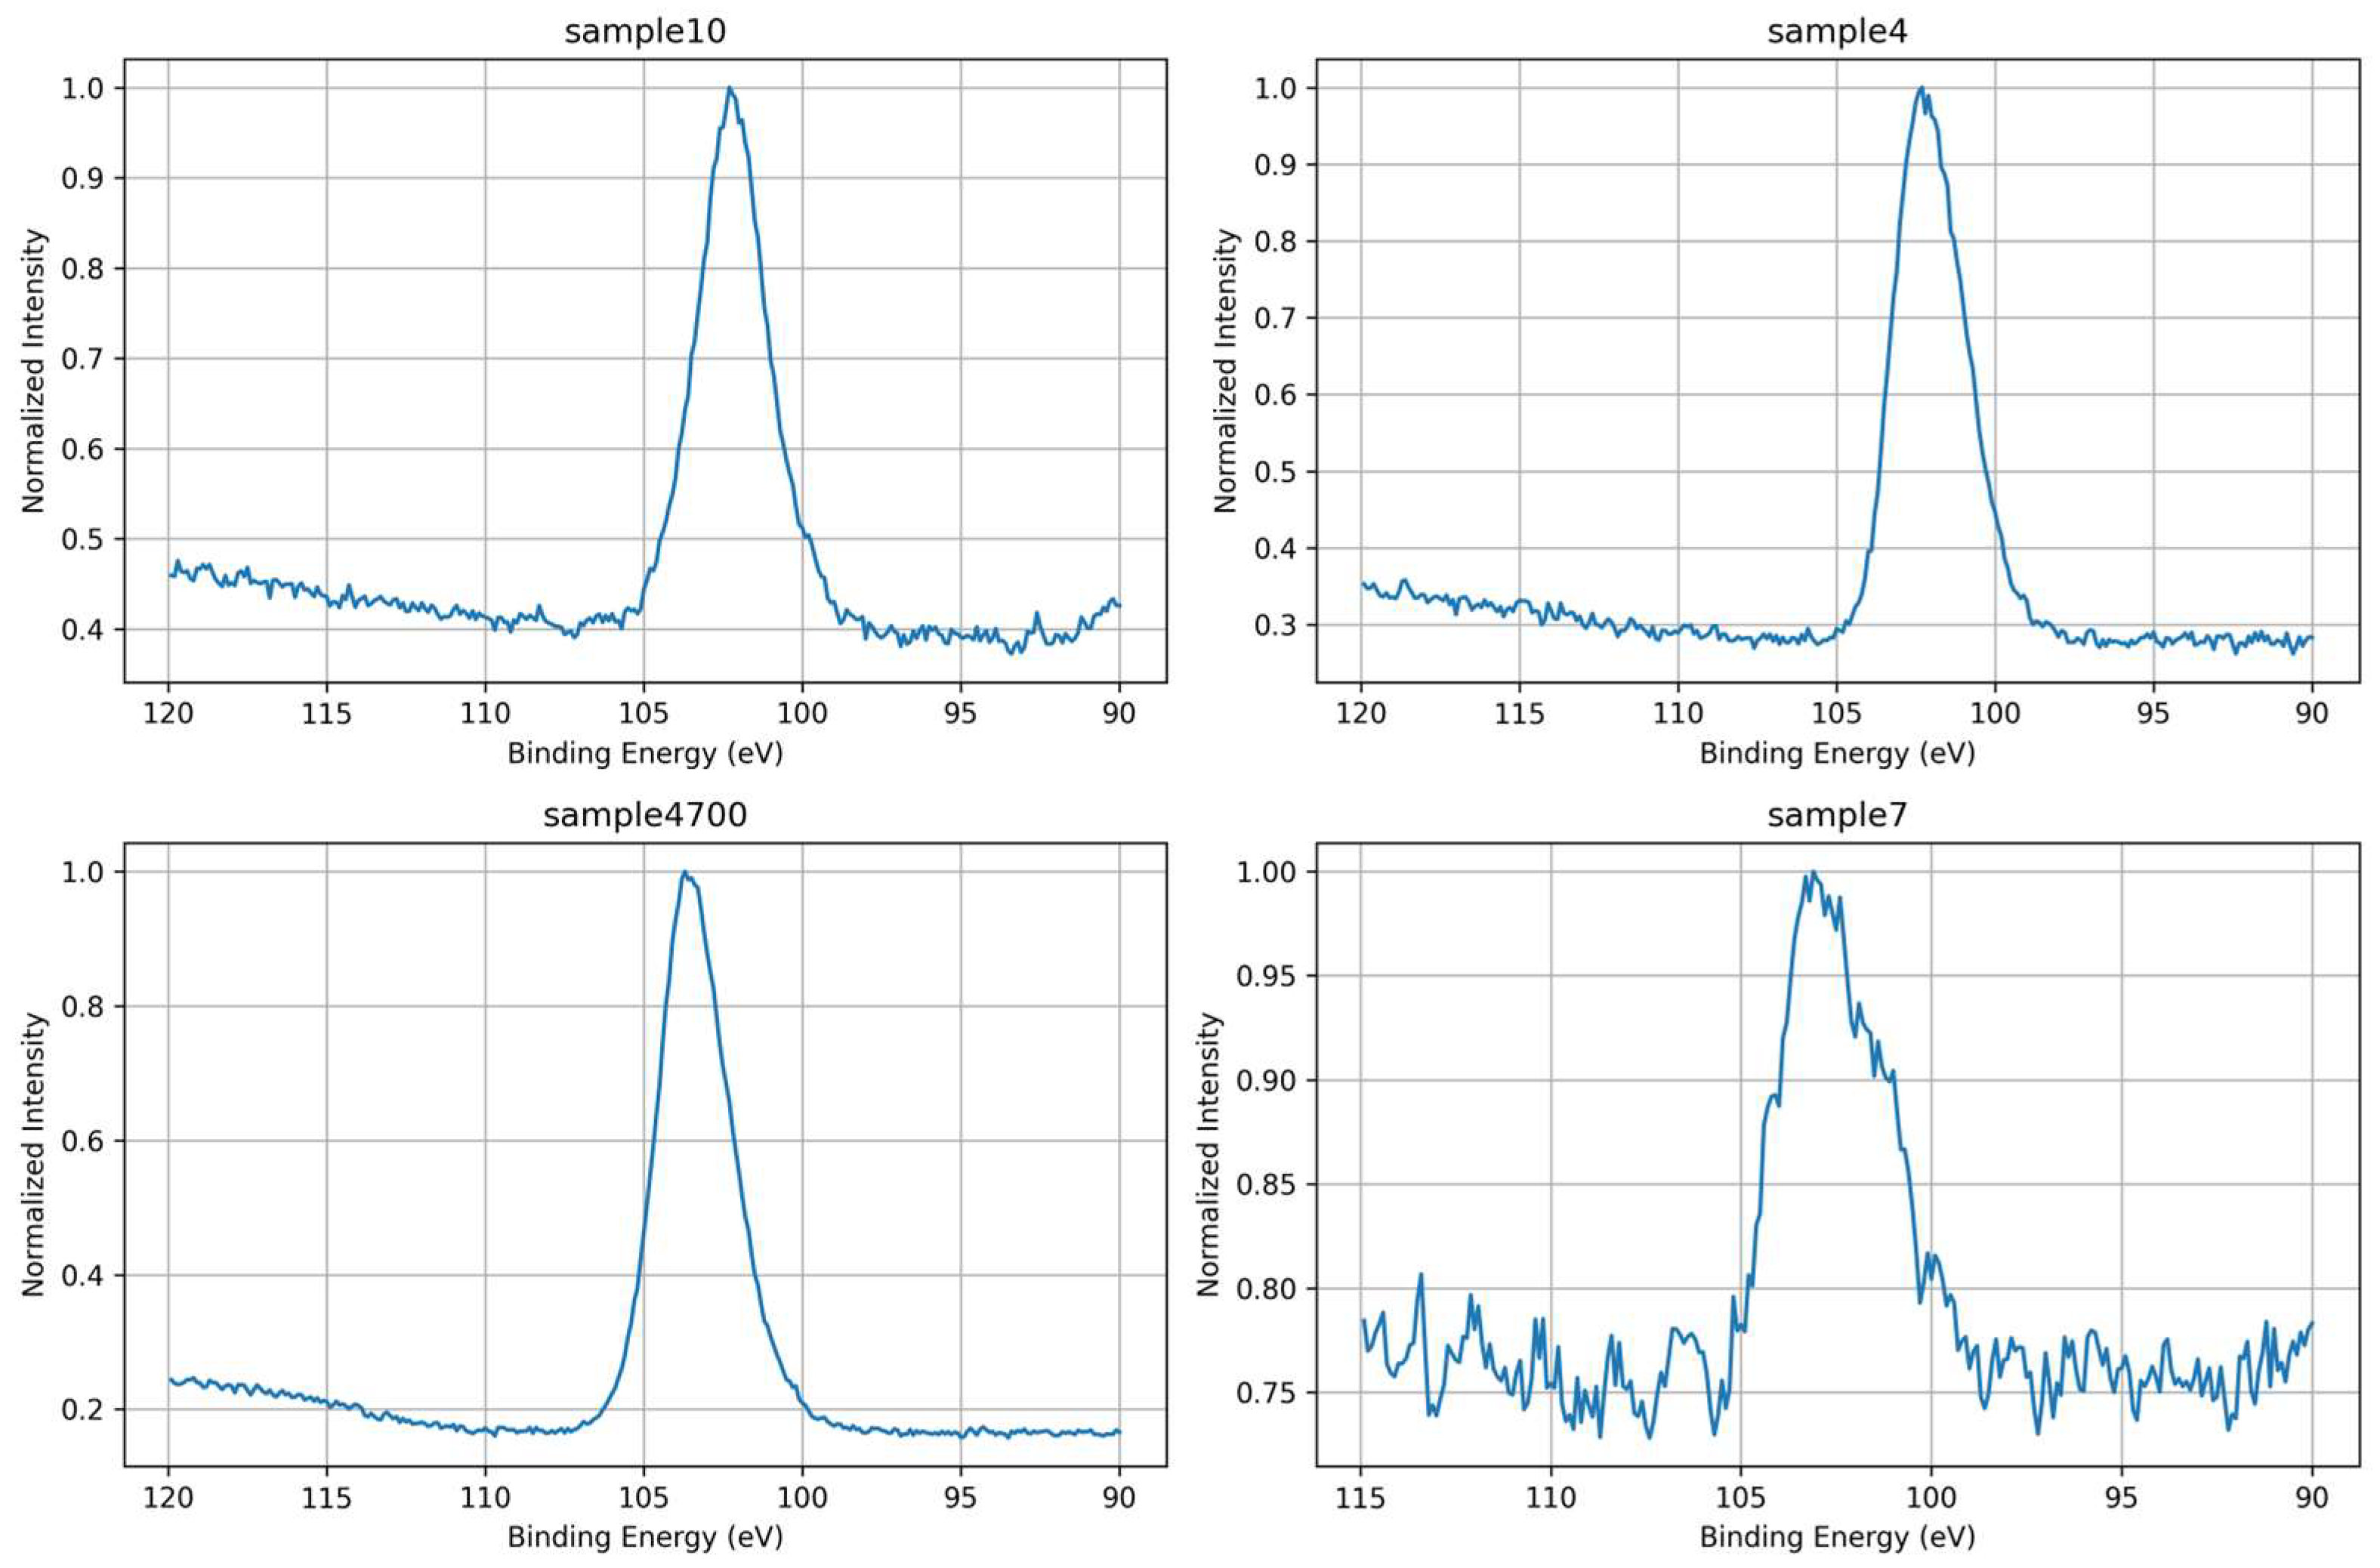
Figure 9.
Overlay of normalized Si 2p spectra for all samples, illustrating differences in peak sharpness and symmetry. Sample 7 shows the broadest and most asymmetric peak, reflecting a less polymerized network, while Samples 4, 4700, and 10 show narrower profiles consistent with increased structural order.
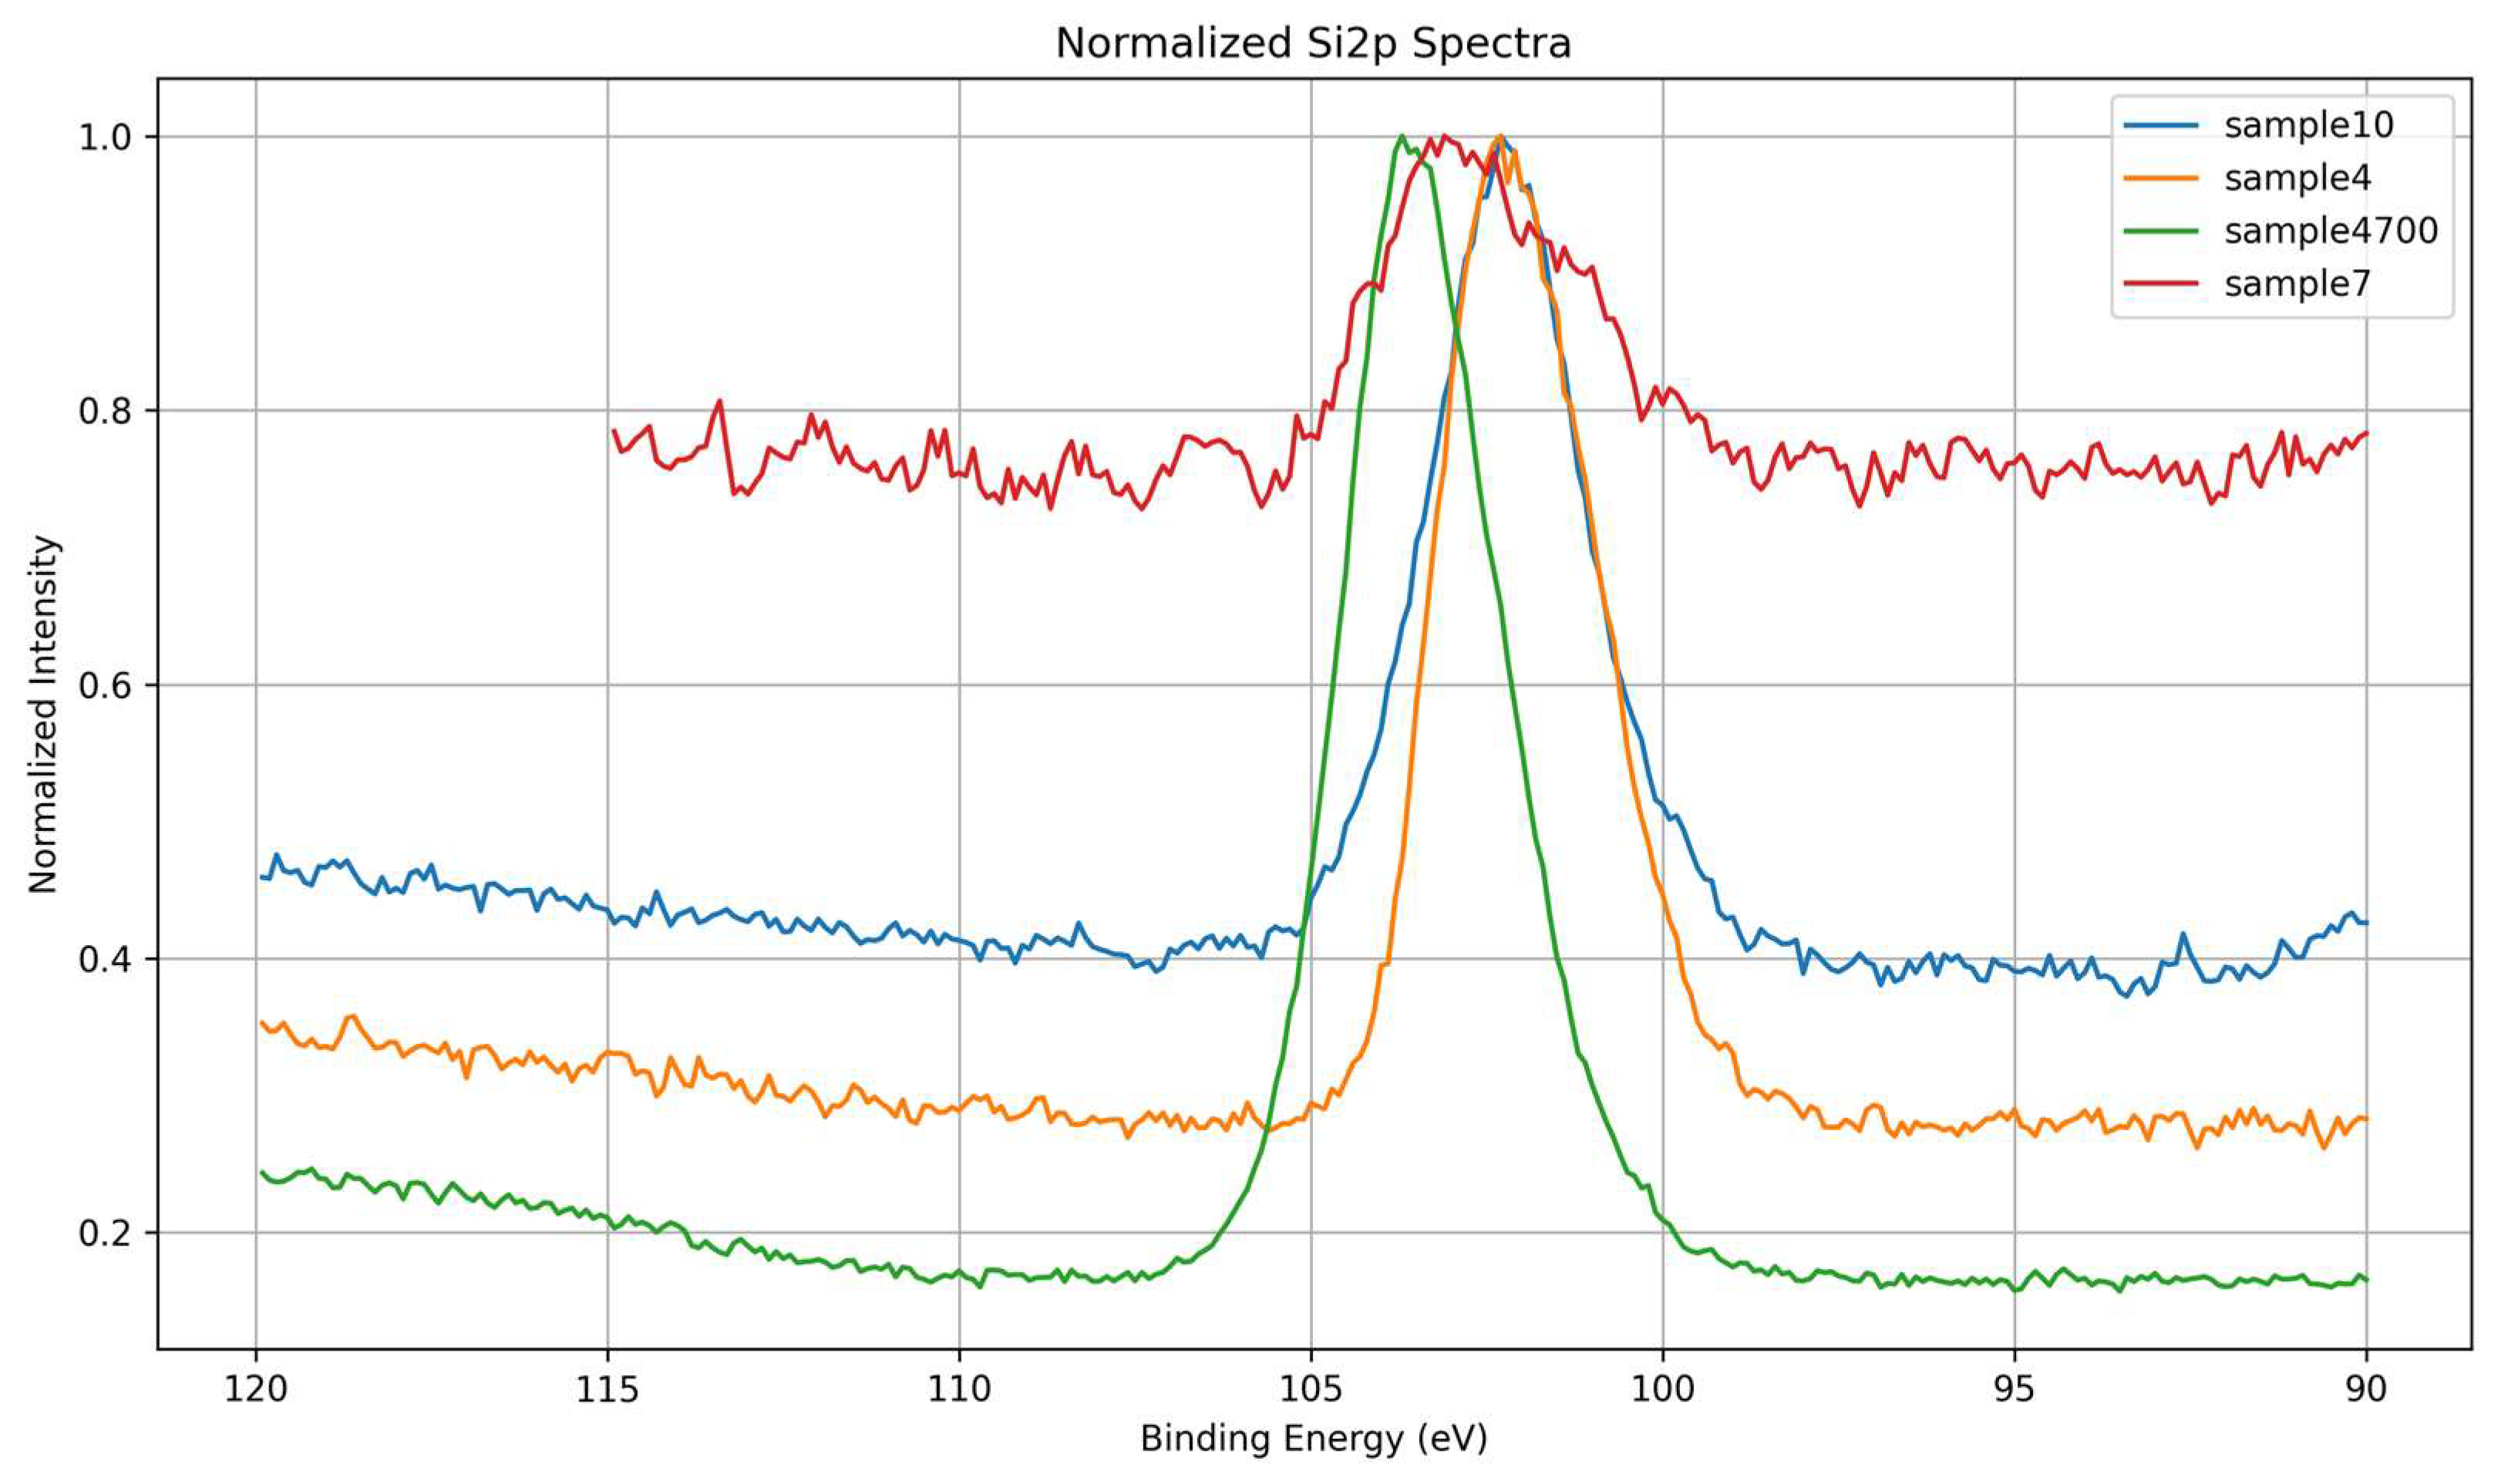
Figure 10.
Deconvoluted Si 2p spectra for Samples 7 and 4700. Sample 7 exhibits dominant low-binding-energy components (~102.4 eV), consistent with Q²/Q³ species, while Sample 4700 shows a shift toward higher-binding-energy Q³/Q⁴ components (~103.1–103.7 eV), indicating increased network polymerization.
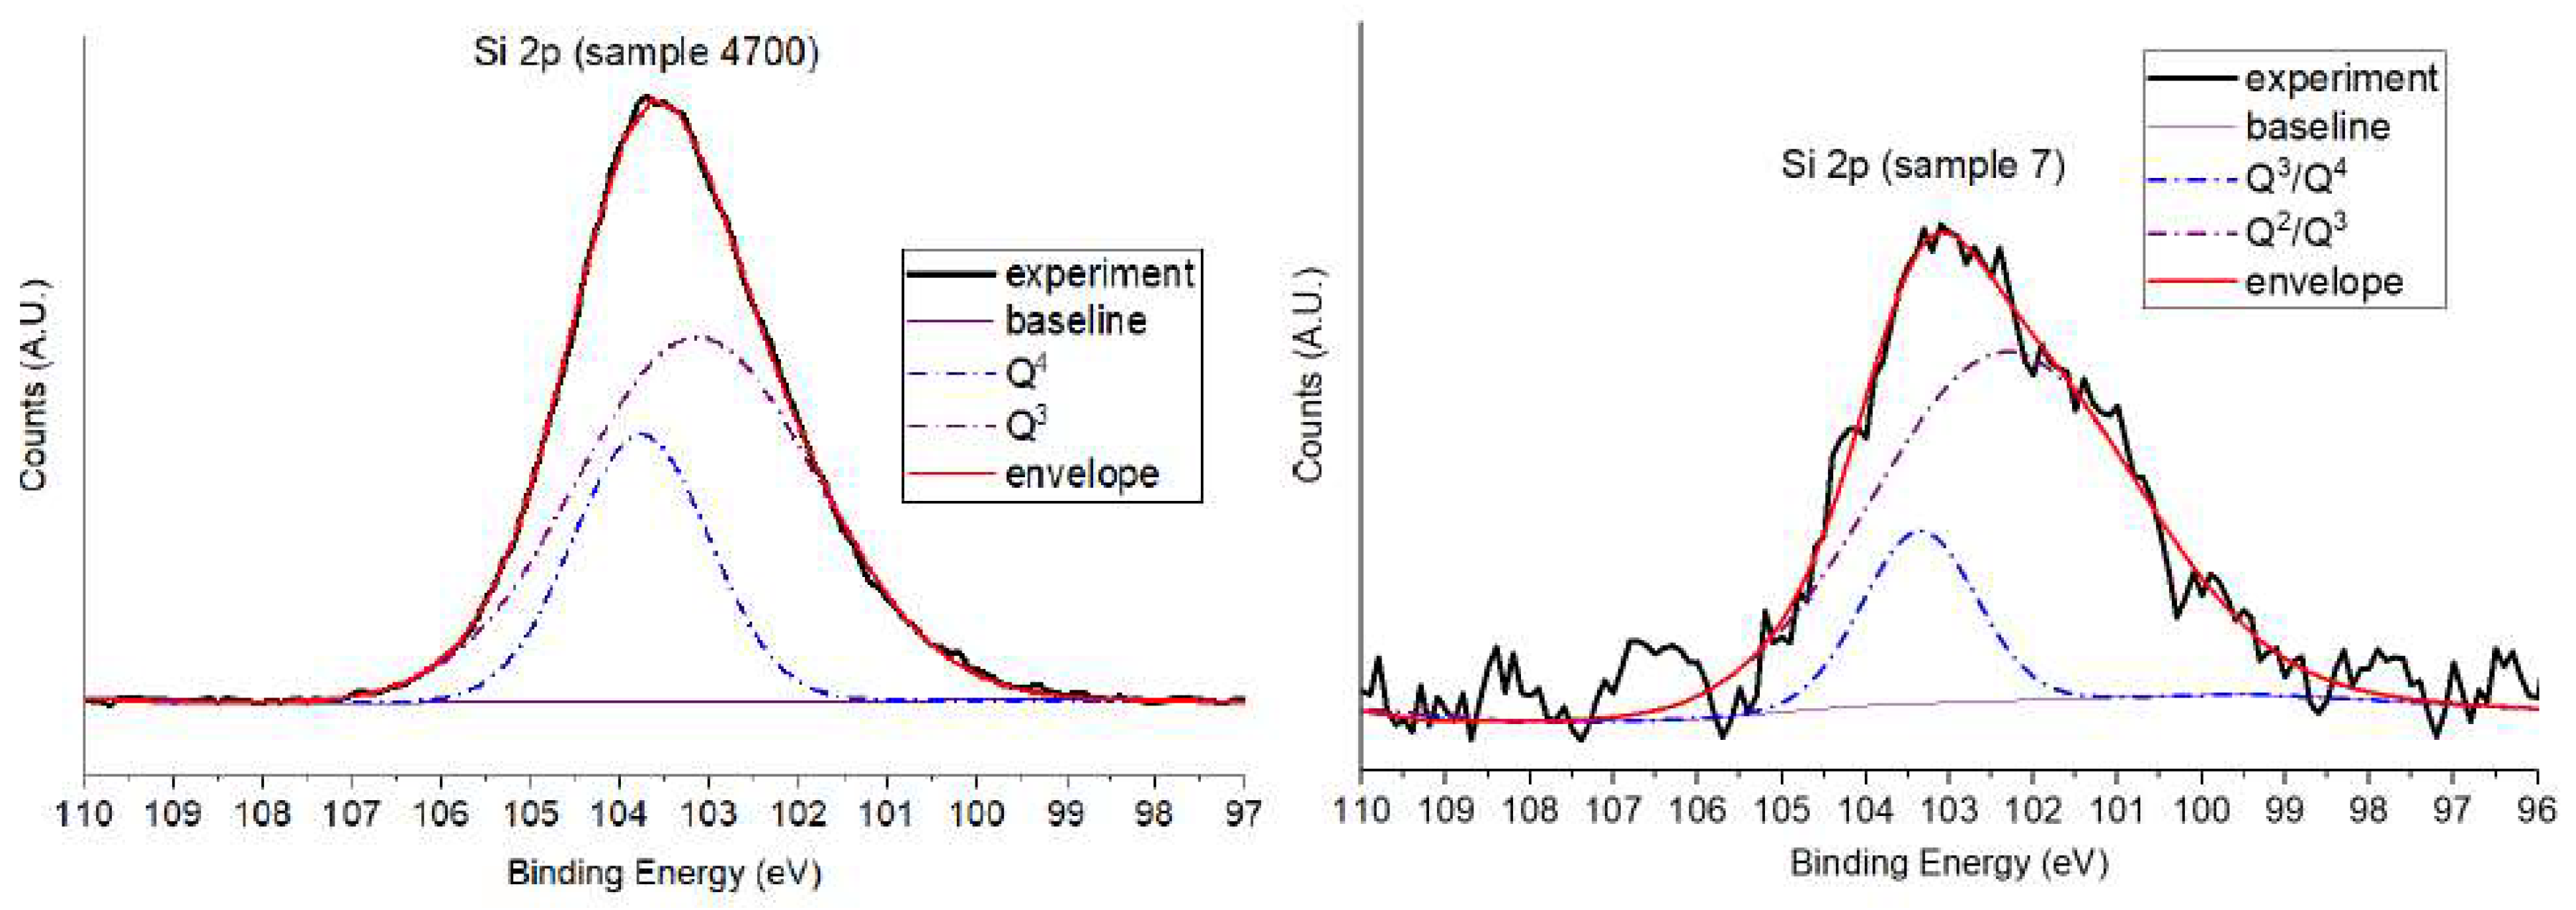
Figure 11.
High-resolution P 2p core-level XPS spectra for Samples 7, 4, and 4700. The main peak at ~133.5 eV corresponds to phosphorus in tetrahedral PO₄³⁻ coordination.
Figure 11.
High-resolution P 2p core-level XPS spectra for Samples 7, 4, and 4700. The main peak at ~133.5 eV corresponds to phosphorus in tetrahedral PO₄³⁻ coordination.
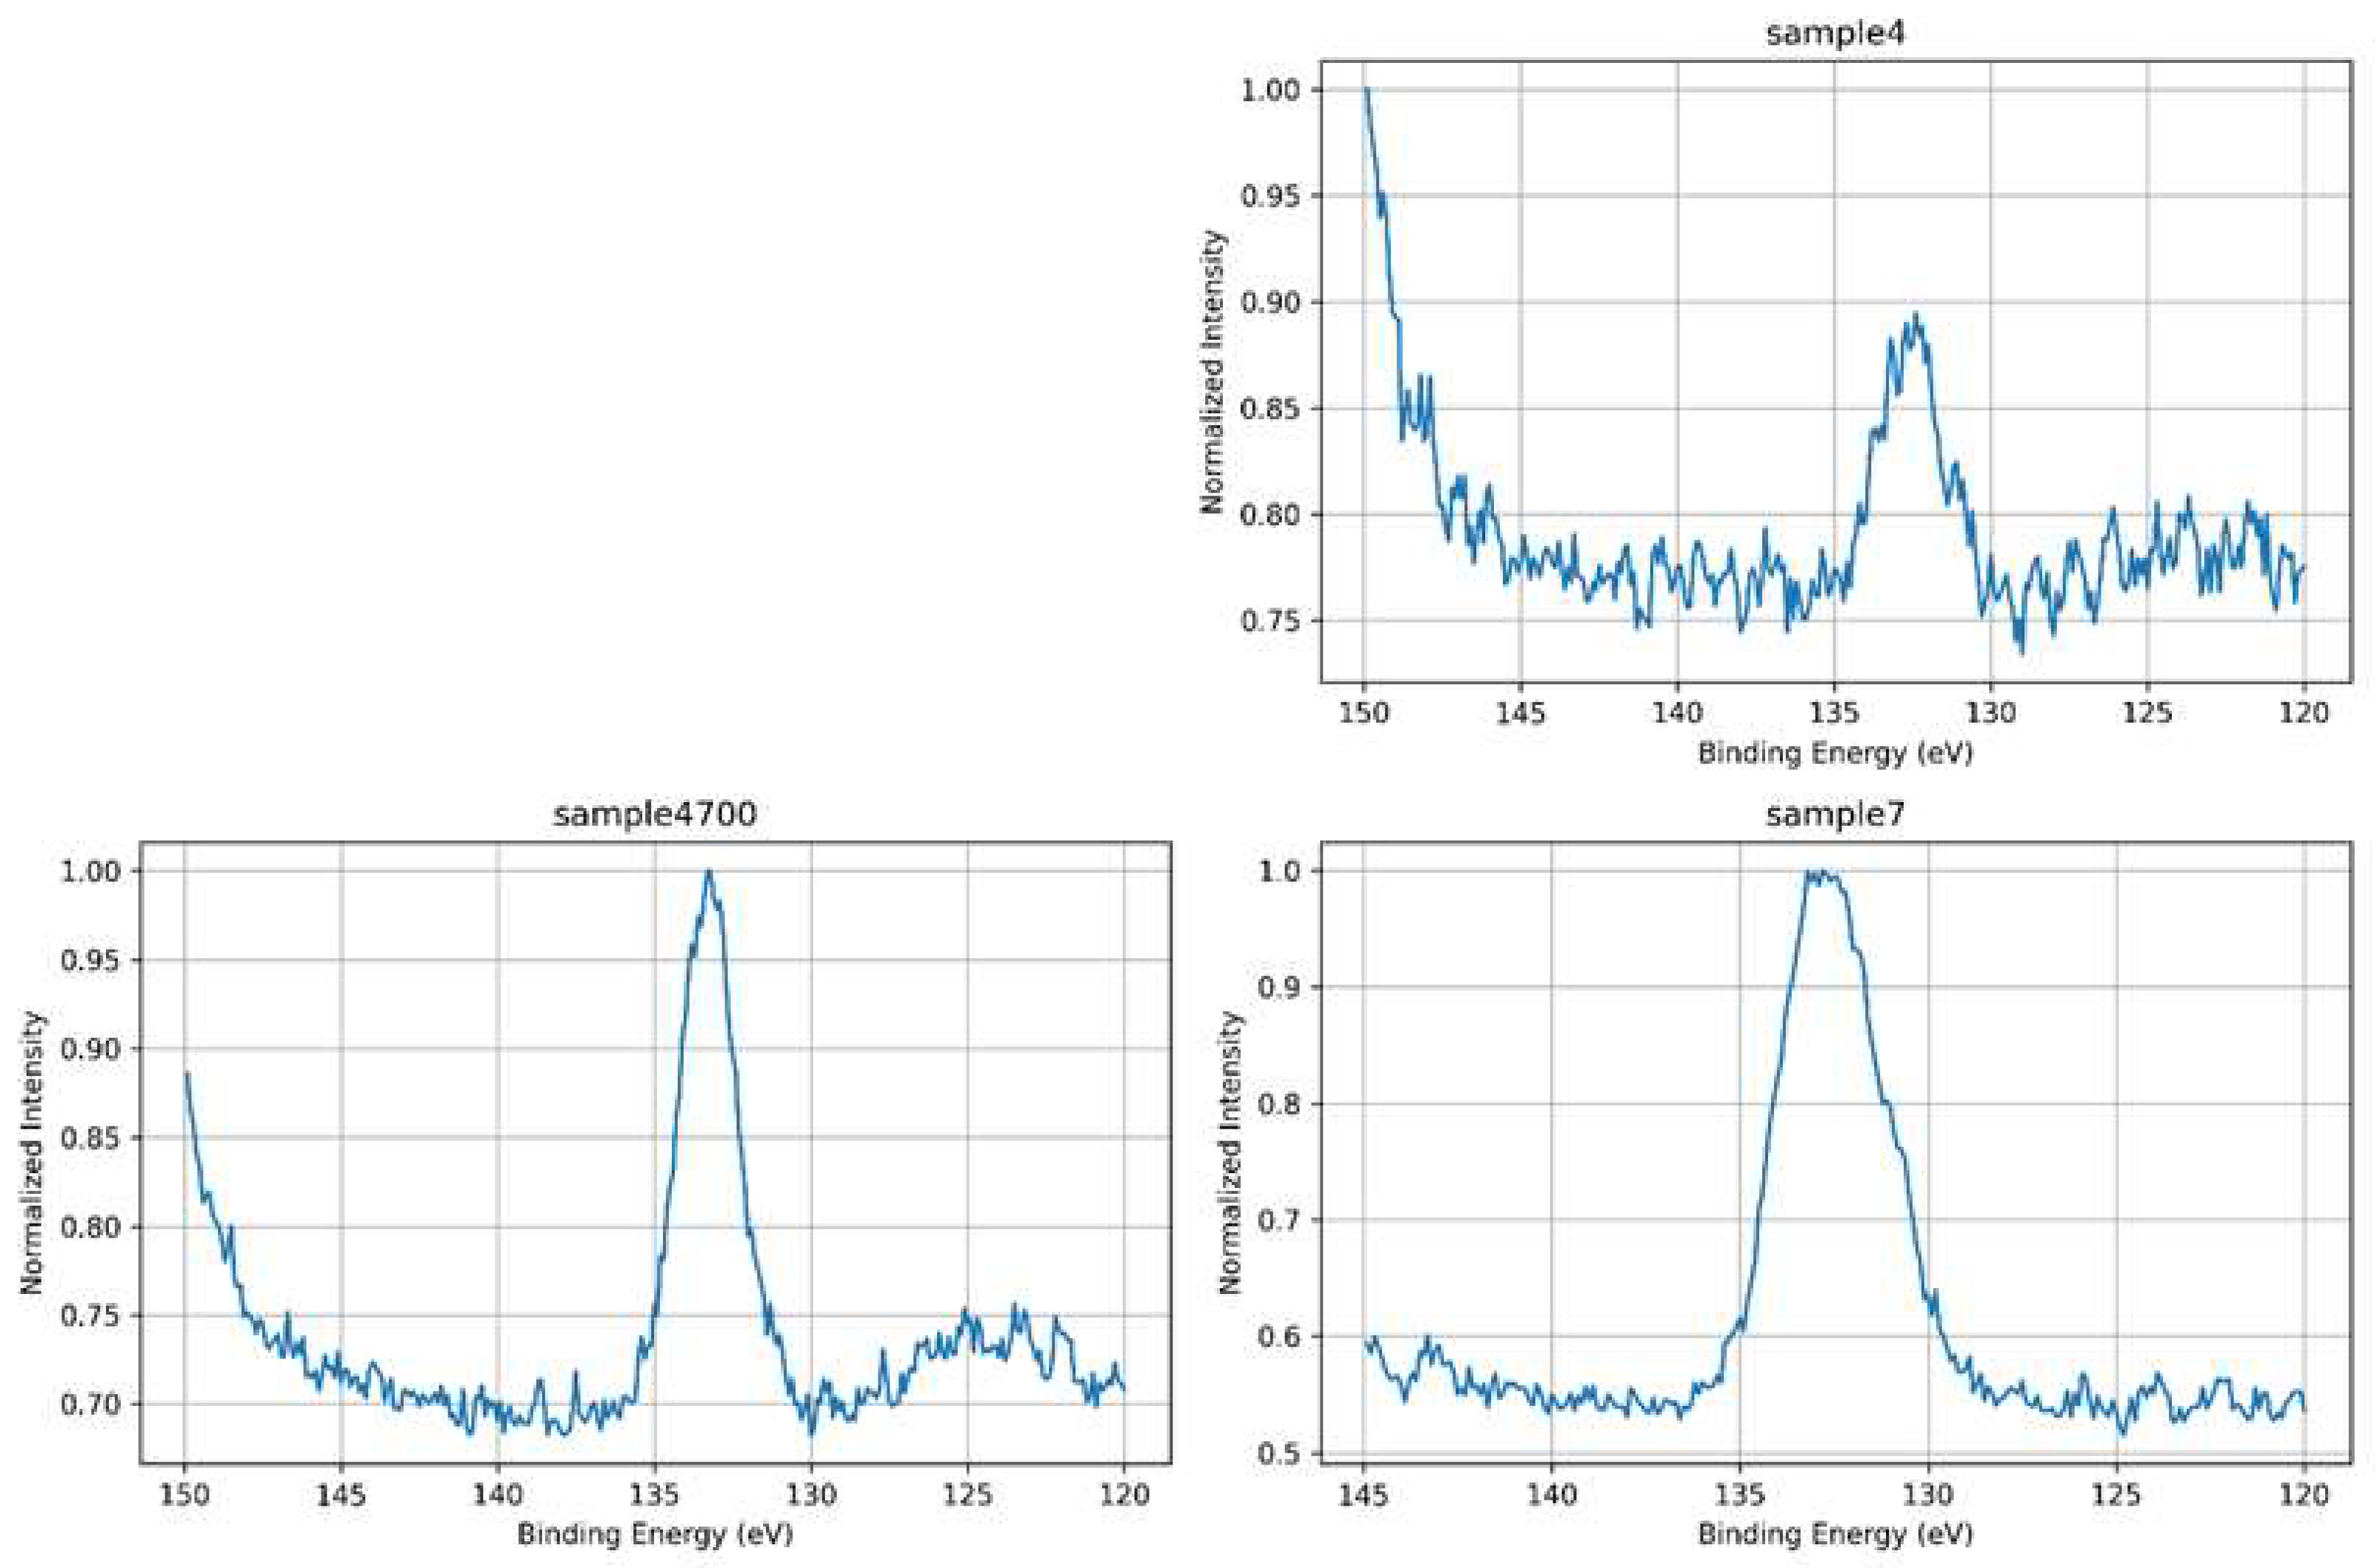
Figure 12.
Overlaid normalized P 2p spectra highlighting peak shape differences among the three samples that contain P2O5.
Figure 12.
Overlaid normalized P 2p spectra highlighting peak shape differences among the three samples that contain P2O5.
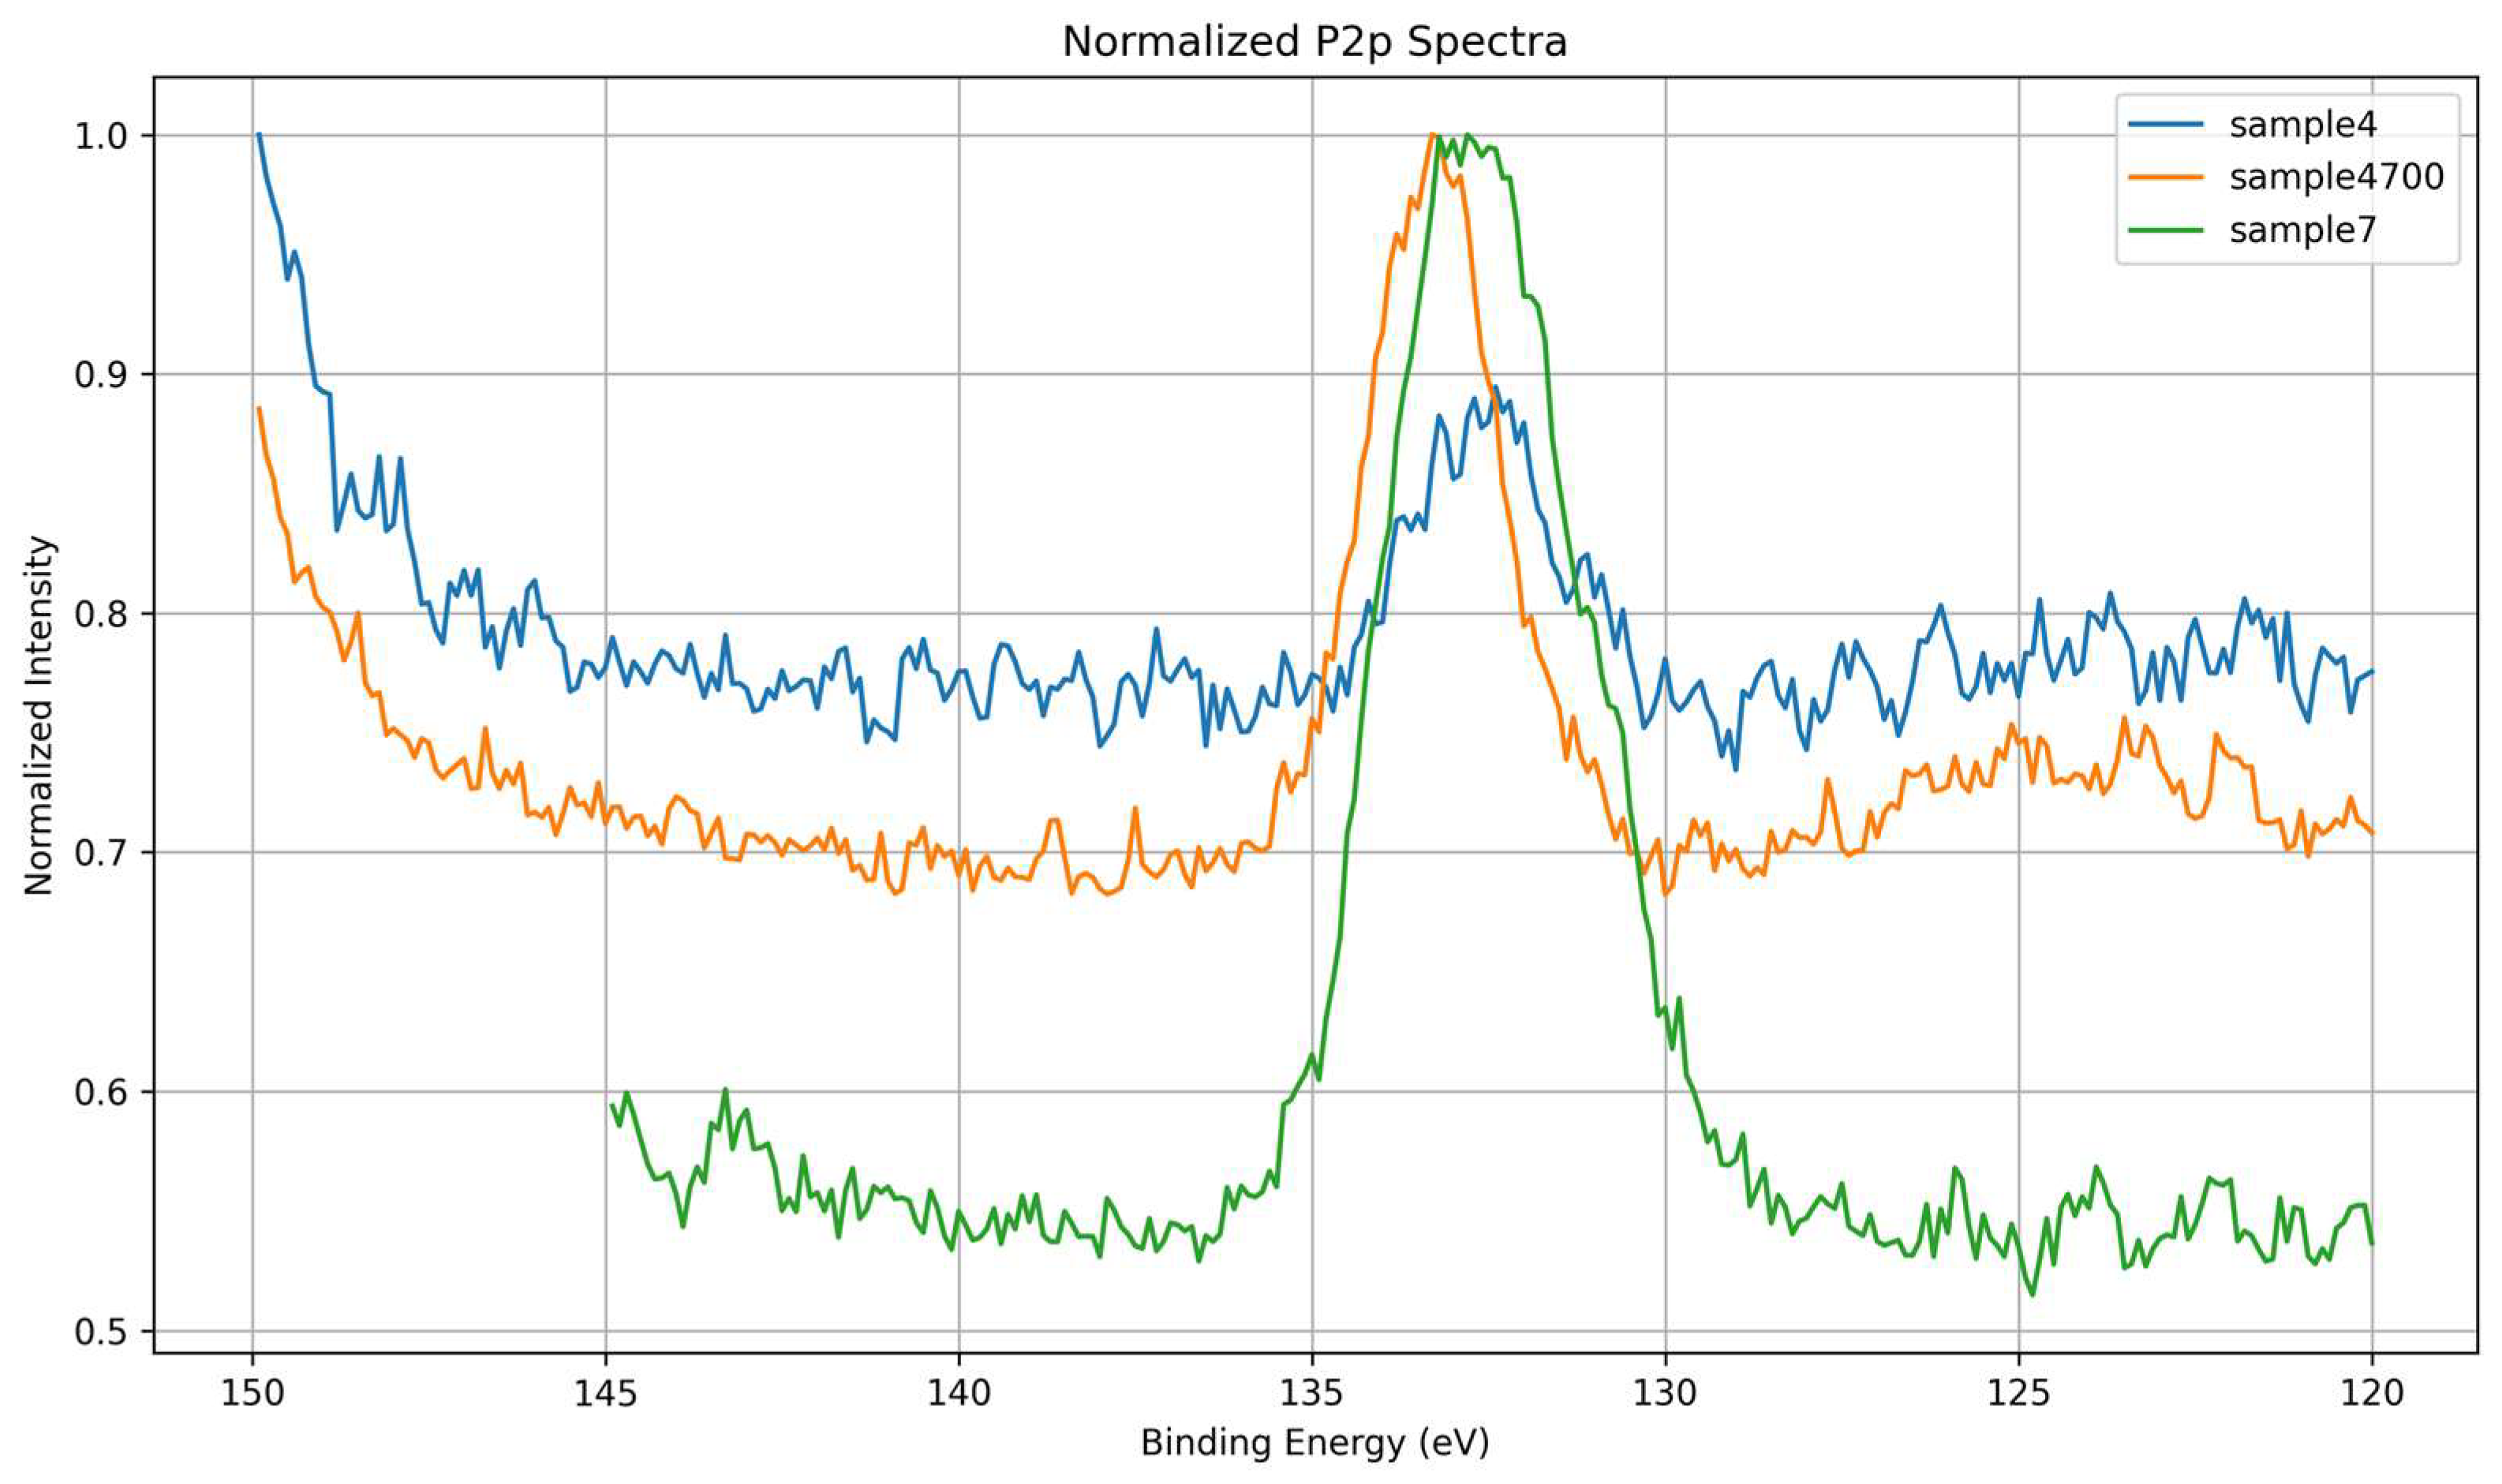
Figure 13.
Deconvoluted P 2p spectra for Sample 4, exhibiting two peaks (133.5, 134.7 eV), assigned, respectively, to PO₄³⁻, PO₄³⁻ + modifier, and reveling a heterogeneous local environment.
Figure 13.
Deconvoluted P 2p spectra for Sample 4, exhibiting two peaks (133.5, 134.7 eV), assigned, respectively, to PO₄³⁻, PO₄³⁻ + modifier, and reveling a heterogeneous local environment.
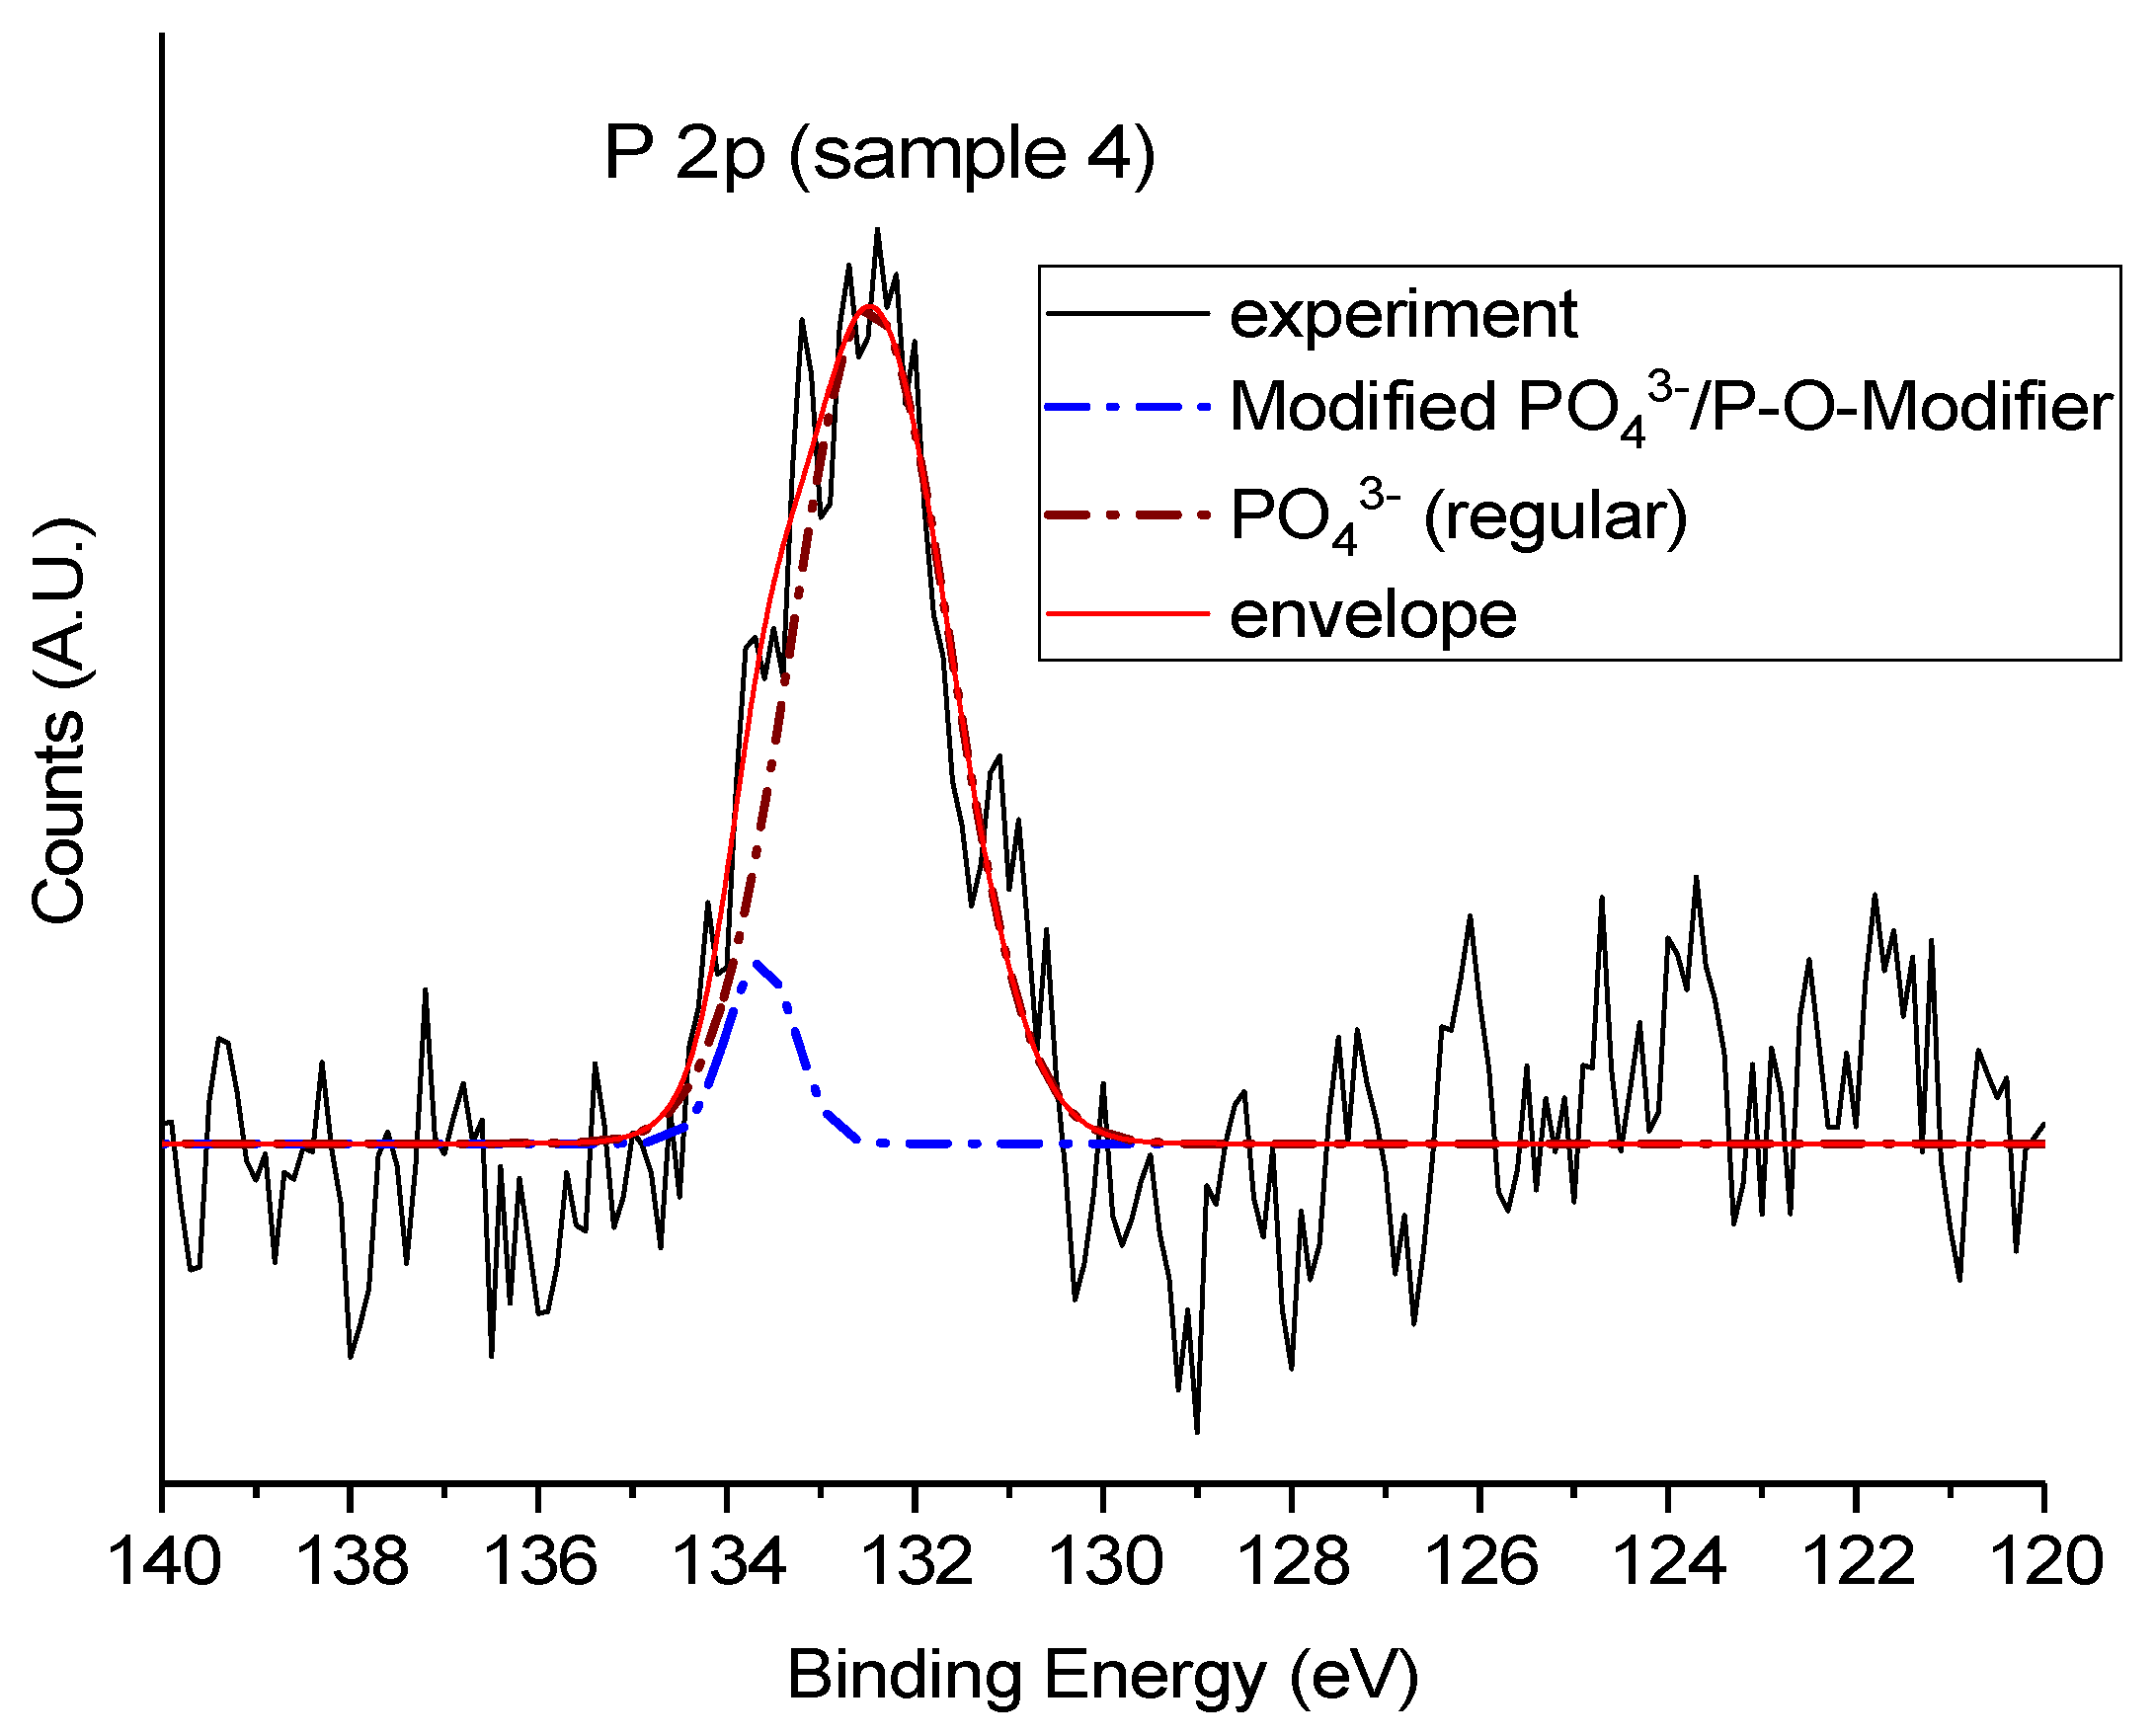
Figure 14.
High-resolution Ca 2p spectra of bioactive glass samples: Sample 7 (deionized water), Samples 4 and 4700 (Água Prata), and Sample 10 (Água Azeda). The Ca 2p doublet (~347.2 and ~350.7 eV) exhibits differences in peak shape and intensity, reflecting variations in calcium coordination and local structure influenced by synthesis and thermal treatment.
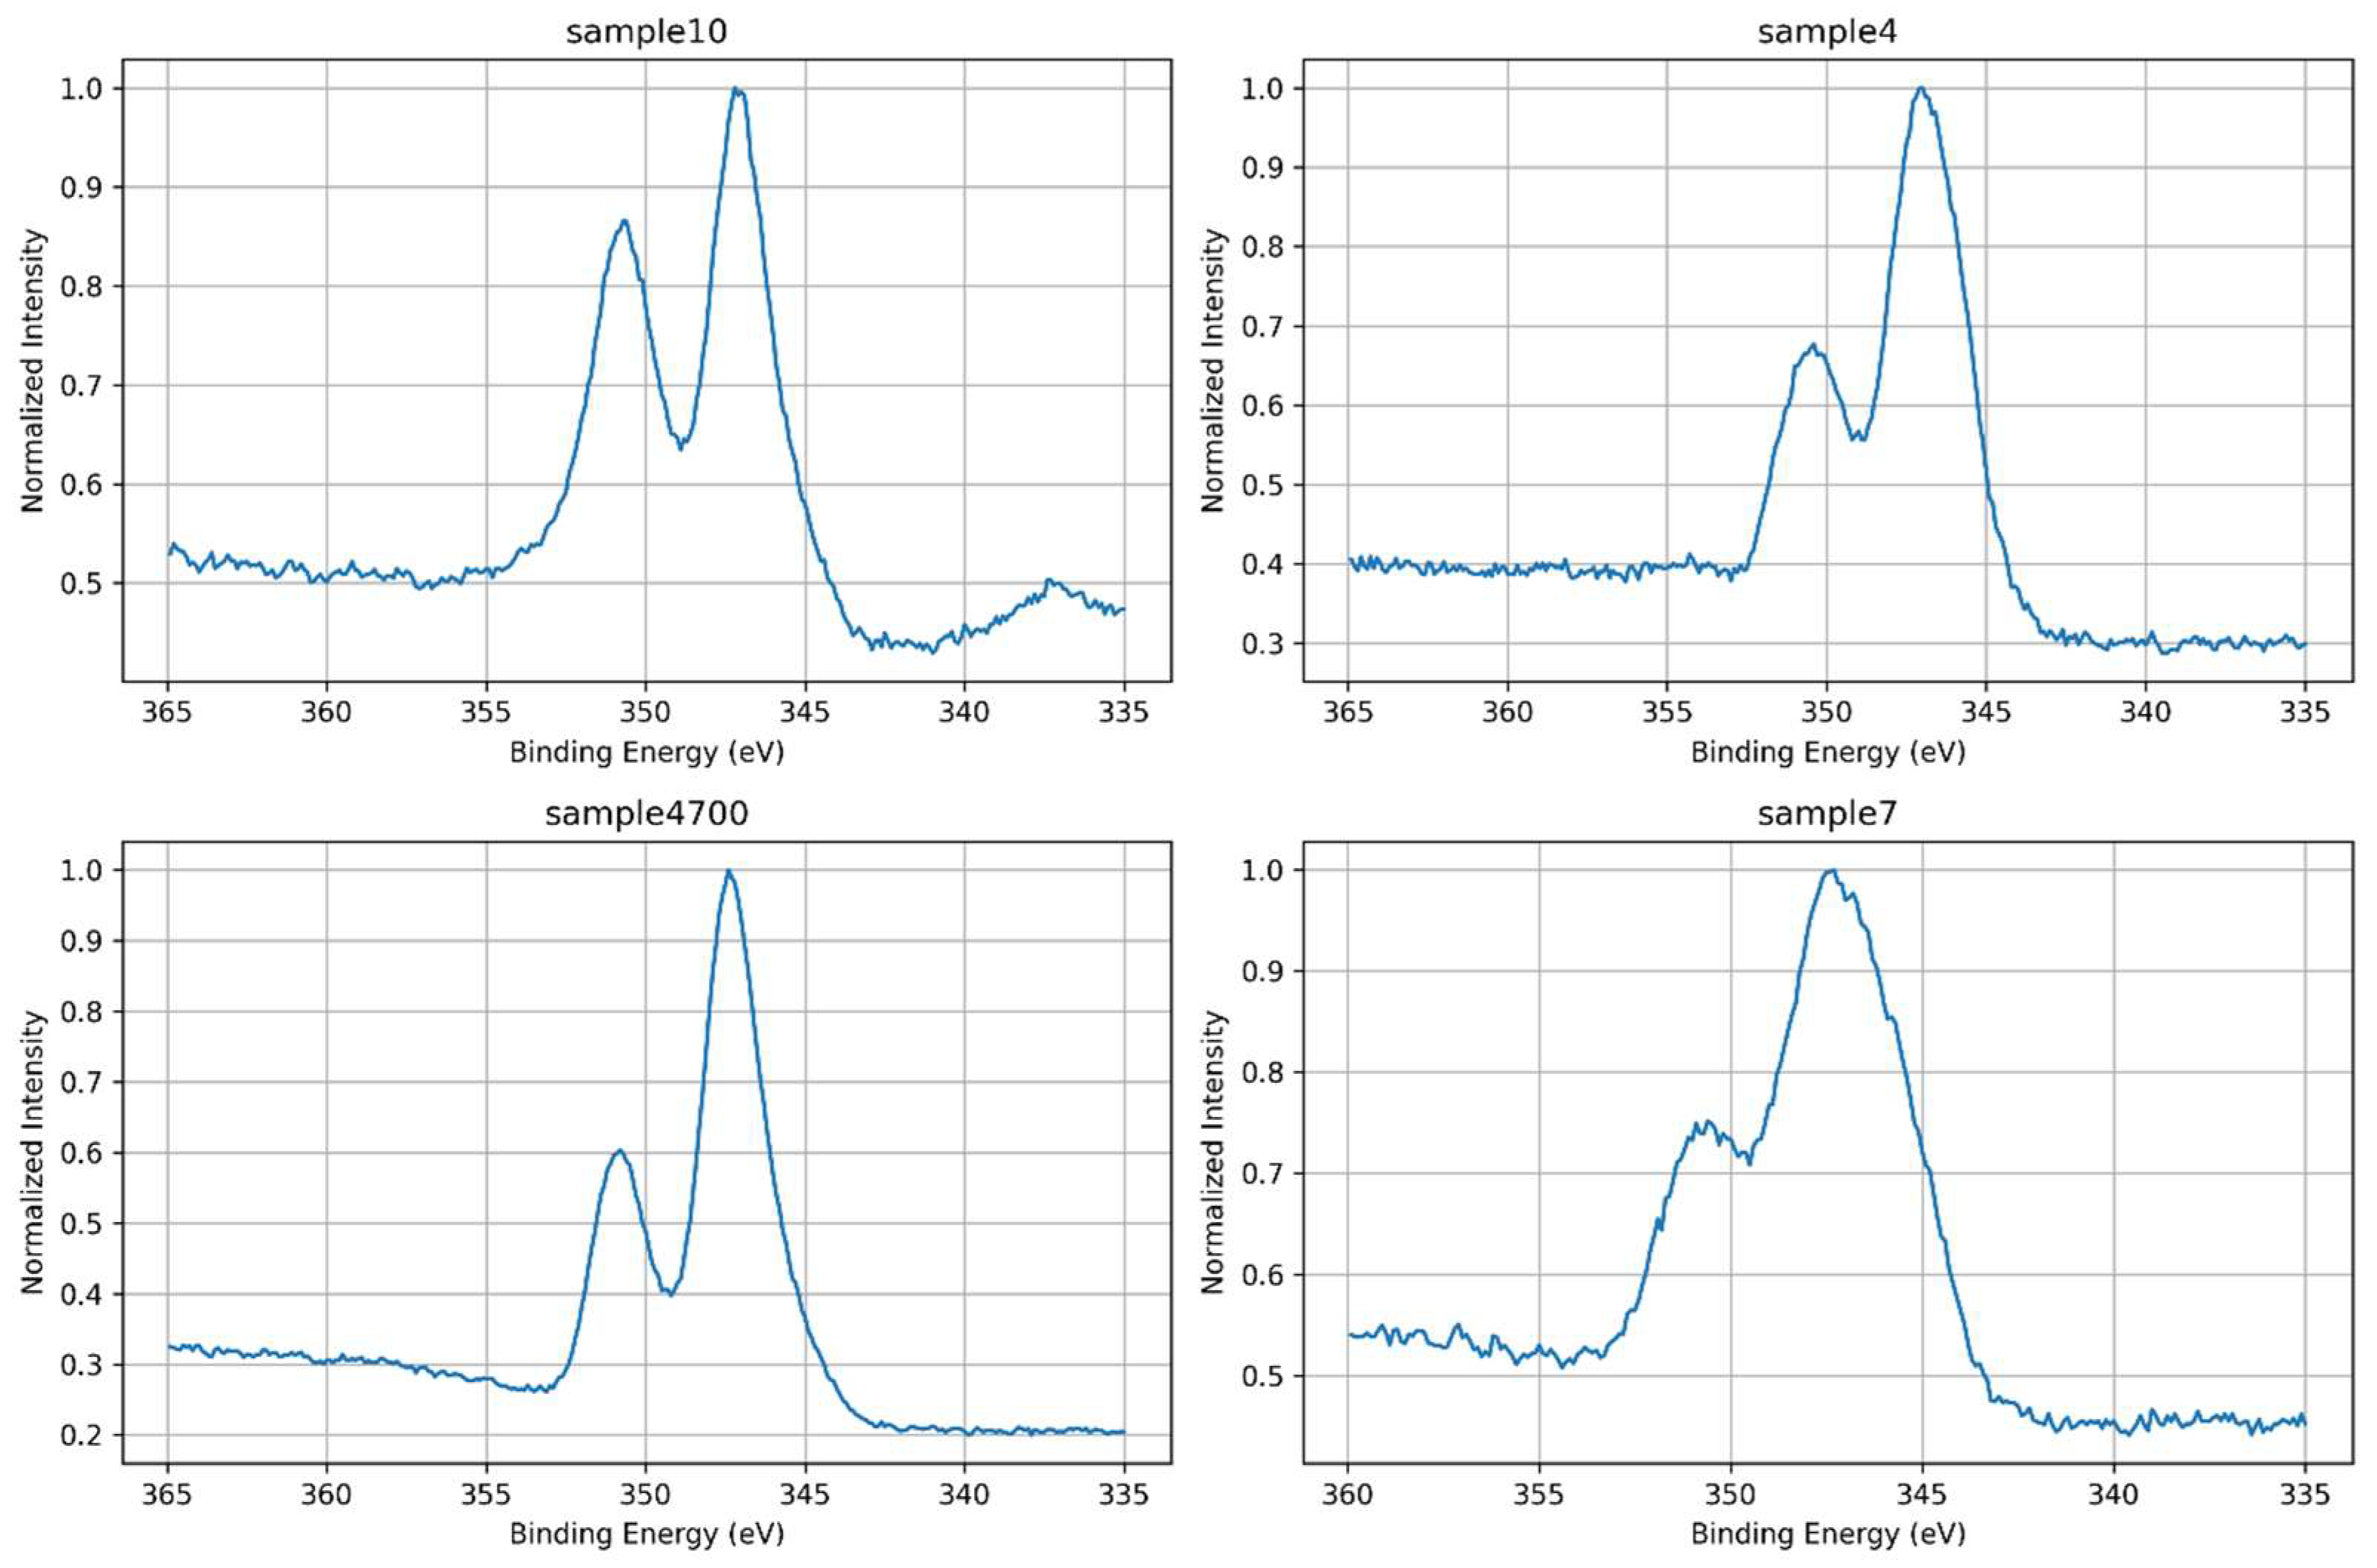
Figure 15.
Overlay of normalized Ca 2p spectra for all samples. Sample 4700 shows the sharpest and most intense peaks, consistent with enhanced network consolidation after thermal treatment. Broader, less symmetric peaks in Samples 7 and 10 indicate increased chemical heterogeneity and disorder in calcium environments.
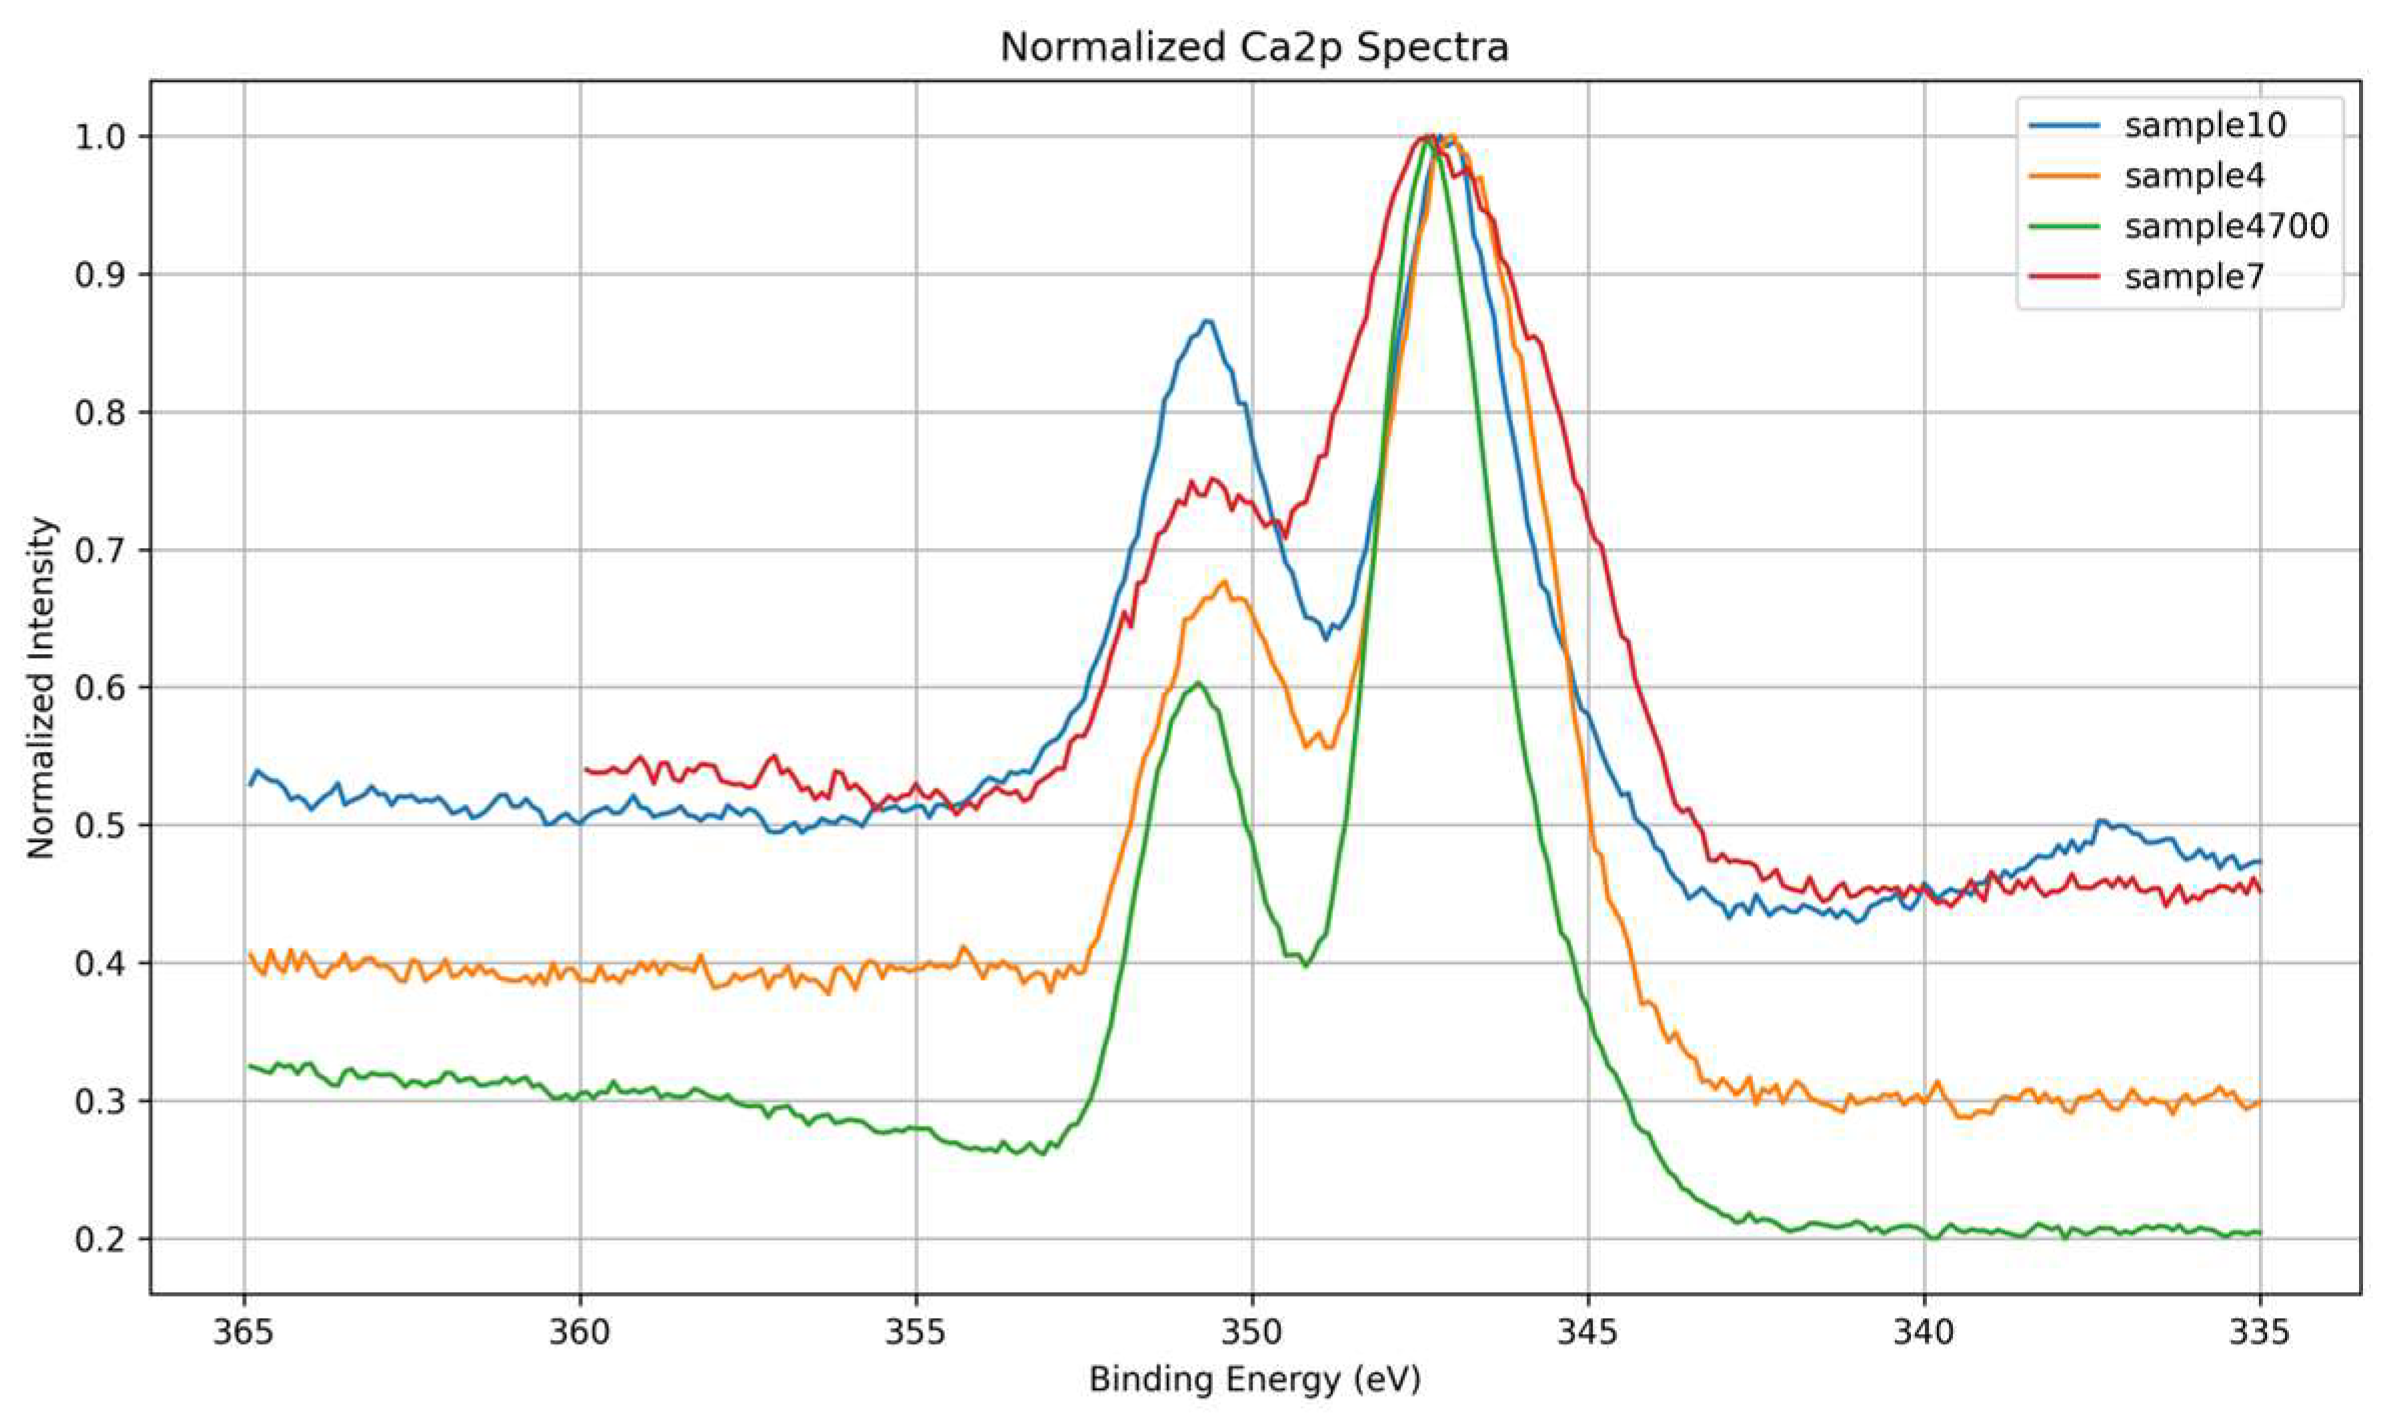
Figure 16.
Deconvoluted Ca 2p spectra of Samples 4 and 7. Two distinct calcium coordination environments are resolved: a lower binding energy component (~347.2 eV) attributed to calcium phosphate species, and a higher binding energy component (~347.8–348.2 eV) assigned to Ca²⁺ coordinated to silicate or carbonate-like groups, demonstrating chemical heterogeneity in these samples.
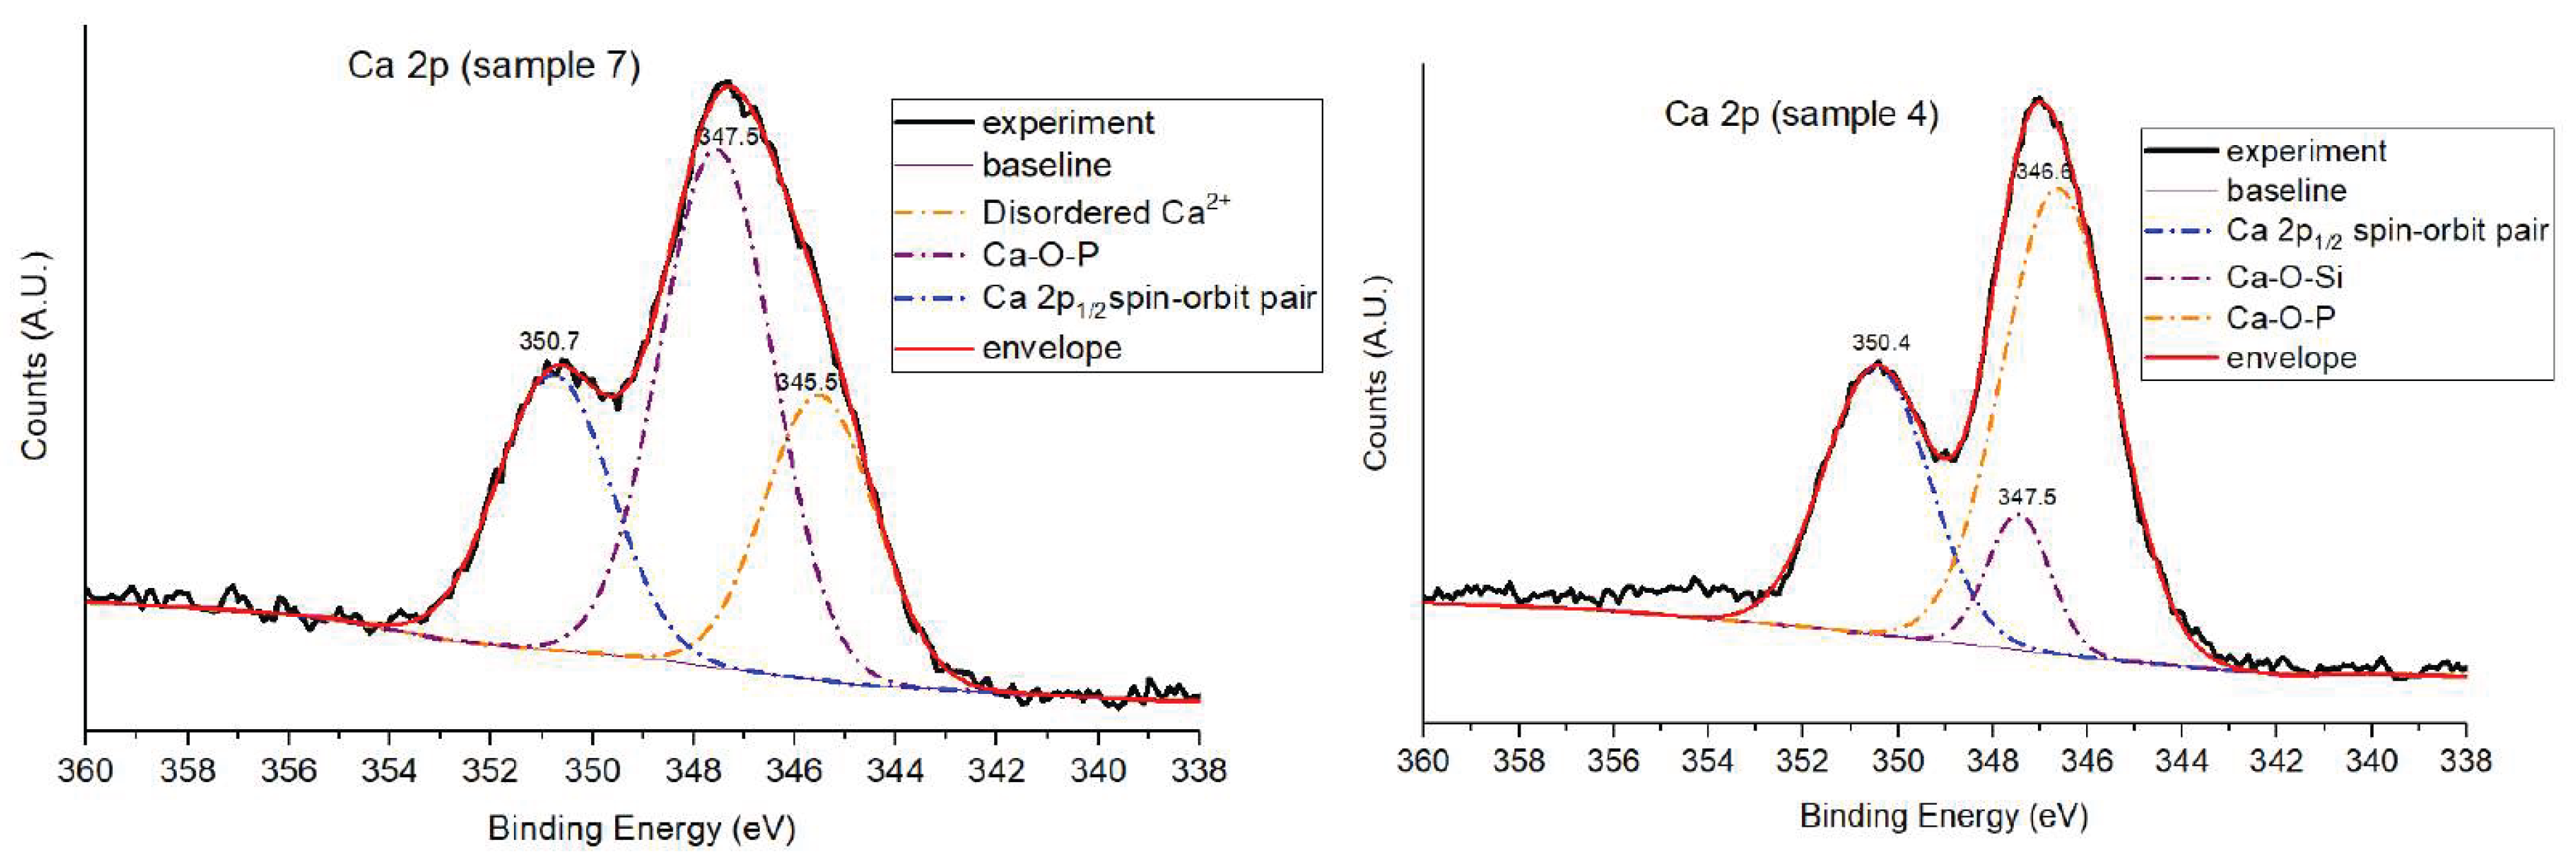
Figure 17.
High-resolution Na 1s spectra of all bioactive glass samples: Sample 7 (deionized water), Sample 4 and 4700 (Água Prata), and Sample 10 (Água Azeda). The main Na 1s peak (~1070 eV) reveals variations in peak width and symmetry, reflecting differences in sodium coordination and the local chemical environment as influenced by the synthesis medium.
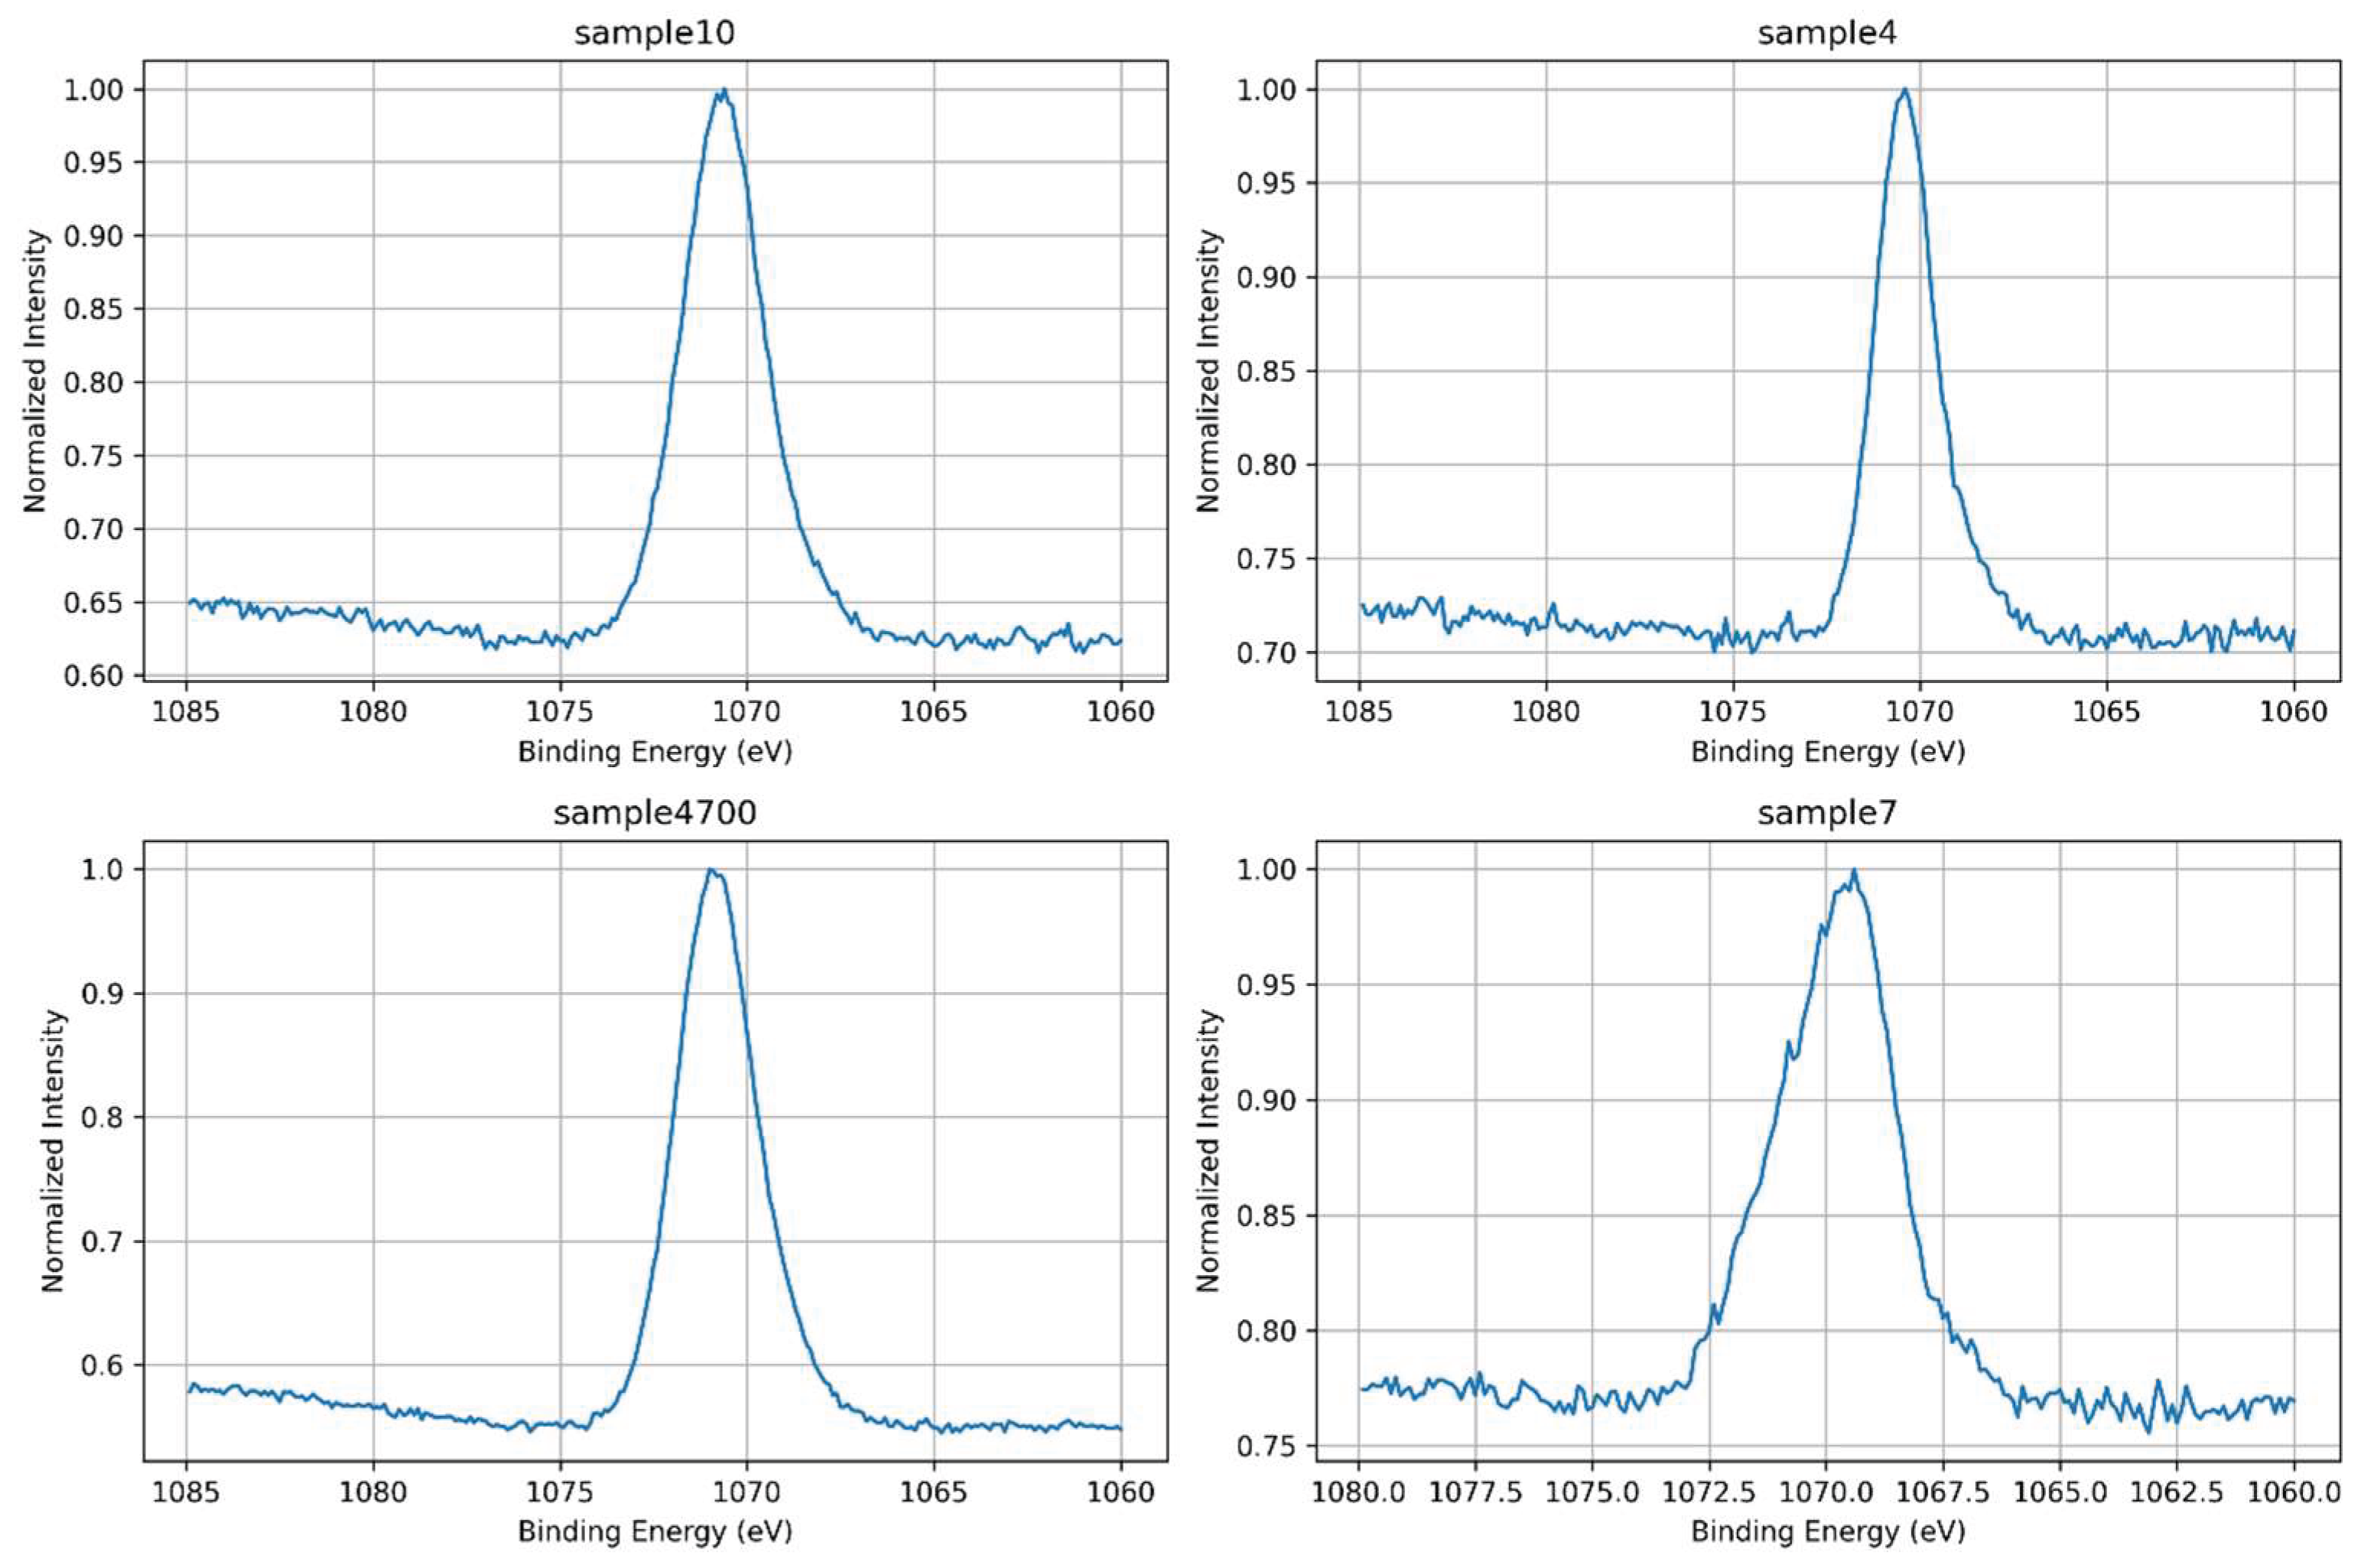
Figure 18.
Overlay of normalized Na 1s spectra for all samples. All spectra are aligned around ~1070 eV. Sample7 shows the broadest peak, while sample4700 exhibits the narrowest one, indicating potential differences in the chemical environment or local bonding structure of sodium atoms.
Figure 18.
Overlay of normalized Na 1s spectra for all samples. All spectra are aligned around ~1070 eV. Sample7 shows the broadest peak, while sample4700 exhibits the narrowest one, indicating potential differences in the chemical environment or local bonding structure of sodium atoms.
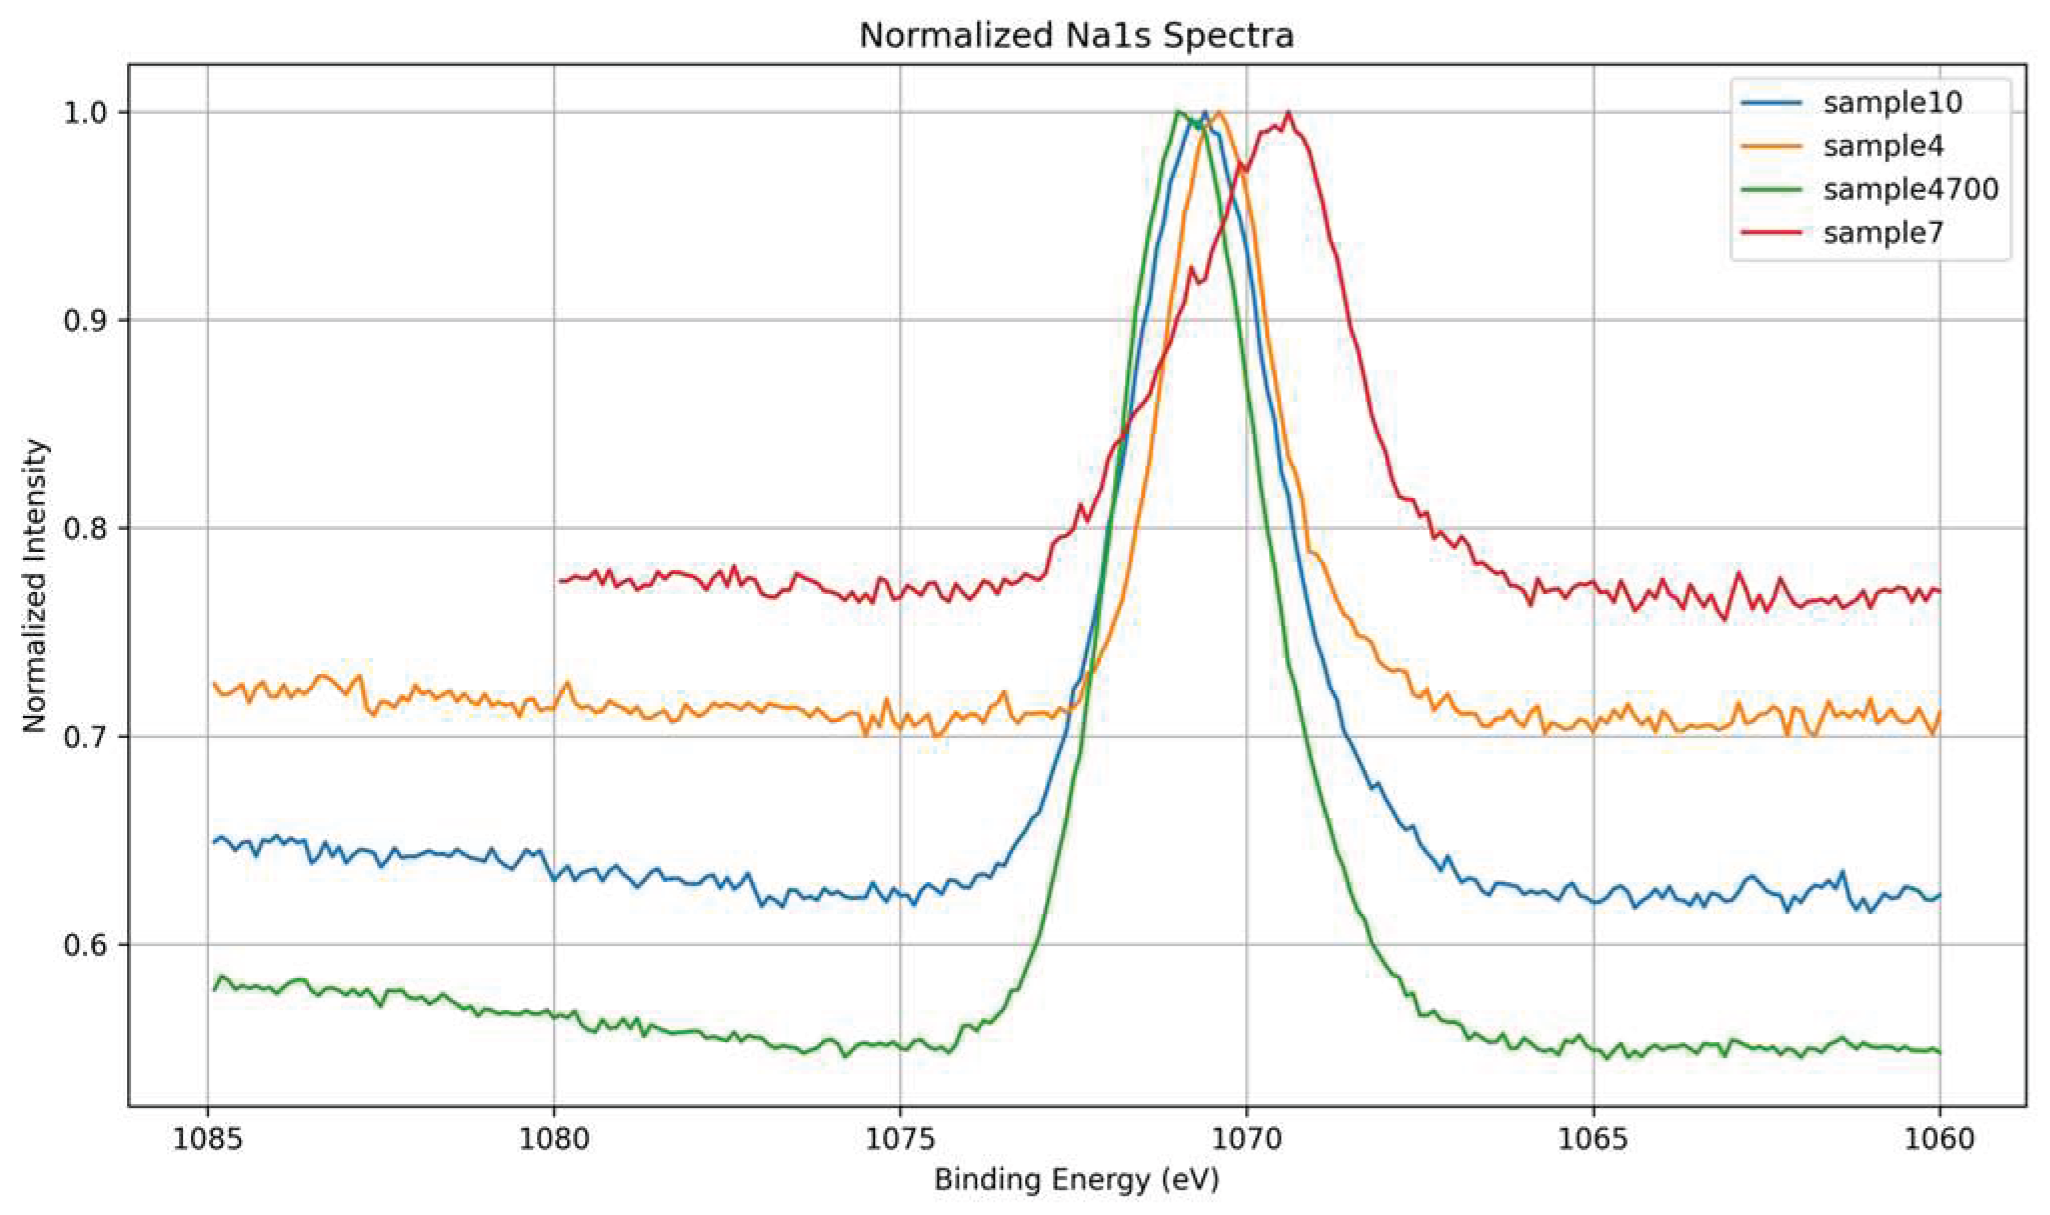
Figure 20.
High-resolution Mg 1s spectrum of Sample 10 (Água Azeda). The main peak at ~1302.5 eV reflects the incorporation of Mg²⁺ into the glass matrix. The slight asymmetry toward lower binding energies may indicate multiple local environments or surface-related contributions affecting magnesium coordination.
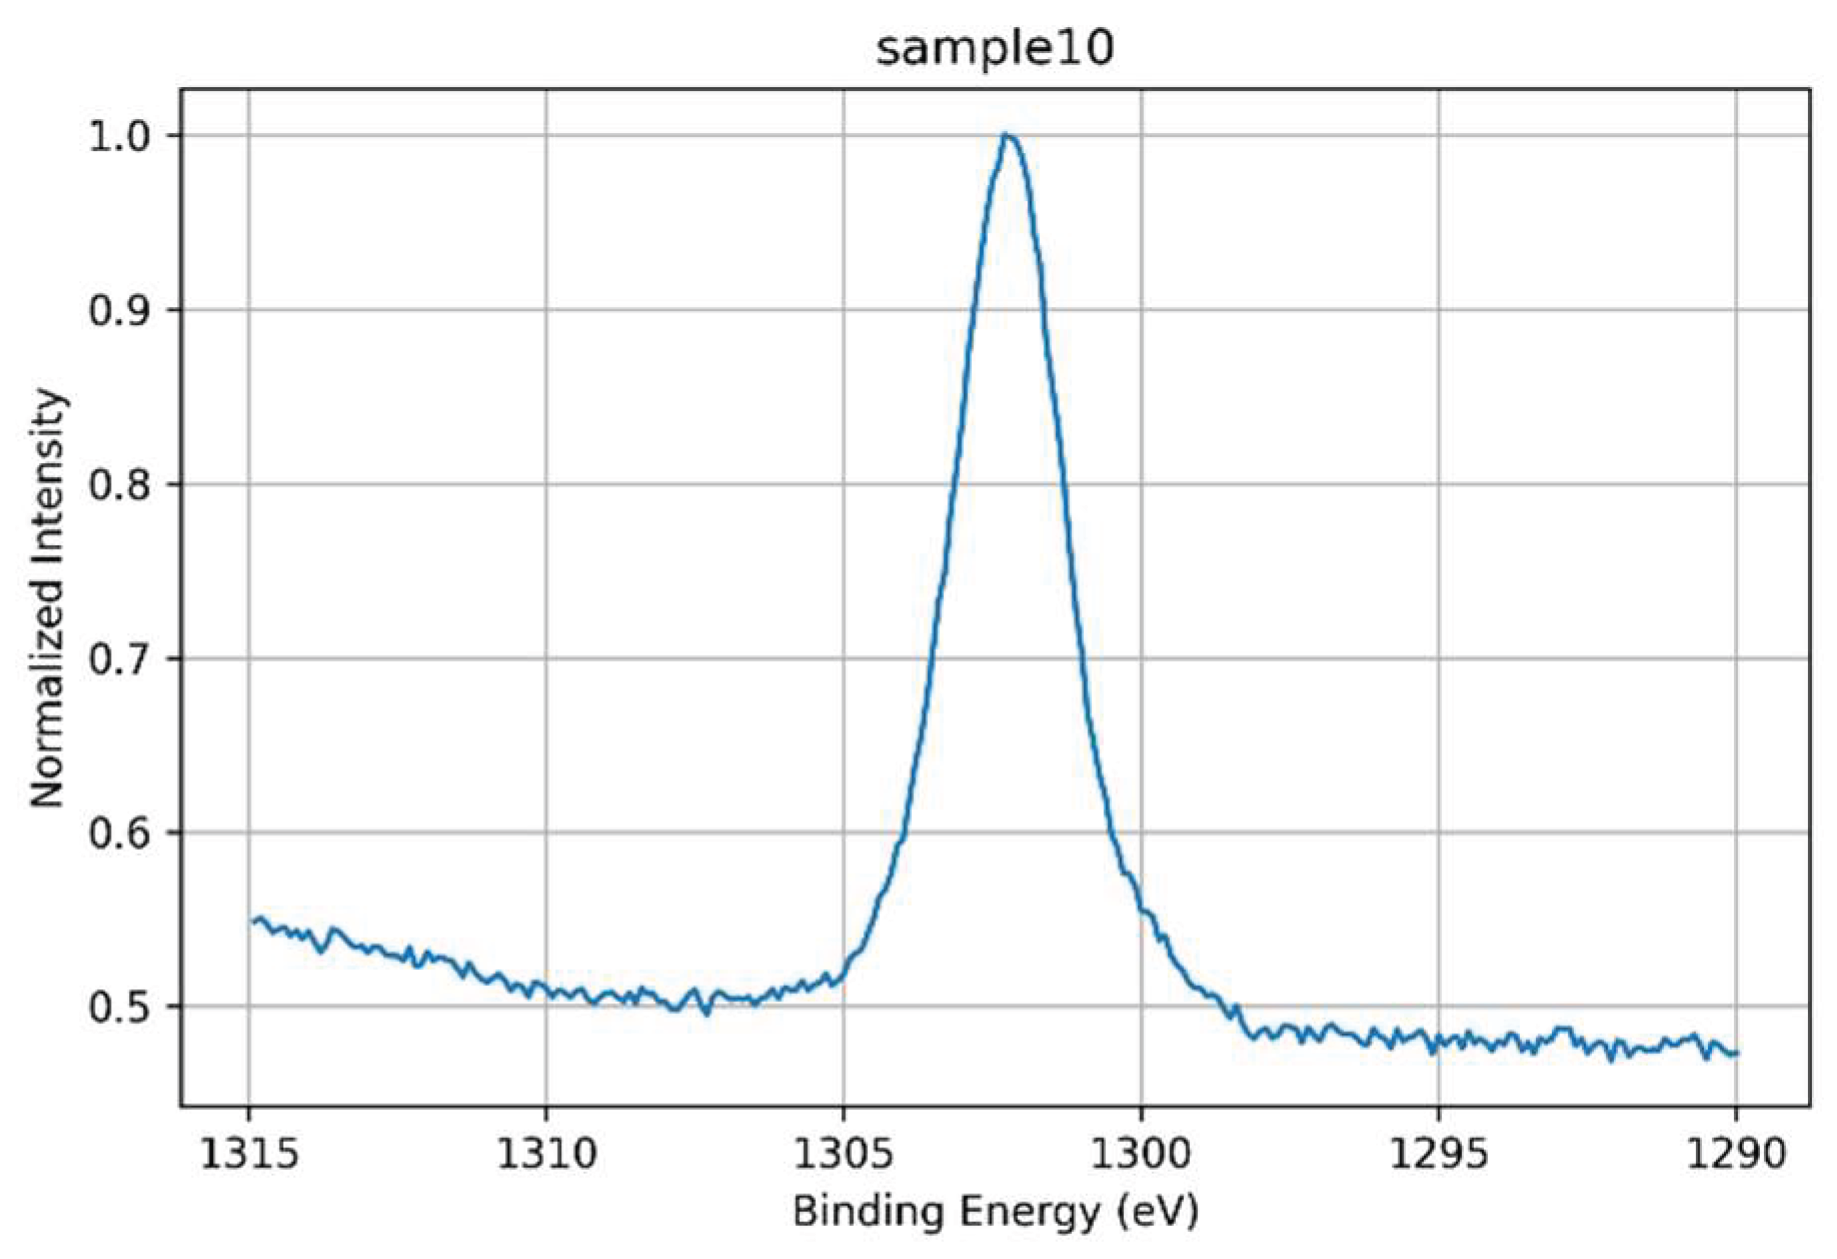

Table 1.
Ions commonly found in biomedical glasses and their potential benefits. References correspond to studies linking each ion to specific properties such as bone growth stimulation, antibacterial activity, tissue regeneration, and other relevant biomedical applications.
Table 1.
Ions commonly found in biomedical glasses and their potential benefits. References correspond to studies linking each ion to specific properties such as bone growth stimulation, antibacterial activity, tissue regeneration, and other relevant biomedical applications.
| Ion | Possible Benefit in Biomedical Glass | Ref. |
|---|---|---|
| Mg²⁺ | Stimulates bone growth, osteoblast activity | [11] |
| Zn²⁺ | Antibacterial and regenerative action, important in bone metabolism | [12] |
| Sr²⁺ | Stimulates bone formation, inhibits bone resorption | [13] |
| Cu²⁺ | Antibacterial action, angiogenesis (formation of blood vessels) | [14] |
| B³⁺ | Stimulates bone and cartilage regeneration | [15] |
| Li⁺ | Potential neuroprotective and bone regenerative properties | [16] |
| Fe | May influence magnetic properties and strength | [17] |
| Mo, Mn | Less common, but can be incorporated for specific applications | [18,19] |
| Al | High quantities can be toxic, must be controlled | [20] |
Table 2.
Relative peak areas (%) of Si–OH, Si–O⁻, and Si–O–Si components obtained from O 1s core-level spectral deconvolution of Samples 4, 4700, 7 and 10. Data reflect the impact of water composition and heat treatment on silicate network structure.
Table 2.
Relative peak areas (%) of Si–OH, Si–O⁻, and Si–O–Si components obtained from O 1s core-level spectral deconvolution of Samples 4, 4700, 7 and 10. Data reflect the impact of water composition and heat treatment on silicate network structure.
| Sample ID | Water Type |
Si-OH (%) |
Si-O-Si (BO, %) | Si-O- (NBO, %) |
Notes |
|---|---|---|---|---|---|
| 7 | DI (control) | 75.0 | 25.0 | - | Hydrated, sol–gel, balanced BO |
| 4 | Água Prata | 68.4 | 15.3 | 16.3 | Ion-induced NBO formation |
| 4700 | Água Prata | 21.0 | 77.0 | 2.0 | Densified, restructured network |
| 10 | Água Azeda | 49.2 | 50.8 | - | No resolved NBO |
Table 3.
Binding energies (BE) and relative contributions of deconvoluted Si 2p components in Samples 7 and 4700.
Table 3.
Binding energies (BE) and relative contributions of deconvoluted Si 2p components in Samples 7 and 4700.
| Sample | BE(eV) | Area (%) | Assignment |
|---|---|---|---|
| 7 | 102.4 | 82.4 | Q²/Q³ – NBO-rich (disordered) |
| 7 | 103.3 | 17.6 | Q³/Q⁴ – Minor ordered sites |
| 4700 | 103.1 | 70.6 | Q³ – Bridging oxygen (ordered) |
| 4700 | 103.7 | 29.4 | Q⁴ – Fully polymerized domains |
Table 4.
Binding energies (BE) and chemical assignments of deconvoluted P 2p components in Sample 4, showing contributions from regular phosphate groups (PO₄³⁻) and modified phosphate species interacting with network-modifying cations.
Table 4.
Binding energies (BE) and chemical assignments of deconvoluted P 2p components in Sample 4, showing contributions from regular phosphate groups (PO₄³⁻) and modified phosphate species interacting with network-modifying cations.
| BE (eV) | Assignment | Description |
|---|---|---|
| 132.5 | PO₄³⁻ (fully oxidized) | Main phosphate environment, tetrahedral and chemically uniform |
| 133.6 | Modified PO₄³⁻ (P–O–Sr/Zn) | Phosphate perturbed by interaction with network-modifying cations |
Table 5.
Binding energies (BE) and relative peak areas (%) of deconvoluted Ca 2p components in Samples 4 and 7. Assignments include phosphate coordination (Ca–O–P), silicate incorporation (Ca–O–Si), and disordered or hydrated surface species.
Table 5.
Binding energies (BE) and relative peak areas (%) of deconvoluted Ca 2p components in Samples 4 and 7. Assignments include phosphate coordination (Ca–O–P), silicate incorporation (Ca–O–Si), and disordered or hydrated surface species.
| Sample | BE (eV) | Area (%) | Assignment |
|---|---|---|---|
| 4 | 346.6 | 58.8 | Ca–O–P (calcium phosphate) |
| 4 | 347.5 | 9.6 | Ca–O–Si (calcium in silicate domains) |
| 4 | 350.4 | 31.6 | Ca 2p₁/₂ spin–orbit pair |
| 7 | 345.5 | 25.9 | Disordered Ca²⁺ (e.g., Ca–OH) |
| 7 | 347.5 | 48.3 | Ca–O–P (calcium phosphate) |
| 7 | 350.7 | 25.8 | Ca 2p₁/₂ spin–orbit pair |
Table 6.
Summary of synthesis parameters, XPS core-level responses, and structural interpretations for selected samples. Observations are based on high-resolution spectra of Si 2p, Ca 2p, Na 1s, P 2p, O 1s and Mg 1s (when applicable).
Table 6.
Summary of synthesis parameters, XPS core-level responses, and structural interpretations for selected samples. Observations are based on high-resolution spectra of Si 2p, Ca 2p, Na 1s, P 2p, O 1s and Mg 1s (when applicable).
| Sample | Synthesis Water | Key XPS Observations | Key Observations |
|---|---|---|---|
| 7 | DI | Broad, symmetric O 1s; disordered Si 2p; intense P 2p; low Na 1s; Ca 2p shows Ca–O–P + disordered component | Phosphate-rich, under-condensed network with weak ionic shielding; Ca loosely coordinated; low densification |
| 4 | Prata | Asymmetric O 1s; Na 1s and P 2p broadened; Ca 2p shows Ca–O–P + Ca–O–Si; no disordered Ca | Presence of multivalent cations (e.g., Sr²⁺, Zn²⁺) induces moderate network perturbation and partial integration of Ca |
| 4700 | Prata | Sharpened O 1s, Si 2p and Ca 2p; most intense Na 1s; P 2p narrow and symmetric | Thermal densification promotes polymerization (Q³/Q⁴), reduction of OH groups, and consolidation of coordination environments |
| 10 | Azeda | Broad O 1s; Na 1s depleted; Mg 1s detected; P 2p absent; Ca 2p sharp (Ca–O–Si) | Ion exchange with Mg²⁺ and other ions disrupts Na⁺ role; silicate network less hydrated, more ordered despite no heat treatment |
Disclaimer/Publisher’s Note: The statements, opinions and data contained in all publications are solely those of the individual author(s) and contributor(s) and not of MDPI and/or the editor(s). MDPI and/or the editor(s) disclaim responsibility for any injury to people or property resulting from any ideas, methods, instructions or products referred to in the content. |
© 2025 by the authors. Licensee MDPI, Basel, Switzerland. This article is an open access article distributed under the terms and conditions of the Creative Commons Attribution (CC BY) license (http://creativecommons.org/licenses/by/4.0/).
Copyright: This open access article is published under a Creative Commons CC BY 4.0 license, which permit the free download, distribution, and reuse, provided that the author and preprint are cited in any reuse.


