
Submitted:
05 June 2025
Posted:
06 June 2025
You are already at the latest version
Abstract
Urban flooding represents a growing global concern, especially in areas with rapid urbanization, unregulated urban sprawl and climate change conditions. Conventional flood modeling approaches do not effectively capture the complex dynamics between natural watershed behavior and urban infrastructure; they typically simulate these domains in isolation. This study introduces the Watershed-BIM methodology, a three-dimensional simulation framework that integrates Building and City Information Modeling (BIM/CIM), Geographic Information Systems (GIS), Flood Risk Assessment (FRA), and Flood Risk Management (FRM) into a single framework. Autodesk InfraWorks, Civil 3D, and RiverFlow2D software are incorporated in the development. The methodology enhances interoperability and prediction accuracy by bridging hydrological processes with detailed urban-scale data. The framework was tested on a real-world flash flood event in Mandra, Greece, an area frequently exposed to extreme rainfall and runoff events. A specific comparison with observed flood characteristics indicates improved accuracy in comparison to other hydrological analyses (e.g., by HEC-RAS simulation). Beyond flood depth, the model offers additional insights into flow direction, duration, and localized water accumulation around buildings and infrastructure. In this context, integrated tools such as Watershed-BIM stand out as essential instruments for translating complex flood dynamics into actionable, city-scale resilience planning.
Keywords:
urban flooding
; flood risk assessment
; Watershed-BIM
; BIM-GIS Integration
; urban resilience
1. Introduction
Urban flooding introduces significant challenges regarding cities’ vulnerability, leading to substantial economic losses, infrastructure damage, and public safety threats. The increasing frequency and intensity of such events, intensified by climate change and rapid urbanization, necessitate advanced proactive resilience planning and management strategies. In recent years, several urban flood disasters have occurred, highlighting the impact of human activity - particularly unregulated or informal urban development - in exacerbating flood risks. In response to the wide-ranging implications, urban flood modeling has emerged as a critical tool for understanding flood dynamics, assessing risks, and developing mitigation strategies.
Urban flood modeling simulates the floodwater flow within urban environments to predict inundation extents, depths, and durations. In the recent past, significant advancements have been made in this field, driven by improvements in computational power, data availability, and modeling techniques. Recent advancements have also focused on coupling hydrodynamic models with Geographic Information Systems (GIS), employing remote sensing technologies and high-resolution topographic data, and making use of machine learning techniques to flood prediction, all of them offering innovative ways to analyze complex datasets.
Despite these advancements, challenges remain. Urban flood models often require extensive calibration and validation, which can be time-consuming and resource-intensive. Additionally, the uncertainty associated with input data, model parameters, and future climate scenarios can affect model reliability. Addressing these limitations is a key focus of ongoing research.
Building Information Modeling (BIM) technologies have revolutionized the architecture, engineering, and construction (AEC) industry by enabling comprehensive digital modeling of physical and functional characteristics of the built environment. By creating a digital twin of a physical structure, BIM enables stakeholders to visualize and analyze every aspect of a project in terms of construction and operation. BIM applications have recently expanded beyond individual buildings to include infrastructure projects and its use in urban planning and disaster management is also gaining interest. For instance, BIM has been used to simulate the impact of natural disasters, optimize evacuation routes, and design resilient infrastructure.
The integration of urban flood modeling with BIM tools arises as a promising pathway for addressing urban flooding challenges. By combining the predictive capabilities of flood models with the detailed spatial and structural information provided by BIM, stakeholders can develop more effective flood mitigation and adaptation strategies. For example, BIM can be used to assess the flood resilience of buildings by simulating how floodwater interacts with individual structures and infrastructure networks. The employment of BIM tools can model the impact of flooding on building interiors, allowing for detailed damage assessment. They can also be used for designing flood-resistant buildings and infrastructure or for emergency response planning.
While these applications demonstrate the potential of improved flood modeling and impact assessment and mitigation, challenges lie ahead. Among them, the development of such integrated tools is rather in its infancy. A BIM-developed digital model should be effectively able to reveal the floodwater flow through the city openings and provide estimates about inundation extents, depths, and velocities. In addition, it should provide visual representation of these parameters, flood damage estimations, and optimization strategy evaluation. In this direction, the present work introduces such a BIM-based tool for flood modeling and estimation in urban environments and illustrates its capabilities, benefits, and limitations. The paper addresses the current lack of fully integrated 3D models that combine watershed hydrology and urban infrastructure into a unified decision-support framework.
2. Background
The literature on urban flood risk management spans a wide range of approaches, technologies, and interdisciplinary frameworks. Existing research works have dealt with flood risk management frameworks, flood impact assessment, flood modeling and simulation, visualization and communication tools, BIM-GIS integration, strategic planning and coordination mechanisms.
In the direction of flood risk modeling and management, Jongman et al. ([1]) examine disparities in flood damage models across Europe and suggest harmonization efforts to improve regional assessments. Bernhofen et al. ([2]) propose a framework for integrating global datasets into national flood risk strategies to ensure scalability and consistency in decision-making. Alabbad et al. ([3]) introduce a web-based framework for urban flood damage estimation, emphasizing rapid and scalable assessments. Cea & Costabile ([4]) review advanced urban flood risk modeling techniques, emphasizing climate adaptation and resilient management practices.
In terms of flood impact assessment, investigation of the role of environmental, meteorological, and socio-economic factors in influencing flood risks and impacts has been studied in recent literature. Soulios et al. ([5]) highlight socio-environmental factors contributing to Greek flood disasters and propose comprehensive mitigation strategies. Mitsopoulos et al. ([6]) focus on flood damage assessment and analyze the potential impact of flood protection works in a case study of the 2017 Mandra flood in Greece. Further, Varlas et al. ([7]) analyze the interplay of meteorological and hydrological factors in the same case study, offering recommendations for early warning systems. Diakakis et al. ([8]) explore the environmental contexts of flash flood mortality, using the 2017 Mandra flood as a case study, suggesting location-specific vulnerability assessments. Speis et al. ([9]) examine the psychosocial impacts of flash floods, emphasizing the importance of addressing demographic vulnerabilities in disaster planning. Finally, Khan et al. ([10]) investigate the impacts of climate change on flooding in Pakistan, recommending mitigation strategies to enhance resilience.
Moving on to core flood modeling, several models have been devised to simulate the water volume in a watershed. They are typically categorized by modeling approach, including hydrological models, hydrodynamic models, and simplified models. In particular, Devia et al. ([11]) review hydrological models and recommend hybrid approaches for urban-rural hydrology. Yu and Duan et al. ([12]) introduce a hydrodynamic model and explore the use of RiverFlow2D and Civil 3D for urban flood mitigation planning. Teng et al. ([13]) provide a review of methods regarding flood inundation modeling.
Other researchers have dealt with the implementation of green-grey infrastructure for mitigating flood risk. More specifically, Zischg et al. ([14]) propose a robustness pathway for mitigating flood risk, primarily based on gray infrastructure (i.e. concrete structures) such as conventional drainage systems. Chen et al. ([15]) evaluate grey infrastructure for flood management, proposing balanced integration of green-grey solutions to improve resilience.
Specific case studies have also been reported in the literature. Bellos et al. ([16]) use open flood datasets to identify challenges in flood modeling, offering recommendations for improving data-driven flood management. Kelesoglu et al. ([17]) investigate the structural damages caused during the August 2021 flood in the Western Black Sea Basin and underscore the importance of site-specific assessments for resilient infrastructure design. Nkwunonwo et al. ([18]) review flood modeling challenges in developing countries and highlight the need for simplified, locally tailored models using open-source data and minimal computational demands.
Visualization is another aspect of existing research. Salvadore et al. ([19]) highlight the widespread adoption of Geographic Information Systems (GIS) technology in urban hydrological modeling. Rong et al. ([20]) underscore the limitations of traditional 2D hydrodynamic models in capturing the complexities of urban flood dynamics and propose the use of digital aerial photogrammetry for urban flood inundation mapping. Rydvanskiy and Hedley ([21]) examine the potential of 3D visualizations to enhance risk analysis by accurately depicting urban spaces against the potential flood impacts in a way that is conceivable to non-experts.
Integrating advanced technologies, such as BIM, GIS, and geospatial tools, to enhance urban flood modeling has attracted research interest in recent years. Amirebrahimi et al. ([22]) propose integrating BIM and GIS tools for assessing and visualizing the flood damage of a building. Kangwa & Mwiya ([23]) utilize GeoBIM applications for urban flood simulation and hazard mapping. Jang et al. ([24]) leverage CityGML models which are generated from national datasets to simulate flood impacts on life and property. Wang et al. ([25]) propose the application of 3D visualization techniques to sponge cities for flood risk reduction. Liu et al. ([26]) review the potential use of digital twins in watershed information modeling. Yang et al. ([27]) integrate BIM, GIS, and digital collaborative environments for assessing interdependent infrastructure vulnerabilities. Syed Abdul Rahman et al. ([28]) highlight the role of BIM-GIS integration in enhancing 3D environmental simulations for urban flood modeling.
At a strategic framework and policy context level, Directive 2007/60/EC mandates the management of flood risks throughout the European Union, aiming at minimizing immediate and long-term consequences. In support of it, the Copernicus Emergency Management Service (CEMS, https://emergency.copernicus.eu/) provides early warning and rapid mapping services. Ajmar et al. ([29]) document how CEMS, through high-resolution satellite imagery and real-time analytics, can play a vital role in guiding post-disaster response and risk management strategies.
The above literature analysis indicates that, although considerable effort has been directed towards urban flooding, addressing the problem necessitates a multidisciplinary approach, integrating elements from informatics, construction management, and environmental science. In fact, existing approaches focus rather fragmentarily on either the watershed or the built environment. The proposed Watershed-BIM approach in this study aims to shorten this gap by integrating watershed hydrology, stormwater infrastructure, and urban morphology into a unified model. This technique enables concurrent assessment of flood discharge and urban resilience, facilitating decision-making across disciplines. The convergence of BIM, GIS, City Information Modeling, and risk assessment tools under a single framework allows more detailed and cost-effective simulations. As such, it sets the foundation for intelligent flood management strategies that are both technologically grounded and practically scalable.
3. Flood Risk Management
3.1. Flood Risk Management Framework
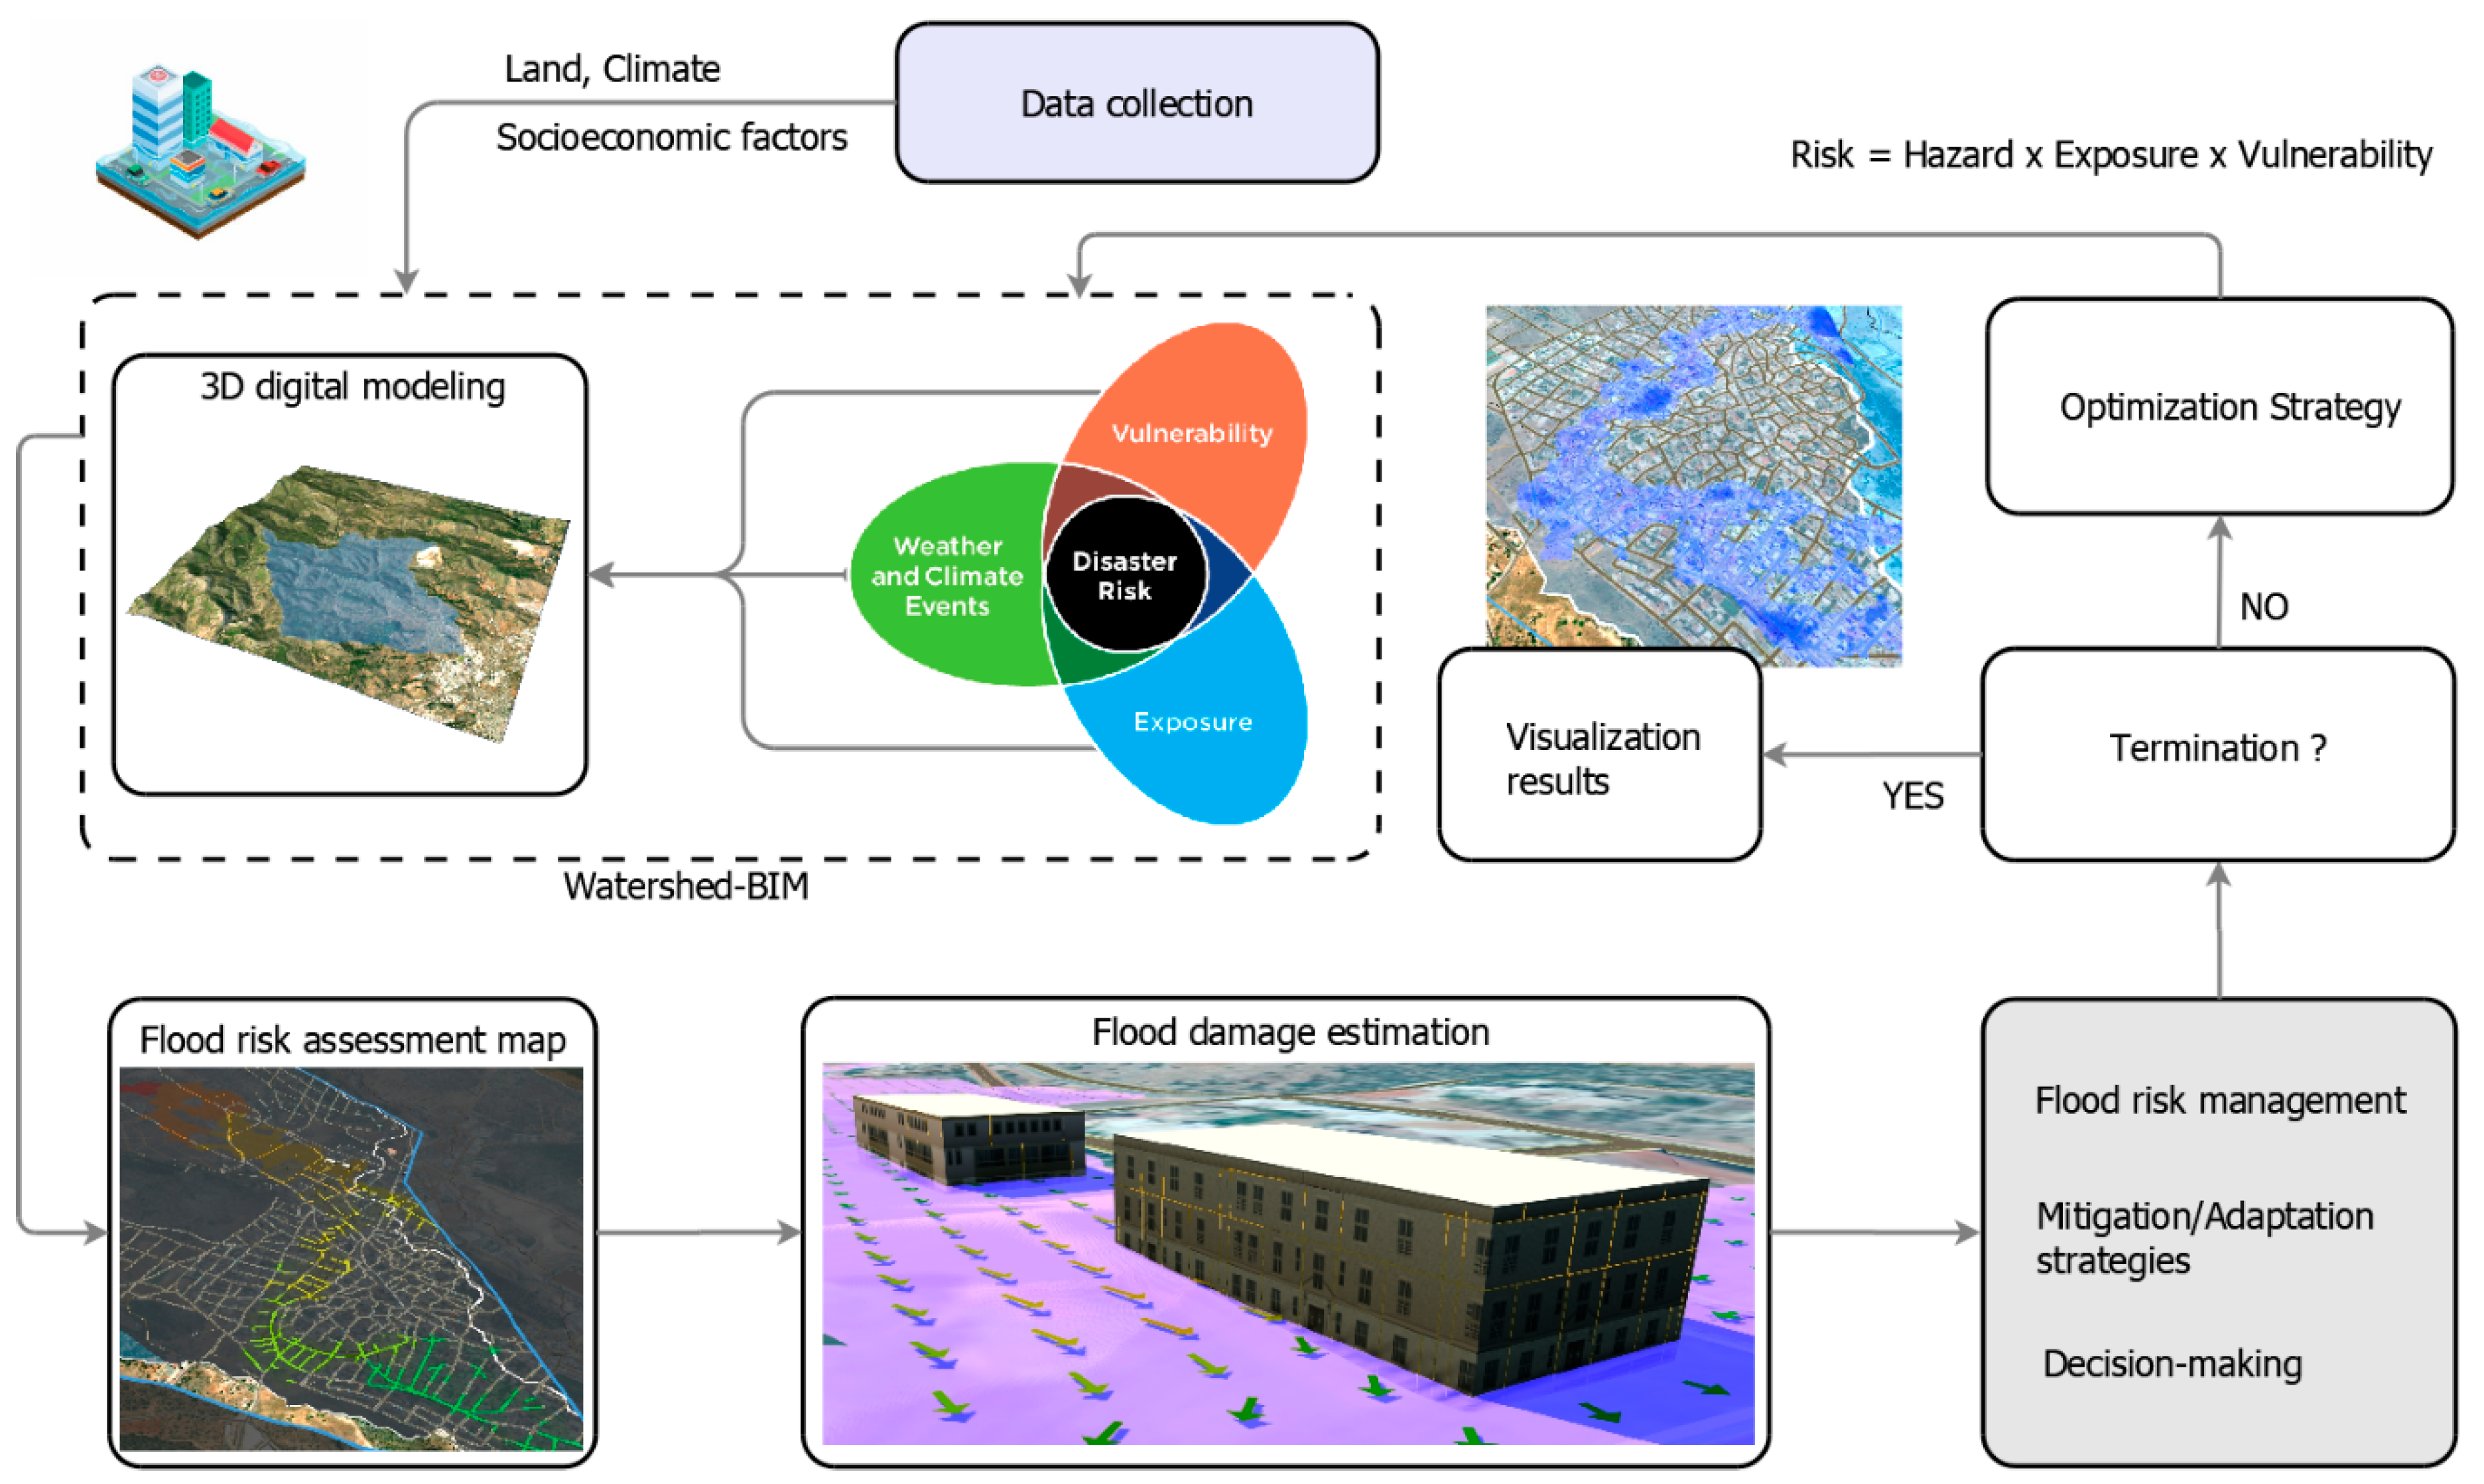
A flood management break-down structure includes the components that are illustrated in Figure 1. Initially, area-wide data collection is performed, including climatological, geographical, and socio-economic factors, among others. The area that contributes to flooding (watershed) and its scenery characteristics (e.g., buildings and roads in the urban environment) are modeled by means of information and communication technologies (ICT). Flood risks are assessed based on urban environment vulnerability and exposure, as well as prevailing climatic conditions in the area. By integrating hazard data in the study area model (Watershed Information Modeling, WIM), the flooding effect (damage) is estimated. Finally, alternative flood risk mitigation scenarios are developed and comparatively scrutinized, considering potential interventions with their cost-effectiveness, and within the general sustainability framework in the social, environmental, and economic dimensions.
3.2. Flood Risk Assessment
Flood risk is typically defined as a function of the flood occurrence probability and the respective anticipated consequences. In this context, flood risk is leveraged by three main parameters, hazard, exposure, and vulnerability. Hazard refers to the flood characteristics (e.g., intensity) and its potential contribution to harm, destruction, or disruption of the natural or built environment. Exposure concerns the presence of people, property, economic activities, or environmental elements that are likely to be affected by an extreme event hazard. Vulnerability is related to the degree of sensitivity or capability of a system to resist or adapt to hazard exposure. Risk expresses the actual impact of the extreme event in the natural or built environment or system. Risk is a function of hazard, exposure, and vulnerability, typically with a linear relationship of the form of Eq. 1. The flood probability is signified by the hazard indicator, whilst the potential consequences by the product of exposure and vulnerability indicators.
Flood Risk = Hazard × Exposure × Vulnerability
Figure 1.
Flood risk management framework.
The estimation of hydrological parameters is based on rainfall curves, with data coming from rainfall gauge locations and stations. Eq. 2 provides an estimate of the rainfall intensity, expressing the Generalized Extreme Value (GEV) distribution. Accordingly, the concentration time (tc) of each basin is calculated using the Giandotti equation (Eq. 3). The calculation of peak flow for flood runoff (Q) in each basin is determined based on the rational formula (Eq. 4).
where:
- i : rainfall intensity (mm/hr),
- tc: concentration time (hr),
- T: return period (years),
- K, θ, λ', ψ', η: scale, position, and shape parameters of the GEV distribution,
- Ad: the hydrological basin area (Km²),
- L: maximum watercourse length in the basin (km),
- Hmref: difference between the mean basin elevation upstream and the bottom of the basin (m),
- Href: elevation at the bottom of basin (m),
- Q: peak runoff flow (m³/s),
- C: runoff coefficient, which mainly depends on the catchment characteristics.
The runoff coefficient C of Eq. 4 is calculated by Eq. 5 as the sum of discrete contributors related to relief slope Cr, soil infiltration Ci, vegetative cover Cv, and surface storage capacity Cs. These factors are determined based on basin characteristics and influence the overall runoff pattern. Table 1 presents indicative values of these coefficients and highlights the potential for flood intensity reduction when factors such as vegetation and surface storage capacity are increased. For instance, dense vegetation and greater surface water storage capacity can reduce the runoff coefficient, enhance infiltration, and decrease surface water flow.
where:
- Cr: watershed relief,
- Ci: soil infiltration,
- Cv: vegetative cover,
- Cs: land surface storage capacity.

Table 1.
Runoff Coefficient for Rural Watersheds (Drainage Manual [30])
Table 1.
Runoff Coefficient for Rural Watersheds (Drainage Manual [30])
| Runoff coefficient values | ||||
| Extreme | High | Normal | Low | |
| Watershed relief (Cr) | 0.28-0.35 | 0.20-0.28 | 0.14-0.20 | 0.08-0.14 |
| Soil infiltration (Ci) | 0.12-0.16 | 0.08-0.12 | 0.06-0.08 | 0.04-0.06 |
| Vegetative cover (Cv) | 0.12-0.16 | 0.08-0.12 | 0.04-0.08 | 0.04-0.06 |
| Surface storage capacity (Cs) | 0.10-0.12 | 0.08-0.10 | 0.06-0.08 | 0.04-0.06 |
3.3. Watershed-Building Information Modeling (W-BIM)
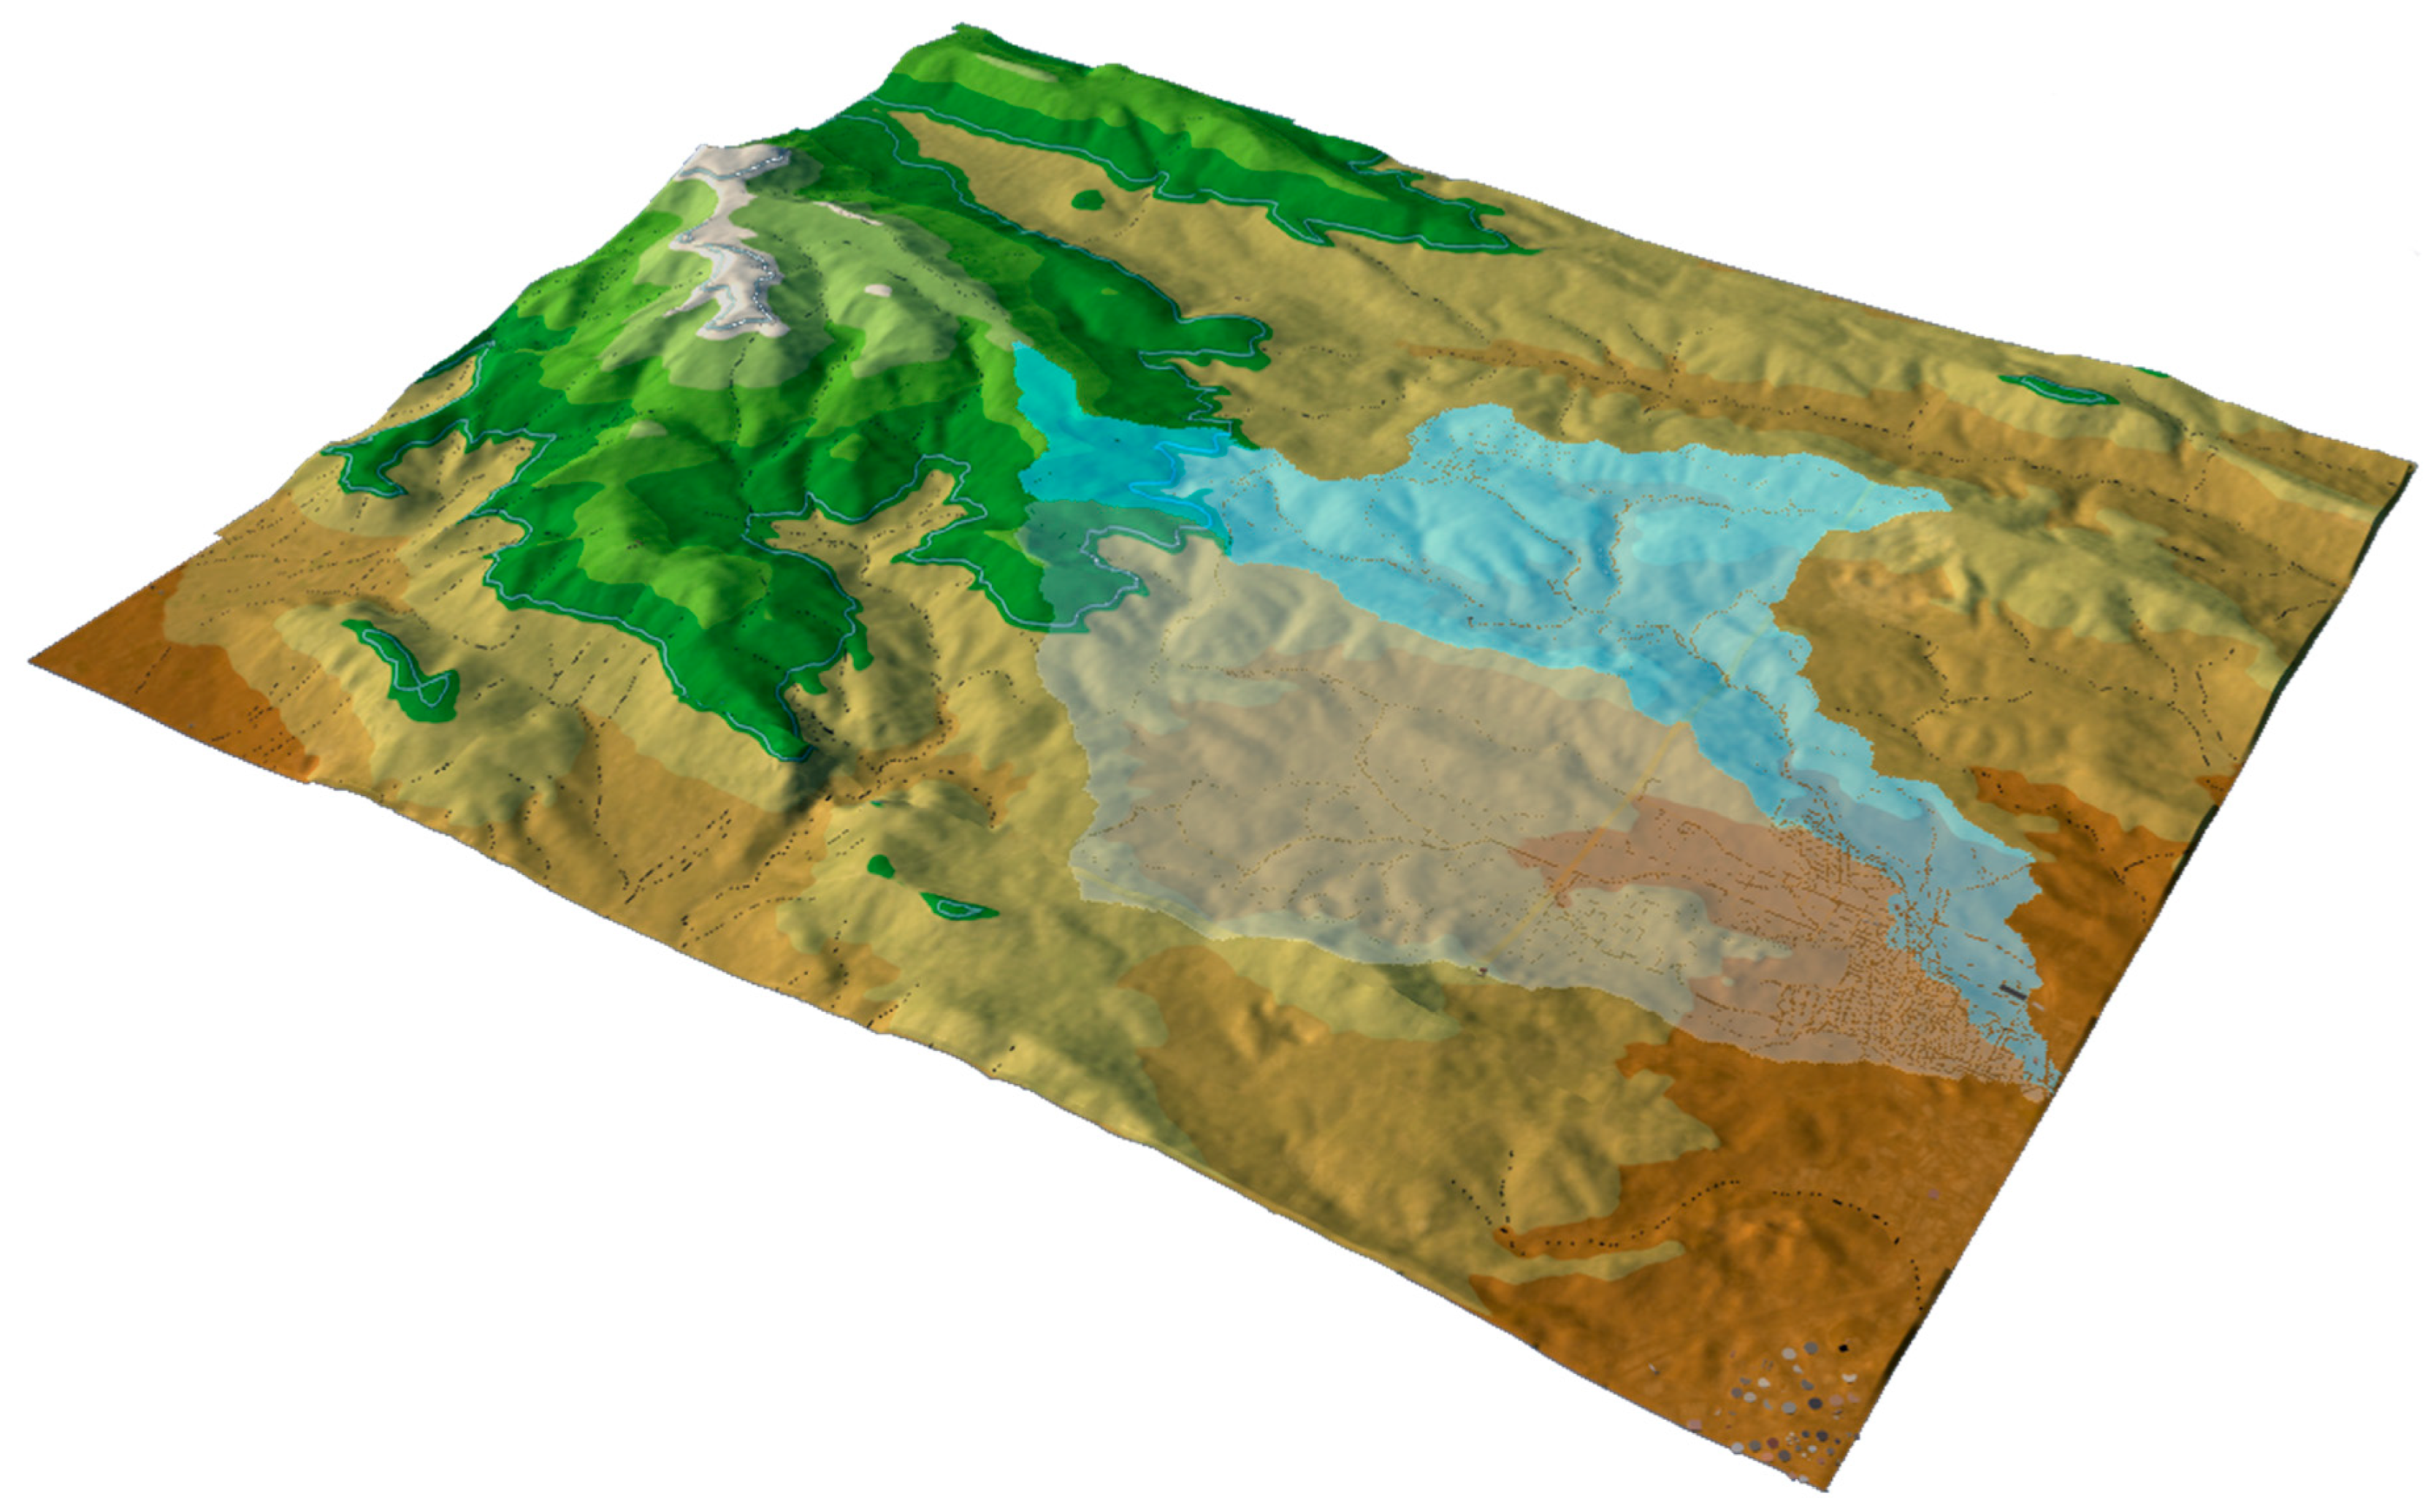
To assess flood risk, the probability of flood occurrence and its potential consequences need to be estimated. The process starts with watershed determination. This can be done using a digital terrain model of the area. The model development involves either area mapping or utilizing GIS software. Typically, GIS software, such as QGIS is used. Figure 2 provides a 3D illustration of the land profile in the area indicating two distinct watersheds. A Digital Elevation Model (DEM), such as HEC-RAS, is developed and imported into flood-modeling software. Once the digital terrain model has been generated, the watershed can be determined. To identify flood-prone areas, hydraulic characteristics of the area are determined in the model (e.g., Manning’s roughness coefficients, boundary conditions). Area hydrological characteristics (e.g., rainfall data, soil infiltration) are further introduced to the model. The analysis results indicate critical areas in terms of flooding probability, flood depth, velocity, and direction of flow.
The assessment of potential impacts (damage, losses, etc.) in critical areas, based on the previous flood probability analysis, is performed in terms of vulnerability and exposure, while the potential impacts are determined based on flood evolving parameters. Unlike traditional approaches that are structured on 2D visualization and step-by-step analysis methodology, Watershed-BIM (W-BIM) modeling emphasizes 3D visualization and a holistic approach of flood analysis. A 3D/W-BIM model constitutes a multi-layered tool (terrain, infrastructure, drainage network, flood impact, damage cost, etc.), and employs interactive digital simulations of the area and the flood. This model provides access to a comprehensive data information model encompassing soil characteristics, watersheds, hydraulic features, hydrological characteristics, structural attributes of the urban environment, resources and costs for mitigation strategies.
Figure 2.
Watershed-BIM 3D modeling of an area.
Autodesk InfraWorks is utilized as a tool for model creation and analysis. Using GIS data (e.g., Google Earth, openstreetmap), a 3D model of the area is developed, encompassing geometric entities such as buildings, roads, bridges, and other urban elements. Intensity-Duration-Frequency (IDF) data (as in Figure 3) are incorporated into InfraWorks to simulate various rainfall scenarios and period of return. Building structures, roads, and other urban features are included in the model to simulate the impacts of rainfall, with a focus on hydraulic flows around infrastructure elements. Hydraulic Grade Lines (HGL) and Energy Grade Lines (EGL) are generated in Infraworks to predict potential overflows, and identify critical elements for potential interventions (e.g., manholes).
The InfraWorks simulation results are imported into the flood analysis software (RiverFlow2D). This software is used to calculate flows within the model, including parameters such as water depth, velocity, and direction. Additionally, areas with potential overflow are identified, and flood extent maps are produced. Multiple flood scenarios, in terms of rainfall height, duration and intensity, period of return, etc are assessed. The combined use of InfraWorks and RiverFlow2D ensures simulation and analysis accuracy while providing realistic 3D visualizations and precise maps for flood prediction and mitigation. As a result, the 3D/W-BIM model can act as a reference tool and be utilized for flood management planning and decision-making. The 3D/W-BIM model can further be integrated with Autodesk Civil 3D for pipeline design using the Storm and Sanitary Analysis (SSA) extension of it. This approach enables seamless integration of all model layers, ensuring accuracy in flood risk assessment and 3D visualization capabilities. Table 2 summarizes the main features of the proposed approach in comparison to the customary techniques for flood risk analysis.
Table 2.
Comparative evaluation of traditional and WIM (Watershed-Information Modeling) flood risk analysis characteristics.
Table 2.
Comparative evaluation of traditional and WIM (Watershed-Information Modeling) flood risk analysis characteristics.
| Traditional process (e.g., HEC-RAS) | WIM process (InfraWorks / Civil 3D / RiverFlow2d) | |
| Digital terrain model | 2D & elementary 3D | 3D (with detailed topography integration) |
| Built environment simulation | No | Yes |
| Road network simulation | No | Yes |
| Hydraulic network simulation | No | Yes |
| Watershed delineation | Manual | Semi-automatic |
| Hydrological characteristics | Yes | Yes |
| Flood simulation robustness | Fragmentarily, only land profile, no structures | Holistic approach, database, city structures, flood consequences and cost, etc. |
| Interoperability (with other software) | Limited (e.g., GIS) | Yes (various BIM software, GIS, DEM high interoperability) |
| Impact assessment on infrastructure | Approximate, based on flood height and land uses | Multi-scenario analysis, buildings, infrastructure, city hydraulic network |
| Measurement capabilities | Elementary | Detailed |
| City-level analysis | Limited (only land profile, no interaction with city infrastructure) | Yes (interaction with city infrastructure) |
| Whole analysis accuracy (land profile, hydrological data, civil infrastructure) | Moderate (no multi-parameter integration) | High (with multi-parameter integration) |
| Big data management | Limited (only for land profile) | High (full multi-dimensional data integration) |
| Result visualization | Moderate (mainly 2D) | High (3D) |
| Software cost | Low | High |
4. Case Study: Flood Risk Analysis
The implementation process of Watershed-BIM analysis in an urban environment is illustrated in detail in the following case study example.
4.1. Case Description and Input Data
One of the largest recent flood disasters in Greece is the one that took place in Mandra, Attika in 2017, which caused 24 human casualties and substantial infrastructure damage and property loss, as depicted in EMSR257 (the flood event in: Flood in Attika, Greece, https://land.copernicus.eu/) over the past 20 years. According to IMERG data from NASA's Global Precipitation Measurement Mission (https://gpm.nasa.gov/, the upstream area of Mandra received roughly 150 mm of rainfall within a 7 hour-span (Soulios et al. [5]). The most intense rainfall occurred between 6:00 and 9:00 a.m., roughly representing 40% of the annual precipitation in the region. The peak flow values were estimated at 180 m3/s for Agia Aikaterini and 140 m3/s and Soures basin. Subsequent estimates account for 172.5 m3/s and 150.5 m3/s for the two basin (Mitsopoulos et al. [6]).
Figure 3 illustrates the watershed areas and streams as provided via GIS techniques. Although GIS systems provide powerful tools for analyzing the morphology and hydrographic network of an area, their capabilities are limited when hydrological and hydraulic analyses are required. GIS primarily serves as platform for preprocessing geospatial data but lacks comprehensive capabilities for simulating flood scenarios, estimating flows, and modeling dynamic surface flows. As shown in Figure 3, while the watersheds and streams are successfully mapped, further analysis of flood behavior is not feasible. Additionally, critical infrastructure affected by floods—such as bridges, roads, and buildings—are not directly integrated into the risk assessment and mitigation process.
In contrast, Building Information Modeling (BIM) technologies offer extensions that enable parametric modeling, integration of network data (e.g., pipelines, manholes, elevation data), and time-based rainfall simulations. These allow for better estimation and visualization of the hydrological system behavior in the study area. Therefore, while GIS remains important for initial geospatial processing, its combined use with BIM is crucial for conducting comprehensive and accurate flood risk analysis.
Figure 3.
Flood analysis using GIS (a) watershed areas, (b) watershed streams.
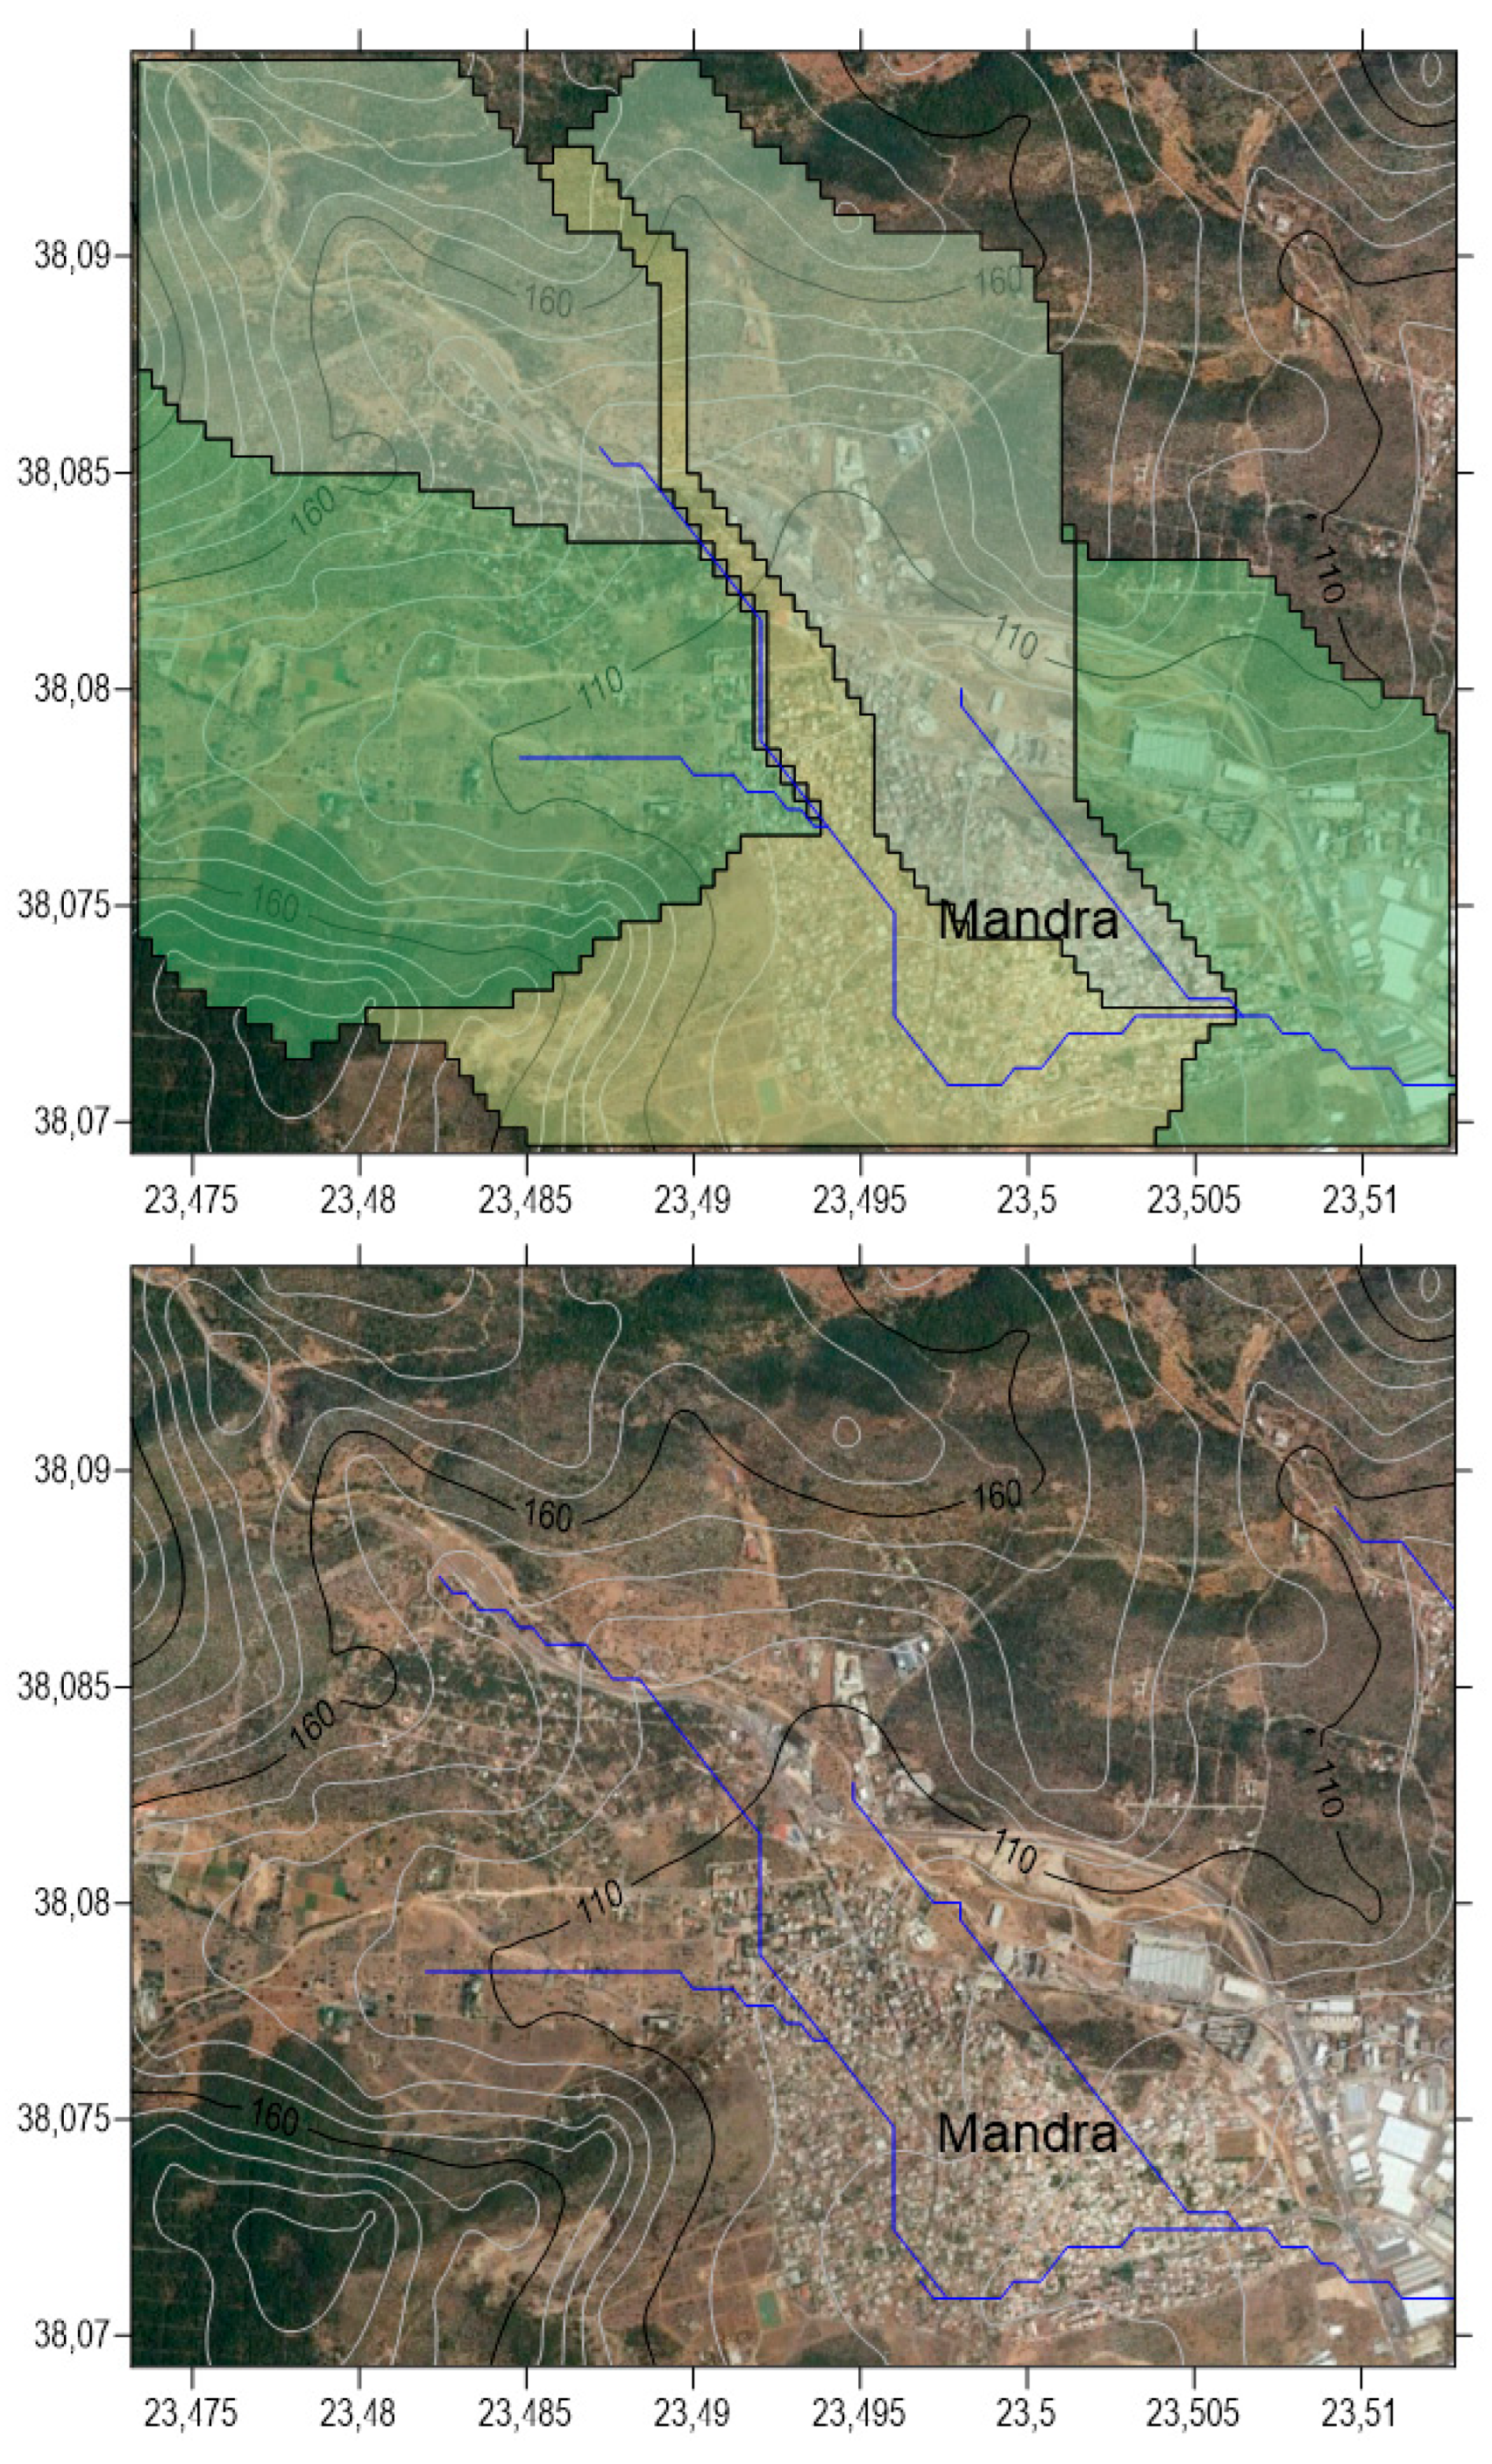
As said before, GIS can simulate the land profile, but it becomes challenging to simulate structures that affect and are impacted by the floodwater, such as buildings, roads and bridges, as they are not directly integrated into flood risk assessment and mitigation efforts. The detailed map-making of the area and precise plotting of the structural environment are crucial factors and highly influence the analysis outcomes.
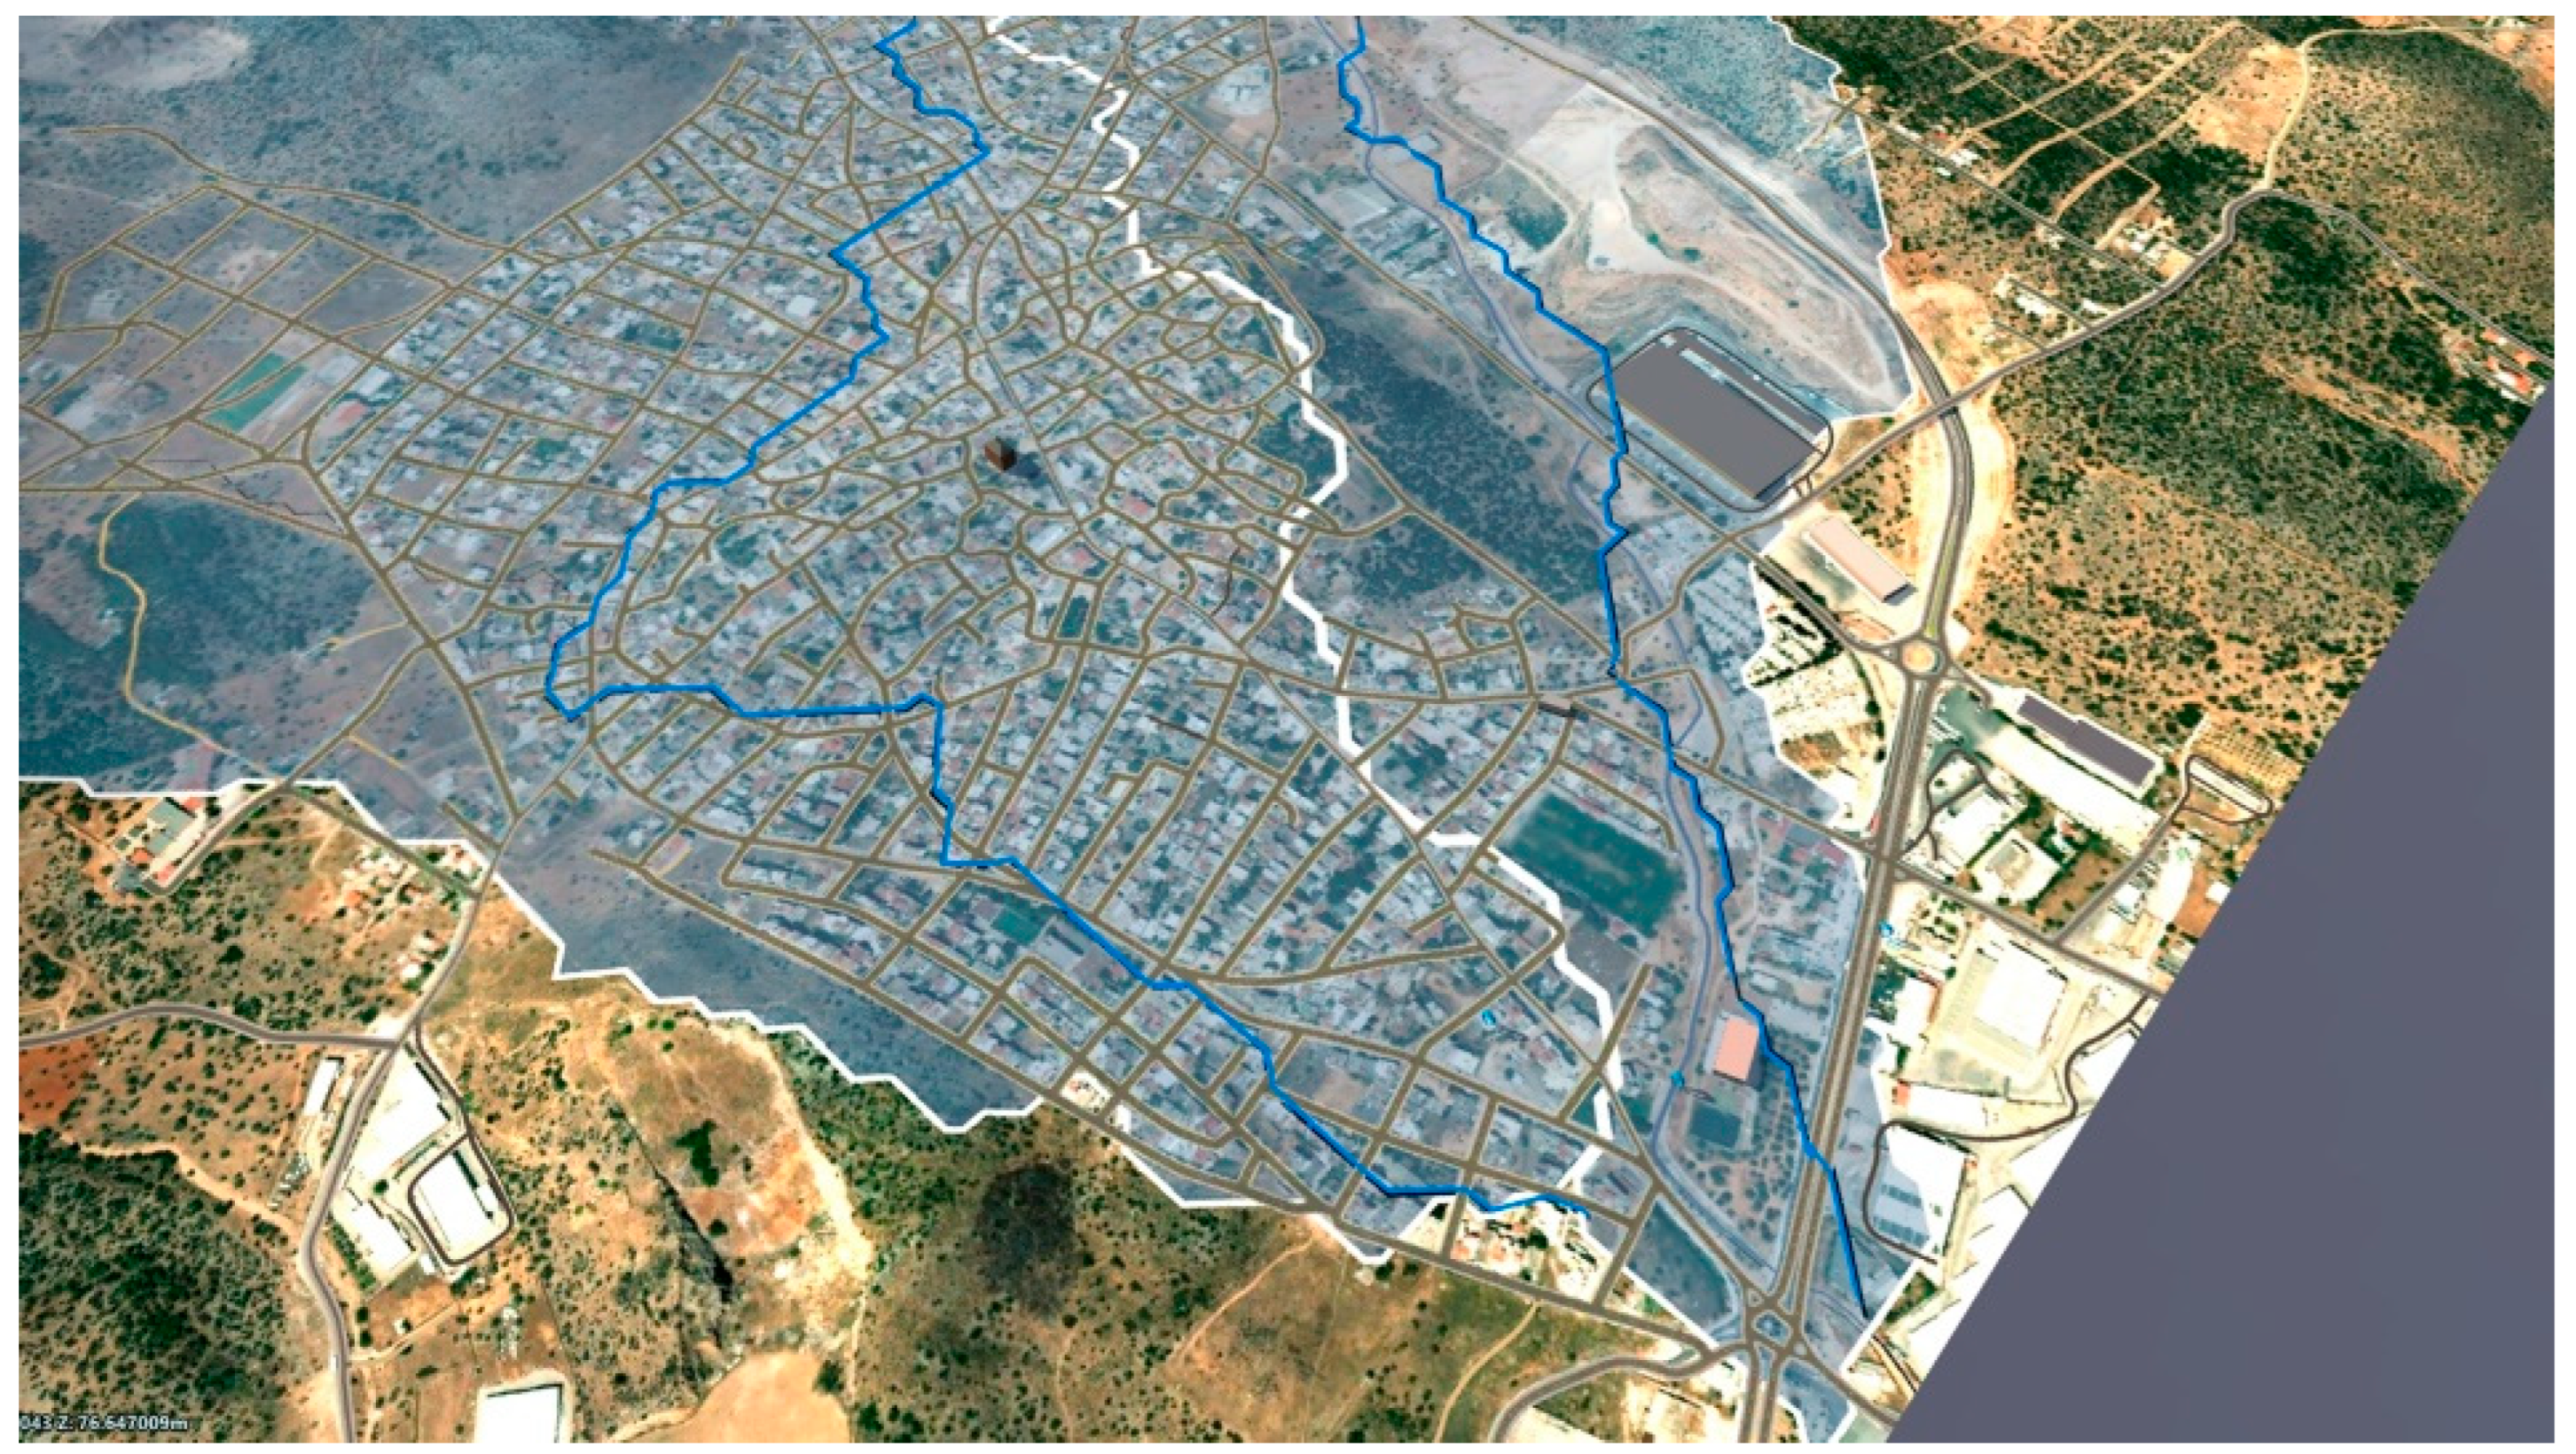
By utilizing actual hydrological, topographical, and geophysical data of the area, the proposed W-BIM methodology is applied, and the flood assessment results are evaluated (qualitatively and quantitatively) in terms of alignment with the field observations following the actual disaster. Figure 4 presents the two hydrological basins (Agia Aikaterini and Soures) upstream of Mandra, with the city being mapped at the east. Each watershed is developed by composing smaller basins using InfraWorks. Figure 5 provides a closer city view. The white lines indicate the watershed boundaries and the blue ones the corresponding streams. It is evident that both streams, especially the Agia Aikaterini one, run through the Mandra urban area. This, coupled with the significant influx of flood runoff and the inadequacy of the drainage system to absorb significant part of the flowing water, contributed to severe flooding and large impacts alike.
Figure 4.
Watershed-BIM plan view modeling of the study area.
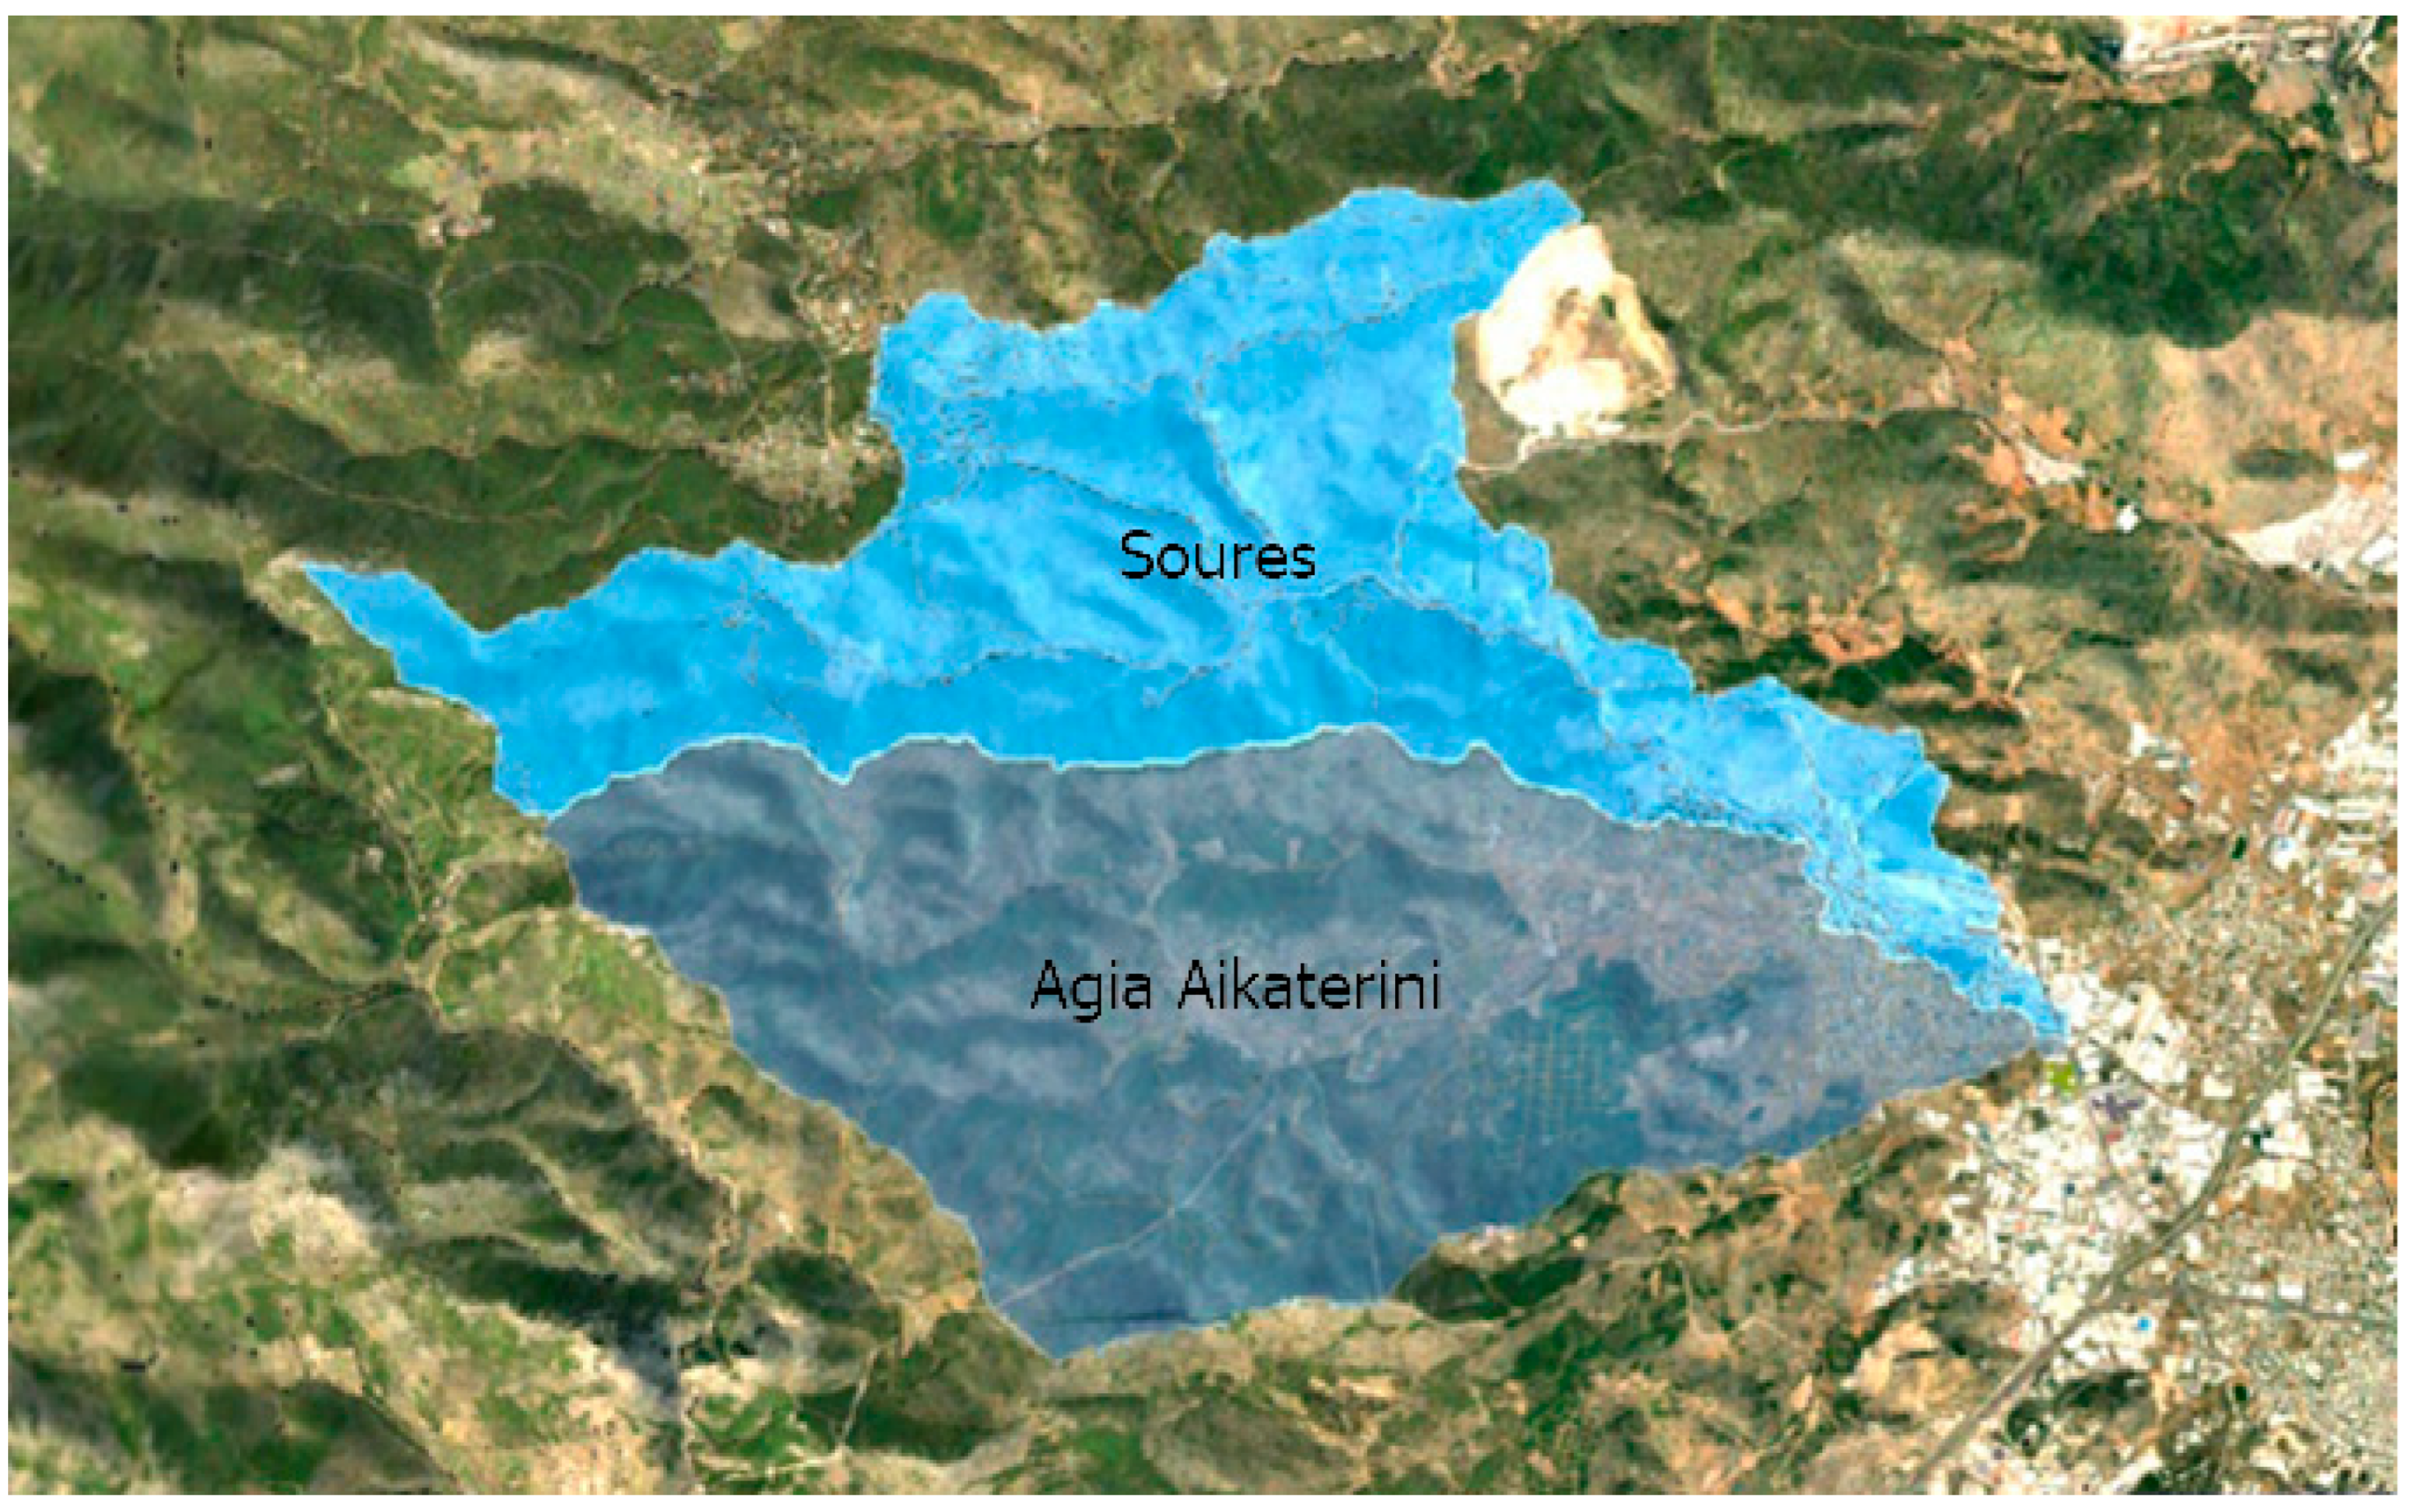
Figure 5.
The Mandra region developed in BIM software.
4.2. Results
The hydrological risk parameters of Eqs. 2-4 are presented in Table 3 and Table 4 for the two basins upstream of Mandra. These parameters include the concentration time (tc), the rainfall intensity (i) and the peak flow of flood runoff (Q) in the Mandra region. The coefficients of the mathematical model for the Mandra area are taken by https://floods.ypeka.gr/wp-content/uploads/2023/10/IDF_Report_V4.pdf as K=0.125, Θ=0.124, λ'=213.4, ψ'=0.641, η=0.622. The results indicate that the calculated peak runoff flow Q, assuming a 50-year return period, closely aligns with the observed values.
Table 3.
Calculation of rainfall duration for the flood in Mandra.
| Watershed | Ad [km2] | L [km] | Hmref [m] | Href [m] | tc [h] |
| Agia Aikaterini | 22.64 | 12.35 | 431.84 | 57.00 | 2.43 |
| Soures | 19.51 | 12.56 | 571.56 | 59.10 | 2.02 |
Table 4.
Calculation of rainfall intensity and flood runoff for the flood in Mandra.
| Watershed | T= 50 years | T= 100 years | T= 500 years | |||
| i [mm/h] | Q [m3/s] | i [mm/h] | Q [m3/s] | i [mm/h] | Q [m3/s] | |
| Agia Aikaterini | 79.70 | 175.57 | 91.59 | 201.76 | 123.50 | 272.06 |
| Soures | 87.13 | 165.41 | 100.13 | 190.07 | 135.02 | 256.30 |
The Mandra urban plan lies roughly perpendicularly to the natural stream flow, particularly the Agia Aikaterini one. This layout impedes in a way the efficient drainage of rainwater to the sea, resulting likewise in flooding incidents within the city. Similarly, the road and railroad network are primarily vertical to the water flow, which intensifies any flooding happening. The urban plan includes also stream-aligned roads, which inevitably carry on the flooding water.
Figure 6 shows the flood simulation output along the Agia Aikaterini stream within the city limits. In the general view of Figure 6a, the colored area indicates the flooded part of the city with the different colors to indicate the flood level (from green to dark brown), as developed by InfraWorks, Figure 6b provides a focused view of flood evolution at spots 1 and 2 presented in Figure 6a. The upper part (spot 1) presents a school in the north part of the city. The flood snapshot shows the flood depth around the school, indicated by the line-shaded envelope.
Figure 6.
Flood simulation and evolution (a) general view, (b) detailed views.
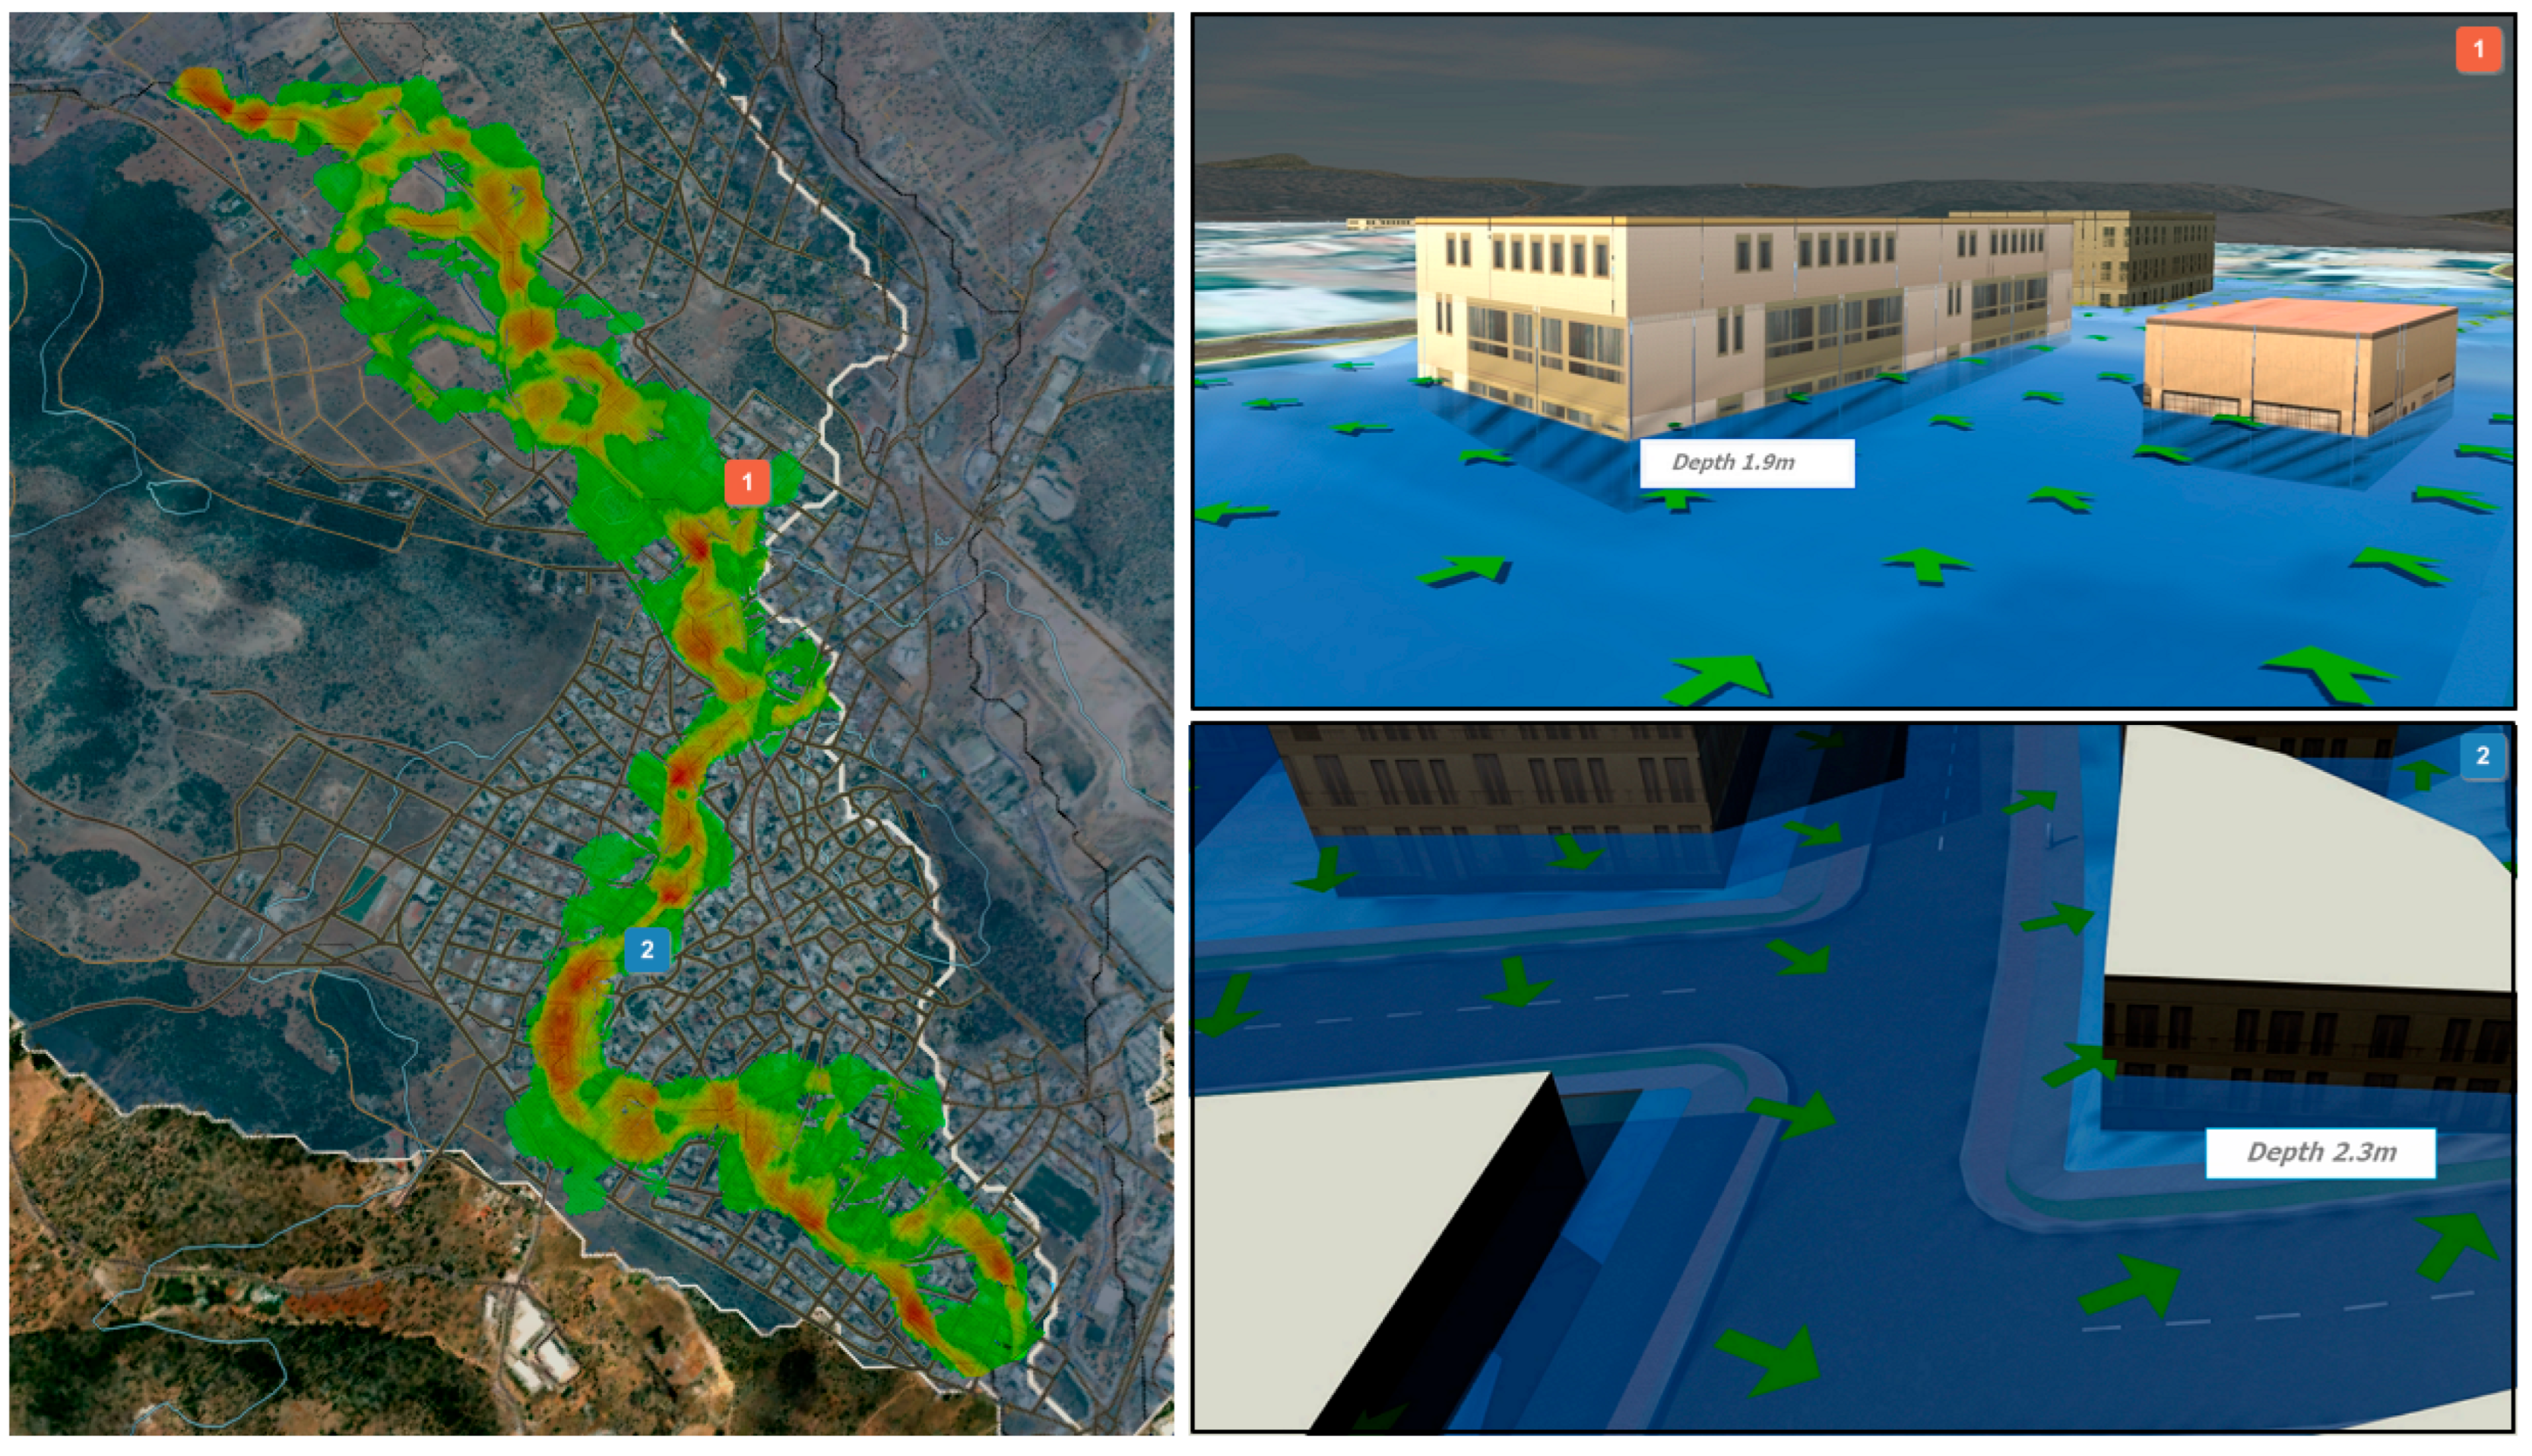
To evaluate the accuracy of results obtained using the WIM methodology, comparisons are made with real global data and existing simulation methodologies (e.g, HEC-RAS) and results. The analysis with W-BIM methodology reveals that the rainfall intensity values closely approximate true global values (Mitsopoulos et al. [6], Diakakis et al [8]) and the identified hazardous areas correspond to the locations of past disasters. The region of Mandra, which is notable for significant flood disasters in Greece, has been studied by various researchers, including Mitsopoulos et al. [6], Speis et al. [9], and Bellos et al. [16] , who have used HEC-RAS, a widely employed flood risk analysis tool. Figure 7 provides a comparative view of results from different sources. Figure 7a shows the Copernicus Emergency Management Service (EMS) output with the yellow area to indicate the flooded part of the city. Figure 7b presents the flooded area provided by HEC-RAS software ([16]). Figure 7c exhibits the flood simulation output provided by Watershed-BIM. The comparison among them indicates a high degree of consistency in terms of flood extent, depth, and flood velocities, mirroring findings from other studies. A specific comparison further illustrates the model’s enhanced accuracy. At location 2 of Figure 6a in the Mandra region, the observed flood depth was recorded at 2.60 m ([16]). The same event simulated using HEC-RAS yielded a depth of 2.02 m, while the Watershed-BIM model estimated a depth of 2.30 m—demonstrating improved approximation of real conditions.
With the proposed development, local conditions can directly be considered in risk analysis and mitigation action planning. By adopting a holistic approach, the methodology enables deeper understanding of the underlying dynamics, thereby facilitating well-informed decision-making and effective flood management strategies. The adaptable nature of the developed Watershed-BIM model ensures that flood risk management plans remain relevant and effective over time. As a result, the proposed methodology holds high potential in providing precise data, fostering collaboration, supporting in-depth analysis, and decision-making.
4.3. Discussion
Effective urban flood assessment and management requires the integration of several tools that can lead to accurate and adaptive systems that can simulate the complex and dynamic nature of flooding. Conventional approaches have laid the groundwork; however, they have rather fragmentarily analyzed the problem based on certain simplifications. A group of them deal with the simulation of hydrological behavior at the watershed scale using tools like HEC-RAS. Other studies focus on isolated urban features through tools like Building Information Modeling (BIM). This separation overlooks the interactions between natural hydrological behavior and urban infrastructure during flood events.
The Watershed-BIM approach aims to address this gap by combining both systems into a single, unified 3D simulation environment. Specifically, the proposed framework can bring together a range of technologies within a common analytical framework. They include City Information Modeling (CIM) to simulate the built environment, Geographic Information Systems (GIS) to map terrain and land use, Flood Risk Assessment (FRA) to identify vulnerable zones, and Flood Risk Management (FRM) to evaluate mitigation strategies. As such, the approach merges them into an interoperable model that can support informed decision-making. The inclusion of high-resolution data regarding rainfall patterns, watershed, and urban structural layouts - as well as real field observations from actual flooding occasions – can improve the simulations and provide better reflection of real-world conditions.
Figure 7.
Flood simulation results via a) Copernicus Emergency Management Service (EMS) b) HEC-RAS flood results ([16]), c) Watershed-BIM flood results.
Figure 7.
Flood simulation results via a) Copernicus Emergency Management Service (EMS) b) HEC-RAS flood results ([16]), c) Watershed-BIM flood results.
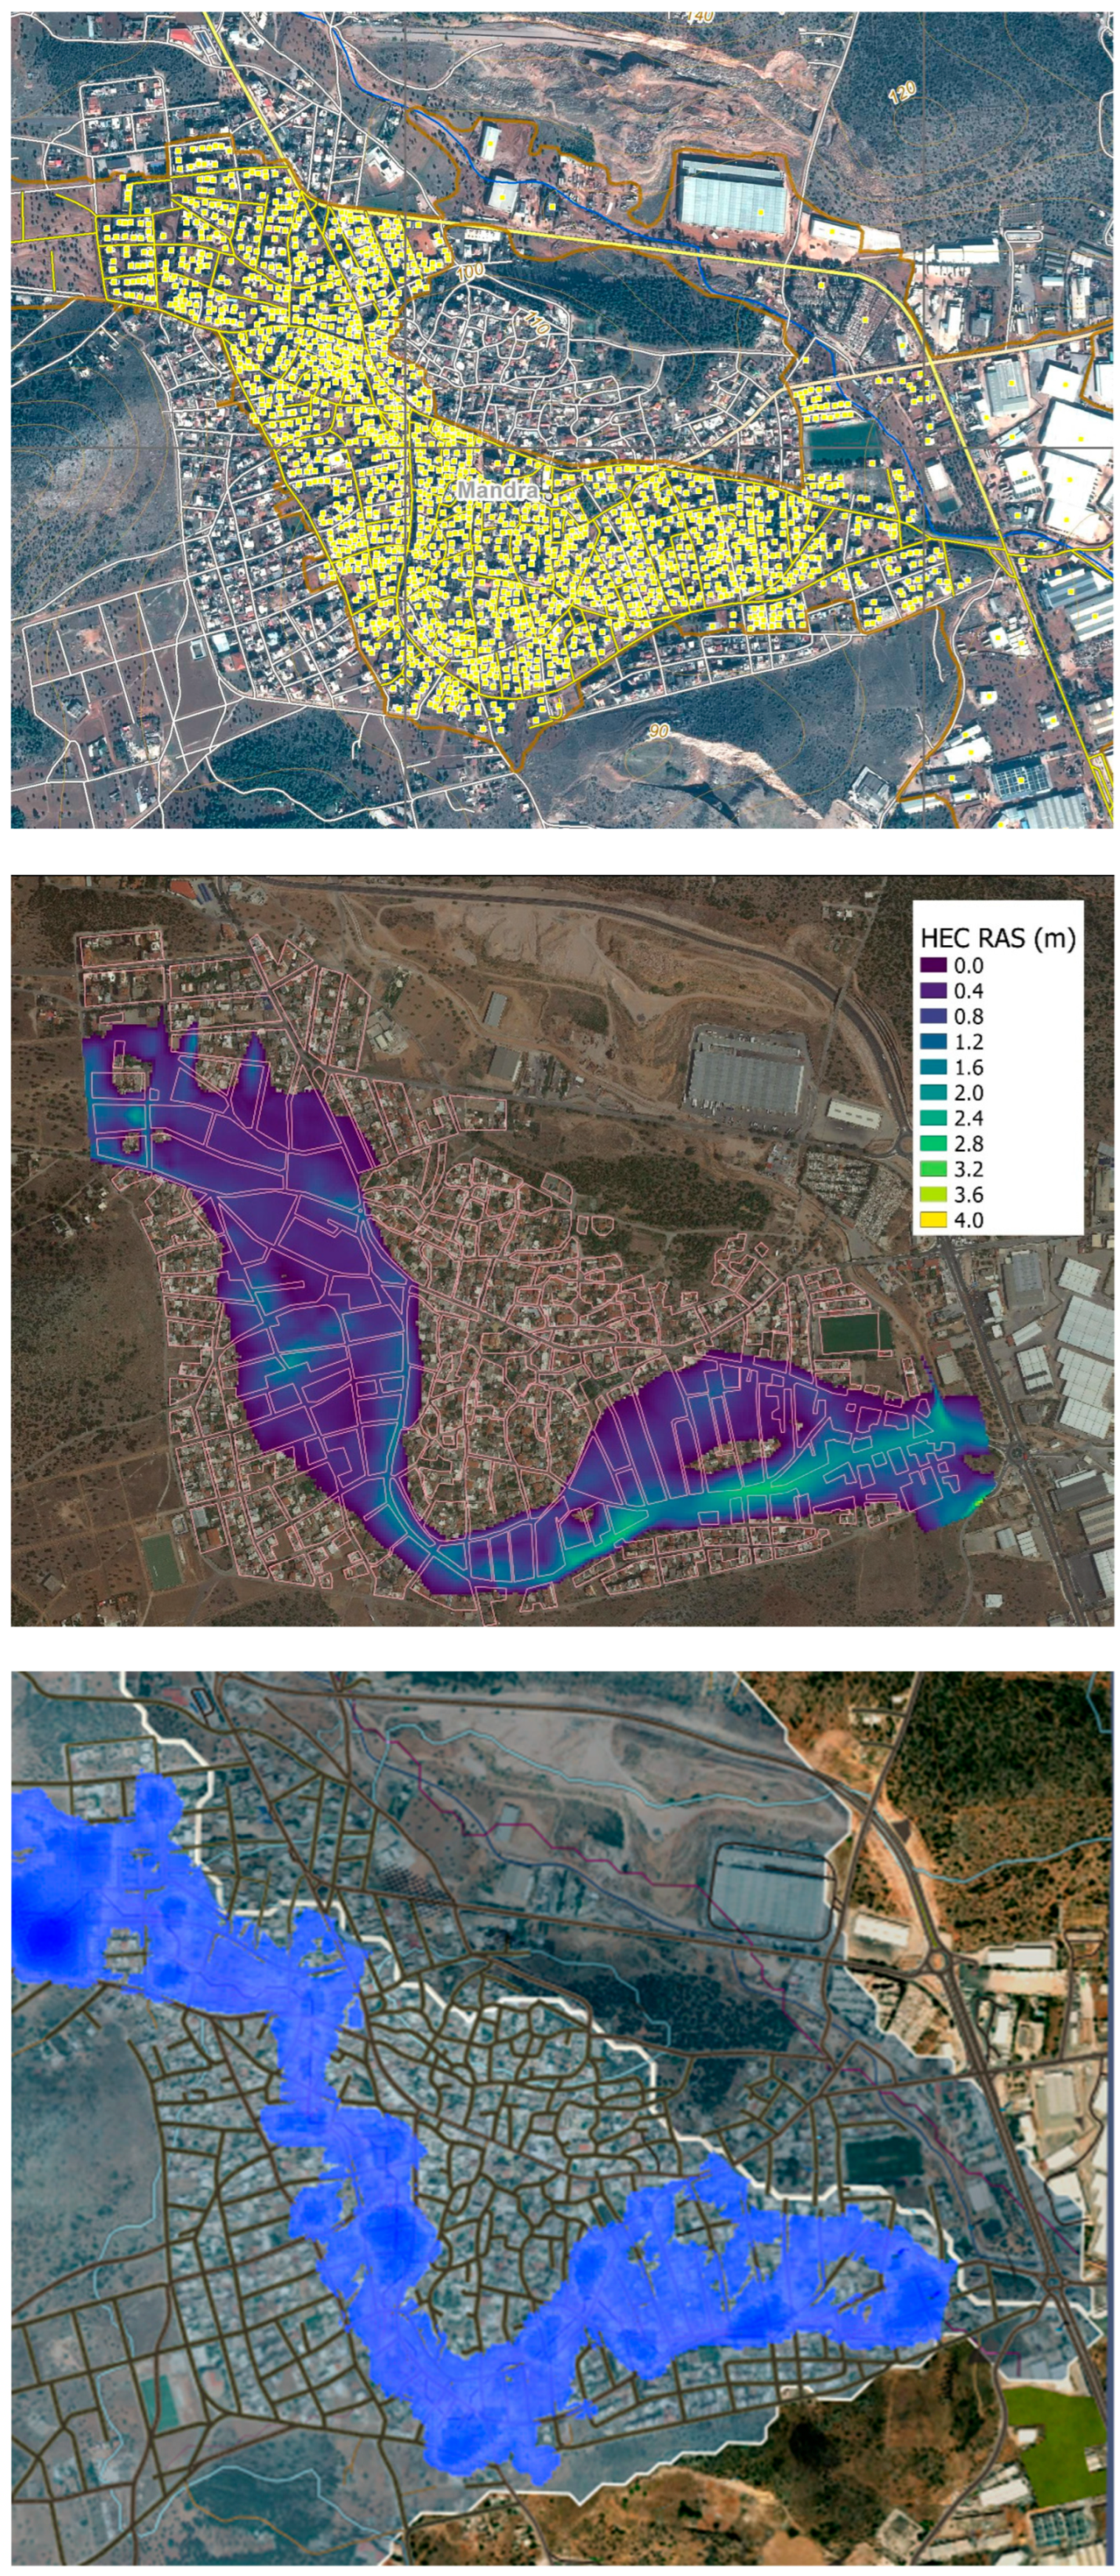
The presented case study (Figure 6) illustrates how the system can visualize flood propagation at both large and small scales. In Figure 6a, flood characteristics are shown within city limits, while Figure 6b zooms in on a school complex showing flow direction and depth around buildings and infrastructure. Figure 7 provides a comparison of results between the simulation and the actual flood measurements which indicates a high potential of the method to simulate the actual event.
Notably, the model is highly adaptable, as it can incorporate a wide range of datasets, from topography and hydrological parameters to infrastructure specifics, allowing for scenario testing and proactive planning. For instance, vegetation can be modeled in terms of surface roughness and infiltration capacity, which helps slow down runoff and retain water in the soil. Stormwater networks, physical barriers, and obstructions can also be simulated, leading to more informed design choices such as green infrastructure, permeable surfaces, or diversion channels.
8. Conclusions
Urban flooding is still a critical and global challenge, exacerbated by the increasing frequency and intensity of extreme weather events and rapid urbanization. Extreme events of such types typically result in severe disruptions, infrastructure inoperability or damage, and occasionally life losses - particularly in older or undergoing unplanned urban sprawl cities with aging, undersized, or poorly maintained drainage systems. Addressing such challenges requires comprehensive modeling approaches, which can capture the complex interaction between natural hydrological processes and urban infrastructure.
This study introduces the Watershed-BIM methodology as a framework for urban flood simulation. In contrast to conventional approaches that tend to address either the watershed or the urban domain in isolation, Watershed-BIM establishes an integrated environment that bridges hydrology, built infrastructure, and spatial data analysis. Combining Building Information Modeling (BIM), City Information Modeling (CIM), Geographic Information Systems (GIS), Flood Risk Assessment (FRA), and Flood Risk Management (FRM), the method enables enhanced predictive accuracy, more effective identification of flood-prone areas, and a deeper understanding of urban flood resilience under extreme conditions.
The application of Watershed-BIM to real-world scenarios demonstrates its capability to approximate observed flood depths with greater precision than traditional models such as HEC-RAS. Moreover, the three-dimensional representation of flood behavior around buildings and infrastructure provides rich spatial and temporal outputs that can provide more informed decision-support to urban planners and risk managers.
Although the study remains mainly in the assessment of flood characteristics and consequences rather than implementing a full-scale flood management plan (at this stage), it provides the ground for integrating detailed simulation models into broader mitigation strategies. As computational power and the availability of high-resolution spatial and hydrological data continue to expand, Watershed-BIM is expected to play an increasingly vital role in shaping resilient, adaptive, and sustainable urban environments.
Supplementary Materials
The are no supplementary materials.
Author Contributions
Conceptualization, P.T. and A.C.; methodology, P.T. and A.C.; software, P.T.; validation, P.T. and V.P.; formal analysis, P.T., A.C., and V.P.; investigation, P.T., and V.P.; resources, A.C.; data curation, P.T., and V.P.; writing—original draft preparation, P.T., and V.P.; writing—review and editing, P.T., A.C., and V.P.; visualization, P.T., A.C., and V.P.; supervision, A.C.; project administration, P.T. and A.C.; funding acquisition, N/A. All authors have read and agreed to the published version of the manuscript.
Funding
This research received no external funding.
Data Availability Statement
The data that were developed and used in this study will be made available by the authors upon request.
Conflicts of Interest
The authors declare no conflicts of interest.
References
- Jongman, B.; Kreibich, H.; Apel, H.; Barredo, J.I.; Bates, P.D.; Feyen, L.; Gericke, A.; Neal, J.; Aerts, J.C.J.H.; Ward, P.J. Comparative Flood Damage Model Assessment: Towards a European Approach. Nat. Hazards Earth Syst. Sci. 2012, 12, 3733–3752. [Google Scholar] [CrossRef]
- Bernhofen, M. V.; Cooper, S.; Trigg, M.; Mdee, A.; Carr, A.; Bhave, A.; Solano-Correa, Y.T.; Pencue-Fierro, E.L.; Teferi, E.; Haile, A.T.; et al. The Role of Global Data Sets for Riverine Flood Risk Management at National Scales. Water Resour. Res. 2022, 58, 1–25. [Google Scholar] [CrossRef]
- Alabbad, Y.; Yildirim, E.; Demir, I. A Web-Based Analytical Urban Flood Damage and Loss Estimation Framework. Environ. Model. Softw. 2023, 163, 105670. [Google Scholar] [CrossRef]
- Cea, L.; Costabile, P. Flood Risk in Urban Areas: Modelling, Management and Adaptation to Climate Change: A Review. Hydrology 2022, 9. [Google Scholar] [CrossRef]
- Soulios, G.; Stournaras, G.; Nikas, K.; Mattas, C. The Floods in Greece: The Case of Mandra in Attica. Bull. Geol. Soc. Greece 2018, 52, 131. [Google Scholar] [CrossRef]
- Mitsopoulos, G.; Diakakis, M.; Panagiotatou, E.; Sant, V.; Bloutsos, A.; Lekkas, E.; Baltas, E.; Stamou, A.I. ‘How Would an Extreme Flood Have Behaved If Flood Protection Works Were Built?’ The Case of the Disastrous Flash Flood of November 2017 in Mandra, Attica, Greece. Urban Water J. 2022, 19, 911–921. [Google Scholar] [CrossRef]
- Varlas, G.; Anagnostou, M.N.; Spyrou, C.; Papadopoulos, A.; Kalogiros, J.; Mentzafou, A.; Michaelides, S.; Baltas, E.; Karymbalis, E.; Katsafados, P. A Multi-Platform Hydrometeorological Analysis of the Flash Flood Event of 15 November 2017 in Attica, Greece. Remote Sens. 2019, 11. [Google Scholar] [CrossRef]
- Diakakis, M.; Deligiannakis, G.; Andreadakis, E.; Katsetsiadou, K.N.; Spyrou, N.I.; Gogou, M.E. How Different Surrounding Environments Influence the Characteristics of Flash Flood-Mortality: The Case of the 2017 Extreme Flood in Mandra, Greece. J. Flood Risk Manag. 2020, 13, 1–16. [Google Scholar] [CrossRef]
- Speis, P.D.; Andreadakis, E.; Diakakis, M.; Daidassi, E.; Sarigiannis, G. Psychosocial Vulnerability and Demographic Characteristics in Extreme Flash Floods: The Case of Mandra 2017 Flood in Greece. Int. J. Disaster Risk Reduct. 2019, 41, 101285. [Google Scholar] [CrossRef]
- Khan, I.; Lei, H.; Shah, A.A.; Khan, I.; Muhammad, I. Climate Change Impact Assessment, Flood Management, and Mitigation Strategies in Pakistan for Sustainable Future. Environ. Sci. Pollut. Res. 2021, 28, 29720–29731. [Google Scholar] [CrossRef]
- Devia, G.K.; Ganasri, B.P.; Dwarakish, G.S. A Review on Hydrological Models. Aquat. Procedia 2015, 4, 1001–1007. [Google Scholar] [CrossRef]
- Yu, C.; Duan, J. Simulation of Surface Runoff Using Hydrodynamic Model. J. Hydrol. Eng. 2017, 22, 1–12. [Google Scholar] [CrossRef]
- Teng, J.; Jakeman, A.J.; Vaze, J.; Croke, B.F.W.; Dutta, D.; Kim, S. Flood Inundation Modelling: A Review of Methods, Recent Advances and Uncertainty Analysis. Environ. Model. Softw. 2017, 90, 201–216. [Google Scholar] [CrossRef]
- Zischg, J.; Goncalves, M.L.R.; Bacchin, T.K.; Leonhardt, G.; Viklander, M.; Van Timmeren, A.; Rauch, W.; Sitzenfrei, R. Info-Gap Robustness Pathway Method for Transitioning of Urban Drainage Systems under Deep Uncertainties. Water Sci. Technol. 2017, 76, 1272–1281. [Google Scholar] [CrossRef]
- Chen, W.; Wang, W.; Huang, G.; Wang, Z.; Lai, C.; Yang, Z. The Capacity of Grey Infrastructure in Urban Flood Management: A Comprehensive Analysis of Grey Infrastructure and the Green-Grey Approach. Int. J. Disaster Risk Reduct. 2021, 54, 102045. [Google Scholar] [CrossRef]
- Bellos, V.; Kourtis, I.; Raptaki, E.; Handrinos, S.; Kalogiros, J.; Sibetheros, I.A.; Tsihrintzis, V.A. Identifying Modelling Issues through the Use of an Open Real-World Flood Dataset. Hydrology 2022, 9. [Google Scholar] [CrossRef]
- Kelesoglu, M.K.; Temur, R.; Gülbaz, S.; Memisoglu Apaydin, N.; Kazezyılmaz-Alhan, C.M.; Bozbey, I. Site Assessment and Evaluation of the Structural Damages after the Flood Disaster in the Western Black Sea Basin on August 11, 2021. Nat. Hazards 2023, 116, 587–618. [Google Scholar] [CrossRef]
- Nkwunonwo, U.C.; Whitworth, M.; Baily, B. A Review of the Current Status of Flood Modelling for Urban Flood Risk Management in the Developing Countries. Sci. African 2020, 7, e00269. [Google Scholar] [CrossRef]
- Salvadore, E.; Bronders, J.; Batelaan, O. Hydrological Modelling of Urbanized Catchments: A Review and Future Directions. J. Hydrol. 2015, 529, 62–81. [Google Scholar] [CrossRef]
- Rong, Y.; Zhang, T.; Zheng, Y.; Hu, C.; Peng, L.; Feng, P. Three-Dimensional Urban Flood Inundation Simulation Based on Digital Aerial Photogrammetry. J. Hydrol. 2020, 584, 124308. [Google Scholar] [CrossRef]
- Rydvanskiy, R.; Hedley, N. 3d Geovisualization Interfaces as Flood Risk Management Platforms: Capability, Potential, and Implications for Practice. Cartographica 2020, 55, 281–290. [Google Scholar] [CrossRef]
- Amirebrahimi, S.; Rajabifard, A.; Mendis, P.; Ngo, T. A BIM-GIS Integration Method in Support of the Assessment and 3D Visualisation of Flood Damage to a Building. J. Spat. Sci. 2016, 61, 317–350. [Google Scholar] [CrossRef]
- Kangwa, K.; Mwiya, B. Flood Simulation with GeoBIM. Smart Resilient Infrastruct. Emerg. Econ. Perspect. Build. Better 2023, 90–98. [Google Scholar] [CrossRef]
- Jang, Y.H.; Park, S.I.; Kwon, T.H.; Lee, S.H. CityGML Urban Model Generation Using National Public Datasets for Flood Damage Simulations: A Case Study in Korea. J. Environ. Manage. 2021, 297, 113236. [Google Scholar] [CrossRef]
- Wang, C.; Hou, J.; Miller, D.; Brown, I.; Jiang, Y. Flood Risk Management in Sponge Cities: The Role of Integrated Simulation and 3D Visualization. Int. J. Disaster Risk Reduct. 2019, 39. [Google Scholar] [CrossRef]
- Liu, H.; Su, H.; Li, H. Study on Digital Twin Technologies for Watershed Information Modeling (WIM): A Systematic Literature Review and Bibliometric Analysis. Arch. Comput. Methods Eng. 2024, 31, 263–289. [Google Scholar] [CrossRef]
- Yang, Y.; Ng, S.T.; Dao, J.; Zhou, S.; Xu, F.J.; Xu, X.; Zhou, Z. BIM-GIS-DCEs Enabled Vulnerability Assessment of Interdependent Infrastructures – A Case of Stormwater Drainage-Building-Road Transport Nexus in Urban Flooding. Autom. Constr. 2021, 125, 103626. [Google Scholar] [CrossRef]
- Syed Abdul Rahman, S.A.F.; Abdul Maulud, K.N.; Wan Mohd Jaafar, W.S. BIM-GIS in Catalyzing 3D Environmental Simulation. In Advances in Geoinformatics Technologies: Facilities and Utilities Optimization and Management for Smart City Applications; Springer, 2024; pp. 183–200.
- Ajmar, A.; Boccardo, P.; Broglia, M.; Kucera, J.; Giulio-Tonolo, F.; Wania, A. Response to Flood Events: The Role of Satellite-based Emergency Mapping and the Experience of the Copernicus Emergency Management Service. Flood damage Surv. Assess. New insights from Res. Pract. 2017, 211–228. [Google Scholar]
- Transportation, P.D. of PennDOT Drainage Manual; Publication (Pennsylvania. Department of Transportation); Pennsylvania Department of Transportation, 2008.
Disclaimer/Publisher’s Note: The statements, opinions and data contained in all publications are solely those of the individual author(s) and contributor(s) and not of MDPI and/or the editor(s). MDPI and/or the editor(s) disclaim responsibility for any injury to people or property resulting from any ideas, methods, instructions or products referred to in the content. |
© 2025 by the authors. Licensee MDPI, Basel, Switzerland. This article is an open access article distributed under the terms and conditions of the Creative Commons Attribution (CC BY) license (https://creativecommons.org/licenses/by/4.0/).
Copyright: This open access article is published under a Creative Commons CC BY 4.0 license, which permit the free download, distribution, and reuse, provided that the author and preprint are cited in any reuse.


