
Submitted:
03 June 2025
Posted:
05 June 2025
You are already at the latest version
Abstract
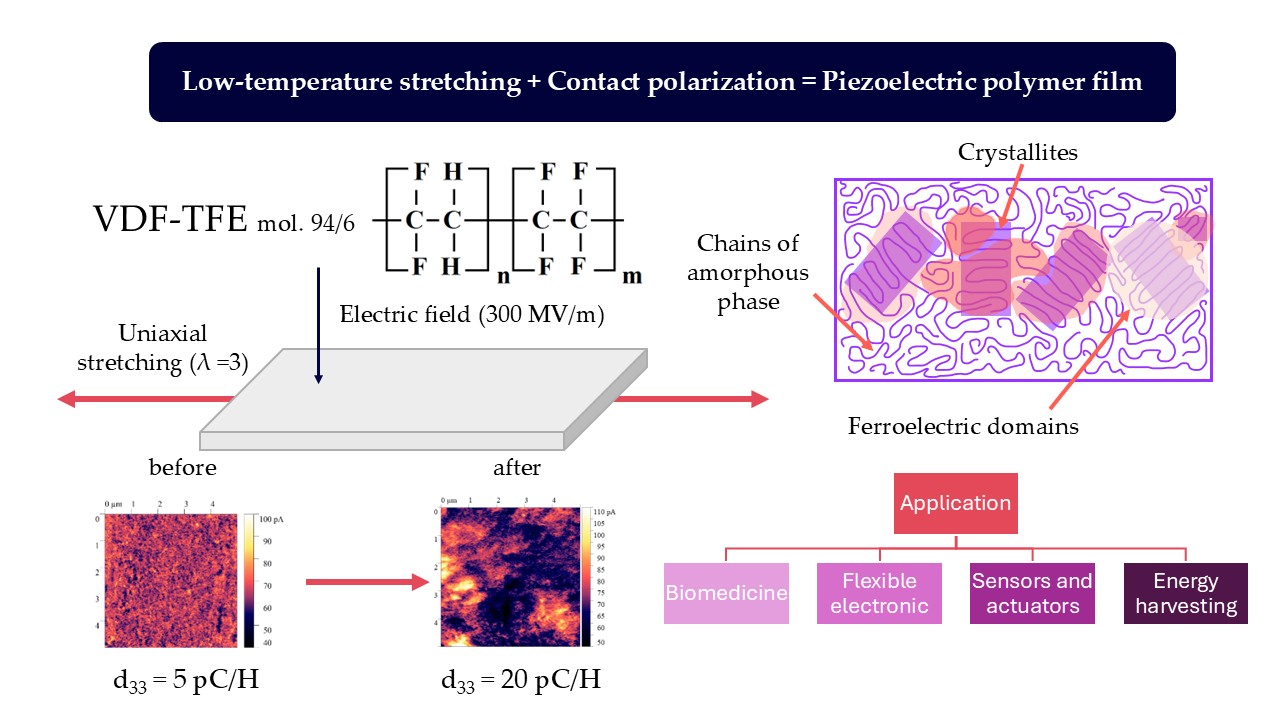
The paper considers the uniaxial orientation effect on structure and piezoelectric properties of the vinylidene fluoride-tetrafluoroethylene copolymer ferroelectric films. The films were exposed to uniaxial orientation stretching in the temperature range from 20°C to 60°C; then, they were contact polarized under the normal conditions. Temperature dependence of the electric strength was determined. The longitudinal piezoelectric coefficient d33 values were measured by the quasi-static Berlincourt method. The piezoresponse force microscopy (PFM) method was used to investigate the film domain structure before and after polarization, and the local piezoelectric coefficient values were also calculated. Phase composition was studied using the differential scanning calorimetry and the infrared spectroscopy with the Fourier transform. It was found that uniaxial orientation stretching contributed to an increase in the piezoelectric coefficient d33 from 5 pC/N to 16…20 pC/N. The results obtained indicate importance of the amorphous phase contribution to formation of the piezoelectric properties in polymeric materials.
Keywords:
piezoelectricity
; ferroelectric polymer
; flexible electronics
; supramolecular structure
1. Introduction
Despite the fact that piezoelectric ceramics remain the main material in piezoelectric engineering today, ferroelectric polymers based on the polyvinylidene fluoride (PVDF) are finding the increasingly wider application in science and technology [1,2] due to the relatively high values of pyro- and piezoresponse, chemical resistance, biocompatibility, mechanical and technological flexibility, high impact strength and transparency [3]. If the electroactive properties in piezoceramics are determined mainly by their chemical composition, for the similar polymer ferroelectrics, the structure of material formed in the process of such technological operations as orientation (stretching) or annealing would affect significantly these properties.
According to the generally accepted assumptions of today [4,5], cooling the melt in the PVDF or its copolymers extraction leads to the polymer matrix crystallization in the TGTG' conformation (α-phase), which is not electroactive. During orientation and as the polymer chains straighten, a polymorphic transition of the α-phase to the electroactive conformation -TT- (β-phase) occurs. Dipoles appear in the polymer volume orienting and causing appearance of the piezoelectric properties with application of the electric field. In addition to the phase transition, orientation increases the polymer material electric strength [6] making it possible to raise the orienting electric field intensity and the material piezoresponse [7].
In the overwhelming majority of works devoted to the PVDF film orientation, the researchers focus their attention primarily on selecting the technological process parameters (degree and temperature) in stretching, which ensures the most complete transition of the α-phase [8,9,10,11] to the β-phase and studying the crystallinity degree and the relaxation processes. As a rule, a PVDF homopolymer is considered, and to obtain films with a high level of the electroactive properties, they are uniaxially oriented at the temperatures of 60–90℃ with the stretching ratio of 3–4 [7,13] and subsequent annealing at the temperature of 120℃ [14,15]. Despite the fact that a number of works show the influence of the polymer supramolecular structure phase composition on the material piezoelectric response [16], the literature practically misses any information on the orientation technological process influence on the response magnitude. While it is important for further practical application of the films obtained. In addition, the literature poorly covers the aspect of the amorphous phase influence on the piezoelectric response magnitude, where the reversible transitions “paraelectric → ferroelectric” are quite possible during the mechanical stretching [17].
This paper considers the vinylidene fluoride copolymer with the 6 mol% tetrafluoroethylene (VDF-TFE). Compared to other better-studied VDF copolymers, this material has a few advantages making it possible to simplify the technological process in obtaining the polarized films. Unlike, for example, the PVDF homopolymer, it dissolves in a larger number of solvents and has lower melting points facilitating the film formation process. Unlike the VDF/TRFE copolymer, it has a significantly lower cost. At the same time, there are significantly fewer works devoted to studying the mechanical treatment effect and thermal history of the VDF/TFE on its structure and electrophysical properties. Paper [18], for example, considers a VDF copolymer with 30 mol% TFE; however, only the stretching influence on the material crystallinity degree and dielectric properties is analyzed.
This paper applies the methods of scanning electron microscopy, piezoresponse force microscopy, differential scanning calorimetry, and IR spectroscopy, to study the uniaxial orientation temperature influence on the structure and electroactive properties of the extruded VDF/TFE copolymer films. Besides, it discusses the molecular and supramolecular mechanisms of such orientation.
2. Materials and Methods
The paper studied the VDF/TFE copolymer films obtained by the melt extrusion. Fluoroplastic powder F2m grade B (HaloPolymer, Kirovo-Chepetsk) was used to receive the film; extrusion was performed by the IIPT SPE “Plastic”. The initial film thickness was 30 μm.
2.1. Uniaxial Stretching Technique
Uniaxial stretching was carried out at four different temperatures of 20, 40, 50 and 60°C, the stretching ratio was 3. It was noted that the stretched film thickness differed from that of the original film by few microns indicating the non-trivial material texturing process.
A laboratory machine for polymer film orientation (DACA Instrument, USA) was used to stretch the extruded film.
The required deformation value was determined by adjusting speeds of the receiving and feeding rollers. The film was heated in orientation on a flat heater, along which the film was displaced during rewinding.
2.2. Contact Polarization
After uniaxial stretching, the samples were polarized by the contact method at the room temperature for 30 seconds. The polarizing field voltage was 300 MV/m.
Contact polarization was carried out using a laboratory bench, which schematic representation is provided in Figure 1. Besides, the bench was introduced to measure electrical strength of the samples.
The samples were placed in the Vaseline oil bath, and the 2.5 mm diameter aluminum electrode was positioned on the sample top. The polarizing voltage was supplied to the sample from the high-voltage electrode.
2.3. Research Methods
2.3.1. Macroscopic Piezoelectric Coefficient d33 Measurement
Macroscopic piezoelectric coefficients d33 values were measured by the quasi-static Berlincourt method using the YE2730A d33-meter (Sinocera Piezotronics, INC, China).
2.3.2. Electrical Strength Measurement
Electrical strength temperature dependences were computed for all the samples under study. The measurements were taken in the temperature range from 20ºC to 110ºC, and the breakdown field characteristic values—at the polarization temperature (30ºC). Electrical strength was measured using the laboratory bench (Figure 2) in the Vaseline oil bath to avoid breakdown in the air.
The breakdown field values at each temperature were obtained using the two-parameter Weibull model [1,19,20,21], according to which a statistical set of the large number of the field values Eb could be described by the following function:
where x is the breakdown field current value; α is a certain characteristic field, at least 63.2% of the test samples are broken down; the parameter characterizes the breakdown field dispersion relative to the average value.
2.3.3. Piezoresponse Force Microscopy
Ferroelectric properties and morphology alteration were studied by the scanning probe microscopy (SPM) methods using the NTEGRA Prima atomic force microscope (NT-MDT SI, Zelenograd, Russia) with cantilevers with the FMG01/Pt platinum conductive coating (Tipsnano, Tallinn, Estonia). Experimental data were processed applying the Gwiddion 2.63 software (Czech Metrology Institute, Czech Republic).
SPM was used to obtain the film surface topographies and compute the root-mean-square (RMS) roughness values for the samples stretched at different temperatures. In the piezoresponse force microscopy mode, vertical and lateral piezoresponse signal distribution maps were obtained, and the local piezoelectric coefficients d33 were computed before and after contact polarization. HA_HR/Pt conducting cantilevers (NT-MDT SI, Zelenograd, Russia) with the strength constant of 17 N/m were used to measure the local piezoelectric coefficients. The local piezoelectric coefficients were determined by direct measurement of deformation when applying the alternating voltage from 0 to 10 V at the fixed frequency of 890 kHz. Measurements were taken at two points: near the breakdown point and at a certain distance. The piezoelectric coefficients d33 values were computed from the Mag1n signal:
where U is the voltage supplied in scanning (B); Q is the quality factor, and the Mag 1n signal corresponds to the sample deformation (pm).
The single-crystal lithium niobate with the known value of d33 = 18 pm/V was chosen as the calibration sample.
2.3.4. Scanning Electron Microscopy
The film surface morphology was studied using the scanning electron microscopy (SEM) with the TESCAN VEGA3 microscope (TESCAN Brno s.r.o., Czech Republic). Before scanning, a thin layer (about 20 nm) of the conductive coating (gold) was deposited to the samples surface to prevent charge spreading over the dielectric surface. The metal coating was deposited using the SPI-MODULE Sputter Coater magnetron sputtering device (SPI supplies, West Chester, USA). Micrographs of the cold cleavage were also obtained for the films stretched in different modes. The films were cooled in the liquid nitrogen for 5 minutes.
2.3.5. Differential Scanning Calorimetry
The samples’ thermal properties and crystallinity degree were determined by the differential scanning calorimetry (DSC) on the NETZSCH DSC 204F1 Phoenix device (NETZSCH-Gerätebau GmbH, Selb, Germany). The samples were placed for measurement in the aluminum crucibles, and they were heated in the temperature range of 25–200ºС at the heating rate of 2 K/min in the argon medium.
2.3.6. Fourier Transform Infrared Spectroscopy and Computation Based on It
Phase composition of the experimental samples was determined by the Fourier transform IR spectroscopy. The transmission coefficients were measured using the PerkinElmer 1760X FTIR IR Fourier spectrometer in the wavelength range of 400–4000 cm–1.
The spectra were processed and decomposed in the Systat PeakFit 4.12.00 software program. The film phase composition (electroactive phase and α-phase proportions) was computed according to the method provided in [24].
The electroactive phase proportion was determined by the formula:
where: is the amplitude at the 763 cm–1 peak (alpha-phase peak); is the amplitude at the 840 cm–1 peak (electroactive phase peak (β- and γ-phases)); are the absorption coefficients at the corresponding wave values.
The alpha phase proportion was computed assuming that the material contained 3 phases (α, β and γ):
2.3.7. Density Measurement by the Hydrostatic Weighing
Density was measured by the hydrostatic weighing method according to ISO 1183–1:2019 “Plastics—Methods for determining the density of non-cellular plastics—Part 1: Immersion method, liquid pycnometer method and titration method”. Weighing was carried out in liquid with the known density, i.e. in the distilled water. The M-ER 123 ACFJR “SENSOMATIC” TFT analytical scales (Mertech, Korea) with the weighing accuracy of up to 0.0001 g were used in weighing.
3. Results
3.1. Electrical Strength Measurement
The orientation stretching temperature provides the strongest effect on the electrical strength dependence on the breakdown temperature. The electrical strength temperature dependence for the studied samples is not linear (Figure 2).
Most likely, this type of temperature dependence is associated with the structure alteration in stretching. It is found that orientation stretching increases the electrical strength value, thereby allowing polarization saturation to be achieved.
The paper notes that increasing the test temperature up to 40℃ leads to the growing electrical strength of the oriented samples. With the further increase in temperature, the electrical strength decreases. Such behavior of the electrical strength temperature dependence could be explained by the αc relaxation process being characteristic for the vinylidene fluoride copolymers, which, according to the literature data [25,26], lies in the temperature range of 40–50℃. The αc-process is associated with alteration in the molecular mobility of the polymer amorphous phase and the segmental motion of chains in the crystallites. At temperatures above the αc-relaxation, local overheating appears due to the energy dissipation, which reduces the electrical material strength.
3.2. Contact Polarization (Measuring the Macroscopic Piezoelectric Coefficients by the Berlincourt Method)
The piezoelectric coefficient dependence on the uniaxial stretching temperature expresses to a lesser extent. The results obtained (Table 1) demonstrate that the d33 value dependence on the sample stretching temperature is non-monotonic.
Uniaxial orientation stretching provides for an increase in the piezoelectric coefficient from 5 pC/N to 20 pC/N, which allows us to use polarized film as an active element in sensors and actuators.
The piezoelectric coefficient maximum value is achieved at the stretching temperature of 20℃. At the orientation temperature of 40℃, the d33 value passes through its minimum: d33 is by 13% less than the piezoelectric coefficient at the stretching temperature of 20℃.
The piezoelectric coefficient values are also computed from the PFM data.
3.3. Piezoresponse Force Microscopy
The piezoresponse force microscopy method is used to obtain distribution patterns of the vertical and lateral piezoresponse signals and compute the local piezoelectric coefficient values before and after film polarization. The data are presented in Table 2 and Figure 3.
It follows from the piezoresponse force microscopy data that the films after polarization have the most pronounced vertical piezoresponse signal, their local piezoelectric coefficients value increases from 5 pm/V to 21 pm/V (film stretched at 20℃).
As could be seen from the data in Figure 4, the vertical piezoelectric response contrast changes after polarization, and consequently changes the ferroelectric domains size. The observed effect is characteristic for all the studied samples. To compute the ferroelectric domain sizes in the film before and after polarization, an autocorrelation function is constructed (Figure 4).
The characteristic domain size ξ is found by computing correlation function of the vertical piezoresponse signal distribution depending on the r coordinate:
where: A is the constant; r is the distance from the central peak (nm) determined from the autocorrelation function image; ξ is the average value of the domain size (nm); h (0<h<1) is the parameter [27,28].
Figure 6 presents an example of the autocorrelation function for a film oriented at 20ºC showing the difference in correlation length of the topographic parameter ξtop and the size of the ferroelectric domain ξVPFM. It is found that the domain size increases significantly after polarization from 54 nm to 490 nm. The measured domain size appears to be an order of magnitude higher than the characteristic crystallite size of the ferroelectric β-phase (l001 = 10 nm) [29], which indicates contribution of the amorphous phase chains to the mechanism of ferroelectric domains formation in the VDF/TFE films.
An increase in the ferroelectric domain size of the oriented film after polarization could be explained by the contribution of the amorphous component chains. The macromolecule regions of the crystallite end surfaces form the intermediate ordering phase [17]. Therefore, when loaded along the drawing axis, these regions could lose mobility and become a part of the crystallite. If in the oriented state, the copolymer crystalline phase exists in both the ferroelectric and paraelectric forms, the external mechanical stress could initiate local reversible “paraelectric → ferroelectric” transitions.
3.4. Differential Scanning Calorimetry
It is natural to assume that dependence of the VDF/TFE copolymer film electroactive properties on the stretching temperature is connected to alteration in its structure during this process.
Using the differential scanning calorimetry makes it possible to analyze the samples’ structure after stretching. Three endothermic peaks corresponding to the crystallite melting are found on the curves of the first heating. This indicates the presence of several crystalline phases in the sample. For the samples stretched at 20ºС and 50ºС, the peak corresponding to 145ºС is weakly expressed.
The paper notes that uniaxial stretching insignificantly influences crystallinity degree of the studied samples. All films are characterized by the presence of several crystalline phases. Films stretched at 20°C and 50°C demonstrate the maximum crystallinity.
It is also worth to mention the existence of a long low-temperature “tail” in the crystallization processes, which could indicate the crystallite defectiveness formed during extrusion and the subsequent stretching.
3.5. IR Fourier Spectroscopy
The measured IR spectra are shown in Figure 6. The electroactive and α-phases content changes slightly (up to 3.5%) and non-monotonically depending on the stretching temperature (Table 4). In general, phase composition also changes slightly as a result of mechanical stretching. The sample stretched at the temperature of 40ºC has the lowest proportion of the ferroelectric phase. It is also characterized by the minimum piezoelectric coefficient among the stretched samples.
3.6. Density Measurement by the Hydrostatic Weighing Method
The samples density after stretching is measured by the hydrostatic weighing method (Table 5).
The paper shows that uniaxial orientation stretching significantly increases the film density. In this case, the density value depends nonlinearly on the stretching temperature. The maximum density value (1.94 g/cm3) is typical for a film oriented at 40ºC. It was shown previously that the piezoelectric coefficient at this stretching temperature was minimal (16 pC/N).
3.7. Scanning Electron Microscopy
The presented data demonstrates that the crystallinity degree and density of the uniaxially oriented film (with a generally non-monotonic nature of dependences with alteration in the stretching temperature) are changing antibatically and reach the extreme point at the stretching temperature of 40℃. This confirms the previously advanced assumption that structure of the film oriented at the temperature of 40℃ differs from its structure formed at the other stretching temperatures.
The SEM micrographs of “cold” cleavage of the films oriented at different temperatures could be considered as an indirect confirmation of this conclusion (Figure 7).
The presented results show that surfaces of all the studied samples contain layers inclined at an angle to the surface, which are characteristic for the uniaxially oriented polymers [30]. Probably, the shear bands are filled with the highly dispersed oriented fibrilized material. The fibrillary structure characteristic picture is mostly indicative for the samples stretched at the temperatures of 20℃ and 50℃, which have the highest piezoelectric coefficients.
4. Discussion
The mechanical uniaxial stretching results in compacting the material structure, as evidenced by an increase in density by 11…21%. The increase in density probably means that the fibrils formed during the uniaxial orientation are compacted under the compressive forces acting in the transverse direction. Under such conditions, the deformation mode changes, i.e. the lamellas spreading turns into the interlamellar shear. The amorphous component is compressing between the lamellae, which leads to a decrease in the material free volume and, as a consequence, to an increase in its density. Apparently, orientation of the amorphous phase chains occurs during the uniaxial stretching. This, in turn, causes a decrease in the amorphous component mobility, which contributes to formation of the larger domains due to transition of the metastable paraelectric phase regions to the ferroelectric state under the mechanical stresses action. As a result, the domain size increases from 40 to 350 nm in the stretched samples under the electric field action.
In addition, an increase in the material electrical strength by ~20% after the mechanical stretching is identified. This could be explained by the fact that the polymer free volume decreases in the acting compressive stresses field, and mobility of the injected charges traps consequentially decreases [31]. Since counter motion of the oppositely charged traps determines the electrical strength magnitude, a decrease in mobility leads to an increase in the field strength, at which an electrical breakdown occurs. As a result, the material polarization efficiency increases, and the stretched films acquire piezoelectric coefficients d33 at the level of 16…20 pC/N, which is comparable with the β-PVDF piezoelectric coefficient values.
In this case, the d33 value depends on the crystallinity degree and the ferroelectric phase proportion. The sample stretched at the temperature of 40ºС has the lowest piezoelectric coefficient (16 pC/N). It is also characterized by the minimum ferroelectric phase proportion and crystallinity degree among the stretched samples. The samples stretched at the temperatures of 20ºС and 50ºС have the highest piezoelectric coefficients (20 and 19 pC/N, respectively). They are also characterized by the highest crystallinity degree.
5. Conclusions
The paper examines effect of the uniaxial orientation stretching on the piezoelectric properties and electrical strength of the VDF/TFE copolymer film. It founds that orientation stretching increases the electrical strength, thereby allowing achievement of the polarization saturation. At the same time, electrical strength decreases at the temperatures above 40℃, where the relaxation αc-process appears leading to an increase in the cooperative mobility and local overheating. This determines technological modes of the film polarization and limits operating conditions of the functional devices based on it.
Uniaxial orientation stretching contributes to an increase in the piezoelectric coefficient d33 from 5 pC/N to 16…20 pC/N. Apparently, this is associated with orientation of the amorphous phase chains, which leads to a decrease in their mobility. Besides, it promotes formation of the larger domains due to transition of the metastable paraelectric phase regions to the ferroelectric phase under the mechanical stresses action. The paper shows that the domain size increases significantly from 40 to 350 nm after polarization.
The obtained results indicate importance of the amorphous phase contribution to formation of the polymer material piezoelectric properties.
In addition, the paper shows that in the case of the film contact polarization at 30ºC, the piezoelectric coefficient d33 value measured by the quasi-static Berlincourt method is almost equal to the d33 value of the commercial PVDF homopolymer (20 pC/N) polarized at 80ºC. This makes it possible to use polarized VDF-TFE film as an active element in sensors and actuators.
Author Contributions
Conceptualization, S.V.K., E.L.B, A.S.O., M.O.M.; methodology, E.L.B., S.V.K. and M.O.M; software, E.L.B. and V.S.K.; validation, M.O.M. and A.S.O.; formal analysis, E.L.B.; investigation, E.L.B., V.S.K., M.V.B.; resources, P.A.M. and D.S.R.; data curation, S.V.K.; writing—original draft preparation, S. V.K., E.L.B., M.O.M; writing—review and editing, E.L.B.; visualization, E.L.B.; supervision, E.L.B. and M.O.M.; project administration, P.A.M. and M.O.M.; funding acquisition, P.A.M. and D.S.R. All authors have read and agreed to the published version of the manuscript.
Funding
The research was carried out within the State Assignment of the Ministry of Science and Higher Education of the Russian Federation (Theme No. FSFN-2024-0014).
Acknowledgments
The domain structure study was performed using the scanning probe microscopy methods with the support of the Ministry of Science and Higher Education of the Russian Federation within the framework of the State Assignment (Theme No. FSME-2024-0001) on the equipment of the Center for Collective Use of Materials Science and Metallurgy of the MISIS University of Science and Technology. Contact polarization and measurement of the film electrical strength were carried out on a bench developed with the support of the Ministry of Science and Higher Education of the Russian Federation within the framework of the State Assignment (Theme FSFN-2025-0004). The authors would like to thank Alexander N. Ozerin and Mikhail Yu. Yablokov from the N. S. Enikolopov Institute of Synthetic Polymer Materials of the Russian Academy of Sciences for scientific advice.
References
- Kochervinskii, V.V.; Gradov, O.V.; Gradova, M.A. Fluorine-containing ferroelectric polymers: applications in engineering and biomedicine. RUSS CHEM REV, 2022, vol. 91, no. 11, P. RCR5037.
- Andrey, V.; et al. Piezoelectric PVDF and its copolymers in biomedicine: innovations and applications. Biomater. Sci. 2024, vol. 12, no. 20, pp. 5164–5185.
- Kochervinskii, V.V.; et al. Structural, optical, and electrical properties of ferroelectric copolymer of vinylidenefluoride doped with Rhodamine 6G dye. 2019, vol. 125, no. 4, p. 044103.
- Sessler, G.M. Piezoelectricity in polyvinylidenefluoride. The Journal of the Acoustical Society of America, 1981, vol. 70, no. 6, pp. 1596–1608.
- Saxena, P.; Shukla, P. A comprehensive review on fundamental properties and applications of poly (vinylidene fluoride) (PVDF). Advanced Composites and Hybrid Materials, 2021, vol. 4, pp. 8–26.
- Bagirov, M.A.; et al. Effect of orientation on electrical properties of polymers. Journal of Applied Polymer Science, 1976, vol. 20, no. 4, pp. 1069–1075.
- Guo, R.; et al. Ultrahigh energy density of poly (vinylidene fluoride) from synergistically improved dielectric constant and withstand voltage by tuning the crystallization behavior. Journal of Materials Chemistry A., 2021, vol. 9, no. 48, pp. 27660–27671.
- Li, L.; et al. Studies on the transformation process of PVDF from α to β phase by stretching. Rsc Advances, 2014, vol. 4, no. 8, pp. 3938–3943.
- Sencadas, V.; et al. α-to β transformation on PVDF films obtained by uniaxial stretch. Materials science forum. Trans Tech Publications Ltd, 2006, vol. 514, pp. 872–876.
- Guan, F.; Wang, J.; Pan, J.; Wang, Q.; Zhu, L. Effects of polymorphism and crystallite size on dipole reorientation in poly (vinylidene fluoride) and its random copolymers. Macromolecules, 2010, vol. 43, no. 16, pp. 6739–6748.
- Constantino, C.J.L.; et al. Phase transition in poly (vinylidene fluoride) investigated with micro-Raman spectroscopy. Applied spectroscopy, 2005, vol. 59, no. 3, pp. 275–279.
- Elyashevich, G.K.; Kuryndin, I.S.; Rozova, E.Y.; Saprykina, N.Y. Polymer piezoelements based on porous polyvinylidene fluoride films and contact electrode polyaniline layers. Physics of the Solid State, no. 62, pp.566–573. [CrossRef]
- Tasaka, S.; Miyata, S. ; The origin of piezoelectricity in poly (vinylidenefluoride). Ferroelectrics, 1981, vol. 32, no. 1, pp. 17–23.
- Ohigashi, H. Electromechanical properties of polarized polyvinylidene fluoride films as studied by the piezoelectric resonance method. Journal of Applied Physics, 1976, vol. 47, no. 3, pp. 949–955.
- Das-Gupta, D.K.; Doughty, K.; Shier, D.B. A study of structural and electrical properties of stretched polyvinylidene fluoride films. Journal of Electrostatics, 1979, vol. 7, pp. 267–282.
- Kochervinskii, V.V.; et al. The effect of electric aging on vinylidene fluoride copolymers for ferroelectric memory. Nanomaterials, 2024, vol. 14, no. 12, p. 1002.
- Kochervinskii, V.V.; Glukhov, V.A.; Sokolov, V.G.; Ostrovskii, B.I. Polymer Science U.S.S.R., 1989, vol. 31, no. 1, pp. 172–178.
- Venkatesan, T.R.; Gulyakova, A.A.; Gerhard, R. Influence of film stretching on crystalline phases and dielectric properties of a 70/30 mol% poly (vinylidenefluoride-tetrafluoroethylene) copolymer. Journal of Advanced Dielectrics, 2020, vol. 10, no. 05, p. 2050023.
- Kochervinskii, V.V. The structure and properties of block poly (vinylidene fluoride) and systems based on it. Russian chemical reviews, 1996, vol. 65, no. 10, p. 865. [CrossRef]
- Tao, R.; Shi, J.; Rafiee, M.; Akbarzadeh, A.; Therriault, D. Fused filament fabrication of PVDF films for piezoelectric sensing and energy harvesting applications. Mater. Adv, 2022, no. 3, p. 4851. 4851; 3. [Google Scholar]
- Laurent, C.; Chauvet, C.; Berdala, J. The significance of the Weibull threshold in short-term breakdown statistics. IEEE Transactions on Dielectrics and Electrical Insulation, 1994, no.1, p. 1.
- Satapathy, S.; Pawar, S.; Gupta, P.K.; Varma, K.B.R. Effect of annealing on phase transition in poly (vinylidene fluoride) films prepared using polar solvent. Bulletin of Materials Science, 2011, vol. 34, pp. 727–733.
- Wu, L.; Jin, Z.; Liu, Y.; Ning, H.; Liu, X.; Alamusi, Hu.N. Recent advances in the preparation of PVDF-based piezoelectric materials. Nanotechnology Reviews, 2022, vol. 11, no. 1, pp. 1386–1407.
- Cai, X.; et al. A critical analysis of the α, β and γ phases in poly (vinylidene fluoride) using FTIR. RSC Adv, 2017, vol. 7, no. 25, pp. 15382–15389.
- Osipkov, A.S.; Makeev, M.O.; Solodilov, V.I.; Moiseev, K.M.; Mikhalev, P.A.; Makarova, K.T.; Emanov, D.P.; Parshin, B.A.; Khromova, M.A. Stability of the properties of an acousto-optical converter based on polyvinylidene fluoride films under external influence. J. Opt. Technol, 2024, no. 91, pp. 502–508. [CrossRef]
- Dmitriev, I.Y. , Gladchenko S.V., Afanasyeva N.V. et al. Molecular mobility of polyvinylidene fluoride in an anisotropic state. Polym. Sci. Ser. A., 2008, vol. 50A, no. 3, pp. 265–272. [CrossRef]
- Munoz, R.C.; Vidal, G.; Mulsow, M.; Lisoni, J.G.; Arenas, C.; Concha, A. Surface roughness and surface-induced resistivity of gold films on mica: application of quantitative scanning tunneling microscopy. Phys. Rev, 2000, no. 62, pp. 4686–4697. [CrossRef]
- Kiselev, D.A.; Bdikin, I.K.; Selezneva, E.K.; Bormanis, K.; Sternberg, A.; Kholkin, A.L. Grain size effect and local disorder in polycrystalline relaxers via scanning probe microscopy. J. Phys. D: Appl. Phys, 2007, no. 40, pp. 7109–7112. [CrossRef]
- Kochervinskii, V.V.; Buryanskaya, E.L.; Osipkov, A.S.; Ryzhenko, D.S.; Kiselev, D.A.; Lokshin, B.V.; Kirakosyan, G.A. ; The domain and structural characteristics of ferroelectric copolymers based on vinylidene fluoride copolymer with tetrafluoroethylene composition (94/6). Polymers, 2024, vol. 16, no. 2, p. 233. [CrossRef]
- Volynskii, A.L.; Efimov, A.V.; Bakeev, N.F. Structural aspects of physical aging of polymer glasses. Polymer Science Series C, 2007, vol. 49, no. 4, pp. 301–320. [CrossRef]
- Lushcheikin, G.A. Russ. Chem. Rev., 1983, vol. 52, no. 8, p. 804. [CrossRef]
Figure 1.
Laboratory bench for the contact polarization: 1—high-voltage electrode; 2—voltage unit; 3—temperature control unit; 4—Vaseline oil bath; 5—heating table.
Figure 1.
Laboratory bench for the contact polarization: 1—high-voltage electrode; 2—voltage unit; 3—temperature control unit; 4—Vaseline oil bath; 5—heating table.
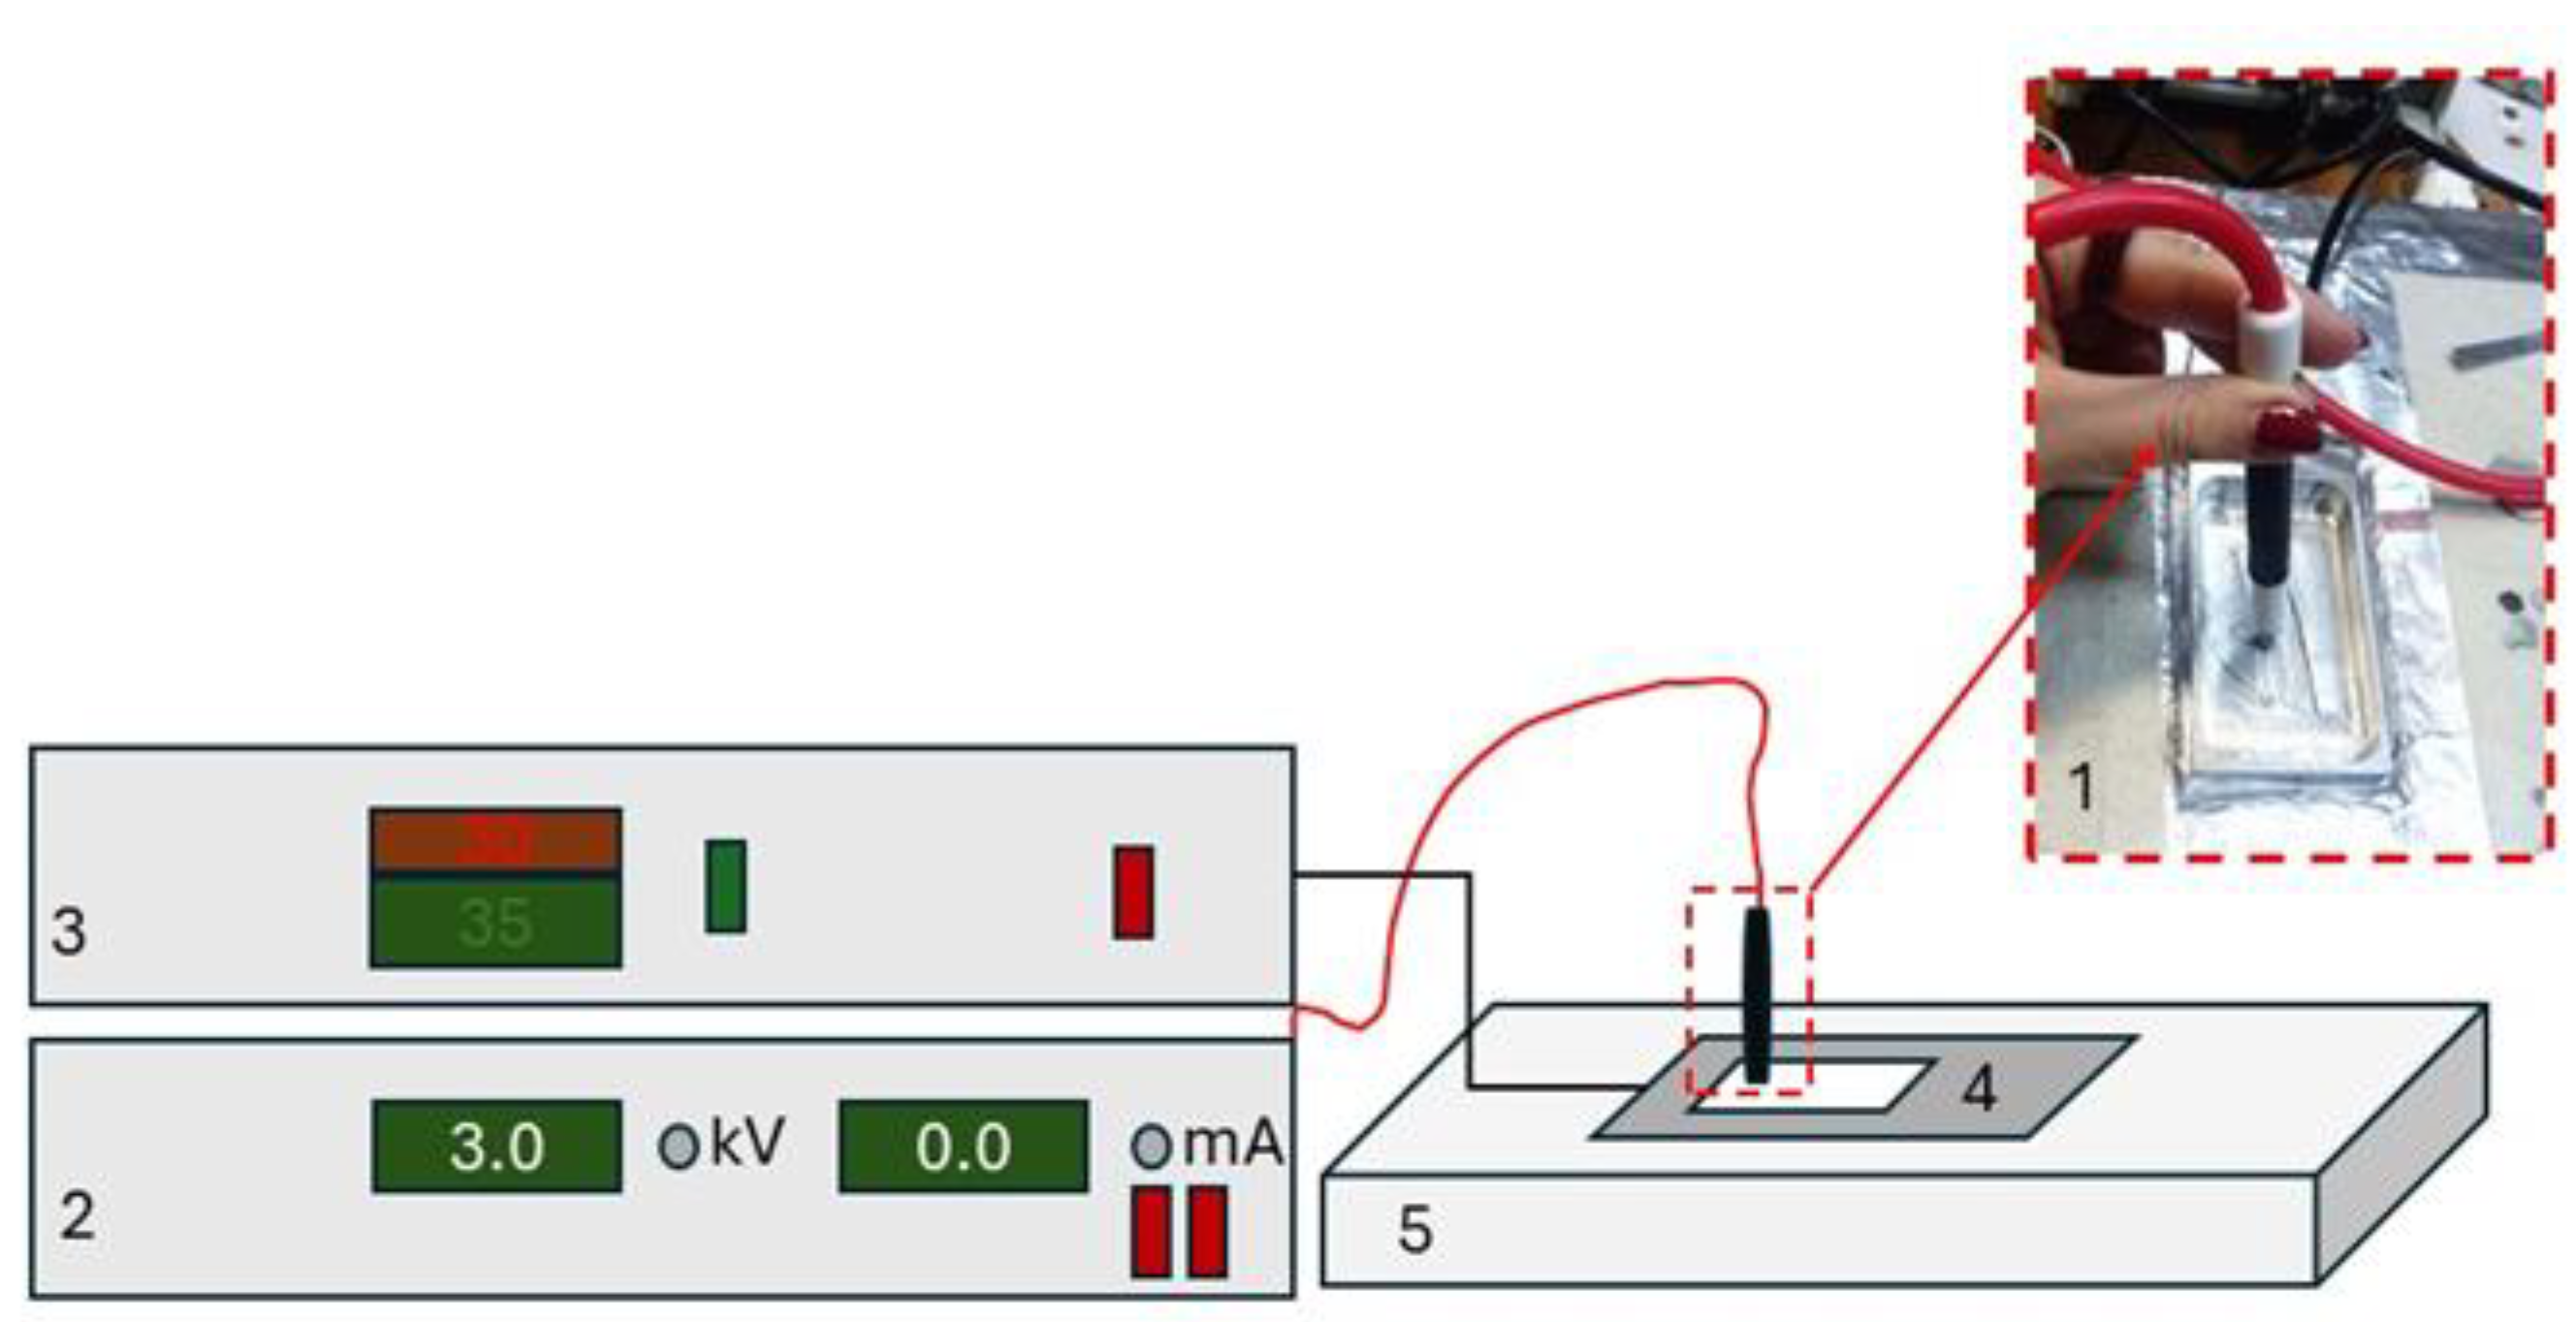
Figure 2.
Electrical strength temperature dependence.
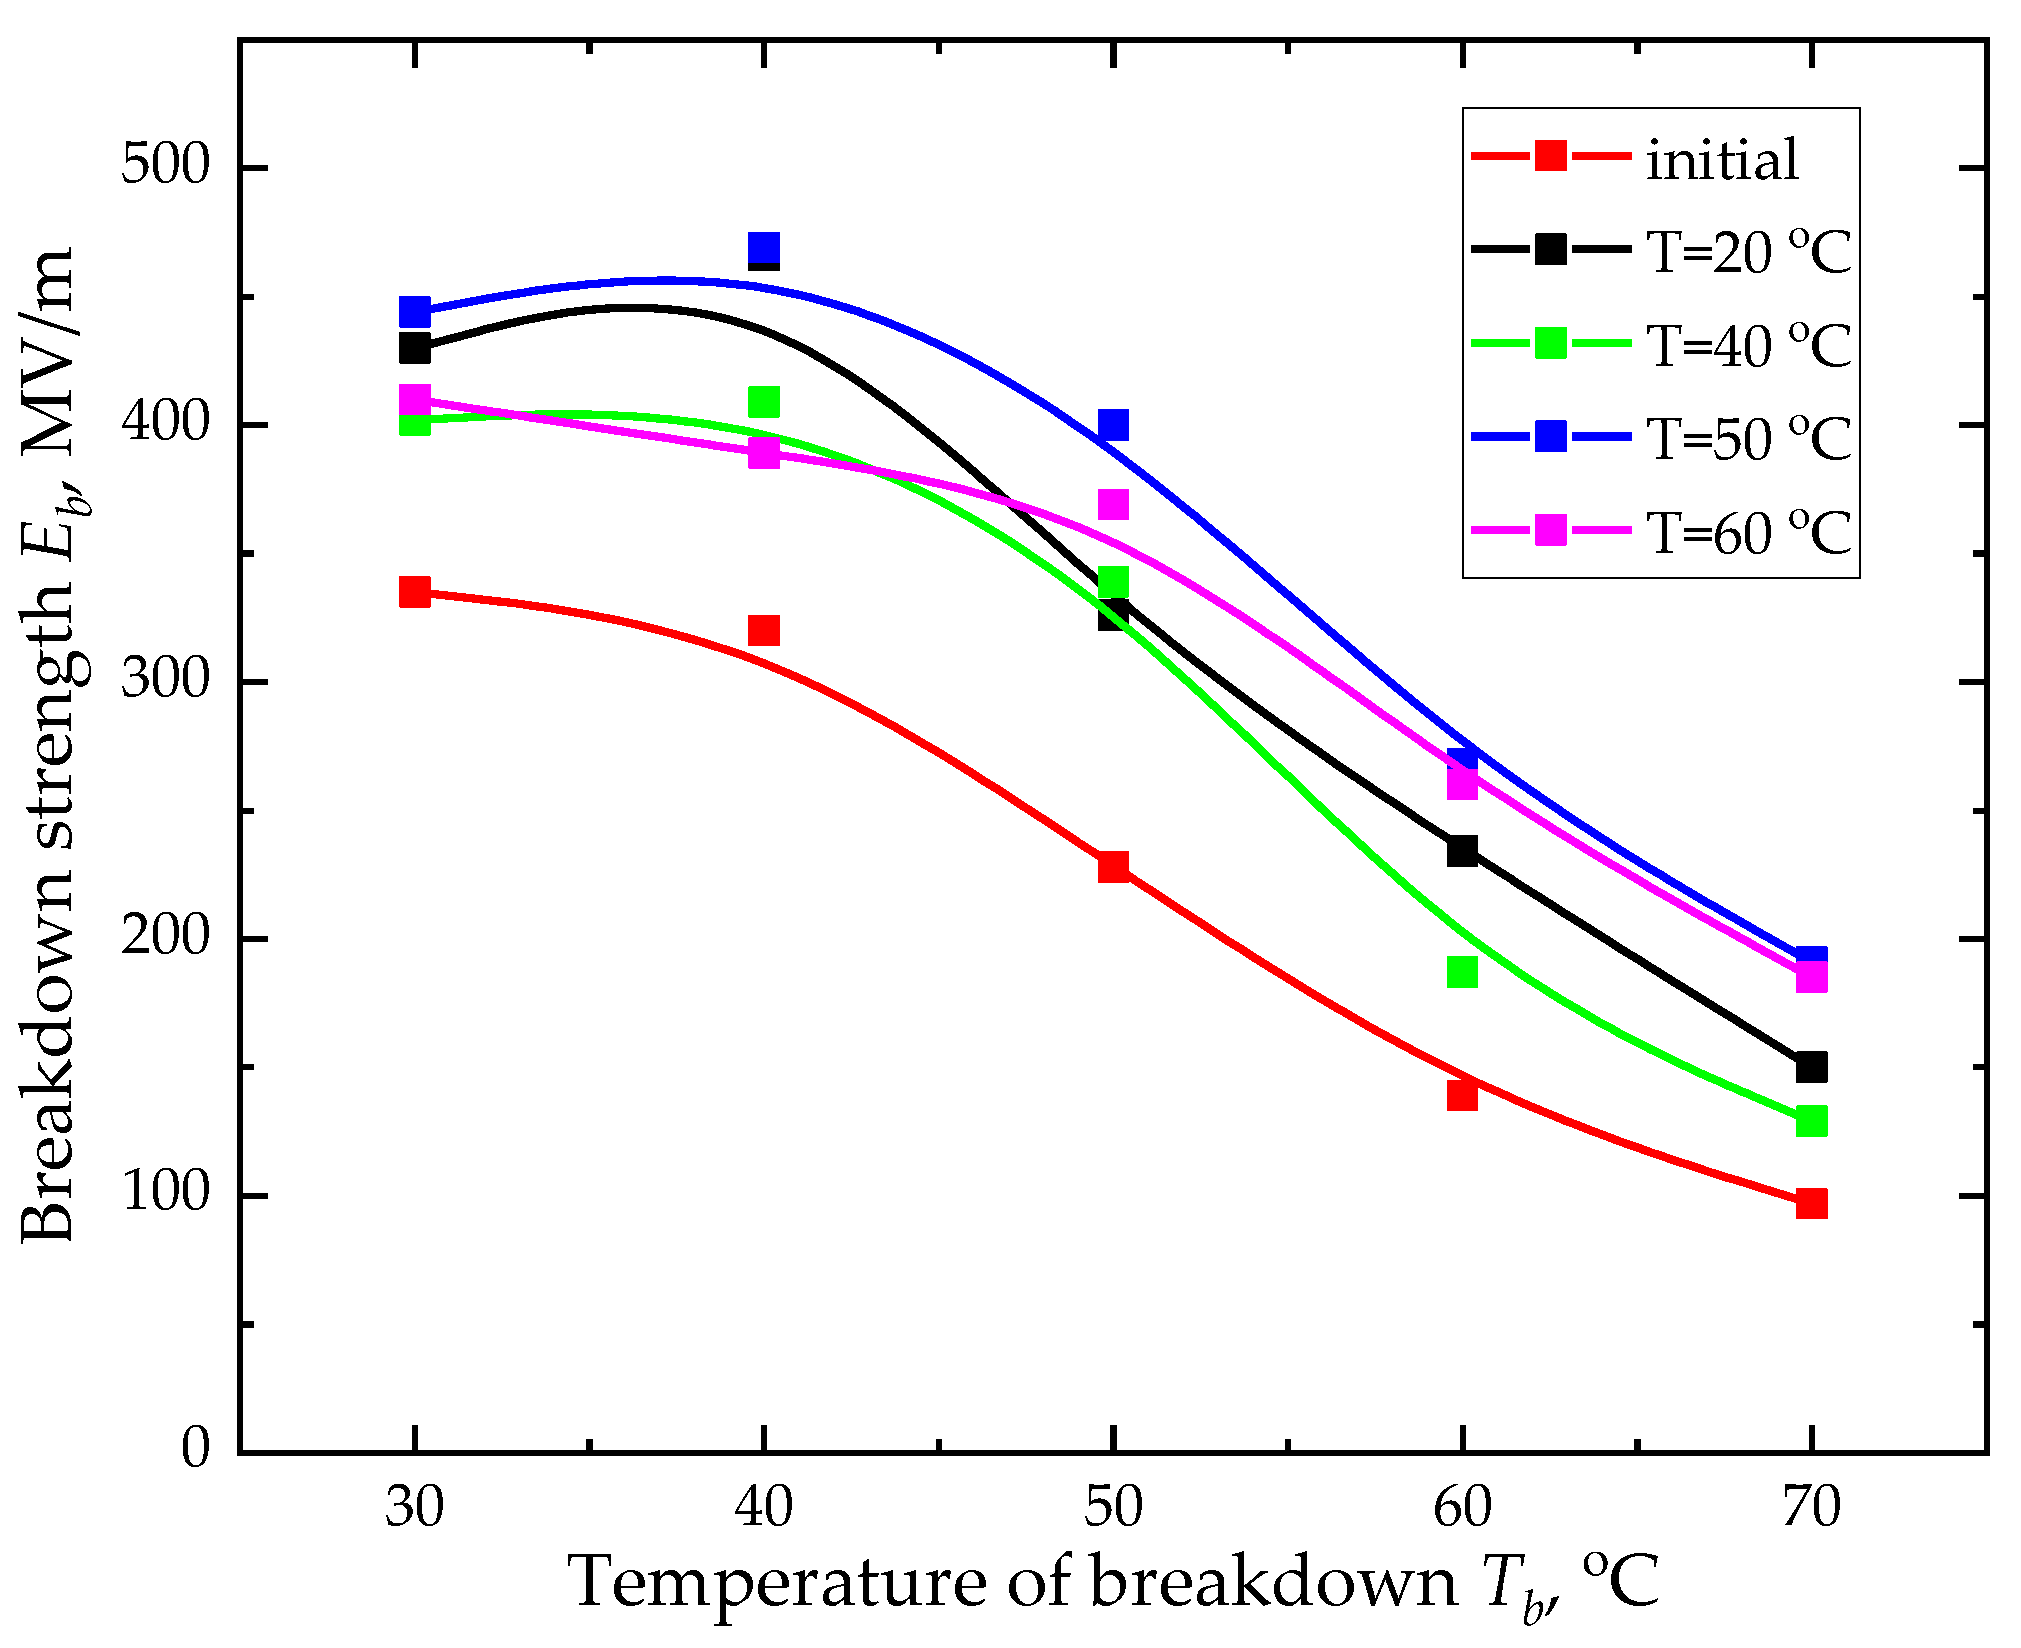
Figure 3.
PFM data for a film stretched at 20ºC before (a) and after (b) polarization.
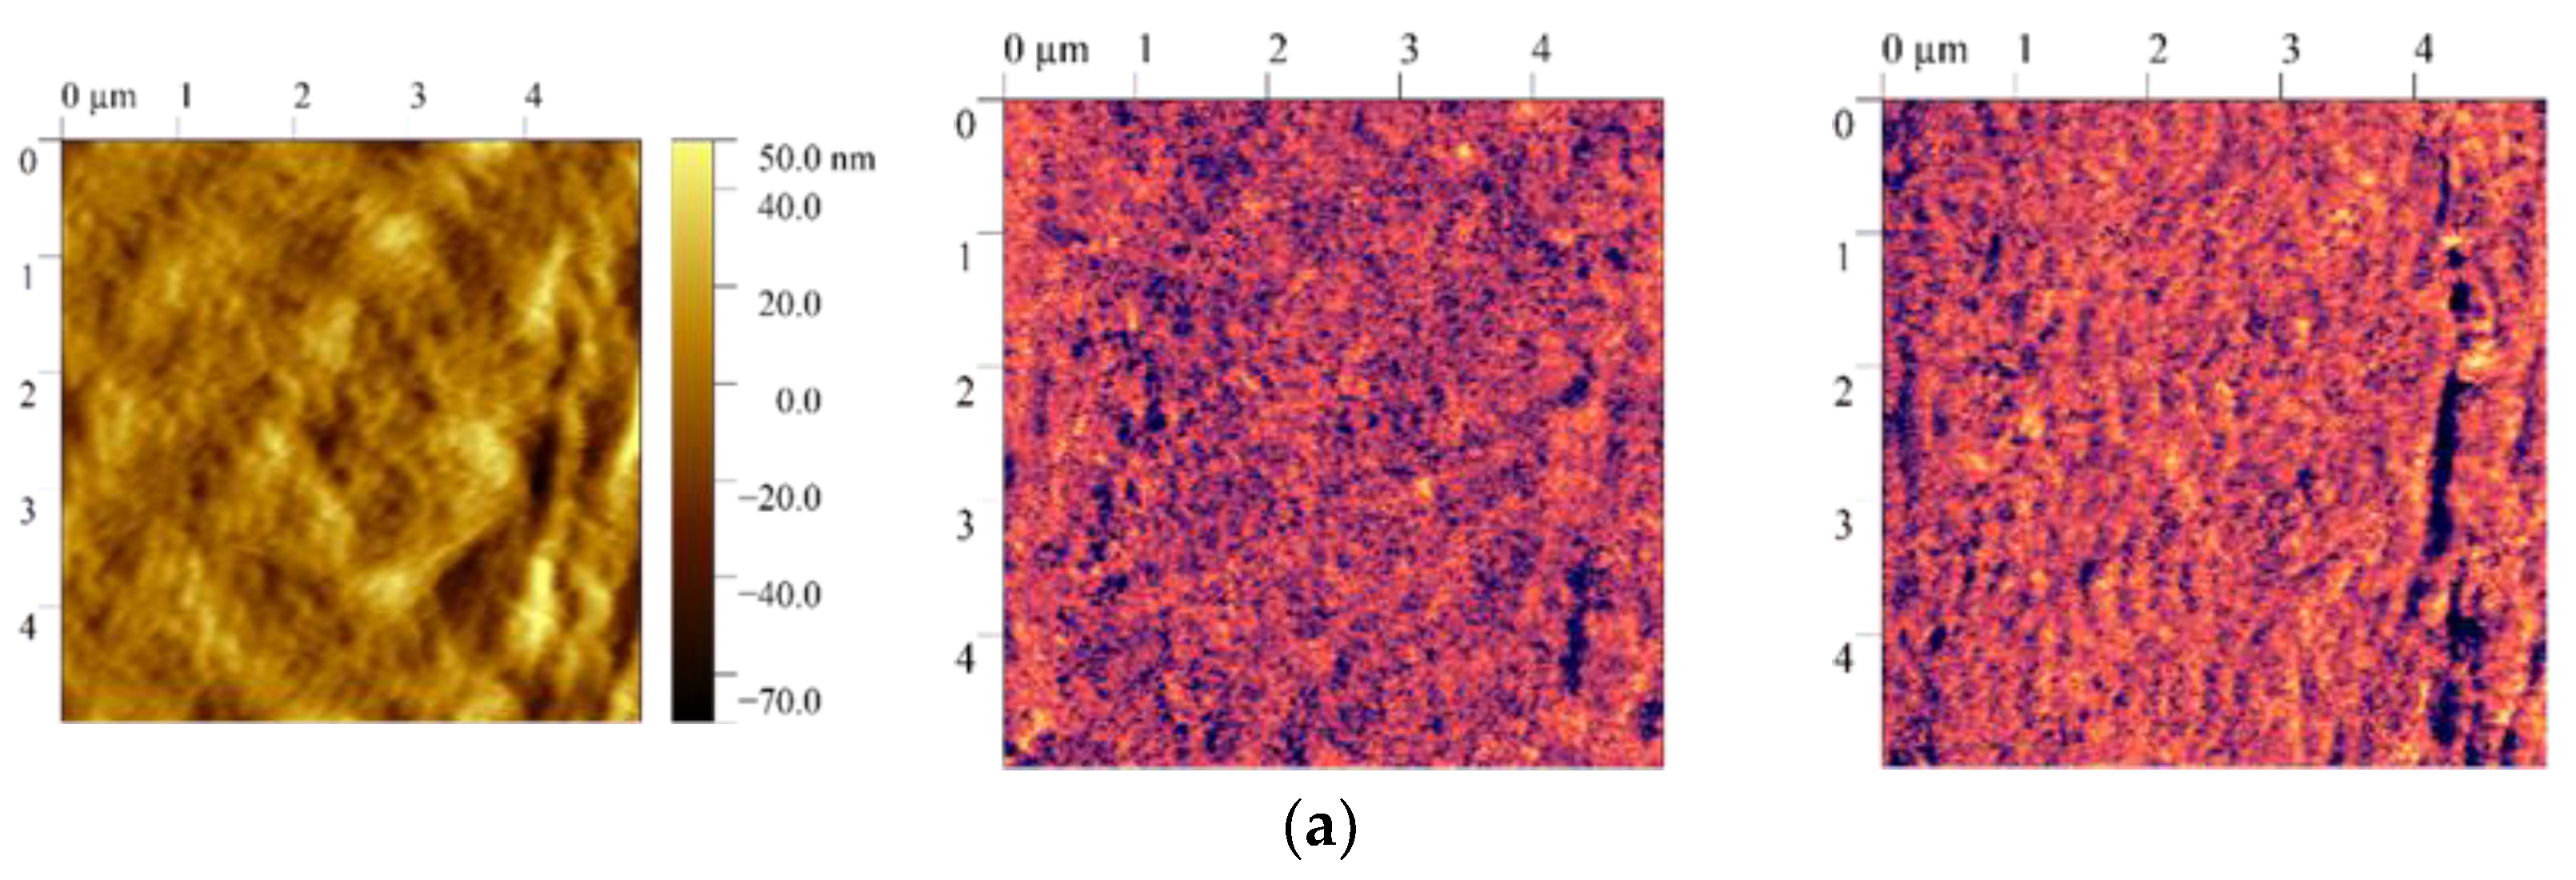
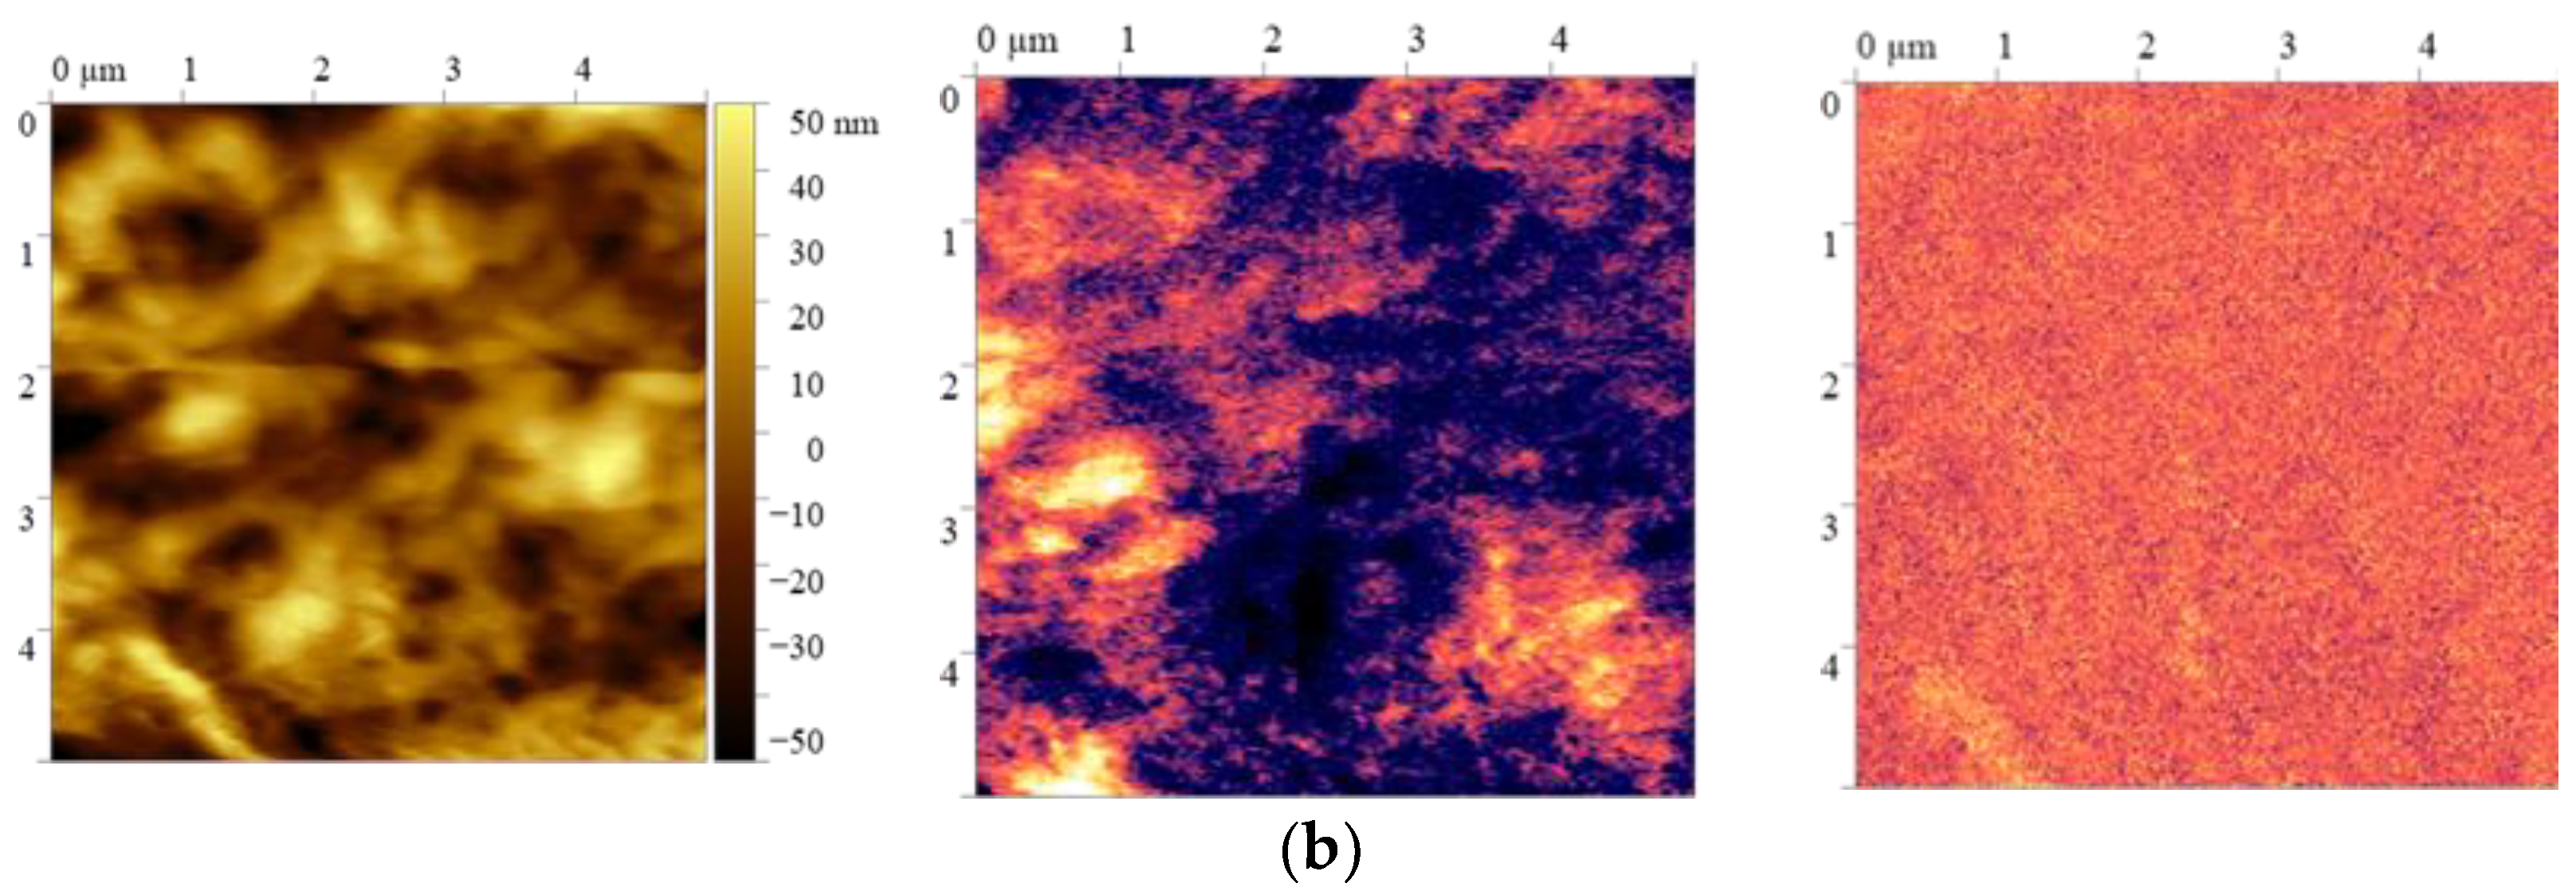
Figure 4.
Autocorrelation function for topography and ferroelectric domains in the VDF/TFE film stretched at 20ºC showing differences in the correlation length for the unpolarized (a) and polarized (b) films.
Figure 4.
Autocorrelation function for topography and ferroelectric domains in the VDF/TFE film stretched at 20ºC showing differences in the correlation length for the unpolarized (a) and polarized (b) films.
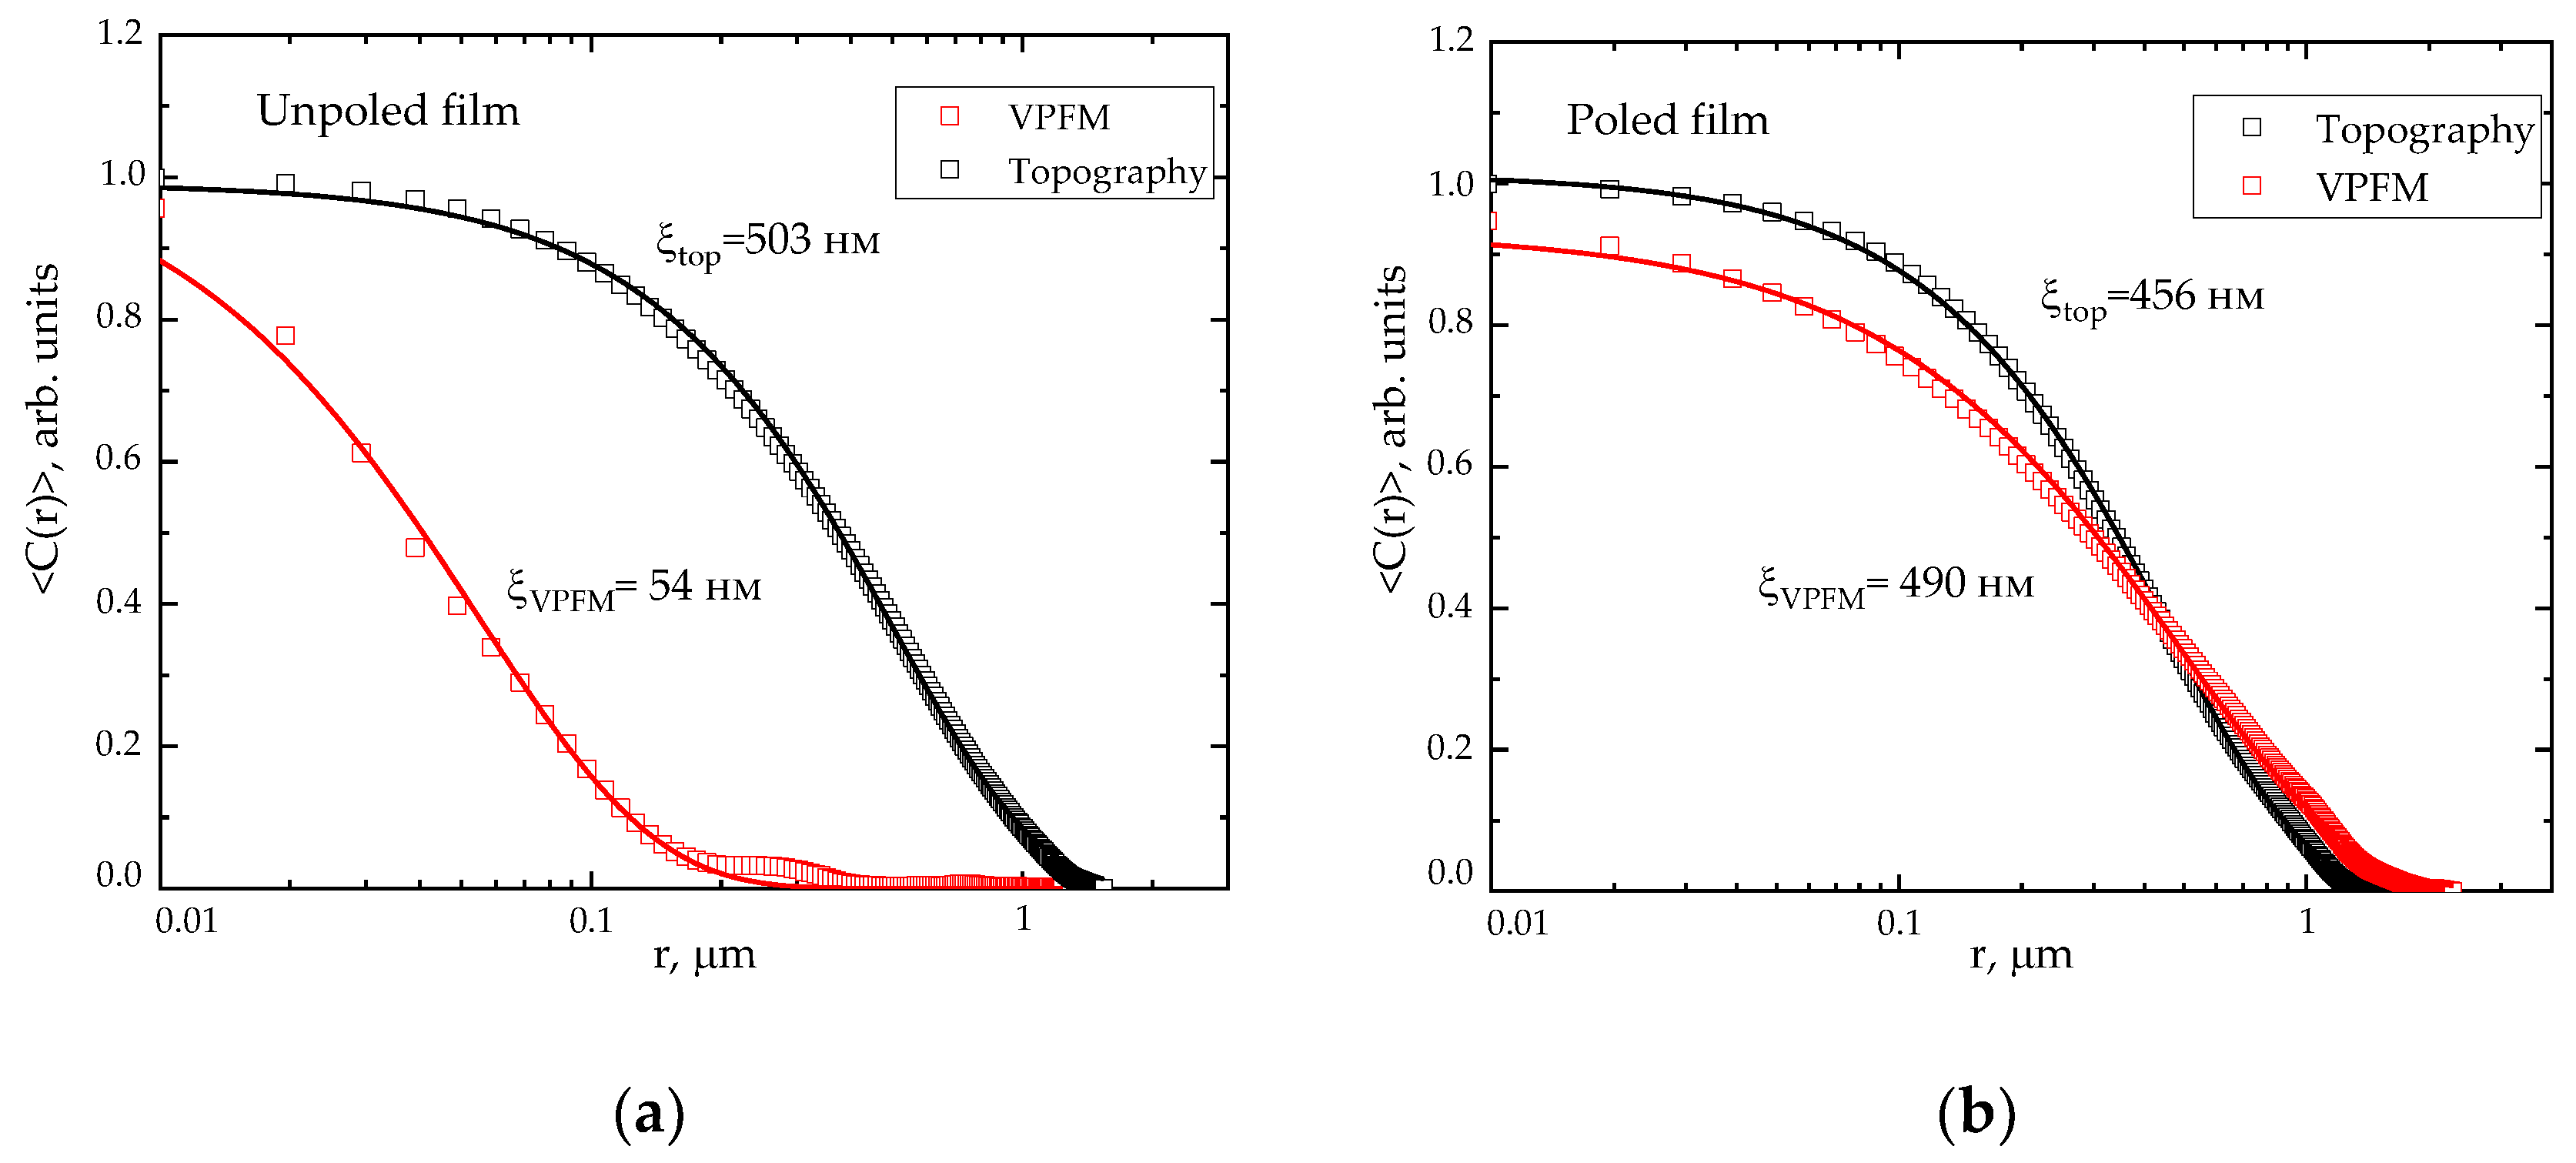
Figure 5.
DSC curves of the first heating.
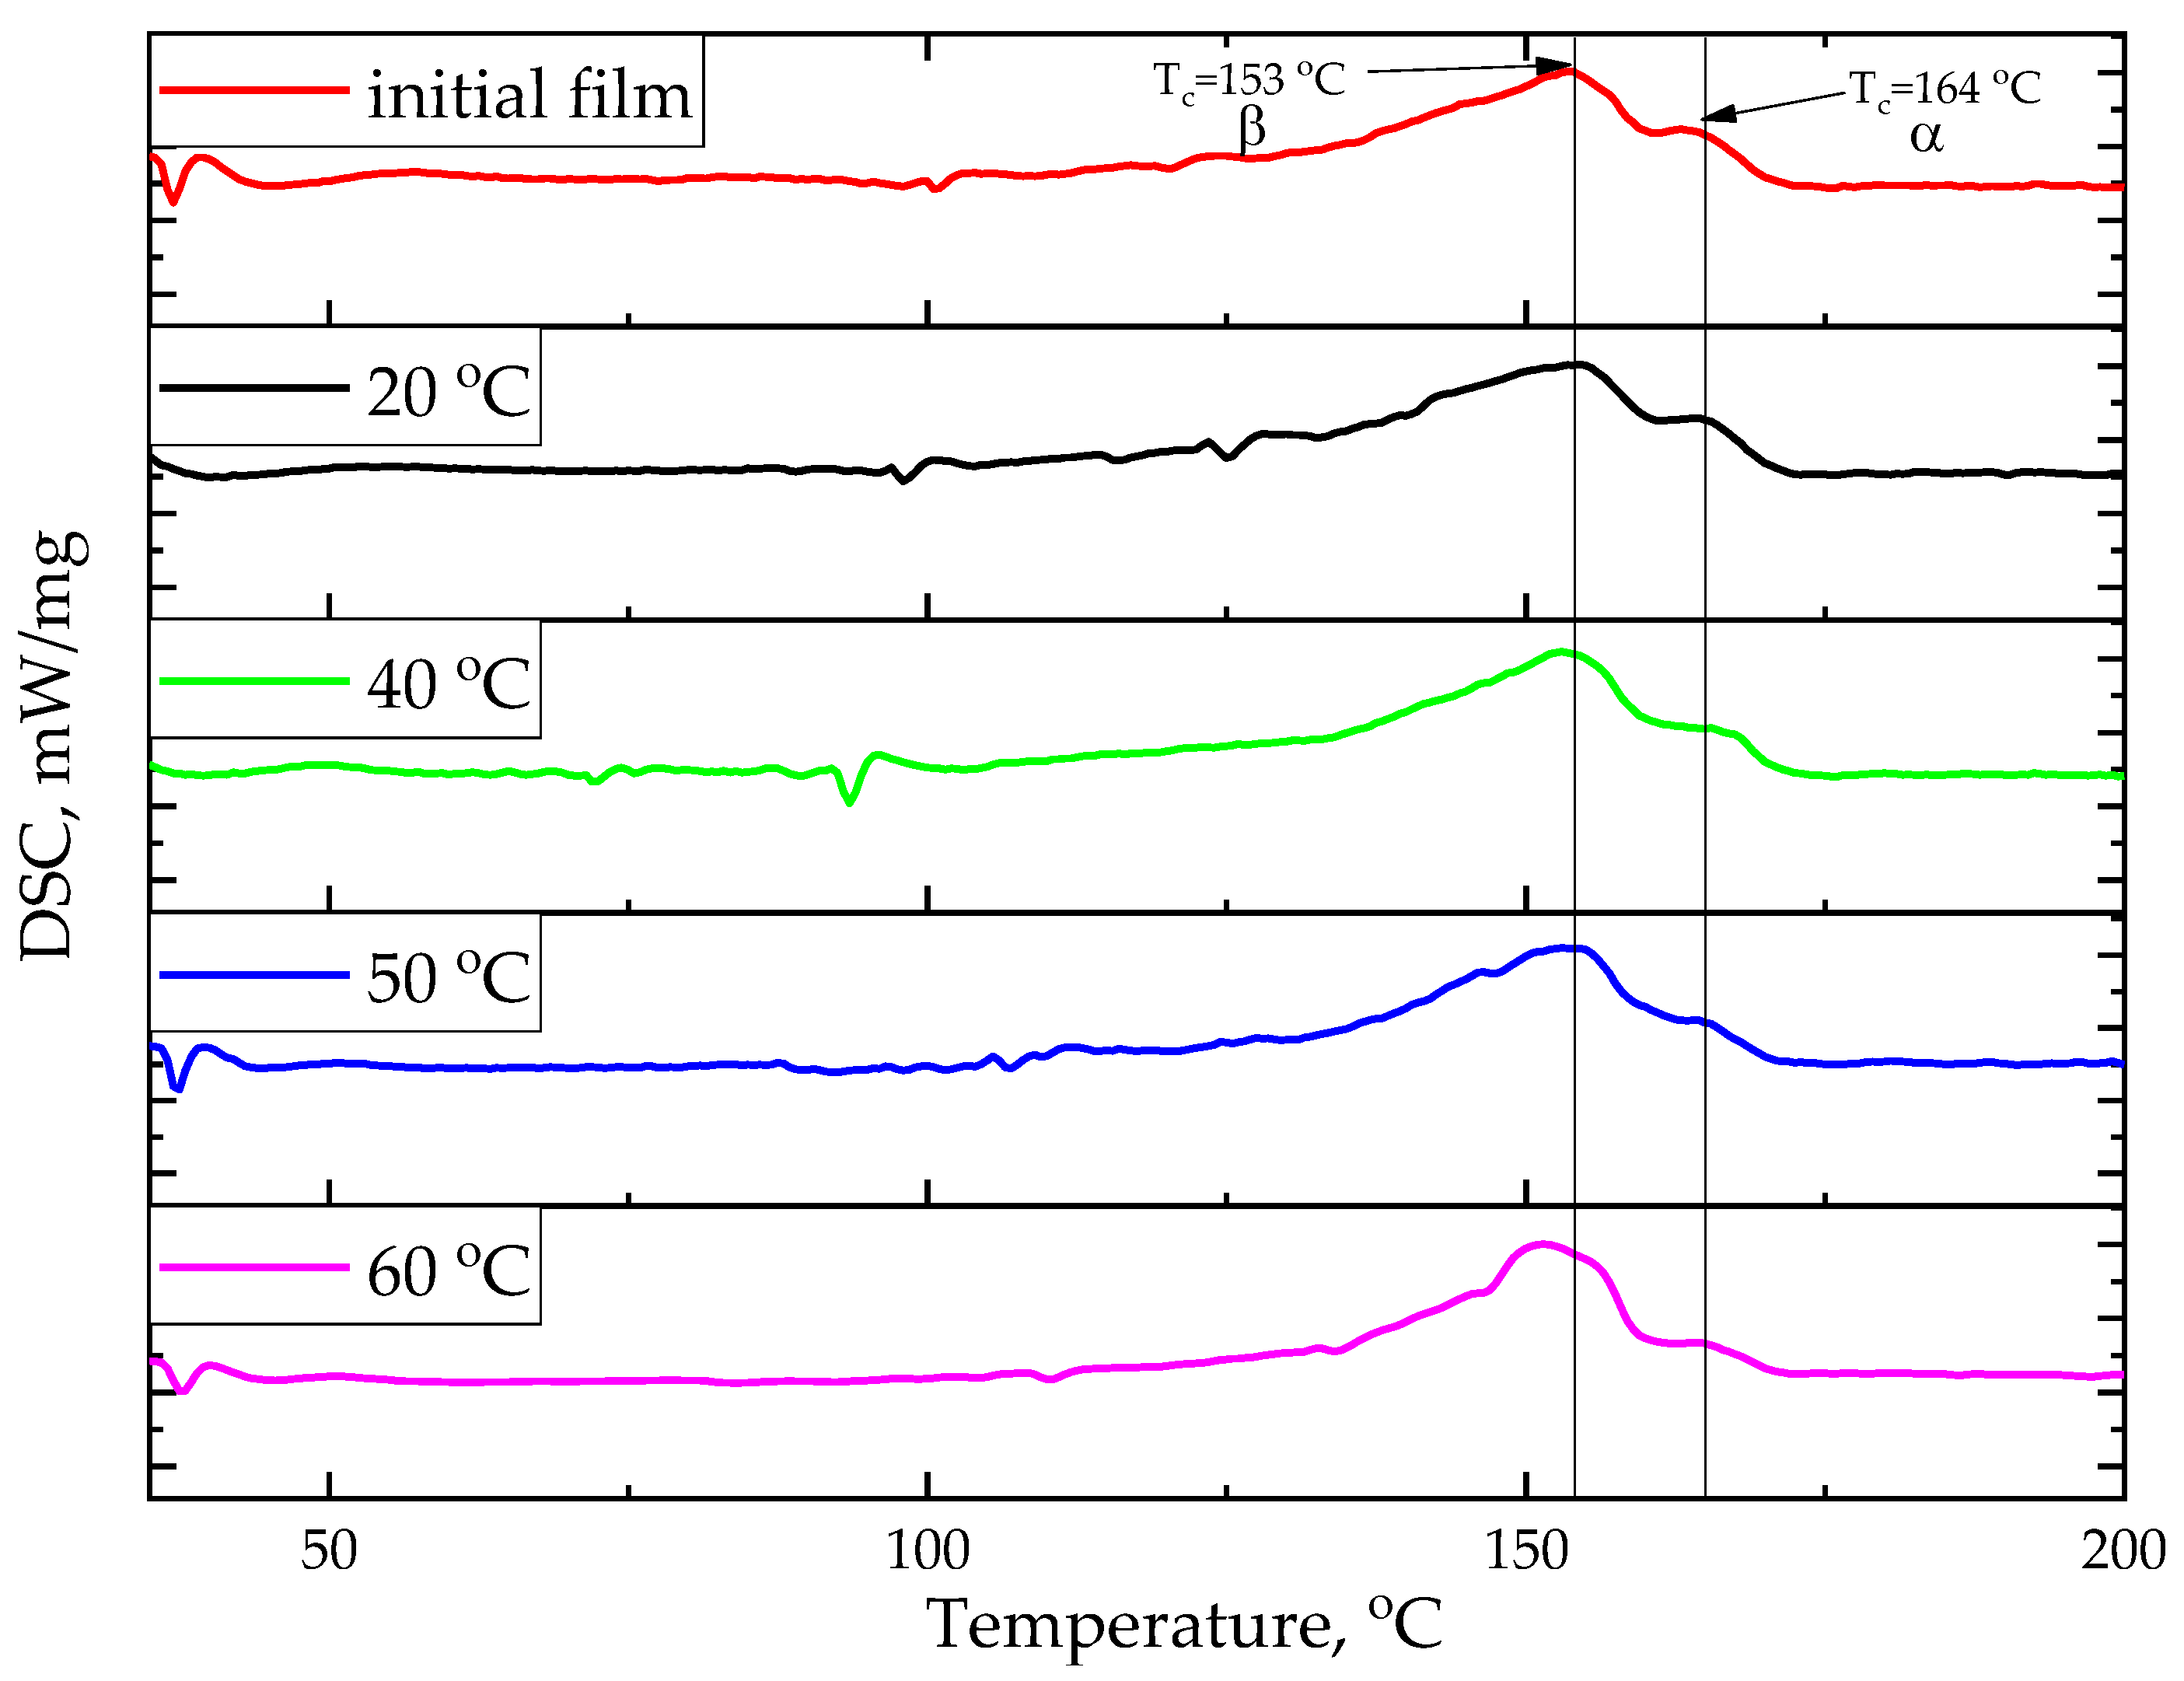
Figure 6.
IR Fourier spectroscopy transmission spectra.
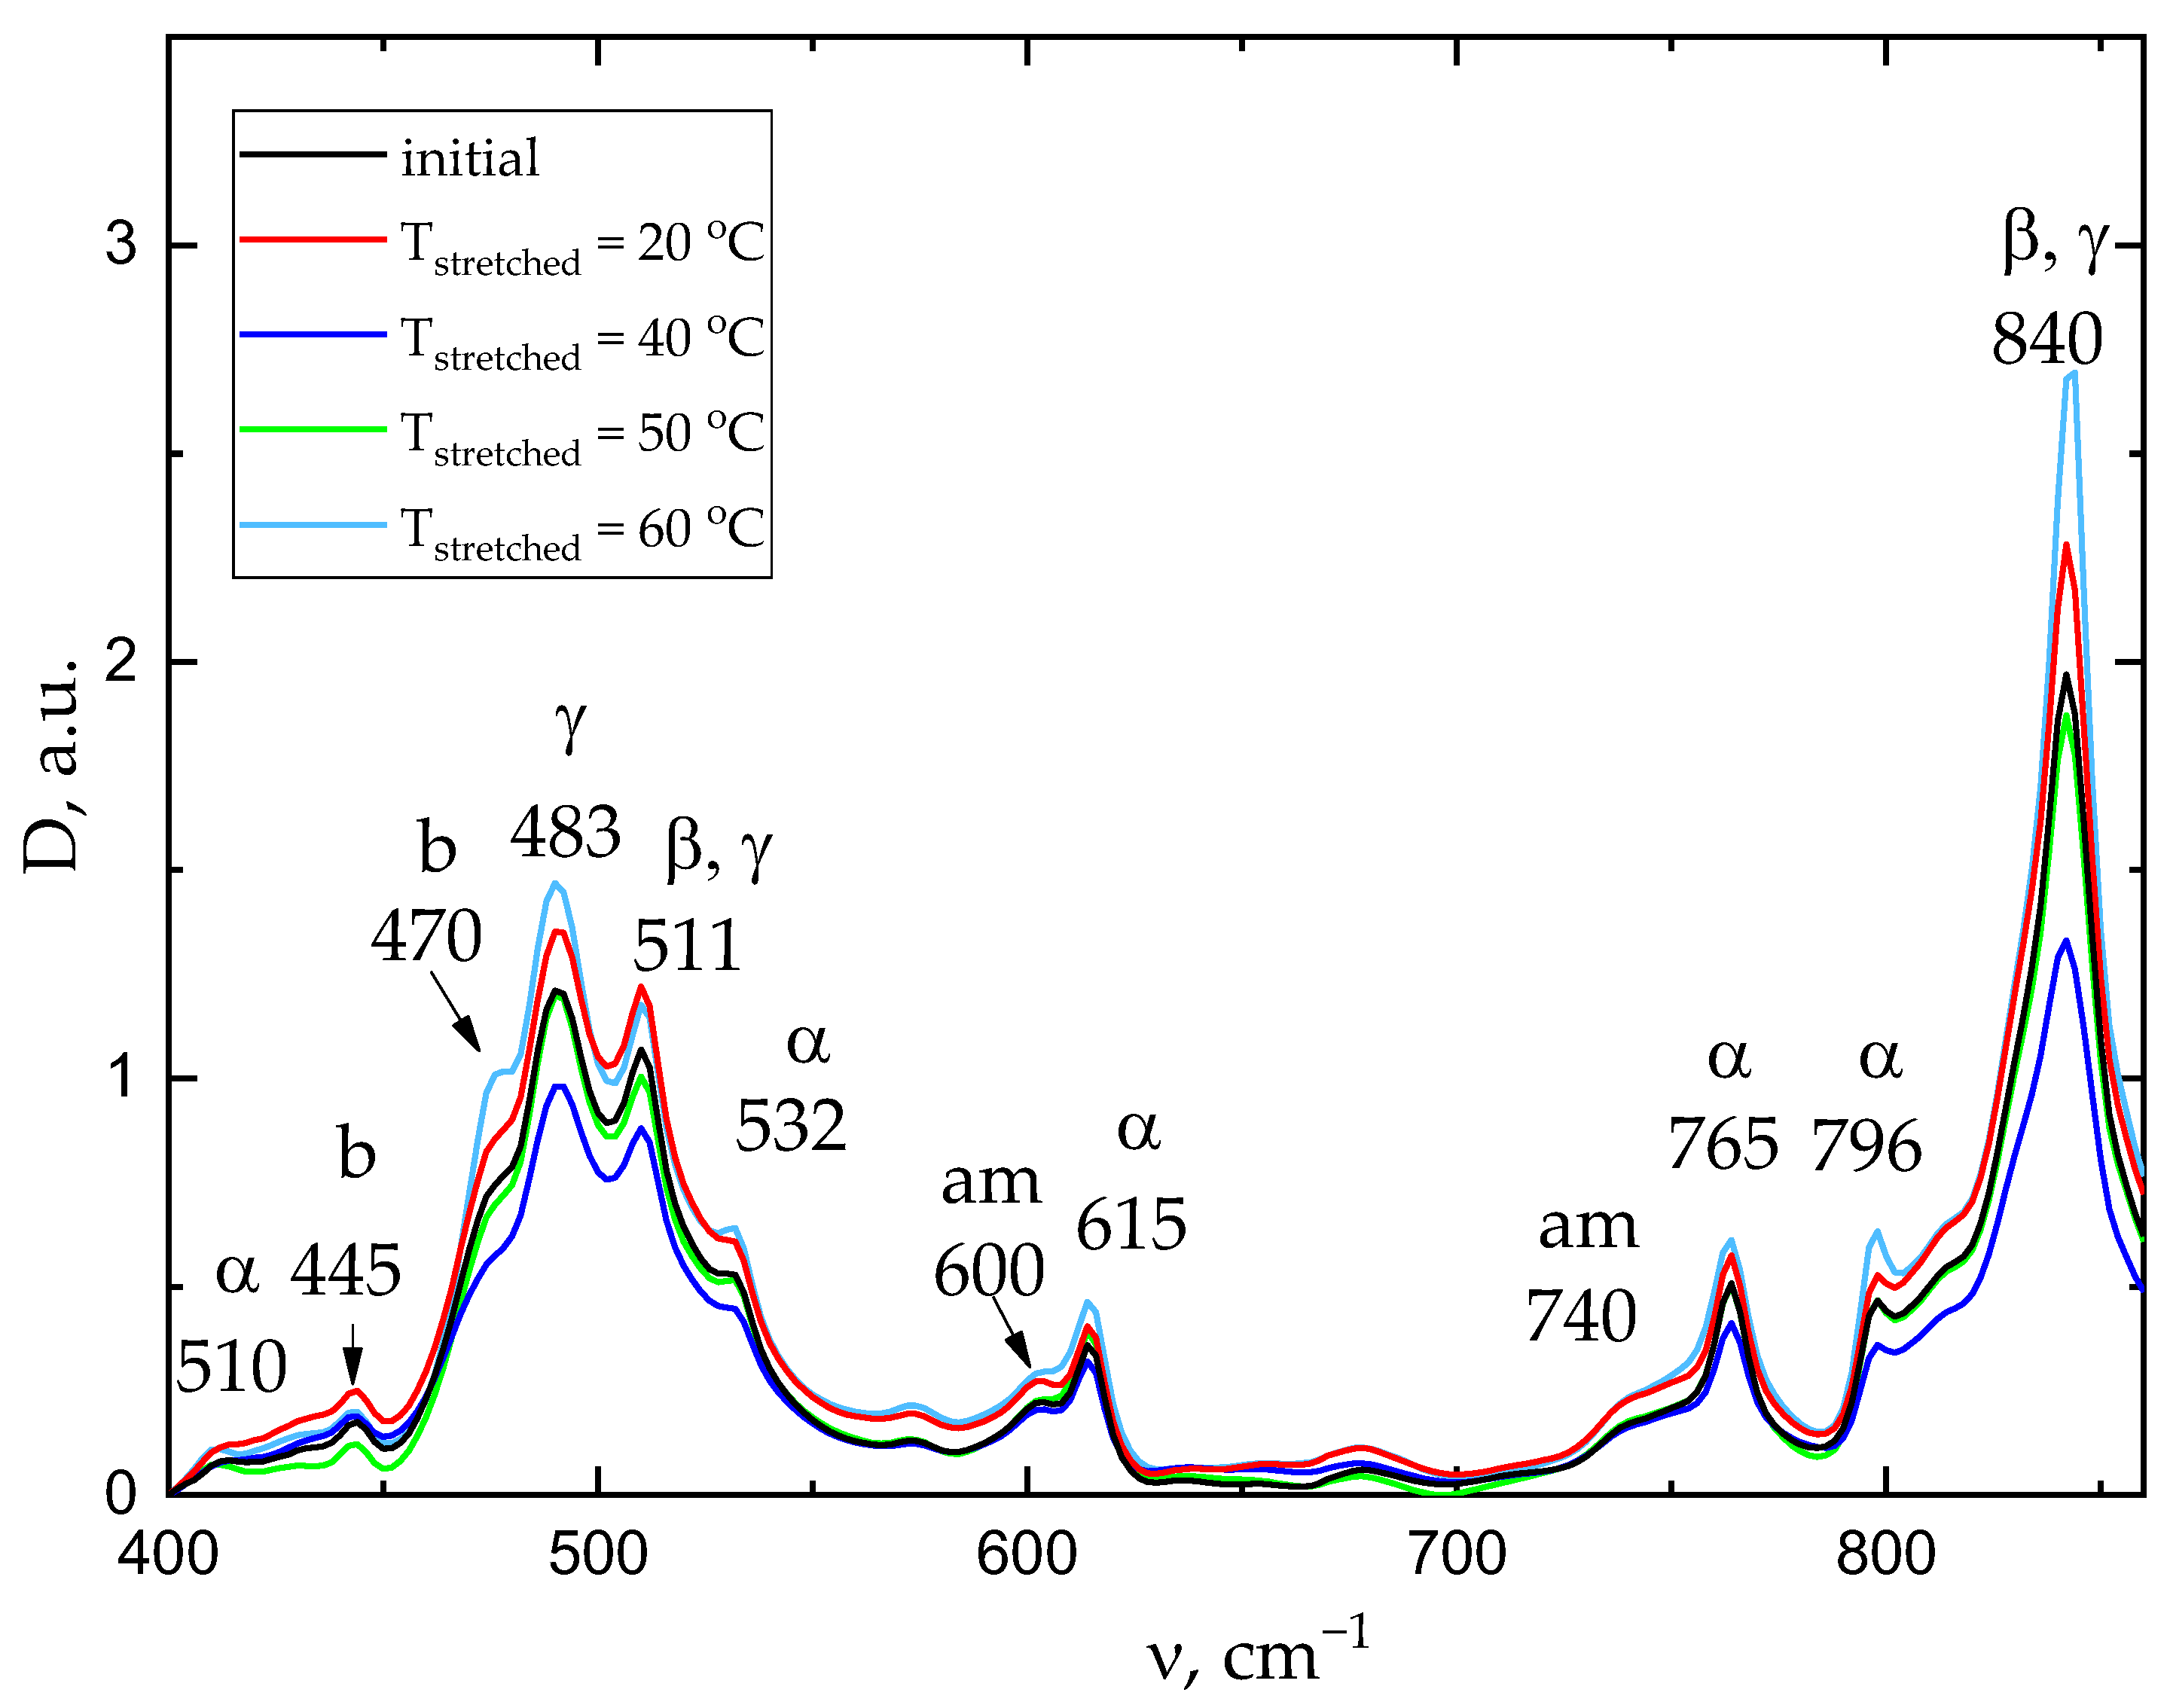
Figure 7.
Micrographs of cold cleavages of the films stretched at different temperatures: (a) -initial film, (a) -temperature of stretching 20℃, (b) - temperature of stretching 40℃, (c) temperature of stretching 50℃ and (e) - temperature of stretching 60℃.
Figure 7.
Micrographs of cold cleavages of the films stretched at different temperatures: (a) -initial film, (a) -temperature of stretching 20℃, (b) - temperature of stretching 40℃, (c) temperature of stretching 50℃ and (e) - temperature of stretching 60℃.
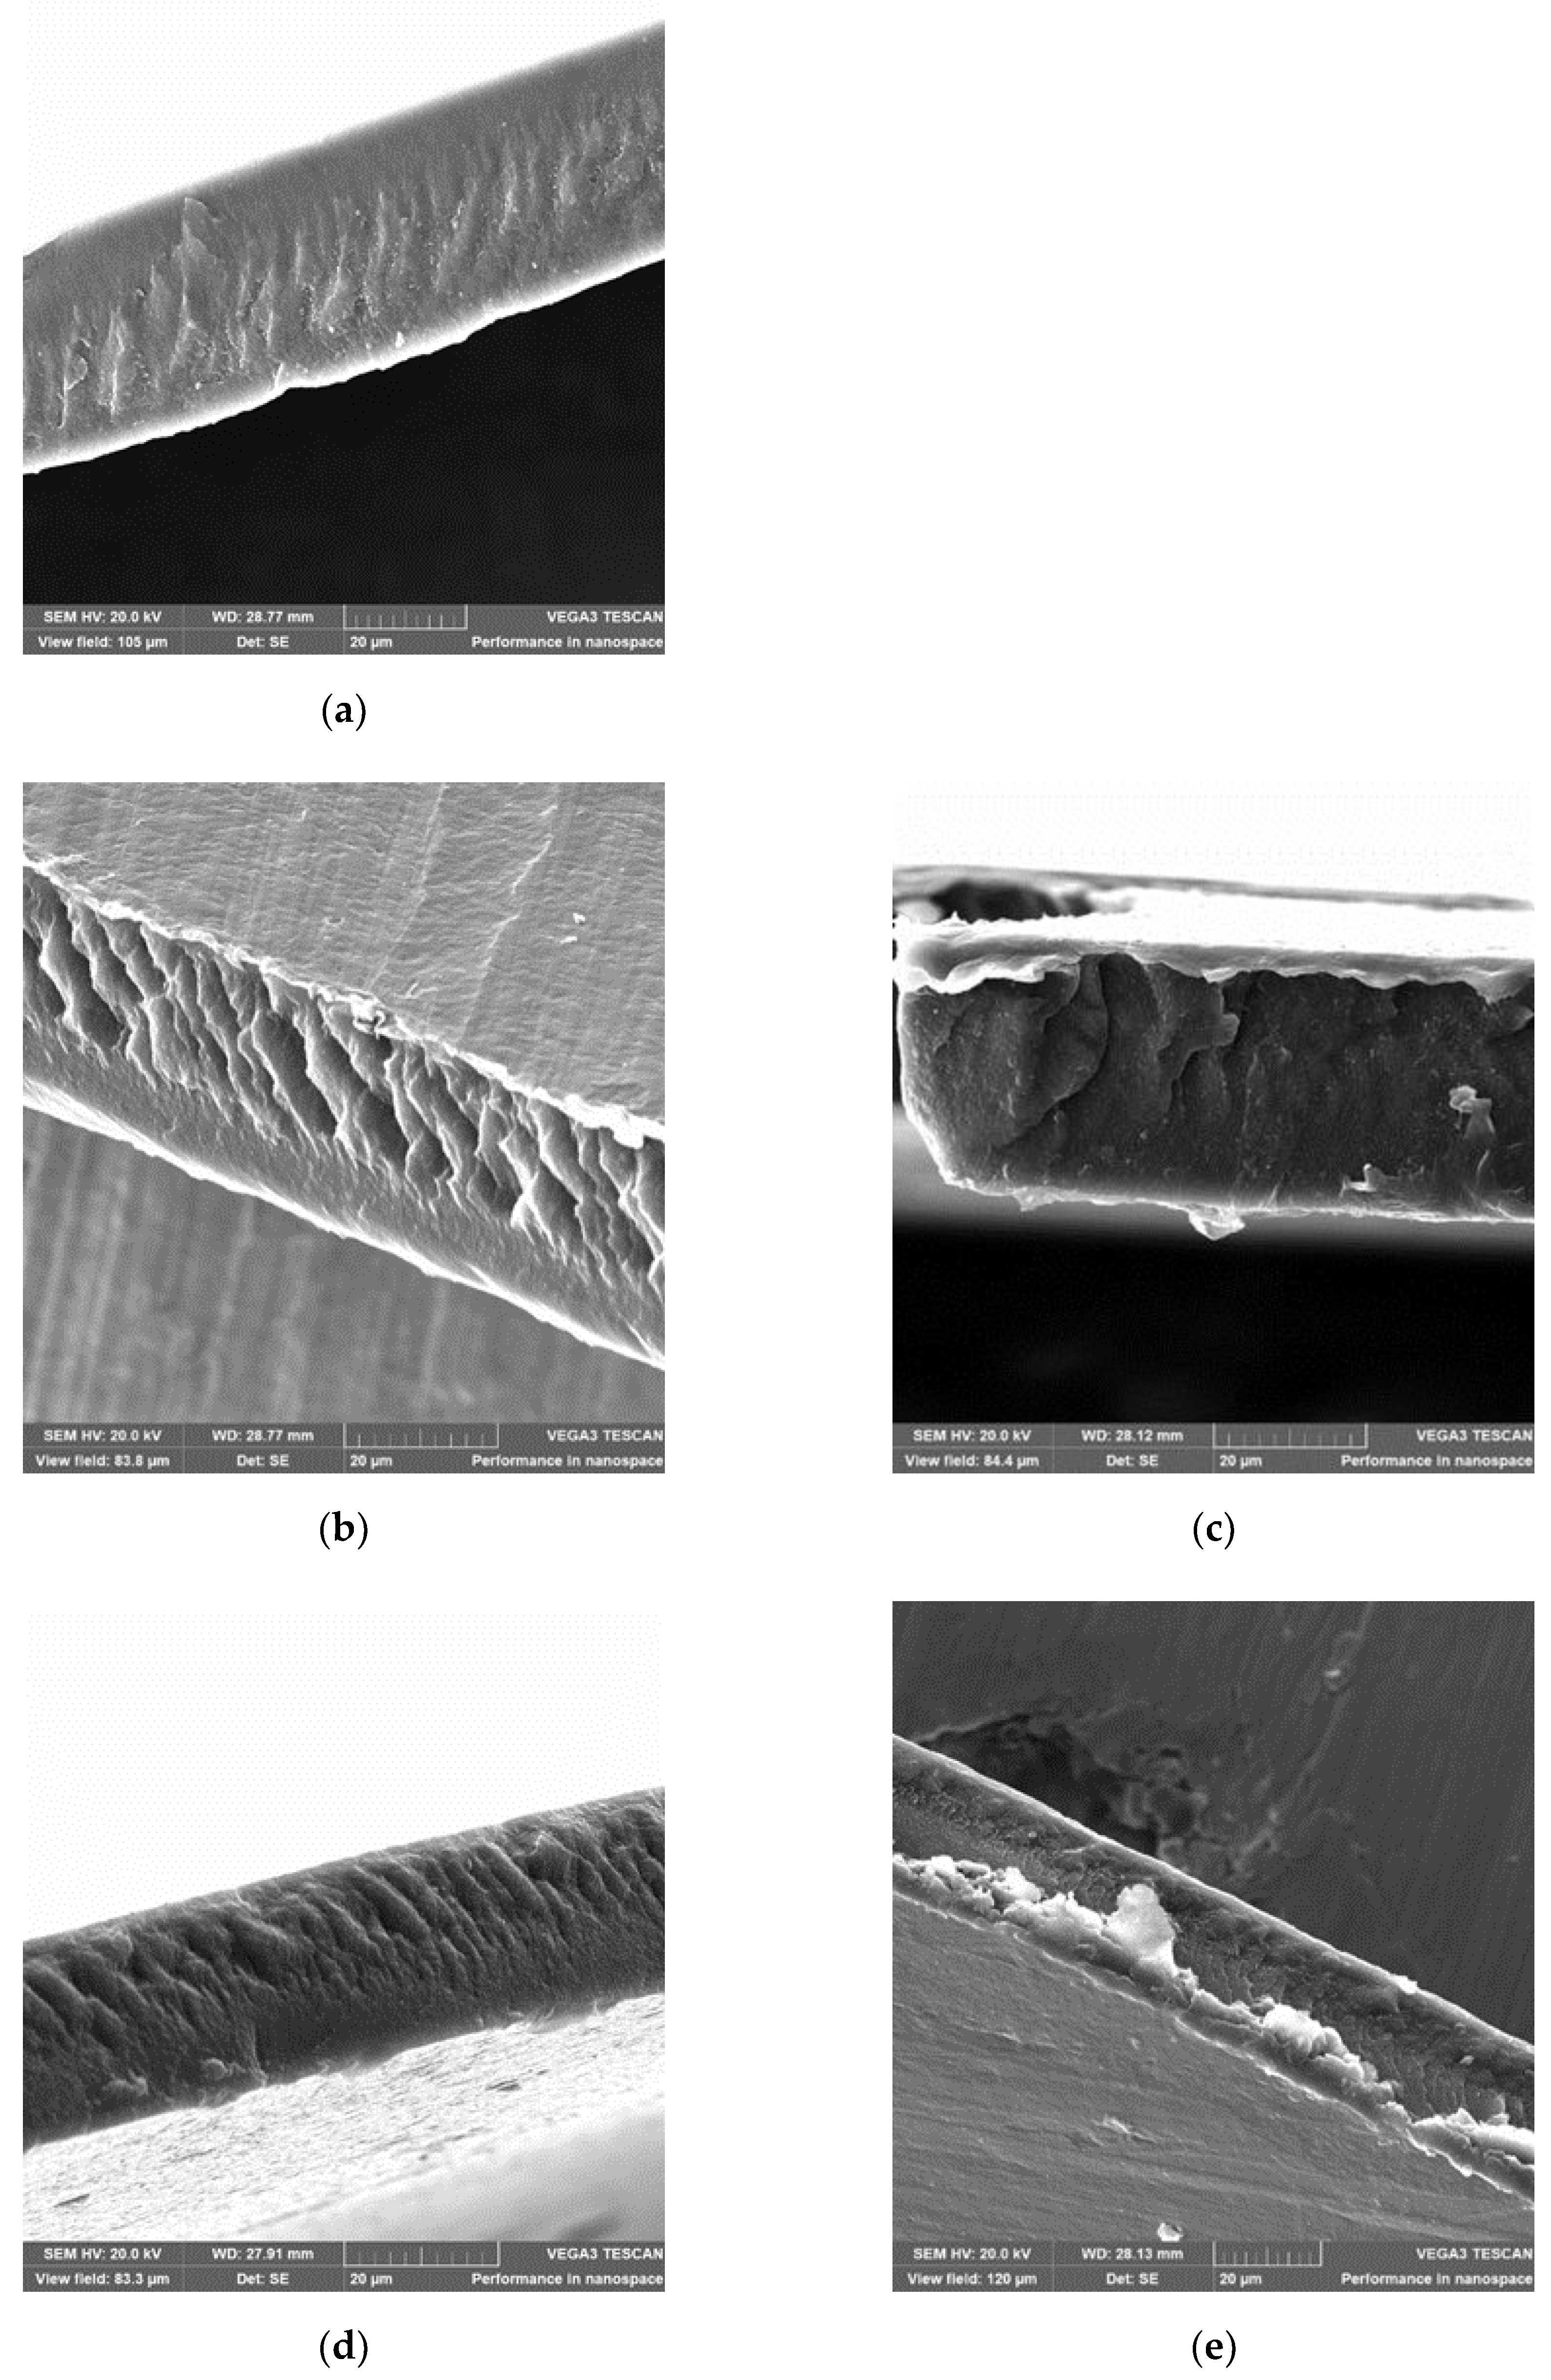

Table 1.
Material piezoelectric properties.
| Stretching temperature, ºC | Eb(30ºC), MV/m | d33, pC/H |
|---|---|---|
| Initial film | 335 | 5 |
| 20 | 430 | 20 |
| 40 | 402 | 16 |
| 50 | 440 | 19 |
| 60 | 410 | 18 |
Table 2.
Piezoelectric response force microscopy data.
| Stretching Temperature, ºC | RMS, nm | d33loc pm/V | ξVPFM, nm | |||
|---|---|---|---|---|---|---|
| Unpoled | Poled | Unpoled | Poled | Unpoled | Poled | |
| Initial film | 68 | 30 | 4 | 11 | 42 | 183 |
| 20 | 36 | 40 | 4,5 | 21 | 54 | 490 |
| 40 | 28 | 55 | 5 | 19 | 21 | 350 |
| 50 | 45 | 59 | 4,5 | 23 | 37 | 270 |
| 60 | 42 | 33 | 4 | 17 | 28 | 380 |
Table 3.
Crystallinity degree computed from the DSC data.
| Stretching Temperature, °С | Melting Enthalpy ΔHm, J/К | Crystallinity Degree χс, % | Melting Temperature | |
|---|---|---|---|---|
| β | α | |||
| Initial | 44.0 | 42.1 | 153.5 | 162.8 |
| 20 | 47.7 | 45.7 | 154.1 | 164.0 |
| 40 | 43.5 | 41.6 | 153.1 | 165.1 |
| 50 | 48.7 | 46.6 | 153.1 | 164.. |
| 60 | 46.7 | 44.6 | 151.4 | 164.2 |
Table 4.
Results of the IR Fourier spectroscopy study.
| Tstretching, oC | Initial | 20 | 40 | 50 | 60 |
|---|---|---|---|---|---|
| Electroactive phase proportion, % | 80.6 | 78.1 | 77.0 | 80.0 | 80.5 |
| α-phase proportion, % | 19.4 | 21.9 | 23.0 | 20.0 | 19.5 |
Table 5.
Material density measurements.
| Tstretching, oC | Initial | 20 | 40 | 50 | 60 |
|---|---|---|---|---|---|
| ρ, g/cm3 | 1.60 | 1.78 | 1.94 | 1.80 | 1.82 |
Disclaimer/Publisher’s Note: The statements, opinions and data contained in all publications are solely those of the individual author(s) and contributor(s) and not of MDPI and/or the editor(s). MDPI and/or the editor(s) disclaim responsibility for any injury to people or property resulting from any ideas, methods, instructions or products referred to in the content. |
© 2025 by the authors. Licensee MDPI, Basel, Switzerland. This article is an open access article distributed under the terms and conditions of the Creative Commons Attribution (CC BY) license (http://creativecommons.org/licenses/by/4.0/).
Copyright: This open access article is published under a Creative Commons CC BY 4.0 license, which permit the free download, distribution, and reuse, provided that the author and preprint are cited in any reuse.


