
Submitted:
28 March 2025
Posted:
31 March 2025
You are already at the latest version
Abstract
This study explores the development of flexible and efficient piezoelectric materials by incorporating multiwalled carbon nanotubes (MWCNTs) into poly(vinylidene fluoride-hexafluoropropylene) [P(VDF-HFP)] polymer films. The MWCNTs, acting as nucleating agents, significantly improve the electroactive β phase content in the polymer, enhancing its piezoelectric performance. Composite films were prepared using a solution casting technique with varying MWCNTs concentrations (0.25%, 0.5%, 0.75%, and 1.0%). Morphological analysis through SEM and AFM confirmed increased surface roughness and pore size with higher MWCNTs content, resulting in better hydrophobic, mechanical and electrical properties. It is evident that the WCA values of all samples ranged from 96.73° ± 4.82° to 117.07° ± 2.10°, confirming the inherent hydrophobicity of the films and demonstrating good water repellence. FTIR and XRD analyses showed a phase transformation from the non-polar α phase to the polar β phase, enhancing the piezoelectric effect. With increasing MWCNTs content, the crystallinity of the composite improves, rising from 50.04% in the pure P(VDF-HFP) sample to 54.83% in the 1.00% MWCNTs composite, leading to more ordered structures. This boosts the mechanical properties, notably raising the tensile strength from 14.56 MPa to 45.13 MPa. TGA analysis further shows that the composites have higher thermal stability compared to pure P(VDF-HFP), due to increased crystallinity and stronger intermolecular forces. Dielectric measurements showed enhanced dielectric constant and reduced energy loss with increasing MWCNTs concentrations. This finding is pivotal in understanding the piezoelectricity mechanisms within these composites. Finally, piezoelectric sensitivity tests demonstrated an optimal concentration of 0.75% MWCNTs, achieving a voltage output of 16.58 V under applied mechanical stress, making these composites promising candidates for advanced sensing technologies.
Keywords:
P(VDF-HFP)
; MWCNTs
; Thermal stability
; Dielectric constant
; d33 coefficient
1. Introduction
Piezoelectricity was discovered in 1880 and the converse piezoelectric effect was proven in 1881. Piezoelectric materials are a distinct class of dielectrics that generate an electric charge when exposed to mechanical stress, a phenomenon known as the piezoelectric effect. This effect causes opposite charges to accumulate on the material's surfaces, creating a weak voltage. Once the stress is released, the material reverts to its uncharged state. These materials are highly efficient at converting mechanical energy into electrical energy and vice versa [1,2,3]. Piezoelectric materials have shown great promise in various industries, including biomedical, aerospace, electronics, and defense communications. Among these, lead zirconate titanate (PZT) remains the most widely used piezoelectric material. PZT is a synthetic ceramic that can be enhanced by doping with niobium (resulting in "soft" PZT) or lanthanum (resulting in "hard" PZT). Although PZT offers strong piezoelectric properties and is cost-effective, it has drawbacks such as brittleness, high density, and the presence of lead [4,5]. In contrast, piezoelectric polymers present a more flexible, lower-density, and lead-free alternative, making them suitable for many practical applications [4,5]. Among these polymers, fluoropolymers like poly(vinylidene fluoride) (PVDF) and its copolymer poly(vinylidene fluoride-co-hexafluoropropylene) [P(VDF-HFP)] have gained significant attention from researchers. These materials offer excellent dielectric properties, thermal stability, mechanical flexibility, biocompatibility, and ease of processing, alongside promising piezoelectric properties, making them ideal for a wide range of applications [6,7].
The PVDF family, including its copolymer, is a semi-crystalline material with a crystallinity typically limited to 50%–60%. It exists in five distinct phases: α, β, γ, δ, and ε. Among these, the α and β phases are the most commonly observed, while the γ phase serves as a transitional state between the two. The δ and ε phases are less common and are difficult to isolate through conventional processing methods [8,9,10]. As depicted in Figure 1(b), the α phase adopts a trans-gauche conformation (TGTGʹ), making it non-polar. In contrast, the β phase is characterized by an all-trans conformation (TTTT), which results in the separation of fluorine and hydrogen atoms. This arrangement creates a dipole moment perpendicular to the polymer chain, measured at 7.0 × 10⁻³⁰ C·m. The γ phase, being a transitional structure between the α and β phases, exhibits a smaller dipole moment than the β phase, owing to its trans-gauche conformation with a higher trans fraction (TTTGTTTGʹ). Among all the chain orientations found in PVDF and its copolymer, the β phase exhibits the highest net dipole moment. This is attributed to the parallel alignment of the –CF₂ and –CH₂ bonds. The significant difference in electronegativity between the fluorine and hydrogen atoms in PVDF enhances the dielectric and ferroelectric properties of its β phase. Increasing the proportion of the β phase in PVDF can significantly improve its relative permittivity, by more than tenfold, highlighting the importance of optimizing its content to maximize electrical performance [8,11,12]. Over the past few decades, various techniques have been explored to increase the β phase content of PVDF while reducing the paraelectric α phase. Some of these methods include poling, quenching, compression, hot pressing, rolling, melting, exposure to magnetic fields, annealing, folding, ultraviolet treatment, and spin coating [13]. Among these approaches, uniaxial or biaxial stretching is commonly used as it aligns the molecular chains, while applying a strong electric field at elevated temperatures helps to align the dipoles along the field. This method effectively transforms the original α-phase into the β-phase. Tension forces applied to the semicrystalline structure rearrange the polymer chains, facilitating phase transformation by providing the necessary energy to overcome the phase transition barrier. In contrast, during the poling process, although some stress is applied to the molecular chains, it is significantly less than that generated through stretching, making it insufficient to provide the external energy required for effective phase transformation [14,15]. Additionally, electrospinning method is able to dramatically enrich the formation of β polymorph as well. Salama, M. et al. [16] measured the piezoelectric d33 coefficient of neat PVDF film with the d33 value as 14.57 pC/N, whereas it is increased to 19.94 pC/N and 32.07 pC/N for 0.5 wt.% and 1 wt.% of the PVDF/graphene composite film, respectively. Nevertheless, the methods suffer from the requirement for sophisticated equipment, high electric field, and electrically conductive targets. The current challenge of electrospinning strategy is to produce nanofiber in a large scale [17]. Compared with the above-mentioned methods, inclusion of nanoparticles in polymer without the poling process (piezoelectric ceramic materials (including PbZr1-xTixO3 (PZT), PbTiO3 (PT), and BaTiO3 (BTO), etc [18]), carbon-based fillers (including, graphite, GO, rGO, CNT, CNF, etc [19] ), metal oxides (including, Fe2O3, SiO2, TiO2, MgO, Al2O3, CuO, Bi2O3, etc [20]), etc.) has been found to be most efficient as it results in significantly enhanced ß phase. It should be noted that the piezoelectricity not only depends on the fraction of the electric active β-phase, but also the alignment of the dipole moments is also very important. Therefore, the crystallographic plane orientations should be investigated.
Among various fillers, multiwalled carbon nanotubes (MWCNTs) are considered one of the most effective materials for enhancing the mechanical, thermal, electrical, and ferroelectric properties of PVDF polymer. When uniformly dispersed in the polymer matrix, MWCNTs serve as nucleating agents, encouraging the formation of the electroactive β-phase, which is crucial for piezoelectric applications. In previous research, Eggedi et al. [21] demonstrated that PVDF/MWCNT nanocomposites are multiphase systems containing both amorphous and crystalline phases. The presence of MWCNTs significantly influences the microstructure and properties of PVDF. These composites exhibit high strength and flexibility, attributed to their enhanced tensile and mechanical properties. It is well established that nanofillers aid in nucleating β-phase nanocrystals during crystallization. Specifically, MWCNTs offer a large surface area for the adsorption of PVDF chains through interactions between the π-electrons of the nanotubes and the fluorine atoms in PVDF. Compared to single-walled carbon nanotubes (SWCNTs), MWCNTs have a more rigid structure, are less likely to coil or aggregate, and demonstrate greater surface defects and a more complex surface morphology. These features enable stronger adhesion to polymers like PVDF, facilitating the formation of a robust interface between the nanotubes and the polymer [22]. Al-Harthi et al. [23] noted that the thermal stability of MWCNTs/PVDF nanocomposites showed less improvement compared to PVDF/graphene nanoflake (GNF) nanocomposites. This difference may be attributed to the two-dimensional planar structure of GNFs, which likely leads to better nano-confinement. Additionally, Sharafkhani and Kokabi [24]observed that the d33 coefficient and β phase content of PVDF increased with the inclusion of modified HD-MWCNTs. More recently, Xu et al. reported that a PVDF composite film with 10 wt.% PVDF, 0.1 wt.% MWCNTs, and 1.5 wt.% ZnO nanoparticles exhibited the highest β-phase content at 79.0% and crystallinity at 87.9% in the nanofibers. This piezoelectric sensor achieved a power density of 0.33 μW/cm² and a force sensitivity of 582 mV/N. Furthermore, the sensor was successfully applied to detect irregular movements such as finger bending and foot stepping. These results suggest that electrospun PVDF/MWCNT/ZnO nanofibrous films hold significant potential for use in wearable devices.
In this study, P(VDF-HFP) was selected as the host polymer matrix due to its superior properties compared to PVDF, including higher solubility, greater hydrophobicity, and improved mechanical strength, thanks to the inclusion of HFP [25]. Despite these enhancements, the phase structure remains similar to that of PVDF. This research highlights the significant impact of MWCNTs-reinforced P(VDF-HFP) composite films, prepared using the solution casting method, on the crystalline structure and sensing performance. By adjusting the concentration of MWCNTs, we aim to explore their effects on the structural, thermal, mechanical, optical, and piezoelectric properties of the composite films. To analyze the morphology, phase structure, and crystallinity, techniques such as scanning electron microscopy (SEM), atomic force microscopy (AFM), Fourier-transform infrared spectroscopy (FTIR), and X-ray diffraction (XRD) were employed. Hydrophobic and optical properties of all the P(VDF-HFP) samples were also investigated. The inclusion of MWCNTs carbon nanomaterials induces a higher proportion of the polar phase in the composite films. Furthermore, we will discuss how the interactions between the aligned P(VDF-HFP) chains and the well-oriented MWCNTs play a critical role in preventing phase transformation while enhancing crystallinity, tensile strength, thermal stability, and the dielectric constant of the material. Lastly, the composite film was tested to measure the open-circuit voltage and d33 coefficient under a low frequency of 1 Hz to evaluate sensor performance. The findings suggest that flexible MWCNTs/P(VDF-HFP) composites offer significant potential for piezoelectric applications, opening new avenues for high-performance electroactive materials.
2. Method
2.1. Materials
Poly(vinylidene fluoride-hexafluoropropylene) powder (PVDF-HFP, Solef® 11010/1001) with a melt mass-flow rate (MFR) of 4-8 g/10 min at 230 °C and a 5 kg load, a density of 1.78 g/cm³, a melting temperature range of 158-162 °C, and water absorption at 23 °C for 24 hours of less than 0.04%, was obtained from Solvay. Multiwall carbon nanotubes (MWCNTs, 659258, > 90% carbon basis, dimensions 110-170 nm × 5-9 μm, density 1.7 g/mL at 25 °C) were procured from Sigma-Aldrich. N,N-Dimethylformamide (DMF, AR1051-G4L, density 0.949 g/cm³), a highly polar solvent, was provided by RCI Labscan, Thailand.
2.2. Film Preparation
Pure P(VDF-HFP) and MWCNTs/P(VDF-HFP) composite films were fabricated using the solution casting technique as represented in Figure 1(a). To prepare the P(VDF-HFP) solution, the P(VDF-HFP) powder was dissolved in DMF solvent with a mass ratio of 1:5 and stirred for 3 hours to obtain a homogeneous and transparent solution. Separately, a specified amount of MWCNT (0.25, 0.5, 0.75, and 1.0 wt%) was added to DMF and stirred for 1 hour to ensure that the nanoparticles were well dispersed in the DMF and to avoid aggregates. Afterward, the desired amount of MWCNTs and DMF were mixed and placed in an ultrasound bath for 30 minutes to achieve a homogeneous dispersion of the MWCNTs within the P(VDF-HFP) polymeric matrix. Each homogeneous solution was cast onto a clean glass substrate using a film applicator doctor blade (SAIDKOCC, China) and kept inside an oven (Binder, FED 56, Germany) at 80°C for 6 hours to completely remove the solvent. The prepared pure P(VDF-HFP) and MWCNTs/P(VDF-HFP) nanocomposite films were cut into rectangular strips, and their thicknesses were measured using a dial thickness gauge (Peacock, PEA-G). The resulting films had thicknesses ranging from 50 to 70 μm, suitable for characterization and measurement purposes.
2.3. Characterization
The surface morphology of pure P(VDF-HFP) and MWCNT/P(VDF-HFP) nanocomposite films was observed with a scanning electron microscopy (SEM, Quanta 400, FEI, Czech Republic). The samples were mounted on the standard sample plate by means of adhesive tapes. A thin layer of gold was sputtered on the sample surface prior to the imaging. The SEM measurements were performed at an accelerating voltage of 20 kV.
Atomic force microscopy (AFM, Nanosurf flex, Switzerland) was employed to further investigate the surface topography of the nanocomposites. AFM images were captured in dynamic force mode using a cantilever (AppNano, STM probe ACLA 50, USA). For quantitative analysis, 20 × 20 μm² micrographs were recorded at a resolution of 256 points per line. Image analysis was performed using Nanosurf C3000 software. The surface roughness parameters of the samples expressed in terms of the root mean square of the Z data (Sq) were obtained by roughness analysis calculated by the software.
Contact angle measurements were conducted using a Dataphysics OCA 15EC. A 3-µL droplet of deionized water was placed on the bottom surface of the film. The contact angle was determined from a digital image using SCA software included with the apparatus. The WCA values for each sample are reported as the averages of at least three measurements taken from different areas, with the result being the mean value.
The phase structure of the P(VDF-HFP) samples was determined using Fourier transform infrared spectroscopy (FTIR) using a VERTEX 70 spectrometer from Bruker, Germany. To investigate interactions between components, FTIR measurement was performed at room temperature in attenuated total reflectance (ATR) mode, covering a range from 4000 to 400 cm⁻¹ with a resolution of 4 cm⁻¹. The relative content of two piezoelectric phases (FEA), β and γ, was determined in accordance to [26] using equation:
where I763 and I840* are the intensities of the bands at 763 cm−1 and 837–841 cm−1, assigned to the α phase, and to both β and γ phases together, respectively. These absorption bands follow Beer–Lambert law with absorption coefficients of K840* = 7.7 × 104 cm2mol−1, and K763 = 6.1 × 104 cm2 mol−1.
X-ray diffraction (XRD) with an Empyrean diffractometer from PANlyrical, Netherlands, was used to identify crystalline phase structure of the samples. The XRD patterns were recorded at an operating current of 30 mA and a voltage of 40 kV, utilizing a Cu Kα radiation source (λ = 0.154 nm). Measurements were conducted over a diffraction angle (2θ) range of 5-90° with a step size of 0.026°. The X-ray results were commonly used to determine the mean crystallite size (D) of the samples using Scherrer’s equation [27]:
where λ is the wavelength of CuKα radiation and is 0.154 nm, θ is Bragg’s angle of diffraction, and βs refers to the full width at half maximum (FWHM). The area corresponding to each crystalline peak was obtained through the curve deconvolution of each XRD pattern using PeakFit program. Based on the data, the total crystallinity (Xct), the α phase crystallinity (Xcα), the β phase crystallinity (Xcβ), and the γ phase crystallinity (Xcγ), were calculated using the following equations [28,29]:
where ΣAcr and ΣAamr are the total integrated areas of the crystalline diffraction peaks and the amorphous halo, respectively. ΣAα, ΣAγ, and ΣAβ indicate the total integral area from α, γ, and β crystalline phases peaks, respectively
Thermogravimetric analysis (TGA) is a key analytical technique for measuring the thermal behavior of samples as a function of temperature. Valuable insight into the thermal stability and degradation were assessed using a thermogravimetric analyzer (TGA; Perkin Elmer, USA). The P(VDF-HFP) samples were analyzed by measuring the temperature difference between the samples and a reference (a thermally inert material) over time and temperature, using a temperature program under a nitrogen atmosphere with a flow rate of 20 ml/min. Each sample was heated from 50 °C to 715 °C at a heating rate of 10 °C/min. TGA curves were generated by plotting weight loss as a function of continuously increasing temperature.
Tensile testing is a fundamental method used to measure the mechanical properties of materials, particularly their strength and deformation behavior when subjected to tension. In this test, a tensile testing machine (Z010, ZwickRoell, Germany) was used to apply a controlled force to the samples. Both ends of the test samples were secured in the machine's clamps, which held the material firmly to ensure that the force was evenly distributed as the sample was stretched.
The test was conducted at a speed of 5 mm/min, which refers to the rate at which the grips moved apart, causing the sample to elongate. Simultaneously, a load speed of 100 N was applied, meaning that the force exerted on the sample increased at this rate. The testing followed an in-house method based on ISO 37 Type II standards. Tensile tests were repeated for three times, ensuring that measurements were consistent within materials. The applied stress was measured as a function of elongation by the machine, which was used to determine the values of tensile strength, elongation at break, and Young's modulus. Engineering stress and strain were obtained according to [30]:
where F is the tensile force, A the transversal area of the sample considering the thickness and width of the sample, ∆L the recorded displacement and L0 the initial interspace between clamps. In addition, Young's modulus (or elastic modulus) was calculated from the slope of the stress-strain curve in the initial elastic region, according to Hooke’s law [31];
UV-Vis spectroscopy analysis was conducted using a double-beam UV-Vis-NIR spectrometer (SPECORD 201 PLUS) over the wavelength range of 200–800 nm to obtain the absorption spectra of the samples. Five specimens, each cut to dimensions of 2 cm × 2 cm, were placed in a sample holder for measurement at room temperature.
Dielectric characterization is a crucial technique for investigating the electrical properties of polymers. In this study, the dielectric properties were measured using an LCR meter (model IM 3533; HIOKI, Japan), with the capacitance (C) of each sample determined over a frequency range from 1 Hz to 100 kHz at room temperature. From these measurements, key dielectric parameters such as the dielectric constant (εr'), also known as the real part of the relative permittivity, the dielectric loss tangent (tan δ), and the ionic conductivity (σ) were derived using the following equations [32,33,34]:
In these equations, ε0 represents the vacuum permittivity, which has a value of 8.854×10⁻¹² F/m, while t is the thickness of the polymer film (m), and A is the area of the electrode contact (m2). The parameter εr′′ denotes the imaginary part of the relative permittivity, which accounts for energy losses in the material. The bulk resistance (Rb) was directly obtained from the LCR meter readings. Together, these relationships enable a comprehensive understanding of the dielectric behavior of the polymer samples across the measured frequency range.
The piezoelectric response measurement setup, as shown in Figure 1(c), involves using an automatic shaker powered by a DC power supply to apply controlled mechanical forces to a piezoelectric sample. The applied forces, ranging from 1.074 to 16.145 N (specifically 1.074, 3.232, 6.199, 9.522, and 16.145 N), are varied by adjusting the DC voltage between 10 and 30 V (10, 15, 20, 25, and 30 V). The shaker, controlled via an Arduino-based box controller, applies pressure to the sample placed on load cells, which measure and display the applied force in Newtons. The sample consists of composite films with copper tape electrodes on both sides, and it is subjected to a 1 Hz force application frequency. The open-circuit voltage generated by the sample, due to the piezoelectric effect, is measured using a digital oscilloscope (RIGOL, DS1104B). This setup effectively correlates mechanical stress with the generated electrical response, enabling the measurement of the piezoelectric coefficient (d₃₃) of the composite films. The charge (Q) generated across the opposite faces of a piezoelectric material with area (A) when mechanical stress (∆σ) is applied between the faces is given by [16,35]:
where d₃₃ is the piezoelectric coefficient (C/N), and the 33-mode refers to stress applied in the polarization direction. It is possible to estimate the typical voltage and current generated under applied stress by considering two extremes of the load impedance. Under open-circuit conditions, d₃₃ is evaluated using the relationship in equation (14), where Q=CV and C (/t) is the material's capacitance. The voltage (V) can be determined as [35]:
3. Results and Discussion
3.1. SEM Analysis
The surface morphology of pristine P(VDF-HFP) and MWCNTs-reinforced P(VDF-HFP) composite films with different MWCNTs concentrations is shown in the SEM images in Figure 2. The pristine P(VDF-HFP) film exhibits numerous spherulitic structures with an average size of approximately 2.0 μm and a microporous surface. The microporous structure of pure P(VDF-HFP), prepared via the solution casting method using DMF as a solvent, can be attributed to several factors [36,37,38]. First, solvent evaporation dynamics play a role: DMF’s relatively high boiling point causes slow evaporation, allowing sufficient time for phase separation and subsequent micropore formation. As the solvent evaporates, the polymer concentration in the solution increases, resulting in phase separation between polymer-rich and polymer-poor regions, creating the porous structure. Second, crystallization behavior contributes to the morphology. P(VDF-HFP) is a semi-crystalline polymer, and during film formation, crystalline regions form, leaving behind amorphous areas that lead to microporosity. The slow evaporation of DMF provides enough time for crystallization to occur, which helps to develop the microporous structure as the crystalline regions expel the solvent, leaving voids. Third, good solvent properties of DMF ensure that the P(VDF-HFP) polymer is well dissolved. As DMF evaporates, polymer chains aggregate, driving phase separation and the formation of micropores. Additionally, any post-casting thermal treatment can influence porosity. Controlled annealing, for instance, can enhance phase separation and crystallization, further contributing to micropore formation.
For the MWCNTs/P(VDF-HFP) composite films, the pore size and porosity gradually increased with increasing MWCNTs concentration as listed in Table1. When the weight ratio of MWCNTs increases, significant changes in the surface morphology of the P(VDF-HFP) film are observed. It is suggested that weak van der Waals interactions occur between the MWCNTs and the P(VDF-HFP) polymer chains, allowing for the nearly uniform distribution of MWCNTs in the composite films . [39]. These results are similar to those reported by Chae et al. [40], who also confirmed that GO (graphene oxide) and MWCNTs were well dispersed in the PVDF membrane. Compared to pure PVDF, the addition of GO and MWCNTs resulted in variations in the pore size and the number of surface pores.
3.2. AFM Analysis
AFM, operating in dynamic force mode, was performed to study the surface topography of pristine P(VDF-HFP) and MWCNTs/P(VDF-HFP) composite films with various MWCNT concentrations (0.25%, 0.50%, 0.75%, and 1.00%). Figure 3 and Table 1 respectively present the typical AFM images and the calculated surface roughness (Sq) of these film surfaces. The Sq values were estimated from AFM images of a 20 µm × 20 µm area. The results show that as the concentration of MWCNTs increases, the surface roughness of the composite films also increases. This trend is visible in both the 2D and 3D AFM surface topography representations. At lower concentrations (0.25% MWCNTs), the change in roughness is relatively minor, whereas higher concentrations (0.75% and 1.00%) lead to a more pronounced increase in roughness. The increasing surface roughness with higher MWCNT content is likely due to the dispersion of MWCNTs within the P(VDF-HFP) polymer matrix, creating a rougher surface. This can be attributed to the formation of microporous structures, as discussed in the SEM section, and provides clear evidence of the presence of MWCNTs in the composite films. The enhanced surface roughness may also influence how the material interacts with its environment, affecting properties such as adhesion or sensing performance in potential applications [41].
3.3. WCA Analysis
In general, P(VDF-HFP) polymers are widely used in membrane manufacturing due to their excellent physical and chemical resistance, thermal stability, and wetting resistance properties. However, films with hydrophilic surfaces tend to absorb moisture from the surrounding air, leading to the formation of a thin layer of water molecules that spreads across the fiber surface, which can affect their electrical properties [42]. To address this, the wetting behavior of the as-prepared films was determined by measuring the contact angle of a water droplet on each sample's surface. The contact angle is directly related to a surface’s wetting resistance, with higher angles indicating greater hydrophobicity [43]. The concentration of MWCNTs plays a significant role in influencing the hydrophobic properties of P(VDF-HFP). Therefore, varying MWCNT concentrations were investigated to understand their effect on surface hydrophobicity, revealing a clear correlation between MWCNTs loading and changes in the film's wettability. Figure 4 shows the measured water contact angle (WCA) values of pristine P(VDF-HFP) and MWCNTs/P(VDF-HFP) composite films with different MWCNT concentrations: 0.25%, 0.50%, 0.75%, and 1.00%. It is evident that the WCA values of all samples ranged from 96.73° ± 4.82° to 117.07° ± 2.10°, confirming the inherent hydrophobicity of the films and demonstrating good water repellence. As previously noted [44], fluoropolymers typically exhibit low surface energy, likely due to the highly electronegative nature of fluorine, which weakens the attractive forces between the surface and other substances, resulting in a larger contact angle.
The incorporation of MWCNTs in the P(VDF-HFP) composites resulted in a gradual increase in WCA values, a trend also observed by Chen et al. [45]. MWCNTs likely increase surface roughness, which amplifies the hydrophobic nature of the P(VDF-HFP) matrix by creating a hierarchical surface structure. This observation is consistent with the surface roughness results obtained from the analysis of the AFM images. According to the Wenzel and Cassie-Baxter models of wettability [46], increased roughness on hydrophobic surfaces enhances their hydrophobicity, as reflected in the gradual rise in WCA with higher MWCNT concentrations. When the MWCNT loading reaches 1.00 wt.%, the WCA of the composite P(VDF-HFP) films increases to 117.07° ± 2.10°. This rise in hydrophobicity suggests that the incorporation of MWCNTs significantly affects surface wettability, as evidenced by the significant increase in the water contact angle.
3.4. FTIR Analysis
FTIR analysis is a powerful technique for determining the crystalline forms and molecular structures of materials. In the case of the obtained P(VDF-HFP) films, FTIR can help identify different crystalline phases. Figure 5 shows the FTIR spectra of pure P(VDF-HFP) and MWCNT/P(VDF-HFP) composite films. Dotted lines in Figure 4 highlight the positions where the characteristic bands of the main polymorphs should appear, including the non-polar α phase and the polar γ and β phases. According to the literature [47,48], the characteristic absorption peaks at 411 cm⁻¹ (CF₂ wagging), 538 cm⁻¹ (CF₂ bending), 617 and 764 cm⁻¹ (CF₂ bending and skeletal bending), 804 and 981 cm⁻¹ (CH₂ rocking), and 1,074 cm⁻¹ correspond to the non-polar α phase. Meanwhile, the bands at 431 cm⁻¹ (CF₂ rocking and CH₂ rocking), 482 cm⁻¹ (CF₂ deformation), 512 cm⁻¹ (CF₂ stretching), 840 cm⁻¹ (CH₂ rocking, CF₂ stretching, and skeletal C═C stretching), and 1,234 cm⁻¹ (CF out-of-plane deformation) correspond to the polar γ phase. Additionally, the electroactive polar β phase of P(VDF-HFP) typically exhibits a characteristic stretching vibration at 840 cm⁻¹ [49]. Some peaks, such as those at 881 cm⁻¹ (CF₂ stretching) and 1,402 cm⁻¹ (deformation of CH₂ vibration groups), are considered common peaks and were excluded from the analysis because they may belong to any of the three main phases [32,47,50].
As observed, in the pure P(VDF-HFP) film, the peaks at 411, 538, 617, 764, 804, and 981 cm⁻¹ confirm the presence of the α-phase crystalline structure, while the peaks at 431, 482, 512, and 1,234 cm⁻¹ are attributed to the γ phase. Notably, the band at 840 cm⁻¹ is associated with both the γ and β phases [51]. This indicates that both non-polar and polar phase configurations are present in the pure P(VDF-HFP) materials under study. Generally, the α phase is the most thermodynamically stable phase of P(VDF-HFP) at room temperature. During the solution-casting process, as the solvent evaporates and the polymer solidifies, the molecules tend to arrange themselves in the most stable configuration, often leading to the formation of the α phase. The crystallization process during casting also influences the formation of the α phase. Since the α phase is kinetically favored during rapid cooling or solvent evaporation, it is commonly the dominant phase in P(VDF-HFP) films prepared by this method [52]. Moreover, one key factor in enhancing the crystallization of the polar phase in pure P(VDF-HFP) is the molecular interaction between P(VDF-HFP) and the solvent. In the case of DMF as the solvent, these interactions include dipolar interactions between the C=O group in DMF and the CH₂–CF₂ group in P(VDF-HFP), as well as weak hydrogen bonding between C=O and H–C. Both interactions disrupt the inter-chain forces in solid P(VDF-HFP), leading to its dissolution. The polarity of the solvent also affects the crystallinity of P(VDF-HFP). Highly polar solvents cause strong dipoles in the molecular chain's C–F bonds within P(VDF-HFP) to rotate, lowering the energy barrier for creating extended all-trans conformations (TTT) and trans-gauche conformations (TGTG) [53,54]. These findings align well with previous reports. Many studies have demonstrated that low-temperature solution crystallization (T < 70 °C) results in either the α or γ phase or a mixture, depending on the solvent used, while some studies have reported the β phase under similar conditions. Extensive casting experiments have been conducted, varying the solution concentration, solvent composition, and crystallization temperature with detailed characterizations [47,55].
After incorporating MWCNTs into the P(VDF-HFP), the intensity of all α-phase peaks weakens with increasing MWCNT scontent, eventually disappearing. In particular, no α phase peaks are observed in the 1.00% MWCNTs/P(VDF-HFP) composite, indicating changes in the molecular structure and the formation of polar crystalline phases. This implies that the formation of the polar phase is significantly dependent on the MWCNTs content, and only the α phase is formed in pure P(VDF-HFP). Although the developed P(VDF-HFP)-based composites do not exhibit a pronounced β phase, they contain a clear combination of the γ and β phases, which are also expected to exhibit piezoelectric effects. Since the 840 cm⁻¹ band is attributed to both polar phases, the relative fraction of the electroactive γ and β phases (FEA) in terms of crystalline components can be quantified using the Lambert–Beer law, as described by equation (1). The calculated weight fractions of the polar phase in the samples are listed in Table 2. The FEA values increased with higher MWCNTs concentrations in the composite films. Overall, the results show that the 1.00% MWCNTs/P(VDF-HFP) composite produced the greatest improvement in the fraction of the electroactive γ and β phases in the film. Since the characteristic absorption peaks from the electroactive γ and β phases are nearly identical and difficult to distinguish in FTIR spectra, XRD analysis was conducted to further identify the phase transitions.
3.5. XRD Analysis
X-ray diffraction (XRD) is a powerful technique used to investigate the effect of MWCNT content on the crystallization of MWCNT/P(VDF-HFP) composite films, revealing the crystalline phase distribution of the composites [56]. Figure 6 shows the XRD patterns of pure P(VDF-HFP) and MWCNT/P(VDF-HFP) composite films with varying MWCNT contents. All samples exhibit similar peaks with varying intensities, corresponding to the reflection planes of P(VDF-HFP). In the pure P(VDF-HFP) film, the peaks at 2θ = 17.7°, 18.3°, and 26.2° are assigned to the (100), (020), and (021) reflections of the α-phase crystal plane, respectively [9,5][]. The diffraction peaks of the γ phase at 18.3°, 20.4° (002/110/101), 36.9° (022), and 38° were observed in all P(VDF-HFP) films, both with and without MWCNTs [58,59,60]. The intensity of the peak around 20.4° is high, as it overlaps with the diffraction from the (002) plane, characteristic of the polar γ phase [13]. The β phase also contributes to this peak, indicating that pure P(VDF-HFP) exists in a combination of α, β, and γ phases, which aligns well with the FTIR results.
When MWCNTs were incorporated into the P(VDF-HFP) composite solutions, the β phase peak appears at 36.5° (020/101) and becomes more prominent with increasing MWCNT content, eventually becoming the strongest diffraction peak. This suggests a phase transition from the α phase to the β phase, which enhances the piezoelectric properties of the samples. MWCNTs, when dispersed in P(VDF-HFP) composites, act as effective nucleating agents, promoting heterogeneous nucleation, increasing the crystallization rate, and facilitating the phase transition from α to β, which is crucial for piezoelectric applications [61]. The high surface area of MWCNTs enhances this effect, making the β phase more dominant. Additionally, electrostatic interactions between the functional groups on MWCNTs and the CF₂ groups in P(VDF-HFP) help align the polymer chains [56]. MWCNTs serve as nucleating agents in the composite solution, with the TGTG molecular chain strongly bound to the surface of MWCNTs through electrostatic interactions between the carbon atoms and π orbitals of the MWCNTs and the CF₂ and CH₂ groups of P(VDF-HFP). Due to the stronger electronegativity of fluorine atoms compared to carbon and hydrogen, the dipoles in CF₂ are more likely to interact with the π-electrons on the π-electron-rich surface of MWCNTs. This interaction facilitates the formation of P(VDF-HFP) chains in a zigzag conformation (trans-trans, TT). As previously discussed [49], MWCNTs exhibit relatively good dispersion in P(VDF-HFP), providing ample opportunities for the adsorption of P(VDF-HFP) chains along the MWCNT surface, as illustrated in Figure 1(b), which contributes to the formation of the β phase. As MWCNTs content increases, these interactions intensify, resulting in a more stable and pronounced β phase [56]. This suggests the significant role of MWCNTs in promoting β phase formation in this study.
The evaluated data presents a detailed analysis of the crystallographic parameters of P(VDF-HFP) and its composites with varying concentrations of MWCNTs, as listed in Table 2. These parameters include d-spacing, full width at half maximum (FWHM), crystalline size, and percentages of different phases (Fα, Fγ, Fβ) along with crystallinity (Xc) and the overall percentage of crystalline material in the samples. d-spacing refers to the distance between crystallographic planes in a material, which can be influenced by the polymer matrix structure and the addition of MWCNTs as a filler. The d-spacing values remain relatively consistent across all samples, ranging from 4.42837 Å in pure P(VDF-HFP) to 4.4401 Å at 1.00% MWCNTs, which is similar to what was reported by Che et al. [62]. This slight increase in d-spacing with higher MWCNTs concentrations suggests that the addition of MWCNTs slightly affects the lattice structure, possibly due to the intercalation of MWCNTs within the polymer matrix. The change in d-spacing reflects a mild expansion in the polymer chains, which may be caused by interactions between the MWCNTs and the polymer chains. FWHM is used to measure the broadening of X-ray diffraction peaks and is inversely related to crystalline size, which is calculated using the Scherrer equation. It provides an indication of the size of crystalline domains in the material. The FWHM values decrease as MWCNTs concentration increases, with the pure sample showing the highest FWHM (0.6652 rad) and the 1.00% MWCNTs composite having the lowest (0.3070 rad). This indicates that crystalline size increases with higher MWCNTs content. The significant increase in crystalline size further confirms that MWCNTs act as nucleating agents, promoting crystal growth within the polymer matrix. As MWCNTs content increases, the crystallization process is enhanced, leading to larger and more ordered crystalline structures. The crystallinity percentage (Xct) also increases with the addition of MWCNTs, rising from 50.04% in the pure P(VDF-HFP) sample to 54.83% in the 1.00% MWCNTs composite, confirming that the polymer remains semicrystalline. The incorporation of MWCNTs into the polymer matrix enhances the nucleation rate, facilitating faster and more organized crystallization. MWCNTs introduce surfaces that aid in the alignment and ordering of polymer chains, promoting crystallization [63]. When the MWCNTs content increases from 0.25% to 1.00%, the increase in crystallinity becomes more gradual, indicating that beyond a certain concentration, the effect of MWCNTs on crystallinity stabilizes. The obtained data revealed that the incorporation of MWCNTs positively influences the crystallinity of P(VDF-HFP) films. Higher crystallinity is often correlated with improved mechanical and piezoelectric properties, as a more ordered structure facilitates the generation and transmission of piezoelectric charges [64]. This increase in crystallinity is possibly beneficial for the electroactive properties of the material, enhancing its potential for piezoelectric applications.
As previously reported, piezoelectricity is one of the key properties of P(VDF-HFP). The piezoelectric response is strongly related to the presence of polar phases (γ and β), with the β phase being particularly desirable because it exhibits the highest piezoelectricity. The non-polar α phase (), which is thermodynamically stable but non-electroactive, steadily decreases from 46.71% in pure P(VDF-HFP) to 29.16% at 1.00% MWCNTs as the concentration of MWCNTs increases. This suggests that the presence of MWCNTs actively suppresses the formation of the α-phase, promoting a transition to more electroactive phases. The γ phase fraction (), which is polar and electroactive, decreases slightly with increasing MWCNTs concentration, from 39.09% in the pure film to 29.75% at 1.00% MWCNTs. This suggests that MWCNTs not only promote the electroactive γ-phase but shift the phase distribution more strongly toward the β phase at higher concentrations. The β phase , which is the most desirable for piezoelectric applications due to its highly electroactive nature, steadily increases from 14.21% in pure P(VDF-HFP) to 41.08% in the 1.00% MWCNTs composite, showing the most significant increase compared to the other phases. At 1.00% MWCNTs, the material exhibits the highest electroactive content, making it the most promising composite for piezoelectric and electroactive applications. The enhancement in phase distribution due to MWCNTs, especially the increase in β phase content, suggests that MWCNTs are highly effective as nucleating agents. They facilitate the transition from non-polar to polar phases, improving the overall functionality of the P(VDF-HFP) matrix for electroactive and piezoelectric applications. This trend indicates that MWCNTs are particularly effective in promoting β phase formation, which is crucial for enhancing the piezoelectric properties of the composite.
3.6. TGA Analysis
Thermogravimetric Analysis (TGA) is commonly used to study the thermal properties of nanomaterials by continuously weighing a given sample in a controlled atmosphere (air) as the temperature increases. The thermograms shown in Figure 7 and Table 3 correspond to pristine P(VDF-HFP) and MWCNTs/P(VDF-HFP) composite films with various concentrations of MWCNTs: 0.25%, 0.50%, 0.75%, and 1.00%. All the P(VDF-HFP) films exhibit good thermal stability up to about 460°C, which is consistent with the results reported by Zhang et al. [65]. However, a minimal weight loss (ranging from 0.785% to 0.851%) was observed at around 50 to 60°C, which is attributed to the volatilization of residual DMF. The presence of residual DMF is indicated by a small, gradual weight loss in the lower temperature range, occurring before the polymer begins to decompose [66]. Typically, vinylidene polymers such as PVDF and its copolymers (e.g., P(VDF-HFP)) exhibit two competitive thermal degradation processes, as also reported by Mendes et al. [67] and Botelho et al. [68]. The first degradation process, corresponding to the primary degradation of PVDF, occurs in the range of 400-510°C. The second degradation step takes place at a temperature range of 510-700°C and appears as a slight slope variation compared to the first stage, where the majority of the polymer mass is lost. Since the thermograms of both thermal degradation steps undergo only minor changes after annealing, it is inferred that thermally induced effects were not harmful to this polymer under the conditions employed.
From the obtained results, the onset temperature of the initial decomposition of the backbone of pure P(VDF-HFP) polymer was at 462.15°C, attributed to a mechanism initiated by carbon-hydrogen scission with a bond strength of C–H (410 kJ mol−1) [69,70]. As the amount of MWCNTs in the nanocomposites increases, the thermal stability of the prepared films gradually improves, with a reduced rate of decomposition. The onset temperature reached up to 468.03°C for the highest concentration (1.00 wt%) of MWCNTs in the P(VDF-HFP) film. Although the increase is not substantial, a 1.30% improvement in thermal stability was contributed by the MWCNTs nanofiller. The enhanced stability of this nanocomposite is probably due to the effective incorporation of MWCNTs into the host P(VDF-HFP) polymer. At higher temperatures, the second thermal degradation stage begins around 560°C, which is attributed to the degradation of the P(VDF-HFP) matrix corresponding to the loss of H–F with a bond strength of about 486 kJ mol−1 [69]. The observed curves also show that for the composites, the primary decomposition step is delayed, and the rate of mass loss appears to be slower as the MWCNT content increases. This suggests that MWCNTs act as barriers to thermal degradation [71]. When uniformly dispersed in the P(VDF-HFP) polymer, MWCNTs create a more tortuous path for the diffusion of volatile decomposition products and heat. This slows down the degradation process, as the thermal energy and degradation products have to navigate around the nanotubes. After the final decomposition step, the residue (remaining mass) is significantly higher in the composites due to the presence of MWCNTs, which are thermally stable. The TGA curves clearly show that all the nanocomposites exhibit higher residue content compared to pure P(VDF-HFP). These results confirm the influence of changes in the molecular structure, leading to an increase in crystallite size and crystalline regions. Higher crystallinity generally improves thermal stability because crystalline regions have stronger intermolecular forces and require more energy to break down. MWCNTs can act as nucleating agents, promoting the formation of these crystalline regions, which is consistent with the obtained XRD results. This phenomenon has been reported in numerous previous studies and can be understood by the following explanations [24,72,73,74]: (i) the introduction of MWCNTs restricts the thermal motion of the polymer chains, effectively enhancing the thermal stability of the polymer matrix; (ii) the high thermal stability of MWCNTs, with decomposition temperatures well above that of P(VDF-HFP); and (iii) strong interfacial interaction between MWCNTs and the polymer matrix due to physical or chemical bonding. It is clear from the observed results that the thermal stability of the MWCNTs/P(VDF-HFP) composite films increases with higher MWCNT content. This suggests a potential advantage of adding MWCNTs to the P(VDF-HFP) polymer matrix, which requires good thermal stability to perform well in practical energy devices.
3.7. Tensile Testing Analysis
The tensile properties are crucial for the industrial applications of polymer-based nanocomposites. Typical stress-strain curves for pure P(VDF-HFP) and its nanocomposites with varying MWCNT content are shown in Figure 8 The corresponding numerical data are presented in Table 4. It is evident that all samples exhibit linear elastic behavior during the initial stage of tensile testing, followed by a region of plastic deformation before fracture. Similar results were obtained in previous studies [7,75,76]. The neat P(VDF-HFP) film demonstrated a tensile strength of 14.56 MPa, elongation at break of 92.11%, and a Young’s modulus of 1.93 MPa. These values are somewhat lower than previously reported values for pure P(VDF-HFP) of the same grade [77], likely due to differences in processing conditions. The pristine polymer exhibits a more ductile nature, characterized by a relatively low Young’s modulus and tensile strength but a high elongation at break, meaning it can stretch significantly before failure, though it is less stiff and strong. As expected, the incorporation of MWCNTs has a significant impact on the tensile strength and Young’s modulus of the MWCNTs/P(VDF-HFP) nanocomposites. Higher modulus and tensile strength values indicate a stiffer and stronger material, respectively. As the MWCNTs concentration increases, the composite becomes stiffer (higher Young’s modulus), stronger (higher tensile strength), but less ductile (lower elongation at break). For the 1.00% MWCNTs/P(VDF-HFP) composite, the modulus, tensile strength, and elongation at break are 17.76 MPa, 45.13 MPa, and 21.44%, respectively. The increase in stiffness and strength can be attributed to the strong interactions between the P(VDF-HFP) polymer and the MWCNTs, which act as reinforcement by efficiently distributing the applied stress [78]. Meanwhile, SEM and AFM results have confirmed that the MWCNTs are evenly dispersed in the P(VDF-HFP) matrix. However, the reduction in elongation at break highlights a trade-off, where the increased mechanical strength results in decreased flexibility [79]. This balance between strength and flexibility is typical in composite materials and must be adjusted according to the specific application. For instance, applications requiring higher strength, but lower flexibility would benefit from higher MWCNTs content, while those requiring more flexibility may need lower MWCNTs concentrations.
3.8. Optical Properties Analysis
The molecular structure of a material can be identified by analyzing its absorbance or reflectance, as molecules absorb different wavelengths of light depending on their structure. This data helps in calculating optical properties such as band gap energy [80]. Additionally, absorbance spectra provide insights into the material's interaction with light, which may influence its piezoelectric properties by altering its structure or electronic behavior. A significant change in the band gap can be observed with the addition of MWCNTs in the P(VDF-HFP) matrix. Figure 9 illustrates the absorption spectra of pristine P(VDF-HFP) and MWCNT/P(VDF-HFP) composite films with varying concentrations of MWCNTs: 0.25%, 0.50%, 0.75%, and 1.00%, studied using UV–visible analysis in the range of 200–800 nm. The absorption spectrum of pure P(VDF-HFP) film shows high absorption intensity around 290 nm, which can be attributed to the P(VDF-HFP) chains containing conjugated double bonds, formed by alternating carbon-carbon single and double bonds. These double bonds undergo π-π* electronic transitions when excited by UV light at around 290 nm [81].
A clear correlation between the MWCNTs content and changes in the UV–visible spectrum is observed. There is an apparent enhancement in absorption for the MWCNT nanocomposites in the UV region, which aligns with previously reported results [82]. The absorption spectrum gradually decreases in the 310–320 nm range due to scattering in the lower wavelength range. This result suggests that the nanotubes exist as large agglomerates and are strongly entangled [83]. The increased MWCNT content in the P(VDF-HFP) nanocomposite leads to a higher absorption band intensity in this range. The maximum absorbance was observed for the composition with 1.00 wt% loading of MWCNTs. This characteristic of individually dispersed MWCNTs in the P(VDF-HFP) matrix results in improved optical characteristics by reducing transmittance, highlighting the potential for tailoring the material’s optical and electronic properties for specific applications.
To better understand the band structure, it is essential to analyze the optical band gap and internal electronic transitions using the Tauc equation. The intersection of the extrapolated linear portion of the Tauc plot with the energy axis yields the optical band gap [84,85]:
where A is a parameter dependent on the interband transition probability, Eg is the optical band gap, α is the absorption coefficient, hν is the incident light energy, and n is a number characterizing the nature of the transition process (with n=2 indicating a direct transition).Figure 10 illustrates the relationship between photon energy and (αhν)2. It is evident that as the photon energy increases, (αhν)2 also increases. The difference in energy between the top of the valence band and the bottom of the conduction band of electrons is referred to as the optical bandgap energy Eg). The optical band gap of pure P(VDF-HFP) is observed to be 3.21 eV, which is higher than that of the MWCNT/P(VDF-HFP) composite films. As MWCNTs are incorporated into the composite, the states at the band edge contribute, lowering the Fermi energy value and consequently reducing the energy band gap, causing the indirect optical band gap to decrease [84]. However, with increasing MWCNT concentrations, the direct band gap values were found to be approximately 1.62, 1.66, 1.70, and 1.72 eV for the P(VDF-HFP) composites with 0.25, 0.50, 0.75, and 1.00 wt% MWCNTs, respectively. This gradual increase in band gap with higher MWCNT concentrations is attributed to the incorporation of MWCNTs into the P(VDF-HFP) matrix, which alters the electronic structure, allowing the material to absorb photons of lower energy. This behavior is due to the conductive nature of MWCNTs, which enhance the overall electronic conductivity of the composite and modify its optical properties. Such changes can be advantageous for applications requiring materials with tunable electronic and optical properties, such as sensors or energy-harvesting devices.
3.9. Dielectric Behavior
The variation of the dielectric constant (ε) and dielectric loss (tan δ) of pristine P(VDF-HFP) and MWCNTs/P(VDF-HFP) composite films as a function of the weight percentage of MWCNT filler at room temperature is shown in Figure 11. According to Figure 11(a), a significant increase in dielectric constant was observed with increased MWCNT loading. A high dielectric constant value of 26.2 was recorded at 10 Hz for the MWCNT/P(VDF-HFP) composites with a filler content of 1.00 wt%. This value is approximately 4.76 times larger than that of pure P(VDF-HFP) (ε = 5.5). In Ji’s work [86], a similarly high dielectric constant was observed in TiO₂@MWCNT-PVDF composites, where the dielectric constant reached 15 when only a 5:1 filler ratio was added into the matrix. As previously reported by Shang et al. [87], the improved dielectric constant values stem from the significant blocking of charge carriers at the internal interfaces under an applied electric field, known as the Maxwell-Wagner-Sillars (MWS) effect. It is believed that numerous interfaces exist between the MWCNTs and the P(VDF-HFP) polymer, and a thin insulating layer of semicrystalline P(VDF-HFP) forms around the MWCNTs, creating a nanoscale structure in the polymer nanocomposites when the filler content approaches the percolation threshold. This phenomenon typically occurs in systems composed of two or more constituents with differing electrical properties. The disparity in conductivity and permittivity between these constituents leads to the accumulation of space charge at their interfaces. As a result, the homogeneously dispersed MWCNTs in the polymer matrix behave like nanocapacitors [88,89]. Charge carriers accumulate at the interface between MWCNTs and P(VDF-HFP) when a low AC field is applied to the samples. Additionally, increasing the MWCNT dopant concentration in the polymer matrix intensifies the fraction of electroactive β phase, which leads to an increase in the number of crystalline chains in the composite samples, further contributing to the enhancement of dielectric strength [11]. As a result, the increased dielectric constant at low frequencies can be attributed to various types of polarization, including dipolar, atomic, and electronic polarization [88,90,91]. This confirms the rise in interfacial polarization in highly filled composites. However, as the frequency increases, the dipoles are unable to keep pace with the rapidly changing field, causing a reduction in the dielectric constant. Consequently, the contributions of interfacial, dipolar, atomic, and electronic polarizations diminish, resulting in a lower dielectric constant value [39].
Figure 11(b) illustrates the variation of the loss (tan δ) factor for MWCNTs/P(VDF-HFP) composites as a function of frequency with changing MWCNTs nanofiller concentrations. The loss tan δ factor is related to the energy required to align the dipoles in the direction of the field. The observed tan δ results from various mechanisms, including ionic conduction, interfacial polarization, dipole alignment, atomic polarization, and electronic polarization [92]. The tan δ values increase with higher MWCNT nanofiller content and decrease with increasing applied frequencies, reaching a high value of 0.66 at 10 Hz for the sample with 1.00 wt% MWCNT content. However, the tan δ of all composite samples remains relatively low (<1.00).
This result aligns with other studies where high-conductivity particles were used as fillers to enhance the dielectric constant of composites. Several studies [88,91,93] have reported that the difference in relaxation times between the MWCNTs and P(VDF-HFP) polymer causes charge carriers from the external electrode to migrate and accumulate at the interface when an electric field is applied to the composite film. The large surface-to-volume ratio of MWCNTs provides a greater surface area for interfacial polarization. However, at higher concentrations, MWCNTs may begin to aggregate, leading to poor dispersion in the polymer matrix. This agglomeration creates conductive pathways that can increase dielectric losses due to the formation of capacitive and resistive elements [39]. The larger tan δ observed at higher MWCNTs concentrations may be due to the presence of microporous structures in the P(VDF-HFP) composite films, as mentioned in the SEM section. Furthermore, the dielectric loss was found to decrease rapidly as the frequency increased, which can be attributed to the rapid movement of free charges through the nanocomposites. The combination of high dielectric permittivity and low dielectric loss in this study is among the best reported. While the addition of MWCNTs to the P(VDF-HFP) matrix improves the dielectric constant, controlling the conductive pathways remains a challenge, often leading to higher conductivity values [72].
For practical applications, insulating behavior is a critically important property of dielectric materials. Generally, as MWCNT loading increases, nanocomposites transition from electrically insulative to conductive, with electrical conductivity rising as the weight percent of MWCNTs in the matrix increases [94]. The incorporation of a small amount of MWCNTs into polymer composites can significantly enhance electrical conductivity due to the formation of an effective electrical network. As shown in Figure 11(c), the conductivity increases linearly with both frequency and MWCNT doping concentration in P(VDF-HFP) composite films. At low frequencies, there is a sharp rise in conductivity due to reduced electrode polarization, followed by a frequency-independent plateau region at intermediate frequencies (corresponding to maximal relaxation time), and finally a high-frequency dispersive region due to rapid field reversal. All samples exhibit relatively low conductivity at low frequencies, which may be attributed to the dominant effect of electrode polarization. Interfacial polarization also occurs between the electrode and nanocomposite surface, as well as between grains and other heterogeneous regions within the nanocomposite, at lower frequencies [87,88]. As the MWCNTs content increases, the bulk resistance of the composite decreases, and the conduction process becomes dominated by inter-filler tunneling. The MWCNTs are well-dispersed randomly within the gelatin matrix composite, and in some regions, they may connect, forming a partially continuous random cluster. As a result, charges can move freely between domains, leading to higher conductivity. Among all the samples, the 1.00 wt% MWCNT/P(VDF-HFP) composite exhibited the highest conductivity, reaching 1.14 x 10⁻⁶ S/m at 10 Hz, compared to the pure P(VDF-HFP), which showed a much lower conductivity of about 1.52 x 10⁻⁹ S/m at the same frequency. The increase in MWCNTs percentage significantly contributes to the rise in conductivity. Thus, the MWS interfacial effect and dipolar relaxation modes are the primary reasons for the linear increase in conductivity with increasing frequency. Despite the slightly higher values, the conductivities of the MWCNT/P(VDF-HFP) composite films remain relatively low compared to other reports, indicating excellent insulating behavior. This result, along with the superior dielectric properties mentioned earlier, suggests that the MWCNT/P(VDF-HFP) composite is a promising candidate for high-performance flexible nanodielectric materials.
3.9. Piezoelectric Performance Testing
The influence of MWCNTs on the sensing performance of pristine P(VDF-HFP) and MWCNTs/P(VDF-HFP) composite films with various MWCNT concentrations (0.25%, 0.50%, 0.75%, and 1.00%) was studied by comparing the applied forces of 1.074, 3.232, 6.199, 9.522, and 16.145 N. The sensor voltage measurements under these forces at 1 Hz are shown in Figure 12(a) and 12(b), with different MWCNTs concentrations (F = 16.145 N) and different applied forces (0.75 wt% MWCNT), respectively. Sensor data, including the average peak-to-peak voltage (Vpp), Vmax (~Vpp/2), and corresponding sensitivity values, are measured in Table 5. Sensitivity was calculated using the ratio of Vmax/Force, as shown in Figure 12(c-e). It is evident that sensitivity increases with MWCNTs concentration. At lower MWCNTs concentrations, the sensitivity increase is moderate but noticeable. MWCNTs help create a conductive network within the polymer, enhancing its piezoelectric properties by facilitating charge transfer [95]. Across all force levels, voltage sensitivity increases as the MWCNTs concentration rises, peaking at 0.75 wt%. At this concentration, the output voltage reaches a maximum of 16.58 V, which is 135% higher than the baseline without MWCNTs (Vmax = 7.06 V). This is probably caused by the optimal balance between charge generation and transfer within the MWCNT network. At 0.75 wt%, the composite appeared to form a well-percolated MWCNTs network without significant aggregation, which would otherwise reduce performance.
As noted by Lin et al. [96], when MWCNTs are uniformly dispersed in the polymer matrix, they enhance conductivity, improving the ability to generate and transfer electric charges under mechanical stress. However, beyond a certain concentration, MWCNTs aggregation and increased conductivity can compromise the polymer’s mechanical flexibility, reducing the overall piezoelectric effect. At 1.00 wt%, the sensitivity slightly decreases, possibly due to excessive nanotube clustering, which leads to non-uniform charge distribution and a loss of polymer flexibility, thus reducing piezoelectric responsiveness [97]. For all concentrations, higher applied forces yield greater voltage sensitivity. This occurs because stronger forces cause larger deformations, leading to a greater piezoelectric response [98]. The highest force (16.145 N) results in the greatest sensitivity, particularly for 0.75 wt% MWCNT, which achieves approximately 1.0 V/N. In addition, Figure 12(f) shows the d33 and dielectric constant (at 1 Hz) values for all samples. The d33 value increases with MWCNTs concentration, although at a slower rate than the dielectric constant. In pure P(VDF-HFP), the d33 value is around 5 pC/N, and it gradually rises to approximately 13 pC/N at 1.00 wt% MWCNT. Interestingly, the dielectric constant increases more sharply with rising MWCNT concentration than the d33 value. Adding 1.00 wt% MWCNTs to the P(VDF-HFP) composite film led to an increase in d33 values, despite a decrease in measured sensitivity. This suggests that MWCNTs not only exhibit excellent electrical conductivity but also enhance the polarization of the composite films. Under mechanical stress, MWCNTs may aid in aligning dipoles within the matrix more effectively, contributing to an improved piezoelectric response. The MWCNTs increase the net dipole moment by enhancing local electric fields within the matrix, which probably contributes to a higher piezoelectric coefficient. Additionally, MWCNTs possess high mechanical strength and stiffness, improving the overall stress transfer within the composite material [99]. When mechanical stress is applied, MWCNTs enhance the transfer of stress to the piezoelectric matrix, likely leading to more efficient conversion of mechanical energy into electrical energy, explaining the observed increase in the d33 coefficient.
4. Conclusions
The incorporation of MWCNTs into P(VDF-HFP) polymer films significantly enhances their mechanical, electrical, and piezoelectric properties, primarily due to the increased β-phase content and improved crystalline structure. At 0.75% MWCNT concentration, the composite achieved optimal performance in terms of voltage output and sensitivity, making it a viable material for high-performance piezoelectric sensors. This research highlights the potential of MWCNTs-reinforced P(VDF-HFP) composites in energy harvesting and sensing applications, offering a flexible and efficient alternative to traditional piezoelectric materials. Future work should focus on large-scale production techniques and the optimization of material properties for specific applications.
<b>Acknowledgments</b>
This work (grant no. RGNS 65-169) was financially supported by the Office of the Permanent Secretary, Ministry of Higher Education, Science, Research and Innovation (OPS MHESI), Thailand Science Research and Innovation (TSRI). Additionally, the authors would like to thank Faculty of Science and Technology, Nakhon Si Thammarat Rajabhat University, Faculty of Science and Technology, Princess of Naradhiwas University, Division of Physical Science (Physics), Faculty of Science, Prince of Songkla University and Center of Excellence in Nanotechnology for Energy (CENE), Prince of Songkhla University for instrumental supports.
Statement
During the preparation of this work the authors used ChatGPT in order to check grammar. After using this tool, the authors reviewed and edited the content as needed and take full responsibility for the content of the publication.
Conflicts of Interest
The authors have declared that no competing interests exist.
References
- Zeyrek Ongun, M., et al., Enhancement of piezoelectric energy-harvesting capacity of electrospun β-PVDF nanogenerators by adding GO and rGO. Journal of Materials Science: Materials in Electronics, 2020. 31(3): p. 1960-1968. [CrossRef]
- Yang, D., et al., Formation mechanisms and electrical properties of perovskite mesocrystals. Ceramics International, 2021. 47(2): p. 1479-1512. [CrossRef]
- Zhu, R. and Z. Wang, 9 - Piezoelectric one- to two-dimensional nanomaterials for vibration energy harvesting devices, in Emerging 2D Materials and Devices for the Internet of Things, L. Tao and D. Akinwande, Editors. 2020, Elsevier. p. 221-241.
- Anton, S.R. and M. Safaei, Piezoelectric Energy Harvesting, in Encyclopedia of Smart Materials, A.-G. Olabi, Editor. 2022, Elsevier: Oxford. p. 104-116.
- Messer, D.K., et al., Characterization and calibration of a piezo-energetic composite film as a reactive gauge. Journal of Applied Physics, 2024. 135(14). [CrossRef]
- Maity, K. and D. Mandal, Chapter Seven - Piezoelectric polymers and composites for multifunctional materials, in Advanced Lightweight Multifunctional Materials, P. Costa, C.M. Costa, and S. Lanceros-Mendez, Editors. 2021, Woodhead Publishing. p. 239-282.
- Su, F. and M. Miao, Effect of MWCNT dimension on the electrical percolation and mechanical properties of poly(vinylidenefluoride-hexafluoropropylene) based nanocomposites. Synthetic Metals, 2014. 191: p. 99-103. [CrossRef]
- Shepelin, N.A., et al., New developments in composites, copolymer technologies and processing techniques for flexible fluoropolymer piezoelectric generators for efficient energy harvesting. Energy & Environmental Science, 2019. 12(4): p. 1143-1176. [CrossRef]
- Zhao, Y., et al., Effect of crystalline phase on the dielectric and energy storage properties of poly(vinylidene fluoride). Journal of Materials Science: Materials in Electronics, 2016. 27. [CrossRef]
- Verma, R. and S.K. Rout, Influence of annealing temperature on the existence of polar domain in uniaxially stretched polyvinylidene-co-hexafluoropropylene for energy harvesting applications. Journal of Applied Physics, 2020. 128(23). [CrossRef]
- Roy, S., et al., Enhanced electroactive β-phase nucleation and dielectric properties of PVdF-HFP thin films influenced by montmorillonite and Ni(OH)2 nanoparticle modified montmorillonite. RSC Advances, 2016. 6(26): p. 21881-21894. [CrossRef]
- Mishra, S., et al., Effect of multi-step processing on the structural, morphological and dielectric behaviour of PVDF films. Ionics, 2020. 26(12): p. 6069-6081. [CrossRef]
- Yasar, M., et al., β Phase Optimization of Solvent Cast PVDF as a Function of the Processing Method and Additive Content. ACS Omega, 2024. 9(24): p. 26020-26029. [CrossRef]
- Wang, Y., et al., Effects of stretching on phase transformation of PVDF and its copolymers: A review. 2023. 21(1). [CrossRef]
- Mahadeva, S.K., et al., Effect of poling time and grid voltage on phase transition and piezoelectricity of poly(vinyledene fluoride) thin films using corona poling. Journal of Physics D: Applied Physics, 2013. 46(28): p. 285305. [CrossRef]
- Salama, M., et al., Boosting piezoelectric properties of PVDF nanofibers via embedded graphene oxide nanosheets. Scientific Reports, 2024. 14(1): p. 16484. [CrossRef]
- Al-Abduljabbar, A. and I. Farooq Electrospun Polymer Nanofibers: Processing, Properties, and Applications. Polymers, 2023. 15. [CrossRef]
- Li, Y., et al., Enhanced piezoelectric performance of multi-layered flexible polyvinylidene fluoride–BaTiO3–rGO films for monitoring human body motions. Journal of Materials Science: Materials in Electronics, 2022. 33(7): p. 4291-4304.
- Ezquerra, T., et al., On the electrical conductivity of PVDF composites with different carbon-based nanoadditives. Colloid and Polymer Science, 2014. 292: p. 1989-1998. [CrossRef]
- Rehwoldt, M.C., et al., High-Temperature Interactions of Metal Oxides and a PVDF Binder. ACS Applied Materials & Interfaces, 2022. 14(7): p. 8938-8946. [CrossRef]
- Eggedi, O., et al., Nanoindentation and thermal characterization of poly (vinylidenefluoride)/MWCNT nanocomposites. AIP Advances, 2014. 4(4).
- Liu, X., et al., Ultra-long MWCNTs highly oriented in electrospun PVDF/MWCNT composite nanofibers with enhanced β phase. RSC Advances, 2016. 6(108): p. 106690-106696. [CrossRef]
- Al-Harthi, M.A. and M. Hussain Effect of the Surface Functionalization of Graphene and MWCNT on the Thermodynamic, Mechanical and Electrical Properties of the Graphene/MWCNT-PVDF Nanocomposites. Polymers, 2022. 14. [CrossRef]
- Begum, S., et al., Investigation of morphology, crystallinity, thermal stability, piezoelectricity and conductivity of PVDF nanocomposites reinforced with epoxy functionalized MWCNTs. Composites Science and Technology, 2021. 211: p. 108841. [CrossRef]
- Xinya, W., et al., Fabrication and properties of PVDF and PVDF-HFP microfiltration membranes. Journal of Applied Polymer Science, 2018. 135: p. 46711.
- Zaszczyńska, A., et al. Enhanced Electroactive Phases of Poly(vinylidene Fluoride) Fibers for Tissue Engineering Applications. International Journal of Molecular Sciences, 2024. 25. [CrossRef]
- Sharafkhani, S. and M. Kokabi, High performance flexible actuator: PVDF nanofibers incorporated with axially aligned carbon nanotubes. Composites Part B: Engineering, 2021. 222: p. 109060. [CrossRef]
- Jin, L., et al., Enhancement of β-Phase Crystal Content of Poly(vinylidene fluoride) Nanofiber Web by Graphene and Electrospinning Parameters. Chinese Journal of Polymer Science, 2020. 38(11): p. 1239-1247. [CrossRef]
- Garain, S., et al., Design of In Situ Poled Ce3+-Doped Electrospun PVDF/Graphene Composite Nanofibers for Fabrication of Nanopressure Sensor and Ultrasensitive Acoustic Nanogenerator. ACS Applied Materials & Interfaces, 2016. 8(7): p. 4532-4540 4532-4540. [CrossRef]
- Vicente, J., et al. Electromechanical Properties of PVDF-Based Polymers Reinforced with Nanocarbonaceous Fillers for Pressure Sensing Applications. Materials, 2019. 12. [CrossRef]
- Li, H. and S. Lim, Boosting Performance of Self-Polarized Fully Printed Piezoelectric Nanogenerators via Modulated Strength of Hydrogen Bonding Interactions. Nanomaterials (Basel), 2021. 11(8). [CrossRef]
- González-Benito, J., et al., PVDF based nanocomposites produced by solution blow spinning, structure and morphology induced by the presence of MWCNT and their consequences on some properties. Colloid and Polymer Science, 2019. 297(7): p. 1105-1118. [CrossRef]
- Zhou, J., et al. Significantly Suppressed Dielectric Loss and Enhanced Breakdown Strength in Core@Shell Structured Ni@TiO2/PVDF Composites. Nanomaterials, 2023. 13. [CrossRef]
- Prabakaran, K., et al., Aligned carbon nanotube/polymer hybrid electrolytes for high performance dye sensitized solar cell applications. RSC Advances, 2015. 5(82): p. 66563-66574. [CrossRef]
- Wan, C. and C.R. Bowen, Multiscale-structuring of polyvinylidene fluoride for energy harvesting: the impact of molecular-, micro- and macro-structure. Journal of Materials Chemistry A, 2017. 5(7): p. 3091-3128. [CrossRef]
- Tang, Y., et al., A review on microporous polyvinylidene fluoride membranes fabricated via thermally induced phase separation for MF/UF application. Journal of Membrane Science, 2021. 639: p. 119759. [CrossRef]
- Cheng, L.-P., Effect of Temperature on the Formation of Microporous PVDF Membranes by Precipitation from 1-Octanol/DMF/PVDF and Water/DMF/PVDF Systems. Macromolecules, 1999. 32(20): p. 6668-6674. [CrossRef]
- Peng, L., et al., Preparation of NaCl Particles Added Polyvinylidene Fluoride Microporous Filter and a Simple Filtration Device. Coatings, 2024. 14(2): p. 196. [CrossRef]
- Sharma, S., et al., Investigations on dielectric and mechanical properties of poly(vinylidene fluoride-hexafluoropropylene) (PVDF-HFP)/single-walled carbon nanotube composites. Journal of Nanoparticle Research, 2023. 25(12): p. 246.
- Chae, J., et al., Modification of the Surface Morphology and Properties of Graphene Oxide and Multi-Walled Carbon Nanotube-Based Polyvinylidene Fluoride Membranes According to Changes in Non-Solvent Temperature. Nanomaterials, 2021. 11(9): p. 2269. Nanomaterials, 2021. 11(9): p. 2269. [CrossRef]
- Croll, S.G., Surface roughness profile and its effect on coating adhesion and corrosion protection: A review. Progress in Organic Coatings, 2020. 148: p. 105847. [CrossRef]
- Amrutha, B., A. Anand Prabu, and M. Pathak, Enhancing piezoelectric effect of PVDF electrospun fiber through NiO nanoparticles for wearable applications. Heliyon, 2024. 10(7): p. e29192. [CrossRef]
- Mapunda, E.C., B.B. Mamba, and T.A.M. Msagati, Carbon nanotube embedded PVDF membranes: Effect of solvent composition on the structural morphology for membrane distillation. Physics and Chemistry of the Earth, Parts A/B/C, 2017. 100: p. 135-142. [CrossRef]
- Chen, T., A. Soroush, and M.S. Rahaman, Highly Hydrophobic Electrospun Reduced Graphene Oxide/Poly(vinylidene fluoride-co-hexafluoropropylene) Membranes for Use in Membrane Distillation. Industrial & Engineering Chemistry Research, 2018. 57(43): p. 14535-1454314535-14543. [CrossRef]
- Chen, F., et al., Table Salt as a Template to Prepare Reusable Porous PVDF–MWCNT Foam for Separation of Immiscible Oils/Organic Solvents and Corrosive Aqueous Solutions. Advanced Functional Materials, 2017. 27(41): p. 1702926. [CrossRef]
- Liu, B., et al., Soft wetting: Modified Cassie-Baxter equation for soft superhydrophobic surfaces. Colloids and Surfaces A: Physicochemical and Engineering Aspects, 2023. 677: p. 132348. [CrossRef]
- Cai, X., et al., A critical analysis of the α, β and γ phases in poly(vinylidene fluoride) using FTIR. RSC Advances, 2017. 7(25): p. 15382-15389.
- Shalu, V.K. Singh, and R.K. Singh, Development of ion conducting polymer gel electrolyte membranes based on polymer PVdF-HFP, BMIMTFSI ionic liquid and the Li-salt with improved electrical, thermal and structural properties. Journal of Materials Chemistry C, 2015. 3(28): p. 7305-7318. [CrossRef]
- Ke, K., et al., Achieving β-phase poly(vinylidene fluoride) from melt cooling: Effect of surface functionalized carbon nanotubes. Polymer, 2014. 55(2): p. 611-619. [CrossRef]
- Kim, S., Y. Song, and M.J. Heller, Influence of MWCNTs on β-Phase PVDF and Triboelectric Properties. Journal of Nanomaterials, 2017. 2017(1): p. 2697382. [CrossRef]
- Barrau, S., et al., Nanoscale Investigations of α- and γ-Crystal Phases in PVDF-Based Nanocomposites. ACS Applied Materials & Interfaces, 2018. 10(15): p. 13092-13099. [CrossRef]
- Chan, K.-Y., et al., Formation of Porous Structures and Crystalline Phases in Poly(vinylidene fluoride) Membranes Prepared with Nonsolvent-Induced Phase Separation—Roles of Solvent Polarity. Polymers, 2023. 15(5): p. 1314. [CrossRef]
- Abdullah, I.Y., et al., Facile formation of [beta] poly (vinylidene fluoride) films using the short time annealing process. Advances in Environmental Biology, 2015. 9: p. 20+.
- Tohluebaji, N., et al., Improved Electroactive β Phase Nucleation and Dielectric Properties of P(VDF-HFP) Composite with Al(NO3)3·9H2O Fillers. Integrated Ferroelectrics, 2022. 224(1): p. 181-191.
- Gregorio Jr., R., Determination of the α, β, and γ crystalline phases of poly(vinylidene fluoride) films prepared at different conditions. Journal of Applied Polymer Science, 2006. 100(4): p. 3272-3279.
- Eun, J.H., et al., Effect of MWCNT content on the mechanical and piezoelectric properties of PVDF nanofibers. Materials & Design, 2021. 206: p. 109785. [CrossRef]
- Li, J., et al., Influence of crystalline properties on the dielectric and energy storage properties of poly(vinylidene fluoride). Journal of Applied Polymer Science, 2011. 122(3): p. 1659-1668. [CrossRef]
- Salman, S.A., F.T.M. Noori, and A.K. Mohammed. Preparation and Characterizations of Poly ( vinylidene fluoride ) ( PVDF ) / Ba 0 . 6 Sr 0 . 4 TiO 3 ( BST ) Nanocomposites. 2018.
- Singh, P., et al., Ferroelectric polymer-ceramic composite thick films for energy storage applications. AIP Advances, 2014. 4(8). [CrossRef]
- Yu, Y., et al., Investigation of morphology and dielectric properties of PVDF composite films reinforced with MWCNT@PDA core–shell nanorods. Journal of Materials Science: Materials in Electronics, 2022. 33: p. 6842 - 6855. [CrossRef]
- Ponnamma, D., et al., Stretchable quaternary phasic PVDF-HFP nanocomposite films containing graphene-titania-SrTiO3 for mechanical energy harvesting. Emergent Materials, 2018. 1(1): p. 55-65. [CrossRef]
- Che, B.D., et al., The impact of different multi-walled carbon nanotubes on the X-band microwave absorption of their epoxy nanocomposites. Chem Cent J, 2015. 9: p. 10. [CrossRef]
- Banerjee, J., et al., Carbon nanotubes interaction with amorphous and semi-crystalline domains of polypropylene in melt-mixed composites: Influence of multiwall carbon nanotubes agglomerate and their modifications. SPE Polymers, 2021. 2(4): p. 257-275. [CrossRef]
- Sezer, N. and M. Koç, A comprehensive review on the state-of-the-art of piezoelectric energy harvesting. Nano Energy, 2021. 80: p. 105567. [CrossRef]
- Zhang, X., et al., Fabrication of MWCNT and phenolic epoxy resin reinforced PVDF: a composite with low dielectric loss and excellent mechanical properties. Journal of Macromolecular Science, Part A, 2021. 58(7): p. 482-491.
- Nady, N., N. Salem, and S.H. Kandil Preparation and Characterization of a Novel Poly(vinylidene fluoride-co-hexafluoropropylene)/Poly(ethersulfone) Blend Membrane Fabricated Using an Innovative Method of Mixing Electrospinning and Phase Inversion. Polymers, 2021. 13. [CrossRef]
- Mendes, S.F., et al., Effect of filler size and concentration on the structure and properties of poly(vinylidene fluoride)/BaTiO3 nanocomposites. Journal of Materials Science, 2012. 47(3): p. 1378-1388.
- Botelho, G., et al., Relationship between processing conditions, defects and thermal degradation of poly(vinylidene fluoride) in the β-phase. Journal of Non-Crystalline Solids, 2008. 354(1): p. 72-78.
- de Jesus Silva, A.J., et al., Kinetics of thermal degradation and lifetime study of poly(vinylidene fluoride) (PVDF) subjected to bioethanol fuel accelerated aging. Heliyon, 2020. 6(7): p. e04573. [CrossRef]
- Polat, K., Energy harvesting from a thin polymeric film based on PVDF-HFP and PMMA blend. Applied Physics A, 2020. 126(7): p. 497. [CrossRef]
- Abutaleb, A., S. Hussain, and M. Imran, Systematic exploration of electrospun polyvinylidene fluoride (PVDF)/multi-walled carbon nanotubes’ (MWCNTs) composite nanofibres for humidity sensing application. Journal of Taibah University for Science, 2021. 15(1): p. 257-266. [CrossRef]
- Yang, K., et al., Fluoro-polymer functionalized graphene for flexible ferroelectric polymer-based high-k nanocomposites with suppressed dielectric loss and low percolation threshold. Nanoscale, 2014. 6(24): p. 14740-14753. [CrossRef]
- Al-Harthi, M.A. and M. Hussain, Effect of the Surface Functionalization of Graphene and MWCNT on the Thermodynamic, Mechanical and Electrical Properties of the Graphene/MWCNT-PVDF Nanocomposites. Polymers, 2022. 14(15): p. 297. [CrossRef]
- Zhang, Y., et al., Hydrophilicity, pore structure and mechanical performance of CNT/PVDF materials affected by carboxyl contents in multi-walled carbon nanotubes. IOP Conference Series: Materials Science and Engineering, 2018. 284(1): p. 012009.
- Indriyati, et al., Nanocomposites of polyvinylidene fluoride copolymer-functionalized carbon nanotubes prepared by electrospinning method. IOP Conference Series: Earth and Environmental Science, 2020. 483(1): p. 012045.
- Ellingford, C., et al., Electrical dual-percolation in MWCNTs/SBS/PVDF based thermoplastic elastomer (TPE) composites and the effect of mechanical stretching. European Polymer Journal, 2019. 112: p. 504-514. [CrossRef]
- Yuennan, J., et al., Enhanced electroactive β-phase and dielectric properties in P(VDF-HFP) composite flexible films through doping with three calcium chloride salts: CaCl, CaCl·2HO, and CaCl·6HO. Polymers for Advanced Technologies, 2024. 35(6): p. e6437.
- Yang, J., et al., Realizing the full nanofiller enhancement in melt-spun fibers of poly(vinylidene fluoride)/carbon nanotube composites. Nanotechnology, 2011. 22(35): p. 355707.
- Kong, F., M. Chang, and Z. Wang, Comprehensive Analysis of Mechanical Properties of CB/SiO(2)/PVDF Composites. Polymers (Basel), 2020. 12(1).
- Khade, V. and M. Wuppulluri, Microwave Absorption Performance of Flexible Porous PVDF-MWCNT Foam in the X-Band Frequency Range. ACS Omega, 2024. 9(33): p. 35364-35373. [CrossRef]
- Taha, T.A.M., et al., Structure–Property Relationships in PVDF/SrTiO3/CNT Nanocomposites for Optoelectronic and Solar Cell Applications. Polymers, 2024. 16(6): p. 73.
- Khannam, M., et al., Enhanced conversion efficiency of quasi solid state dye sensitized solar cells based on functionalized multi-walled carbon nanotubes incorporated TiO2 photoanode. Journal of Materials Science: Materials in Electronics, 2016. 27(10): p. 10010-10019. [CrossRef]
- Larosa, C., et al., Preparation and characterization of polycarbonate/multiwalled carbon nanotube nanocomposites. Beilstein Journal of Nanotechnology, 2017. 8: p. 2026-2031. [CrossRef]
- Madivalappa, S., et al., Insights and perspectives on PVDF/MgO NCs films: Structural, optical and dielectric properties. Results in Chemistry, 2024: p. 101764. [CrossRef]
- Devi, P.I. and K. Ramachandran, Dielectric studies on hybridised PVDF–ZnO nanocomposites. Journal of Experimental Nanoscience, 2011. 6(3): p. 281-293. [CrossRef]
- Ji, W., et al., The enhancement in dielectric properties for PVDF based composites due to the incorporation of 2D TiO2 nanobelt containing small amount of MWCNTs. Composites Part A: Applied Science and Manufacturing, 2021. 149: p. 106493. [CrossRef]
- Shang, S., et al., Enhancement of dielectric permittivity in carbon nanotube/polyvinylidene fluoride composites by constructing of segregated structure. Composites Communications, 2021. 25: p. 100745. [CrossRef]
- Alam, R.B., M.H. Ahmad, and M.R. Islam, Effect of MWCNT nanofiller on the dielectric performance of bio-inspired gelatin based nanocomposites. RSC Advances, 2022. 12(23): p. 14686-14697. [CrossRef]
- Shehzad, K., et al., Effects of carbon nanotubes aspect ratio on the qualitative and quantitative aspects of frequency response of electrical conductivity and dielectric permittivity in the carbon nanotube/polymer composites. Carbon, 2013. 54: p. 105-112. [CrossRef]
- Laxmayyaguddi, Y., et al., Modified Thermal, Dielectric, and Electrical Conductivity of PVDF-HFP/LiClO4 Polymer Electrolyte Films by 8 MeV Electron Beam Irradiation. ACS Omega, 2018. 3(10): p. 14188-14200.
- Sadiq, M., et al., Enhancement of Electrochemical Stability Window and Electrical Properties of CNT-Based PVA–PEG Polymer Blend Composites. ACS Omega, 2022. 7(44): p. 40116-40131. [CrossRef]
- Qin, M., L. Zhang, and H. Wu, Dielectric Loss Mechanism in Electromagnetic Wave Absorbing Materials. Advanced Science, 2022. 9(10): p. 2105553. [CrossRef]
- Chatterjee, A., et al., Nanofiller-Induced Enhancement of PVDF Electroactivity for Improved Sensing Performance. Advanced Sensor Research, 2023. 2(6): p. 2200080. [CrossRef]
- Hu, G., et al., Low percolation thresholds of electrical conductivity and rheology in poly(ethylene terephthalate) through the networks of multi-walled carbon nanotubes. Polymer, 2006. 47(1): p. 480-488. [CrossRef]
- Zhao, C., et al., Coaxially aligned MWCNTs improve performance of electrospun P(VDF-TrFE)-based fibrous membrane applied in wearable piezoelectric nanogenerator. Composites Part B: Engineering, 2019. 178: p. 107447. [CrossRef]
- Lin, X., et al., Wearable Piezoelectric Films Based on MWCNT-BaTiO3/PVDF Composites for Energy Harvesting, Sensing, and Localization. ACS Applied Nano Materials, 2023. 6(13): p. 11955-11965.
- Bhadwal, N., R. Ben Mrad, and K. Behdinan Review of Piezoelectric Properties and Power Output of PVDF and Copolymer-Based Piezoelectric Nanogenerators. Nanomaterials, 2023. 13. [CrossRef]
- Chen, J., et al., Enhancing piezoelectric properties of PVDF-HFP composite nanofibers with cellulose nanocrystals. Materials Today Communications, 2024. 39: p. 108872. [CrossRef]
- Sharafkhani, S. and M. Kokabi, Enhanced sensing performance of polyvinylidene fluoride nanofibers containing preferred oriented carbon nanotubes. Advanced Composites and Hybrid Materials, 2022. 5(4): p. 3081-3093. [CrossRef]
Figure 1.
(a) MWCNTs/P(VDF-HFP) composite film preparation, (b) three different phase structure of P(VDF-HFP) and (c) piezoelectric response measurement.
Figure 1.
(a) MWCNTs/P(VDF-HFP) composite film preparation, (b) three different phase structure of P(VDF-HFP) and (c) piezoelectric response measurement.
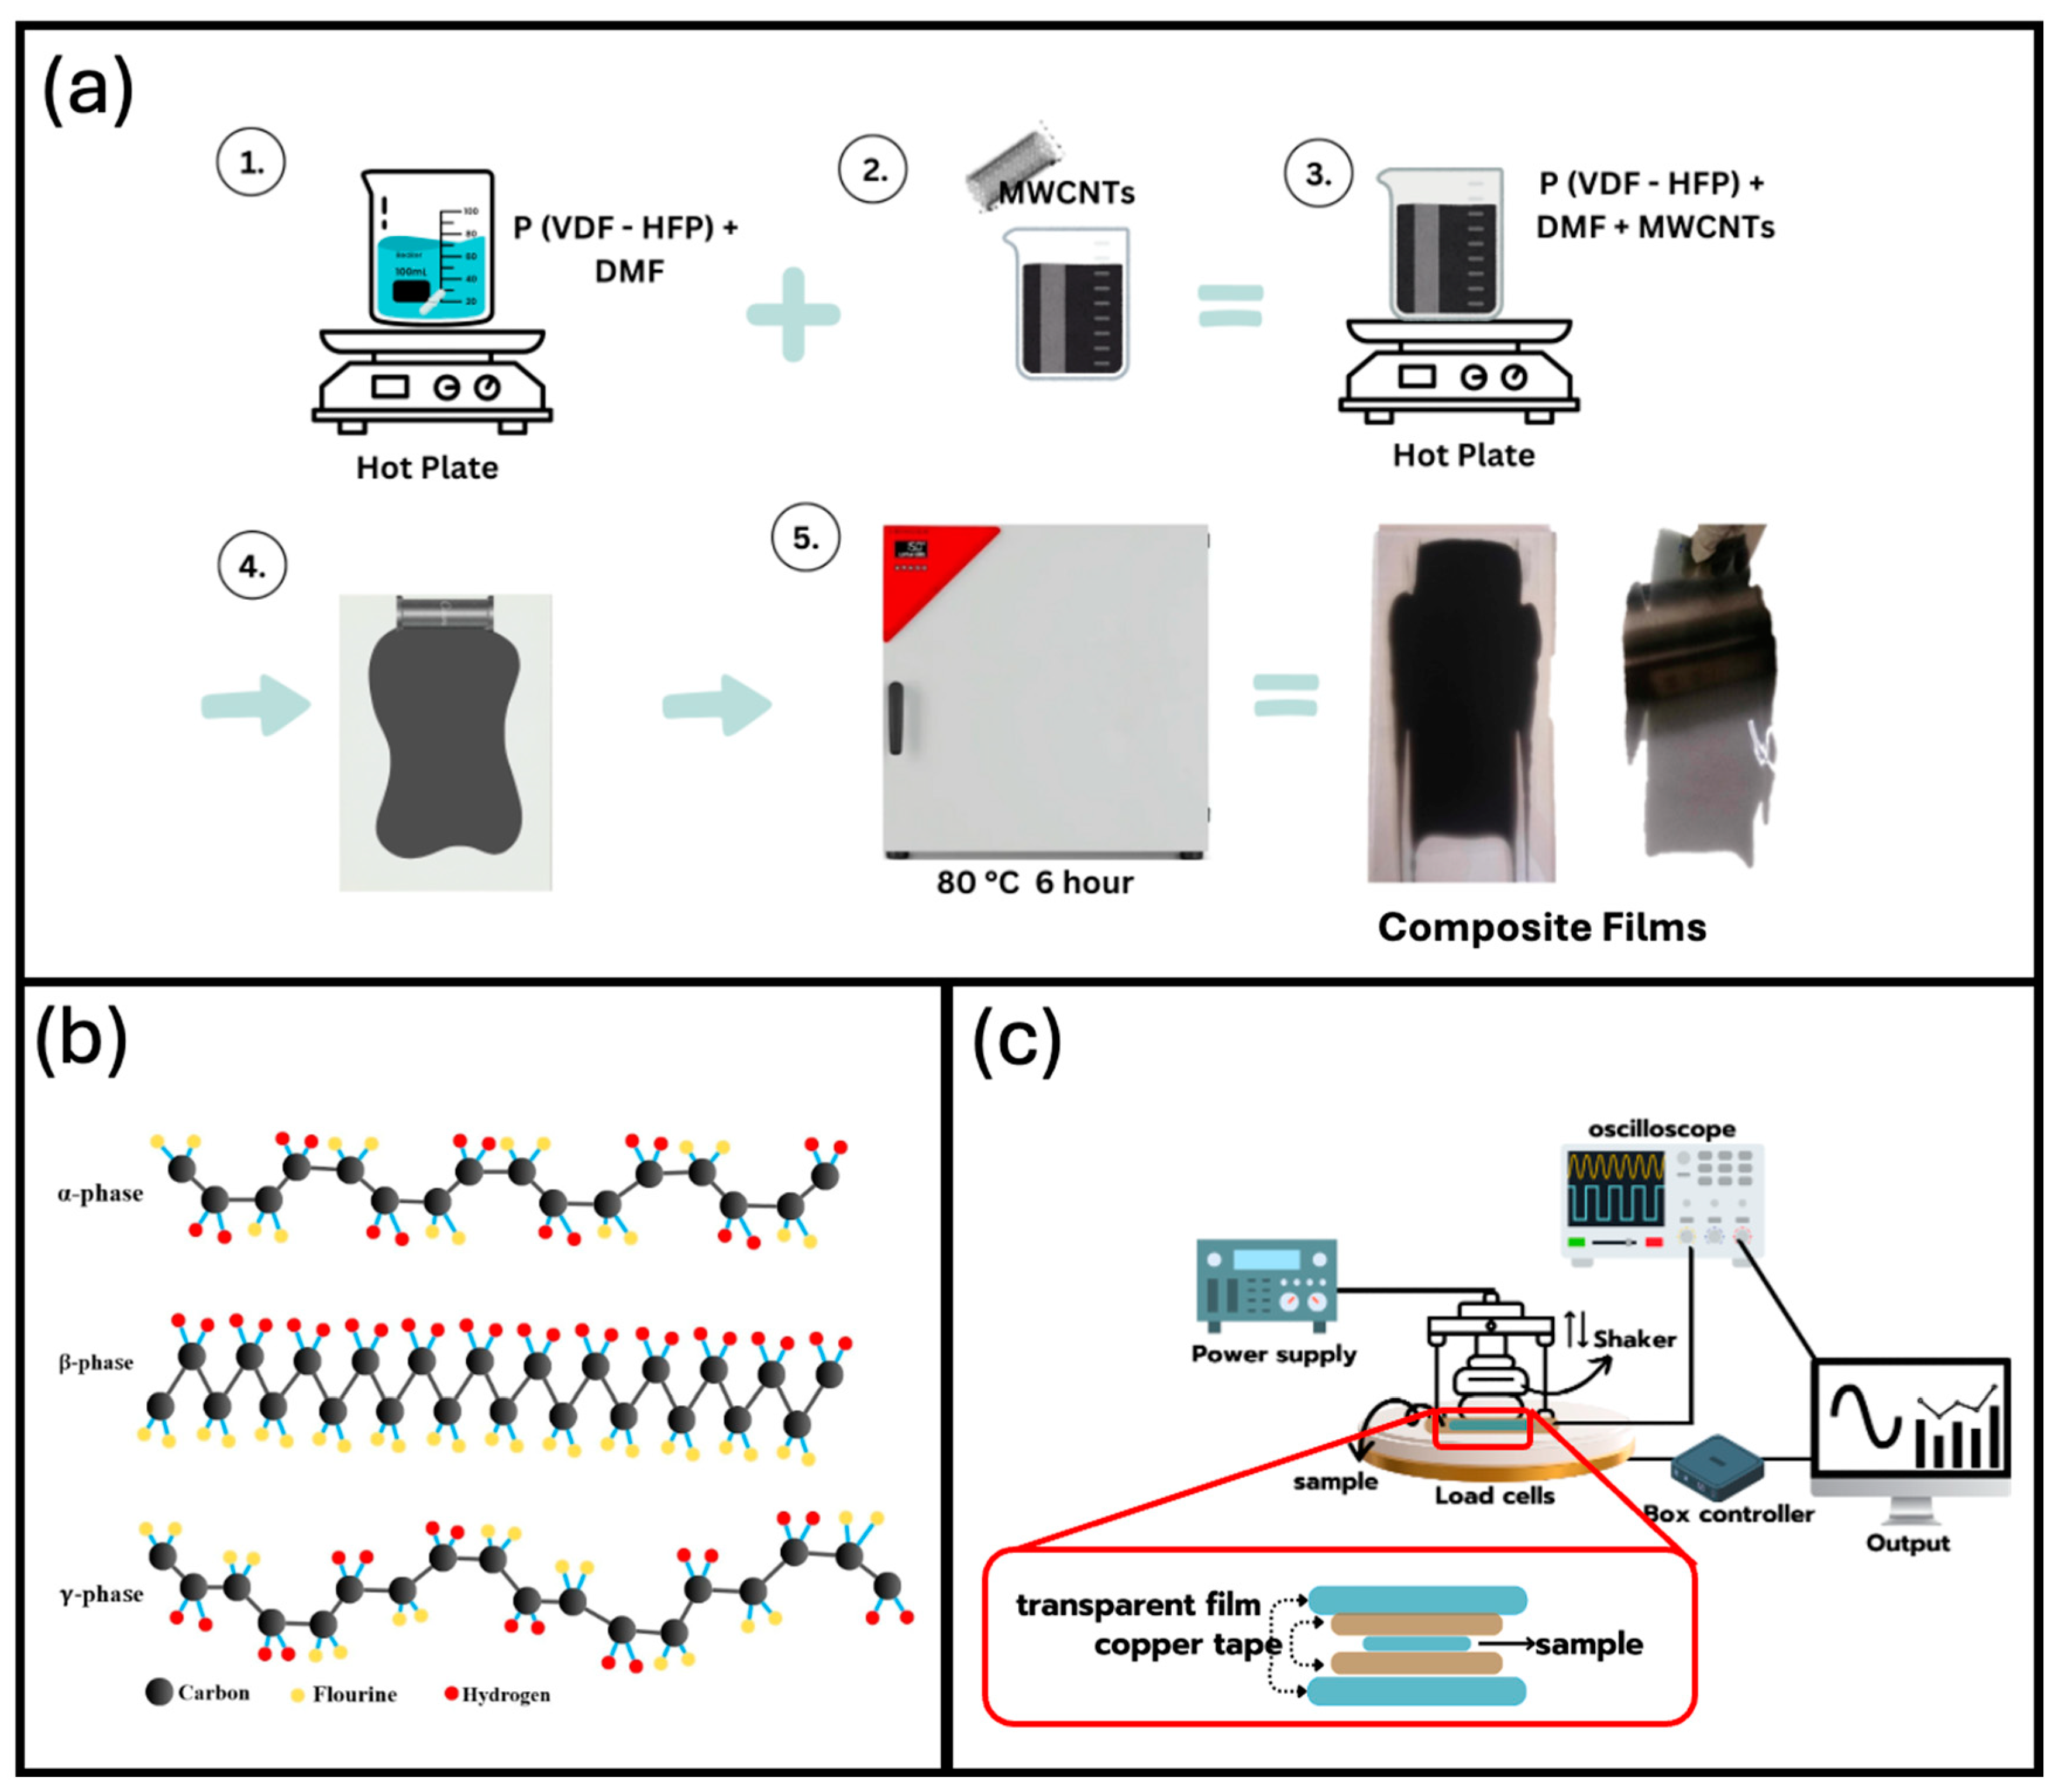
Figure 2.
SEM morphology of pristine P(VDF-HFP) and MWCNTs/P(VDF-HFP) composite films, with various concentrations of MWCNTs; 0.25%, 0.50%, 0.75% and 1.00%.
Figure 2.
SEM morphology of pristine P(VDF-HFP) and MWCNTs/P(VDF-HFP) composite films, with various concentrations of MWCNTs; 0.25%, 0.50%, 0.75% and 1.00%.
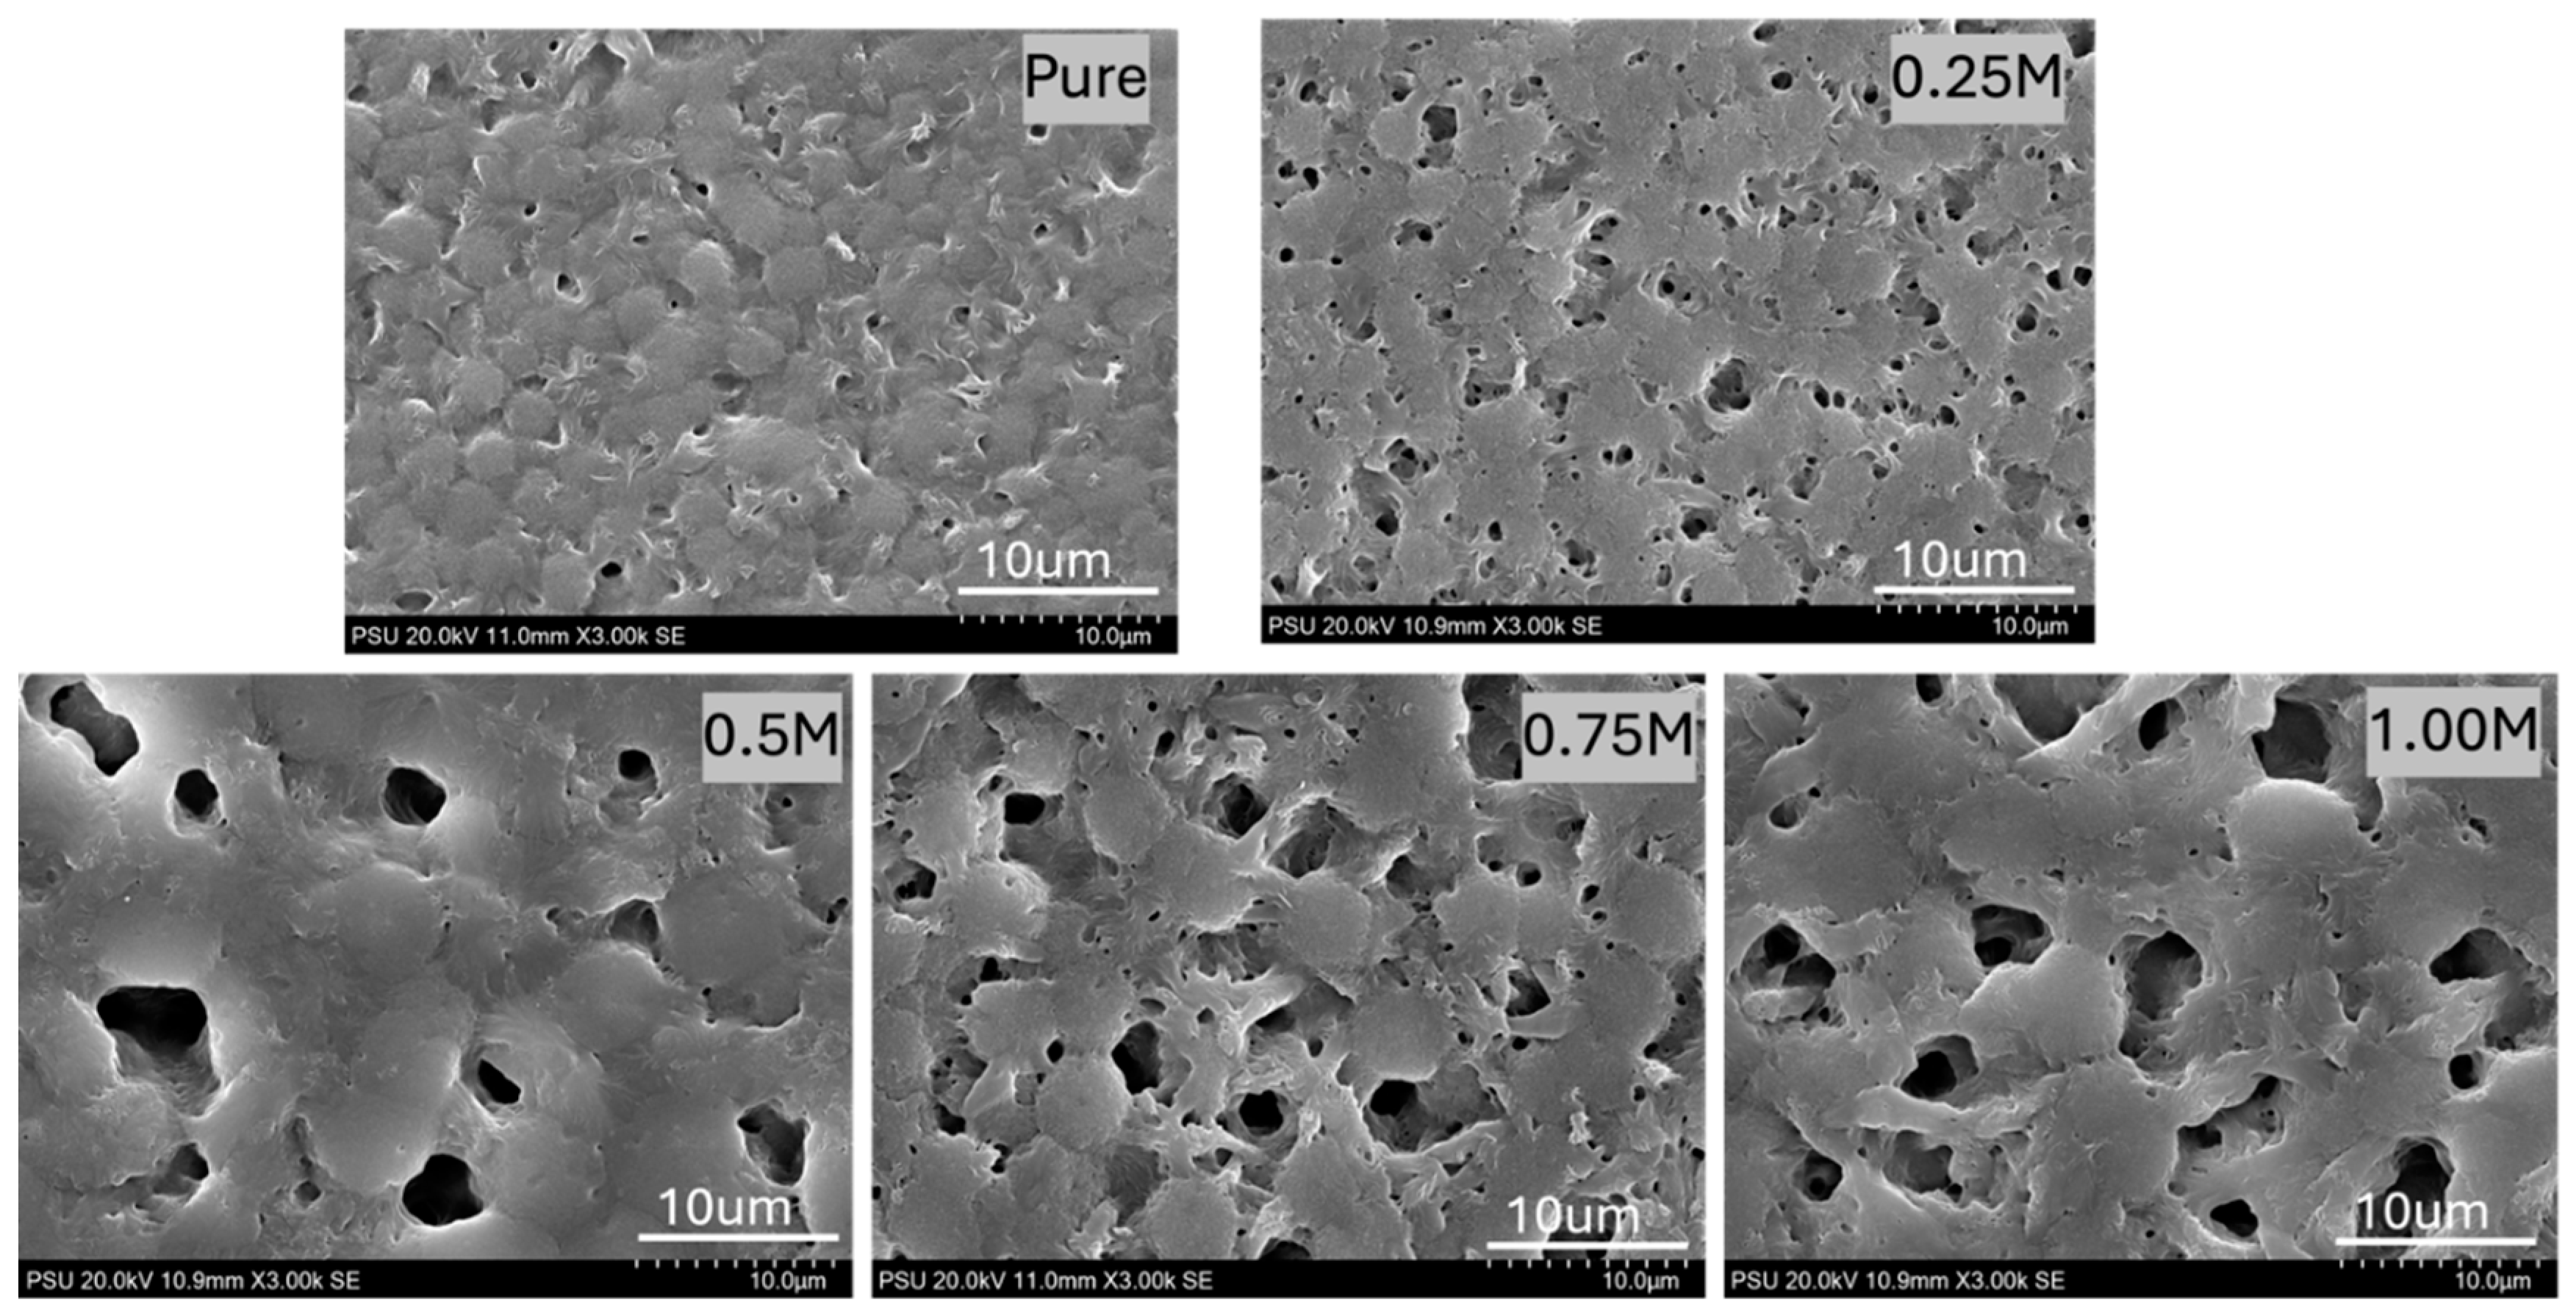
Figure 3.
AFM images of pristine P(VDF-HFP) and MWCNT/P(VDF-HFP) composite films, with various concentrations of MWCNT; 0.25%, 0.50%, 0.75% and 1.00%.
Figure 3.
AFM images of pristine P(VDF-HFP) and MWCNT/P(VDF-HFP) composite films, with various concentrations of MWCNT; 0.25%, 0.50%, 0.75% and 1.00%.
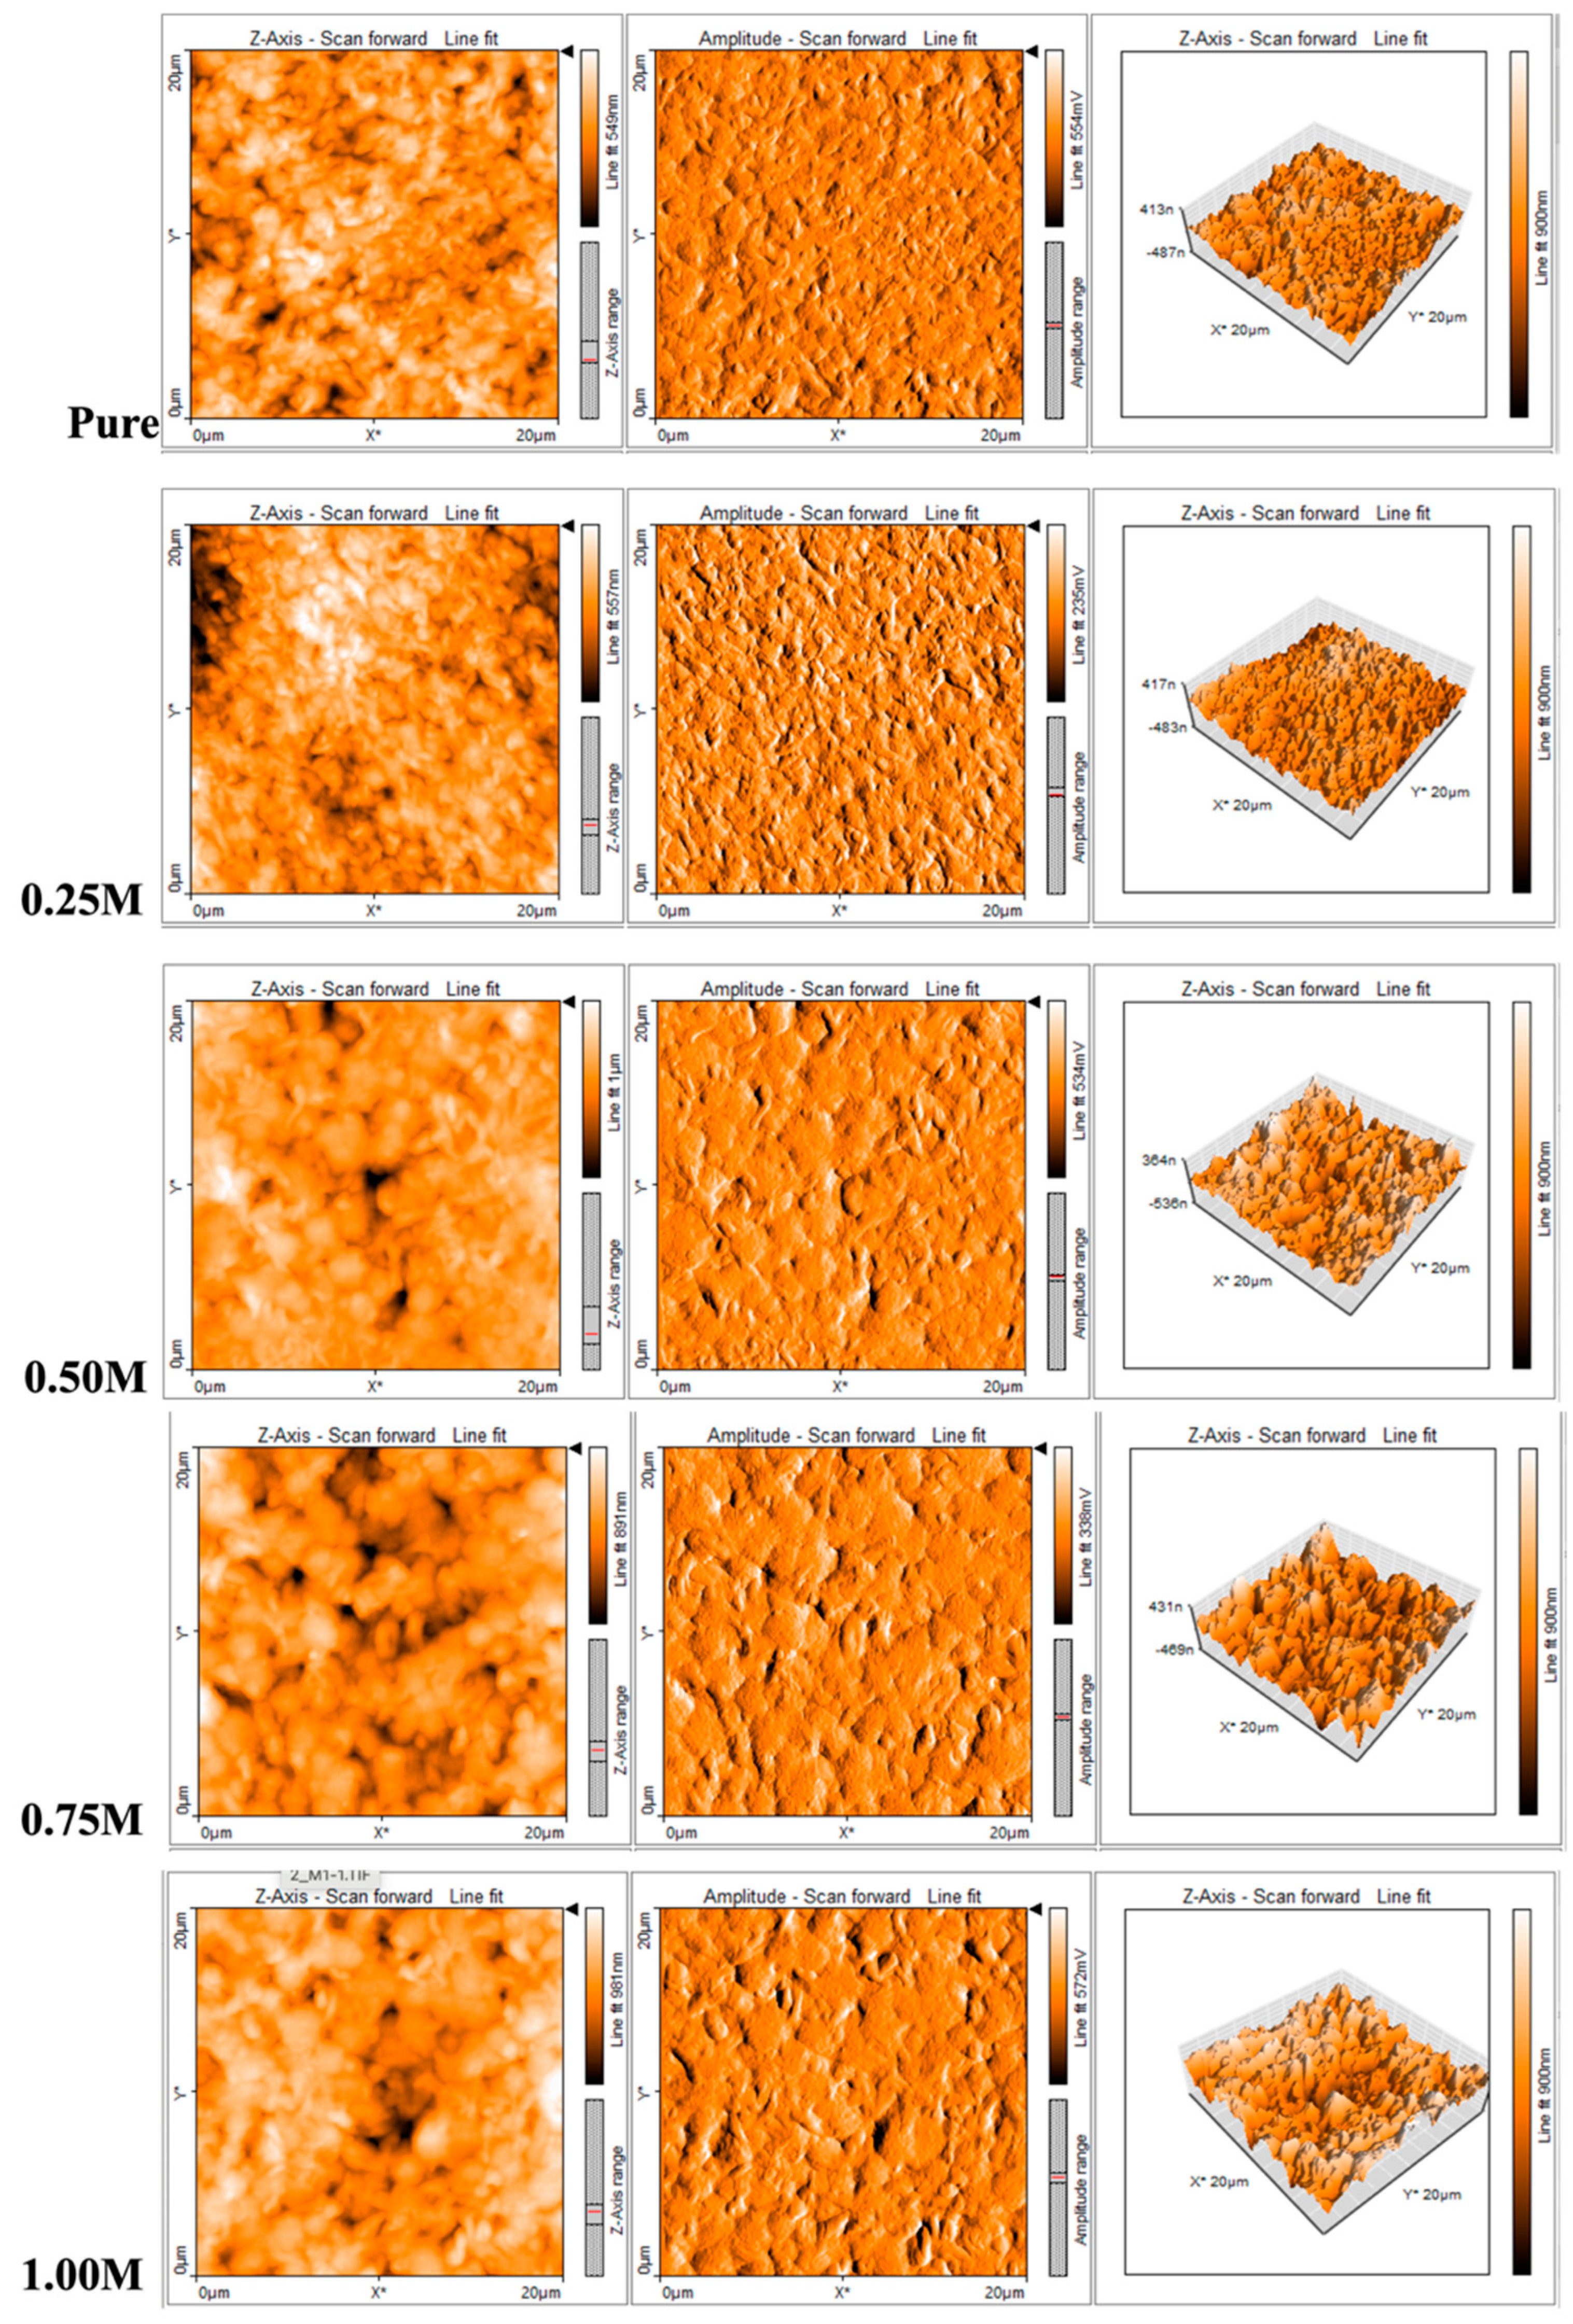
Figure 4.
WCA results of pristine P(VDF-HFP) and MWCNT/P(VDF-HFP) composite films, with various concentrations of MWCNT; 0.25%, 0.50%, 0.75% and 1.00%.
Figure 4.
WCA results of pristine P(VDF-HFP) and MWCNT/P(VDF-HFP) composite films, with various concentrations of MWCNT; 0.25%, 0.50%, 0.75% and 1.00%.
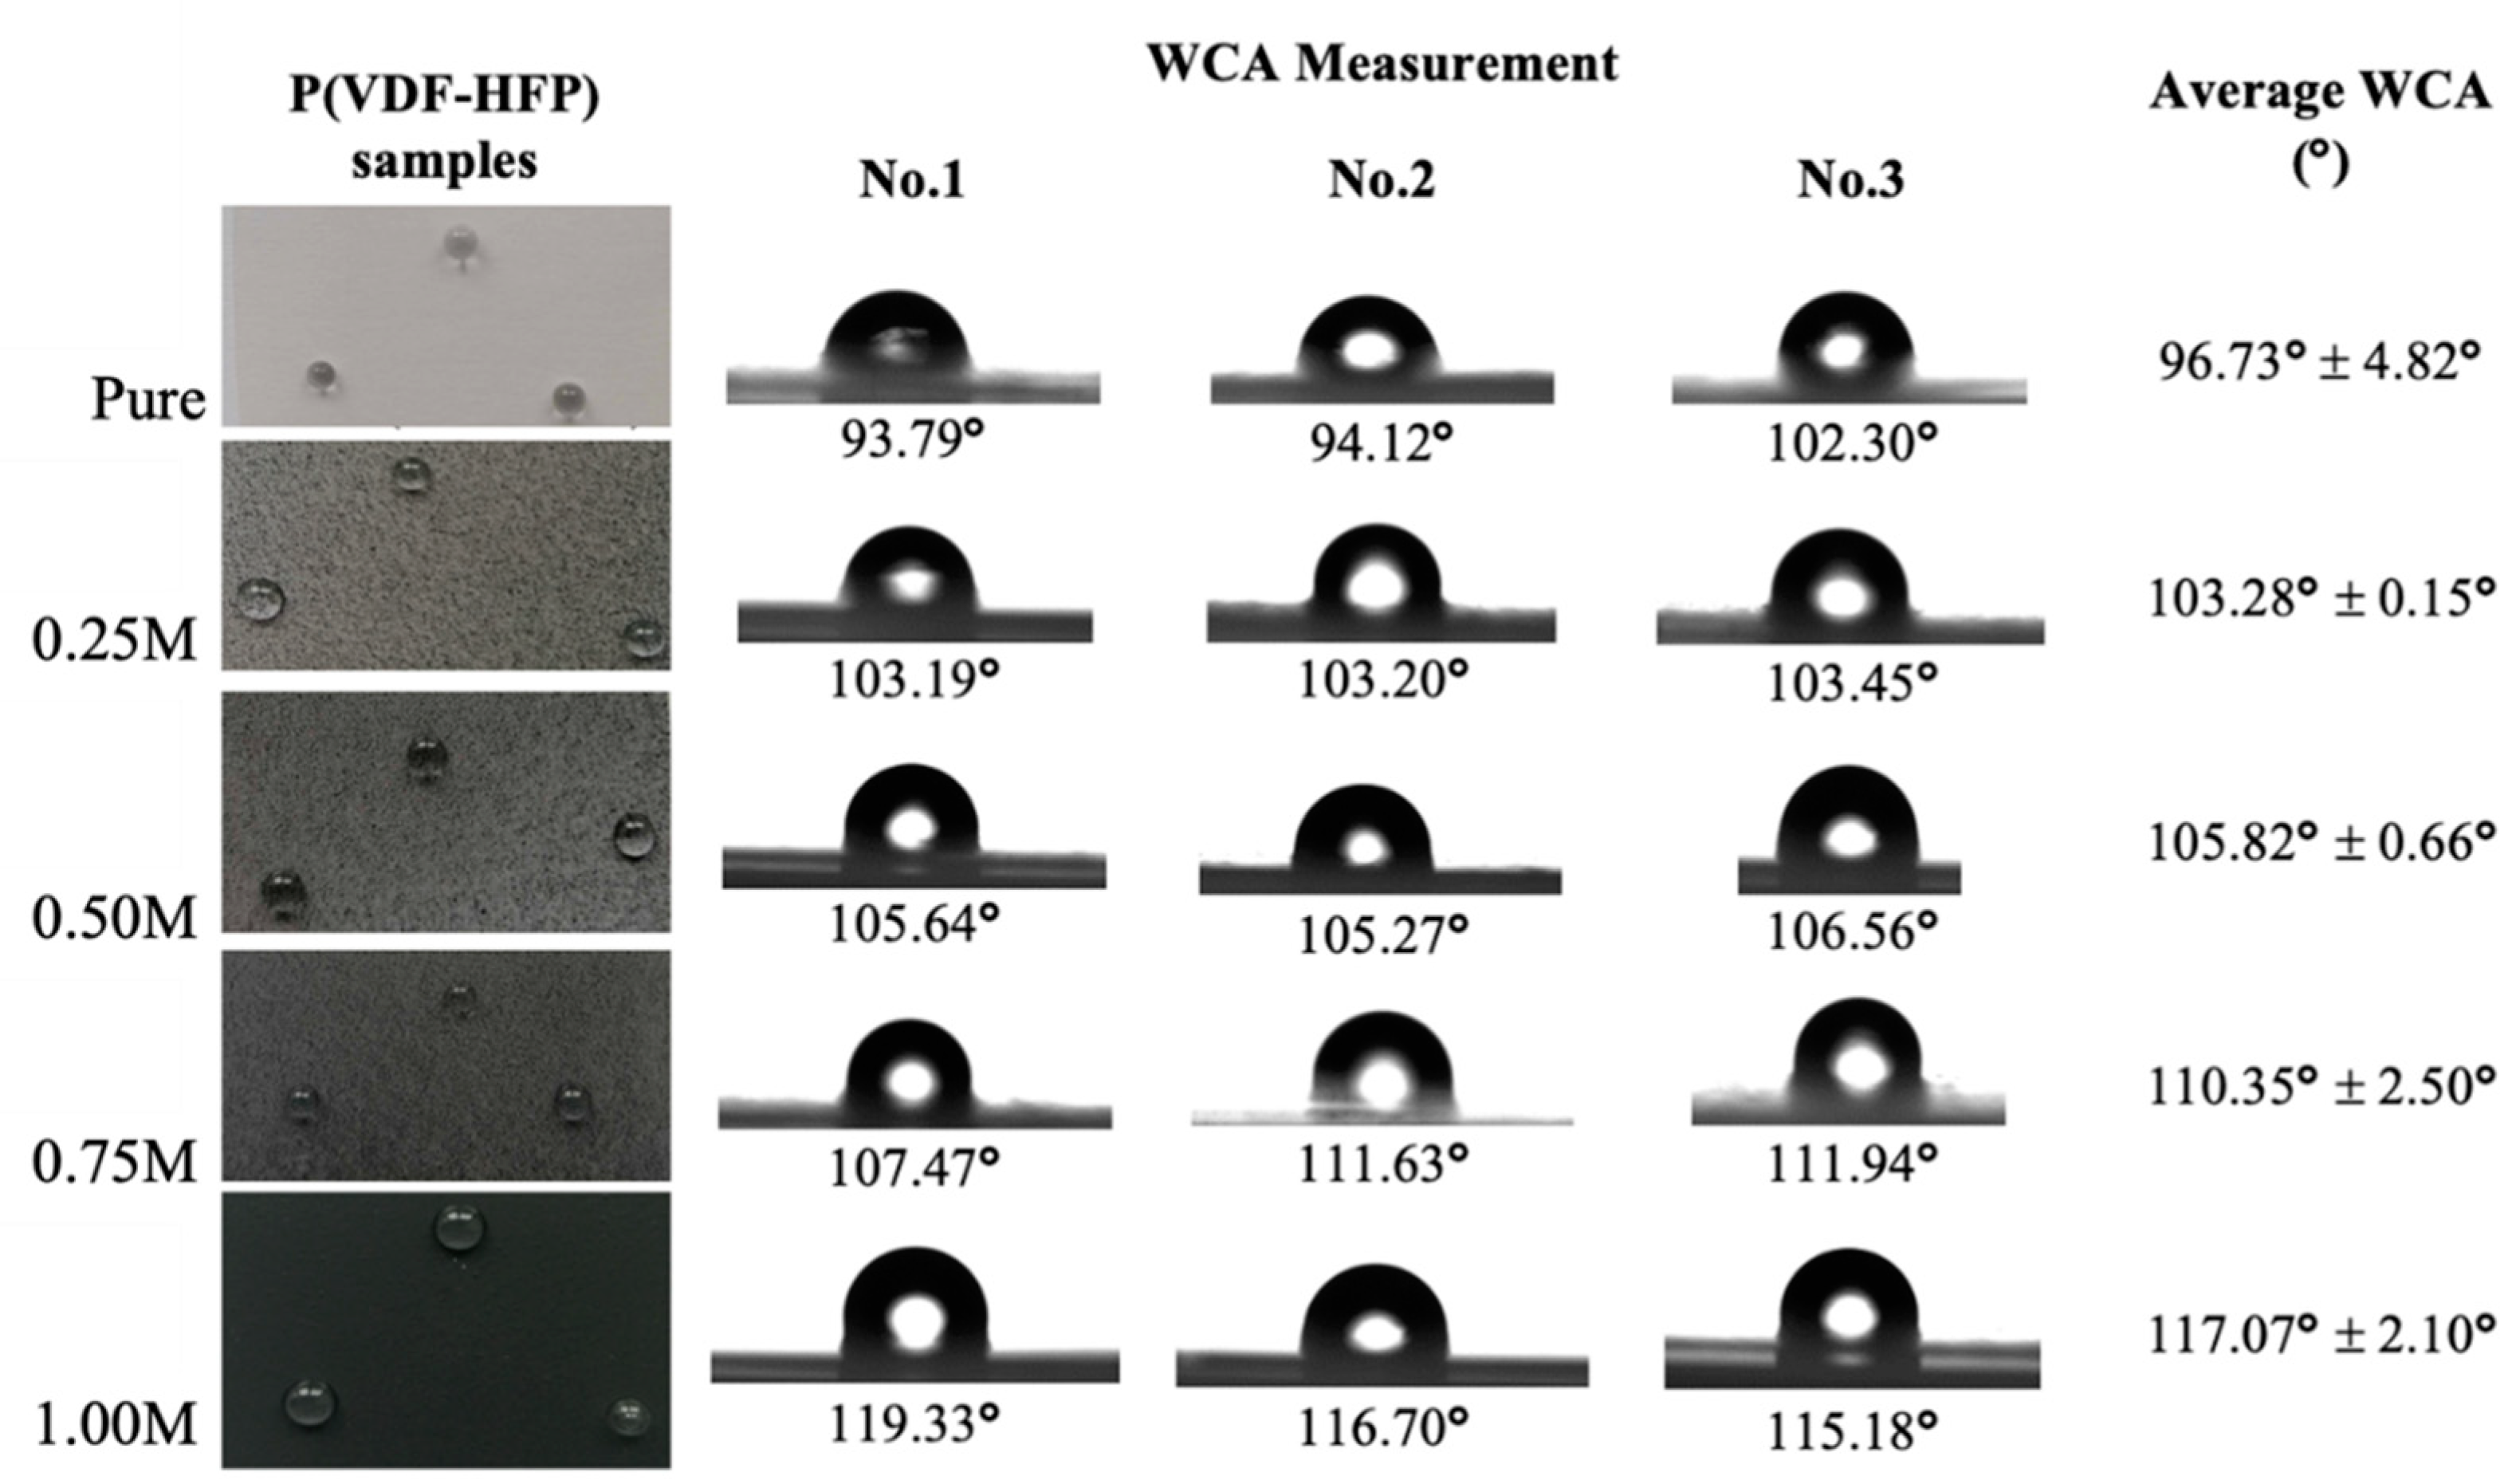
Figure 5.
FTIR spectra of pristine P(VDF-HFP) and MWCNTs/P(VDF-HFP) composite films, with various concentrations of MWCNTs; 0.25%, 0.50%, 0.75% and 1.00%.
Figure 5.
FTIR spectra of pristine P(VDF-HFP) and MWCNTs/P(VDF-HFP) composite films, with various concentrations of MWCNTs; 0.25%, 0.50%, 0.75% and 1.00%.
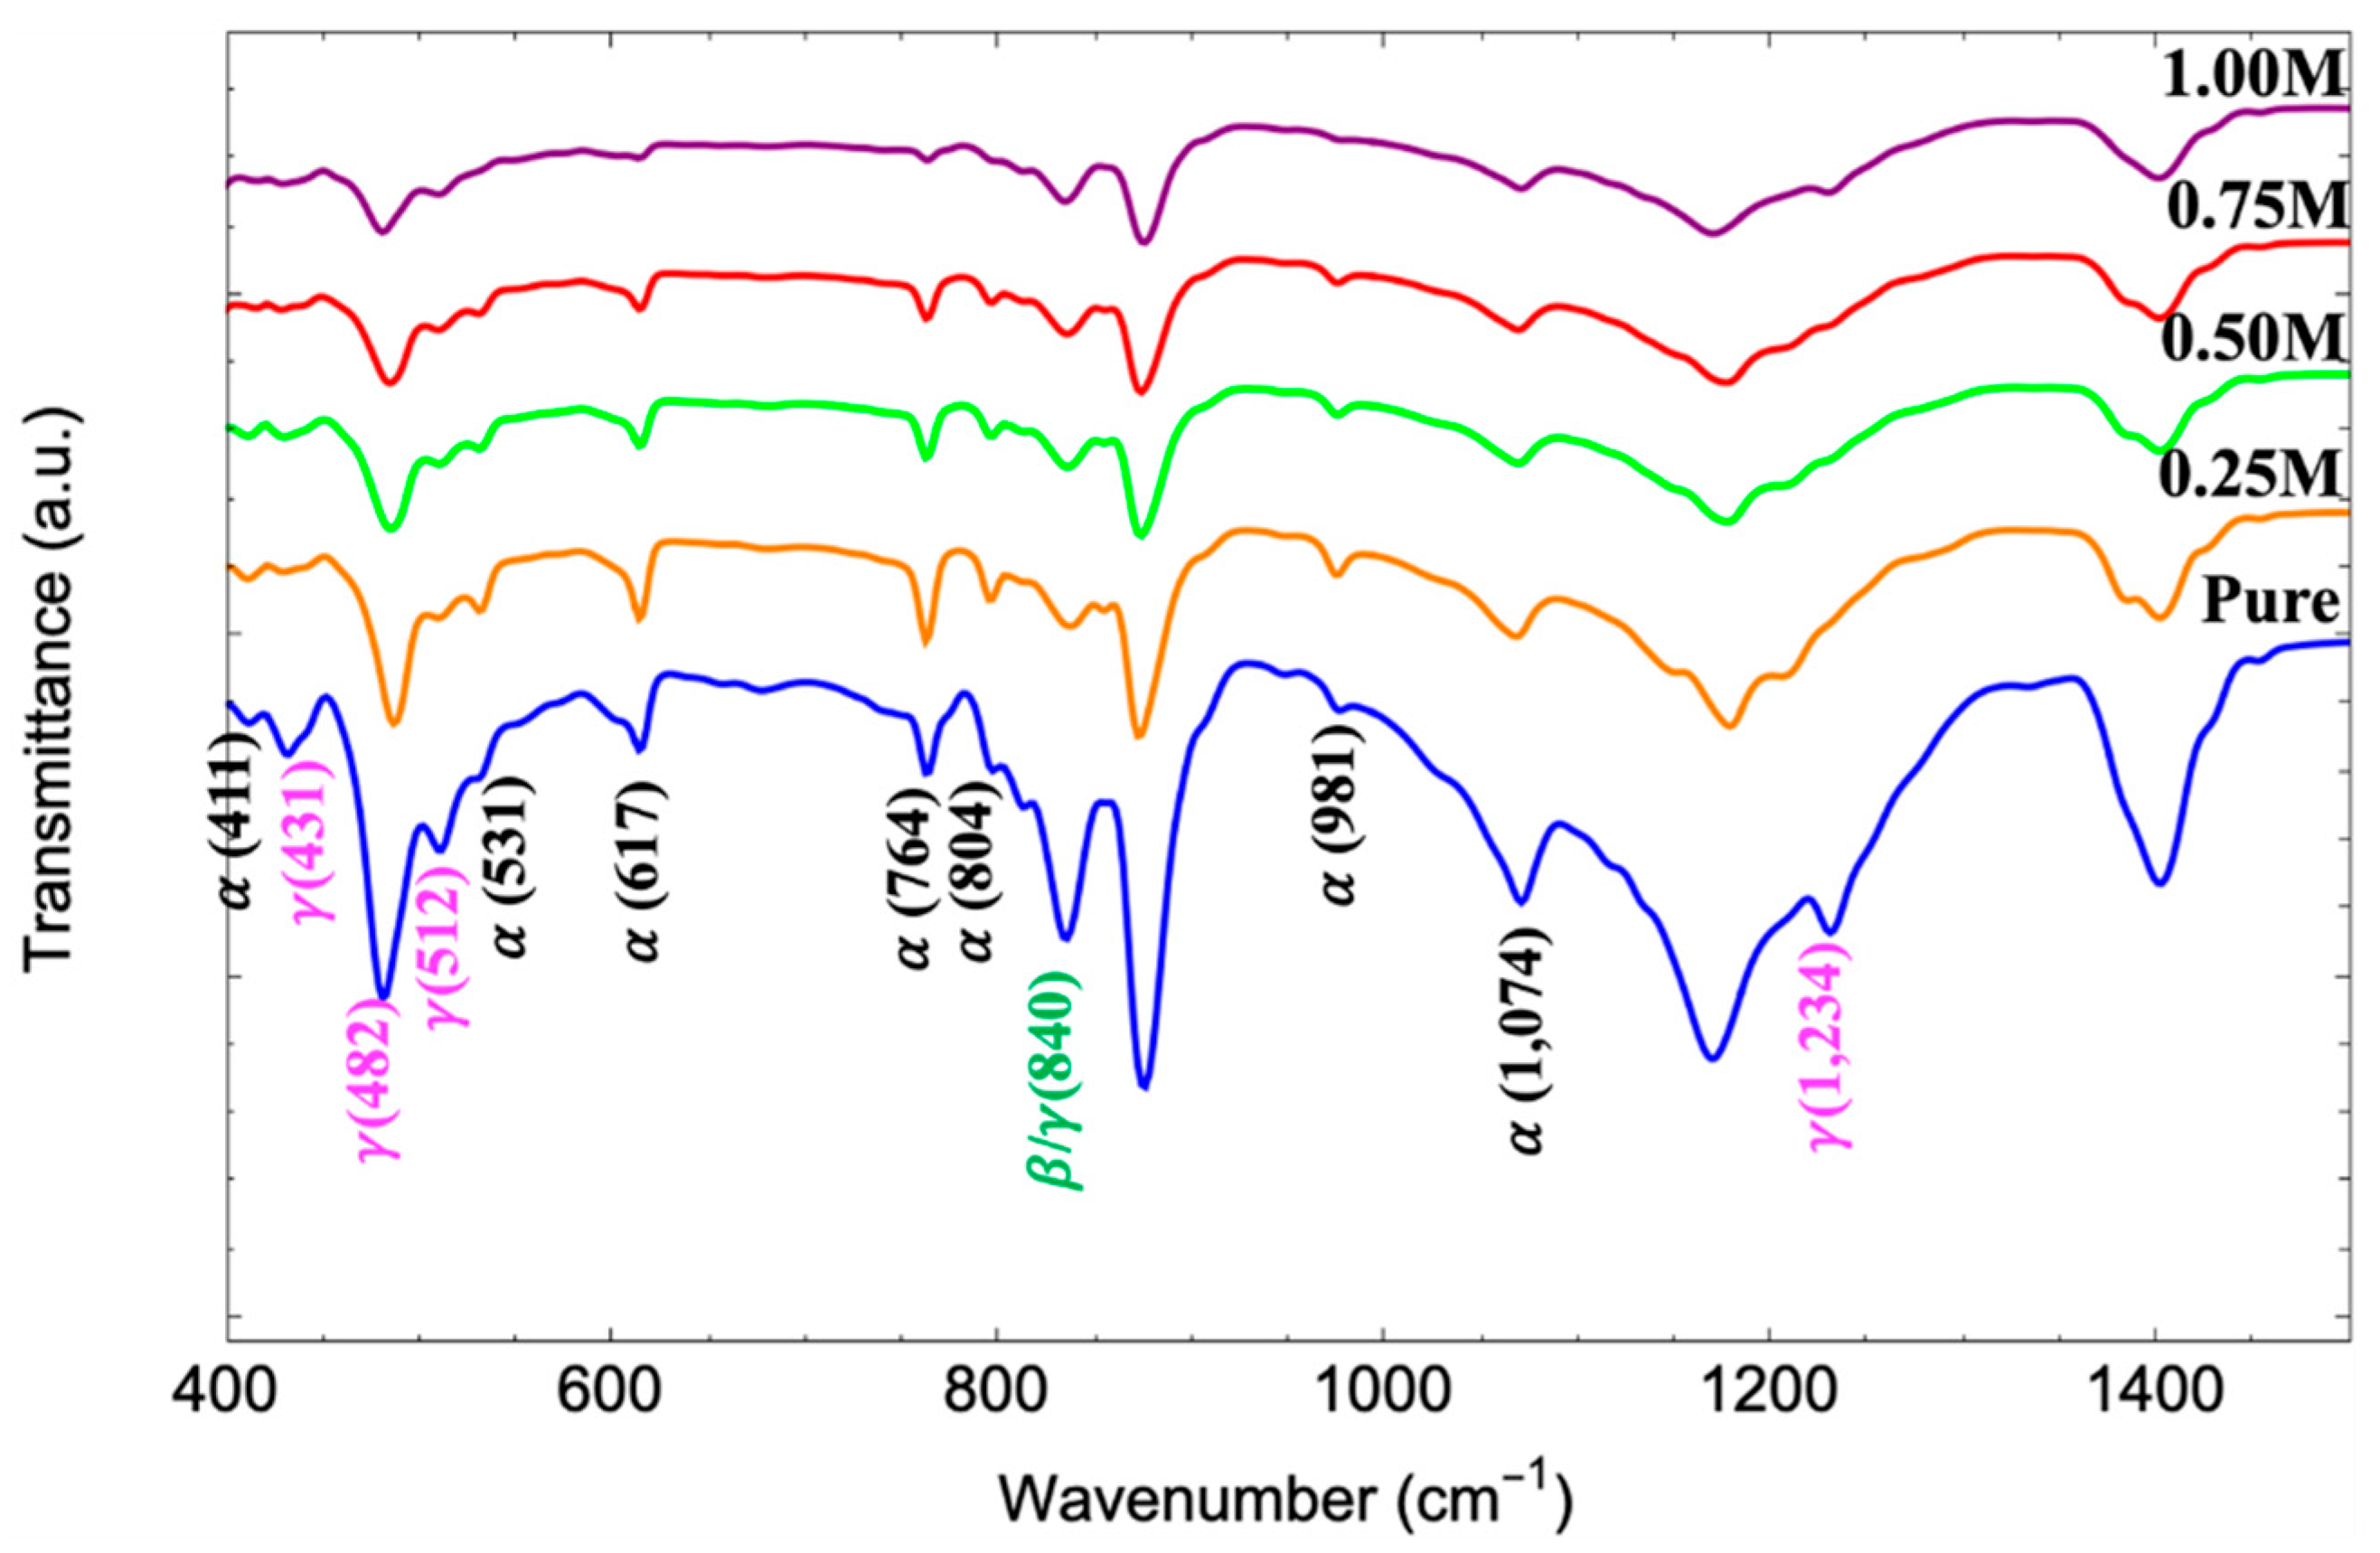
Figure 6.
XRD patterns of pristine P(VDF-HFP) and MWCNT/P(VDF-HFP) composite films, with various concentrations of MWCNT; 0.25%, 0.50%, 0.75% and 1.00%.
Figure 6.
XRD patterns of pristine P(VDF-HFP) and MWCNT/P(VDF-HFP) composite films, with various concentrations of MWCNT; 0.25%, 0.50%, 0.75% and 1.00%.
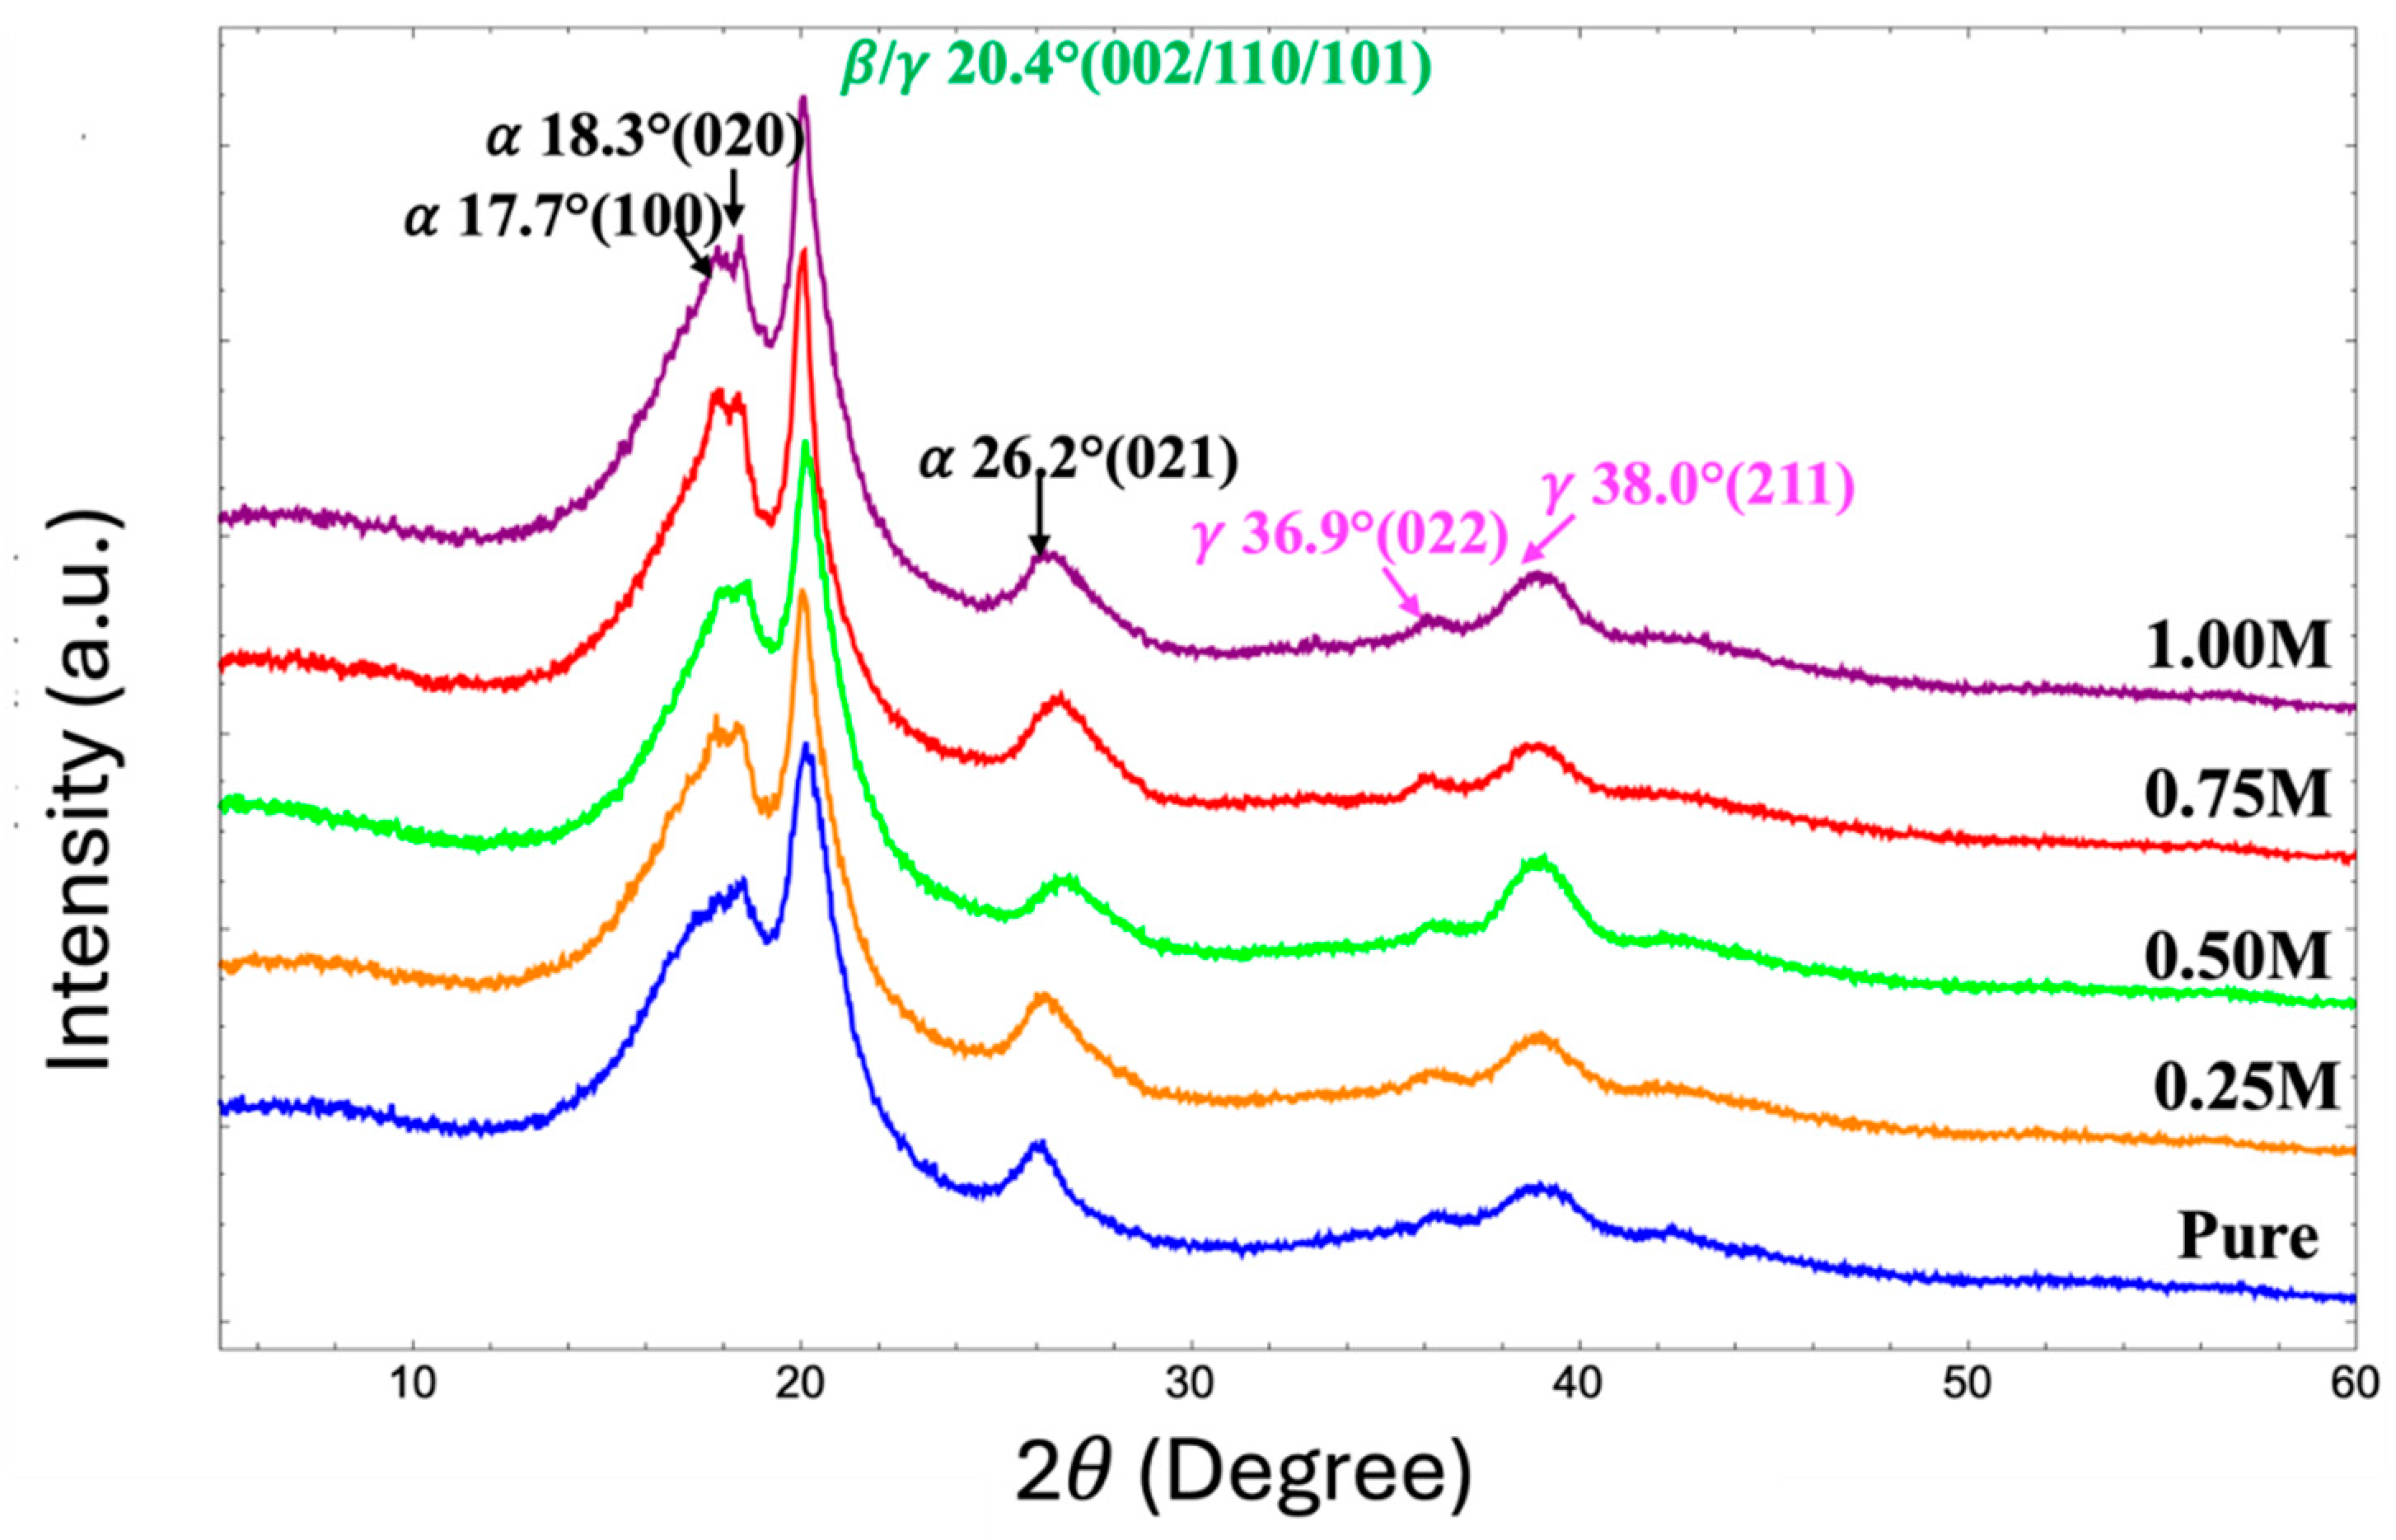
Figure 7.
TGA curve of pristine P(VDF-HFP) and MWCNT/P(VDF-HFP) composite films, with various concentrations of MWCNT; 0.25%, 0.50%, 0.75% and 1.00%.
Figure 7.
TGA curve of pristine P(VDF-HFP) and MWCNT/P(VDF-HFP) composite films, with various concentrations of MWCNT; 0.25%, 0.50%, 0.75% and 1.00%.
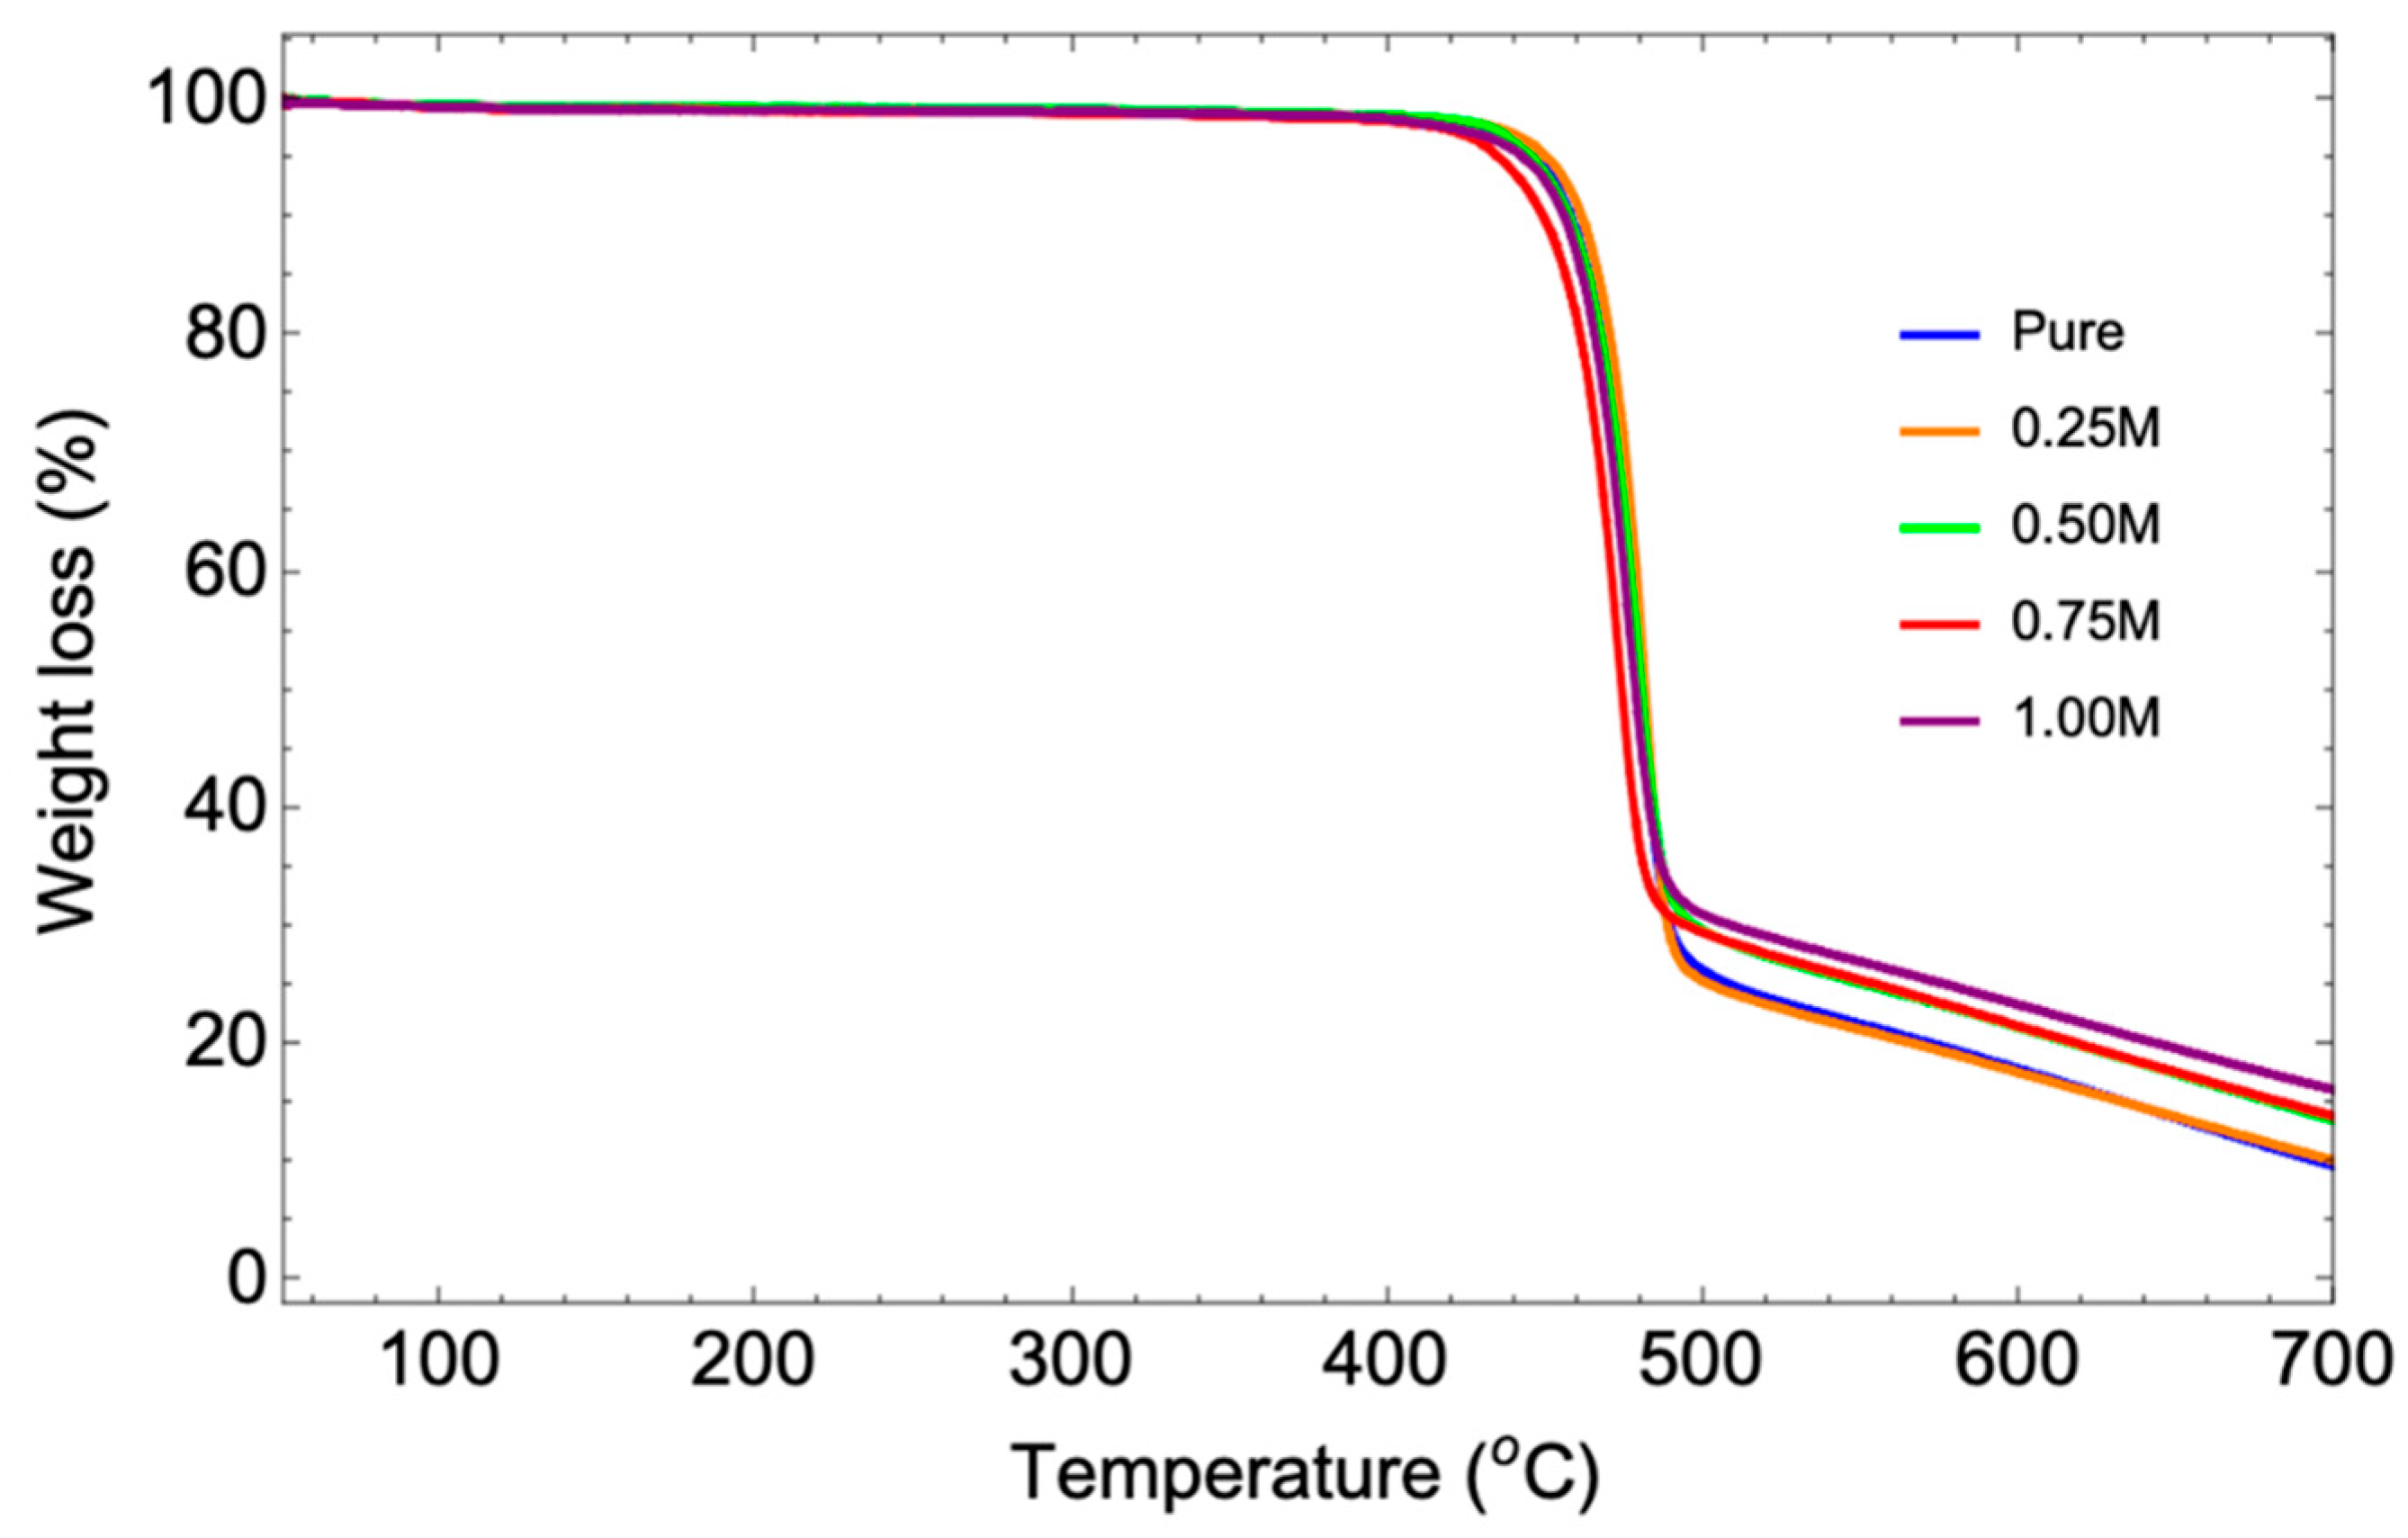
Figure 8.
Stress-strain curves of pristine P(VDF-HFP) and MWCNT/P(VDF-HFP) composite films, with various concentrations of MWCNT; 0.25%, 0.50%, 0.75% and 1.00%.
Figure 8.
Stress-strain curves of pristine P(VDF-HFP) and MWCNT/P(VDF-HFP) composite films, with various concentrations of MWCNT; 0.25%, 0.50%, 0.75% and 1.00%.
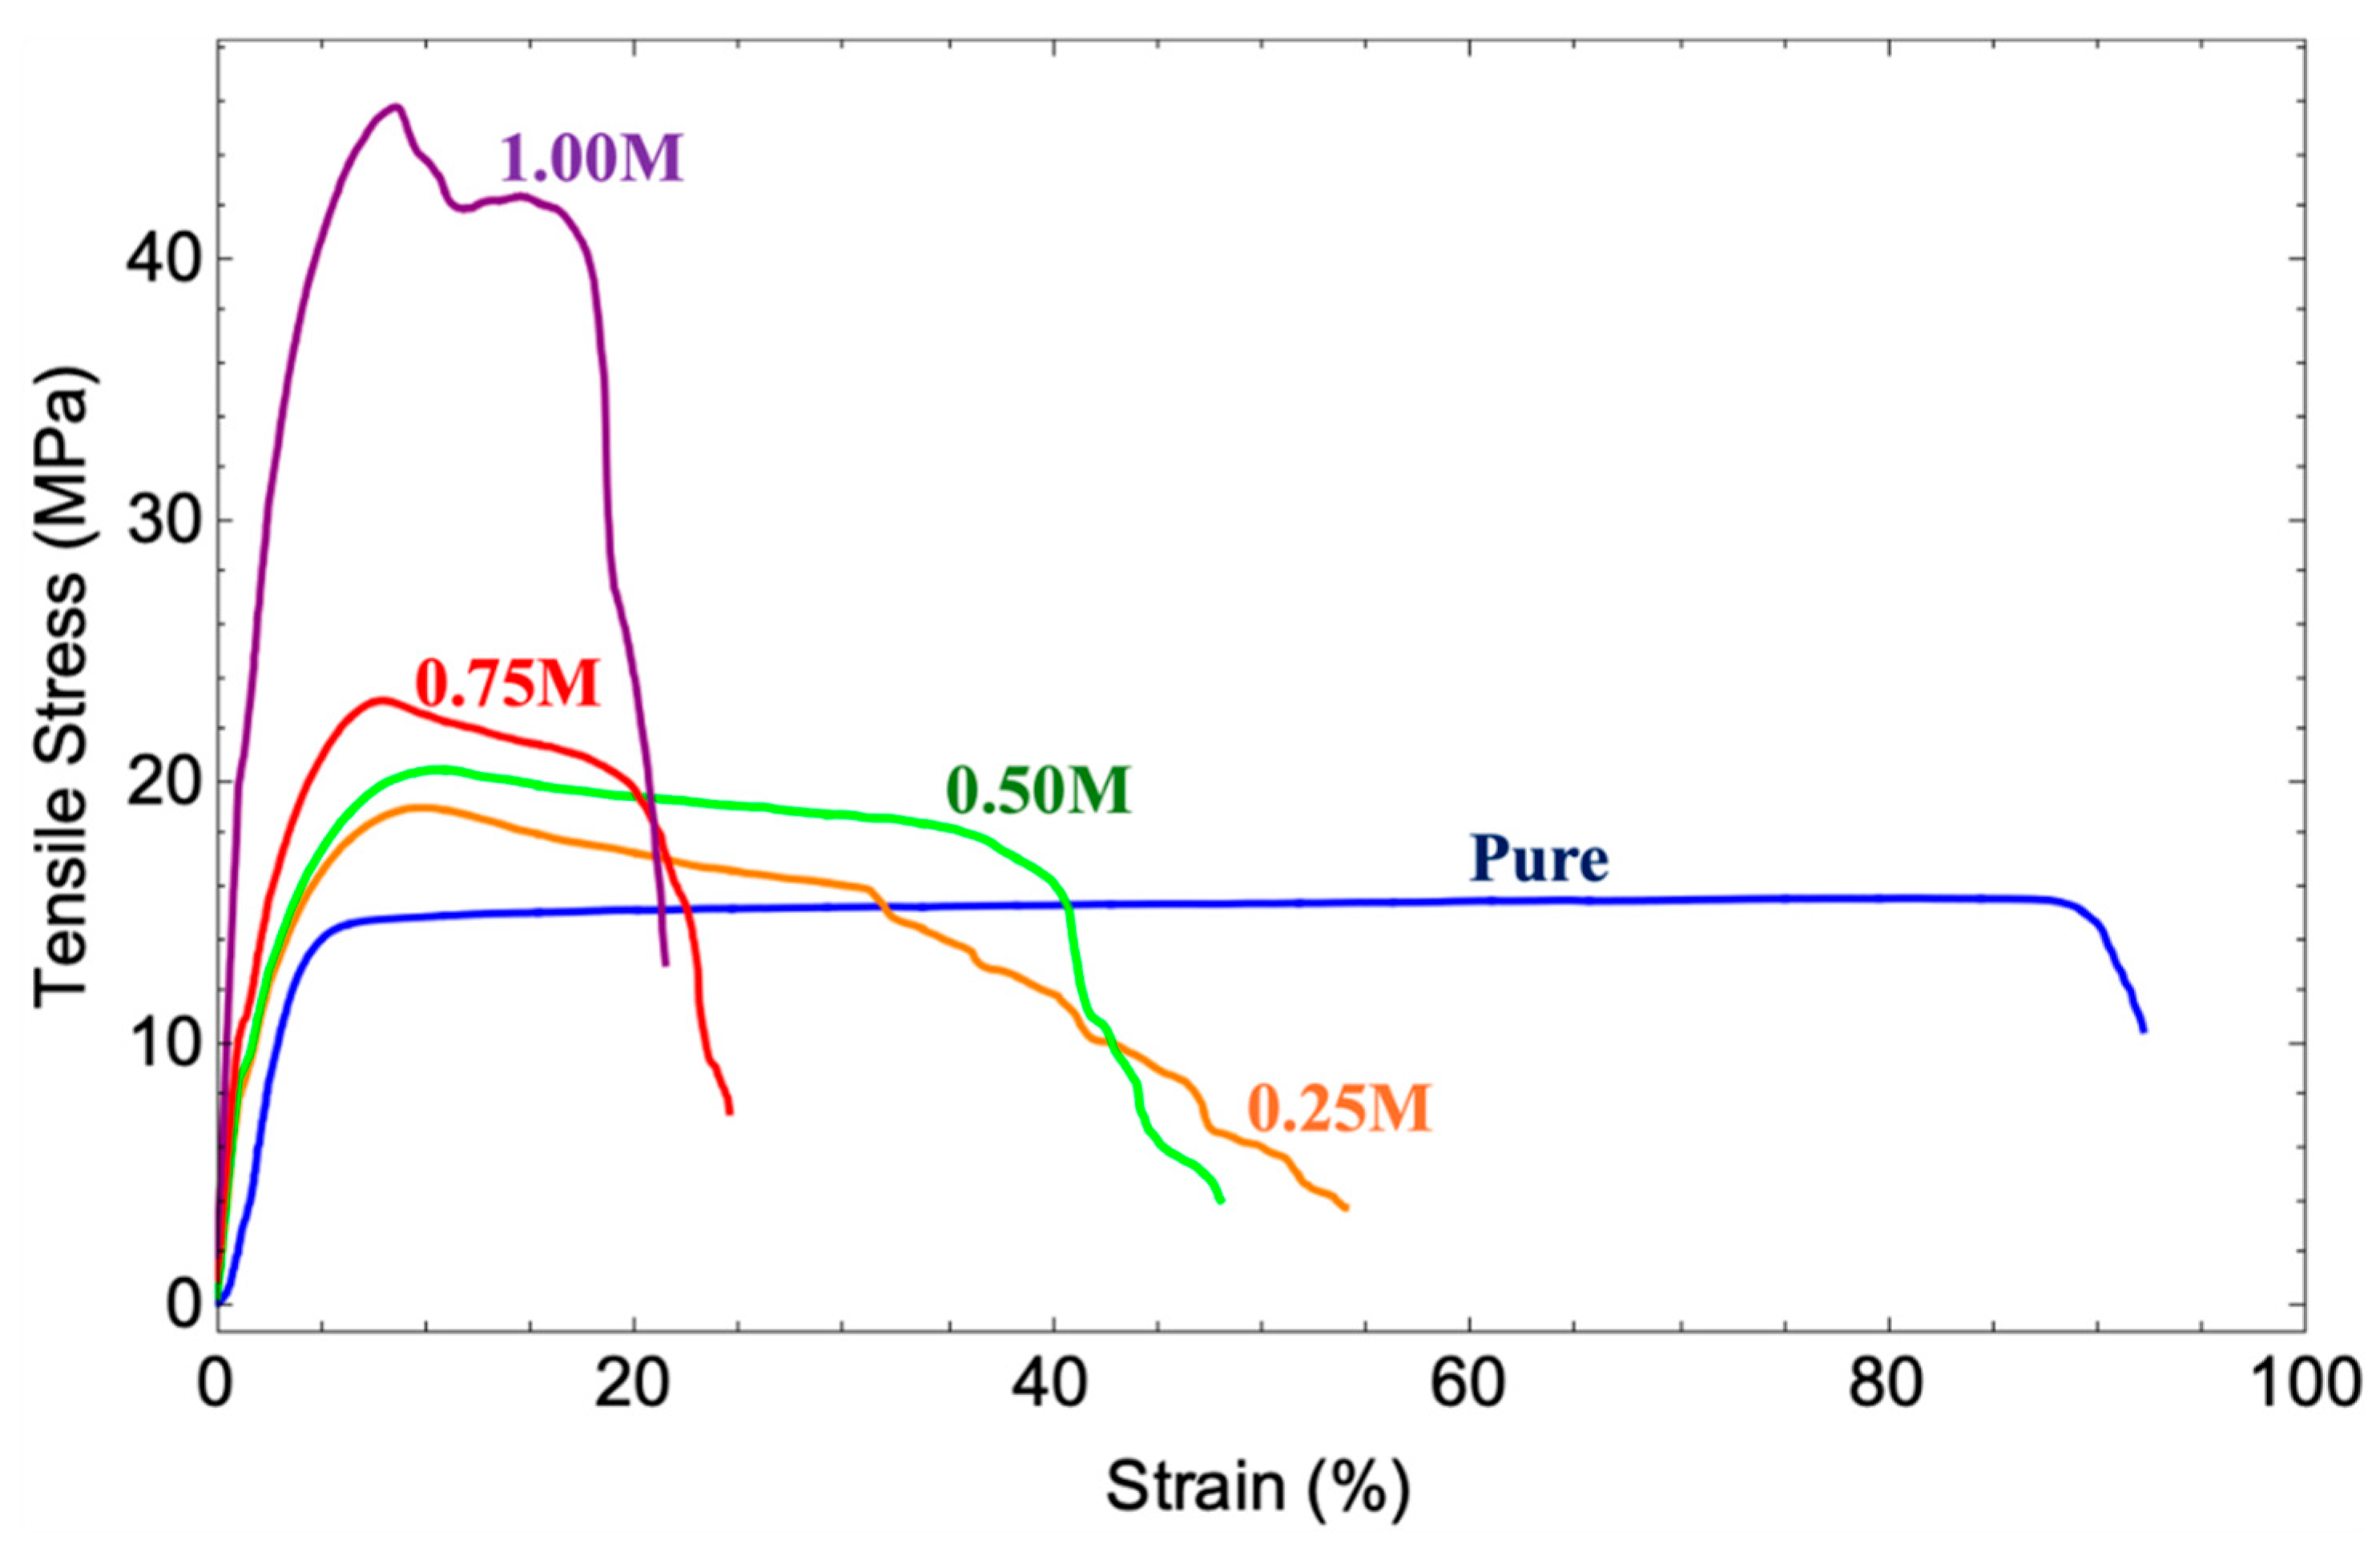
Figure 9.
Absorption spectra of pristine P(VDF-HFP) and MWCNT/P(VDF-HFP) composite films, with various concentrations of MWCNT; 0.25%, 0.50%, 0.75% and 1.00%,.
Figure 9.
Absorption spectra of pristine P(VDF-HFP) and MWCNT/P(VDF-HFP) composite films, with various concentrations of MWCNT; 0.25%, 0.50%, 0.75% and 1.00%,.
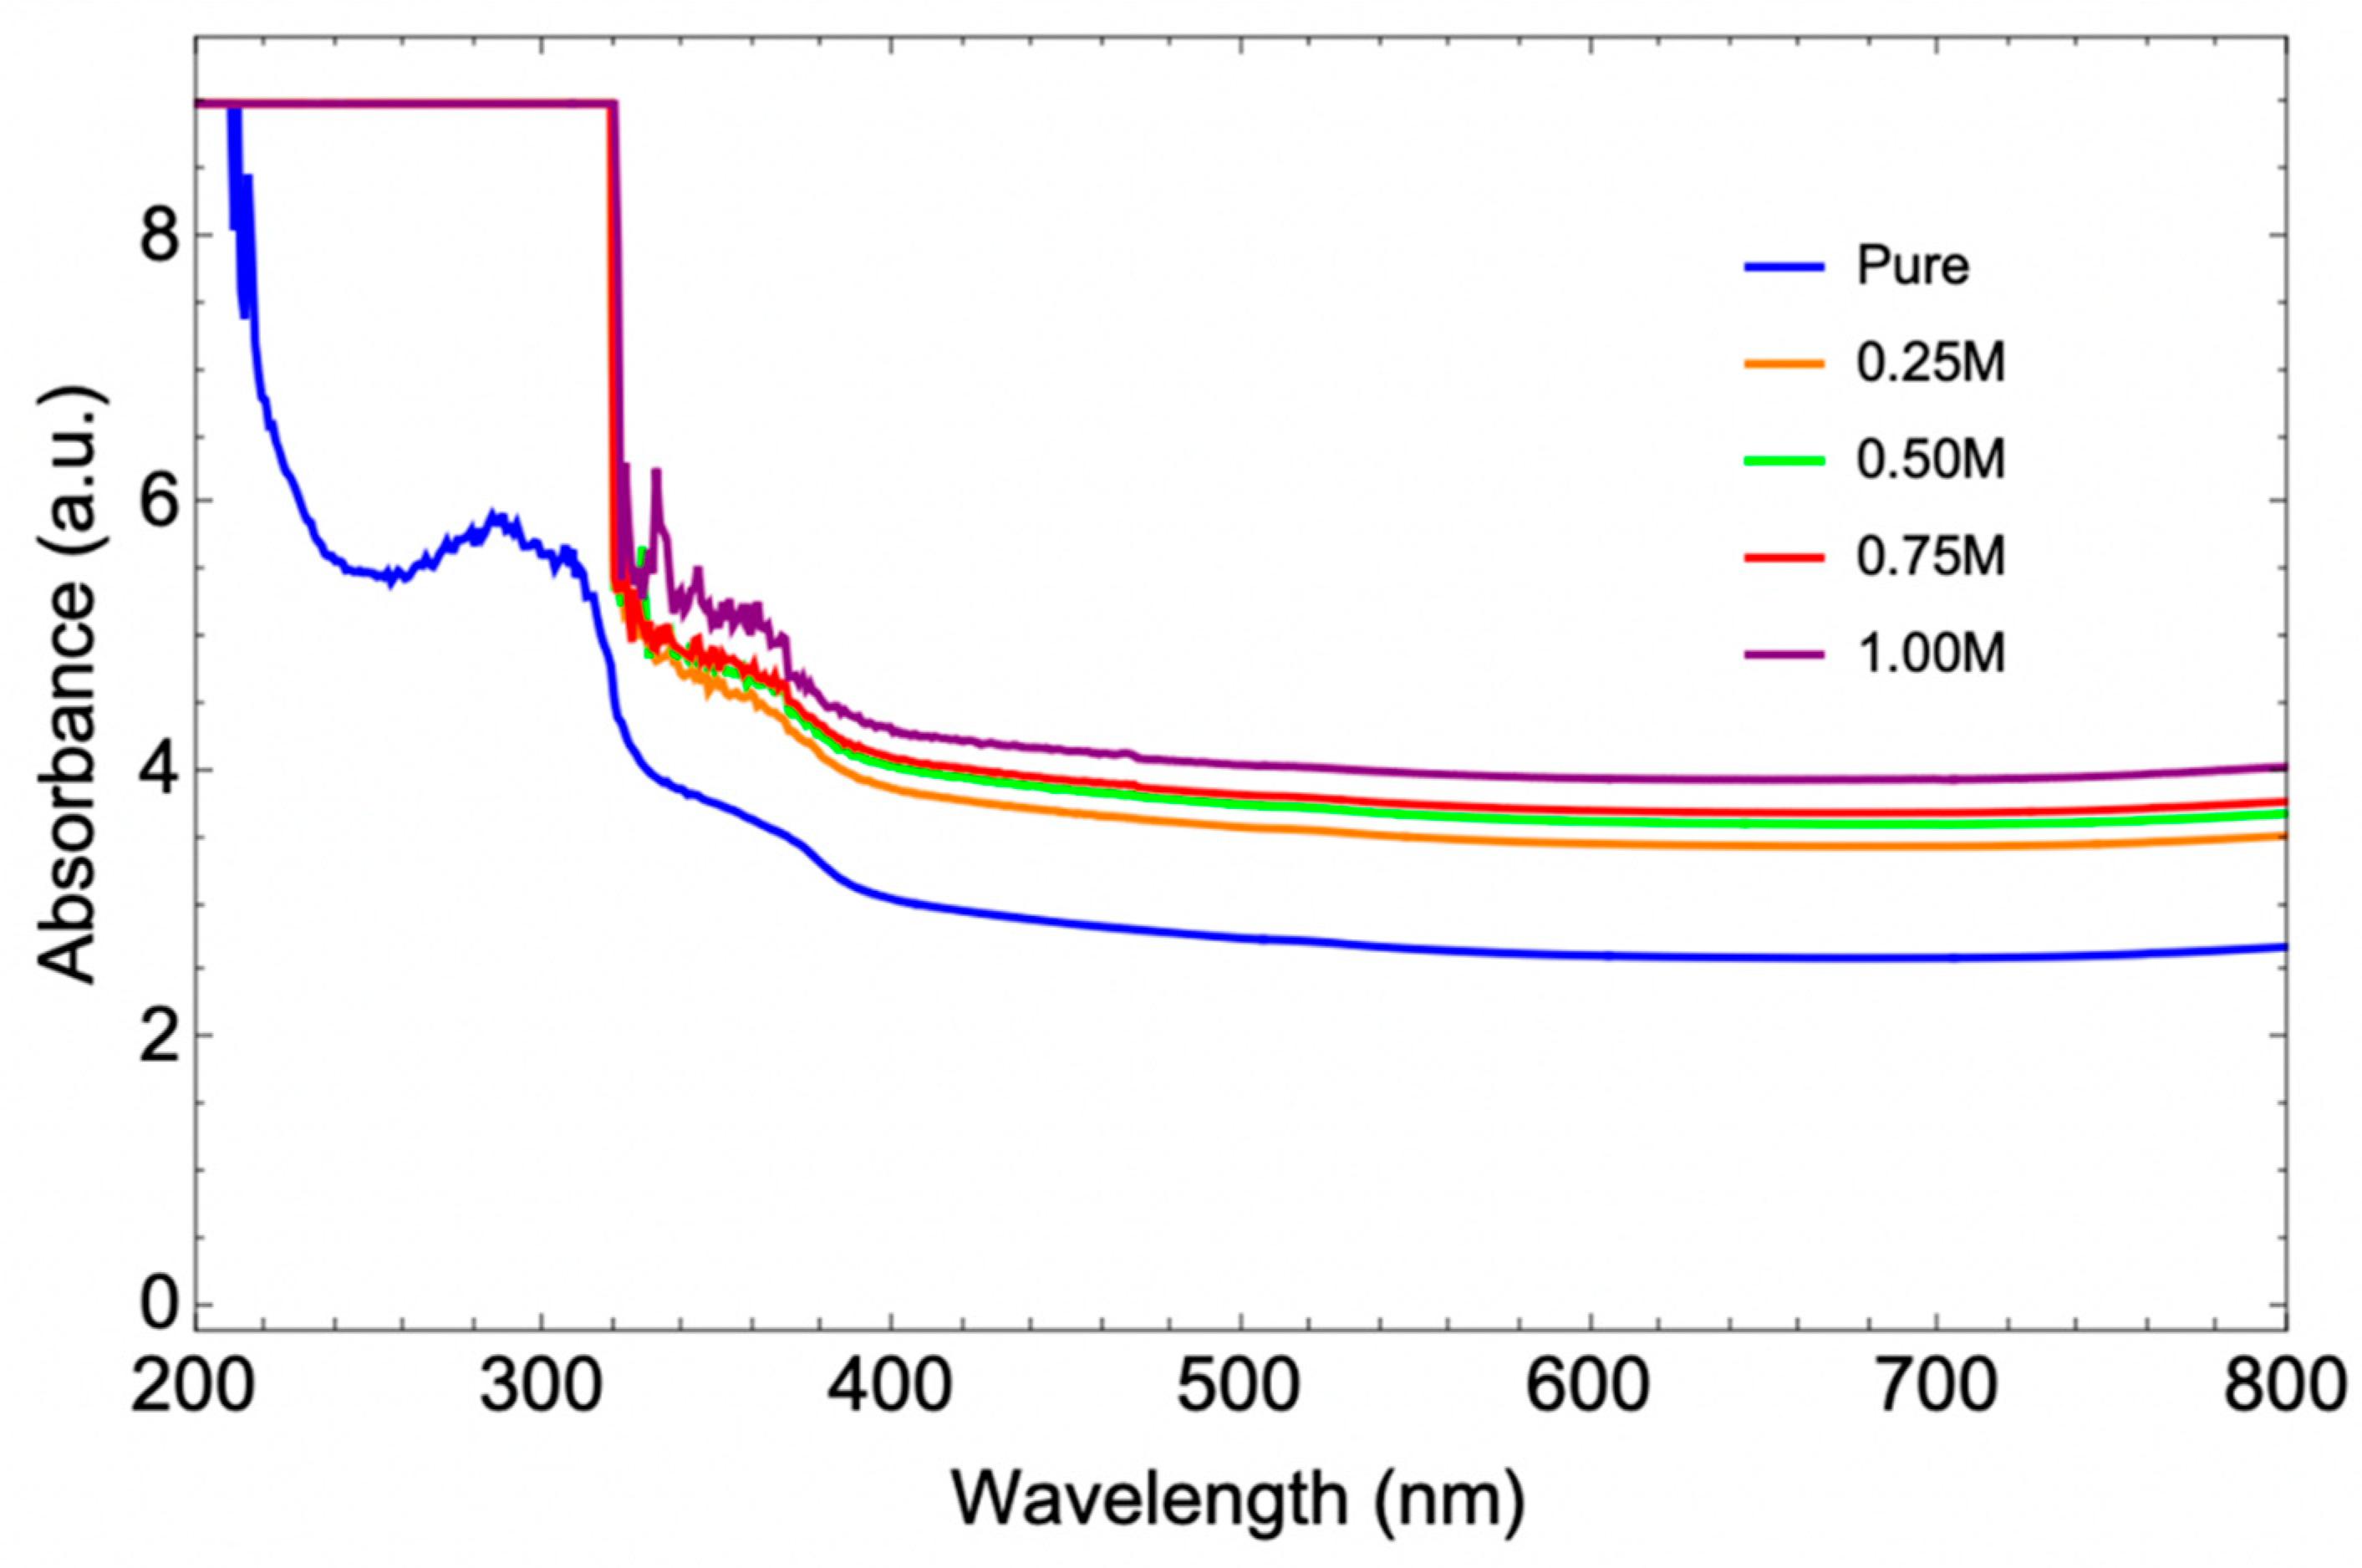
Figure 10.
Relationship between photon energy and (αhν)2 of P(VDF-HFP) and MWCNT/P(VDF-HFP) composite films, with various concentrations of MWCNT; 0.25%, 0.50%, 0.75% and 1.00%.
Figure 10.
Relationship between photon energy and (αhν)2 of P(VDF-HFP) and MWCNT/P(VDF-HFP) composite films, with various concentrations of MWCNT; 0.25%, 0.50%, 0.75% and 1.00%.
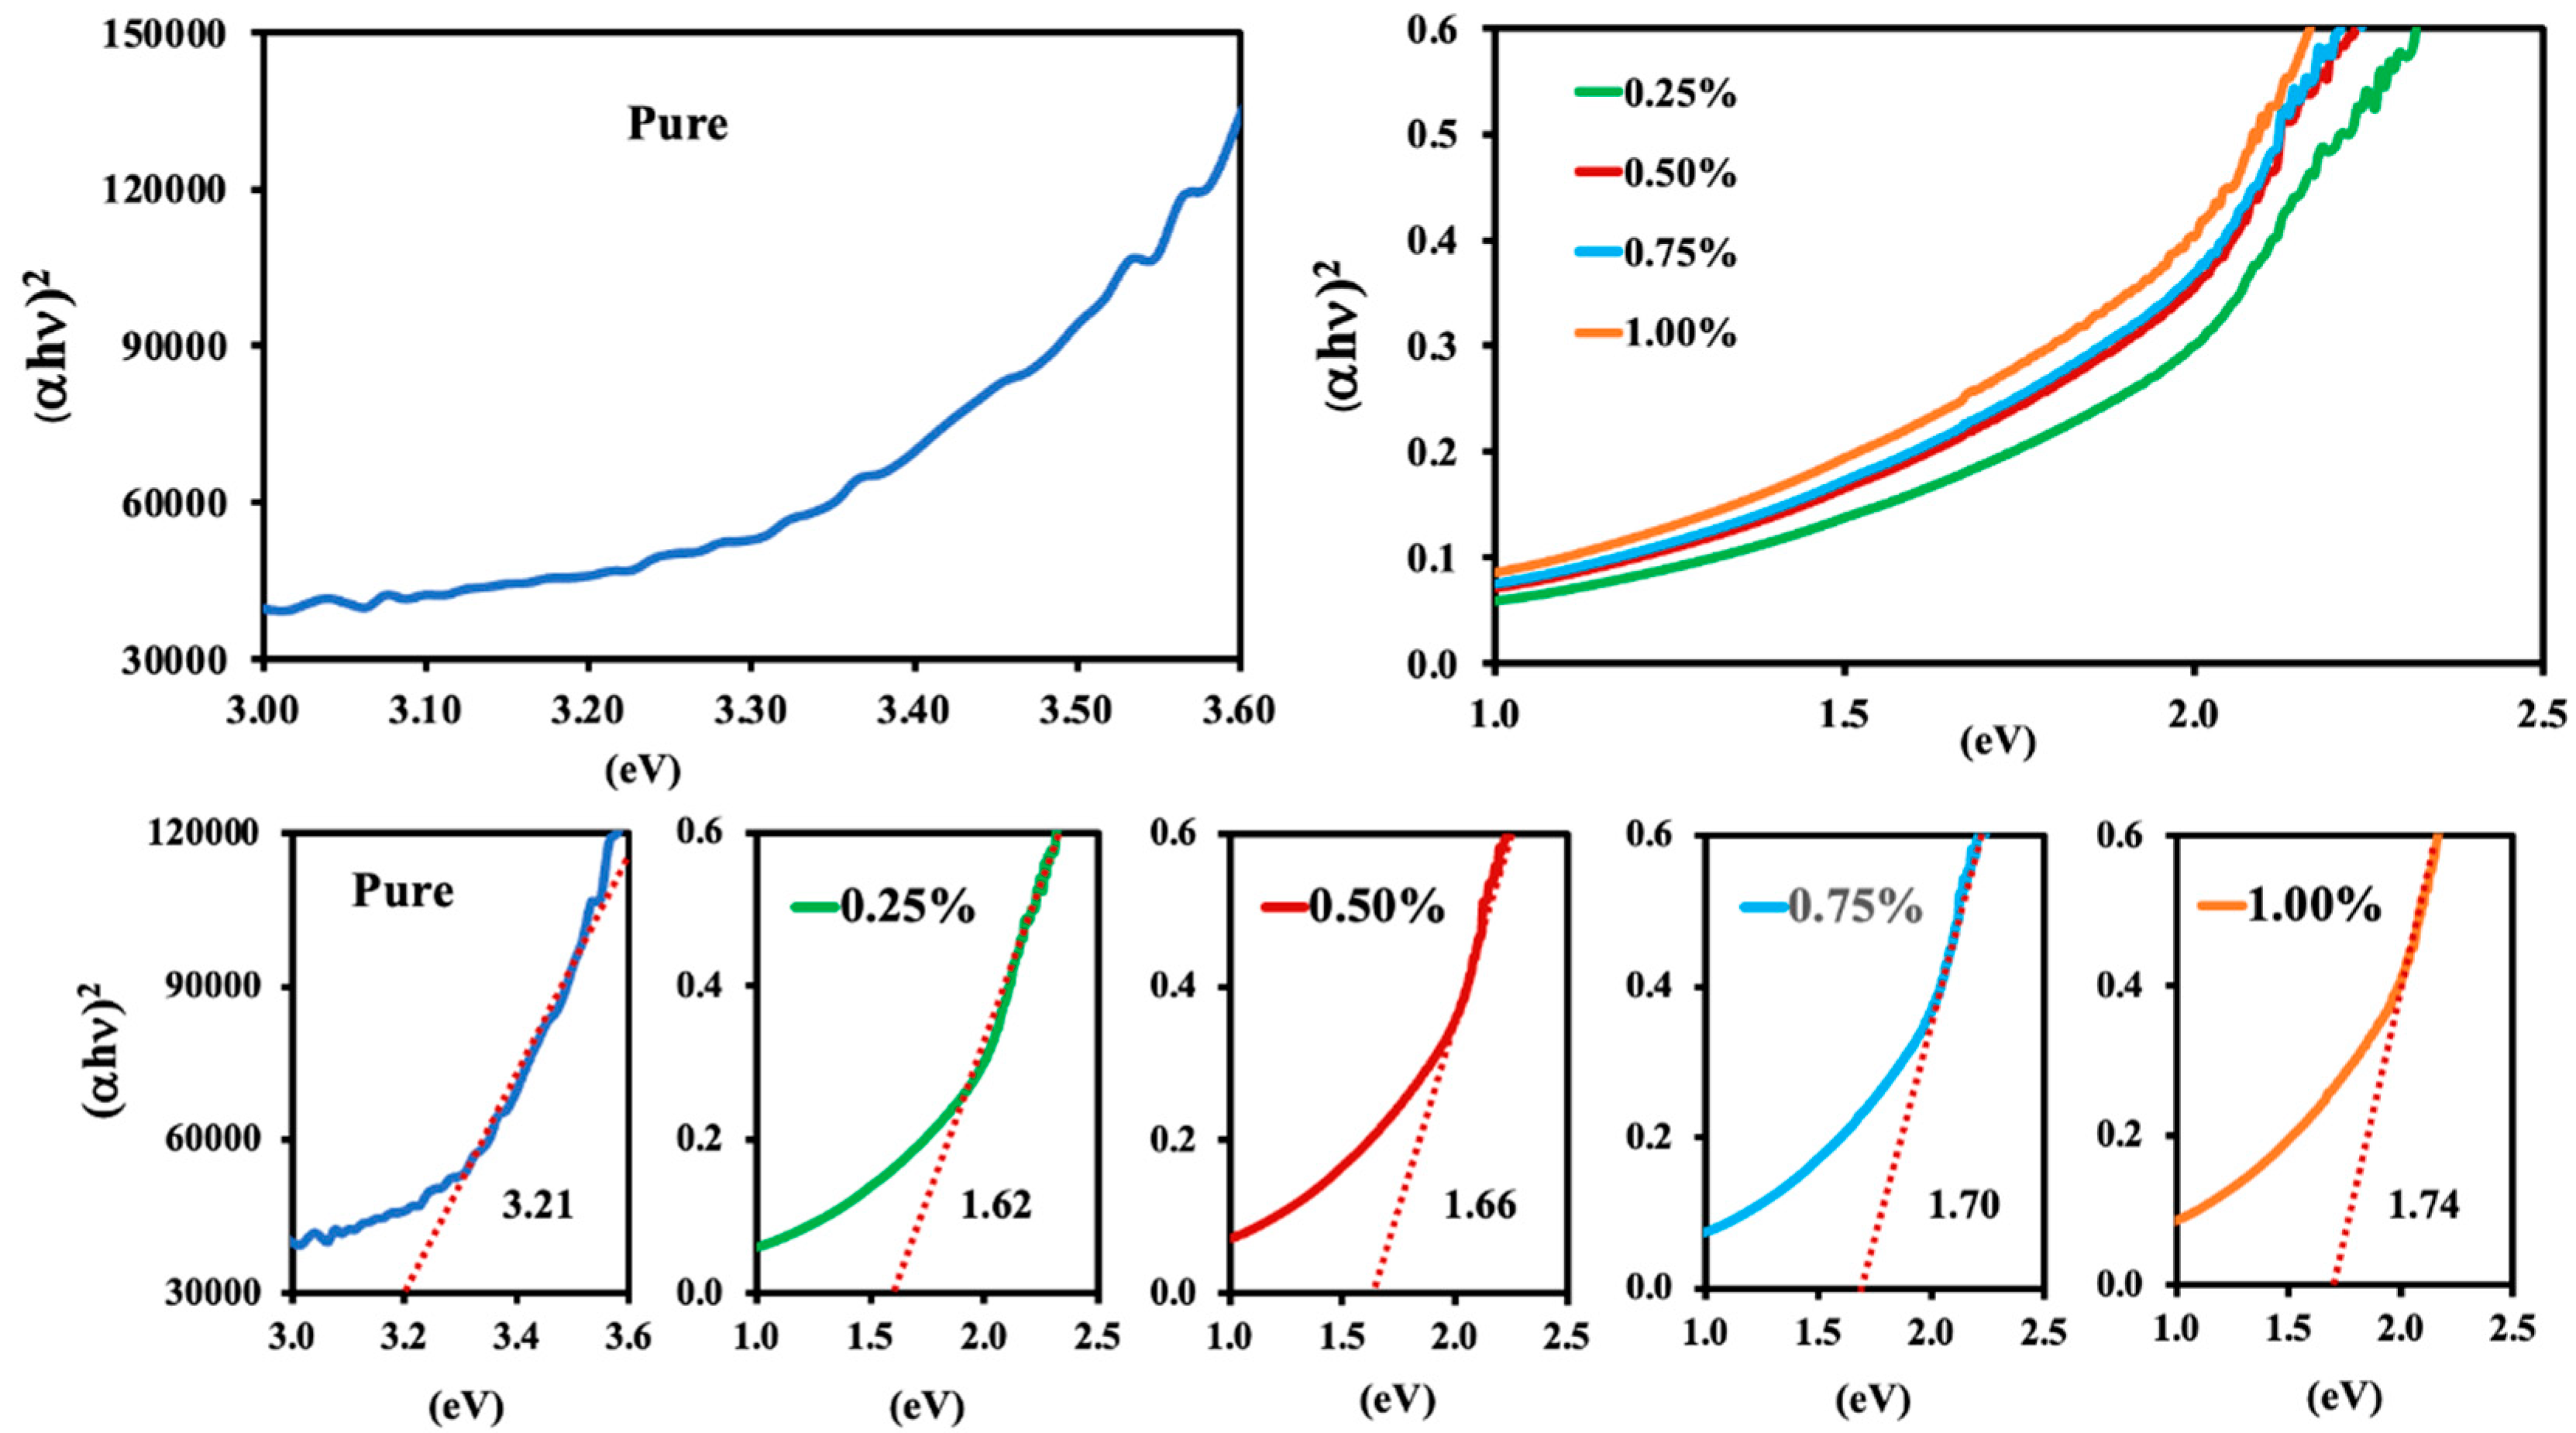
Figure 11.
Variation of (a) dielectric constant (ε), (b) dielectric loss (tan δ) and (c) conductivity of pristine P(VDF-HFP) and MWCNTs/P(VDF-HFP) composite films with various concentrations of MWCNT; 0.25%, 0.50%, 0.75% and 1.00%, as a function of the applied frequency at room temperature.
Figure 11.
Variation of (a) dielectric constant (ε), (b) dielectric loss (tan δ) and (c) conductivity of pristine P(VDF-HFP) and MWCNTs/P(VDF-HFP) composite films with various concentrations of MWCNT; 0.25%, 0.50%, 0.75% and 1.00%, as a function of the applied frequency at room temperature.
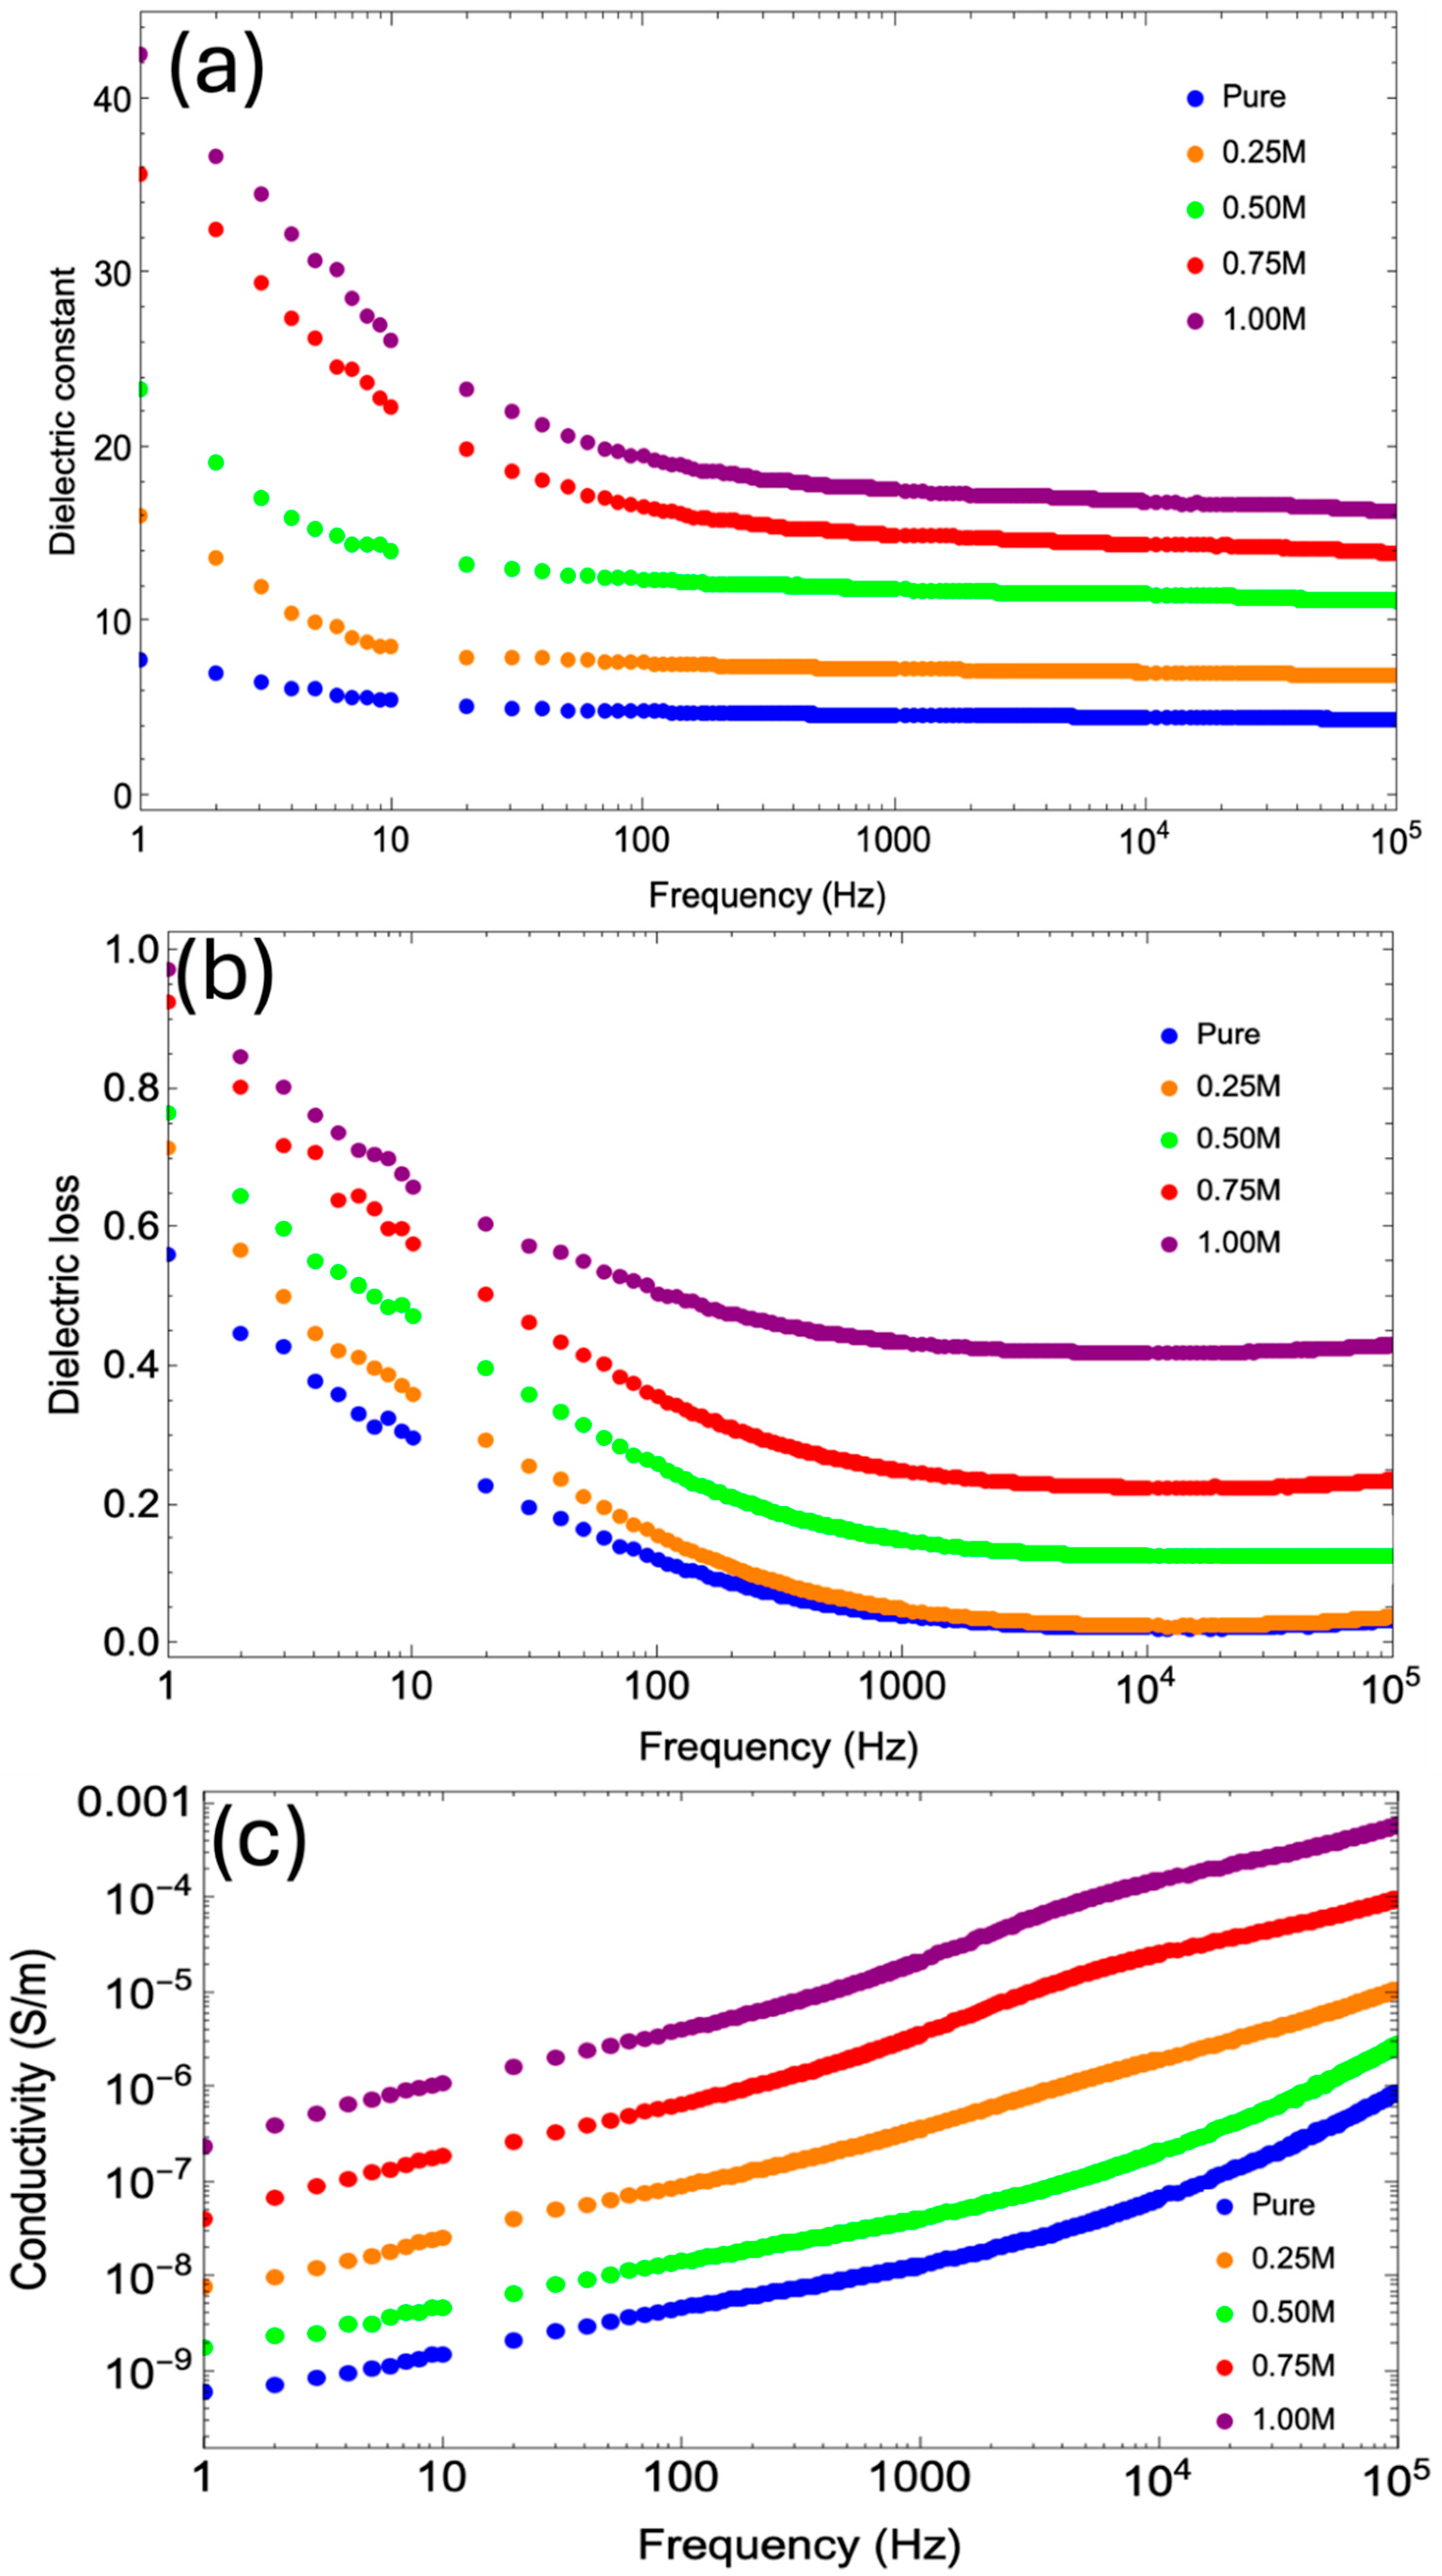
Figure 12.
Piezoelectric performance of pristine P(VDF-HFP) and MWCNTs/P(VDF-HFP) composite films with various concentrations of MWCNT; 0.25%, 0.50%, 0.75% and 1.00%; (a) measured under the applied forced 16.145 N at 1 Hz with different MWCNTs contents, (b) measured different applied force for 0.75 wt% MWCNTs, (c) Vp-p, (d) Vmax (~Vp-p/2), (e) sensitivity (Vmax/Force) , and the d33 values.
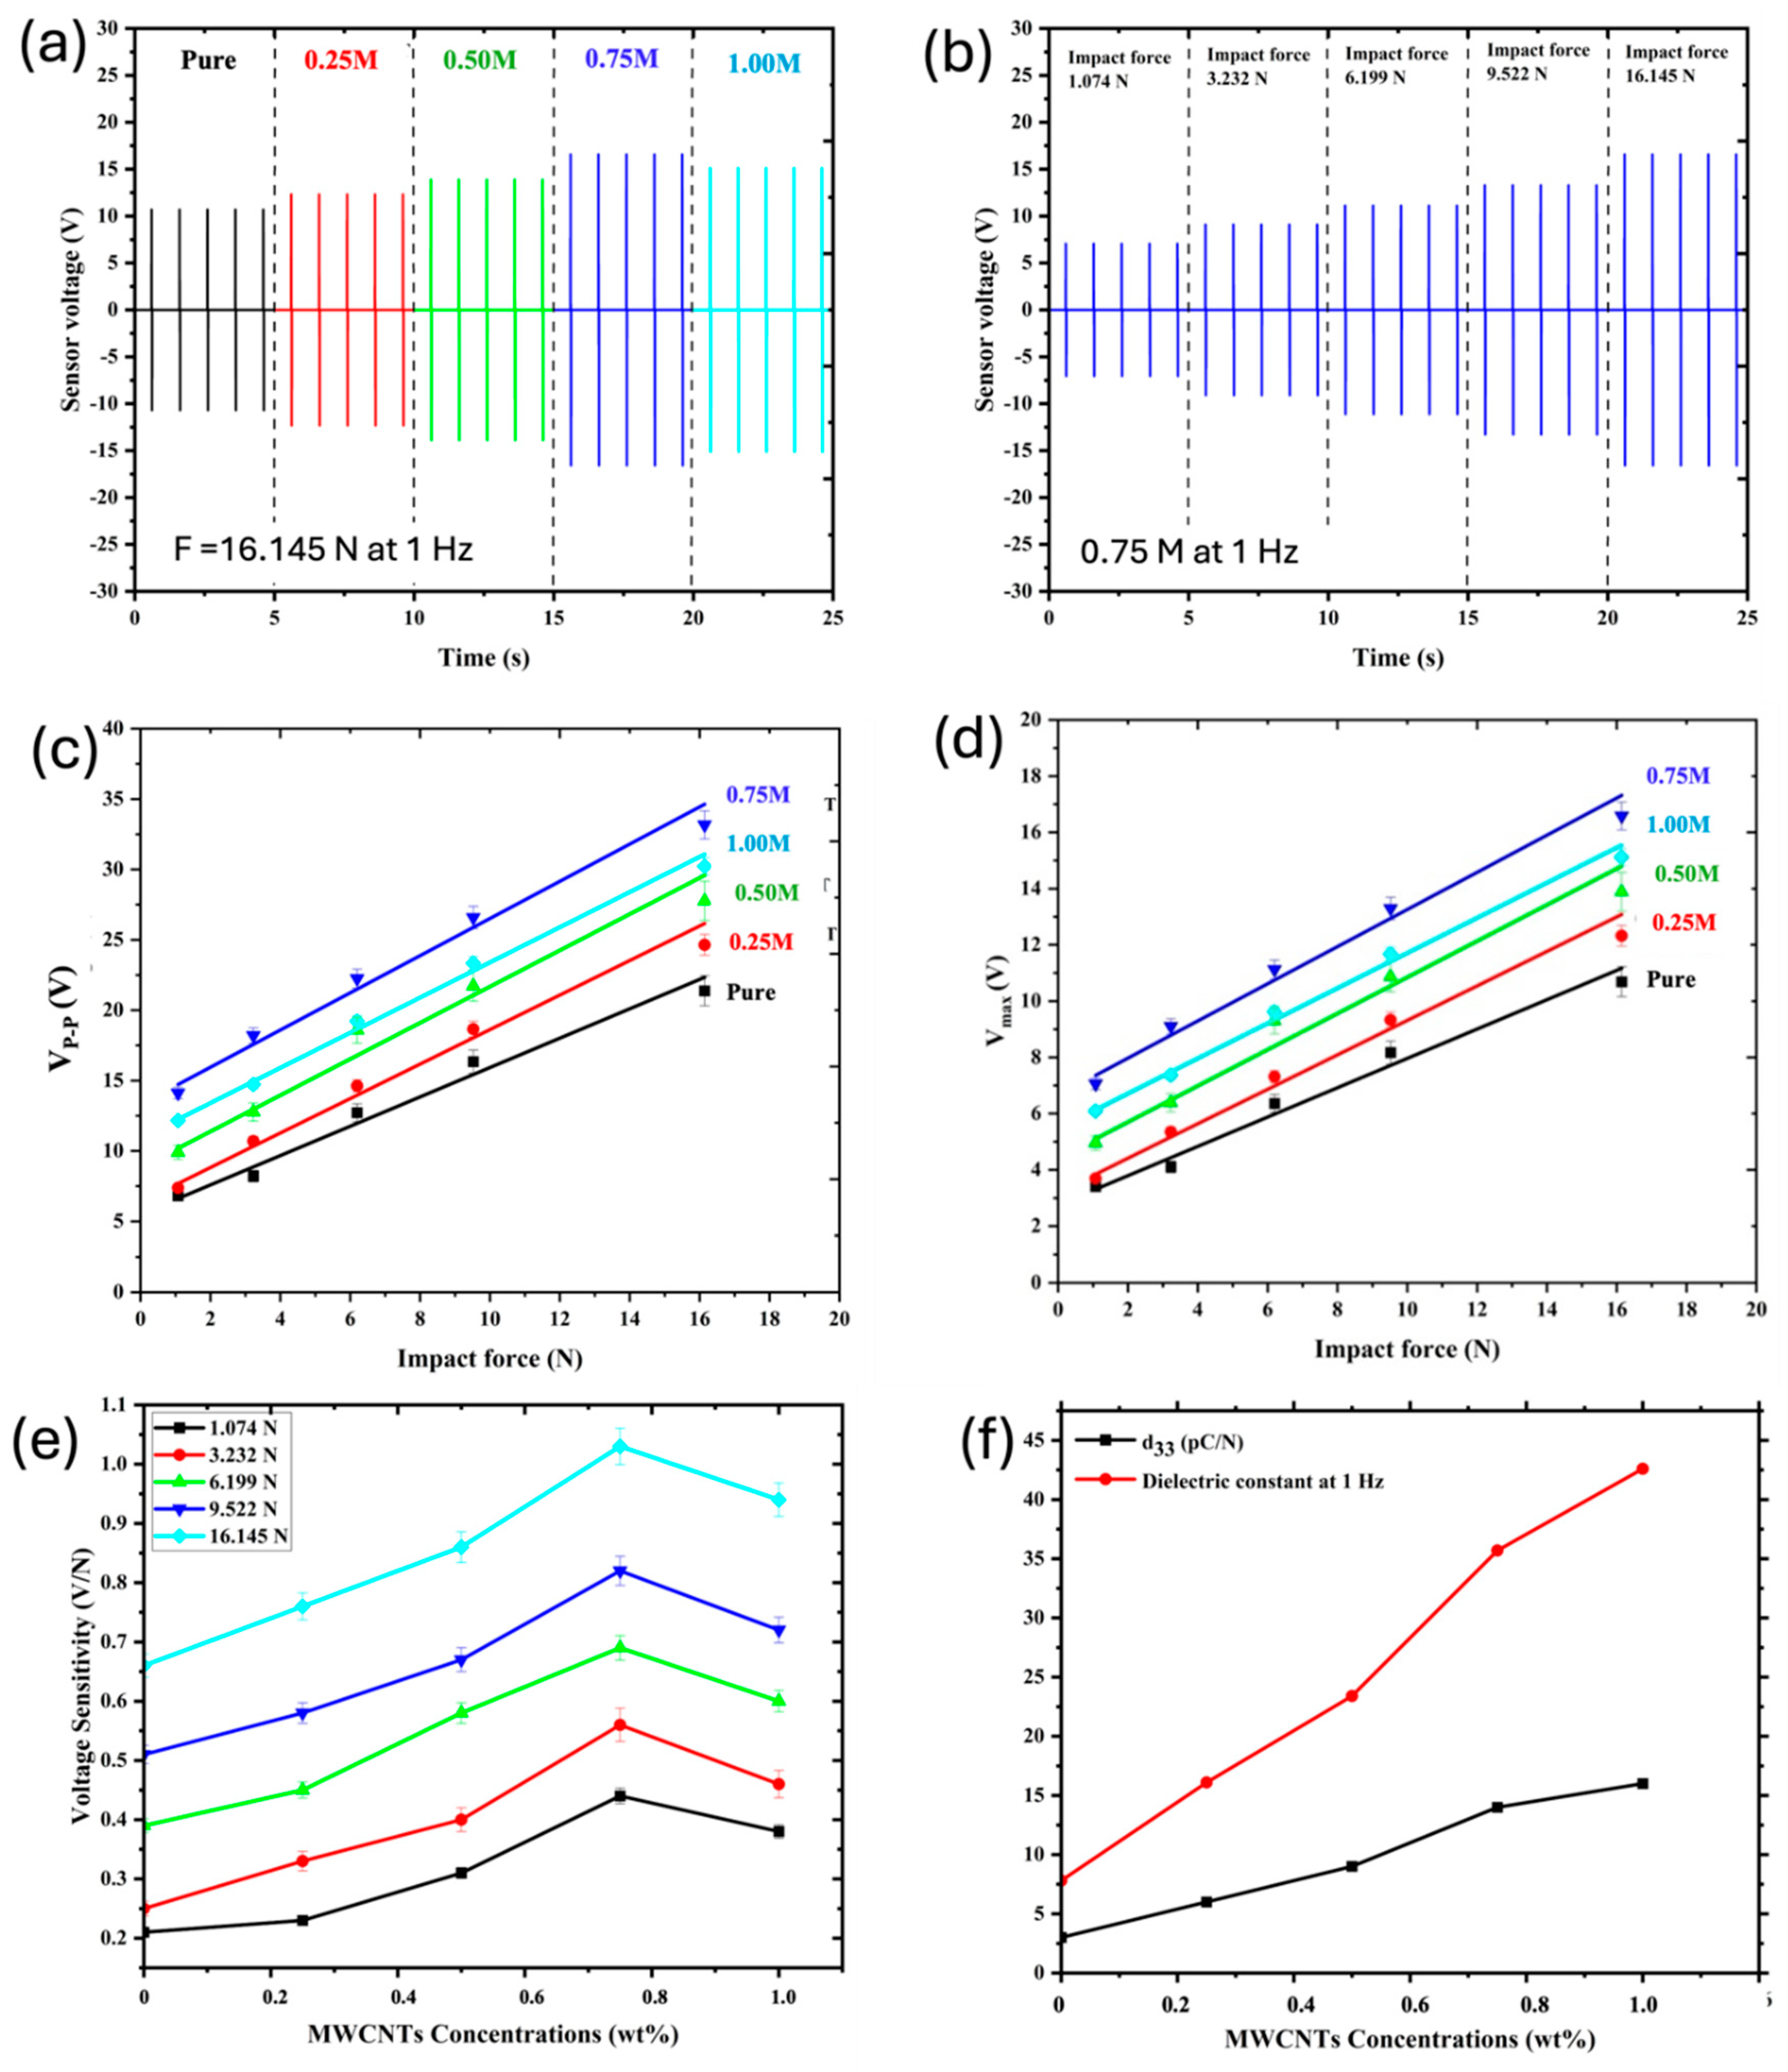

Table 1.
Calculated average pore size, porosity and Surface roughness (Sq) of pristine P(VDF-HFP) and MWCNTs/P(VDF-HFP) composite films, with various concentrations of MWCNTs; 0.25%, 0.50%, 0.75% and 1.00%.
Table 1.
Calculated average pore size, porosity and Surface roughness (Sq) of pristine P(VDF-HFP) and MWCNTs/P(VDF-HFP) composite films, with various concentrations of MWCNTs; 0.25%, 0.50%, 0.75% and 1.00%.
| P(VDF-HFP) Samples |
Average Pore Size( μm) |
Porosity(%) |
Surface Roughness(nm) |
| Pure P(VDF-HFP) | 0.31 ± 0.06 | 7.047 | 78.33 |
| 0.25%MWCNTs | 0.98 ± 0.01 | 14.421 | 89.82 |
| 0.50%MWCNTs | 1.25 ± 0.12 | 24.297 | 118.40 |
| 0.75% MWCNTs | 1.64 ± 0.12 | 34.588 | 129.73 |
| 1.00% MWCNTs | 1.85 ± 0.09 | 39.126 | 137.34 |
Table 2.
Phase structure results of pristine P(VDF-HFP) and MWCNT/P(VDF-HFP) composite films, with various concentrations of MWCNT; 0.25%, 0.50%, 0.75% and 1.00%.
Table 2.
Phase structure results of pristine P(VDF-HFP) and MWCNT/P(VDF-HFP) composite films, with various concentrations of MWCNT; 0.25%, 0.50%, 0.75% and 1.00%.
| P(VDF-HFP) samples | d-spacing [Å] | FWHM Total [rad] | Crystalline size (nm) | (%) | (%) |
*FEA (%) |
(%) |
(%) |
| Pure | 4.42837 | 0. 6652 | 2.12 | 50.04 | 46.71 | 41.5 | 39.09 | 14.21 |
| 0.25%MWCNTs | 4.43478 | 0.4605 | 3.06 | 53.62 | 40.32 | 45.5 | 35.07 | 24.60 |
| 0.50%MWCNTs | 4.43227 | 0.4093 | 3.67 | 53.65 | 39.12 | 47.0 | 34.46 | 26.42 |
| 0.75% MWCNTs | 4.43581 | 0.3838 | 3.44 | 53.82 | 36.21 | 53.7 | 32.36 | 31.44 |
| 1.00% MWCNTs | 4.4401 | 0.3070 | 4.59 | 54.83 | 29.16 | 63.0 | 29.75 | 41.08 |
* FEA values were calculated from FTIR results.
Table 3.
Thermal degradation behavior of pristine P(VDF-HFP) and MWCNT/P(VDF-HFP) composite films, with various concentrations of MWCNT; 0.25%, 0.50%, 0.75% and 1.00%.
Table 3.
Thermal degradation behavior of pristine P(VDF-HFP) and MWCNT/P(VDF-HFP) composite films, with various concentrations of MWCNT; 0.25%, 0.50%, 0.75% and 1.00%.
| P(VDF-HFP) samples | First thermal decomposition temperature | Mass loss | Second thermal decomposition temperature | Mass loss | Third thermal decomposition temperature | Mass loss | Residue Content |
| Pure | 51.72 | 0.79% | 462.15 | 76.45% | 559.6 | 13.22% | 9.54% |
| 0.25M | 52.31 | 0.74% | 463.98 | 76.01% | 560.41 | 13.25% | 10.00% |
| 0.50M | 52.68 | 0.69% | 464.2 | 72.54% | 571.31 | 13.41% | 13.36% |
| 0.75M | 57.1 | 0.90% | 464.75 | 72.19% | 577.66 | 13.18% | 13.73% |
| 1.00M | 58.66 | 0.85% | 468.03 | 72.01% | 574.04 | 12.15% | 15.98% |
Table 4.
Tensile properties of pristine P(VDF-HFP) and MWCNT/P(VDF-HFP) composite films, with various concentrations of MWCNT; 0.25%, 0.50%, 0.75% and 1.00%.
Table 4.
Tensile properties of pristine P(VDF-HFP) and MWCNT/P(VDF-HFP) composite films, with various concentrations of MWCNT; 0.25%, 0.50%, 0.75% and 1.00%.
| P(VDF-HFP) sample | Tensile strength (MPa) | Elongation at break (%) | Young’s modulus (MPa) |
| Pure | 14.56 | 92.11 | 1.93 |
| 0.25M | 18.9 | 53.95 | 7.33 |
| 0.50M | 20.54 | 47.94 | 8.09 |
| 0.75M | 23.01 | 24.50 | 9.06 |
| 1.00M | 45.13 | 21.44 | 17.76 |
Table 5.
Sensor response description of pristine P(VDF-HFP) and MWCNTs/P(VDF-HFP) composite films with various concentrations of MWCNT; 0.25%, 0.50%, 0.75% and 1.00%, with different applied force at 1 Hz.
Table 5.
Sensor response description of pristine P(VDF-HFP) and MWCNTs/P(VDF-HFP) composite films with various concentrations of MWCNT; 0.25%, 0.50%, 0.75% and 1.00%, with different applied force at 1 Hz.
| Applied force (N) |
Sensor response at 1 Hz |
P(VDF-HFP) sample | ||||
| Pure | 0.25M | 0.50M | 0.75M | 1.00M | ||
| 1.074 N | Vp-p (V) | 6.80 | 7.38 | 9.90 | 14.12 | 12.26 |
| V max (V) | 3.40 | 3.69 | 4.95 | 7.06 | 6.08 | |
| V max/1.074 (V/N) | 0.21 | 0.23 | 0.31 | 0.44 | 0.38 | |
| 3.232 N | Vp-p (V) | 8.20 | 10.7 | 12.76 | 18.2 | 14.72 |
| V max (V) | 4.10 | 5.35 | 6.38 | 9.10 | 7.36 | |
| V max/3.232 (V/N) | 0.25 | 0.33 | 0.40 | 0.56 | 0.46 | |
| 6.199 N | Vp-p (V) | 12.72 | 14.62 | 18.58 | 22.24 | 19.22 |
| V max (V) | 6.36 | 7.31 | 9.29 | 11.12 | 9.61 | |
| V max/6.199 (V/N) | 0.39 | 0.45 | 0.58 | 0.69 | 0.60 | |
| 9.522 N | Vp-p (V) | 16.34 | 18.66 | 21.72 | 26.58 | 23.34 |
| V max (V) | 8.17 | 9.33 | 10.86 | 13.29 | 11.67 | |
| V max/9.522 (V/N) | 0.51 | 0.58 | 0.67 | 0.82 | 0.72 | |
| 16.145 N | Vp-p (V) | 21.38 | 24.64 | 27.76 | 33.16 | 30.22 |
| V max (V) | 10.69 | 12.32 | 13.88 | 16.58 | 15.11 | |
| Vmax/16.145 (V/N) | 0.66 | 0.76 | 0.86 | 1.03 | 0.94 | |
Disclaimer/Publisher’s Note: The statements, opinions and data contained in all publications are solely those of the individual author(s) and contributor(s) and not of MDPI and/or the editor(s). MDPI and/or the editor(s) disclaim responsibility for any injury to people or property resulting from any ideas, methods, instructions or products referred to in the content. |
© 2025 by the authors. Licensee MDPI, Basel, Switzerland. This article is an open access article distributed under the terms and conditions of the Creative Commons Attribution (CC BY) license (http://creativecommons.org/licenses/by/4.0/).
Copyright: This open access article is published under a Creative Commons CC BY 4.0 license, which permit the free download, distribution, and reuse, provided that the author and preprint are cited in any reuse.


