
Submitted:
20 October 2025
Posted:
24 October 2025
You are already at the latest version
Abstract
Multifiber polyvinylidene fluoride (PVDF), a thermoplastic polymer, was produced as a one-dimensional nanostructure via the electrospinning technique. Due to the peculiar properties attributed to the nanoscale fiber dimension, PVDF material, as pure, and with the addition of hexafluoropropylene (HFP) and/or graphene oxide (GO), was thoroughly characterized in terms of morphology, density, optical and electrical properties, surface wettability, mechanical resistance, and other physical characteristics. PVDF, with a multifiber surface, with or without the addition of other elements, has been demonstrated to have a strong capacity to absorb high concentrations of gases, water, nanoparticles, and other substances. It is an optimum biocompatible material, exhibiting dielectric behavior, and possesses soft and shock-absorbing polymer properties, making it useful for various applications, some of which will be presented and discussed in this work. A detailed comparison was made between bulk PVDF, multifiber PVDF, and PVDF containing HFP and/or GO, highlighting the changes in polymer properties.
Keywords:
PVDF
; HFP
; GO
; nanofiber
; electrospinning
; polymer properties
1. Introduction
Polyvinylidene fluoride (PVDF) is a semi-crystalline thermoplastic fluoropolymer that is readily melt-processible, can be fabricated by injection and compression molding, can be used up to about 150°C, combines high mechanical strength with good processability, and has strong piezoelectric properties.
PVDF represents an interesting material in the market for its numerous applications. It is widely used in high-tech applications. These include mainly chemical process equipment and electrical and electronics applications. The molecular structure of PVDF is constituted by chains with alternating CH2 and CF2 groups, as described in Figure 1:
The PVDF melting point is 178°C, the density 1.78 g/cm3, the tensile strength and modulus at 23°C are about 50 MPa, and 1700 MPa, respectively, the Coefficient of thermal expansion is about 10-4, the dielectric constant at 1 kHz is about 10, the dissipation factor at 1 kHz about 0.018, its resistivity is about 1016 W cm [1]. PVDF has high thermal stability, chemical resistance, biocompatibility, and processability. It is used in the biomedical field to realize biomembranes. The PVDF is a hydrophobic polymer; its water absorption in 24 hr is very low, of about 0.04 wt%.
PVDF is a semicrystalline polymer containing one or more crystalline phases, known as a, b, g, d, dispersed in the amorphous regions [2]. Due to the dipoles created by the positive hydrogen atoms and the negative fluorine, the PVDF structure, with chemical composition -C2H2F2- generates a strong polarization that results in a piezoelectric behavior. The realization of PVDF by the electrospinning deposition process permits the realization PVDF surface rich in nanometric multifiber, making its surface highly absorbent of water, gas, nano, and microparticles.
Electrospinning is a simple method for producing nanofibers or nanowires, resulting in large surface areas and highly porous structures with diameters ranging from nanometers to micrometers. This deposition process uses an electrostatic field, applied between the metallic needle emitting the molecular spray and the substrate on which the film will be deposited, which permits control over the fiber dimensions and morphology [3]. Moreover, the incorporation of fillers during electrospinning permits to realization of more complex structures with peculiar properties, such as those obtained by inserting GO nanoparticles (NPs) in polystyrene and polymethylmethacrylate [4, 5].
Graphene oxide is a compound of carbon, oxygen, and hydrogen in variable ratios, obtained by treating graphite with strong oxidizers and acids. Graphene oxide can be reduced by ion irradiation [6], laser irradiation [7], besides other approaches to obtain reduced graphene oxide (rGO). Generally, the C/O ratio ranges between 2 and 3, and the oxygen content is significant. Reducing the oxygen content, the GO properties increasingly resemble those of graphene, i.e., becoming with higher density and electrical conductivity. GO has a low density of about 1.5 g/cm3 and is an insulating material [8].
Hexafluoropropylene (HFP) is the fluoroalkene with the formula CF3CF=CF2, i.e., with a chemical compositional -C3F6-, with an F/C atomic composition 2/1, equal to that of polytetrafluoroethylene. It can be produced by the pyrolysis of tetrafluoroethylene. It is insulating, hydrophobic, and has properties similar to those of CF2 [9].
Literature reports that the PVDF-HFP copolymer contains amorphous domains capable of trapping a large amount of liquid electrolytes, and its crystalline phase acts as a mechanical support [10]. Both GO and HFP were employed as nanoparticles to be embedded into PVDF at high concentration (from 10 to 50 wt%) and to change the chemical and physical properties of the multifiber polymer. Literature reports that the chemical and physical properties of PVDF can be strongly altered by the presence of copolymers, doping, and treatments [11].
In the ambit of polymer synthesis with innovative techniques using ion beams, lasers, UV and X-rays, electron beams, and electro-spinning, the insertion of other molecules in its structure significantly changes the physical and chemical properties [12, 13, 14, 15]. In this paper will be investigated the physical properties of electrospinning multifiber PVDF without and with the insertion of GO and HFP, concerning those of the pristine PVDF bulk, to put in evidence the advantages and peculiarities of the obtained multifiber compounds.
2. Materials and Methods
Polyvinylidene fluoride (PVDF) and polyvinylidene fluoride with the addition of hexafluoropropylene (PVDF-HFP), dimethylformamide (DMF), acetone, and graphene oxide (GO) powder (average number of layers, 15–20) were used for the production of fibers or wires. All reagents were purchased from Merck Life Science S.r.l. (Milano, Italy).
2.1. Sample Preparation
The production of electrospun microfibers started with the preparation of the polymeric solutions, according to the following procedure: for PVDF microfibers, the pellets were dissolved in a mixture of DMF and acetone and then stirred at 250 RPM for 2 hours at 50°C. Instead, to obtain the PVDF-GO, the pellets were first dissolved in DMF and acetone, stirred at 250 RPM for 2 hours at 50°C, and finally GO was dissolved in the solution and stirred at 250 RPM for 24 hours. Similarly, the same procedure was followed in the case of both samples, PVDF-HFP and PVDF-HFP-GO.
For the production of electrospun mats, polymeric solutions were first introduced into a 10 mL glass syringe equipped with a 1 mm metal needle for the electrospinning process. A pump was utilized to regulate the flow rate at approximately 0,020 ml/min. The electrospinning procedures were conducted at 25°C with a relative humidity of 40%.

Table 1.
Summary of the electrospinning parameters used to produce each sample.
|
Sample Code |
Weight ratio Polymer/Solvent |
Weight Ratio Additive/Polymer |
Voltage (kV) |
Flow Rate (μL/min) |
Needle to Collector Distance (cm) |
| PVDF | 16.0/84.0 | - | 12.5 | 20.0 | 15.0 |
| PVDF-HFP | 16.0/84.0 | - | 12.0 | 20.0 | 15.0 |
| PVDF-GO | 16.0/84.0 | 10.0/90.0 | 11.5 | 20.0 | 15.0 |
| PVDF-HFP-GO | 16.0/84.0 | 10.0/90.0 | 12.0 | 20.0 | 15.0 |
2.2. Techniques of Analysis
The Attenuated Total Reflectance (ATR) coupled to the Fourier Transform Infrared (FTIR) spectroscopy was employed to characterize the transmittance and absorbance of the investigated polymers. A Jasco AT/IR 4600 spectrometer was employed in the wavenumber range 400-4500 cm-1 with a resolution of 4 cm-1.
UV-Visible optical spectroscopy was performed in the wavelength region 250-850 nm by using the Jasco V-750 double-beam spectrophotometer for high-resolution measurements, with a spectral bandwidth that can be set as narrow as 0.1 nm.
The morphological characterization of electrospun microfibers was performed using scanning electron microscopy (SEM) (Phenom ProX, Thermo Fisher Scientific, Waltham, MA, USA).
The optical microscopy was used for preliminary observation of the prepared polymers and measurement of polymer surface wetting. Based on the sessile drop technique, the wetting angle of distilled water was measured at room temperature, 1 atm pressure, and 50% humidity, using drops of 2 μL volume deposited with a micro-syringe on the polymer surface and PC controlled online through the optical microscope at 8X magnification.
XRD spectra were collected by a Panalytical Empyrean S-2 diffractometer, using Cu Ka radiation (1.54056 Å) at 40 kV and 40 mA. The patterns were recorded in step scan mode from 10–60° 2q angles in steps of 0.02° and a count time of 5 s per step.
The electrical characterization of the investigated polymers was performed by analyzing the frequency dependence of the real part 1 of permittivity, the imaginary part 2 of permittivity, and the loss tangent tan in the (103 ÷ 106) Hz range at room temperature using an Agilent 4284A precision LCR meter [16]. The samples were sandwiched between two symmetric stainless-steel electrodes of the Keysight 16451B dielectric material test fixture, and a 2V peak-to-peak voltage was applied. The guarded electrode had an area of about 19.64 mm2.
A tensile strength test was carried out over electrospun fibers to study their mechanical behaviour. For the tensile strength test, a Zwicki 2.5 kN machine coupled with a load cell of 200 N was used; the gauge length was fixed at 30 mm, and the tensile speed was set at 0.5 mm/min. To obtain an average value, three fiber samples were tested for each polymer.
3. Results and Discussion
The first investigation concerns the SEM observations of the polymer morphology without and with the GO and HFP components.
Many samples have been investigated using SEM, optical spectroscopy, besides other techniques, and our analysis has concerned:
- 1)
- PVDF foils, 100 microns thickness, investigated as bulk, without and with 10 wt% GO, and as electrospun multifiber with and without 10 wt% GO.
- 2)
- PVDF-HFP foils, 100 microns thickness, investigated also as bulk, without and with 10 wt% GO, and as electrospun multifiber with and without 10 wt% GO.
Figure 2 reports the photos of the eight types of different polymer objects of this investigation: PDVF bulk (a), PVDF bulk+10 wt% GO (b), PVDF multifiber (c), and PVDF multifiber +10 wt% GO (d). The PVDF bulk foils without and with HFP bulk are transparent. The polymers containing GO are grey or black, the spun multifiber polymers are white or black if not contain GO or contain GO nanoparticles, respectively.
Electron microscopy, performed at 10 kV and generally at 2000X, has shown a high degree of micrometric diameter fiber density distributed in random directions with a length of the order of 0.1-1 mm. Figure 3a reports an SEM photo of the pristine pure multifiber PVDF fibers morphology at 2000X magnification, indicating an average fiber diameter of 3 μm. Figure 3b reports on the multifiber PVDF with 10 wt% GO nanoparticles. In this case, it is possible to observe a minor fiber diameter and the presence of many micrometric beads. Typically, solvent evaporation rate impacts fiber solidification (i.e., diameter, bead formation). Dimethylformamide (DMF) is a low-volatility solvent, affecting the features of the electrospinned PVDF. The average fiber diameter goes down to 1.2 mm.
Figure 3c reports the SEM image of the multifiber PVDF with 50 wt% HFP, indicating a minor fiber diameter, with an average value goes down to about 0.75 mm. Figure 3d is relative to the image of the PVDF containing both HFP and GO, at 50 wt% and 10 wt %, respectively, showing a further fiber diameter reduction; in fact, its average value goes down to 0.55 mm.
Thus, a first result derives from the fibers' diameter decreasing, from about 3 mm up to about 0.5 mm, with the insertion in the PVDF of GO, HFP, and HFP+GO, as evident from the plot of Figure 4, where the fiber diameter measurements have a bar error of about 10%. The average fiber diameter decrease produces a minor polymer porosity, a higher polymer density, and a multifiber density enhancement, changing the final properties of the sample. Figure 4 also reports the pore average size in the case of the four types of electrospun polymers. The pore size decreases with the fiber diameter, from about 10 mm at high fiber diameters up to about 4 mm at low fiber diameters.
The mechanical properties of the multifibers were obtained by applying a tensile strength test, measuring the stress as a function of the strain. Figure 5 reports the obtained results for PVDF multifiber with and without GO (a) and those for PVDF-HFP multifiber with and without GO (b). The mechanical properties of the multifiber systems revealed substantial differences depending on the polymer matrix and the incorporation of GO.
The pristine PVDF multifiber displayed moderate tensile strength (≈13 N/g of fibers) and a relatively low strain at break (≈6.5%), indicating a material with limited ductility and only modest load-bearing capacity. When GO was introduced into the system, the PVDF-GO multifiber exhibited a slight increase in tensile strength (≈13.5 N/g), while maintaining a similar strain at break (≈6.0%). This modest improvement suggests that GO interacted favourably with the PVDF matrix, possibly acting as a stress-transfer medium without negatively impacting deformability. Although the absolute gain was small, it points to a potential reinforcing effect of GO in pure PVDF systems. In contrast, the PVDF-HFP multifiber demonstrated outstanding mechanical performance, combining a very high tensile strength (≈190 N/g) with exceptional elongation at break (≈130%). This remarkable balance of strength and ductility indicates a tough material capable of withstanding both high stresses and large deformations. However, the incorporation of GO into the copolymer drastically altered this behaviour. The PVDF-HFP-GO multifiber exhibited a sharp reduction in mechanical properties, with maximum stress dropping to ≈40 N/g and strain at break limited to ≈60%. The stress–strain curve also revealed an unstable response with earlier failure, consistent with a brittle fracture. These findings suggest that GO was not well integrated into the PVDF-HFP matrix, likely due to incompatibility or poor dispersion, resulting in the formation of structural defects and localized stress concentrators.
Overall, the comparative analysis highlights two distinct scenarios: in PVDF, GO acted as a mild reinforcing agent, whereas in PVDF-HFP, it compromised the excellent intrinsic toughness of the copolymer. This dual behaviour emphasizes the critical role of matrix composition in determining the reinforcing efficiency of nanofillers. It also underscores the importance of optimizing filler–matrix compatibility and dispersion to achieve the desired mechanical performance in polymer nanocomposites.
XRD analysis evinces the crystallinity of the investigated polymer and puts in evidence the differences between the bulk and the multifiber polymer. Moreover, it shows the difference in PVDF when HFP is added at 50% modifying the matrix composition.
The main results of the XRD analysis are reported in the spectra comparison shown in Figure 6. The spectra indicate that PVDF is a semicrystalline polymer exhibiting different crystalline forms, especially on the most common α, β, and γ phases. The XRD analyses indicate that the XRD patterns of the PVDF foils exhibited two intense diffraction peaks at 18.4 and 20.0° and a low peak at 26.6°, as indicated in the spectrum of Figure 6c, corresponding to 020, 110, and 021 reflections of the monoclinic α-phase crystal, respectively [17, 18]. Also, the three weak peaks at 36.4, 39.1, and 41.8°, indicated in Figure 6c, correspond to 200, 002, and 111 reflections of the monoclinic α-phase crystal, respectively [18]. Thus, well evident is the a phase of the polymer, while the phases b, and g are less evident due to weaker diffraction peaks.
Figure 6a indicates that the crystallinity is higher in the multifiber case concerning the bulk PVDF foil, probably due to the most exposed surface in the case of the multifiber sample. Figure 6b indicates that the PVDF-HFP polymer bulk has a crystallinity higher than the multifiber version. The insertion of HFP in PVDF and the electrospinning process does not significantly alter the angular position of the diffraction peaks, but it narrows the diffraction peak and significantly reduces its intensity, indicating that its contribution, even in high concentration, is like that of an amorphous, without typical diffraction peaks. Figure 6c shows that the crystallinity in PVDF bulk is much less than in the PVDF-HFP bulk polymer, which maintains high semicrystallinity. Finally, Figure 6d indicates that the PVDF and the PVDF-HFP multifiber polymers have a very similar crystallinity, confirming the absence of crystallinity in the added HFP copolymer.
A further analysis of the characterization of the four multifiber polymers, including the PVDF-based one, has been performed using ATR-FTIR spectroscopy. Figure 7 reports the FTIR transmittance spectra comparison between the investigated multifiber polymers: PVDF bulk, transparent, PVDF multifiber, white, and PVDF multifiber with 10 wt% GO, black. The average transmittance is about 98% with a slight decrease for the bulk PVDF due to its higher density with respect to the multifiber type.
Such spectra are complex because they show many characteristic absorption peaks due to the presence of the different crystallographic phases of the polymer. The characteristic bands of α phase are around at 410, 489, 532, 614, 763, 795, 854, 975, 1149, 1209, 1383 and 1423 cm−1, whereas characteristic bands of the β and γ phases are around at 445, 473, 1275 and 1431 cm−1 and around at 431, 482, 811, 1234 and 1429 cm−1, respectively, according to the literature [19, 20]. The a, b crystalline phases are the main components, while the g phase is negligible.
The strong peak for the CO group at 1178 cm-1 and that of NO at 1538 cm-1 indicate high oxygen and air absorption of the multifiber species without GO due to its high porosity. It decreases in the case of PVDF with GO, which has a minor porosity, but remains as the typical functional groups of oxygen present in this material [21].
The spectra have the same IR absorption peaks, decreasing the average transmittance due to the significant vibrational states of the groups of OH, CO2, CO, NO, CH2, and CF2. The C=C contribution comes from the GO addition.
Figure 8 reports the FTIR transmittance spectra comparison between the investigated multifiber polymers: PVDF-HFP bulk, transparent, PVDF-HFP multifiber, white, and PVDF-HFP multifiber with 10 wt% GO, black. The average transmittance is about 95% in the case of PVDF-HFP bulk and multifiber, but decreases to about 90% or less in the case of PVDF-HFP multifiber with GO, due to different molecular groups being absorbed by both the multifiber and the GO. In this case seems that the GO, although at a concentration of 10 wt%, can absorb much more water and CF2 groups, in addition to the usual oxygen functional groups, than in the case of PVDF+HFP multifiber and bulk version.
A further characterization of the investigated polymers was performed using the sessile method of water wetting of their surface at room temperature (20 °C), atmospheric pressure (1 atm), and 50% water humidity. All such polymers are hydrophobic, but their degree of hydrophobicity depends on the composition and morphology of the surface. Figure 9 reports a lot of optical microscope photos of a 2 mL distilled water drop deposited on the surface of different types of polymers. In particular, Figure 9a shows the contact angle with the bulk PVDF surface of 81°, Figure 9b that of PVDF multifiber of 152°, and Figure 9c that of PVDF multifiber with 10 wt% GO nanoparticles, of 138°. Thus, for this polymer, the hydrophobicity increases significantly from the bulk morphology to the phase of electrospun multifiber, and then decreases due to the insertion of the GO nanoparticles. Similar results, but with a higher hydrophobicity, have been obtained for the PVDF-HFP polymer, showing a contact angle of 90° for the bulk version, 165° in the case of PVDF+HFP multifiber, and 140° for the PVDF+HFP+10 wt% GO.
The dielectric constant measurements performed on the various investigated polymers have been compared, and the results, plotted as a function of frequency and of the type of polymer, are summarized in Figure 10 [22].
Figure 10a reports the dielectric real constant e1 as a function of the frequency and of the type of analyzed polymer. The bulk matter has a higher dielectric constant (of the order of 10 - 17) than the multifiber (of the order of 2.4 -3.4), as expected due to the presence of air and water vapor between the fibers. The insertion of HFP and GO in PVDF enhances the dielectric constant. Figure 10b reports the dielectric imaginary constant e2 as a function of the frequency and of the type of analyzed polymer. Also, in this case, the bulk matter has a higher dielectric constant than the multifiber, and the insertion of HFP and GO in PVDF enhances the dielectric imaginary constant, maintaining the order observed for the real component.
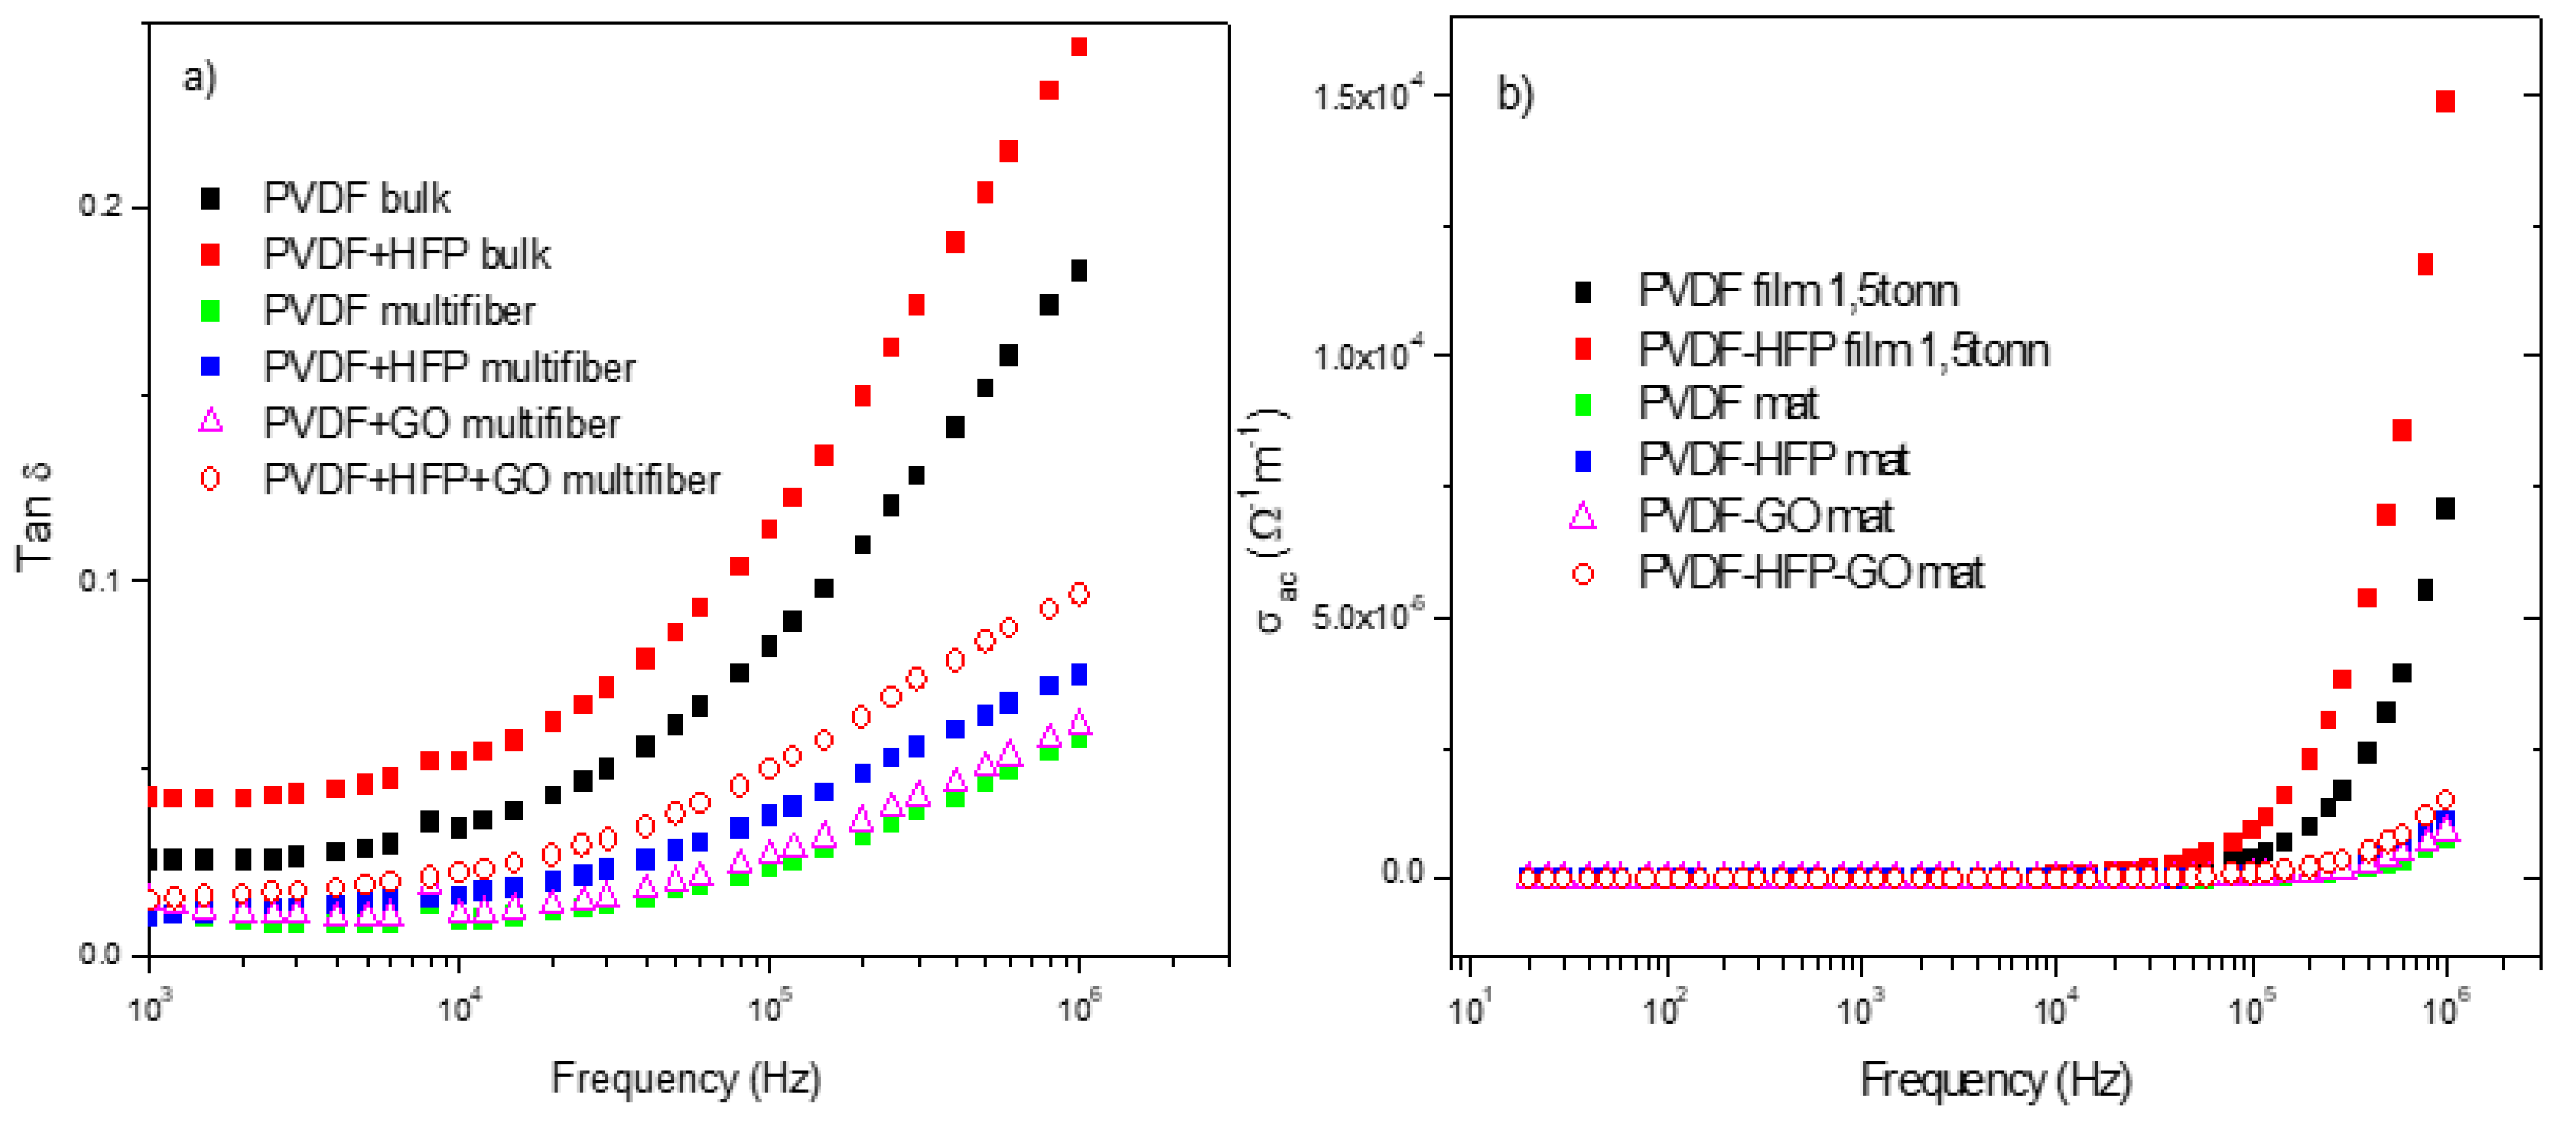
Furthermore, measurements of the ratio of the loss current to the charging current, i.e., the loss tangent tan d, and of the polymer's weak electrical conductivity s have been acquired as a function of the frequency and of the type of investigated polymer.
Figure 11a reports the comparison between the measurements of tan d vs. frequency and polymer type. The tan d has higher values for the OVDF and PVDF+HFP bulk foils and minor values for the multiwfiber polymers, of which the higher value is obtained for the PVDF+HFP+GO, maintaining the previous reported order. From such data, it is possible to evaluate the weak electrical conductivity of the different polymers vs. frequency, as reported in Figure 11b. For all polymers, the electrical conductivity is practically zero from low frequency up to about 1 MHz; only for higher frequency it shows some increment at values of the order of 10-4/Wm.
Some words about the possible application of the investigated polymers. PVDF with and without HFP and GO may find interesting applications in different fields. The possibility to use them as multifiber with different densities, diameters, and lengths allows them to be used in creating membranes and filters that trap various liquid, solid, and gaseous substances between the fibres [23]. The absorption of water and higher-viscosity liquids is well known, while the absorption of micro- and nanoparticles is also possible thanks to the high porosity of multifiber polymers. Gas absorption is possible, especially with the inclusion of GO nanoparticles that trap various types of gases, such as oxygen, and retain various oxygen functional groups. Thus, polymers can be employed to filter gases for toxic species, to filter water for desalination, and to accumulate certain species of micro- or nanoparticles during industrial processes, acting as filters for polluting material.
Further applications can be found in the biomaterials, microelectronics, chemical treatments, optical devices, sensors, and others, as reported in the literature [24, 25, 26, 27].
4. Conclusions
Innovative polymers for their production as a multifiber have been compared to their bulk version and modified by inserting another copolymer and/or carbon nanoparticles as graphene oxide. The results of these electrospinning processes produce polymers with peculiar properties, especially for filtering and absorbing high quantities of liquids, gases, and micro and nanoparticles.
The investigated polymers are based on the properties of PVDF and were electron-spun using the addition of GO and HFP copolymer separately, or together. The obtained copolymers have been studied from the point of view of their nano and micrometric morphology, diffraction patterns for the semi-crystalline nature, IR transmission spectroscopy to identify the main vibrational molecular groups essentially based on C, O and H, to understand their elasticity from stress-strain response, to measure their wetting ability on different surfaces, and to evaluate their dielectric constant for the dielectric behaviour as a function of frequency. Such additions to PVDF polymer chains, in fact, modify the chemical and physical properties of the copolymer, making it more suitable for certain applications.
The most important innovation is due to the electrospinning process developed using peculiar characteristics and to the ability to add to PVDF other polymeric species, such as the HFP, or to add the insulator nanoparticles of GO, and adding together HFO and GO. These additions modify the fiber densities, the density and porosity of the fibrous polymer, the mechanical and elastic response, the semicrystalline structures determined their lattice, the composition of the main molecular groups related to PVDF, the dielectric properties, and the wettability of their surface, which are always highly hydrophobic. Indeed, the simplicity and scalability of the proposed technique would make it easy to be used in whatever field, would be flexible in materials composition, and would not be expensive for commercialization purposes. They find applicability to membranes, air filtration and protection, water filtration and desalination, retention of fine dust and toxic gases, sensors, tissue engineering, medical prostheses, flexible electronic support, and other.
Author Contributions
Data Availability Statement
The original contributions presented in this study are included in the article. Further inquiries can be directed to the corresponding author.
Acknowledgments
The research was supported by the European Union-Next Generation EU for the Italian PNRR ‘Carbon dots for advanced bio-medical imaging and beyond (CAR-BIO-MED)’ CUP J53D23016220001-CI P2022M33MS coordinated at MIFT Department of Messina University by L. Torrisi.
Conflicts of Interest
References
- Omnexus; polyvinylidene-fluoride-pvdf, actual website July 2, 2025. https://omnexus.specialchem.com/selection-guide/polyvinylidene-fluoride-pvdf-plastic.
- Harrison, J.S.; Ounaies, Z.; Polymers, P. , NASA Technical Reports Server (NTRS), Hampton, 2001,Virginia, EUA.
- Bonakdar, M.A.; Rodrigue, D. Electrospinning: Processes; Structures; Materials. Macromol 2024, 4, 58–103. [Google Scholar] [CrossRef]
- Torrisi, L.; Silipigni, L.; Torrisi, A.; Cutroneo, M.; Malara, A.; Fotia, A.; Frontera, P. , Physical characterization of multiwire polystyrene produced by electrospinning technique, Polymers 2025, submitted.
- Torrisi, L.; Torrisi, A.; Cutroneo, M.; Malara, A.; Nunnari, C.; Fotia, A.; Frontera, P.; PMMA, E.M. , ECJS of Solid State Science and Technology, submitted 2025.
- Cutroneo; M; Havranek; et al. , Localized deoxygenation of graphene oxide foil by ion microbeam writing, VACUUM 2019, 163, 10–14.
- Cutroneo; M; Torrisi et al. Localized modification of graphene oxide properties by laser irradiation in vacuum, VACUUM 2019, 165, 134–138.
- Torrisi, L.; Cutroneo, M.; Torrisi, A.; Silipigni, L. Measurements on Five Characterizing Properties of Graphene Oxide and Reduced Graphene Oxide Foils. Physics Status Solidi A 2022, 219, 2100628. [Google Scholar] [CrossRef]
- Siegemund, G.; Schwertfeger, W.; Feiring, A.; Smart, B.; Behr, F.; Vogel, H.; McKusick, B.; Kirsch, P. 2016), Fluorine Compounds, Organic, Ullmann's Encyclopedia of Industrial Chemistry. Weinheim: Wiley-VCH. ISBN 978-3-527-30673-2. [CrossRef]
- Wilson, J.; Ravi, G.; Kulandainathan, M.A. Electrochemical Studies on Inert Filler Incorporated Poly(Vinylidene Fluoride – Hexafluoropropylene) (PVDF – HFP) Composite Electrolytes. Polímeros: Ciência e Tecnologia 2006, 16, 88–93. [Google Scholar] [CrossRef]
- Edwards, T.R.; Shankar, R.; Smith, P.G.H.; Cross, J.A.; Lequeux, Z.A.B.; Kemp, L.K.; Qiang, Z.; Iacano, S.T.; Morgan, S.E.; Crystallinity, P. ; Printability, and Piezoelectric Characteristics of Polyvinylidene Fluoride (PVDF)/Poly(methyl methacrylate) (PMMA)/Cyclopentyl-Polyhedral Oligomeric Silsesquioxane (Cp-POSS) Melt-Compounded Blends, ACS Appl. Polym. Mater. 2024, 6, 5803–5813. [Google Scholar]
- Fragalà, M.E.; Compagnini, G.; Torris, L.; Puglisi, G. , Ion beam assisted unzipping of PMMA, Nucl. Instr. and Methods B 1998, 141, 169–173. [Google Scholar] [CrossRef]
- Torris, L.; Percolla, R. , Ion beam processing of polyvinylidene fluoride, Nucl. Instr. and Methods B 1996, 117, 387–391. [Google Scholar] [CrossRef]
- L. Torrisi, L. L. Torrisi, L. Silipigni, A. Torrisi, M. Cutroneo, A. Malara, A. Fotia, C. Nunnari, P. Frontera, Physical Characterization of Multifiber Polystyrene Produced by Electrospinning Technique.
- Fotia, A.; Malara, A.; Paone, E.; Bonaccorsi, L.; Frontera, P.; Serrano, G.; Caneschi, A. Self Standing Mats of Blended Polyaniline Produced by Electrospinning. Nanomaterials 2021, 11, 1269. [Google Scholar] [CrossRef] [PubMed]
- Dielectric Constant and Loss, actual website July 2, 2025. Dielectric Constant and Loss Capacitor Phasor Diagram Measurement Ranges.
- Nishiyama, T.; Sumihara, T.; Sasaki, Y.; Sato, E.; Yamato, M. Crystalline structure control of poly(vinylidene fluoride) films with the antisolvent addition Method, Polym J 2016, 48, 1035–1038. [CrossRef]
- Caia, X.; Lei, T.; Sund, D.; Lin, L. , A critical analysis of the α, β and γ phases in poly(vinylidene fluoride) using FTIR. RSC Adv. 2017, 7, 15382–15389. [Google Scholar] [CrossRef]
- Medeiros, K.A.R.; Rangel, E.Q.; Sant’Anna, A.R.; Louzada, D.R.; Barbosa, C.R.H. J.R.M. d’Almeida, Evaluation of the electromechanical behavior of polyvinylidene fluoride used as a component of risers in the offshore oil industry. Oil & Gas Science and Technology - Rev. IFP Energies nouvelles 2018, 73, 48. [Google Scholar]
- Cai, X.; Lei, T.; Sund, D.; Lin, L. A critical analysis of the α, β and γ phases in poly(vinylidene fluoride) using FTIR. RSC Adv. 2017, 7, 15382–15389. [Google Scholar] [CrossRef]
- Torrisi, L.; Silipigni, L.; Cutroneo, M.; Torrisi, A. Graphene oxide as a radiation sensitive material for XPS dosimetry. Vacuum 2020, 173, 109175. [Google Scholar] [CrossRef]
- Torrisi, L.; Silipigni, L.; Torrisi, A.; Cutroneo, M.; Malara, A.; Fotia, A.; Nunnari, C.; Frontera, P. Physical characterization of Multifiber polystyrene produced by electrospinning technique. Polymers submitted. 2025. [Google Scholar] [CrossRef] [PubMed]
- Malara, A.; Bonaccorsi, L.; Fotia, A.; Antonucci, P.L.; Frontera, P. Hybrid Fluoro-Based Polymers/Graphite Foil for H2/Natural Gas Separation. Materials 2023, 16, 2105. [Google Scholar] [CrossRef]
- Xue, J.; Wu, T.; Dai, Y.; Xia, Y. Electrospinning and Electrospun Nanofibers: Methods, Materials, and Applications. Chem Rev. 2019, 119, 5298–5415. [Google Scholar] [CrossRef]
- Huang, Z.M.; Zhang, Y.Z.; Kotaki, M.; Ramakrishna, S. , A review on polymer nanofibers by electrospinning and their applications in nanocomposites. Composites Science and Technology 2003, 63, 2223–2253. [Google Scholar] [CrossRef]
- Frontera, P.; Bonaccorsi, L.; Fotia, A.; Malara, A. , Fibrous Materials for Potential Efficient Energy Recovery at Low-Temperature Heat. Sustainability 2023, 15, 6567. [Google Scholar] [CrossRef]
- Fotia, A. , Encapsulation of Disodium-EDTA in Electrospun Polymeric Fibers for the Detection of Heavy Metals. Adv. Sustainable Syst. 2024, 8, 2300463. [Google Scholar] [CrossRef]
Figure 1.
Molecular structure of polyvinylidene fluoride (PVDF).
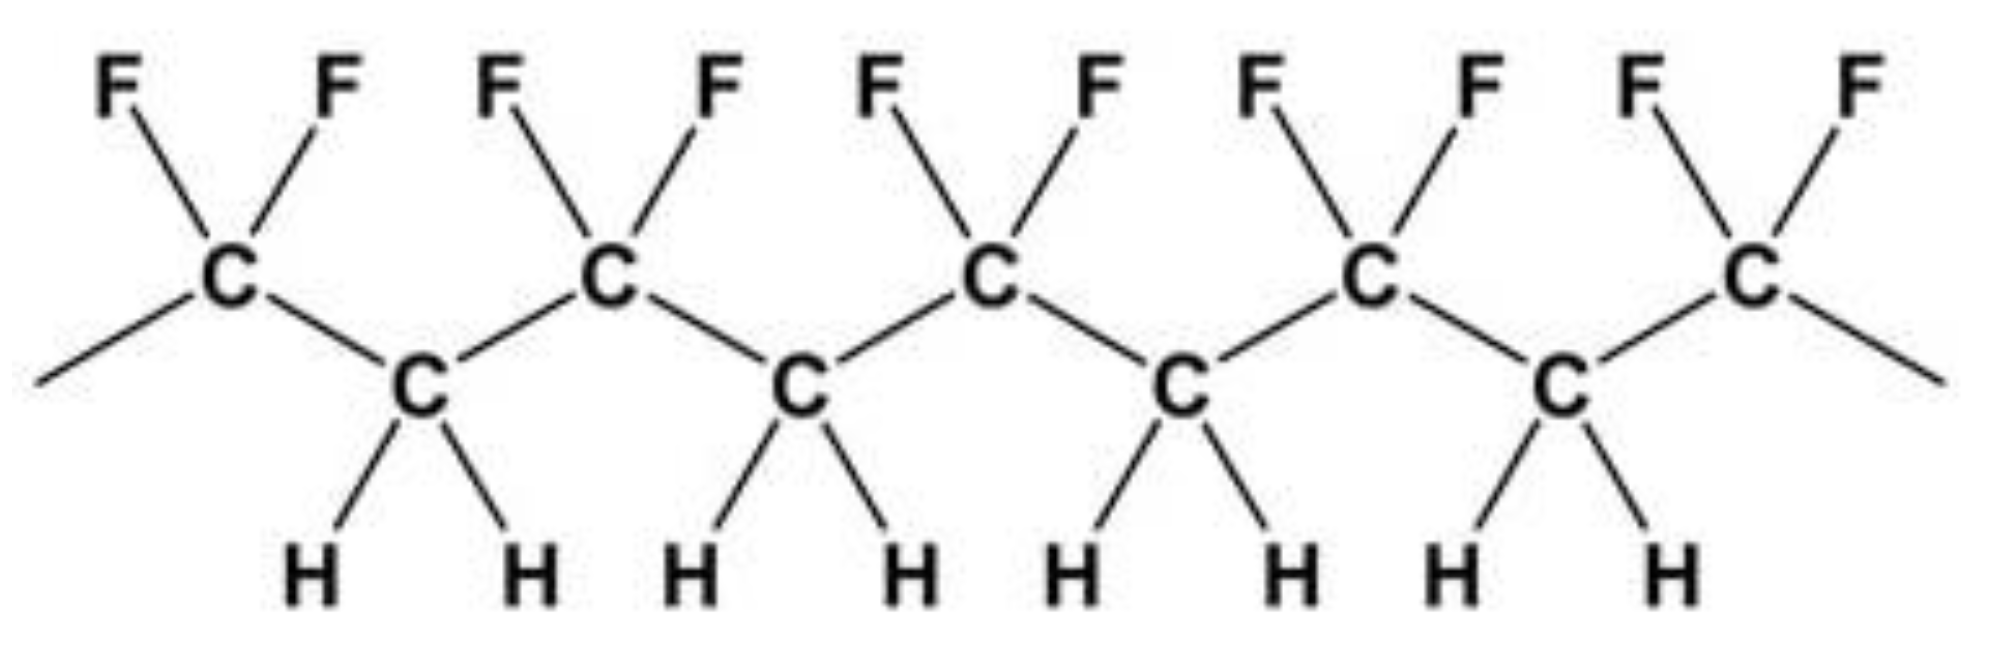
Figure 2.
Photos of the eight types of different investigated polymers: PDVF bulk (a), PVDF bulk+10 wt% GO (b), PVDF multifiber (c), and PVDF multifiber +10 wt% GO (d).
Figure 2.
Photos of the eight types of different investigated polymers: PDVF bulk (a), PVDF bulk+10 wt% GO (b), PVDF multifiber (c), and PVDF multifiber +10 wt% GO (d).
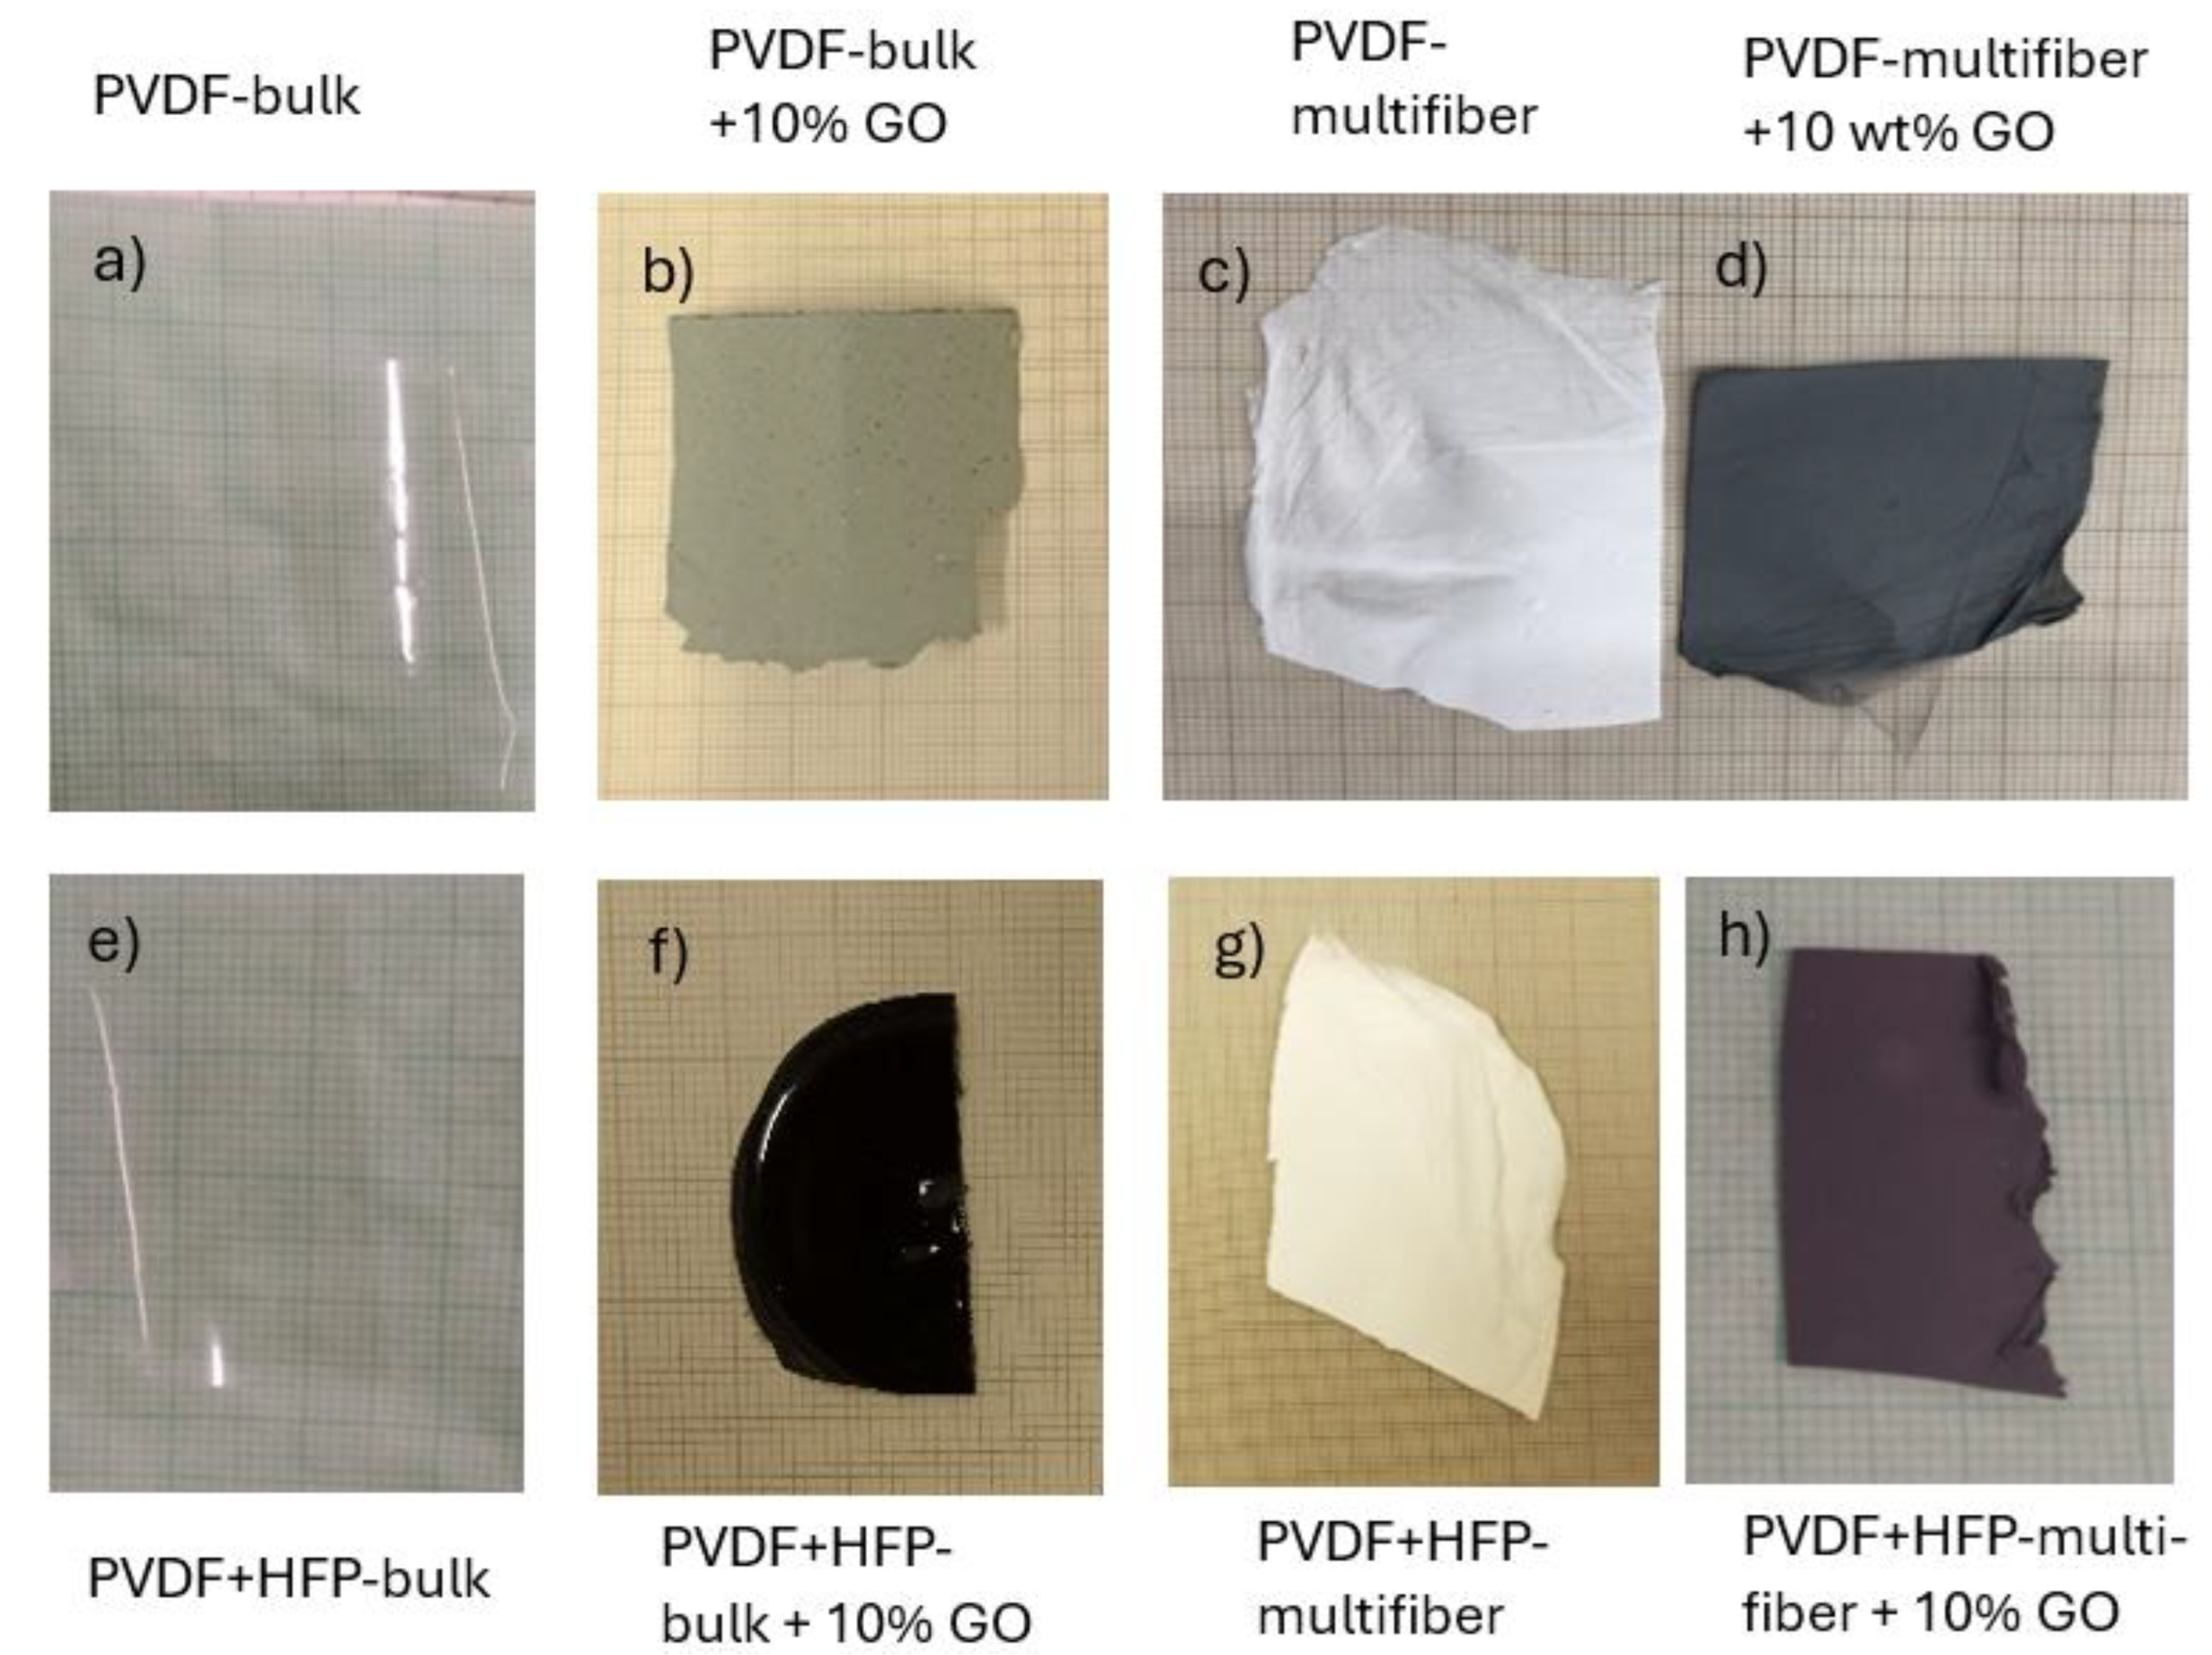
Figure 3.
SEM image of multifiber pristine PVDF (a), PVDF with 10 wt% of GO NPs (b), PVDF-HFP (c), and PVDF-HFP with 10 wt% GO (d).
Figure 3.
SEM image of multifiber pristine PVDF (a), PVDF with 10 wt% of GO NPs (b), PVDF-HFP (c), and PVDF-HFP with 10 wt% GO (d).
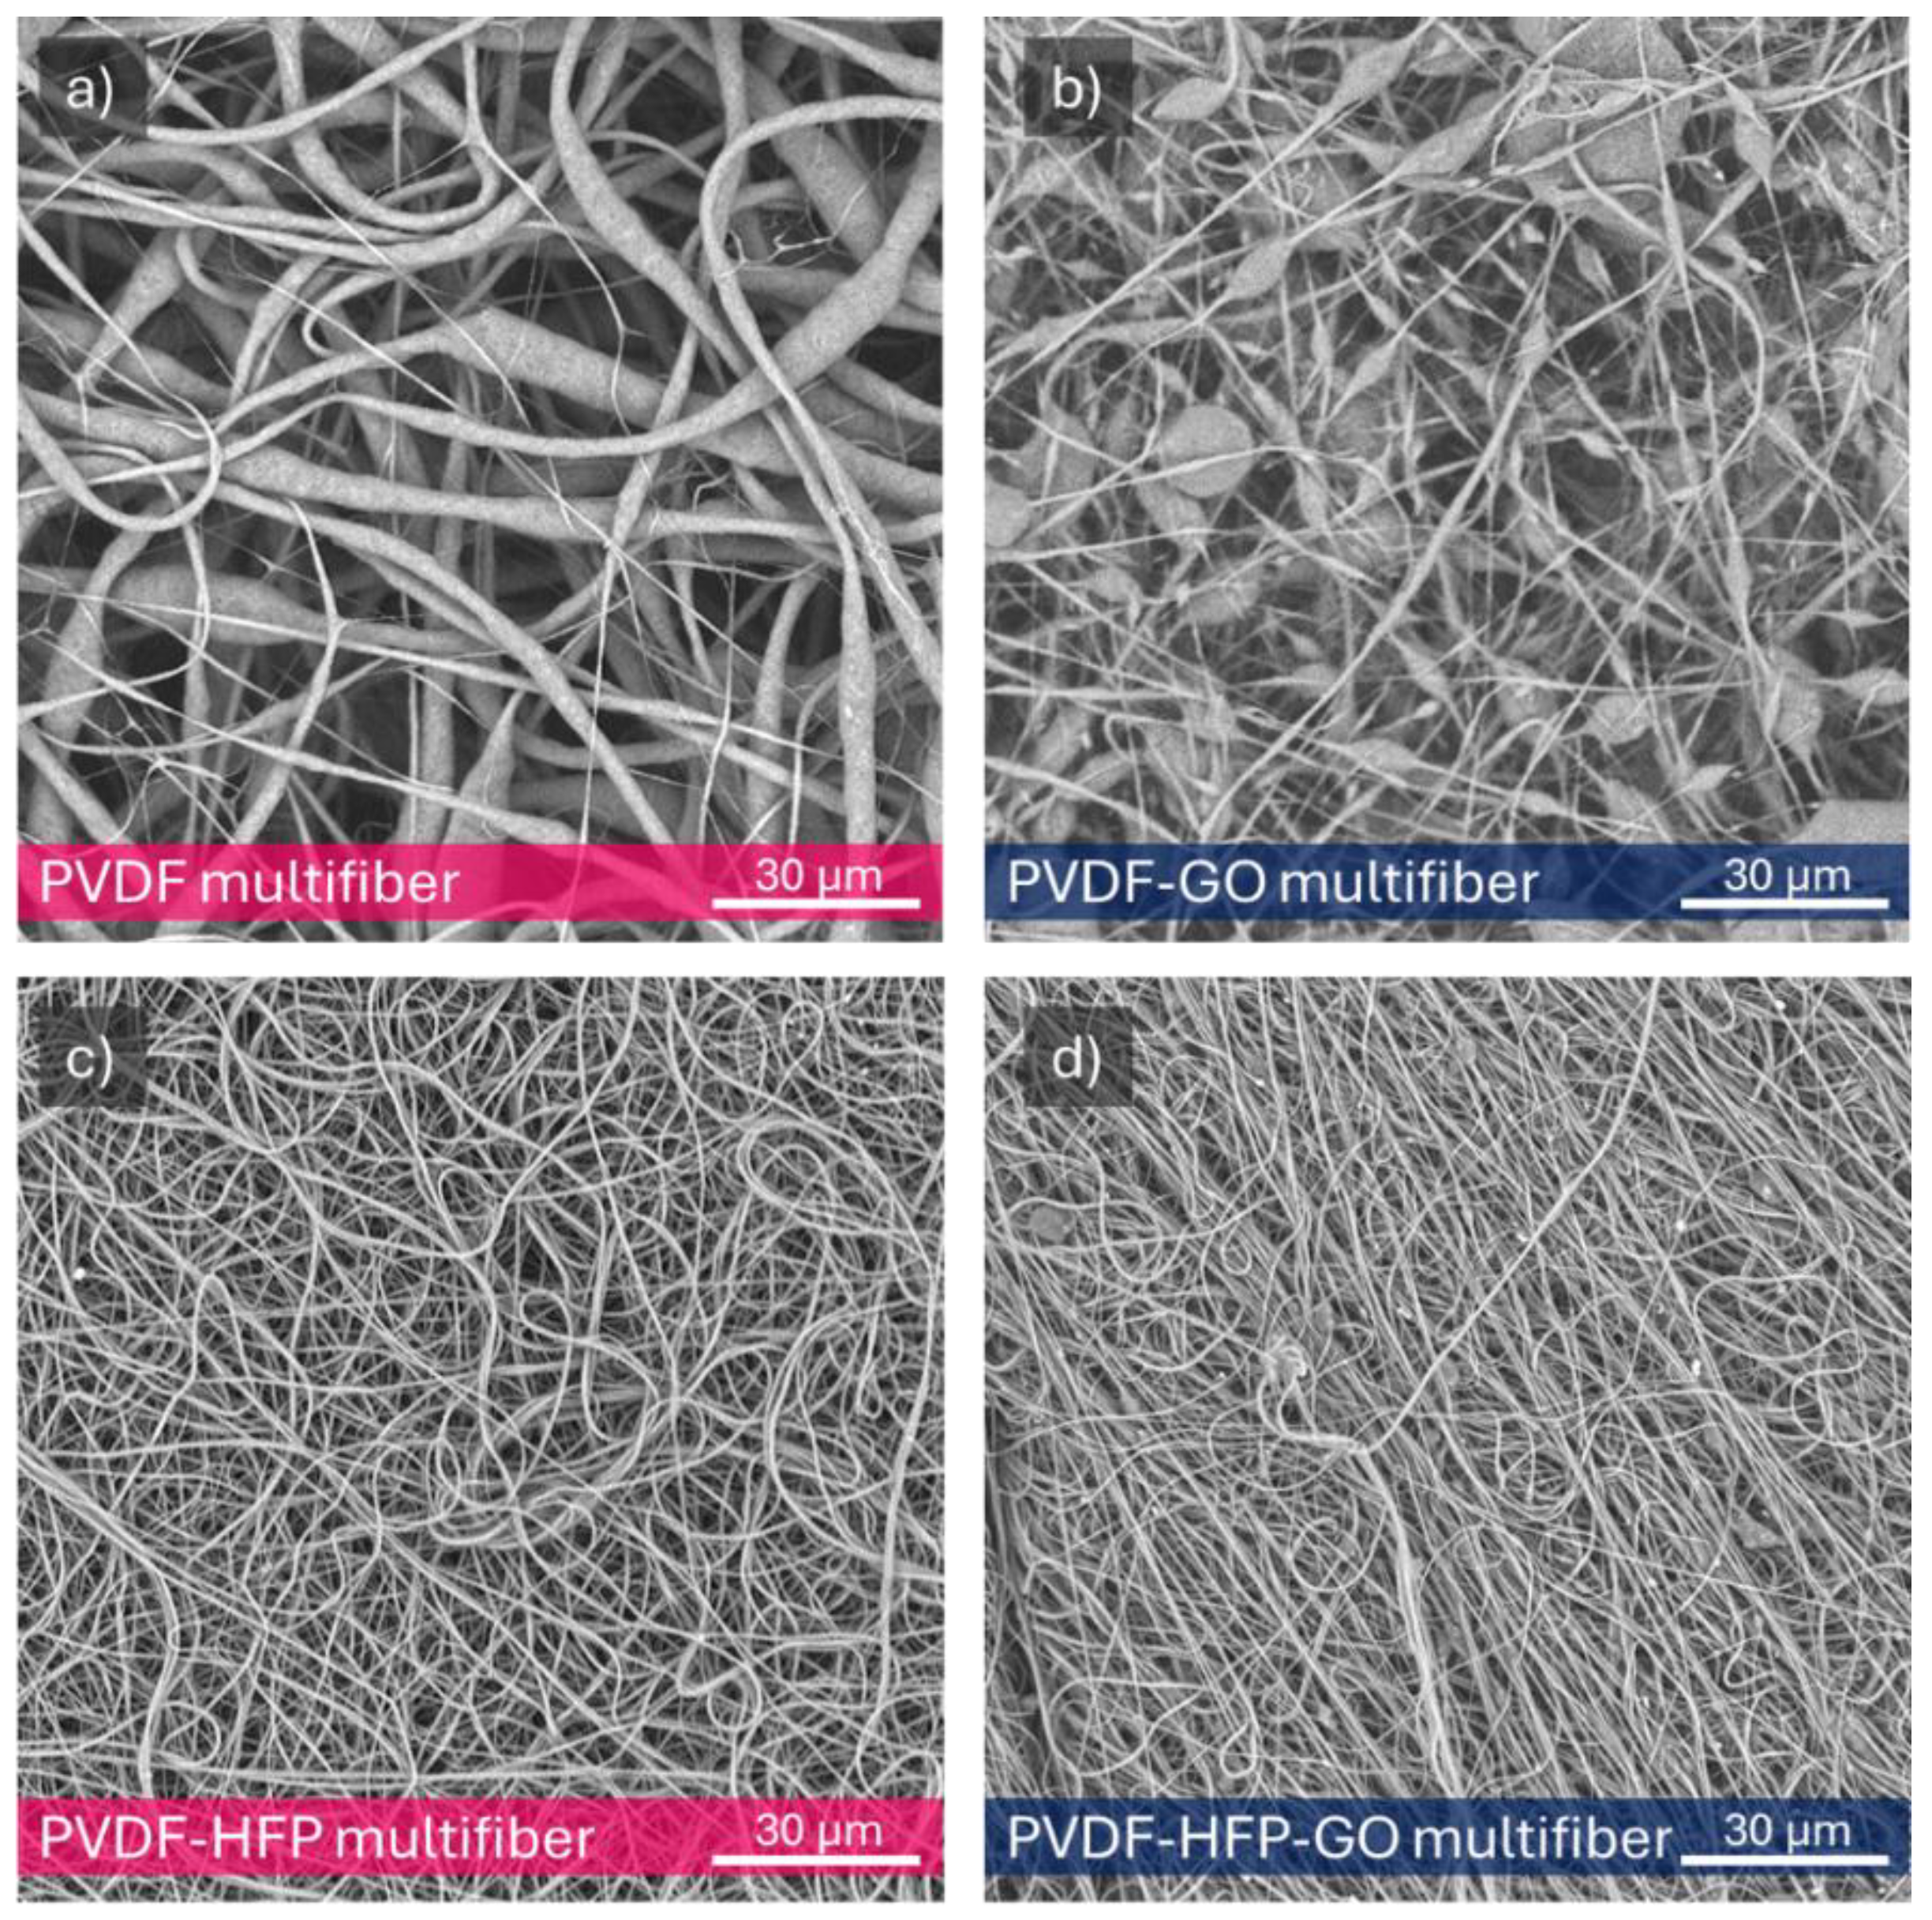
Figure 4.
Average fiber diameter versus type of PVDF copolymer used.
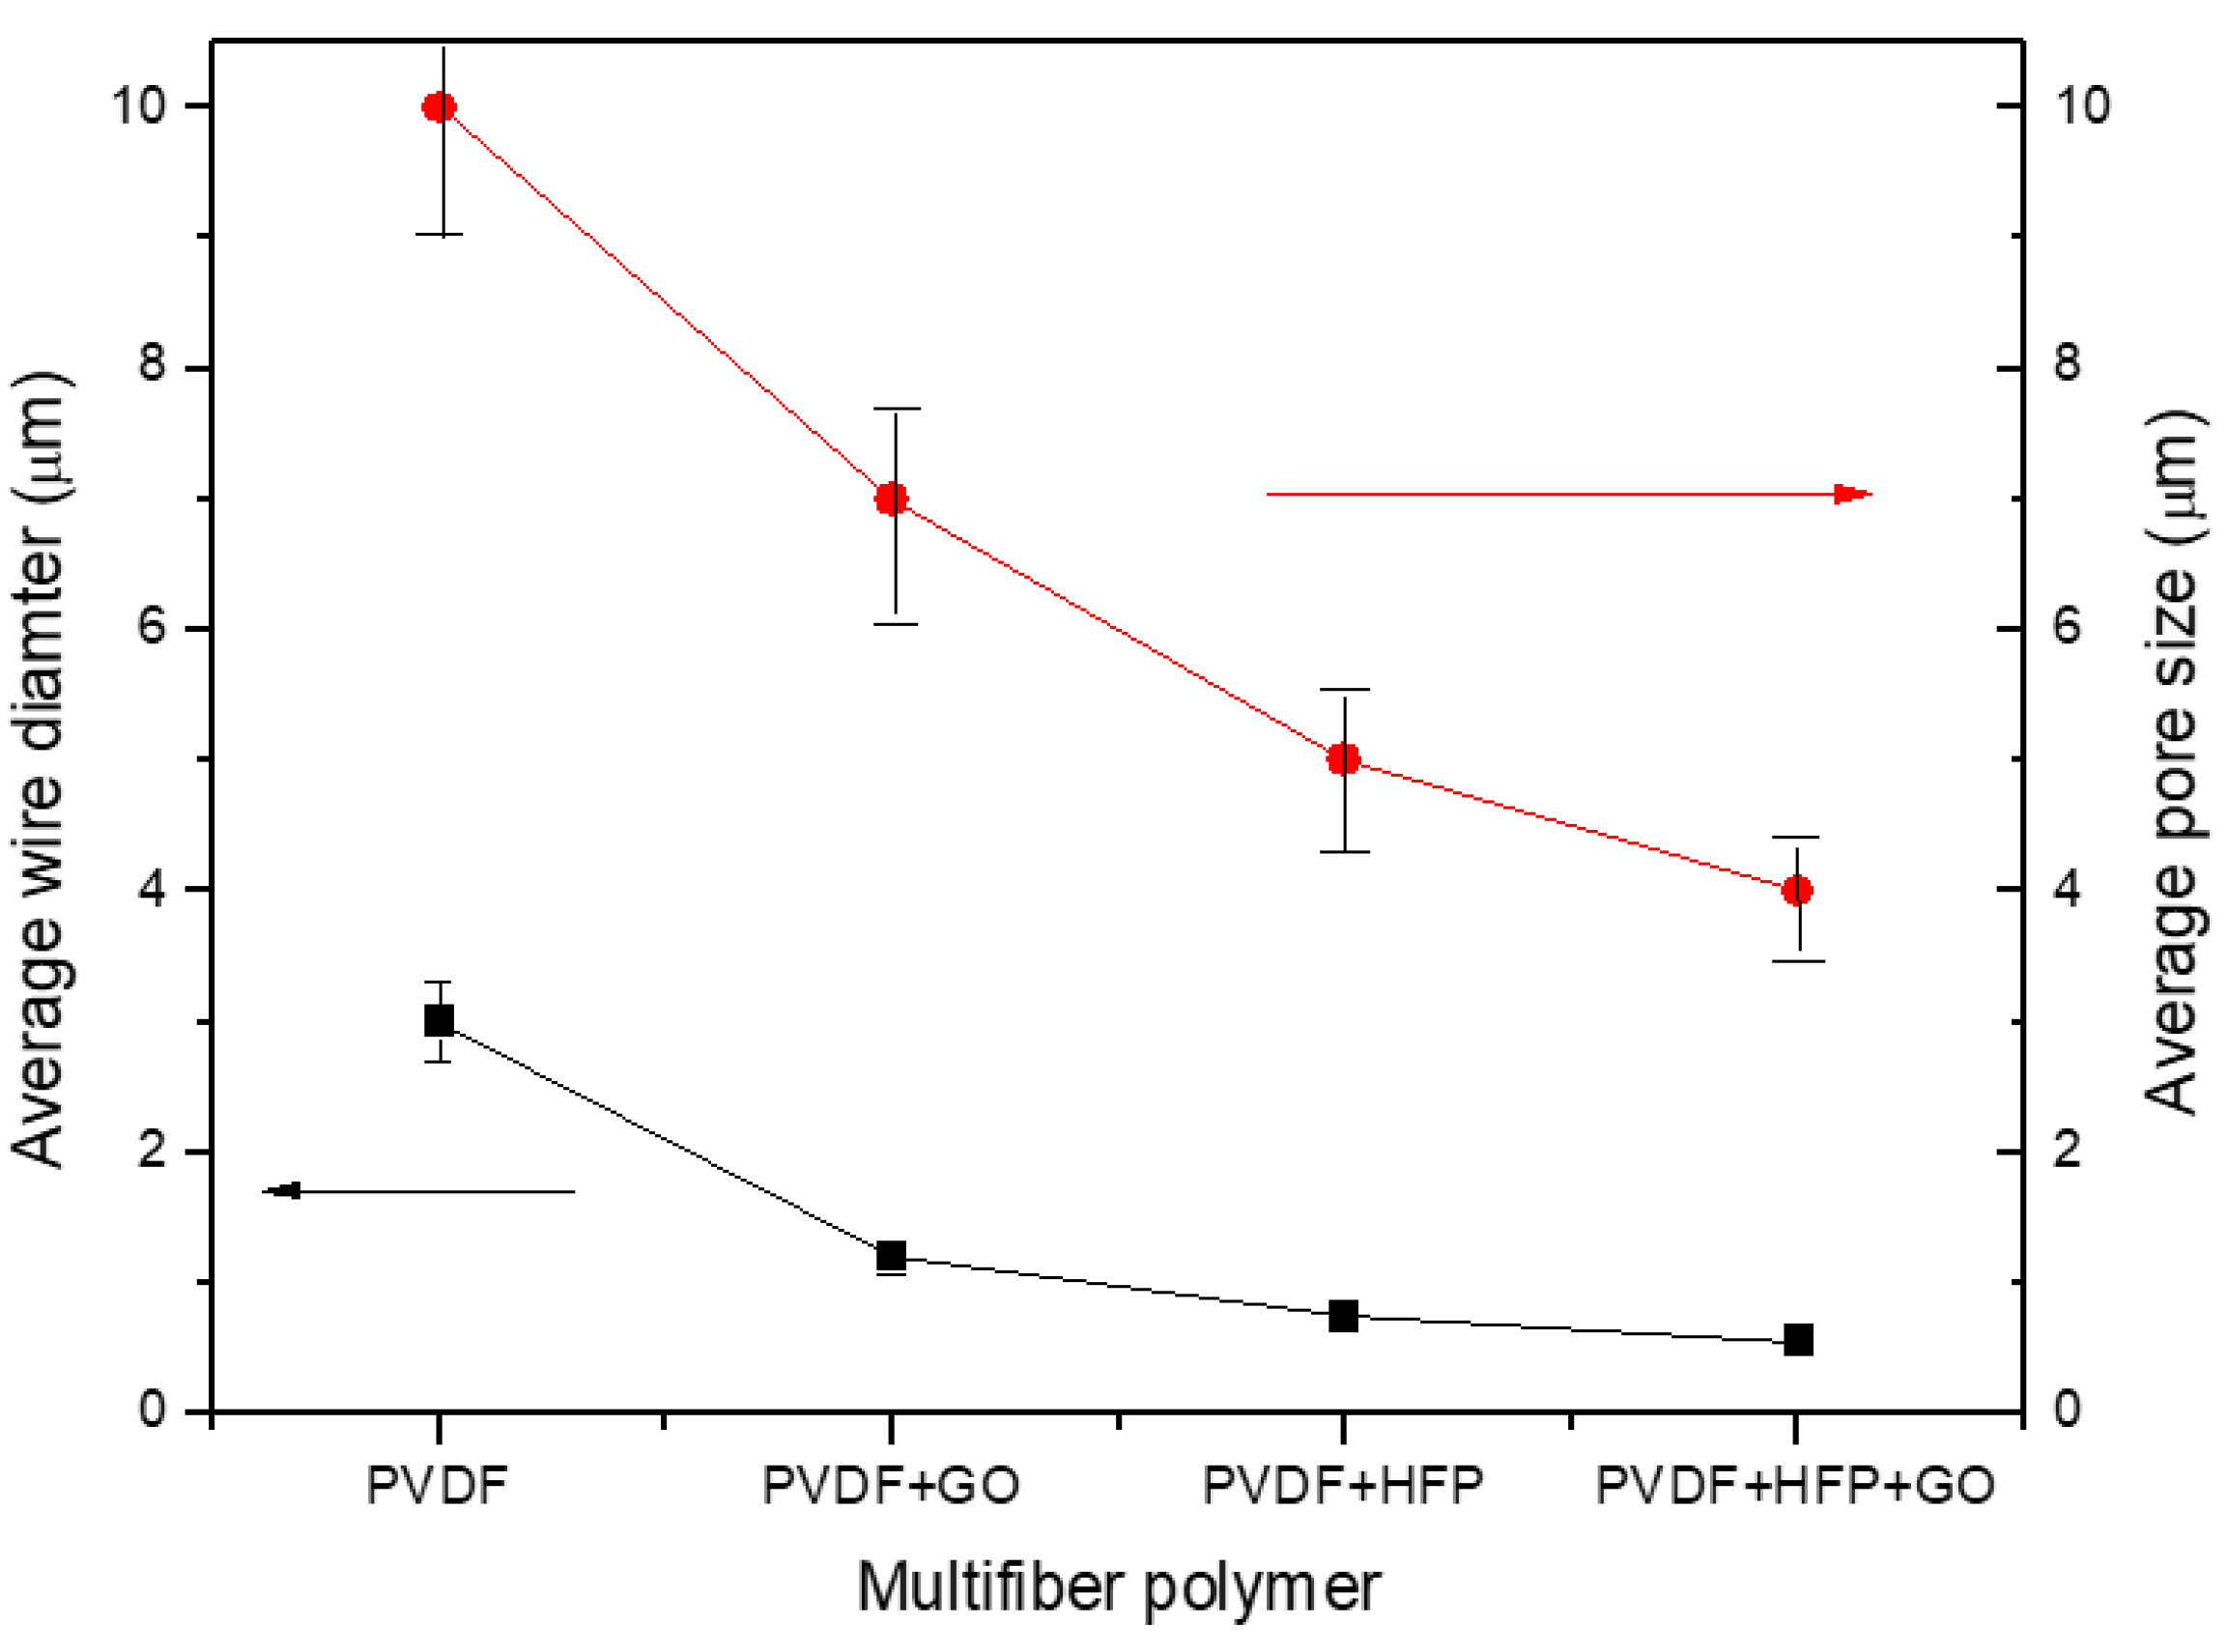
Figure 5.
Stress-strain curves for multifiber PVDF with and without GO (a) and PVDF-HFP with and without GO (b).
Figure 5.
Stress-strain curves for multifiber PVDF with and without GO (a) and PVDF-HFP with and without GO (b).
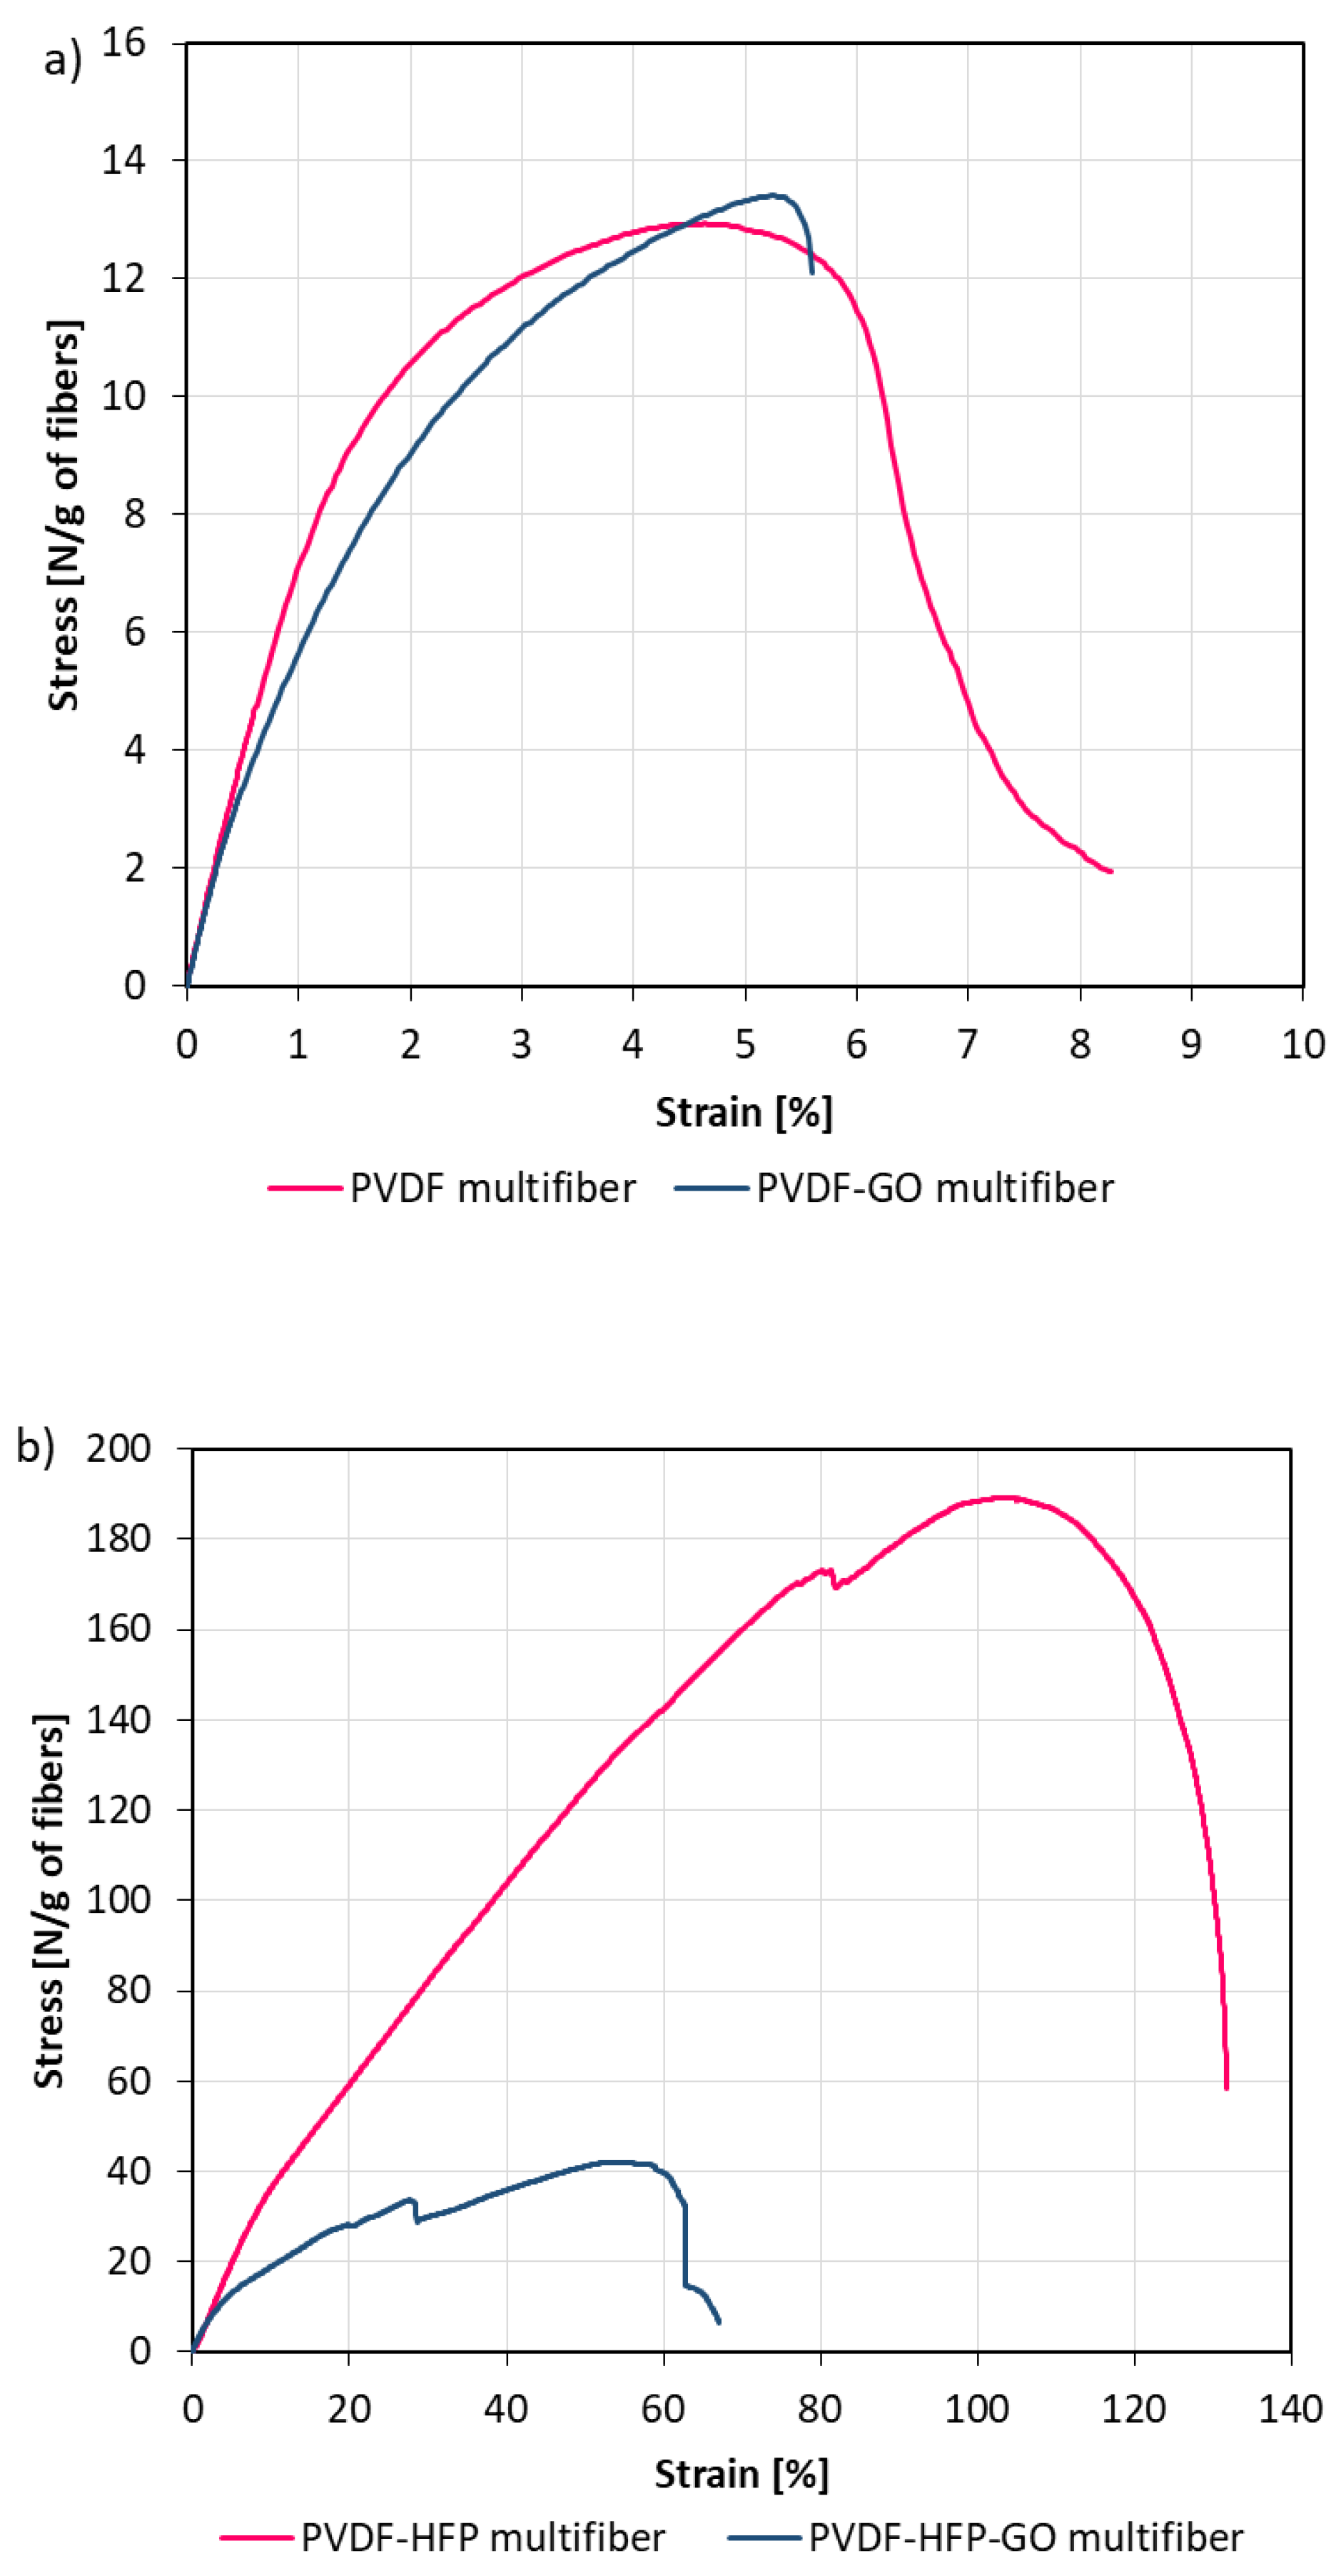
Figure 6.
XRD spectra relative to the comparison PVDF bulk & fibers (a), PVDF-HFP bulk & fibers (b), PVDF and PVDF-HFP bulk (c), and PVDF and PVDF-HFP fibers (d).
Figure 6.
XRD spectra relative to the comparison PVDF bulk & fibers (a), PVDF-HFP bulk & fibers (b), PVDF and PVDF-HFP bulk (c), and PVDF and PVDF-HFP fibers (d).
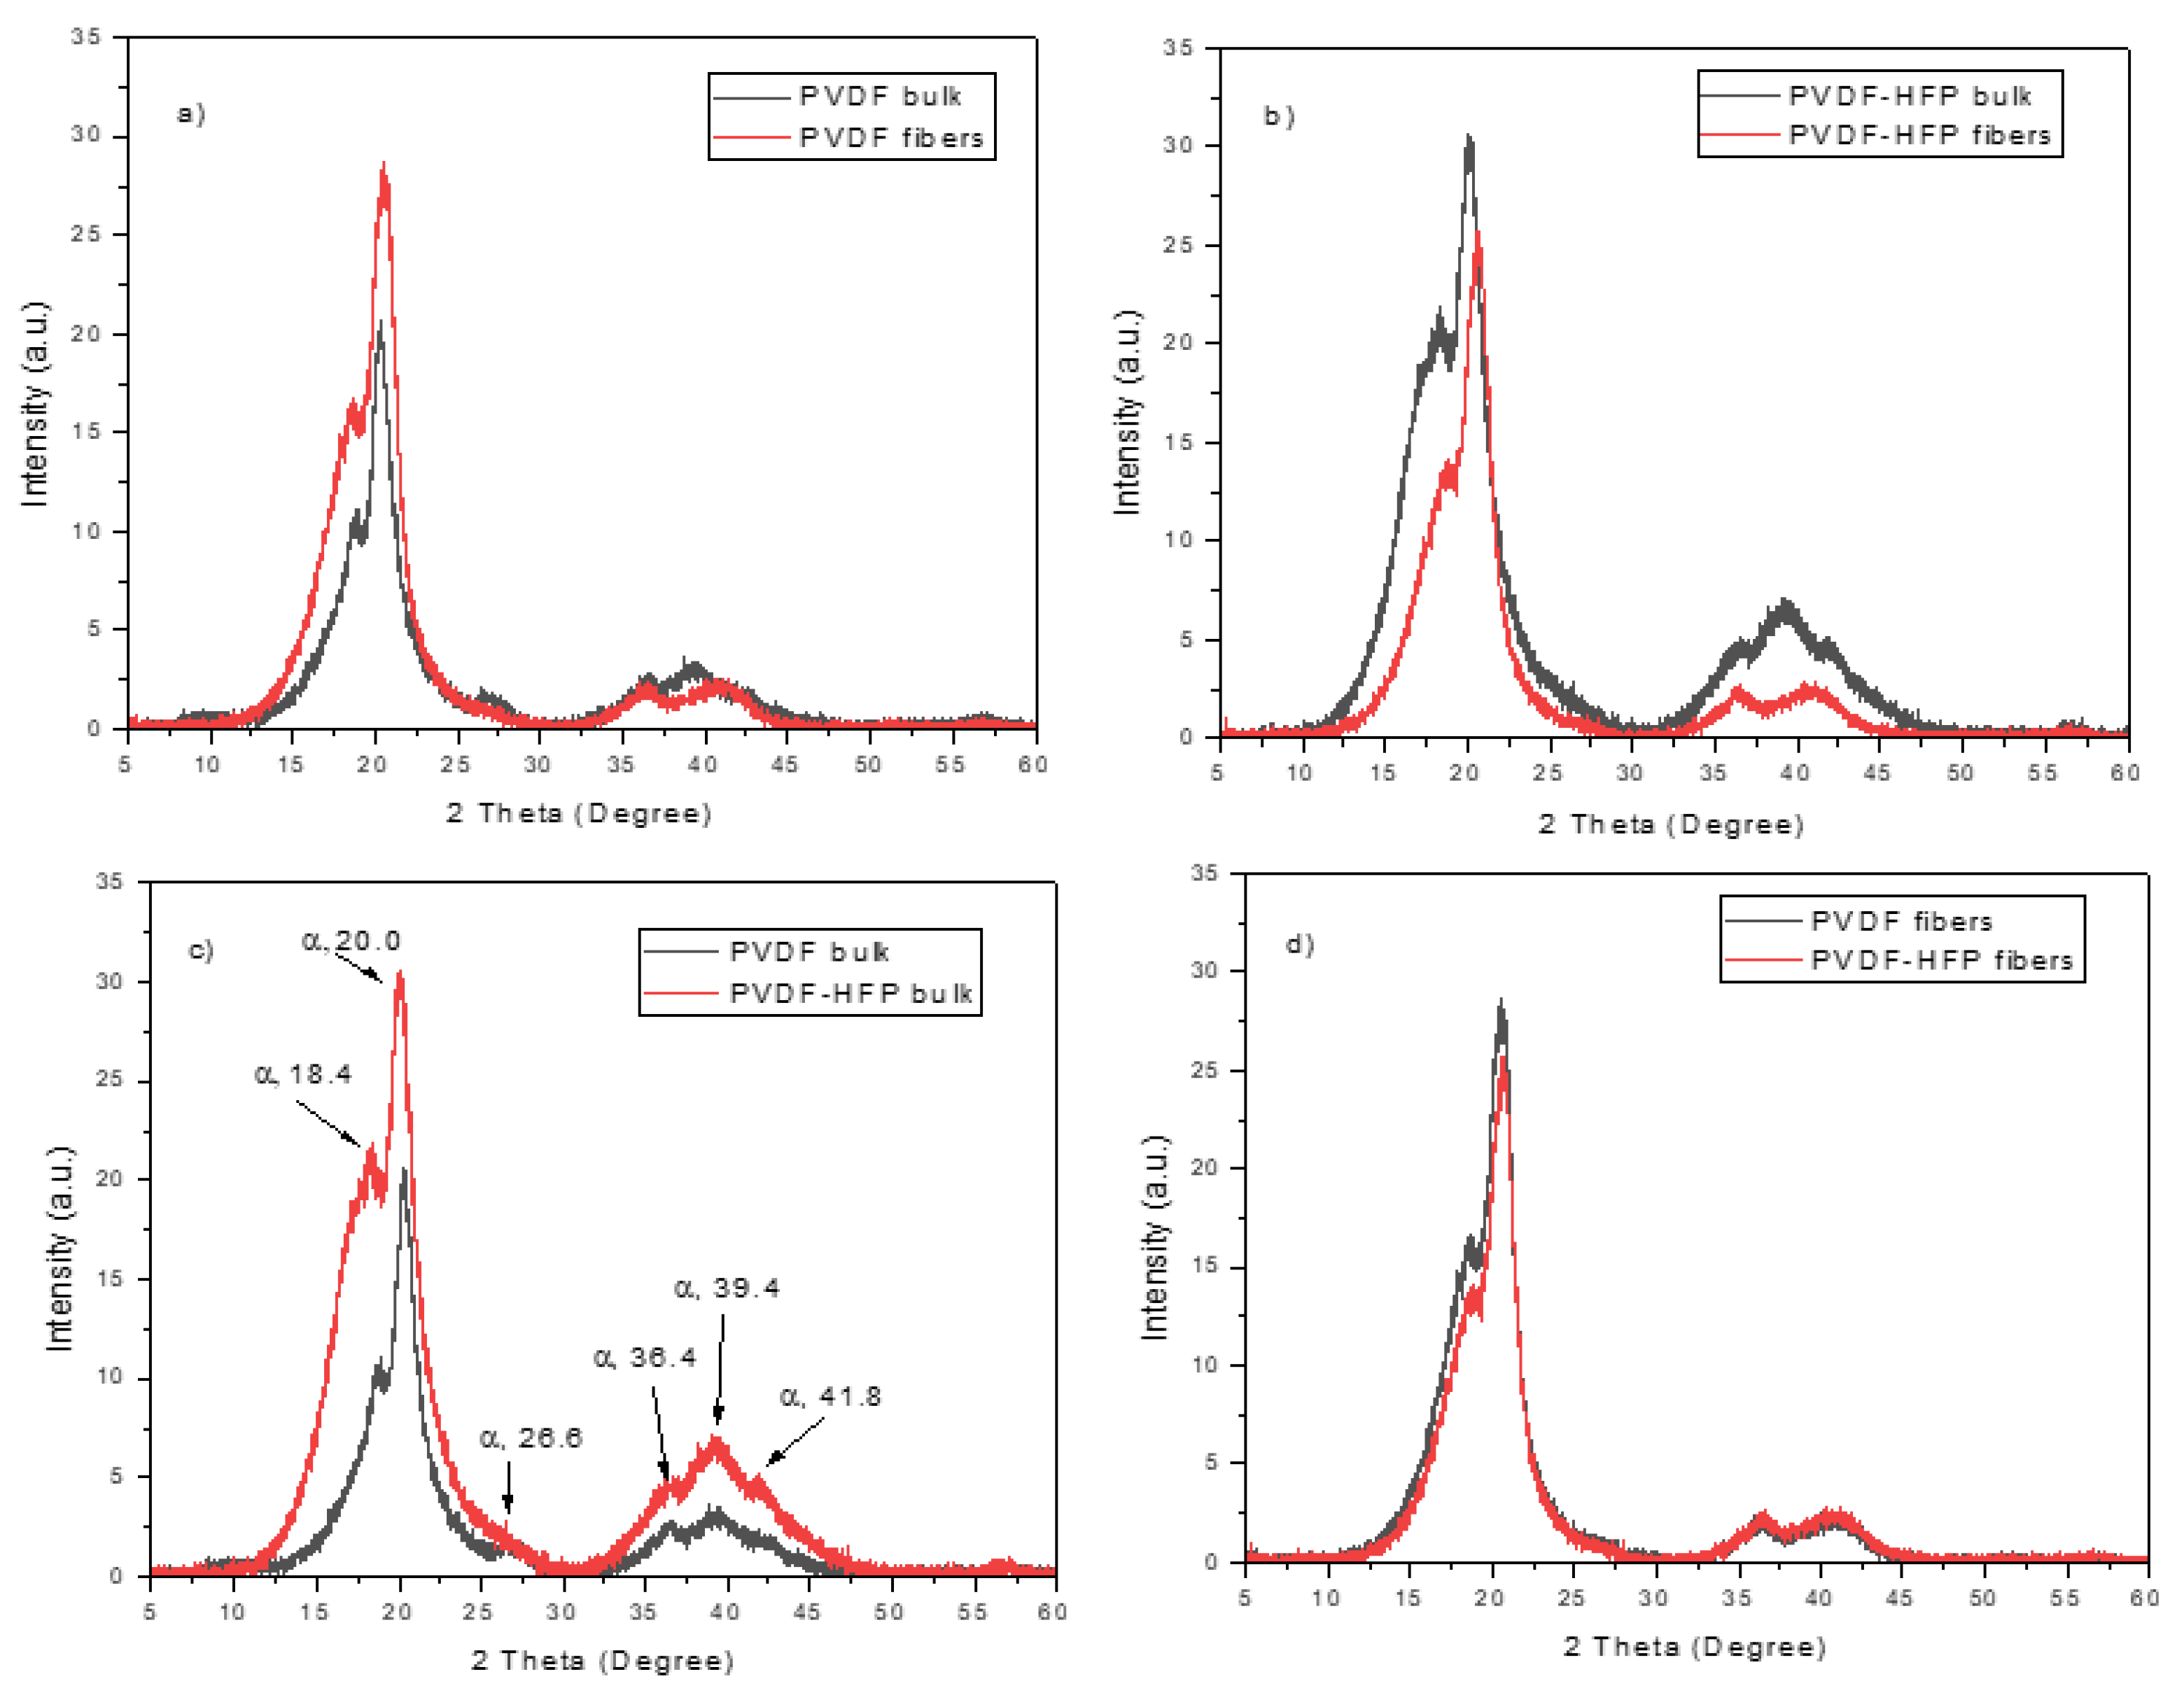
Figure 7.
ATR-FTIR spectra comparison between PVDF bulk and PVDF multifiber with and without GO nanoparticles.
Figure 7.
ATR-FTIR spectra comparison between PVDF bulk and PVDF multifiber with and without GO nanoparticles.
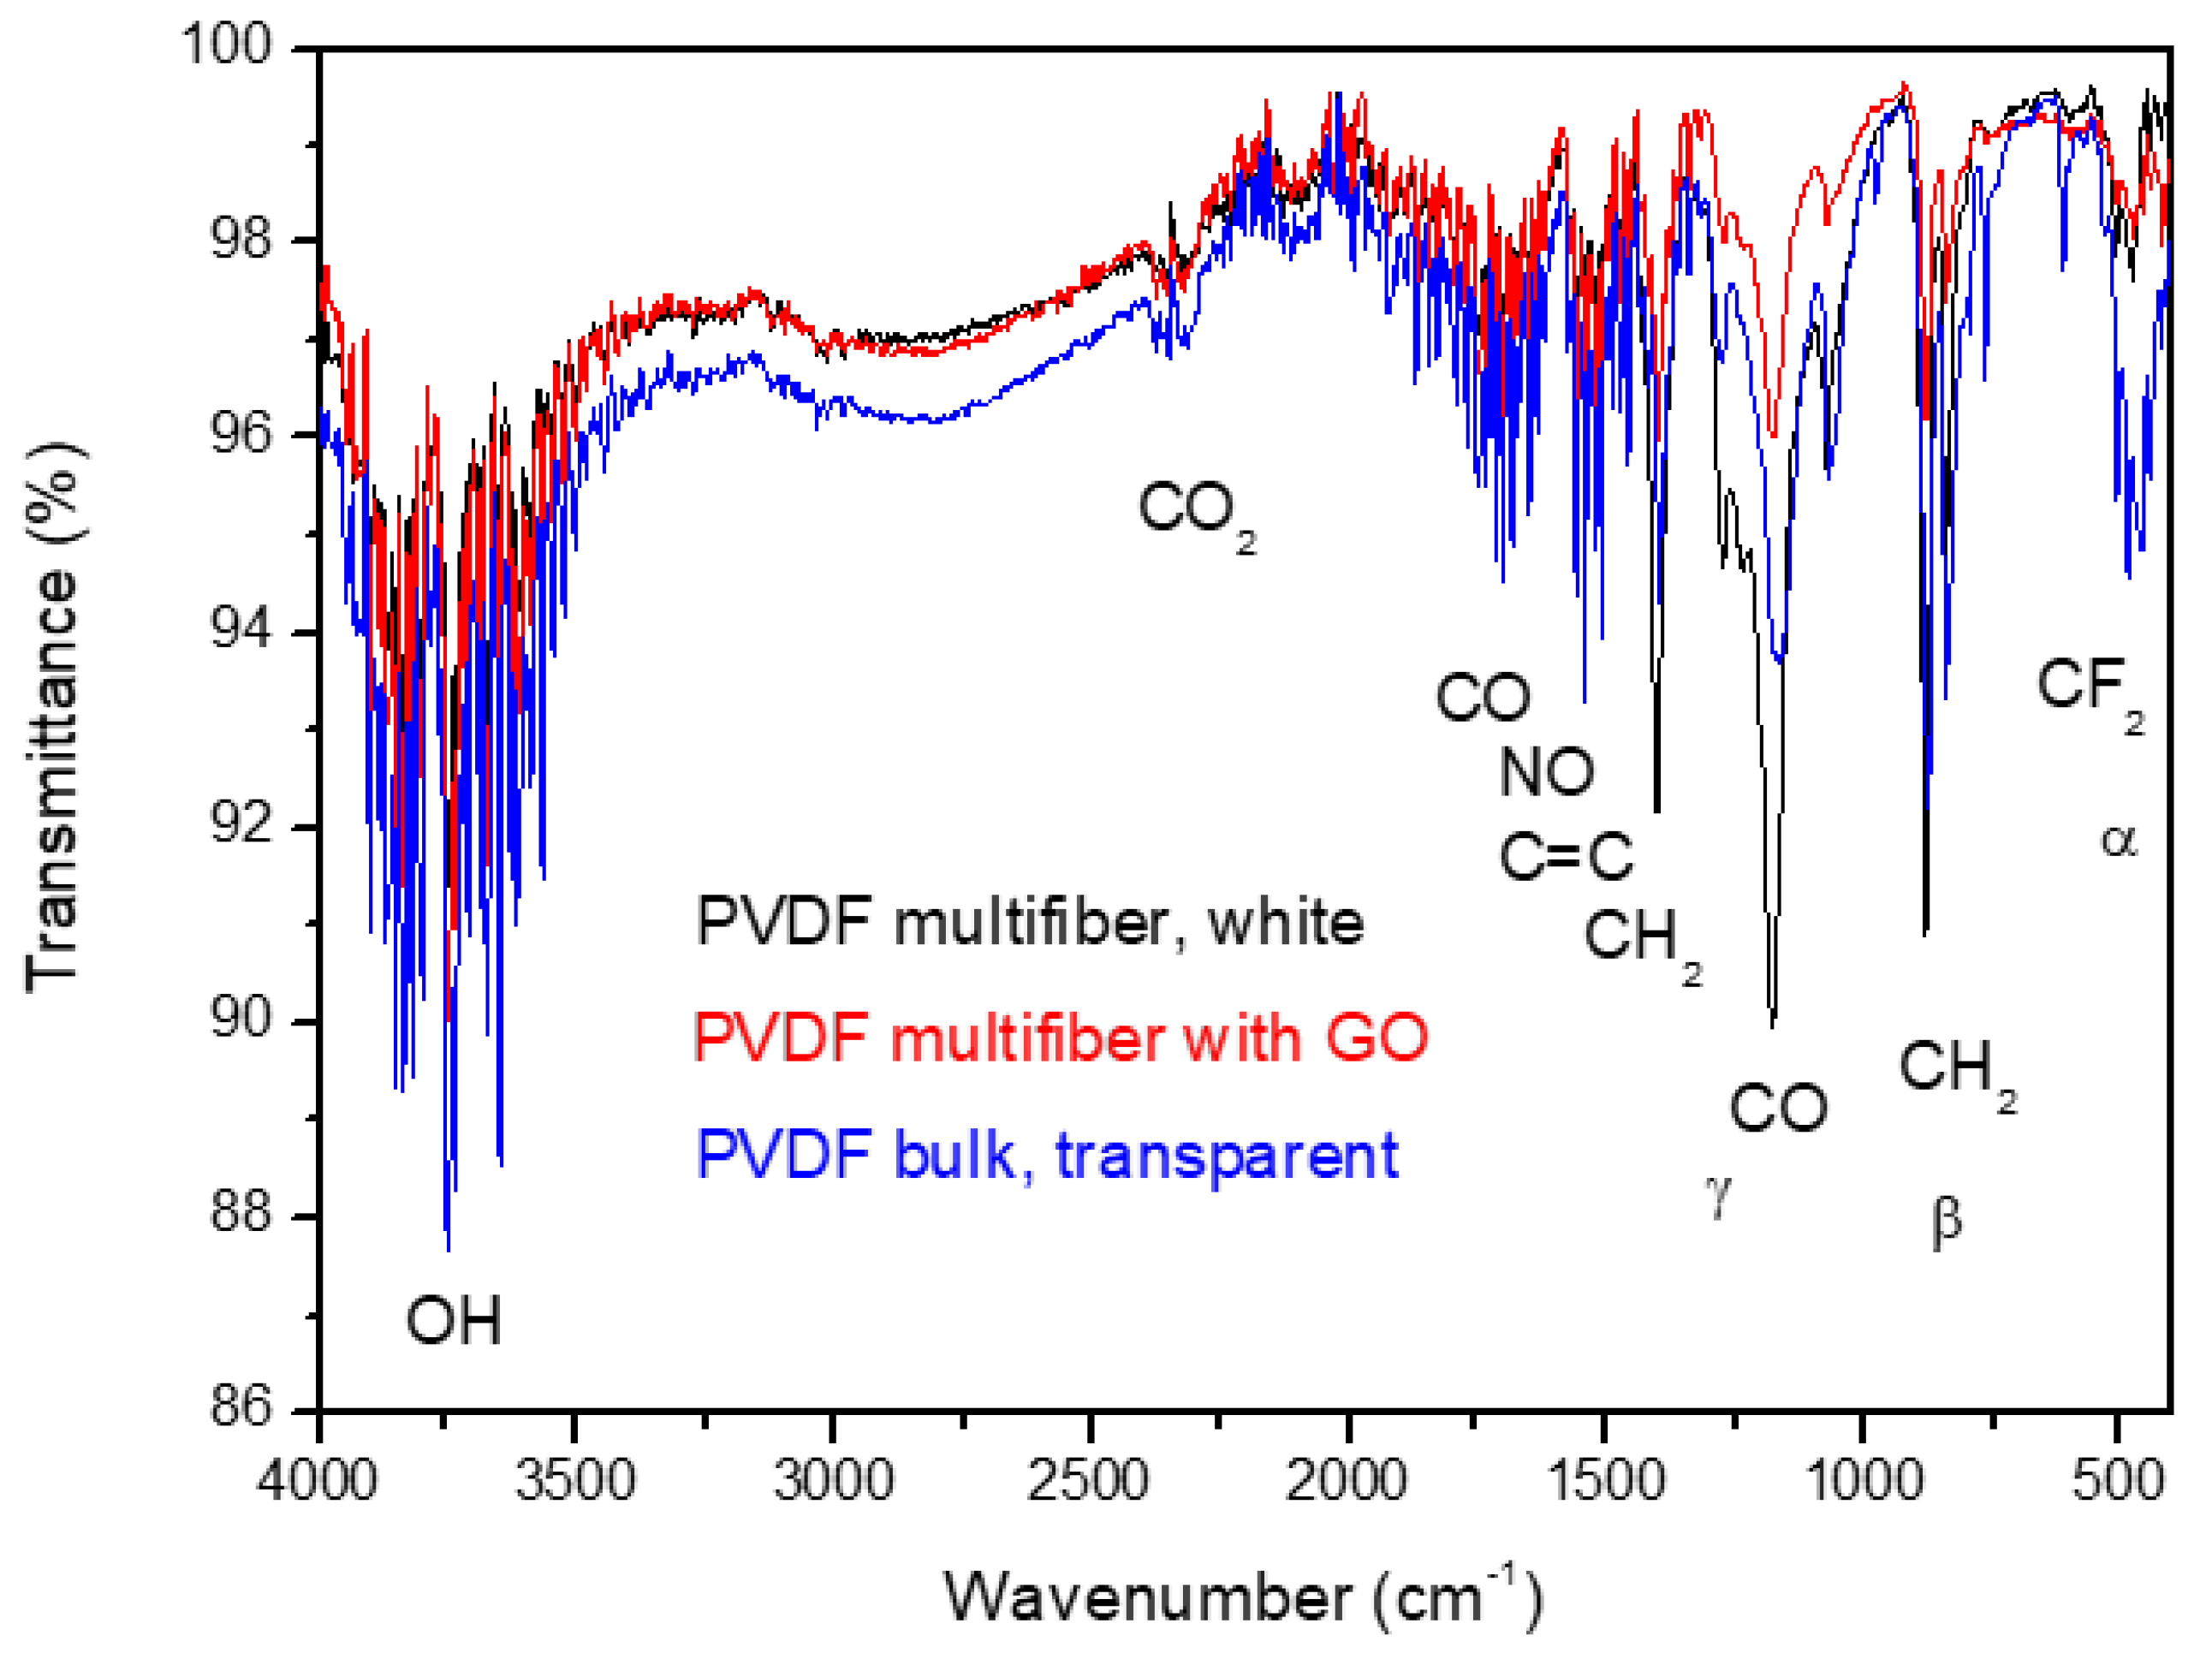
Figure 8.
ATR-FTIR spectra comparison between PVDF-HFP bulk and PVDF-HFP multifiber with and without GO nanoparticles.
Figure 8.
ATR-FTIR spectra comparison between PVDF-HFP bulk and PVDF-HFP multifiber with and without GO nanoparticles.
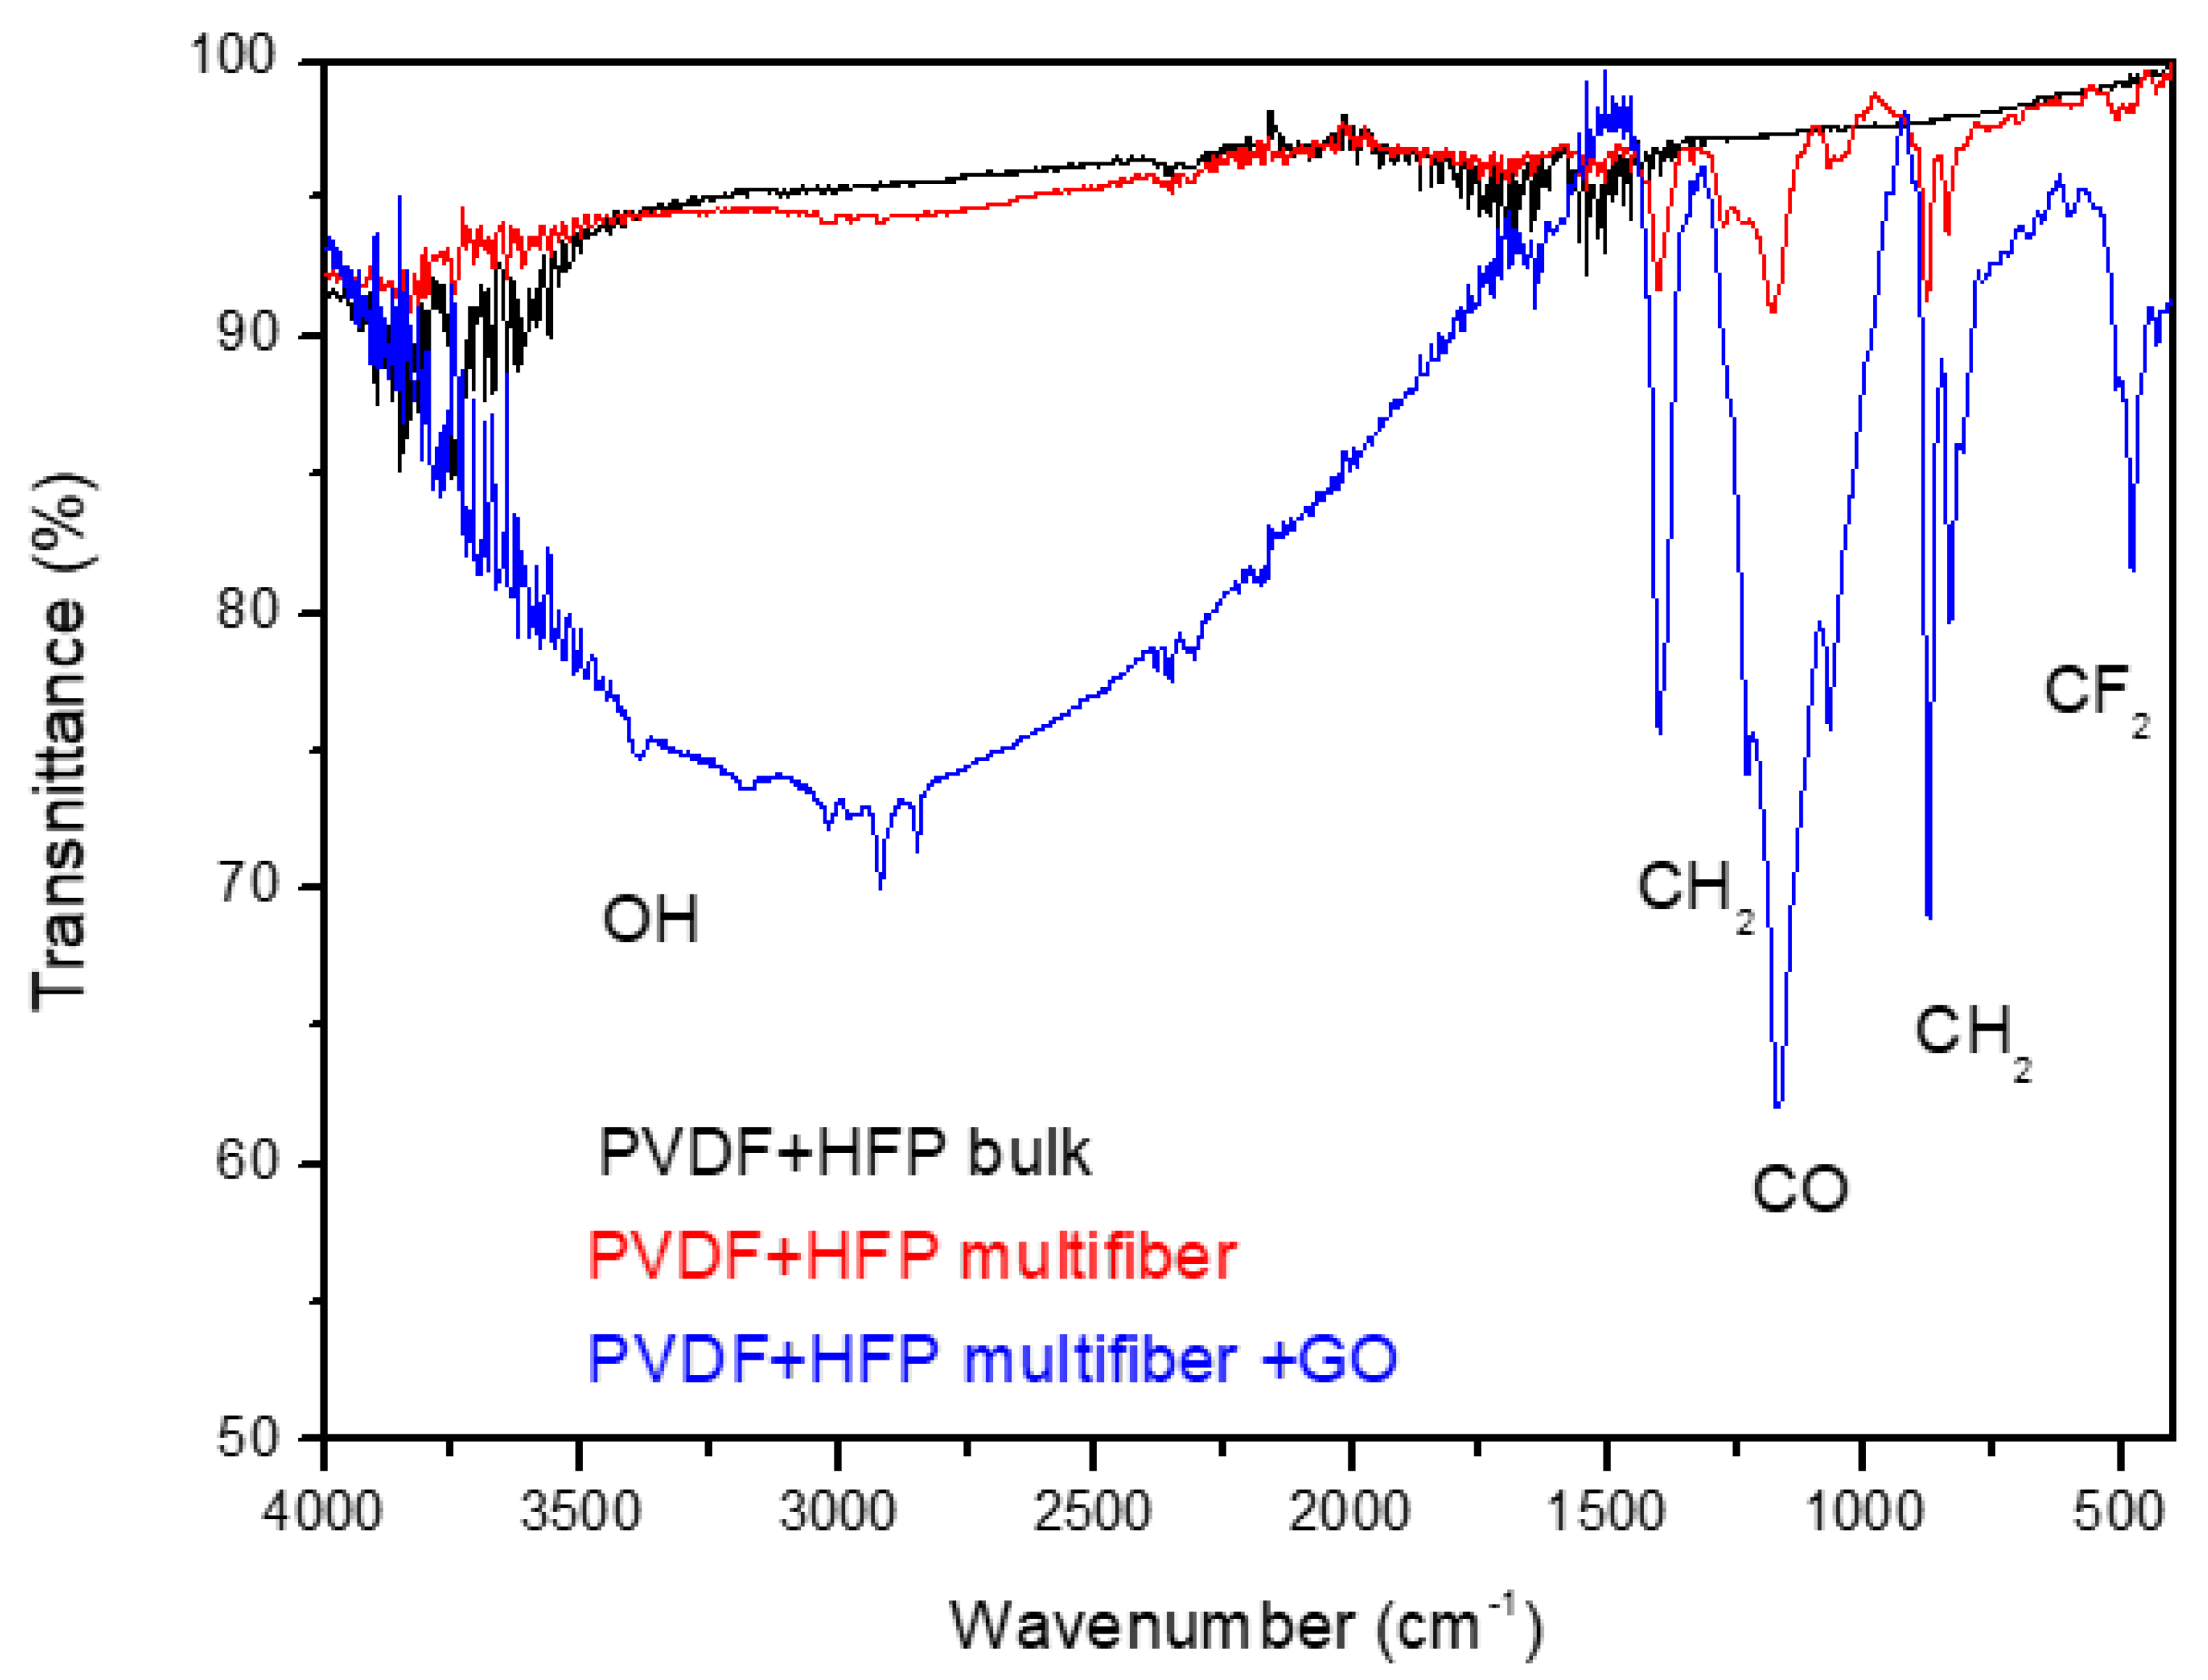
Figure 9.
Contact angle for PVDF bulk (a), PVDF multifiber (b), PCDF multifiber with GO (c), PVDF-HFP bulk (c), PVDF-HFP multifiber (e), and PVDF-HFP with GO (f).
Figure 9.
Contact angle for PVDF bulk (a), PVDF multifiber (b), PCDF multifiber with GO (c), PVDF-HFP bulk (c), PVDF-HFP multifiber (e), and PVDF-HFP with GO (f).
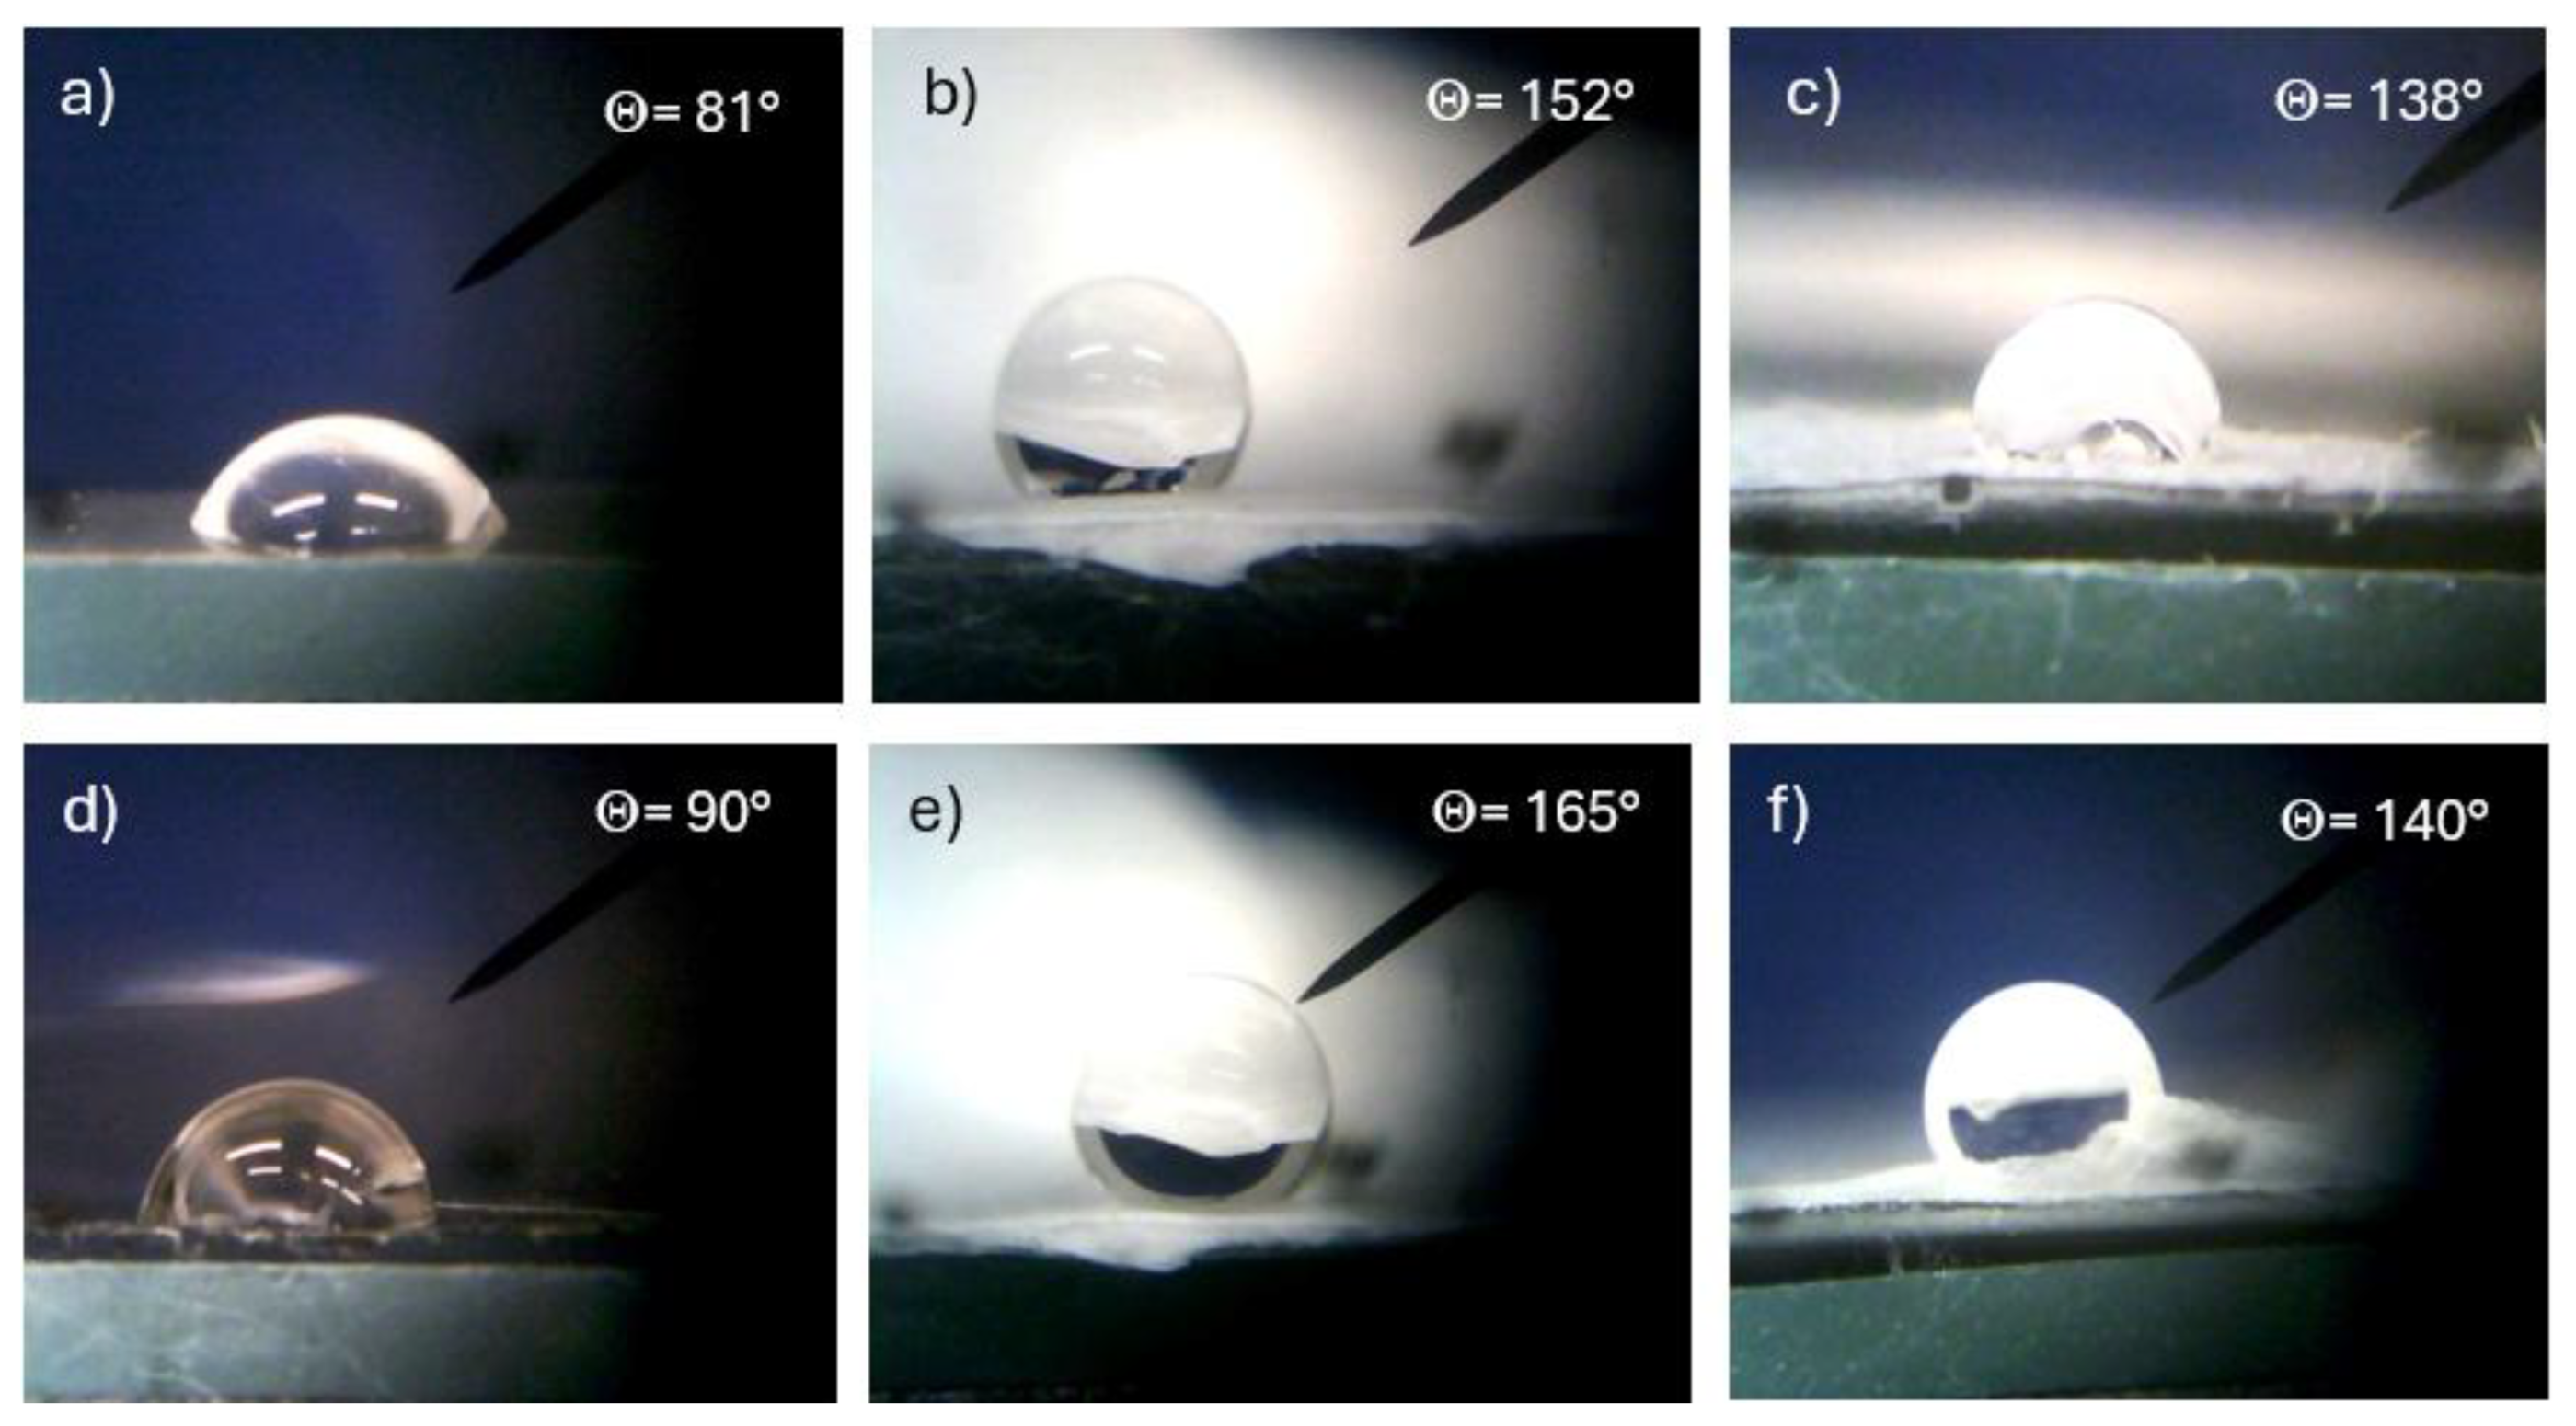
Figure 10.
Dielectric constant real (a) and imaginary (b) as a function of the frequency and of the polymer type.
Figure 10.
Dielectric constant real (a) and imaginary (b) as a function of the frequency and of the polymer type.
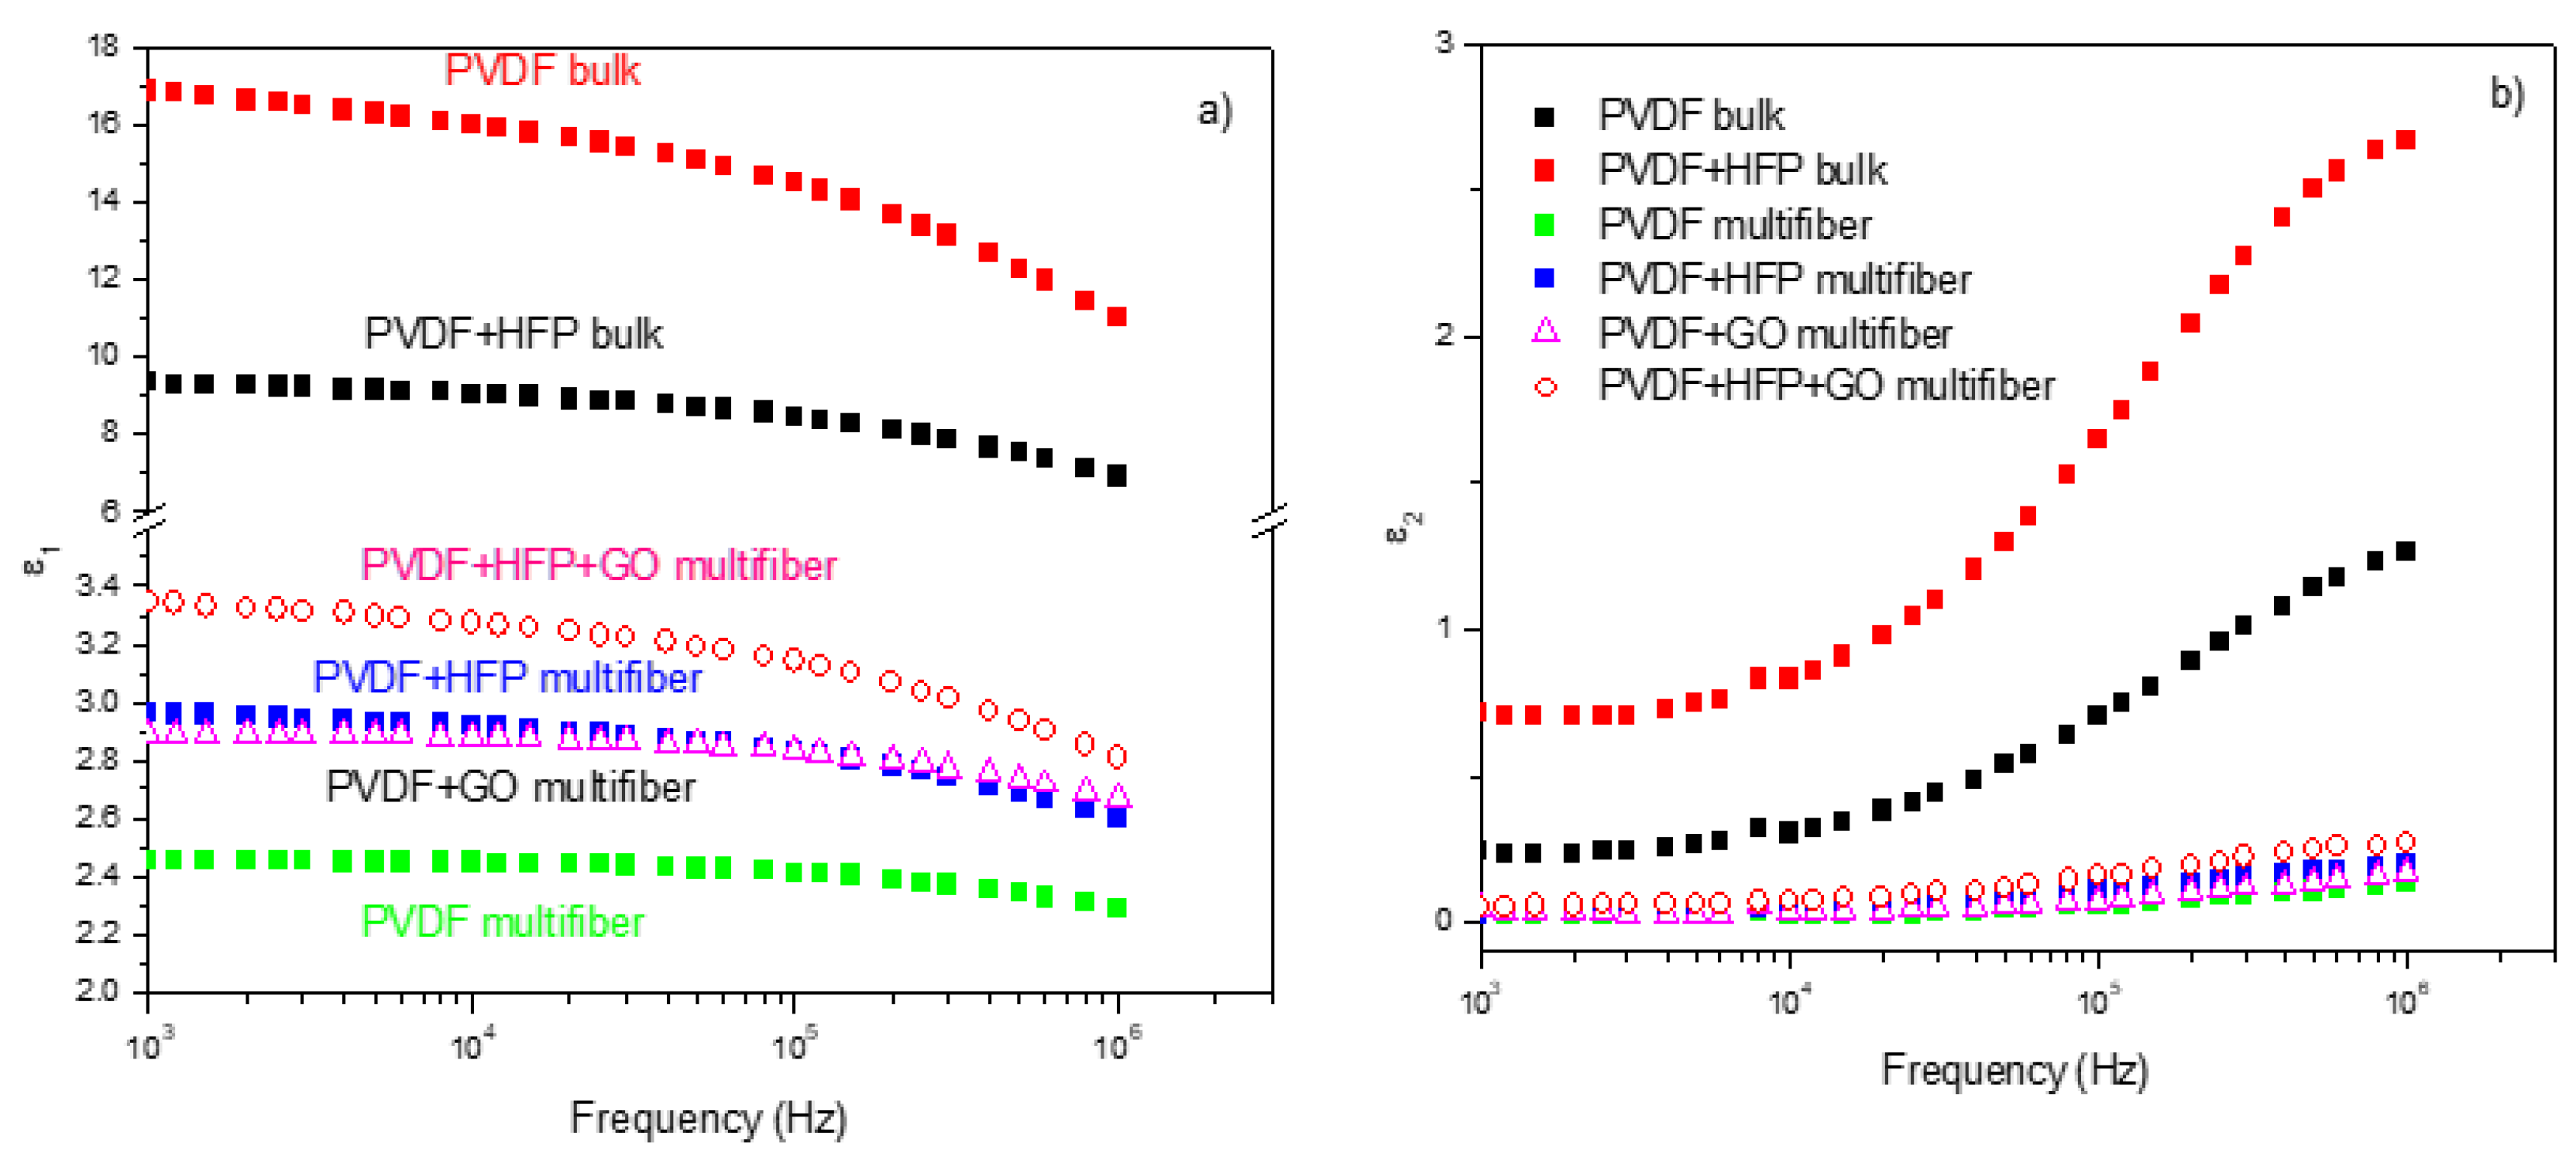
Figure 11.
Tan d (a) and electrical conductivity (b) vs frequency and polymer type.
Disclaimer/Publisher’s Note: The statements, opinions and data contained in all publications are solely those of the individual author(s) and contributor(s) and not of MDPI and/or the editor(s). MDPI and/or the editor(s) disclaim responsibility for any injury to people or property resulting from any ideas, methods, instructions or products referred to in the content. |
© 2025 by the authors. Licensee MDPI, Basel, Switzerland. This article is an open access article distributed under the terms and conditions of the Creative Commons Attribution (CC BY) license (http://creativecommons.org/licenses/by/4.0/).
Copyright: This open access article is published under a Creative Commons CC BY 4.0 license, which permit the free download, distribution, and reuse, provided that the author and preprint are cited in any reuse.


