
Submitted:
28 November 2024
Posted:
28 November 2024
You are already at the latest version
Abstract
This work focuses on the incorporation of 2D carbon nanomaterials, such as graphene oxide (GO), reduced graphene oxide (rGO) and graphene nanoplatelets (GNPs), into polypropylene (PP) via melt mixing. The addition of these 2D carbon nanostructured networks offers a novel approach to enhancing/controlling the water vapor permeable capabilities of PP composite films, widely used in industrial applications, such as technical (building roof membranes) or medical (surgical gowns) textiles. The study investigates how the dispersion and concentration of these graphene nanomaterials within the PP matrix influence the microstructure and water vapor permeability (WVP) performance. The WVP measurements were conducted via the “wet” cup method. The presence of either GO, rGO or GNPs in the new polyolefin composite films re-vealed 6- to 7-fold enhanced WVP values compared to pristine PP. This improvement is at-tributed to the nano-indentations created at the interface of the carbon nano-inclusions with the polymer matrix in the form of nanopores that facilitate water vapor diffusion. In the particular case of GO and rGO, residual oxidative groups might contribute to the WVP, as well. This is the first study to compare GO, rGO and even GNPs inclusions under identical conditions, providing deeper insights into the mechanisms driving the observed improvements in WVP performance.
Keywords:
2D-carbon based nanomaterials
; graphene
; polypropylene
; nanocomposites
; breathability
1. Introduction
Polymeric membranes are selective materials used in a wide range of applications that require separation processes, from water filtration and purification to industrial separations. An important property that polymeric membranes can exhibit is the water vapor permeability (WVP), which make them ‘’breathable’’. Breathability is defined as the ability of some membranes to allow the diffusion of water vapors through them and at the same time to prevent the penetration of water in liquid state [1,2]. This can be accomplished by various methods, including the incorporation of micro/nano-fillers into the polymer matrix [1,2,3,4,5]. In this case, a micro/nano-pore network can be formed, allowing water vapor to permeate through the membrane. The polymeric composite membrane can be stretched uniaxially or biaxially, either creating micro/nano-pores and/or aligning or “cross-linking” them, respectively, in the composite, contributing to the increase in WVP [1].
Membranes that could provide a selective blocking or permeability of water vapors find application in several sectors including dehydration of gaseous streams, moisture protection for sensitive electronics, breathable textiles and humidity control in buildings. In the latter case, new “breathable” composite polymeric membranes could be applied either (i) as building roof membranes, which would allow water vapor to permeate through them and avoid the co-existence of moisture, and/or (ii) as Vapor Control Layers (VCLs), which will be capable of preventing water vapor generated onto the building surface from freely diffusing towards the roof (wall, floor) and minimizing heat loss through convection.
Stretched membranes reinforced with CaCO3 particles are conventionally used to develop micro-porosity sufficient to impart breathability characteristics. On the other hand, 1D and 2D graphene-based nanomaterials, such as carbon nanotubes or graphene oxide, are anticipated to improve WVP in polymer membranes. The ability of both, carbon nanotubes and GO, to allow rapid diffusion of water vapor through them is a promising implication for the development of breathable composites [4,5,6,7,8]. More specifically, the presence of the CNTs in PP composites, combined with the occurrence of the β and α PP crystalline phase, exhibited significantly enhanced WVP values [3]. The importance of crystalline phase alterations within the polyolefinic matrix, with the β-phase to provide higher permeability characteristics compared to the α-phase, was highlighted. The presence of CNTs further contributed to this enhancement by promoting the formation of nano-channels within the polymer structure, facilitating the diffusion of water vapor. These results prompted the involvement also of the two-dimensional graphene nanomaterials, such as GO, rGO and GNPs, for eventual optimization of WVP properties in composite films. In parallel, graphene based polymeric nanocomposites are proposed as membranes with high moisture permeability and almost impermeability to gases [9]. For instance, there are several studies on self-standing GO films where it is argued that the presence of different oxidizing functional groups (-OH, -C=O, -COOH, etc.) affect the d distance between graphite sheets and, consequently, the water vapor permeability [10,11,12,13]. On the other hand, rGO, which is resulted after the partial removal of the oxidizing groups in GO, is anticipated to exhibit barrier properties, however, in many cases the remaining oxidizing functional groups and the many structural defects may result in notable water permeation [14]. Similarly, in GNPs, which could be considered ideal reinforcements for impermeable membranes due to their high aspect ratio and specific surface area [15], the WVP is significantly influenced by their specific structural characteristics such as the lateral size of their platelets [16].
The main scope of this study is to thoroughly examine and evaluate these three carbon-based 2D nanomaterials as reinforcements for water vapor breathable (or impermeable) polymeric membranes. In this context, polymeric composites consisting of i-PP polymeric matrix and the class of graphene-based 2D nanomaterials, such as GO, rGO or GNPs, were developed and analyzed. The focus is on understanding how these nanomaterials influence the properties of the membranes, particularly in terms of water vapor permeability. iPP is a semi-crystalline polymer that, with the incorporation of nano-inclusions and appropriate processing, can lead to the improvement of the microporosity of the polymer matrix, thereby enhancing the WVP of its nanocomposites [17,18,19,20,21]. This property is expected to be further optimized with the incorporation of carbon-based 2D nanomaterials, which are anticipated to contribute to the overall performance of the membranes. This point-to-point comparison under similar composite preparation conditions could provide direct feedback in case breathability properties arise.
2. Materials and Methods
2.1. Materials
Graphene oxide (GO) was purchased from Abalonyx (GO, CAS: 18002, dry powder < 100 mesh). The reduced GO (rGO) was synthesized by the thermal reduction of the GO from Abalonyx. Specifically, a small amount of GO was heated in an oven at 50 ℃ overnight and kept there additionally for 2 hours at 80℃, for 1 hour at 100℃, for 1 additional hour at 150℃ and finally for 30 minutes at 200℃. The GNPs were purchased from Thomas Swan (GNPs, CAS: SP 8099B, lateral size: 5μm and thickness: 5-7nm). The powdered form of polypropylene (ECOLEN® HZ40S polypropylene homopolymer) was a product of the Hellenic Petroleum S.A. provided by by Plastika Kritis S.A. (Crete, Greece)
2.2. Materials
Nanocomposite membranes containing PP loaded with GO, rGO and GNPs (0.25 to 2.5 wt.%) were prepared by melt mixing with the appropriate amounts of powdered PP in a twin-screw extruder (Thermoscientific-minilab twin extruder HAAKE MINILAB II with conical screws) at 200 °C and screw speed of 100 rpm for 3 min. The pellets of the composite compounds were pressed into films via a hydraulic press at ~200 °C and 80 bars. Polymer films had a thickness of about 100 μm. These films were further annealed at 130oC (this temperature was selected due to its ability to promote the β crystalline phase in PP, which is associated with WVP enhancement under suitable conditions) for 30 min [3]. Table 1 lists the membranes prepared in this study indicating loading of the 2D carbon based nanomaterial utilized.
3. Experimental Techniques
3.1. Characterization Technique
In order to measure water vapor transmission rate (WVTR), the wet cup method described by ASTM E96/E96M-10 [22] was used, based on a home-made devise, already described [21]. Briefly, a dish filled with distilled water is covered by the tested membrane and placed in a chamber in which a cartridge heater and two N2 inlets (one for dry N2 and another for N2 passing through water) control the temperature and humidity level, respectively, while an axial fan ensures air circulation. During the experimental procedure the weight change of the complete test assembly is measured every 5 min by a computer-interfaced scale inside the chamber. The experimental conditions for all the examined membranes were 27 °C and 21% relative humidity (RH). Water vapor transmission rate (WVTR) is defined as the steady water vapor flow in unit of time through unit of area of a body, normal to specific parallel surfaces, under the specific conditions of temperature and humidity at each surface. A least-squares regression analysis of the change in mass as a function of time is used to determine the rate of water vapor transmission at steady state. The WVTR was calculated at the steady-state region from the slope of the water mass loss as a function of time normalized to the area of the tested film[4,23,24]:
with units of g·m−2·min−1. Since the thickness of the films varied, the WVTR was normalized to film thickness, l, in order to obtain the Specific Water Vapor Transmission Rate (l × WVTR) with units of μm·g·m−2·min−1.
The ATR-FTIR spectra of solid samples were recorded on an Alpha-II Diamond ATR Spectrometer of Bruker Optics GmbH.
Scanning Electron Microscopy, SEM, (Zeis SUPRA 35 VP-FEG instrument operation at 5-20kV) was used to examine the morphology of pristine GO, rGO and GNPs. SEM images of cryogenic cross-sections of the composites membranes were also examined.
Thermogravimetric Analysis, TGA, measurements of the pristine GO, rGO and GNPs were performed using a TA 55 model, at a heating rate of 10 ℃/min under nitrogen N2 conditions and a flow rate of 25 mL/min.
X-ray diffraction (XRD) was used to identify the crystalline phase of all composites. XRD measurements were carried out by using a Bruker D8 Advance diffractometer equipped by a Cu lamp (λCuKa = 1.54046 Å) at a scanning rate 0.5°/min over a range 5–30ο (2θ).
Differential scanning calorimetry (DSC) measurements were carried out on a Q100 unit (TA Instruments) equipped with a liquid N2 cooling system. For the study of melting and crystallization behavior of net polymer and nanocomposites containing GO, rGO and GNPs, the samples were heated up to 200οC with a heating rate of 10οC min-1. All measurements were performed in a nitrogen atmosphere (50 mL/min). Data were obtained from the first heating cycle that refer to the actual state of the prepared composites.
4. Results and Discussion
4.1. Characterization of 2D Carbon Based Nanomaterials
The morphological, structural, crystallographic and thermal properties of the 2D carbon-based nanomaterials (GO, rGO and GNPs), used to prepare the PP nanocomposite films, were investigated through Scanning Electron Microscopy, ATR/FTIR spectroscopy, X-ray diffraction and Thermogravimetric Analysis (TGA), respectively.
The morphology of GO, rGO and GNPs samples was characterized using SEM analysis (Figure 1). The lateral dimensions of GO are between 15-50 μm, while rGO presents approximately similar morphology and dimensions; SEM image does not reveal any thinner sheet morphology of rGO compared to GO nor the reduced distance between its layers. GNPs has a form of flakes (multi-layer graphene platelet) with typical lateral size of 5 μm.
ATR-FTIR spectra (Figure 2a) and XRD patterns (Figure 2b), contributed on the identification of the chemical composition. In the ATR-FTIR spectrum of GO, characteristics peaks are noticed related to its oxidizing functional groups (-OH, -COOH, C=O, -C-O, C-O-C). The assignment of these peaks is provided in Table 2. The peaks of the -COOH groups are detected at 970 and 1380 cm-1, whilst the peaks at 1040 cm-1 and 1220 cm-1 are assigned to the -C-O and -C-O-C groups, respectively. The peak at 1720 cm-1 corresponds to the carbonyl groups (C=O). It is evident that after the thermal reduction of GO to rGO, most of the peaks corresponding to the oxidizing functional groups decrease in intensity, however partial and not complete reduction is noticed, as indicated by the persistence of the peak at ∼1720 cm-1 (C=O) and in the 950-1300cm-1 region (Figure 2a). In addition, as it was anticipated, no absorption peaks are observed in the ATR-FTIR spectrum of GNPs.
The latter is further confirmed by XPS spectra obtained for the GNPs in which the presence of oxygen was not detected, as shown in Figure S1 (deconvoluted C1s spectra and the O1 core level spectra). From the peak areas of O1s and C1s divided by the relative sensitivity factors and the energy analyzer transmission characteristics, the % atomic concentration is 98.6 ±0.1 carbon and 1.4 ±0.1 oxygen for GNPs. On the other hand, the % atomic concentration for the GO is 69.9 ±0.5 carbon and 30.1 ±0.5 oxygen and for the rGO is 94.1 ±0.5 carbon and 5.9 ±0.5 oxygen. GO shows high percentages of oxygen revealing the presence of several oxidizing groups with the ability to adsorb water. rGO shows some residual oxidizing groups after the reduction process achieved with considerably lower percentages of oxygen.
Figure 2b presents the TGA thermograms of all graphene/graphitic nano-inclusions. It is obvious that both GO and rGO are not thermally stable compounds and can easily decompose or lose weight, even at temperatures below 100℃. Weight loss in this temperature window is primarily residual water molecules. Up to 190°C, the slight weight loss is due to the removal of a few physically adsorbed water molecules and unstable oxygen-containing functional groups. As the temperature increases to 250°C, the relatively stable oxygen-containing functional groups begins to decompose. Subsequently, the significant weight loss observed at temperatures between 100 ℃ and 250 ℃ is due to the removal of functional oxidizing groups in GO. Thus, from the TGA thermogram we can derive the information that GO contains about 30 wt.% oxidizing groups, while in rGO, which has been obtained from the thermal reduction of the same GO, a percentage of ∼8 wt.% oxidizing groups remains. Therefore, during its thermal reduction to rGO, GO has lost a significant percentage of its oxidizing functional groups. In the case of GNPs it is evident that this is a thermally stable material up to 500 ℃. From 500 ℃ onwards, a rapid mass loss begins, which can be mainly attributed to the decomposition of the carbon skeleton of the GNPs [25,26], this is also discernable for GO and rGO. A note is made of the fact that a bulk technique, the TGA, and a surface technique one, the XPS, give such comparable results.
Fianally, the XRD patterns corresponding to the three components (GO, rGO and GNPs) are depicted in Figure 2c showing reasonable differences considering their distinct structure or/and composition. The XRD is one of the most comprehensive tools to identify the type and quality of 2D carbon-based materials, being relatively easy to determine the composition and crystal structure of the material from the positions of the diffraction peaks. In the XRD pattern of GO, a characteristic peak appears at ~2θ=11o, corresponding to the crystallographic plane (001) [30,31] and at a interlayer distance between the crystallographic planes of the crystal d ~10.8Aο which is due to the presence of the various oxidizing functional groups attached to the carbon atoms of GO. The distance between the crystallographic planes, d-spacing, is calculated based on Bragg’s equation.The XRD pattern of GNPs presents a sharp peak, indicating a high degree of crystallinity, at higher diffraction angle, ~2θ=26.3ο. This peak corresponds to the (002) crystallographic plane,. This peak is similar to that of graphite, confirming its stacked structure with a distance between the crystallographic planes of the crystal d~3.4Aο. Essentially, comparing the XRD patterns of GO and GNPs, it is evident that the presence in GO of various oxidizing groups, such as hydroxyls (C-OH), carbonyls (C=O) and epoxides (C-O) on the basal plane and carboxyl acids (O-C=O) on the edges of GO, results in an increased interlayer distance between graphene sheets, from 3.4Aο in graphite to 8Aο in GO. In the XRD pattern of rGO, a broad peak centered at ~23.4ο appears, which corresponds to the (002) crystallographic plane, indicating a poor ordering of the sheets along the stacking direction. The distance between the crystallographic planes is slightly larger in rGO (3.8Aο) than in graphite (3.4Aο), suggesting the presence of some residual surface oxidizing groups in rGO. Upon the heating of GO a gradual dehydration is taking place in the beginning, while extended heating results in the reduction of GO. The partial reduction of GO that has been revealed though ATR-FTIR, is also confirmed through XRD. In particular, the main diffraction peak of GO at ~2θ=11ο disappears in the rGO pattern with the simultaneous generation of the broad peak at ~23.4ο [24,32,33].
Overall, we observe distinct features among the three different 2D carbon-based nanomaterials. All the above results and conclusions from the characterization techniques of the graphene structures are summarized in the following Table 3
4.2. Characterization of 2D Carbon Based Nanocomposite Films
In a previous study related to PP/carbon nanotubes composites we presented that the crystallization behavior of the membranes and the crystallographic phase is among the most important features to be consider regardless of their major or minor effect on WVP that may exhibit [3]. In this context, both DSC and XRD techniques were used collaboratively to characterize the crystalline structures present in the polymeric nanocomposites, comparing the crystalline behavior in each composite and evaluating if the 2D-carbon-based nanofiller affects the crystalline properties of the polymeric matrix.
DSC thermographs of composite films PP/GO, PP/rGO and PP/GNPs (1.5 and 2.5 wt.%) are shown in Figure 3a,b,c. The procedure involved the heating of the films from −20 oC to 200 oC at a constant heating rate of 10 oC min−1. The typical endothermic melting peak of the α-crystalline phase of PP (melting point Tm~160℃) is noticed in the DSC thermographs of pure PP polymer matrix which becomes quite broader with 2D carbon-based loading indicating a wider crystallite size distribution in the nanocomposite films. For all the nanocomposite films, a shoulder at around 155 oC appears prior to the main melting peak, most likely indicating the existence of different perfection of α-crystals [34].
A similar characterization of the crystallization phases was also attempted through XRD analysis (Figure 3d,e,f). All samples showed diffraction peaks at 2θ = 14.2o, 17o, 18.6o, 21.2o and 22o, which correspond to the respective crystalline lattice planes, α(110), α(040), α(130), α(111) and α(131) + (041), of the α-crystalline phase of the PP [34,35]. The XRD patterns corresponding to the different composites are quite similar. It is noticeable that in the case of net PP and mainly in all PP/GO compositions a very small diffraction peak at 16o attributed to β-phase crystallites in PP is observed. This indicates that the development of a small portion of β-phase is favored. Moreover, the relative intensity peaks corresponding to the α-phase differ in the composite containing GNPs compared to the other two composites. In semi-crystalline polymers like polypropylene, the α-phase can develop a preferred orientation during processing, where the polymer chains align along a particular direction. This alignment leads to anisotropy in the crystalline structure, causing certain crystallographic planes to become more oriented in specific directions. Consequently, the relative intensities of the diffraction peaks from various crystal planes can vary. The morphology and size of GNPs which defers from those of GO and rGO, may be responsible for the variations in the relative intensity of the peaks associated with the α-phase in PP.
It is remarkable that the characteristic diffraction peaks corresponding to GO and rGO nanoinclusion, typically observed at ~11o and 23.4° respectively, are absent in the XRD patterns of their corresponding nanocomposite films. Even at the highest loading (2.5 wt.% GO or rGO), these characteristic peaks do not appear in the XRD diagrams of the composites. In contrast, a significant difference is observed in the XRD diagrams of PP/GNPs composites, where the characteristic diffraction peak of GNPs is clearly noticeable. At the same time, a slight shift of this peak towards higher diffraction angles, from 26.2o on GNPs to 26.6o in the PP/GNPs composites, indicates that the graphene nanosheets undergo a degree of compression upon their inclusion through melt extrusion into the polymer matrix. While, in the case of GO and rGO, a certain degree of layer exfoliation could be considered, as their characteristic peaks disappear (or shift to lower diffraction angles) upon incorporation into the polymer matrix.
4.3. Underlaying Interactions Inside the Composite
For a comprehensive understanding of the WVP properties of the composite films containing the three different fillers (GO, rGO, and GNPs), it is essential to emphasize the key findings revealed through the above characterization.
In the PP/GO and PP/rGO nanocomposite films, it was observed that the characteristic diffraction peaks of GO and rGO do not appear in the relevant XRD diagrams. Even at their highest loading (2.5 wt.%), the distinctive peaks that constitutes the imprint of GO or rGO within the polymeric matrix are absent. In an attempt to reveal if the absence of the GO or rGO peak in the composite XRD pattern is due to the low GO or rGO fraction of carbon, new composites with higher loading in GO and rGO (i.e., PP/6 wt.%GO and PP/6 wt.% rGO) were also prepared and their XRD pattern is presented in Figure 4. Nevertheless, despite the higher GO or rGO loading, the XRD fingerprint of GO or rGO remains indiscernible.
In a further effort, the PP/6 wt.%GO film was also prepared following a film casting approach (see section S2). Film casting is a technique through which the extensive heat treatment and shear stresses, which are developed during the melt mixing extrusion technique adopted for the composites preparation, can be avoided. When the film casting method was applied, the characteristic diffraction peak corresponding to GO nanoinclusion was just observable in the XRD pattern of the nanocomposite film (Figure S2). The slight differentiation between the two preparation methods may be attributed to the non-invasive nature of film casting process, which avoids the heat treatment and shear stresses involved in melt mixing extrusion preparation. As a result, in the case of the film casted composite, the GO filler is partly incorporated into the matrix in its original form, while its partial exfoliation continues to apply here to a certain extent.
Furthermore, in order to certify the absence of the characteristic peak of GO in the composites, Small Angle X-ray diffraction technique, SAXS, measurements were also conducted for the PP/2.5 wt.%GO nanocomposite film. Once again, it was observed that the characteristic diffraction peak corresponding to the GO nanoinclusion does not appear in the SAXS pattern (Figure S3). Therefore, in the case of GO loading into the PP matrix, it is reasonable to assume that GO undergoes (a partial) exfoliation. This could be attributed to the intense temperature stresses during molding and the shear stresses generated during mixing via the melt mixing technique. In a conceptual design of this assumption, the GO is included in the PP/GO composite in a form of dispersed GO sheets within the polymer matrix. This also holds for the rGO case. On the contrary, in the PP/GNPs composites, intact stacks of GNPs are included in the composite forming a tactoid-polymer configuration (Figure 5).
4.4. Water Vapor Transport Through Hybrid Composite PP Films
The Specific Water vapor Transmission Rate, Sp.WVTR, values of PP nanocomposite films loading with 2D carbon-based nanomaterials (GO, rGO and GNPs) have been evaluated and are depicted in Figure 6. The Sp.WVTR values have been measured at RT at 21%, relative humidity (RH) following the wet cup method.
It was observed that all PP/x% 2D carbon-based (GO, rGO and GNPs) nanocomposite films, exhibit enhanced average values of Sp.WVTR, compared to the values obtained for net PP polymer matrix films. In particular, for PP/GO nanocomposite films, containing 0.5 wt.% GO, the Sp.WVTR values increase considerably (~6-7 times) compared to the permeability obtained for pure PP. The maximum Sp.WVP for PP/rGO and PP/GNPs is observed at a nanoinclusion concentration of 1.5 wt.%. At higher loadings of all nanoinclusions, the permeability gradually decreases. This can be explained by the fact that, at a high concentration of nanoinclusions, their dispersion in the polymer matrix is hindered by the formation of aggregates, which obstruct the facilitation of water vapor permeability. The increased WVP in the case of PP/GO nanocomposite films, even at low loadings, is probably due to the presence of the various oxidizing groups (-COOH, -OH, -C=O, -C-O-C) in GO (exfoliated or not), within the PP polymeric matrix. In particular, the oxidizing groups existing in the GO structure leads to defects and imperfections in the structure creating a nonperiodic structure. This discontinuation in the structure along with the uniquely large 2D surface of graphene, could be alleged as the factor that enables the rapid transport of water vapors through GO, thereby enhancing the permeability of polymeric nanocomposite films. Furthermore, considering that rGO was obtained by thermal reduction of GO, which proved to achieve partial, and not complete, removal of the oxidizing groups, these could facilitate the water vapor permeability, when rGO was incorporated as an inclusion into the PP polymeric matrix.
In the above cases, the water vapor is initially bound through the oxidizing groups of GO and rGO (Figure 7a), but due to the hydrophobic nature of the graphitic structure, the vapor tends to “escape” and move away. Thus, a hopping phenomenon of water vapor might occur (Figure 7b) with a rapid transport through the polymeric composite.
Meanwhile, the GNPs, which have not undergone exfoliation during melt mixing with the PP polymer matrix, retain a firm structure with a relatively small lateral size. As a result, the GNPs seem to disrupt the polymer’s microstructure, creating microporous formations at their interfaces with the polymeric matrix, thereby ensuring the water vapor permeability of PP/GNPs nanocomposite films. This phenomenon probably cannot be excluded from the other composite films, regardless of the nature of the 2D carbon-based nanomaterial. This is confirmed by the SEM images depicted in Figure 8 which shows the voids created at the polymer-inclusion interfaces, contributing to the porosity development.
From the SEM images, we can discern the development of nanoporosity at the boundaries of all 2D carbon-based fillers which can be related to the initially high Sp. WVTR (of the order of 8000 µm g/m2 day) compared to pure PP. The low affinity of polymer and 2D carbon-based inclusions can lead to the formation of “interfacial voids” and nano-indentations which create pathways that facilitate permeability. This helps explain the increased water vapor permeability (WVP), regardless of the type of inclusion or the presence of oxidizing groups within the polymer matrix. It is evident that the distribution of nano- or micro-porosity generated by the inclusions plays a significant role in water vapor diffusion. In this context, a Kelvin effect that could decrease the partial pressure of the water at the above interfacial voids cannot be excluded. Moreover, it is important to note that the maxima in water vapor permeability can be constrained due to both, the presence of aggregates at the high loadings of graphene 2D nanomaterials and the continuous consequence of the Kelvin effect which can limit the maximum possible water vapor permeability at all loadings.
5. Conclusions
From the WVP measurements, it was observed that all PP/2D nanocarbon-based composite films exhibited enhanced Sp. WVTR values, approximately 6-7 times greater than those of the pure polymer matrix films. Specifically, maximum permeability was noticed at a concentration of about 0.5 to 1.5 wt.% (2D) nanoinclusion, while higher concentrations led to a significant decrease in permeability. Whereas it is plausible that some percentage of GO and rGO may undergo exfoliation, the enhanced water vapor permeability values obtained for the nanocomposites containing GO and rGO can be attributed both to the presence/ remaining oxidizing groups (such as carbonyls) as well as to a hopping effect of water vapor within the composite, which facilitates the penetration of water vapors. Additionally, the increased WVP values encountered for all the 2D-carbon based nanocomposite films studied (PP/GO, PP/rGO and PP/GNPs) can be linked to the nano/micro voids that appear to be created at the interface with the polymer matrix. In the same context, a contribution to the rapid water vapor transport due to the frictionless, smooth and chemically inert graphitic structure of these 2D carbon-based nanomaterials at these interfaces cannot be ruled out.
Supplementary Materials
The following supporting information can be downloaded at the website of this paper posted on Preprints.org. Figure S1 Deconvoluted C1s XPS spectra from (a)GO, (c) rGO and (e) GNPs and O1s XPS spectra from (b)GO, (d) rGO and (f) GNPs. Figure S2. XRD diagrams of (a) the PP/6%GO nanocomposite film prepared by the melt blending technique in the twin screw extruder, (b) the PP/6%GO nanocomposite film prepared by the film casting technique, (c) the film of the pure PP polymer matrix and (d) the GO nanoinclusion. Figure S3. SAXS diagrams of PP polymer matrix film, PP/2.5%GO nanocomposite film and GO nanoinclusion.
Author Contributions
G.A.V. (Glykeria A. Visvini) investigation, methodology, validation and data analysis; G.N.M. Methodology, validation, investigation, visualization, supervision; A.S.B. Conceptualization, writing-original draft, writing—review and editing, visualization, supervision; G.A.V. (George A. Voyiatzis) Conceptualization, supervision, project administration, funding acquisition. All authors have read and agreed to the published version of the manuscript
Funding
This research has been co-financed by the European Union and Greek national funds through the Operational Program Competitiveness, Entrepreneurship and Innovation, under the call «Special Actions “AQUACULTURE”-”INDUSTRIAL MATERIALS”-”OPEN INNOVATION IN CULTURE”» (project code: T6YBP-00337).
Data Availability Statement
The raw data will be available from corresponding author upon reasonable request.
Acknowledgments
The authors would like to acknowledge Assistant Professor Aris Giannakas for providing set up twin-screw extruder for the compound preparation at the Department of Food Science & Technology, University of Patras. Dr. Eleni Pavlopoulou for SAXS (Small angle scattering) measurements carried out at IESL/FORTH (Institute of Electronic Structure and Laser, of the Foundation for Research and Technology) in Crete. In addition, the authors acknowledge Dr. Labrini Syggelou and Dr. Vassilios Dracopoulos from ICE-HT/FORTH for their support with the XPS and SEM measurements, respectively
References
- Wu, P.C.; Jones, G.; Shelle, C.; Woelfli, B. Novel Microporous Films and Their Composites. Journal of Engineered Fibers and Fabrics 2007, 2, 155892500700200105. [Google Scholar] [CrossRef]
- Liu, S.; Jun, S.C.; Zhang, S.; Wang, F.; Yu, J.; Ding, B. Advancements in Electrospun Nanofibrous Membranes for Improved Waterproofing and Breathability. Macromolecular Materials and Engineering 2023, 309. [Google Scholar] [CrossRef]
- Visvini, G.A.; Mathioudakis, G.N.; Soto Beobide, A.; Piperigkou, Z.; Giannakas, A.E.; Messaritakis, S.; Sotiriou, G.; Voyiatzis, G.A. Improvement of Water Vapor Permeability in Polypropylene Composite Films by the Synergy of Carbon Nanotubes and β-Nucleating Agents. Polymers 2023, 15, 4432. [Google Scholar] [CrossRef]
- Bounos, G.; Andrikopoulos, K.; Moschopoulou, H.; Lainioti, G.; Roilo, D.; Checchetto, R.; Ioannides, T.; Kallitsis, J.; Voyiatzis, G. Enhancing Water Vapor Permeability in Mixed Matrix Polypropylene Membranes Through Carbon Nanotubes Dispersion. Journal of Membrane Science 2016, 524. [Google Scholar] [CrossRef]
- Fornasiero, F. Water vapor transport in carbon nanotube membranes and application in breathable and protective fabrics. Current Opinion in Chemical Engineering 2017, 16, 1–8. [Google Scholar] [CrossRef]
- Kim, S.; Jinschek, J.R.; Chen, H.; Sholl, D.S.; Marand, E. Scalable Fabrication of Carbon Nanotube/Polymer Nanocomposite Membranes for High Flux Gas Transport. Nano Letters 2007, 7, 2806–2811. [Google Scholar] [CrossRef] [PubMed]
- Baek, Y.; Kim, C.; Seo, D.K.; Kim, T.; Lee, J.S.; Kim, Y.H.; Ahn, K.H.; Bae, S.S.; Lee, S.C.; Lim, J.; et al. High performance and antifouling vertically aligned carbon nanotube membrane for water purification. Journal of Membrane Science 2014, 460, 171–177. [Google Scholar] [CrossRef]
- Cho, Y.H.; Kim, H.W.; Lee, H.D.; Shin, J.E.; Yoo, B.M.; Park, H.B. Water and ion sorption, diffusion, and transport in graphene oxide membranes revisited. Journal of Membrane Science 2017, 544, 425–435. [Google Scholar] [CrossRef]
- Cui, Y.; Kundalwal, S.; Kumar, S. Gas Barrier Performance of Graphene/Polymer Nanocomposites. Carbon 2015. [Google Scholar] [CrossRef]
- Nair, R.R.; Wu, H.A.; Jayaram, P.N.; Grigorieva, I.V.; Geim, A.K. Unimpeded Permeation of Water Through Helium-Leak–Tight Graphene-Based Membranes. Science 2012, 335, 442–444. [Google Scholar] [CrossRef]
- Peng, C.; Iqbal, Z.; Sirkar, K.; Peterson, G. Graphene Oxide-Based Membrane as a Protective Barrier against Toxic Vapors and Gases. ACS Applied Materials & Interfaces 2020, 12. [Google Scholar] [CrossRef]
- Sygellou, L.; Paterakis, G.; Galiotis, C.; Tasis, D. Work Function Τuning of Reduced Graphene Oxide Τhin Films. The Journal of Physical Chemistry C 2015, 120. [Google Scholar] [CrossRef]
- Díez-Pascual, A.M. Carbon-Based Polymer Nanocomposites for High-Performance Applications II. Polymers 2022, 14, 870. [Google Scholar] [CrossRef]
- Sengupta, I.; Chakraborty, S.; Talukdar, M.; Pal, S.; Chakraborty, S. Thermal reduction of graphene oxide: How temperature influences purity. Journal of Materials Research 2018, 1–10. [Google Scholar] [CrossRef]
- Chiou, Y.-C.; Chou, H.-Y.; Shen, M.-Y. Effects of adding graphene nanoplatelets and nanocarbon aerogels to epoxy resins and their carbon fiber composites. Materials & Design 2019, 178, 107869. [Google Scholar]
- Peretz, S.; Cullari, L.; Nadiv, R.; Nir, Y.; Laredo, D.; Grunlan, J.; Regev, O. Graphene-induced enhancement of water vapor barrier in polymer nanocomposites. Composites Part B: Engineering 2017, 134. [Google Scholar] [CrossRef]
- Brückner, S.; Meille, S.; Petraccone, V.; Pirozzi, B. Polymorphism in isotactic polypropylene. Progress in Polymer Science 1991, 16, 361–404. [Google Scholar] [CrossRef]
- Lotz, B.; Wittmann, J.C.; Lovinger, A.J. Structure and morphology of poly(propylenes): a molecular analysis. Polymer 1996, 37, 4979–4992. [Google Scholar] [CrossRef]
- Varga, J. Supermolecular structure of isotactic polypropylene. Journal of Materials Science 1992, 27, 2557–2579. [Google Scholar] [CrossRef]
- Horváth, F.; Gombár, T.; Varga, J.; Menyhard, A. Crystallization, melting, supermolecular structure and properties of isotactic polypropylene nucleated with dicyclohexyl-terephthalamide. Journal of Thermal Analysis and Calorimetry 2016, 128. [Google Scholar] [CrossRef]
- Ran, S.; Zong, X.S.; Fang, D.; Hsiao, B.; Chu, B. Structural and Morphological Studies of Isotactic Polypropylene Fibers during Heat/Draw Deformation by in-Situ Synchrotron SAXS/WAXD. Macromolecules 2001, 34. [Google Scholar] [CrossRef]
- Standard test methods for water vapor transmission of materials, ASTM E96/E96M-10. Available online: http://www.astm.org/Standards/E96.htm (accessed on 27 November 2024).
- Kumaran, M.K. Interlaboratory Comparison of the ASTM Standard Test Methods for Water Vapor Transmission of Materials (E 96-95). Journal of Testing and Evaluation 26 26, 83–88. [CrossRef]
- Andrikopoulos, K.; Bounos, G.; Tasis, D.; Sygellou, L.; Drakopoulos, V.; Voyiatzis, G. The Effect of Thermal Reduction on the Water Vapor Permeation in Graphene Oxide Membranes. Advanced Materials Interfaces 2014, 1. [Google Scholar] [CrossRef]
- Sadri, R.; Hosseini, M.; Kazi, S.N.; Bagheri, S.; Ahmed, S.M.; Ahmadi, G.; Zubir, N.; Sayuti, M.; Dahari, M. Study of environmentally friendly and facile functionalization of graphene nanoplatelet and its application in convective heat transfer. Energy Conversion and Management 2017, 150, 26–36. [Google Scholar] [CrossRef]
- Wilson, N.; Pandey, P.; Beanland, R.; Young, R.; Kinloch, I.; Gong, L.; Liu, Z.; Suenaga, K.; Rourke, J.; York, S.; et al. Graphene Oxide: Structural Analysis and Application as a Highly Transparent Support for Electron Microscopy. ACS nano 2009, 3, 2547–2556. [Google Scholar] [CrossRef]
- Saleem, H.; Habib, A. Study of band gap reduction of TiO2 thin films with variation in GO contents and use of TiO2/Graphene composite in hybrid solar cell. Journal of Alloys and Compounds 2016, 679, 177–183. [Google Scholar] [CrossRef]
- Chammingkwan, P.; Matsushita, K.; Taniike, T.; Terano, M. Enhancement in Mechanical and Electrical Properties of Polypropylene Using Graphene Oxide Grafted with End-Functionalized Polypropylene. Materials 2016, 9, 240. [Google Scholar] [CrossRef]
- Jiao, K.; Zhu, T.; Li, X.; Shan, M.; Xu, Z.; Jiao, Y. Assembly of graphene oxide on nonconductive nonwovens by the synergistic effect of interception and electrophoresis. Journal of Nanoparticle Research 2015, 17. [Google Scholar] [CrossRef]
- Kovtyukhova, N.I.; Ollivier, P.J.; Martin, B.R.; Mallouk, T.E.; Chizhik, S.A.; Buzaneva, E.V.; Gorchinskiy, A.D. Layer-by-Layer Assembly of Ultrathin Composite Films from Micron-Sized Graphite Oxide Sheets and Polycations. Chemistry of Materials 1999, 11, 771–778. [Google Scholar] [CrossRef]
- Jung, I.; Rhyee, J.-S.; Son, J.Y.; Ruoff, R.S.; Rhee, K.-Y. Colors of graphene and graphene-oxide multilayers on various substrates. Nanotechnology 2012, 23, 025708. [Google Scholar] [CrossRef]
- Ruidíaz-Martínez, M.; Álvarez, M.A.; López-Ramón, M.V.; Cruz-Quesada, G.; Rivera-Utrilla, J.; Sánchez-Polo, M. Hydrothermal Synthesis of rGO-TiO2 Composites as High-Performance UV Photocatalysts for Ethylparaben Degradation. Catalysts 2020. [Google Scholar] [CrossRef]
- Saleem, H.; Haneef, M.; Abbasi, H. Synthesis Route of Reduced Graphene Oxide Via Thermal Reduction of Chemically Exfoliated Graphene Oxide. Materials Chemistry and Physics 2017, 204. [Google Scholar] [CrossRef]
- Bhuiyan, M.K.H.; Rahman, M.M.; Mina, M.F.; Islam, M.R.; Gafur, M.A.; Begum, A. Crystalline morphology and properties of multi-walled carbon nanotube filled isotactic polypropylene nanocomposites: Influence of filler size and loading. Composites Part A: Applied Science and Manufacturing 2013, 52, 70–79. [Google Scholar] [CrossRef]
- Martin, J.; Bourson, P.; Dahoun, A.; Hiver, J. The β-Spherulite Morphology of Isotactic Polypropylene Investigated by Raman Spectroscopy. Applied spectroscopy 2009, 63, 1377–1381. [Google Scholar] [CrossRef]
Figure 1.
SEM images of (a) GO, (b) rGO and (c) GNPs.
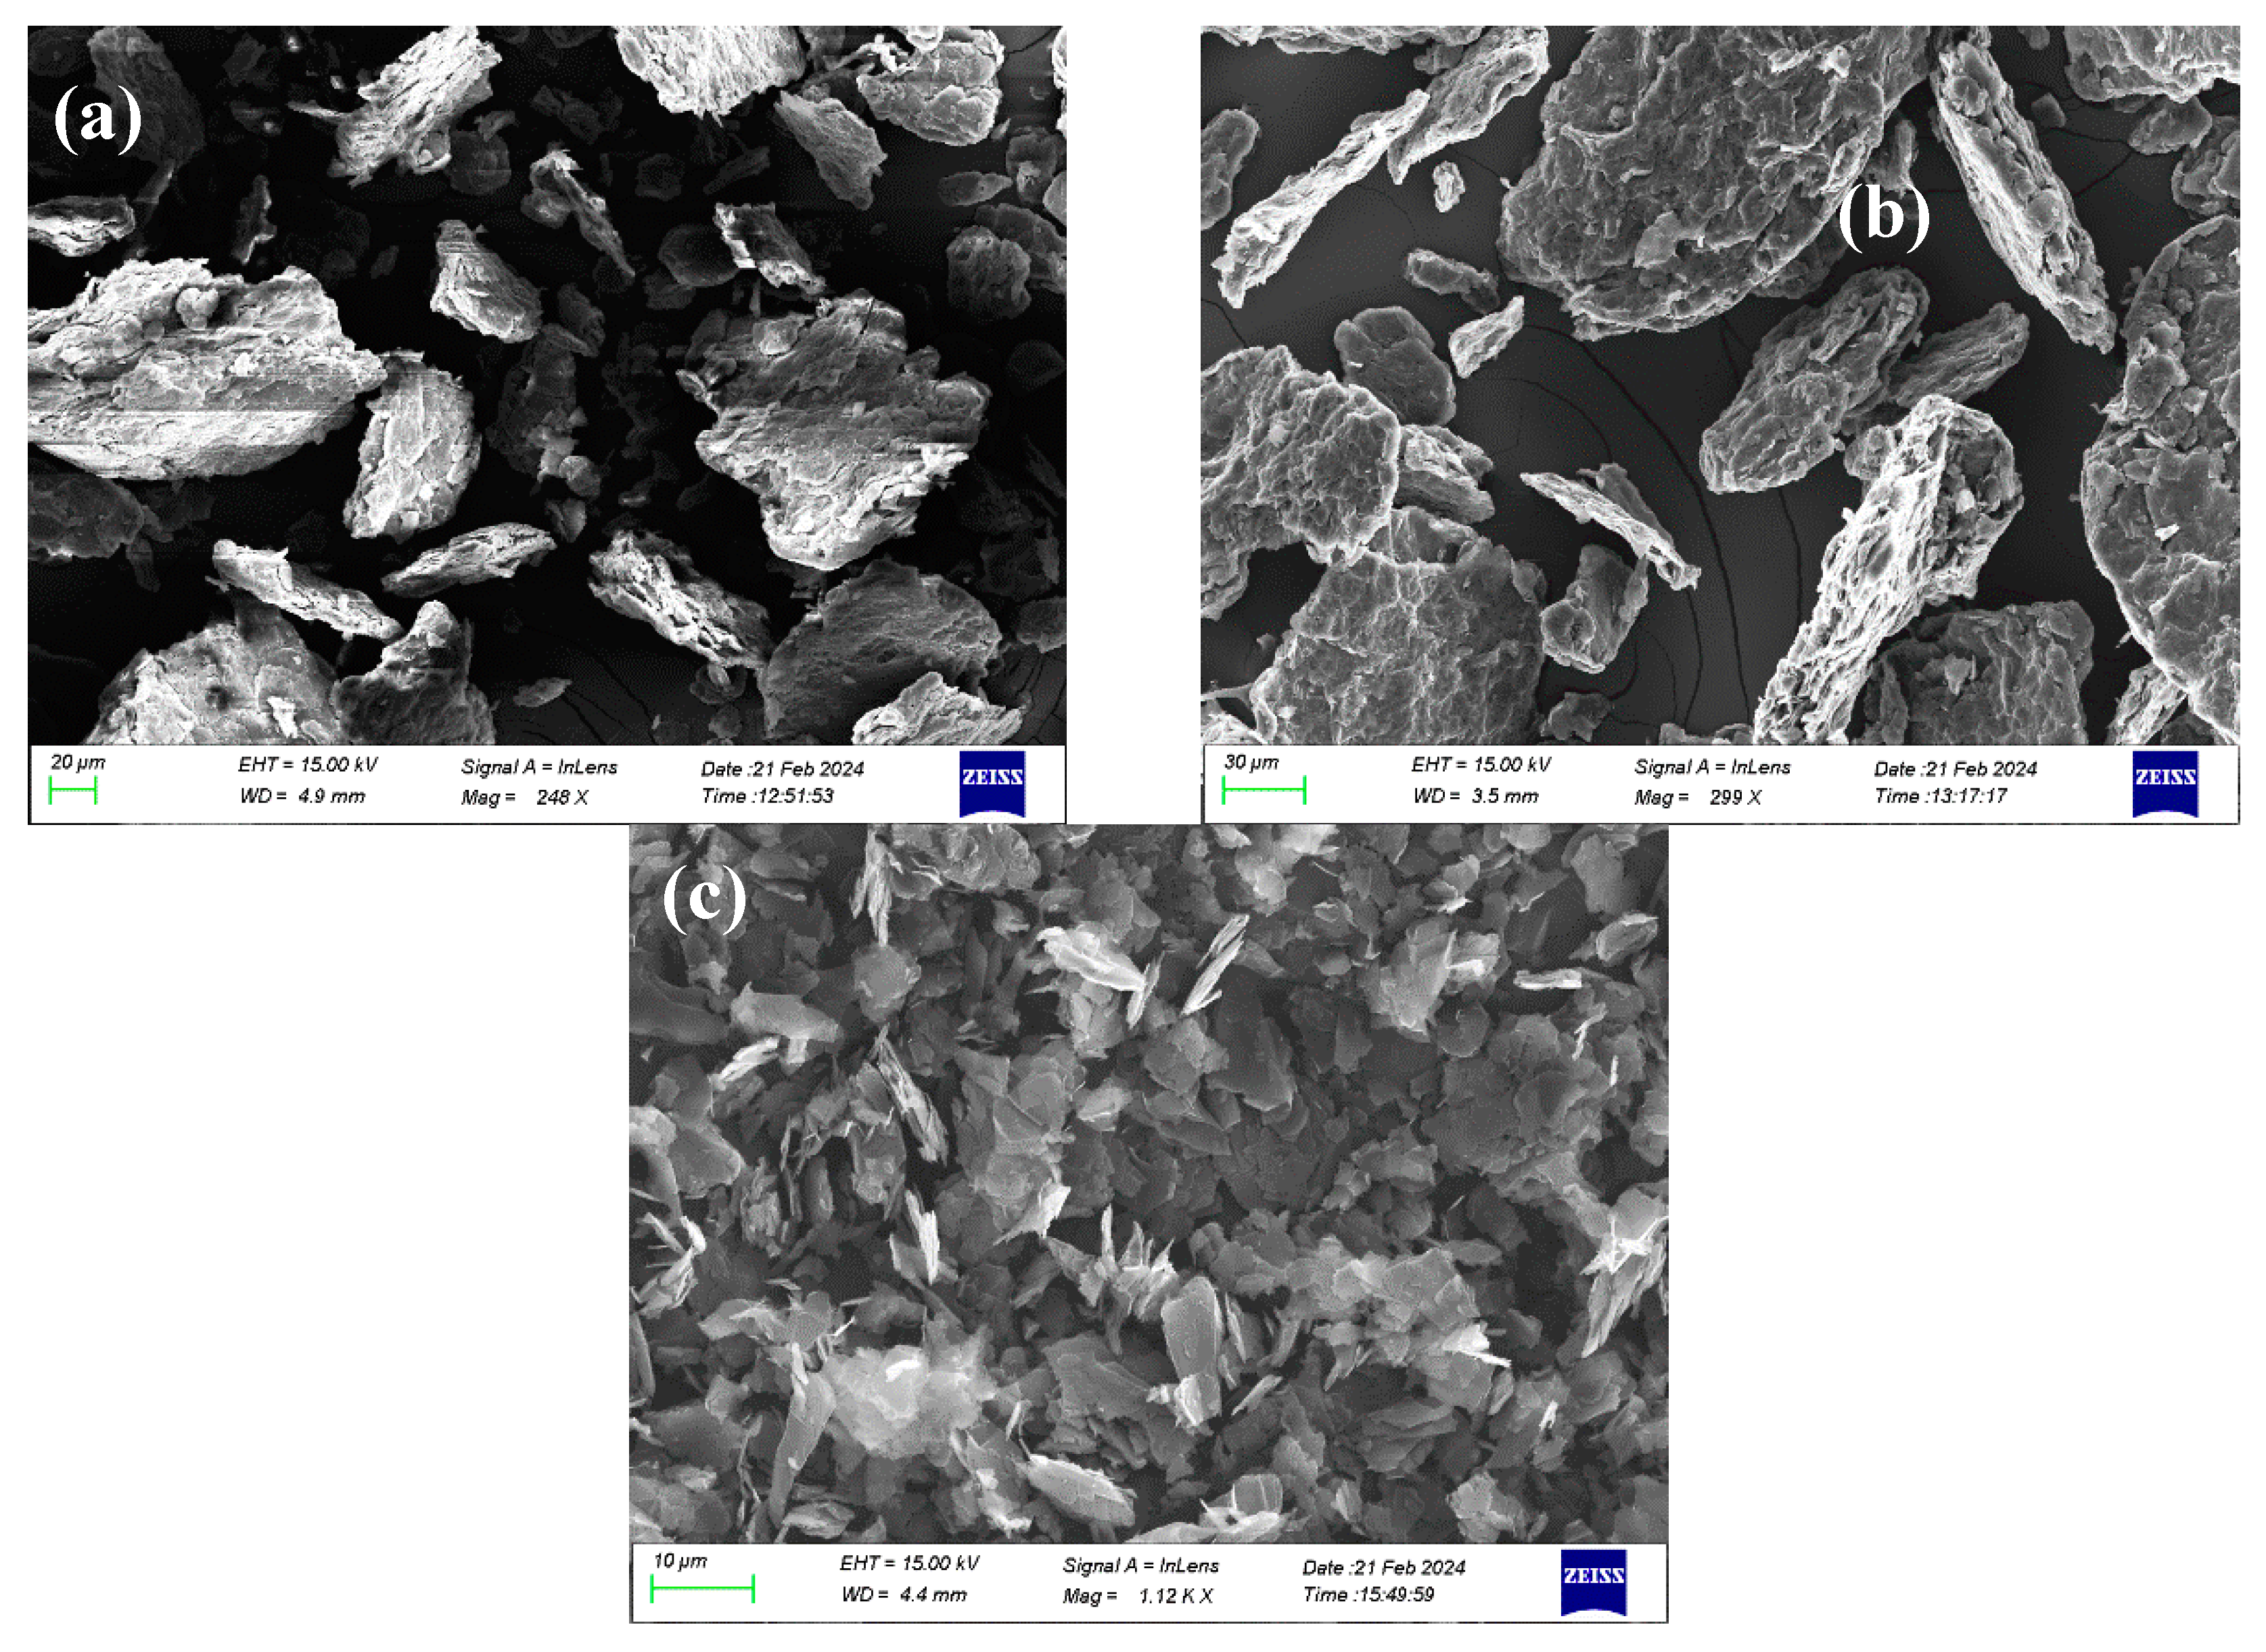
Figure 2.
(a)The FTIR/ATR spectra, (b) XRD patterns and (c) TGA thermographs of pristine GO, rGO and GNPs.
Figure 2.
(a)The FTIR/ATR spectra, (b) XRD patterns and (c) TGA thermographs of pristine GO, rGO and GNPs.
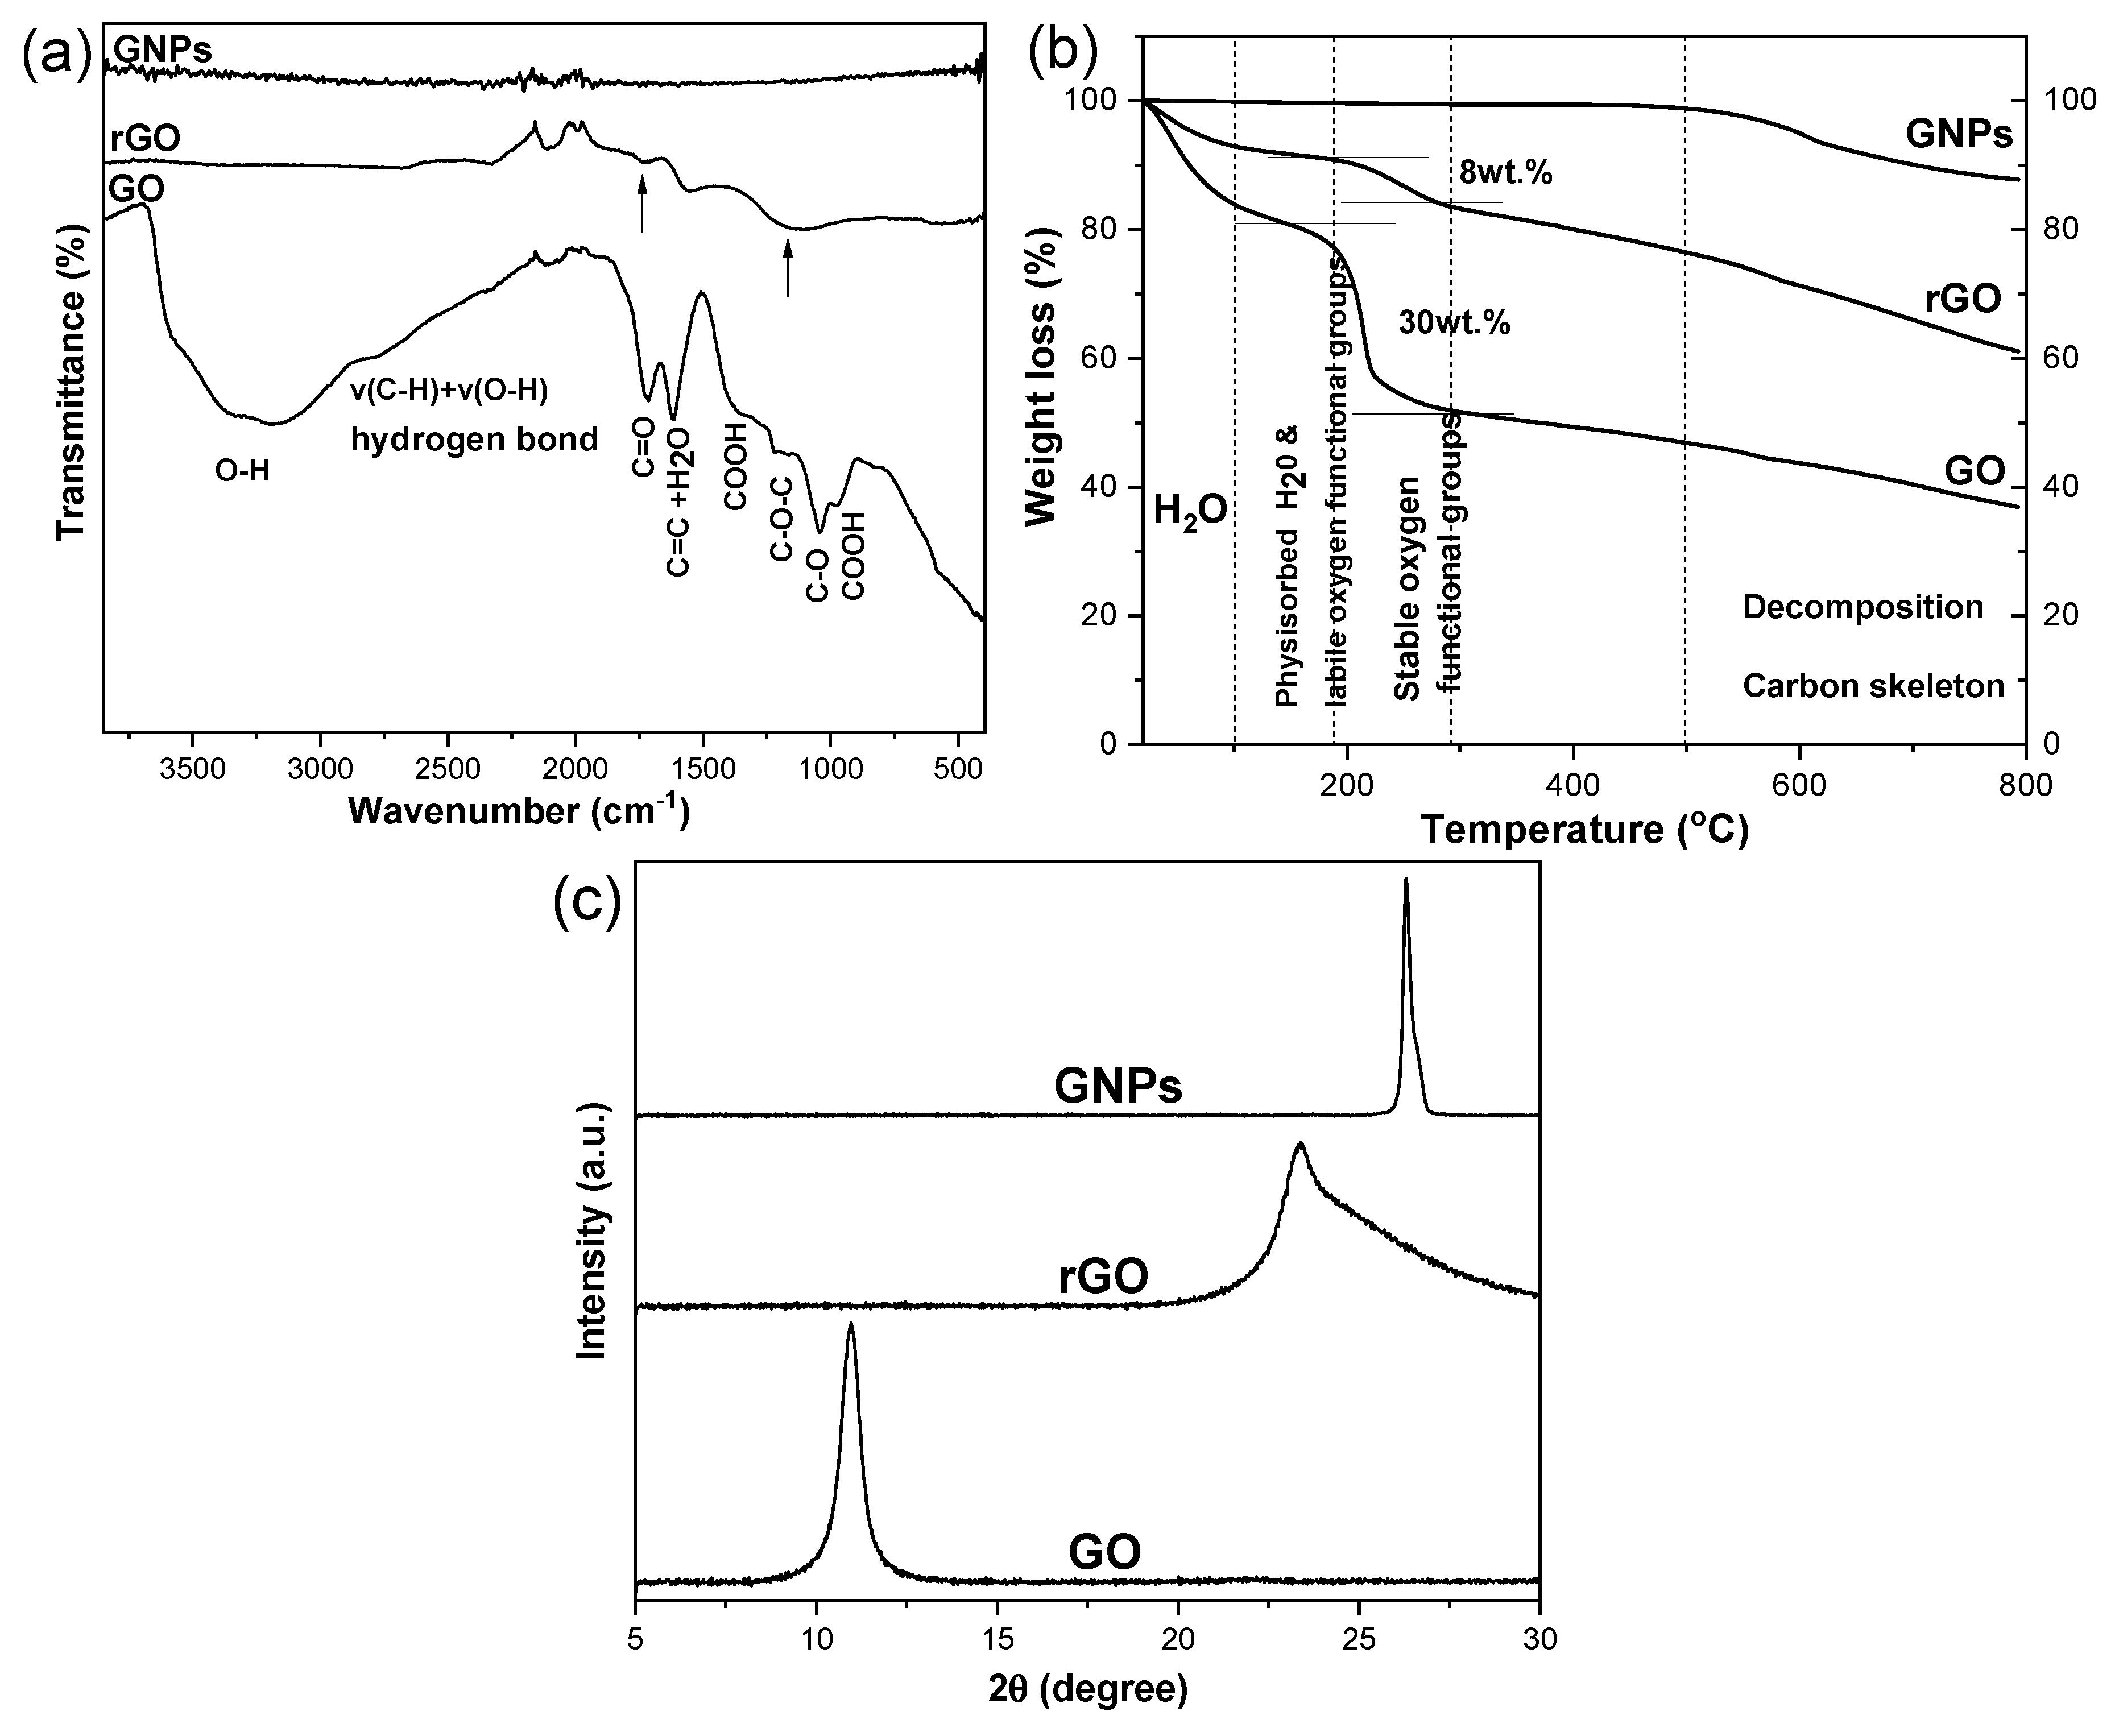
Figure 3.
DSC thermograms and XRD patterns of PP/GO, PP/rGO and PP/GNPs (0, 1.5 and 2.5 wt.%) nanocomposite films.
Figure 3.
DSC thermograms and XRD patterns of PP/GO, PP/rGO and PP/GNPs (0, 1.5 and 2.5 wt.%) nanocomposite films.
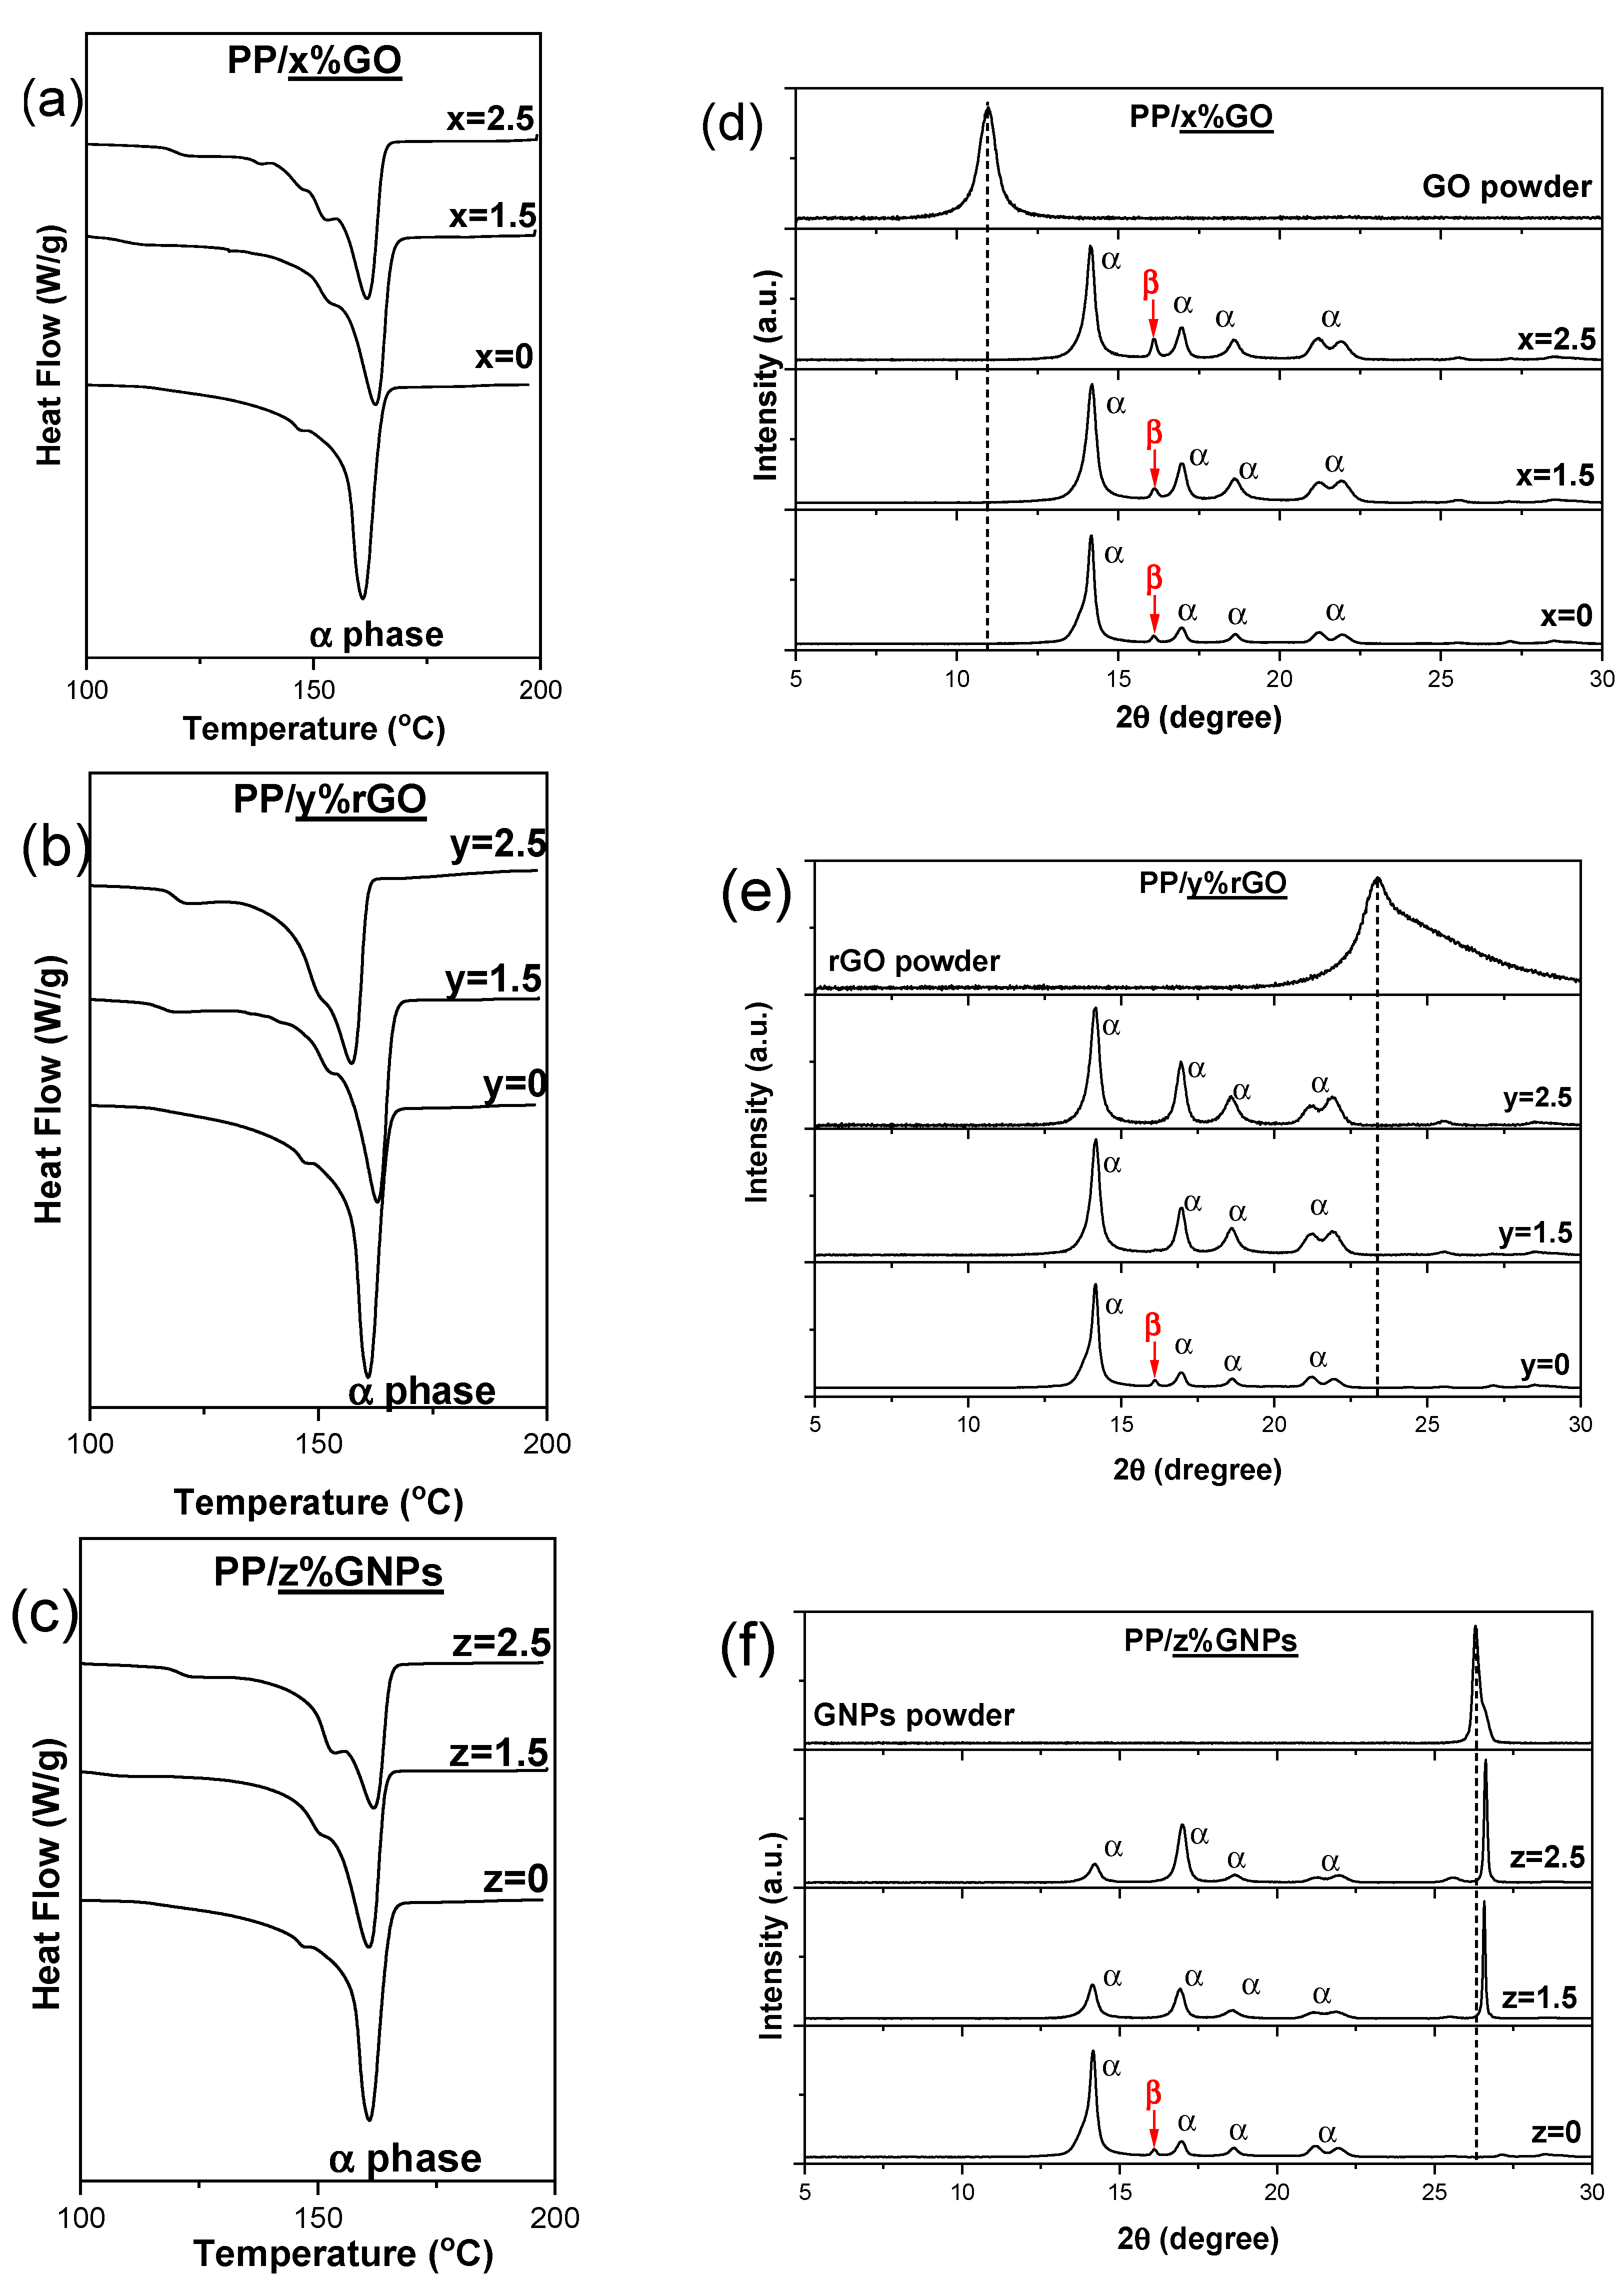
Figure 4.
XRD patterns corresponding to PP/6 wt.%GO, PP/6 wt.% rGO and PP/2.5 wt.% GNPs nanocomposite films. The XRD patterns of net GO, rGO and GNPs are depicted for comparison.
Figure 4.
XRD patterns corresponding to PP/6 wt.%GO, PP/6 wt.% rGO and PP/2.5 wt.% GNPs nanocomposite films. The XRD patterns of net GO, rGO and GNPs are depicted for comparison.
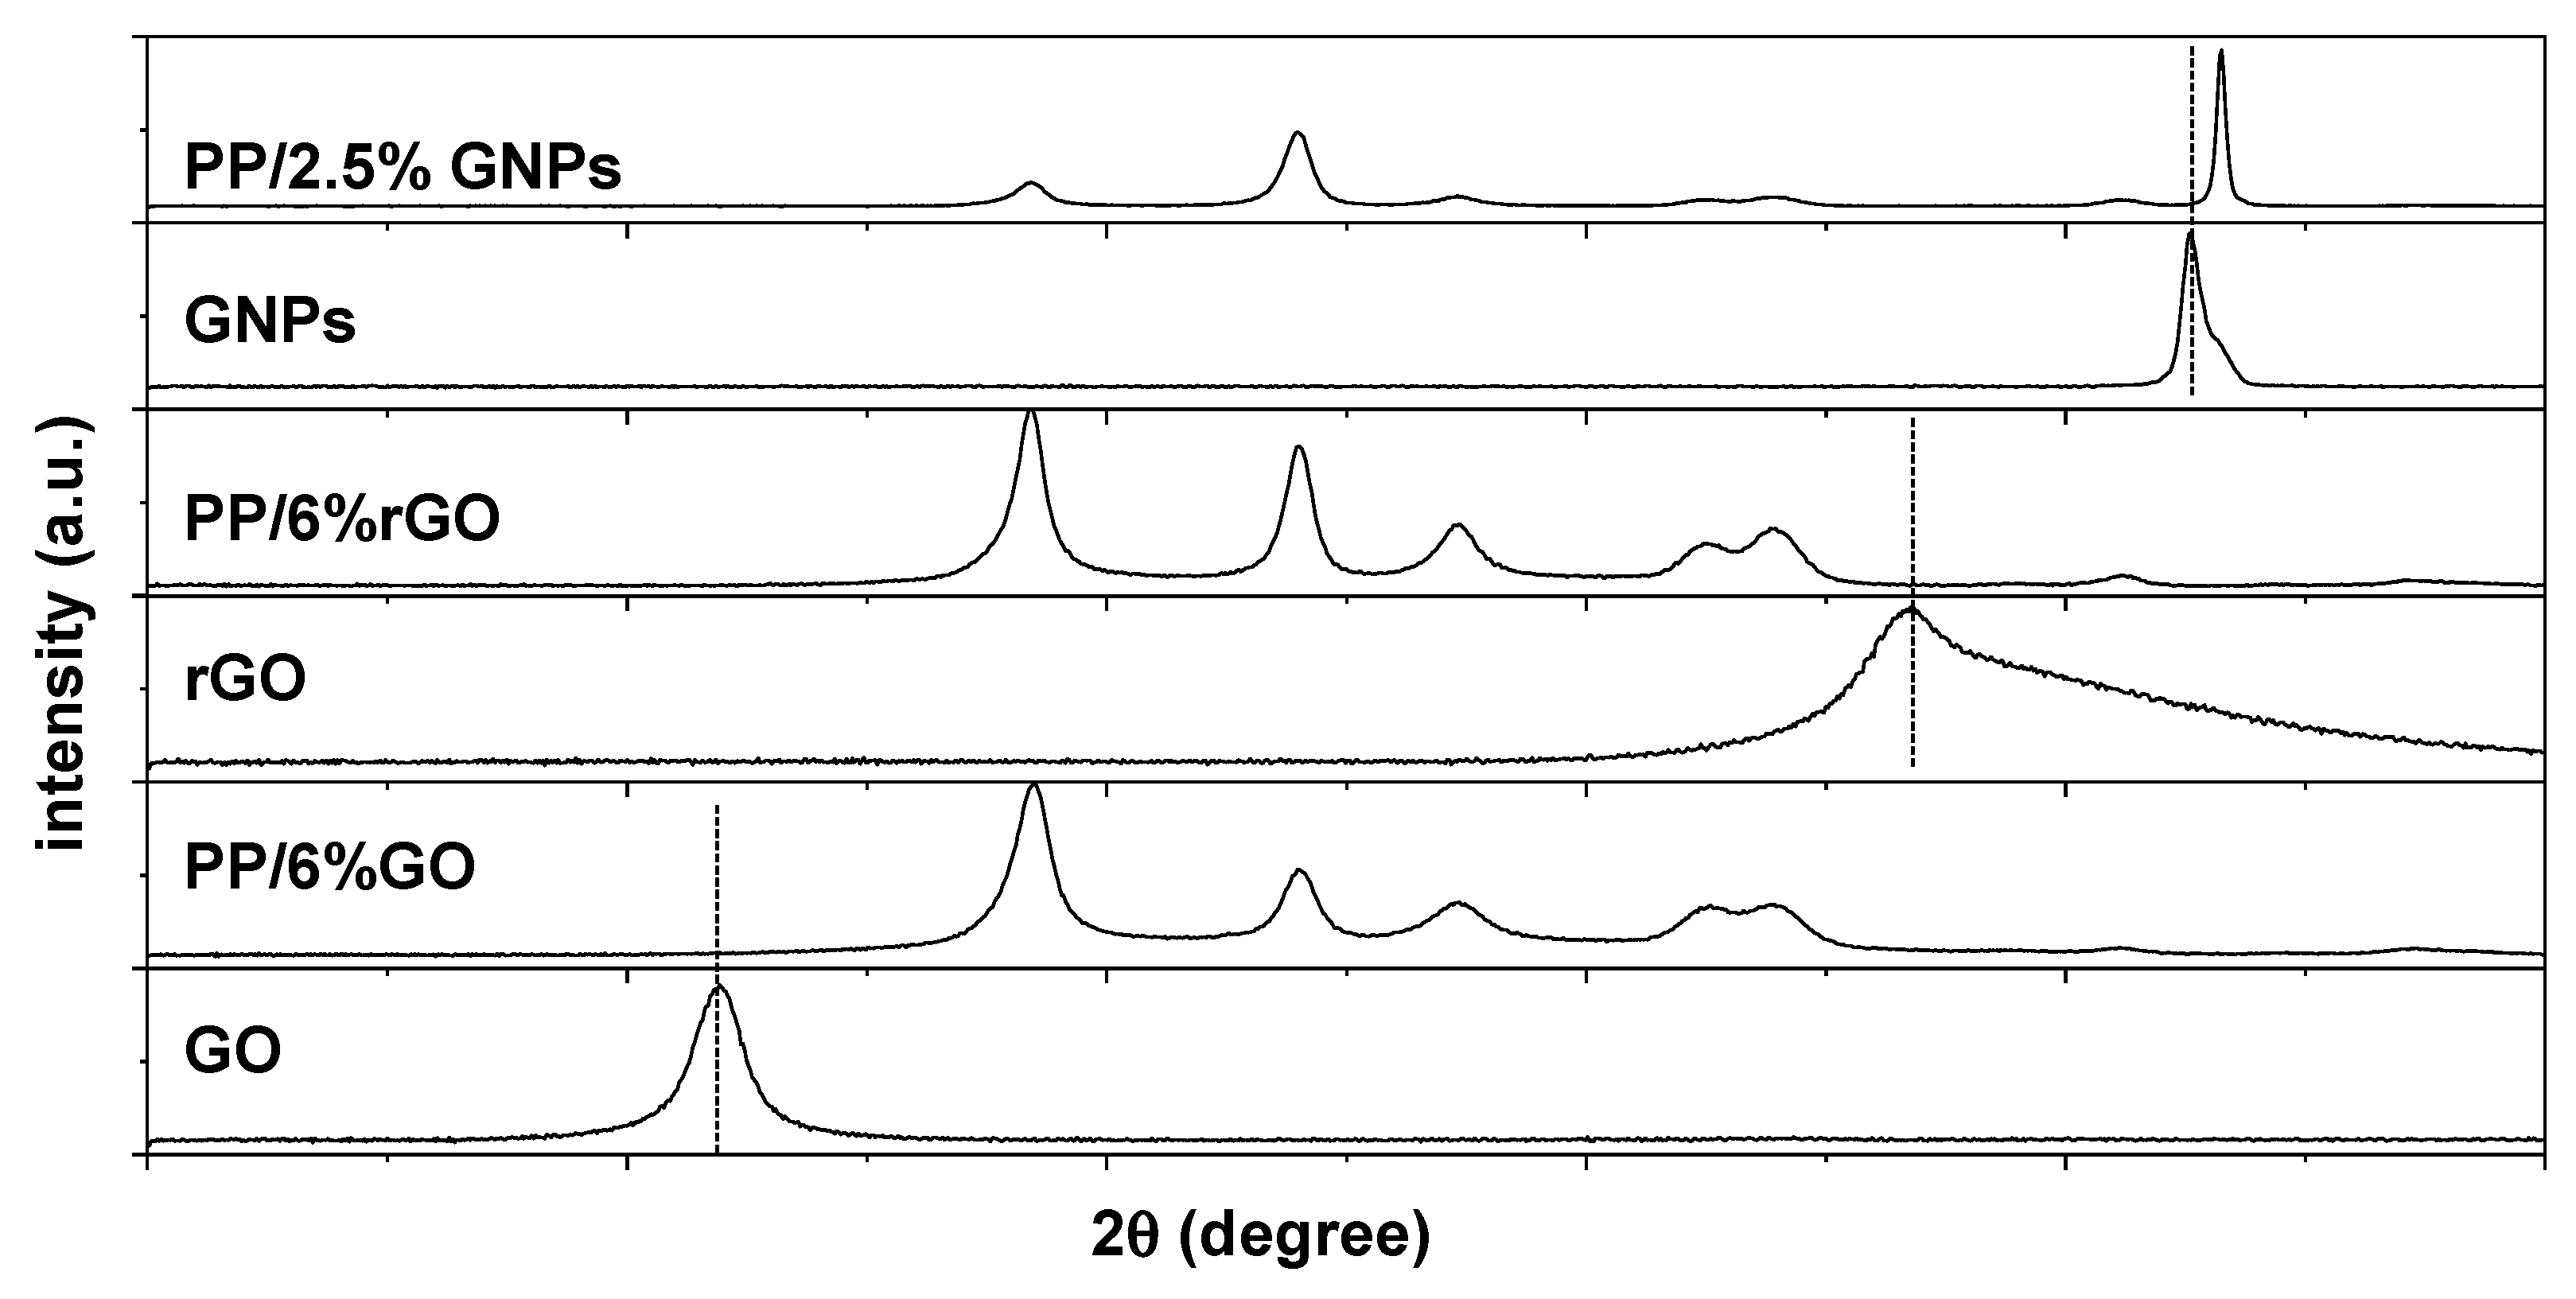
Figure 5.
Schematic representation of the different types of composites formed based on the nature of interactions of polymer with 2D carbon based nanomaterials.
Figure 5.
Schematic representation of the different types of composites formed based on the nature of interactions of polymer with 2D carbon based nanomaterials.
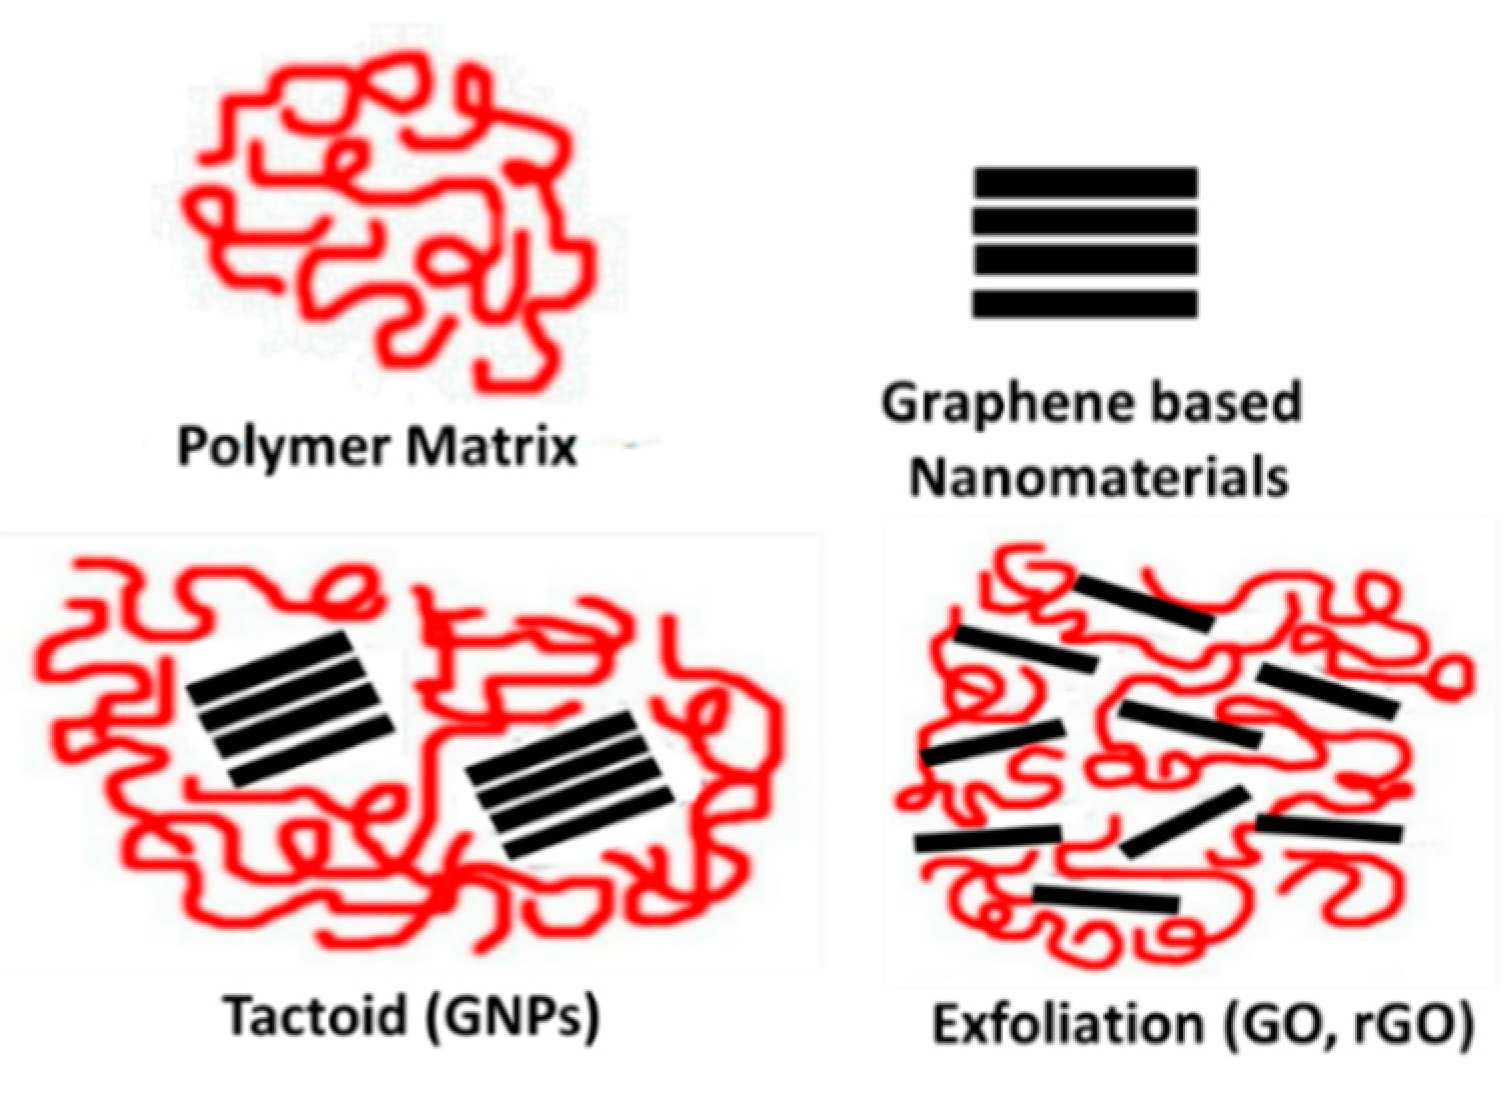
Figure 6.
Sp.WVTR values for PP/ x% 2D carbon-based nanomaterials composite films.
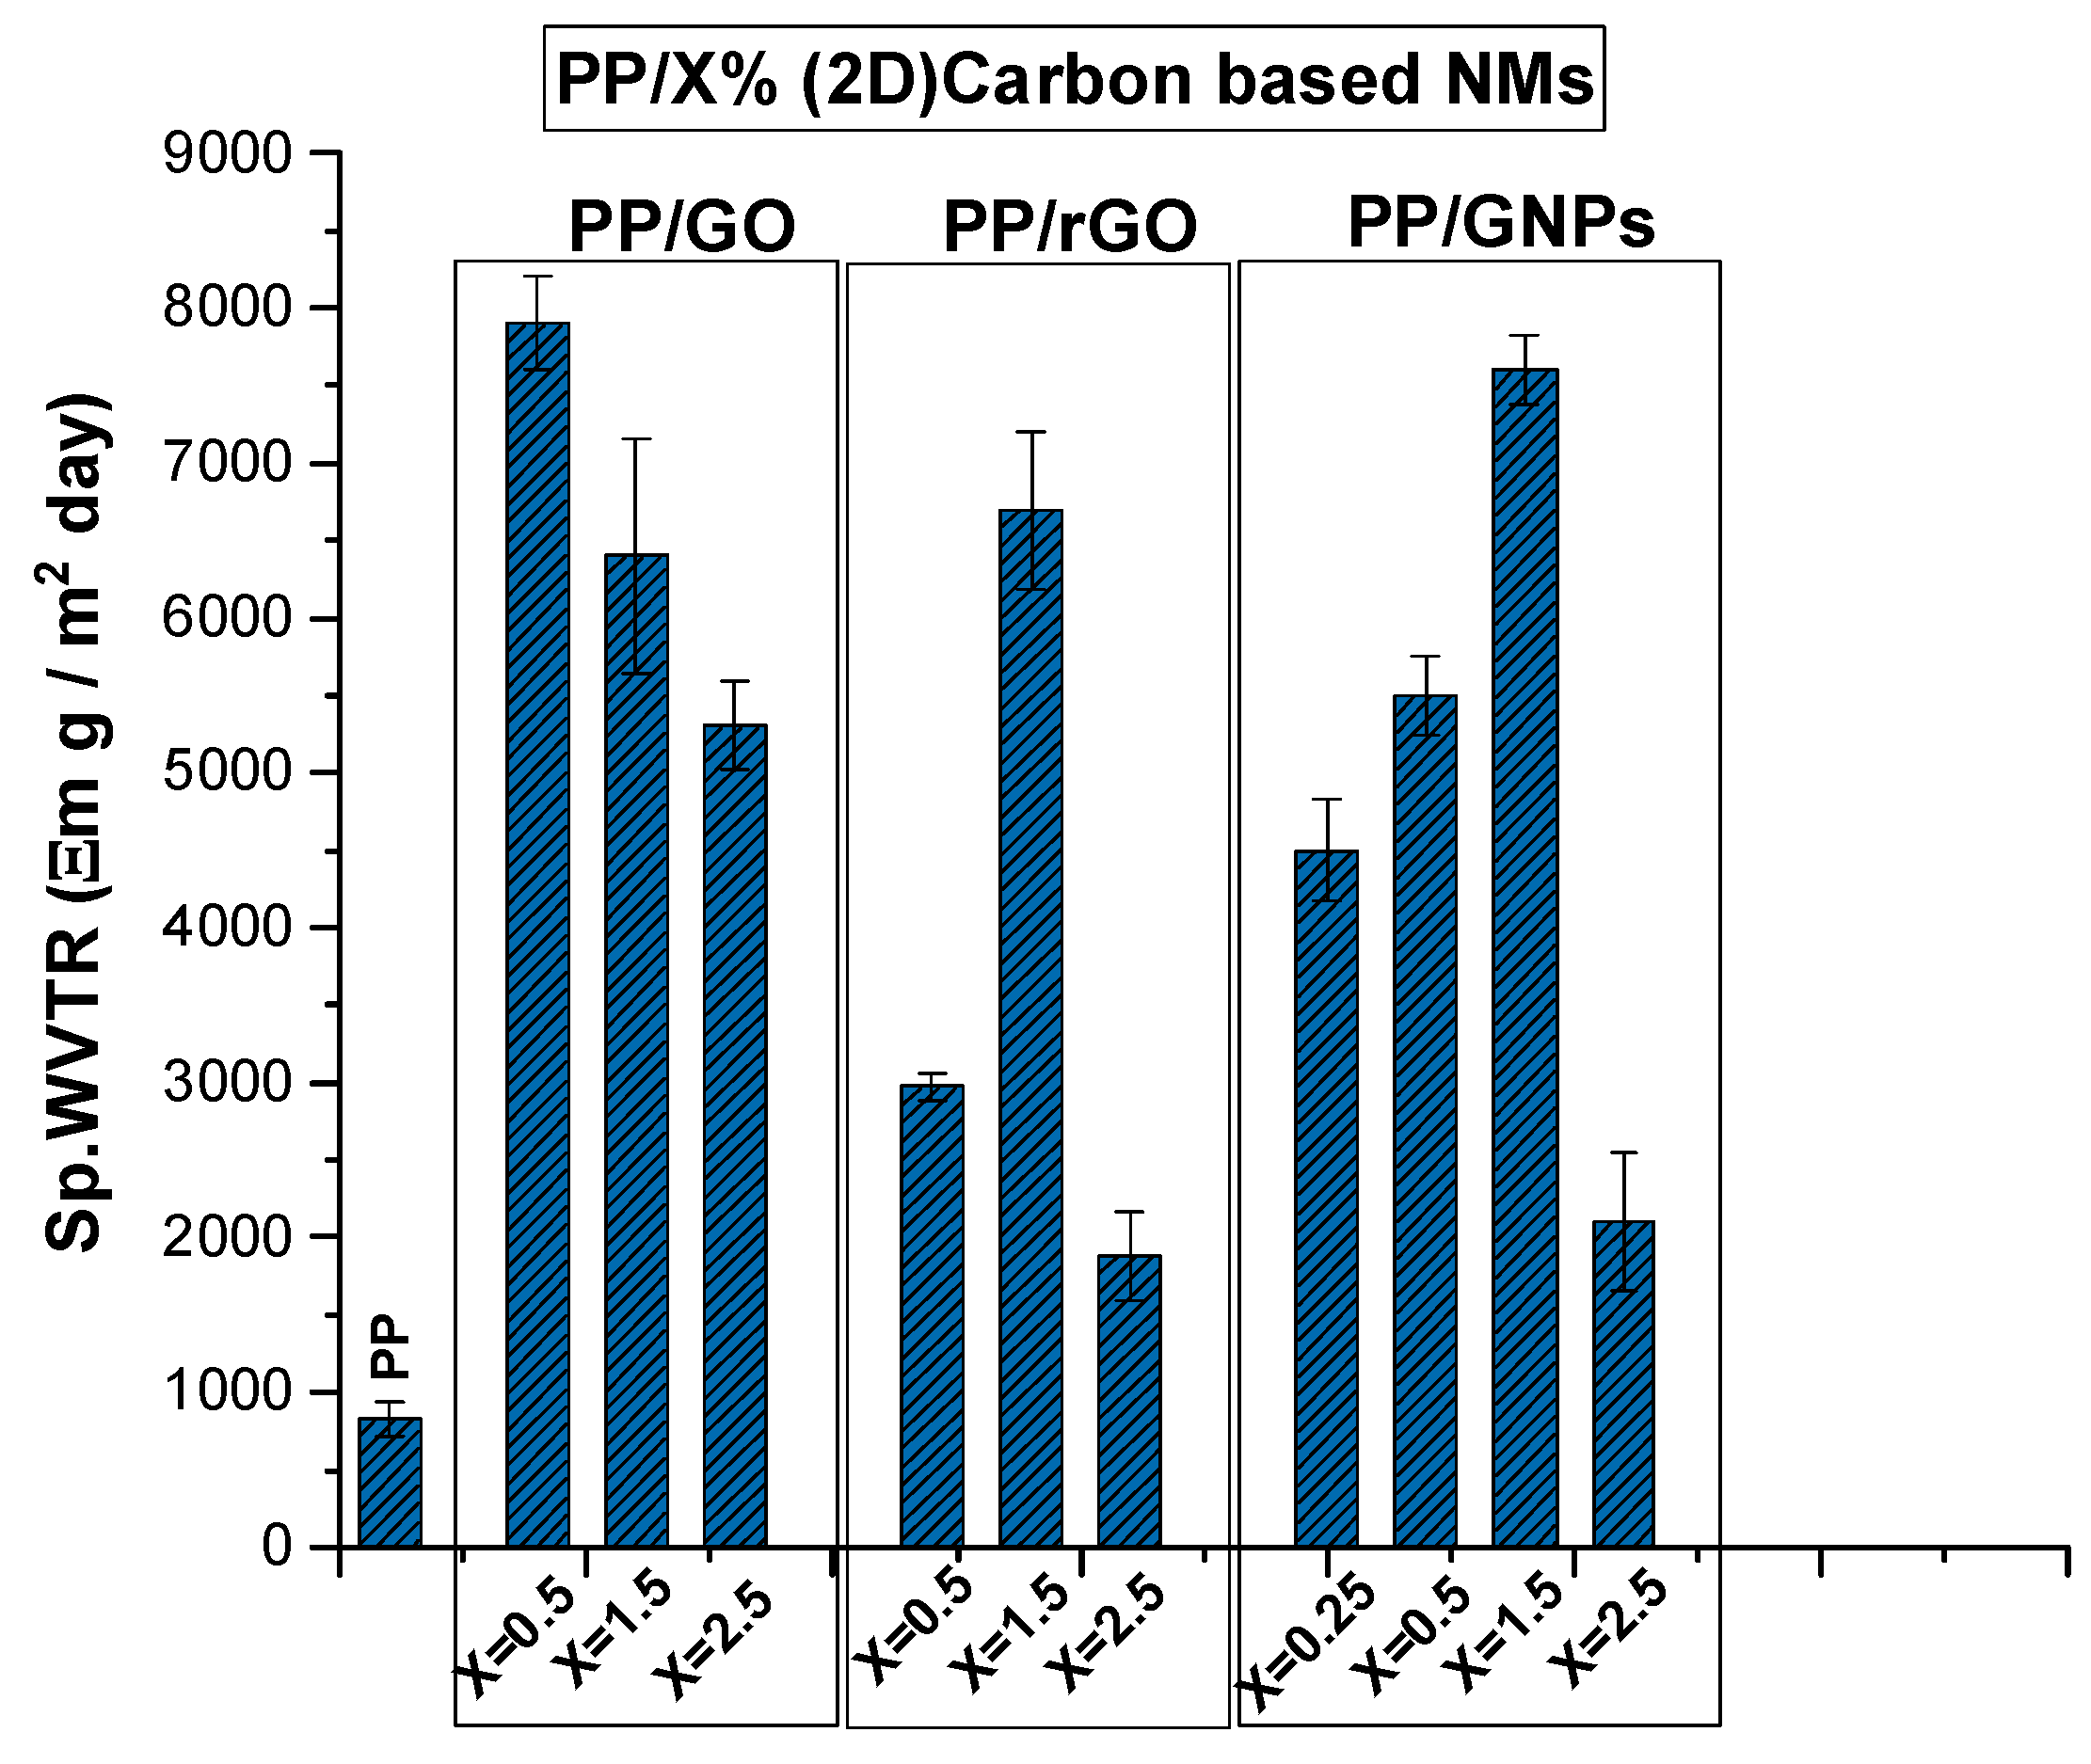
Figure 7.
(a) Schematic representation of graphene and the various oxygen containing groups, (b) sketch describing the hopping phenomenon of water vapor in the case of PP/GO and PP/rGO composites.
Figure 7.
(a) Schematic representation of graphene and the various oxygen containing groups, (b) sketch describing the hopping phenomenon of water vapor in the case of PP/GO and PP/rGO composites.
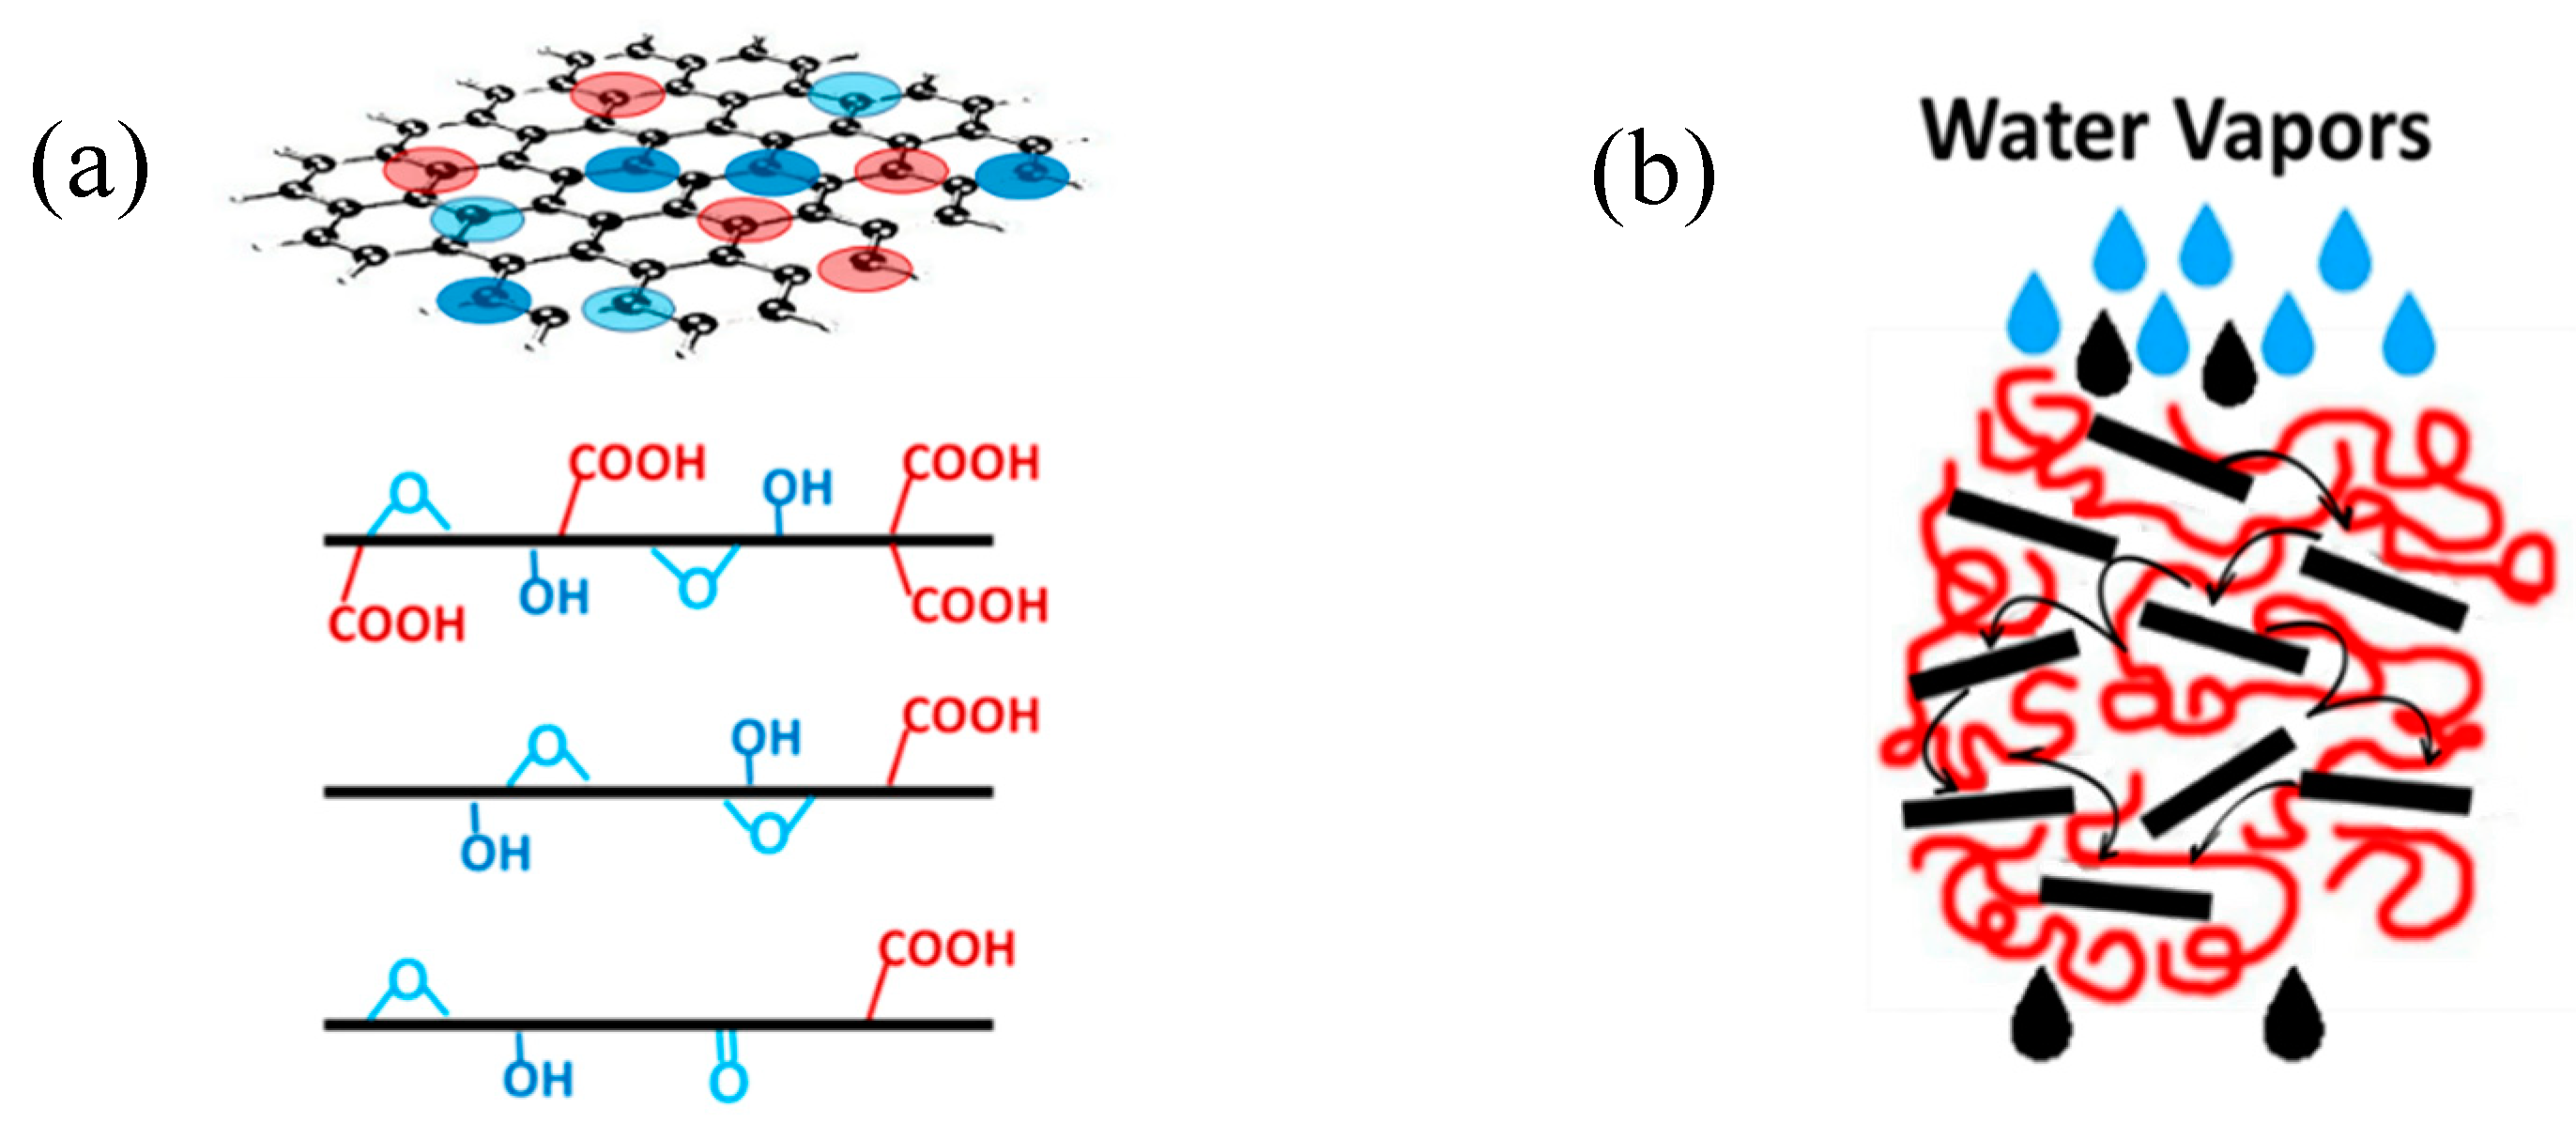
Figure 8.
SEM images of (a) PP/1.5 wt.% GO, (b) PP/1.5 wt.% rGO and (c) PP/1.5 wt.% GNPs nanocomposite films and the pore generation occurring at the interface of polymer matrix and 2D graphene nanostructures.
Figure 8.
SEM images of (a) PP/1.5 wt.% GO, (b) PP/1.5 wt.% rGO and (c) PP/1.5 wt.% GNPs nanocomposite films and the pore generation occurring at the interface of polymer matrix and 2D graphene nanostructures.
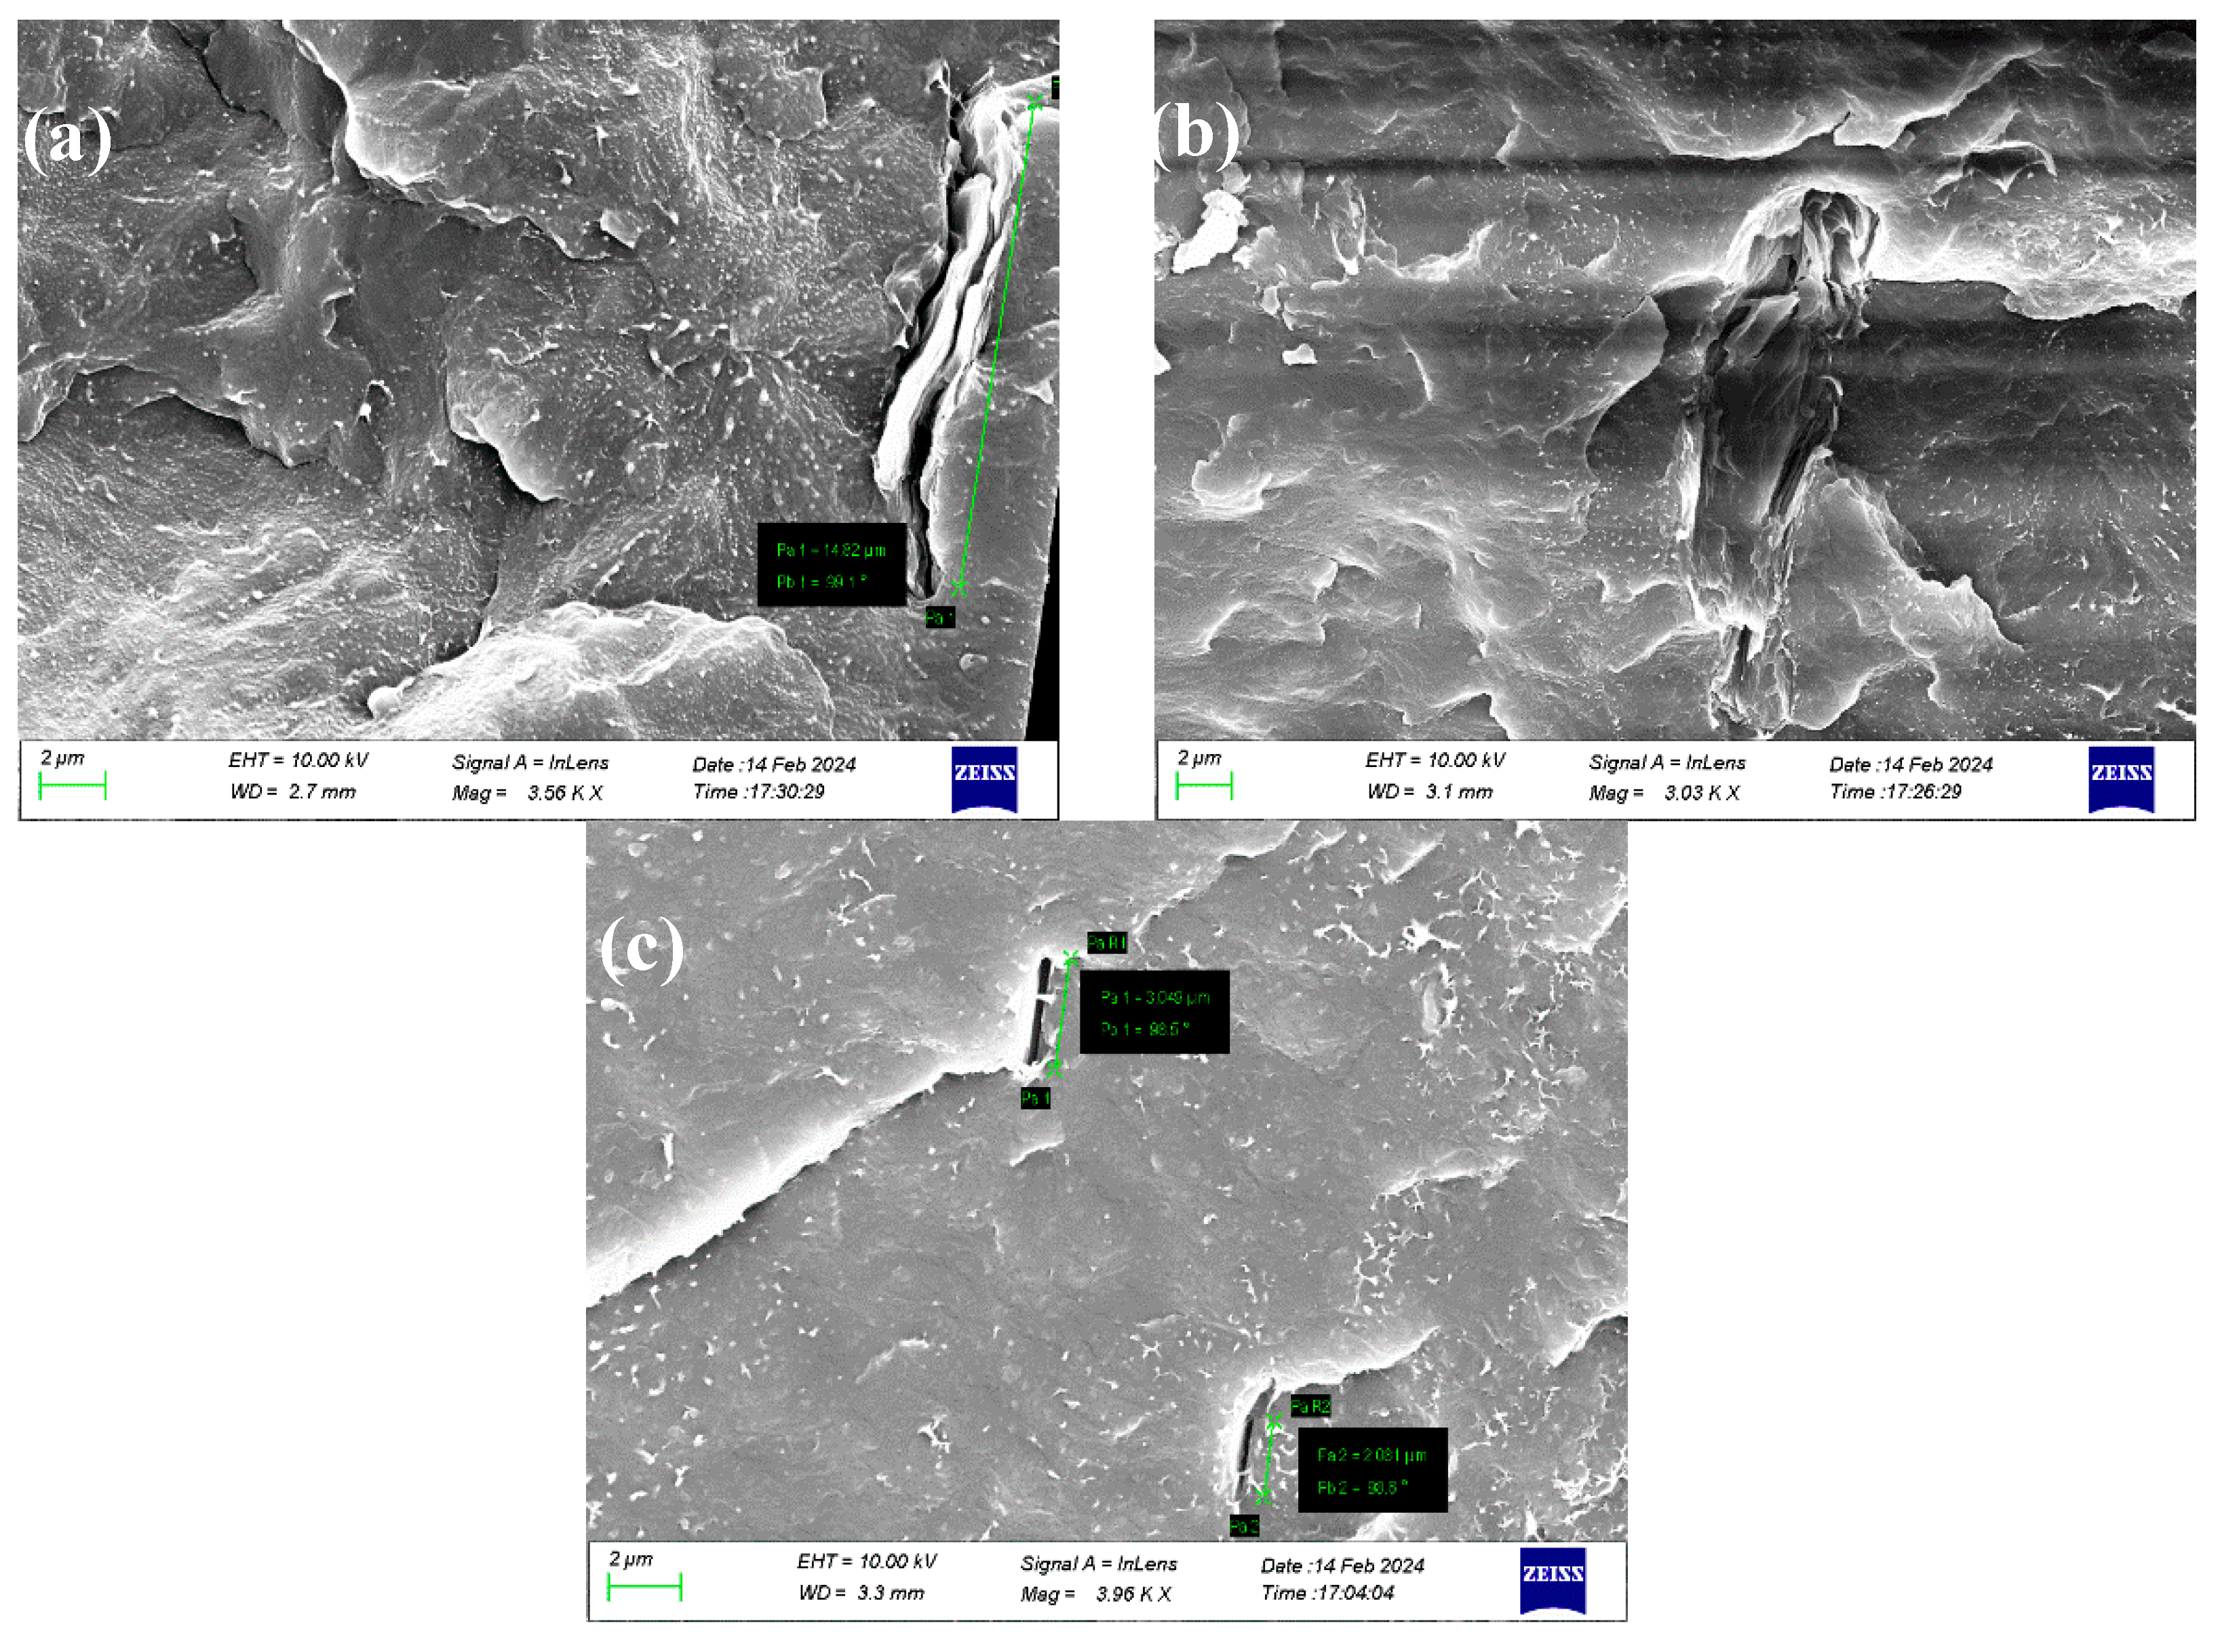

Table 1.
List of samples prepared with PP as polymer matrix.
| (2D) carbon-based nanomaterials loading | ||||
|---|---|---|---|---|
| GO (wt.%) | - | 0.5 | 1.5 | 2.5 |
| rGO (wt.%) | - | 0.5 | 1.5 | 2.5 |
| GNPs (wt.%) | 0.25 | 0.5 | 1.5 | 2.5 |
| Wavenumber (cm−1) | Functional groups assignment | |
|---|---|---|
| 3000-3500 (broad) | O-H | |
| 2773 | v(C-H)+v(O-H)hydrogen bond | |
| 1720 | C=O stretching | |
| 1600 | H2O (1616 cm-1) | |
| C=C (1580 cm-1) graphene layers | ||
| 1380 | COOH | |
| 1220 | C-O-C | |
| 1040 | C-O | |
| 970 | COOH |
Table 3.
Summary results from characterization techniques applied.
| Characterization Technique | GO | rGO | GNPs |
|---|---|---|---|
| SEM (lateral size, μm) |
15-50 | 15-50 | 5-10 |
| IR-ATR (oxidizing groups) |
-OH, -COOH, C=O, -C-O, C-O-C |
-C=O | - |
| XRD (d-spacing, ) |
10.8 | 3.8 | 3.4 |
| TGA (oxidizing groups) |
30% | 8% | - |
| XPS (% atomic concentration) |
C: 69.9 ± 0.5 O: 30.1 ± 0.5 |
C: 94.1 ± 0.5 O: 5.9 ± 0.5 |
C: 98.6 ± 0.1 O: 1.4± 0.1 |
Disclaimer/Publisher’s Note: The statements, opinions and data contained in all publications are solely those of the individual author(s) and contributor(s) and not of MDPI and/or the editor(s). MDPI and/or the editor(s) disclaim responsibility for any injury to people or property resulting from any ideas, methods, instructions or products referred to in the content. |
© 2024 by the authors. Licensee MDPI, Basel, Switzerland. This article is an open access article distributed under the terms and conditions of the Creative Commons Attribution (CC BY) license (http://creativecommons.org/licenses/by/4.0/).
Copyright: This open access article is published under a Creative Commons CC BY 4.0 license, which permit the free download, distribution, and reuse, provided that the author and preprint are cited in any reuse.


