
Submitted:
04 June 2025
Posted:
05 June 2025
You are already at the latest version
Abstract
Amidst significant digital and sustainability shifts in the global manufacturing industry, this research examines the relationship between Environmental, Social, and Governance (ESG) considerations and excess stock returns of manufacturing companies worldwide. A dual methodology integrating panel regression and machine learning techniques (Random Forest and XGBoost) is employed to assess overall ESG ratings, specific operational indicators, and ESG risk classifications. The panel regression analysis reveals no immediate, statistically significant linear relationship for most ESG measures; however, board size displays a positive correlation with returns. Notably, firms with high ESG risk exhibit a slight positive association with excess returns. In parallel, machine learning models achieve fair predictive accuracy, identifying market variables as key drivers while also ranking environmental scores and ESG risk categories among the leading predictors. These results suggest that, although direct linear effects are limited, ESG elements possess predictive capabilities, potentially through complex, non-linear interactions. The study offers nuanced perspectives for stakeholders navigating the evolving landscape of sustainable and technologically advanced manufacturing.
Keywords:
ESG performance
; stock excess returns
; global manufacturing
; panel regression
; machine learning
; industry 4.0
; sustainable manufacturing
; corporate governance
; predictive analytics
1. Introduction
The worldwide industrial and manufacturing domain is currently undergoing an era of significant transformation, characterized by growing demands for personalized products, rapid delivery, enhanced quality, operational resilience, and pervasive digital integration [1,2]. Within this dynamic global environment, Environmental, Social, and Governance (ESG) considerations have evolved from peripheral concerns to essential elements for long-term viability, competitive advantage, and societal acceptance [3,4]. This shift is not solely a reaction to regulatory mandates or investor preferences but is increasingly woven into the fundamental operational and strategic framework of manufacturing enterprises globally. The sector leads in innovation, experiencing swift technological and strategic changes that redefine production approaches and value chains. Prominent among these are Industry 4.0 principles, which include the integration of cyber-physical systems, the Internet of Things (IoT), Artificial Intelligence (AI), and Big Data analytics, alongside a strong move towards sustainable practices like the circular economy and supply chain decarbonization [5,6,7,8]. These innovations, as highlighted in recent analyses of manufacturing trajectories for 2025 and beyond, fundamentally alter operational dynamics and, consequently, have the potential to reshape firms' ESG profiles and their perceived financial implications [9,10,11].
A central discussion within academic and industry spheres revolves around the financial significance of ESG performance. The fundamental question persists: how, and through what mechanisms, does robust ESG performance translate into superior financial outcomes [12,13]? Theoretical arguments propose that strong ESG credentials can offer advantages such as reduced operational and regulatory risks, an improved corporate reputation, enhanced capacity for innovation, better employee morale and productivity, and improved access to capital [14,15]. However, empirical findings present a varied picture, with studies reporting positive, negative, neutral, or even non-linear associations between ESG metrics and corporate financial performance (CFP). These outcomes often depend on regional contexts, industry specifics, and methodological choices [16,17]. This study posits that the global industrial and manufacturing sector provides a particularly compelling and intricate context for examining the ESG-CFP relationship. Its substantial environmental footprint, diverse and globally distributed labor practices, complex international governance structures, and proactive adoption of transformative technologies create a unique blend of ESG challenges and opportunities [18,19,20].
Despite a growing body of research that uses established datasets like those from Bloomberg, Refinitiv, and Sustainalytics for ESG risk assessments, and Fama-French factors for market analysis, a notable research gap remains, which this study aims to address. A primary challenge in this area is ensuring originality when relying on widely explored datasets. This research argues that such originality can be achieved through a significantly innovative theoretical framing and interpretation of insights derived from these existing data sources. Specifically, a nuanced understanding of how various aspects of ESG—including aggregate scores, specific operational metrics, and external risk classifications—influence stock excess returns within the global manufacturing sector, particularly when placed in the context of its distinctive innovation trends (such as Industry 4.0 and sustainable manufacturing, as highlighted by recent works like Qureshi et al. [6] on logistics 4.0, Faheem and Butt [7] on IoT-enabled cyber-physical systems, and Ghaithan et al. [9] on integrated circular economy and Industry 4.0), remains underexplored. Many existing studies, while valuable, may not fully capture the synergistic or conflicting effects that emerge from the simultaneous pursuit of technological advancement and ESG improvement. This paper seeks to bridge this gap by offering an interpretive framework that links ESG performance not only to traditional financial models but, crucially, to the ongoing technological and sustainable transformations shaping the future of manufacturing. The distinctiveness of this study lies in its effort to interpret the ESG-CFP relationship through the lens of these profound sectoral shifts, thereby aiming to provide insights that move beyond the mere replication of existing knowledge and to generate new, significant information.
Therefore, this research is guided by the following primary questions:
- RQ1: How do overall ESG scores (Environmental, Social, Governance) and specific operational ESG metrics (e.g., CO2 emissions, energy use, board size, injury rate) influence firms' stock excess returns within the global industrial and manufacturing sector?
- RQ2: Do firms categorized by distinct ESG risk levels (High, Medium, compared to Low) exhibit significantly different stock excess returns within the global industrial and manufacturing sector?
- RQ3: Using machine learning approaches (Random Forest and XGBoost), what are the most influential ESG characteristics and market factors in predicting firms' stock excess returns within the global industrial and manufacturing sector?
The importance of this research is underscored by its potential to provide robust empirical evidence vital for global investors navigating complex ESG landscapes, multinational corporate managers formulating strategies at the intersection of innovation and sustainability [21], and policymakers striving to foster responsible industrial development. It aims to contribute both theoretically, by refining understanding of how ESG value is created and recognized in a technologically dynamic sector, and practically, by offering actionable insights for various stakeholders. This study seeks to advance current knowledge by providing a theoretically grounded interpretation of ESG's financial implications, thereby contributing to the development of solutions for challenges faced by organizations and contemporary society, and promoting a stronger connection between theory and practice.
This paper is organized as follows: Section 2 presents the theoretical framework and a literature review focusing on transformative trends in global manufacturing and recent ESG research. Section 3 details the methodology, including data sources, sample selection of global manufacturing firms, variable definitions, and the econometric models used, justifying the choice of panel regression and explaining variable selection. Section 4 presents the empirical results from the panel regression analyses. Section 5 discusses these findings, interpreting them within the context of the research questions, established theories, and current industry dynamics, and explicitly addresses the study's originality and contribution. Section 6 concludes, summarizing key insights, acknowledging limitations, and suggesting avenues for future research on the ESG-CFP nexus in global manufacturing. Section 7 provides the references.
2. Theoretical Framework and Literature Review
This section establishes the theoretical underpinnings of the relationship between Environmental, Social, and Governance (ESG) factors and corporate financial performance (CFP). It also synthesizes existing literature relevant to this research, with a particular emphasis on incorporating recent analyses of transformative trends shaping the global manufacturing sector. This integration is crucial to the study's novel interpretative framework, aiming to provide fresh insights from well-established datasets by contextualizing ESG's financial impact within ongoing sectoral innovations.
2.1. Theoretical Frameworks for ESG and Corporate Financial Performance (CFP)
Several interconnected theories underpin the ESG-CFP relationship. Stakeholder theory [14,15] posits that corporate success depends on creating value for all stakeholders, not just shareholders. For global manufacturers, this means effectively managing diverse stakeholder expectations regarding ESG performance, ethical labor practices across global supply chains [22], transparent governance in varied regulatory environments [23], and environmental responsibility [19] can yield financial benefits. These may include reduced risks, enhanced reputation, increased investor confidence leading to lower capital costs, improved employee morale and retention, and stronger customer loyalty, potentially boosting stock returns [24]. Proactive ESG management is thus a strategic imperative, not an optional expense [25].
Innovation diffusion theory [26] helps explain how ESG initiatives drive CFP in manufacturing. Investments in sustainable technologies and practices, Industry 4.0 principles [5,7], circular economy models [9], and advanced automation (discussed further in Section 2.2) represent innovations [10,11,27]. These often directly improve ESG performance: resource efficiency (Environmental) [9,28], worker safety (Social) [29,30], and supply chain transparency (Governance) [31]. Firms effectively adopting these innovations gain competitive advantages, leading to improved financial outcomes through cost reductions, new markets, brand differentiation, and first-mover advantages in a sustainability-focused market [32]. This study examines whether the market recognizes such ESG-driven innovation.
The theory of change framework [33] clarifies the causal links between corporate actions and long-term outcomes. It helps conceptualize how ESG improvements, investments in renewable energy [1], supply chain decarbonization [20], improved ESG risk oversight, or smart manufacturing for waste reduction [34] lead to intermediate benefits. These include enhanced corporate image, lower cost of capital, operational efficiencies, greater innovation, and improved employee engagement. These, in turn, are hypothesized to result in superior CFP, reflected in higher stock returns. This framework facilitates a detailed analysis of how specific ESG initiatives, particularly those linked to technological innovation in manufacturing, influence financial performance.
Finally, asset pricing theory, including Fama-French multi-factor models [36,37], provides a benchmark for evaluating ESG's unique impact. These models explain stock return variations based on systematic risk factors (market risk, firm size, book-to-market equity, profitability, and investment). A key objective is to determine whether ESG adds explanatory power beyond these established factors. A significant ESG-return relationship, after controlling for these factors, could indicate ESG as an independent risk factor, market inefficiencies, or a correlation with other factors driving returns [38]. This study uses the Global Fama-French five-factor model to isolate ESG's contribution to the financial performance of global manufacturing firms.
2.2. Literature Review
The subsequent literature review is structured to first provide an overview of existing ESG-CFP research, then deeply integrate the "Current Trends and Innovations in the Global Manufacturing and Industrials Sector (2025)" as a novel contextual lens, and finally identify the specific research gaps this study addresses. This approach is designed to highlight the originality of the current work by demonstrating how it builds upon, yet distinctively extends, prior research by explicitly linking ESG's financial impact to the transformative dynamics of the modern manufacturing industry.
2.2.1. Overview of ESG and Financial Performance (EFP) Research in Global Context
Academic inquiry into the connection between Environmental, Social, and Governance (ESG) performance and corporate financial performance (CFP) has significantly expanded over the past two decades, generating a vast and diverse body of literature [12,16,39]. Numerous meta-analyses and systematic reviews have attempted to synthesize these findings, often concluding that a positive or, at minimum, neutral relationship generally exists between robust ESG practices and various measures of CFP, such as accounting-based profits or market-based returns [13,17,40]. The theoretical mechanisms supporting a positive link frequently involve concepts such as enhanced operational efficiency through resource optimization [35], improved risk management (e.g., reduced litigation or regulatory penalties), stronger brand reputation and customer loyalty, better employee attraction and retention [41], and more favorable access to capital from ESG-conscious investors [24]. However, the empirical evidence is not uniform. Some studies have reported insignificant or even negative associations, particularly in short-term analyses or when considering the substantial initial costs that can be associated with comprehensive ESG investments before longer-term benefits are realized [42]. Furthermore, the possibility of non-linear relationships (e.g., U-shaped or inverted U-shaped) has been suggested, implying that the financial returns to ESG might vary depending on the level of ESG commitment or other firm-specific contingencies [43].
A significant aspect of EFP research involves exploring global variations. The nature and strength of the ESG-CFP link can be influenced by diverse institutional contexts, including national regulatory frameworks, cultural attitudes towards corporate responsibility, the sophistication of financial markets, and prevailing investor preferences [44,45,46]. For instance, firms operating in jurisdictions with stringent environmental laws or strong social safety nets may find that proactive ESG management aligns more directly with financial outperformance due to clearer regulatory incentives or stronger stakeholder pressures. Methodological rigor remains a persistent challenge in EFP research globally. Issues of endogeneity are paramount, given the potential for reverse causality (e.g., more profitable firms may afford greater ESG investment) or the influence of unobserved confounding variables that affect both ESG adoption and financial success [17]. The measurement of ESG itself is complex, with variations in scoring methodologies across different data providers (e.g., Bloomberg, Refinitiv, MSCI, Sustainalytics) leading to rating divergence and impacting research outcomes [47,48]. The quality and consistency of ESG disclosures also vary significantly across countries, despite ongoing efforts towards global standardization through frameworks like GRI or SASB [49]. Addressing these challenges necessitates the use of sophisticated econometric techniques, careful selection of control variables, and robust research designs, such as the panel data approach adopted in this study, which can help mitigate biases from unobserved firm heterogeneity. Many recent studies aim to tackle these issues using advanced panel data methods and by exploring moderating and mediating variables [40,50].
2.2.2. Current Trends and Innovations in the Global Manufacturing and Industrials Sector (2025) and Their ESG/Financial Implications
The global manufacturing and industrial sphere is currently experiencing significant transformations that reshape operational methods and deeply affect Environmental, Social, and Governance (ESG) considerations. Grasping these dominant trends is vital, as they introduce new challenges and avenues for ESG integration, directly influencing the potential financial relevance of these efforts. The discussion below amalgamates these key industrial shifts, outlining their connections to ESG performance and anticipated financial outcomes, thereby setting a distinct contextual foundation for this study’s analysis.
A primary impetus for transformation is the intensified strategic focus on Sustainable Manufacturing. This broad initiative incorporates several critical facets. The Circular Economy model, which prioritizes material reuse, waste minimization, and designs facilitating easier recycling, directly improves environmental (E) performance by curbing resource depletion and waste [9,19,23,51]. Financially, adopting circularity can yield notable cost savings from reduced material and disposal expenditures, unlock new revenue from repurposed goods, and enhance brand appeal, potentially improving returns [28,52]. Concurrently, Energy Efficiency measures, driven by investments in renewables, advanced machinery, and green certifications, are fundamental [10,34,35,53]. These actions lower operational costs (E), mitigate carbon-related risks, and attract ESG-conscious investors, potentially leading to better valuations and capital access [54]. Furthermore, Supply Chain Decarbonization is a significant effort, compelling manufacturers to manage emissions across their global value chains (Scope 3), beyond their direct operations (Scopes 1 and 2) [1,20]. Success in this area strengthens environmental stewardship (E), lessens regulatory and reputational risks, and can enhance supply chain resilience, thereby positively influencing financial standing [18], as highlighted by studies like Wang et al. [1] on green technology innovation.
Simultaneously, Smart Manufacturing & Digitalization, often termed Industry 4.0, is radically altering production, with extensive ESG and financial consequences [5,21,55]. The fusion of Cyber-Physical Systems (CPS), the Internet of Things (IoT), Artificial Intelligence (AI), and Big Data analytics cultivates highly automated, intelligent, and interconnected manufacturing environments [7,31,56]. This digital shift facilitates precise real-time environmental oversight (improving E performance) [34], boosts worker safety (S) through automation [29], and reinforces governance (G) via data-driven transparency and agile decision-making, leading to operational optimization and potential financial gains [31,57]. Smart Sensors are crucial, enabling continuous data collection for process control, predictive maintenance, and quality assurance, which improves efficiency, cuts waste (E), enhances safety (S), and reduces costly downtimes [58,59]. Digital Twins, virtual counterparts of assets or processes, are increasingly used for simulation and optimization [5,60,61]. For ESG, digital twins permit virtual testing of sustainable designs (E) [62], energy use optimization (E) [63], and proactive safety risk modeling (S) [5], thus reducing waste and improving safety [64]. Cloud-Based Platforms (ERP, MES) support remote global operations management and secure data storage, enhancing data transparency for ESG reporting (G) and enabling remote environmental and social monitoring (E, S) [7,65,66].
The evolution of Robotics and Automation profoundly influences productivity and ESG. Collaborative Robots (Cobots), engineered for safe human-robot interaction, augment human skills [29,30,67,68]. By undertaking ergonomically difficult or hazardous tasks, cobots directly enhance worker safety and well-being (S benefits) [69], potentially leading to fewer injuries, better job satisfaction, higher productivity, and labor cost efficiencies [70,71]. More advanced Autonomous Systems increase operational flexibility and reduce direct human intervention, leading to greater efficiency and optimized resource use (E and S benefits) [55]. Hyperautomation, a strategic combination of AI and RPA, aims for end-to-end process optimization [57,72], driving efficiency improvements across environmental, social, and governance dimensions.
Predictive Maintenance (PdM) strategies, driven by AI and IoT, offer strong ESG and operational cost benefits [58,59,73,74]. AI algorithms analyze sensor data to foresee equipment failures, minimizing downtime and extending machinery life (an E benefit by reducing premature replacement) [75]. PdM also reduces energy waste and material loss (E benefits), contributing to profitability. Data-Driven Maintenance Scheduling, based on actual equipment conditions, further optimizes resource use.
Expanding on Smart Manufacturing & IoT Integration, the deployment of Connected Devices in machinery, tools, and worker wearables fosters hyper-connected manufacturing environments [31,56,66]. This allows granular data collection for optimizing resource use (E) [7], improving worker safety (S) [69], and enhancing supply chain transparency (G) [76]. Edge Computing, processing data locally, facilitates faster real-time decision-making, reduces network latency, and can improve data security [66,77,78]. From an ESG viewpoint, edge computing enables immediate adjustments for energy optimization (E) or safety responses (S) and can lower overall energy demand from data processing [79].
Advanced Analytics and Artificial Intelligence are pivotal for deriving insights from smart manufacturing data [55,62,80]. AI-Powered Analytics are used for demand forecasting (reducing waste, E), process optimization (improving resource efficiency, E) [71], automated quality control (minimizing rework, E) [78], and generative design for sustainable products [81]. Simulation & Scenario Planning, using AI and Digital Twins, allow manufacturers to explore operational strategies and validate designs virtually [5,60], enabling rigorous assessment of sustainability initiatives (E), process improvements (E, S) [64], and governance frameworks (G) [63] with reduced real-world costs.
The trend towards Decentralized Manufacturing is growing, driven by desires for supply chain resilience and customization [18,82]. Distributed Production via smaller, tech-advanced facilities closer to end-users can reduce transportation emissions (E), create local jobs (S), and enhance supply chain resilience (G), positively influencing financial outcomes [83]. 3D Printing/Additive Manufacturing is a key enabler, reducing material waste (E), facilitating local production (E, S), and enabling optimized lightweight designs [11,55,84].
An increased emphasis on workforce empowerment and human-machine collaboration is critical in today's manufacturing sector, with a direct impact on the Social (S) ESG pillar [29,30,58,67]. Augmented Reality (AR) and Virtual Reality (VR) technologies are redefining employee training by providing immersive and safe settings for mastering challenging tasks [68,70,85]. This improves worker skills (S), increases safety (S), and can boost productivity while lowering turnover [71]. Human-Robot Collaboration (HRC), particularly with cobots, generates synergies by having robots do difficult or hazardous jobs, allowing people to focus on higher-value cognitive activities [59,70,86]. This paradigm enhances worker safety and well-being (S), boosts productivity, and cultivates a more trained workforce [70].
Finally, the comprehensive trend of Software-Driven Manufacturing underscores the increasing reliance on sophisticated, integrated software systems [79,80]. Robust digital cores and data foundations are vital for high-ROI applications of AI, XR, and 5G [81]. This software integration underpins most contemporary manufacturing trends, enabling data-driven ESG optimization across all dimensions and maximizing financial returns from technology investments.
In summary, the global manufacturing sector around 2025 is shaped by a complex interplay of sustainability goals, digitalization, intelligent automation, predictive analytics, distributed production, and an empowered, technologically skilled workforce. Firms strategically adopting these trends are not only enhancing operational efficiency and innovation but also fundamentally reshaping their ESG characteristics. These changes are likely to significantly influence their long-term competitiveness and, as this study investigates, their financial performance. This research seeks to contribute by analyzing the ESG-CFP linkage within this dynamic, technologically advanced, and sustainability-focused sectoral environment, aiming for insights grounded in these tangible innovations.
2.2.3. ESG, Financial Performance, and Risk Ratings in the Global Manufacturing Context
The existing literature examining the link between Environmental, Social, and Governance (ESG) factors and corporate financial performance (CFP) within the global manufacturing sector, though growing, presents a complex tapestry of findings, especially when considering the sector's ongoing transformations [17,39,44]. Some research focusing on manufacturing firms has indicated positive relationships between specific environmental practices, such as pollution control and energy efficiency investments (aligning with sustainable manufacturing trends), and financial metrics like Return on Assets (ROA) or Tobin's Q, particularly over longer periods [34,54]. Similarly, social initiatives, including investments in employee safety and training (consistent with workforce empowerment trends), have been correlated with improved productivity and fewer operational disruptions in manufacturing settings [29,59]. Strong corporate governance, especially regarding transparency and board oversight, is generally viewed as vital for mitigating risks and enhancing value in capital-intensive industries like manufacturing [80,81].
However, the path to superior ESG performance often involves significant capital outlays for advanced green technologies or comprehensive digital transformations, as previously detailed. These investments can exert short-term pressure on profitability, potentially obscuring or delaying the financial benefits of improved ESG metrics [42,55]. The globalized nature of manufacturing supply chains further complicates ESG management and measurement, as companies must navigate diverse international regulatory standards, cultural norms, and varying data availability [18,37]. For example, Ye et al. [46] found that sustainable practices positively influenced performance indicators for EU firms, with higher ESG disclosure linked to better stock returns, highlighting regional effects. Conversely, Nazir et al. [50] reported a negative overall ESG link to financial sustainability in the global high-tech sector, though governance showed a positive effect, underscoring pillar-specific impacts. The role of digitalization in the ESG-performance relationship, explored by Eriandani and Winarno [82], remains an area with inconclusive direct findings. Additionally, the impact of technologies like industrial robots on green transformation presents a nuanced picture, with studies like Sun et al. [83] suggesting benefits alongside sector-specific sensitivities.
ESG risk ratings from agencies such as Sustainalytics, MSCI, and Refinitiv are increasingly influential for investors in global manufacturing [3,4,47]. These ratings aim to quantify a firm's exposure to and management of material ESG risks. However, research, like Onomakpo's [2] study on electric vehicle manufacturers, reveals that the link between these ratings and stock performance can be context-specific, with different ESG pillars affecting outcomes variously across firms with different risk profiles. This indicates that broad risk categories may not uniformly predict financial results without considering specific corporate strategies and sectoral nuances. The well-known issue of discrepancies among ESG rating agencies also persists, complicating reliance on a single source without critical assessment [48]. Current research also examines ESG disclosure antecedents and outcomes, with Khamisu and Paluri [49] highlighting mandatory regulations and governance as drivers, and firm performance and market returns as outcomes. Other studies, such as Habib [84], explore interactions between corporate practices like earnings management and ESG performance. Broader ESG investment trends, including in novel asset classes, as discussed by Juškaitė and Tamošiūnienė [89], also provide relevant market context.
3. Methodology
This section thoroughly details the research design, encompassing the comprehensive data sources and collection procedures, precise variable definitions, and the specific econometric and machine learning models employed. The overarching goal is to meticulously investigate the intricate relationship between Environmental, Social, and Governance (ESG) factors and the excess stock returns of global manufacturing firms. The methodological framework is rigorously structured to address the hypothesized relationships while systematically mitigating potential econometric challenges, such as unobserved heterogeneity, endogeneity, and multicollinearity. Throughout this section, particular attention is paid to providing robust justifications for the selection of methods and variables, thereby ensuring the credibility, transparency, and replicability of the reported findings, consistent with best practices in empirical financial research.
3.1. Research Design
This study adopts a quantitative, empirical research design, utilizing panel data analysis. Panel data, which combines cross-sectional observations of multiple firms over several periods (annually in this study), is particularly well-suited for examining the relationship between firm-level ESG characteristics and financial performance [85]. This approach offers significant advantages over purely cross-sectional or time-series designs. First, it allows for the control of unobserved firm-specific heterogeneity, those time-invariant characteristics unique to each firm, such as ingrained corporate culture, persistent managerial talent, or unique technological capabilities, which might simultaneously influence both its ESG orientation and its financial outcomes. Second, panel methods can account for time-specific effects, macroeconomic trends, market-wide sentiment shifts, or global shocks that impact all firms within a given period. Controlling for these unobserved effects is crucial for obtaining less biased and more reliable estimates of the true impact of ESG factors, a consideration of particular importance in a global sample where firms operate under diverse institutional, economic, and regulatory environments [44]. The selection of panel regression is thus theoretically and methodologically justified for its capacity to handle complex data structures and mitigate common sources of endogeneity in observational studies.
3.2. Data Sources and Collection
A comprehensive longitudinal dataset was meticulously constructed by integrating information from several globally recognized, reputable, and widely used data sources. This integrated dataset covers a substantial panel of global manufacturing firms for a specified observation period, predominantly from 2012 onwards. The choice of starting year (2012) was deliberately made due to the significantly enhanced availability, improved quality, and increased standardization of ESG data globally from this point in time.
The dependent variable in this study is Excess_Return_it, representing the excess stock return for firm i in year t. This metric was carefully calculated to measure financial performance beyond what would be expected given the prevailing risk-free rate, thereby reflecting the abnormal return attributable to firm-specific characteristics. Historical daily or monthly stock price data for a global sample of manufacturing companies were primarily obtained using the Python yfinance library, which provides access to publicly available financial data. For firms not adequately covered by yfinance, or to ensure comprehensive global coverage, stock price data were supplemented and meticulously cross-verified with feeds from premier institutional financial data providers, specifically Bloomberg L.P. [3] and Refinitiv (LSEG) [4]. Stock returns were typically calculated monthly to capture more granular market movements and then geometrically compounded to derive annual returns, aligning with the annual periodicity of the ESG and firm-specific financial data. The corresponding annual risk-free rate, carefully selected to match the currency and primary listing market of each firm (e.g., yields on 1-year government bonds or Treasury bills, obtained from central bank databases or verified via Bloomberg terminals), was then subtracted from the firm’s annual stock return to arrive at the excess return figure.
Independent variables included ESG data, principally obtained from Bloomberg L.P. [3] and Refinitiv (LSEG) [4]. These platforms are industry standards, offering extensive and detailed ESG metrics for a vast universe of publicly traded global companies, gathered from company reports, public disclosures, news, and other sources. The rationale for selecting specific ESG variables was multifaceted, driven by:
- Their common usage in prior empirical ESG-financial performance (EFP) literature facilitates comparability of findings with existing research. Data availability and consistency across a global sample, given the challenges of international ESG data collection.
The key ESG variables collected and utilized include:
Aggregate ESG Scores: ESG_Score (an overall composite score reflecting a firm's total ESG performance), Social_Score, Gov_Score, and Env_Score. These are proprietary composite scores provided by the data vendors, derived from numerous underlying metrics and designed to capture a firm's performance across each respective ESG pillar.
Specific Operational ESG Metrics: A comprehensive suite of granular metrics was collected to provide deeper, more actionable insights into specific ESG practices directly relevant to manufacturing operations. These included:
Environmental metrics: Scope_1 and Scope_2 greenhouse gas emissions (direct and indirect from energy), total CO2_emissions, Energy_use, Water_use, Water_recycle percentage, Toxic_chem_red (initiatives for toxic chemical reduction), and Recycling_Initiatives. These metrics directly reflect a firm's environmental footprint and efforts towards sustainable production.
Social metrics: Injury_rate (reflecting workplace safety), percentage of Women_Employees (diversity metric), policies or incidents related to Human_Rights (supply chain ethics, labor practices), occurrences of Strikes (labor relations), and Turnover_empl (employee turnover, morale). These capture aspects of human capital and social license.
Governance metrics: Board_Size (structure), a Shareholder_Rights index (if available, protecting investor rights), Board_gen_div (board gender diversity percentage), and policies or incidents related to Bribery (anti-corruption efforts). These reflect the quality and transparency of corporate oversight.
ESG Risk Categories: Firms were classified into Low, Medium, or High ESG risk categories. This crucial classification was derived based on Sustainalytics' comprehensive overall ESG risk assessment methodology, as reported or triangulated through the Bloomberg or Refinitiv platforms. This variable captures an external, holistic evaluation of a firm's exposure to and management of material ESG risks, similar to approaches discussed in other ESG risk studies [2].
A set of Control Variables was systematically incorporated into all regression models. These controls are essential to account for other established and widely recognized determinants of stock returns, ensuring that any estimated ESG effects are not confounded by these known financial or market factors.
Global Fama-French Factors: To control for systematic market risk factors that influence stock returns across firms and over time, data for the Fama-French five factors—MKT_RF (market risk premium, representing the excess return of the market over the risk-free rate), SMB (small minus big, a size factor reflecting returns of small-cap stocks over large-cap stocks), HML (high minus low, a value factor reflecting returns of high book-to-market stocks over low book-to-market stocks), RMW (robust minus weak, a profitability factor reflecting returns of high operating profitability stocks over low operating profitability stocks), and CMA (conservative minus aggressive, an investment factor reflecting returns of low investment stocks over high investment stocks)—and the momentum factor (WML) were meticulously sourced from Kenneth R. French's Data Library [37]. Crucially, for this study's global scope and to ensure appropriate application to a diversified international sample of firms, the International/Global versions of these factors were utilized. These factors, typically available at a monthly frequency, were aggregated to an annual frequency to align consistently with the periodicity of the ESG and firm-specific financial data.
Firm-Specific Financial Controls: Additional firm-level financial data, essential for controlling for idiosyncratic firm characteristics that influence returns beyond market factors, were also sourced from Bloomberg or Refinitiv. These variables include: Log_Market_cap (natural logarithm of year-end market capitalization), Log_Total_assets (natural logarithm of year-end total assets), FNCL_LVRG (financial leverage, calculated as total debt divided by total assets or total equity), RETURN_ON_ASSET (ROA, net income divided by total assets), PE_RATIO (price-to-earnings ratio), ASSET_GROWTH (annual percentage change in total assets), Log_BVPS (natural logarithm of book value per share), and QUICK_RATIO (acid-test ratio, measuring short-term liquidity). Logarithmic transformations were applied to size-related variables (Market Cap, Total Assets, BVPS) to normalize their distributions, mitigate potential heteroskedasticity, and linearize their relationships with the dependent variable, which is a common practice in financial econometrics. The inclusion of these controls is standard and critical practice in asset pricing and corporate finance research, as these variables are widely recognized as influencing firm valuation and returns [36,40,85].
The Sample Selection targeted publicly traded firms in the global Industrial and Manufacturing sectors, identified via major global indices and industry classifications. The observation period began post-2012, reflecting improved ESG data availability. After merging and cleaning, the final panel comprised 438 firm-year observations. Country inclusion was implicitly driven by data availability from the providers.
3.3. Data Preprocessing
Data preprocessing involved several steps. Datasets (stock returns, Fama-French factors, ESG, and financials) were aligned using firm identifiers and year. Dummy variables for RiskCat_High and RiskCat_Medium were created, with RiskCat_Low as the baseline (raw distribution: Low 195, High 122, Medium 121).
Given significant missing data for some ESG metrics (e.g., Water_recycle 421 NaNs; Turnover_empl 397 NaNs), Multiple Imputation by Chained Equations (MICE) was implemented for 29 numeric columns to preserve sample size and reduce bias [86], with the understanding that imputation introduces some uncertainty.
A Variance Inflation Factor (VIF) check on 35 numeric variables revealed high multicollinearity for several (e.g., Log_Total_assets VIF 5601.73; ESG_Score VIF 1204.02). To mitigate this, individual ESG scores and most operational ESG metrics were tested in separate regression models, each including the ESG variable of interest and base financial controls. This approach, while not fully eliminating potential omitted variable bias, enables feasible estimation and clearer ceteris paribus interpretation of individual ESG factor effects.
3.4. Panel Regression and Machine Learning Models
To empirically investigate the impact of various ESG factors on excess stock returns, this study employed both panel regression models for inferential analysis and machine learning models for predictive insights.
The general panel regression equation is:
Excess_Return_it = α + β1 * ESG_Factor_it + Σj(βj * Control_Variable_jit) + μi + λt + εit
where Excess_Return_it is the dependent variable, ESG_Factor_it the key ESG independent variable, Control_Variable_jit are controls, μi firm-fixed effects, λt time-fixed effects, and εit the error term.
Two-Way Fixed Effects (FE) models were primarily used to analyze the influence of overall ESG scores and specific operational metrics. This FE specification controls for time-invariant unobserved firm characteristics (μi) and common time-varying shocks (λt) [85]. Global Fama-French factors are typically absorbed by time fixed effects. Each ESG score or operational metric was tested individually alongside standard firm-specific financial controls. Robust clustered standard errors (by entity and potentially time) were used [87].
A Random Effects (RE) model was used to assess the impact of ESG risk categories (RiskCat_High, RiskCat_Medium), treated as time-invariant or infrequently changing. RE models explicitly included Global Fama-French factors and firm-specific financial controls alongside the risk category dummies [85]. Robust clustered standard errors were applied. The choice between FE and RE considers trade-offs regarding unobserved heterogeneity, informed by specification tests (e.g., F-test, Breusch-Pagan test) and theoretical preferences.
For predictive analysis, Random Forest and XGBoost regression models were created. Excess_Return was predicted using the same set of ESG indicators, financial controls, and Fama-French factors as in the panel model. The data was divided into training (75%) and testing (25%) sets. Model performance was measured using Mean Squared Error (MSE) and R-squared, and feature importance was investigated to discover critical predictors.
3.5. Model Specification Tests
Standard model specification tests informed the panel regression approach. An F-test for entity fixed effects versus pooled OLS (statistic 0.68, P-value 0.935) and a Breusch-Pagan test on entity fixed effects residuals (statistic 4.50, P-value 0.876 for homoskedasticity in that specific test) were conducted. An informal Hausman test comparison between FE and RE coefficients for common time-varying variables was also considered in the interpretation of RE model results for time-invariant risk categories.
4. Results
This section outlines the empirical outcomes derived from the panel data analyses and machine learning models. These methodologies were applied to examine the association between Environmental, Social, and Governance (ESG) factors and excess stock returns for manufacturing firms operating globally.
4.1. Data Characteristics and Model Specification Diagnostics
The panel regression analyses utilized a final dataset comprising 438 firm-year observations from global manufacturing firms, spanning the period post-2012. Firms were allocated to ESG Risk Categories, resulting in 195 observations classified as 'Low' risk, 122 as 'High' risk, and 121 as 'Medium' risk. To manage missing values in 29 numeric columns while preserving sample integrity and size, Multiple Imputation by Chained Equations (MICE) was implemented.
Table 1 summarizes the outcomes of the model specification tests. An F-test comparing entity fixed effects against pooled OLS, performed on a variable subset, returned a statistic of 0.68 (P-value 0.935). This suggested that, for the tested variables, firm fixed effects did not offer a statistically significant advantage over a basic pooled model. A Breusch-Pagan test applied to the residuals of an entity fixed effects model yielded a statistic of 4.50 (P-value 0.876), indicative of homoskedasticity in that specific test scenario.
Variance Inflation Factor (VIF) analysis performed on 35 numeric variables indicated high levels of multicollinearity among several regressors. For instance, Log_Total_assets exhibited a VIF of 5601.73, Log_Market_cap had 5304.86, and ESG_Score showed a VIF of 1204.02. This justified the analytical strategy of testing individual ESG variables in separate regression models.
4.2. Impact of Overall ESG Scores and Operational Metrics on Excess Returns (Fixed Effects Panel Models)
A series of Two-Way Fixed Effects (FE) panel regression models were estimated. Each model included a single ESG score or operational metric along with firm-specific financial controls; Global Fama-French factors were absorbed by time fixed effects.
Table 2 summarizes the coefficients and P-values for each individually tested ESG variable. For aggregate ESG scores, no statistically significant relationship with excess returns was found at conventional (e.g., 5%) levels. ESG_Score exhibited a coefficient of -0.0018 (P-value 0.4101). Similarly, Social_Score had a coefficient of -0.0013 (P-value 0.4791), Gov_Score had a coefficient of 0.0003 (P-value 0.7275), and Env_Score showed a coefficient of -0.0014 (P-value 0.3362).
Among specific operational ESG metrics, Board_Size displayed a statistically significant positive relationship with excess returns. The model including Board_Size yielded a coefficient of 0.0018 (P-value 0.0019). Most other individual operational ESG metrics did not demonstrate statistical significance at the 5% level. For example, CO2_emissions had a P-value of 0.6862, Energy_use a P-value of 0.7146, Water_use a P-value of 0.6804, and Injury_rate a P-value of 0.1593.
Several firm-specific financial control variables consistently showed statistical significance across models. ASSET_GROWTH frequently had a positive and highly significant coefficient (e.g., P-value < 0.0001). RETURN_ON_ASSET also often exhibited a positive and significant association (e.g., P-value 0.0358 in the ESG_Score model). Log_Total_assets frequently displayed a negative coefficient, sometimes significant (e.g., P-value 0.0099 in the Gov_Score model).
4.3. Influence of ESG Risk Categories on Excess Returns (Random Effects Panel Model)
The impact of ESG Risk Categories (Low, Medium, High) was investigated using a Random Effects (RE) panel model. This model incorporated dummy variables for RiskCat_High and RiskCat_Medium (using 'Low' as the baseline), Global Fama-French factors, and firm-specific financial controls, with robust clustered standard errors applied.
Table 3 displays the outcomes from this RE model. The coefficient for RiskCat_High was 0.0450 (P-value 0.0763), indicating marginal statistical significance at the 10% level. For RiskCat_Medium, the coefficient was 0.0070 (P-value 0.7543) and not statistically significant.
In this RE model, several Global Fama-French factors were found to be statistically significant. MKT_RF had a coefficient of 1.4243 (P-value 0.0000), CMA showed 1.3336 (P-value 0.0054), and WML registered -0.2710 (P-value 0.0283). Log_Market_cap (coefficient 0.0694, P-value 0.0013) and Log_Total_assets (coefficient -0.0718, P-value 0.0003) also emerged as highly significant control variables.
4.4. Machine Learning Model Outcomes
Random Forest and XGBoost Regressor models were trained to predict excess returns. Data were partitioned into a training set (328 observations) and a test set (110 observations).
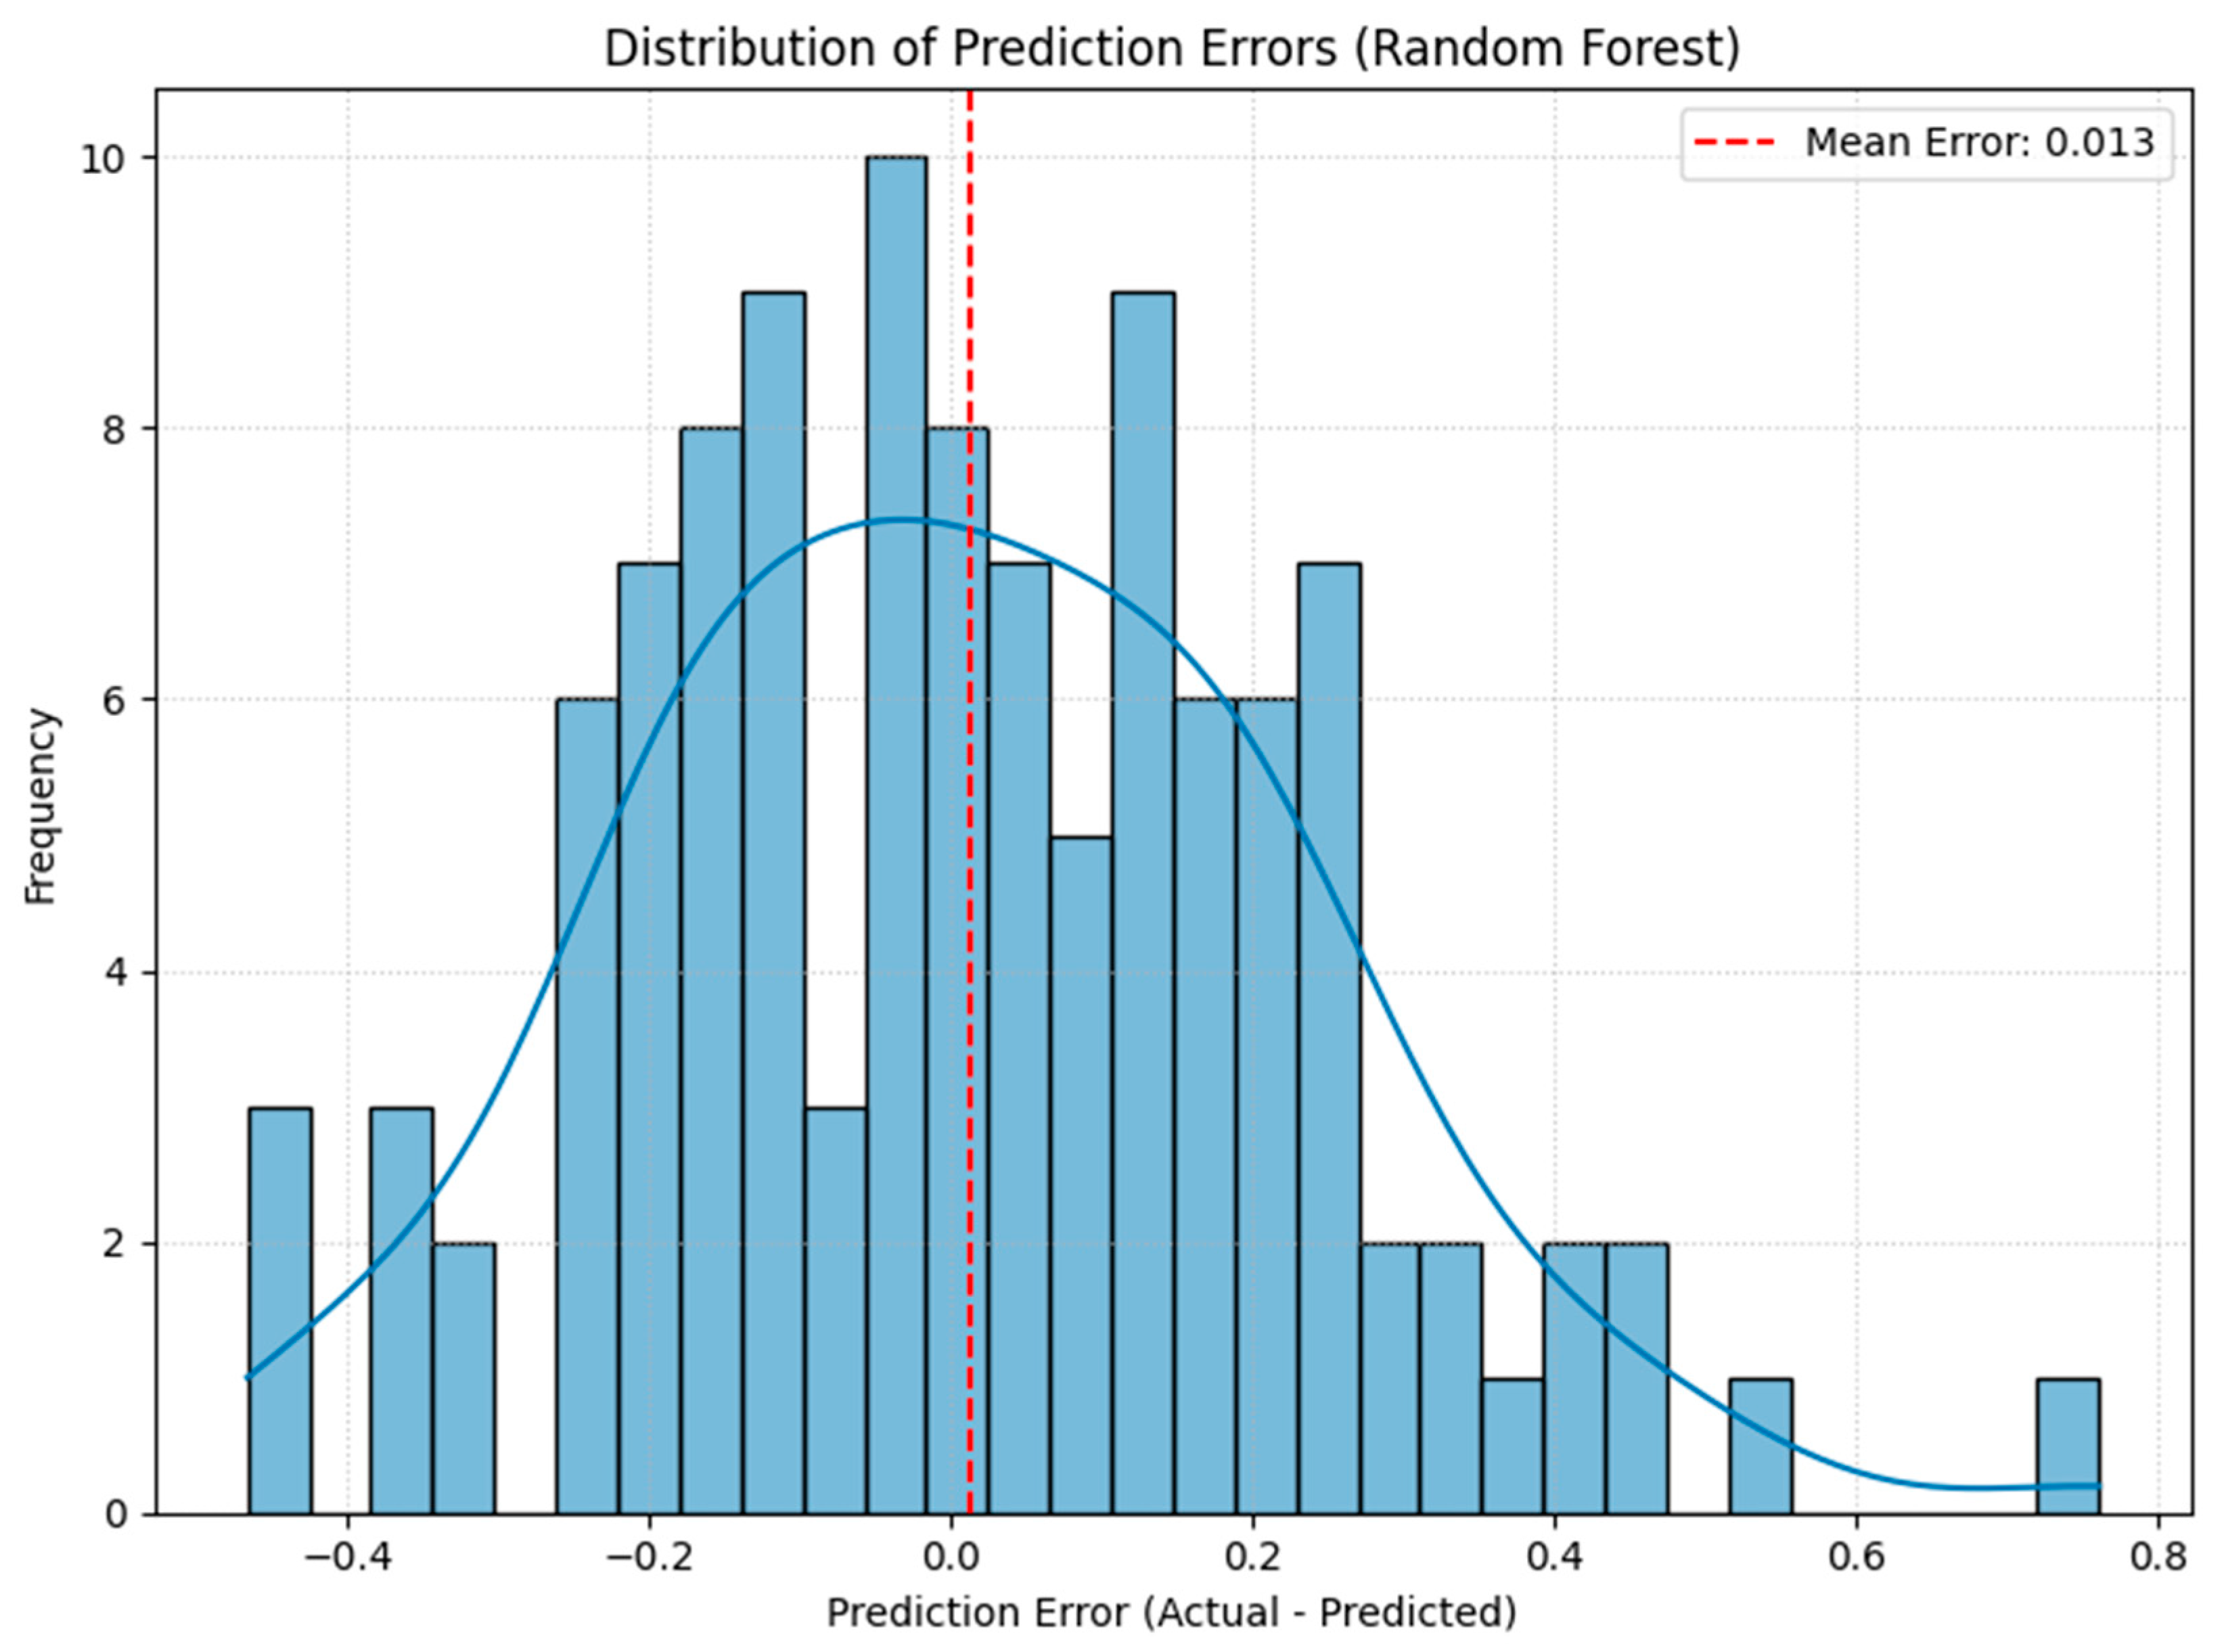
On the test set, the Random Forest model yielded a Mean Squared Error (MSE) of 0.0487 and an R-squared value of 0.3005. The five leading features contributing to this model's predictive capability were MKT_RF, Env_Score, RETURN_ON_ASSET, PE_RATIO, and RiskCat_High. Figure 1 illustrates the top 15 feature importances for the Random Forest model. Figure 3 displays the actual versus predicted excess returns from this model, and Figure 4 shows the distribution of its prediction errors.
Figure 1.
Top 15 Feature Importances for Random Forest Regressor.
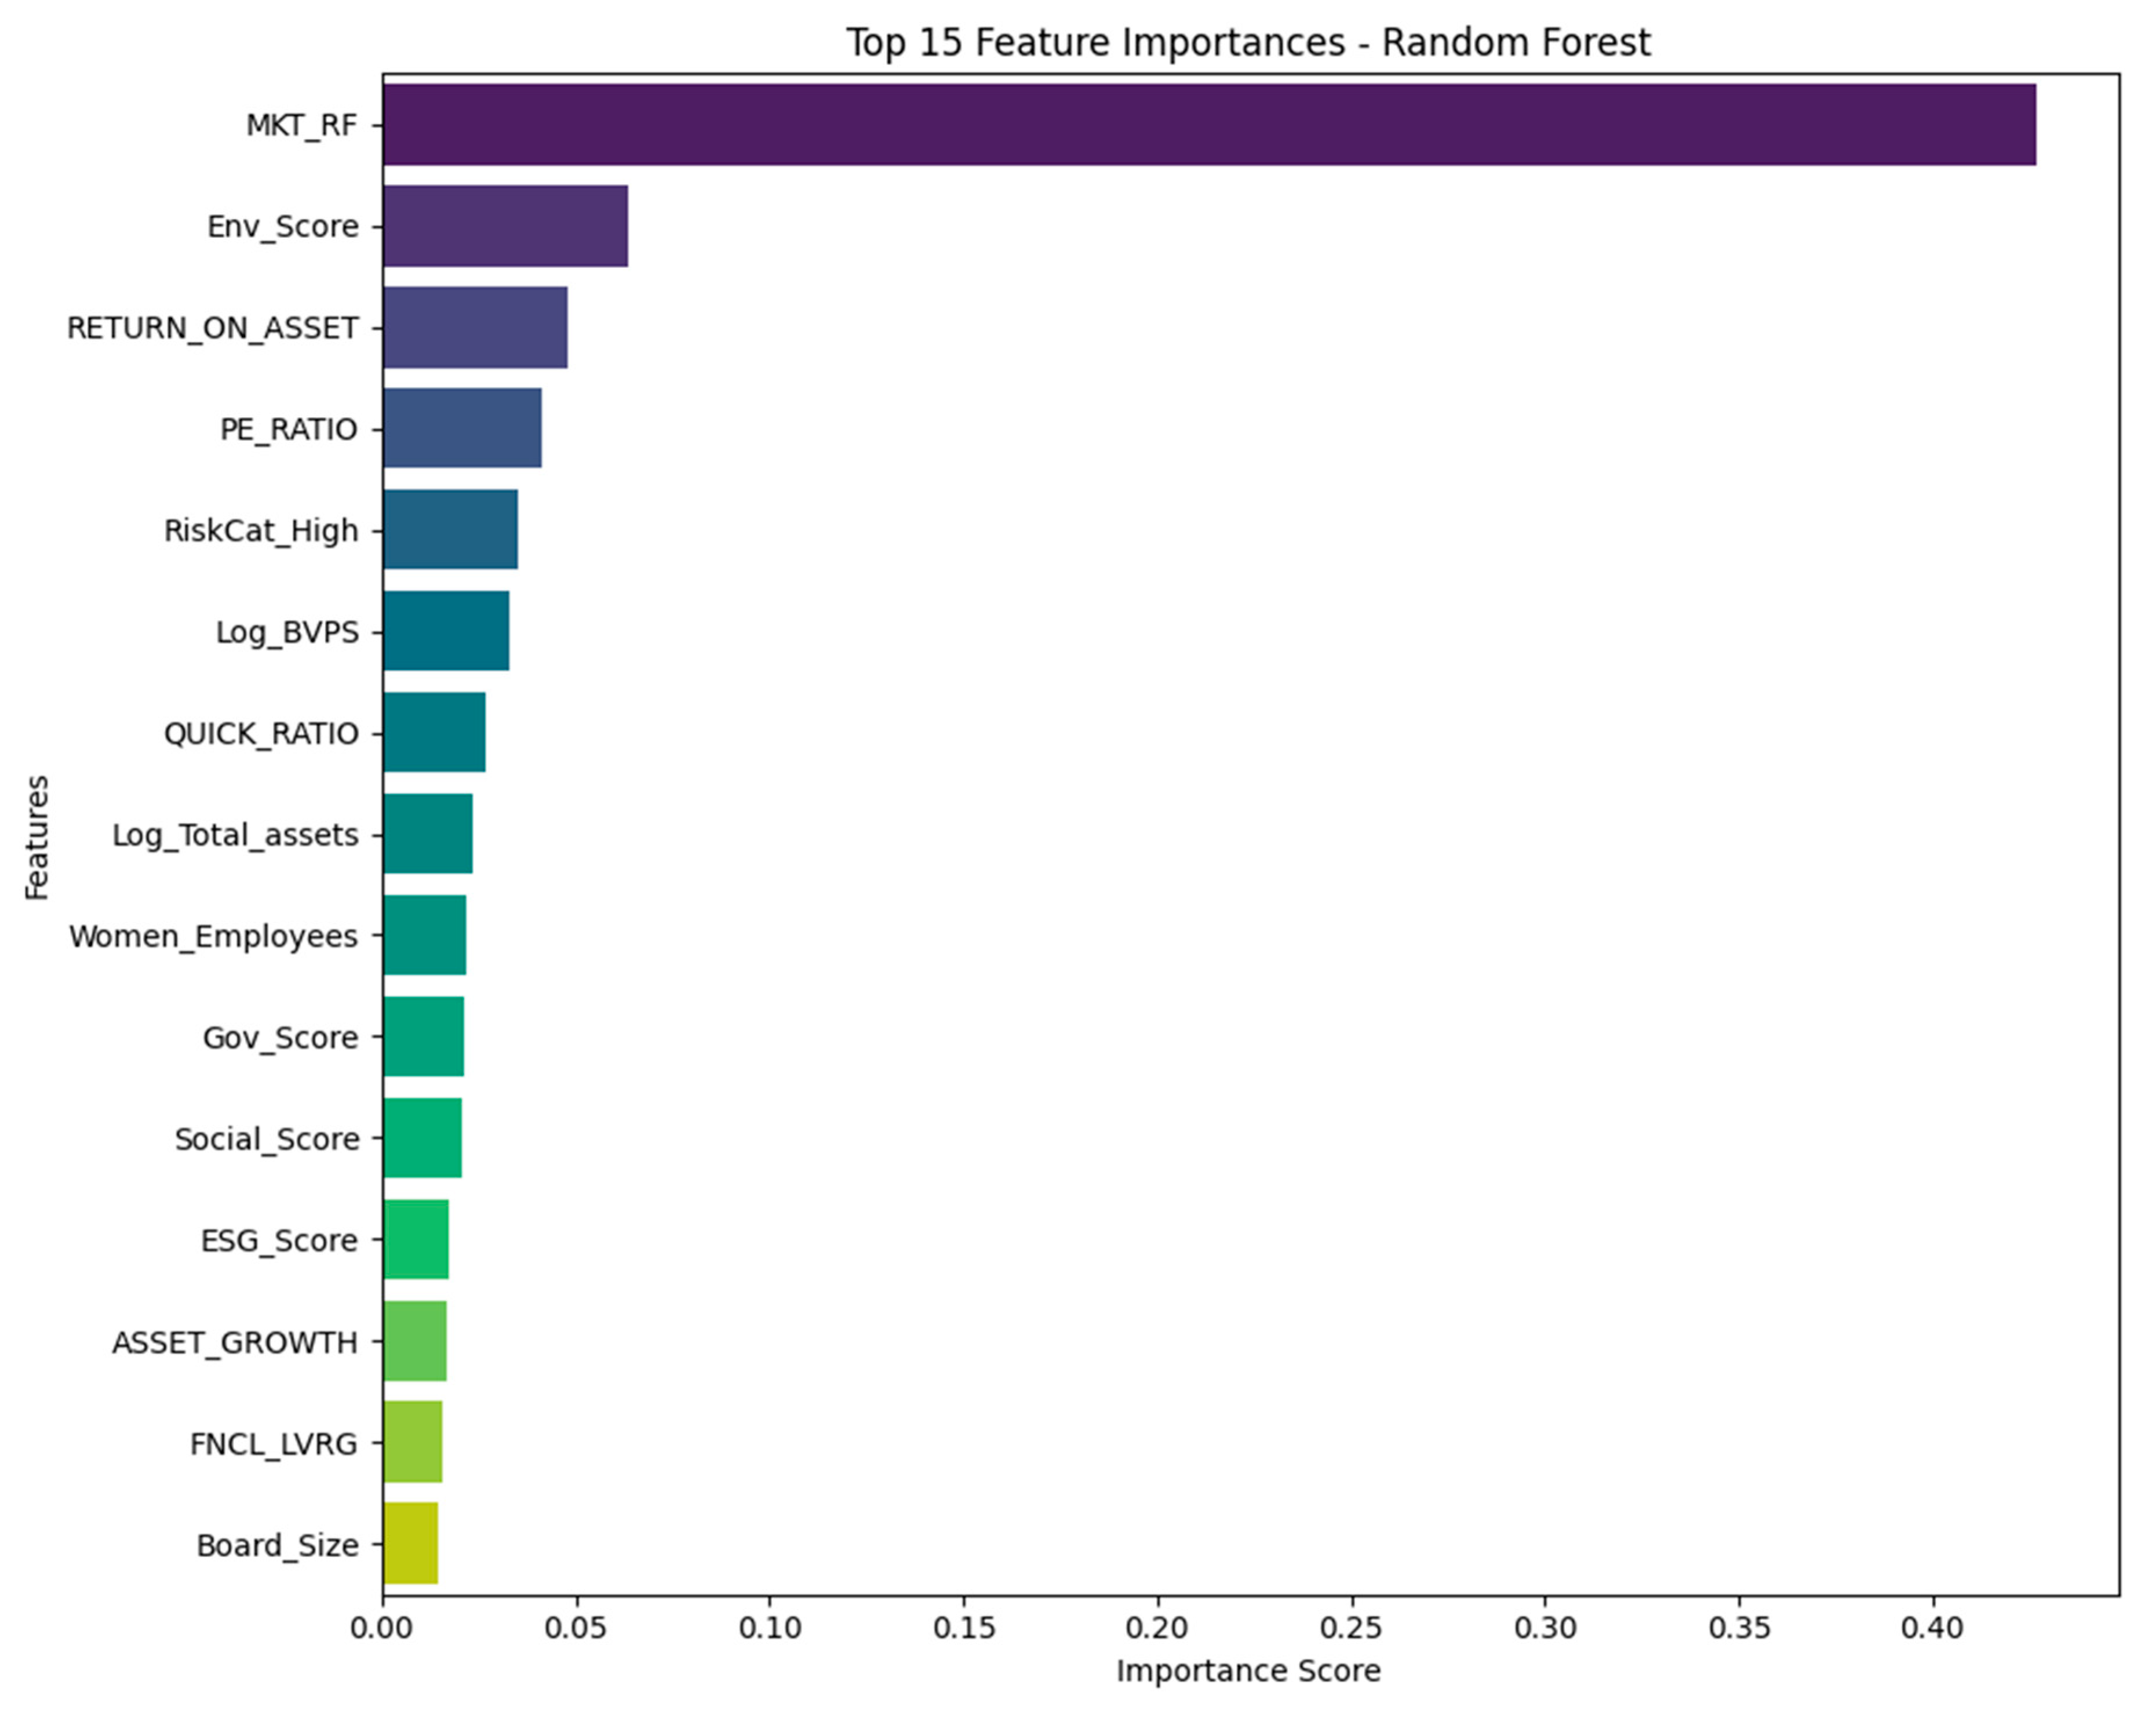
Figure 2.
Top 15 Feature Importances for XGBoost Regressor.
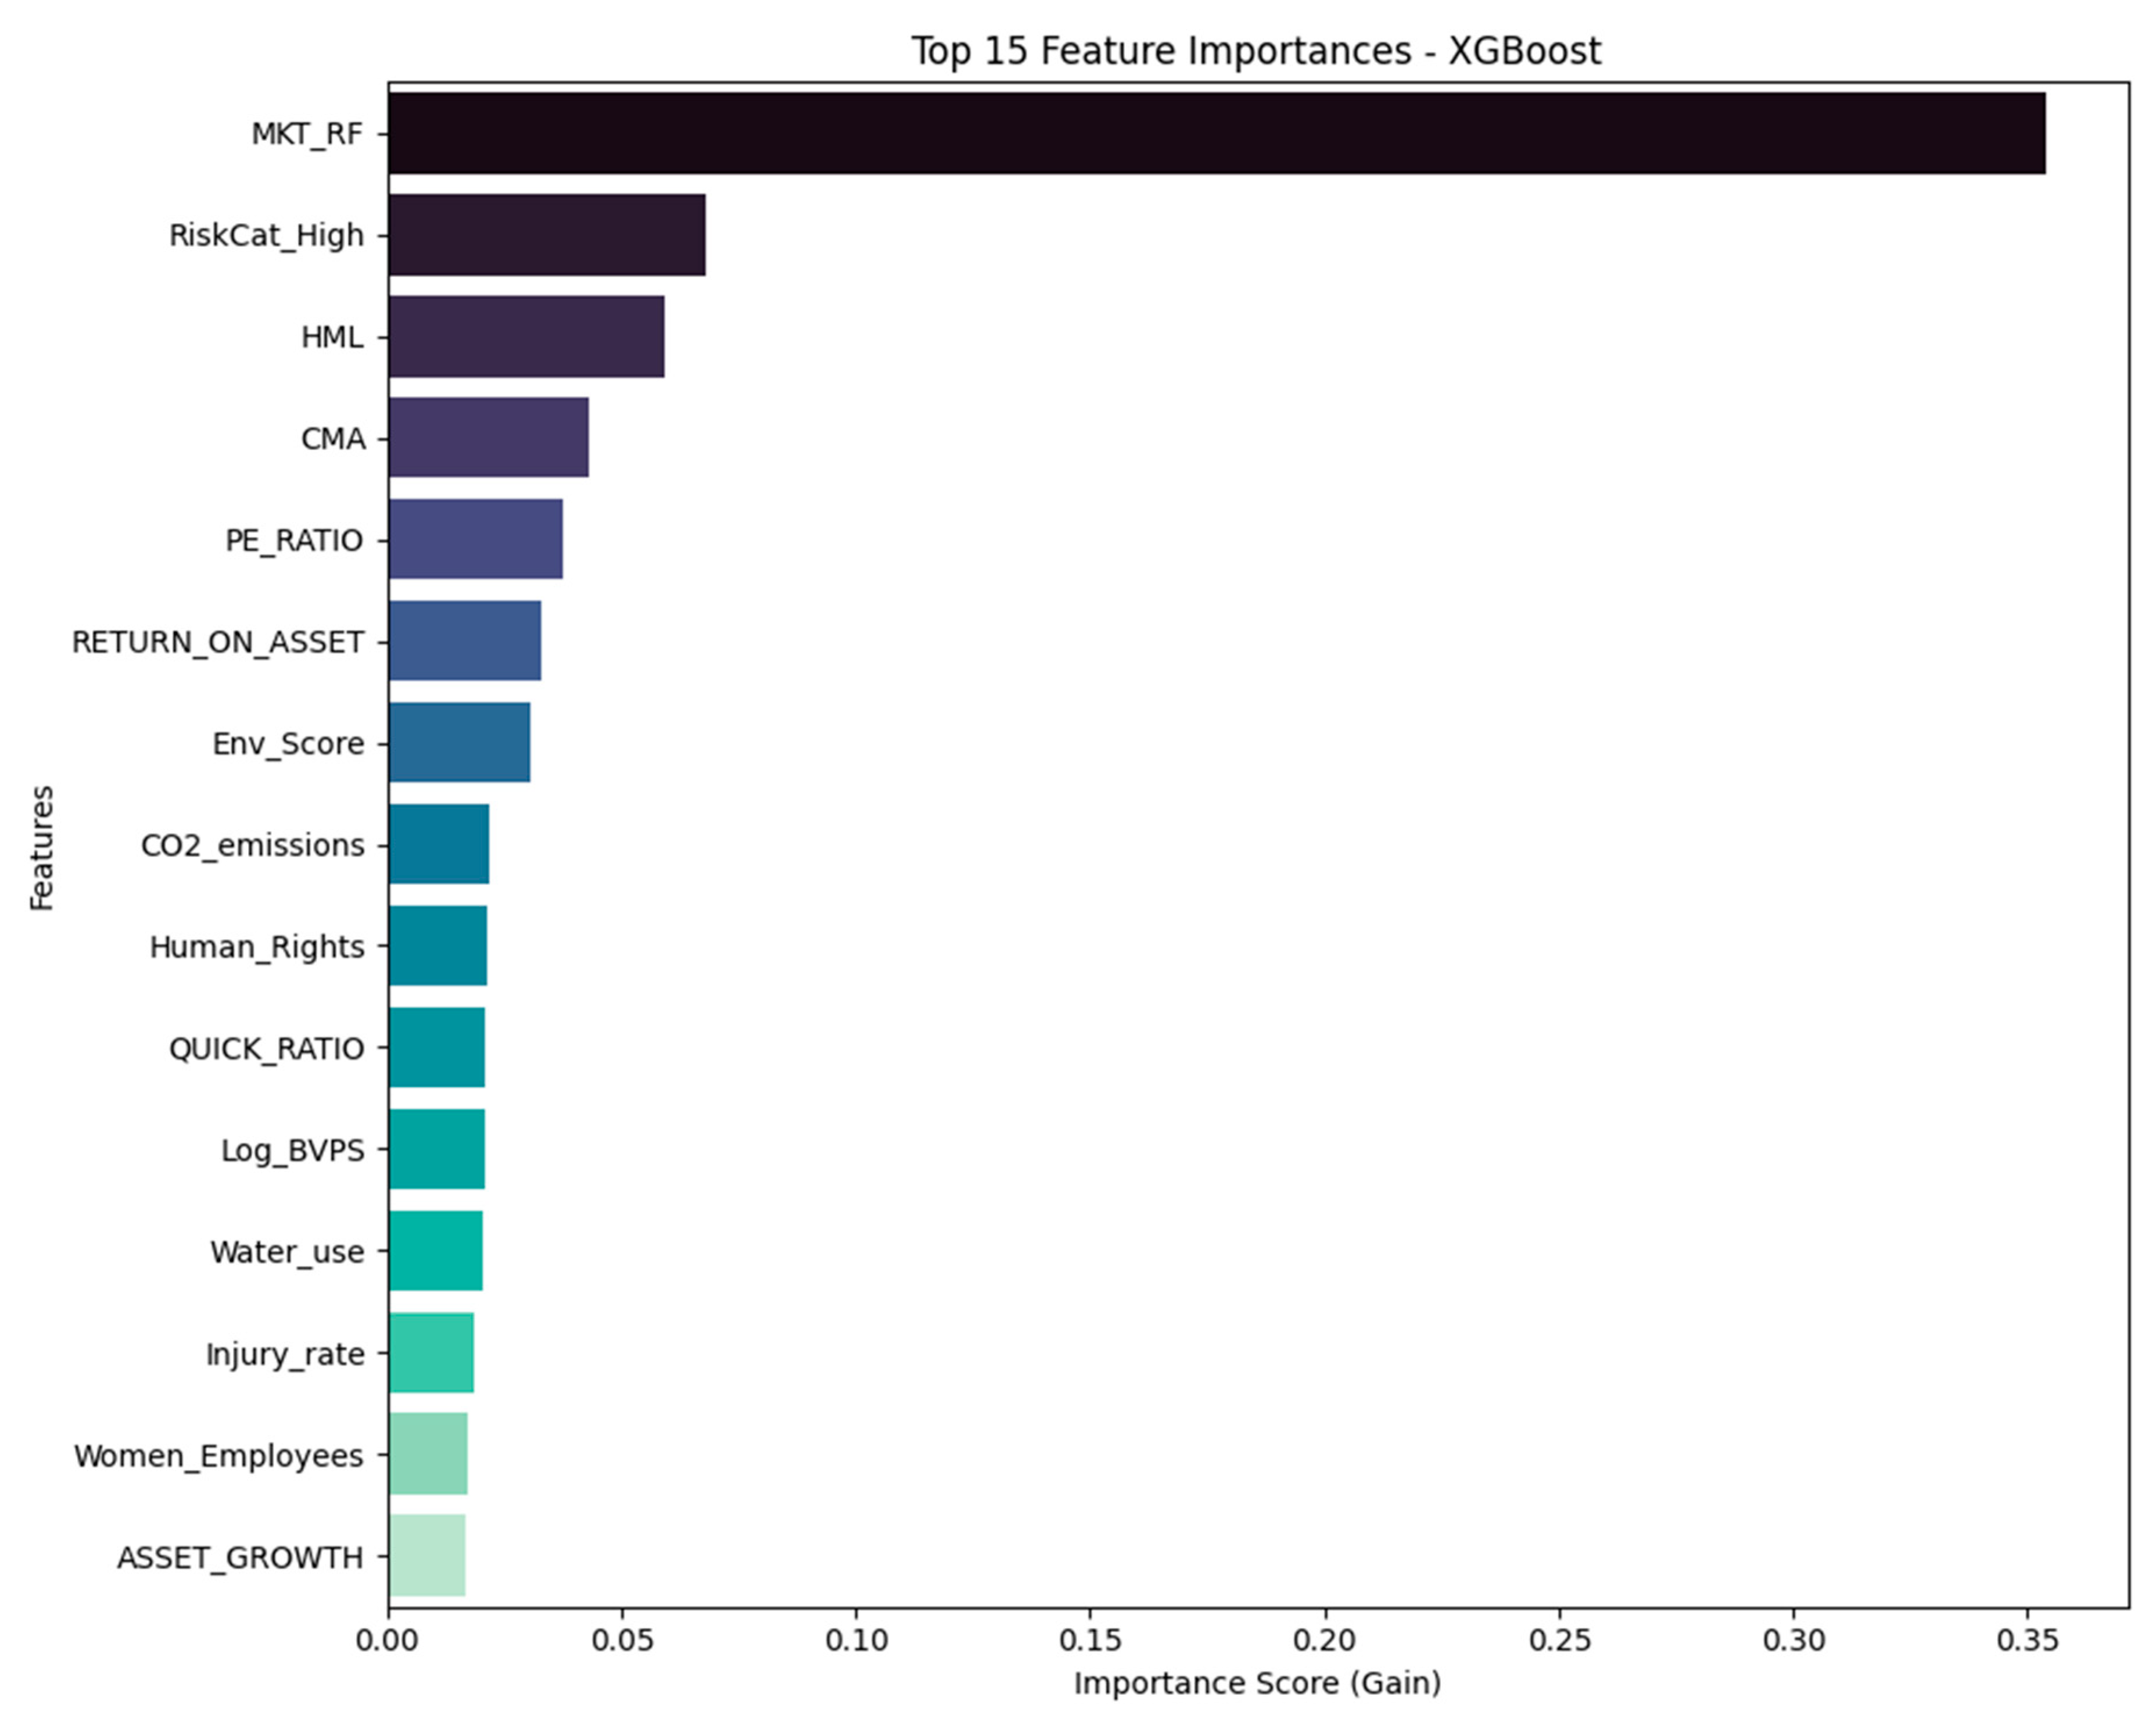
Figure 3.
Actual vs. Predicted Excess Returns (Random Forest).
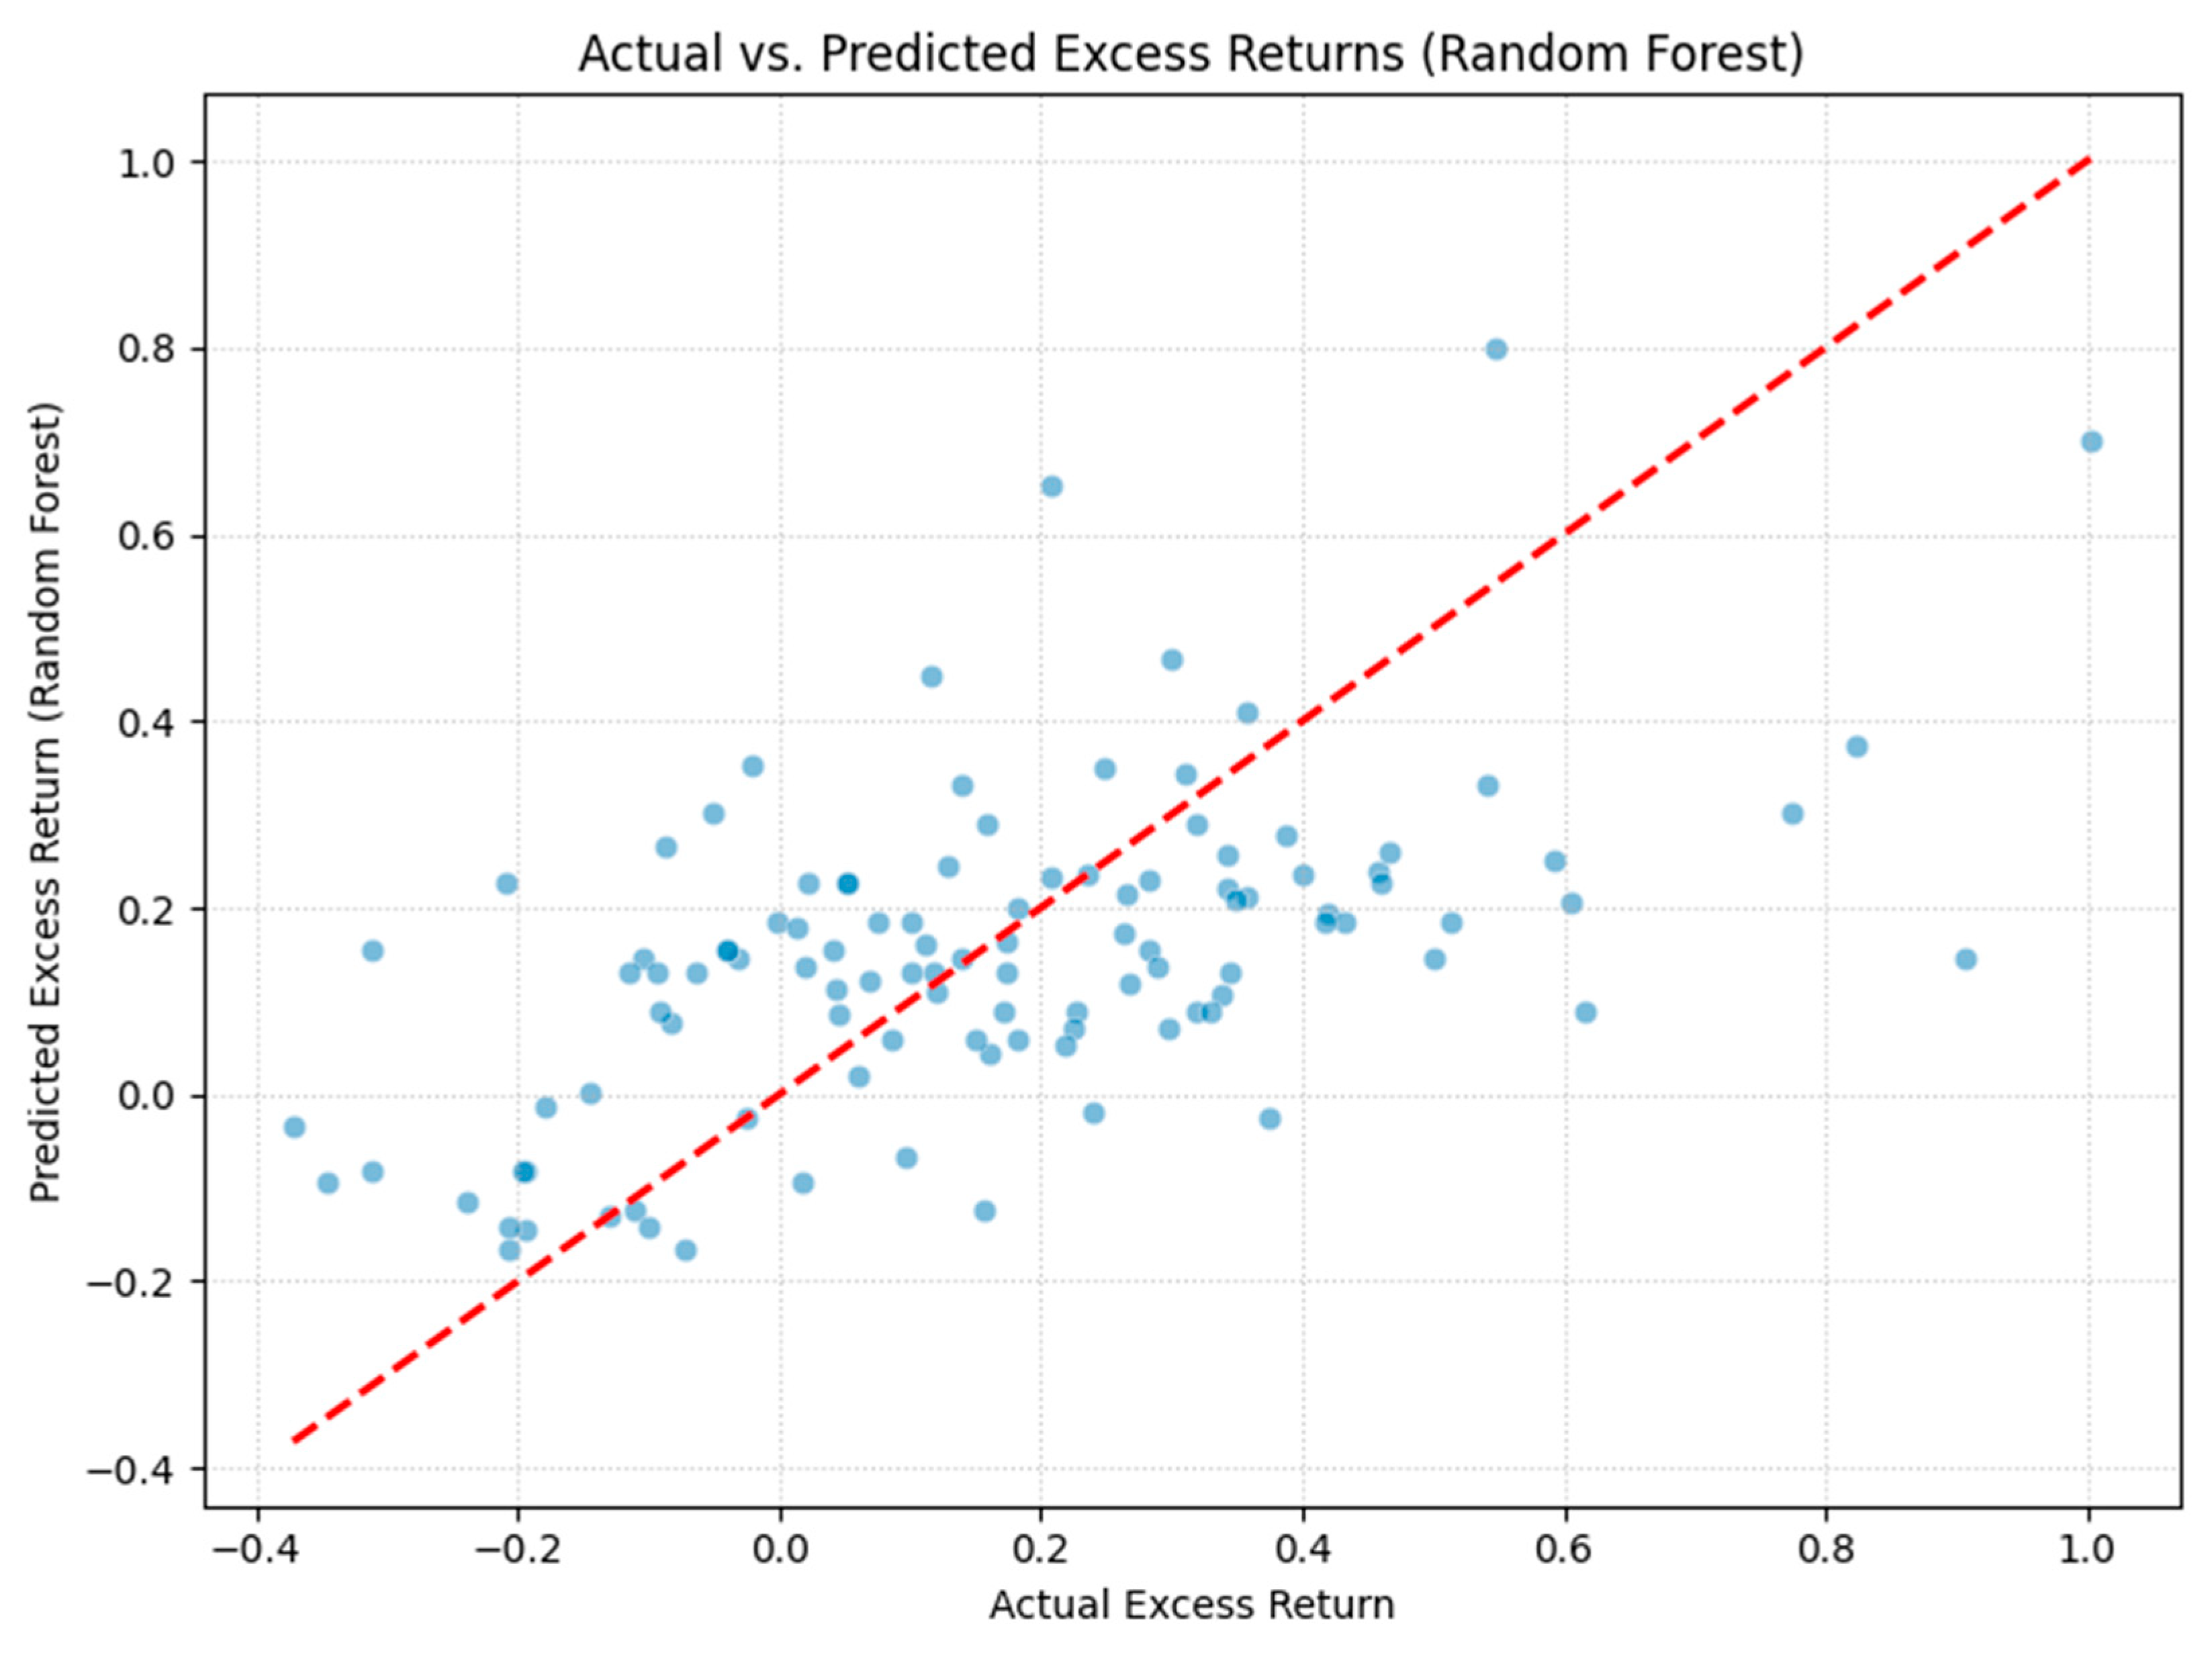
Figure 4.
Distribution of Prediction Errors (Random Forest).
The XGBoost model achieved an MSE of 0.0499 and an R-squared of 0.2835 on the test data. For this model, the top five features for predictive performance were MKT_RF, RiskCat_High, HML, CMA, and PE_RATIO. Figure 2 illustrates the top 15 feature importances for the XGBoost model. Table 4 offers a summary of the performance metrics for both machine learning approaches.
5. Discussion
This section analyzes Section 4's empirical results, placing them within established theoretical frameworks and existing literature, with a specific focus on transformative trends in global manufacturing. The discussion addresses the research questions, highlights the study's contributions and limitations, and aims to provide deeper theoretical explanations and clarify the paper's advancements.
5.1. Interpretation of Results: Research Questions and Global Manufacturing Trends
RQ1 findings from Two-Way Fixed Effects models, examining the impact of overall ESG scores and operational ESG metrics on excess stock returns, indicate a generally subtle immediate link for most variables in the global manufacturing sector. The lack of statistical significance for aggregate ESG_Score, Env_Score, Social_Score, and Gov_Score (Table 2) suggests that, after controlling for unobserved firm heterogeneity and time-specific shocks, improvements in these ESG ratings did not directly correspond to higher or lower excess stock returns for the sampled firms during the study period. Similarly, most specific operational ESG metrics, like CO2_emissions or Energy_use, showed no significant direct impact (Table 2). This widespread insignificance is notable, considering the growing investor and stakeholder focus on these factors [41,49] and manufacturers' substantial investments in sustainability driven by "Current Trends" (e.g., Sustainable Manufacturing [1,9,28,43], Smart Manufacturing & Digitalization [5,6,7,11]) from Section 2.2.2. Potential explanations include: ESG benefits materializing over longer periods than this annual model captures; indirect impacts (e.g., reduced long-term risk, enhanced brand value, operational efficiencies not immediately priced in) [17,42]; market pre-pricing of known ESG data; or significant costs of ESG-enhancing technologies offsetting immediate gains [55]. Sector heterogeneity and varied technological adoption rates (e.g., AI [57,80], digital twins [5,60,63]) might also mask generalized effects.
A key exception for RQ1 was the significant positive link between Board_Size and excess stock returns (coefficient 0.0018, p=0.0019, Table 2). This implies that larger boards in the sampled global manufacturing firms were associated with higher subsequent stock returns. Theoretically, Stakeholder Theory [14,15] and Agency Theory suggest larger boards in complex multinational manufacturers might offer broader expertise, better global oversight, diverse perspectives for international navigation, and stronger governance, valued by the market [80,81]. Amidst "Current Trends" involving complex technological (e.g., AI [49,72], digital twins [5,61]) and sustainability decisions [8], well-structured, competently sized boards may be seen as better equipped, boosting investor confidence. This contrasts with some literature favoring smaller, agile boards. The positive finding here could reflect specific needs of large global manufacturers requiring extensive oversight for diverse challenges, including those from innovations in Section 2.2.2.
For RQ2, a Random Effects model assessed ESG Risk Categories' impact on excess returns (Table 3). RiskCat_High showed a coefficient of 0.0450 (p-value 0.0763), a marginally significant (10% level) positive relationship. This offers some, albeit not strong (at a 5% level), evidence that firms classified as 'High' ESG risk might have experienced slightly higher excess returns than 'Low' risk firms, after controls. RiskCat_Medium was insignificant. This intriguing finding needs careful interpretation, considering RE model assumptions (chosen as FE models don't estimate time-invariant variable coefficients). While specification tests (Table 1) didn't strongly mandate FE, and an informal Hausman test showed some differences, finance often prefers FE for controlling unobserved correlated heterogeneity [85]; thus, RE results carry this caveat. A possible interpretation for the marginally positive RiskCat_High coefficient, if robust, is that markets see these "high-risk" firms as having greater improvement potential, especially if engaging with "Current Trends" (e.g., investing in sustainable/smart technologies [5,7,9,26,28,34,44]). These firms might undergo risky but growth-signaling investment cycles [26,55]. For instance, a manufacturer heavily investing in decarbonization or digital overhaul [18,20,75] might seem "riskier" by static ESG metrics but could signal future growth potential. This links ESG risk ratings to ongoing, high-reward innovation efforts like Decentralized or Software-Driven Manufacturing [18,79,80,83].
RQ3 utilized machine learning models (Random Forest, XGBoost) to identify influential predictors of excess returns (Table 4, Figures 1, 2). Both models achieved R-squared values near 0.30, indicating reasonable predictive ability. Feature importance analysis showed traditional factors like MKT_RF were highly influential, as per asset pricing theory. Notably, ESG factors like Env_Score and RiskCat_High were prominent in Random Forest, and RiskCat_High in XGBoost. This suggests that while panel regressions may not find direct significant impacts for all ESG dimensions contemporaneously, machine learning identifies ESG characteristics as important predictors. This implies ESG variables hold relevant information for predicting financial performance, possibly through complex, non-linear relationships or interactions not captured by traditional linear models. Consistent ESG feature appearance points to their predictive value.
5.2. Comparison with Literature and Knowledge Contribution
The general lack of significance for aggregate ESG scores and most operational metrics in our FE models aligns with some EFP literature reporting mixed or neutral findings in contemporaneous analyses [17,42]. This differs from studies finding consistent positive links, possibly due to sample, period, metric, or methodological variations. This study's contribution lies in interpreting these null findings as reflecting complexities in a transforming sector. "Current Trends" (Section 2.2.2) involve large investments and long-term shifts (e.g., Industry 4.0 for sustainable manufacturing [8,21], AI/IoT integration [22,56,78]). Markets may need more time to recognize and reward these ESG-aligned innovations, or benefits might be non-immediate stock returns (e.g., lower cost of capital, operational resilience) [54].
The significant positive finding for Board_Size uniquely contributes to corporate governance literature from the global manufacturing sector. While optimal board size is debated [81], our result suggests larger boards may be linked to better performance for complex multinational manufacturers facing technological and sustainability challenges, possibly due to enhanced advisory capacity and oversight [80,81]. This FE model-derived finding, controlling for unobserved firm specifics, adds a relevant data point for large, evolving industrial entities.
The RE model's marginally significant positive coefficient for RiskCat_High is perplexing, contrasting expectations of higher ESG risk being penalized [2]. However, if "high-risk" firms undertake significant innovations aligned with "Current Trends" (e.g., pioneering sustainable technologies [9,46] or digitizing operations [5,7,26,55]), the market might price in future upside or a risk premium. This links ESG risk perception to innovative dynamism, a novel perspective compared to static ESG risk treatments. This study embeds interpretation within global manufacturing's evolving context.
Machine learning models offer a crucial complementary view. While panel regression estimates average causal effects, ML prioritizes prediction, identifying useful forecasting features even with non-linear or complex relationships. That ESG factors (Env_Score, RiskCat_High) are top predictors in ML models, even if not significant in linear panel models, suggests ESG information is relevant to market outcomes. ESG variables may contain valuable, potentially hidden, predictive information through complex relationships traditional models miss. This multi-method approach helps unpack the intricate ESG-CFP relationship. The study's methodological rigor (variable selection, Global Fama-French factors, MICE/VIF reporting, FE/RE discussion, ML application) contributes to finance literature using advanced computational methods, aiming for new knowledge and theoretical contribution by framing analysis through sectoral change and ML insights.
5.3. Theoretical Implications
Study findings have several implications for the discussed theories. For Stakeholder Theory [14,15], results offer nuanced support. Board_Size significance aligns with robust governance, representing stakeholder interests being market-valued, suggesting effective stakeholder management via governance can yield financial returns. However, the general lack of direct, immediate financial reward for many E and S metrics in linear panel models implies pathways from broader stakeholder engagement to financial value may be indirect, long-term, or conditional, especially in a capital-intensive, technologically shifting sector. Markets may not immediately price all stakeholder activities without clear short-term value. Yet, ML models' predictive power for environmental metrics and ESG risk categories (Figures 1, 2) hints at indirect market consideration.
Regarding the Theory of Technological Innovation [26] and ESG, this study shows complexities in realizing financial benefits from "green" and "smart" innovations. Many "Current Trends" (Industry 4.0, circular economy, automation) are innovations improving operational efficiency and ESG performance (e.g., smart factories [50,66,75], circular processes [9,21,52]). While innovation theory suggests these lead to competitive advantages, our panel findings indicate market recognition via stock prices may not be immediate or uniform. Upfront costs of transformative technologies (e.g., additive manufacturing [11,84]) or time lags for maturation could explain muted contemporaneous effects. ML's predictive importance of ESG factors suggests firms navigating these innovations might signal future performance detectable through advanced analytics.
For the Theory of Change [33], this research highlights the likely complex, multi-stage causal chain from ESG actions to financial returns. While manufacturers invest in "Current Trends" (e.g., supply chain decarbonization [1,20], digitalization [7,31,56]), intermediate outcomes (e.g., improved image, efficiency, risk management) may take time to materialize and then affect stock performance. Our annual, contemporaneous models likely capture only an early part of this chain. ML models, by identifying predictive features, suggest some ESG initiatives contribute to firm value trajectory, eventually processed by markets.
From an Asset Pricing Theory [36,37] view, while Global Fama-French factors are crucial for stock returns in global manufacturing, most tested ESG metrics do not consistently emerge as additional priced factors in our contemporaneous FE models. Board_Size is an exception, suggesting some governance attributes are price-relevant. The RiskCat_High RE result hints at complex ESG risk pricing dynamics needing further research, possibly linking to debates on ESG in contexts like cryptocurrencies [89]. ML findings suggest ESG characteristics, even if not linear risk factors, hold predictive market value, possibly reflecting subtle efficiencies, non-linearities, or interactions exploitable by sophisticated investors.
5.4. Practical Implications for the Global Industrial and Manufacturing Sector
Findings offer practical insights for global manufacturing stakeholders. For Managers, while broad ESG commitment is vital for stakeholder relations and long-term sustainability [41,49], it may not guarantee immediate stock return uplift. Strategic focus should be on material ESG initiatives driving operational excellence and innovation via "Current Trends." Examples include smart factory tech for efficiency (E) [2,5,7,9,31,35,53,56], collaborative robots/AR/VR for worker safety/skills (S) [29,61,68,71], and robust board oversight (G). Benefits may be long-term, through improved operational metrics, or recognized in complex ways. ML's predictive power for some ESG metrics suggests correlation with future performance. Thus, an integrated ESG and technological innovation strategy (e.g., digital twins for sustainability [5,60,62,64], AI for energy optimization [54,72,80]) is likely more effective than isolated initiatives.
For Global Investors, ESG investing in manufacturing is nuanced. Sole reliance on aggregate ESG scores or generic risk categories for short-term alpha may be insufficient. Board_Size significance warrants due diligence on governance. ML results show ESG factors (environmental scores, ESG risk categories) have predictive power, implying investors using advanced quantitative strategies might find value in incorporating granular ESG metrics. Company engagement with transformative industry trends (e.g., sustainable manufacturing [8,20,28], Industry 4.0 readiness [6,10,18,47,55,65,73,76,79]) is key for long-term value, even if contemporaneous stock impact isn't clear. Potential higher returns in some "high ESG risk" firms might suggest seeking companies in value-creating transformations, requiring careful fundamental assessment.
For Policymakers and Regulators, the study highlights supporting sustainable practices and technological innovation in manufacturing. While ESG disclosure mandates grow [49], data quality, comparability, and usefulness are critical. Policies could incentivize "Current Trend" tech with ESG co-benefits (e.g., tax credits for green tech [1,46] or AI-driven energy systems [54,63,75]). ESG factors' predictive relevance (per ML models) supports enhancing ESG data transparency and standardization. Further research is needed on the financial implications of manufacturing transformations, including Industry 5.0's human-centricity and sustainability [2,69,79].
5.5. Limitations of the Study
This study has limitations inherent in EFP research and global data analysis. First, Data Frequency and Time Series Length: Annual ESG and financial data limit capturing short-term market reactions. The short effective time series (8 years) constrains some dynamic modeling and ML potential. Second, ESG Data Specificity and Quality: Reliance on commercial ESG data (Bloomberg, Refinitiv) and Sustainalytics risk assessments means proprietary methodologies and potential inter-provider rating differences ("aggregate confusion" [47,48]). Data quality varies, and MICE imputation introduces estimation error, especially with high initial missingness. Third, Multicollinearity: High VIFs indicated multicollinearity. Testing ESG variables individually in panel models, while feasible, risks omitted variable bias. ML handles multicollinearity for prediction, but interpreting unique contributions of correlated features is challenging. Fourth, Model Specification and Causality: Establishing causality from ESG to financial performance is difficult. Endogeneity (reverse causality [42] or unobserved time-varying confounders) isn't fully ruled out. FE/RE model choice involves trade-offs. ML models primarily show prediction, not causation. Fifth, Generalizability: Findings are specific to the sampled firms, period (post-2012), and ESG data. The heterogeneous global manufacturing sector [19,20] means results may not apply uniformly.
Sixth, Contemporaneous Analysis: Panel models test immediate relationships. True financial impacts of long-term ESG investments (e.g., sustainable tech [9,28], reskilling for Industry 5.0 [2,30,69,71]) likely have lags not fully captured. Finally, the Machine Learning Model Simplicity, panel-aware ML could offer more robust insights.
5.6. Future Research Directions
Based on findings and limitations, future research avenues include:
First, using longer, higher-frequency ESG data to explore lead-lag relationships and dynamic causality via advanced dynamic panel or time-series ML models. Second, investigating the moderating/mediating role of specific "Current Trends" in the ESG-CFP link, requiring granular data on firms' technological adoption (e.g., IoT [7,26,56,66], AI [22,49,57,72,80], digital twins [5,60,62,64]) or circular economy practices [9,21,52]. Third, examining ESG impact on other financial metrics (cost of capital, valuation multiples, operational efficiency, analyst recommendations) for a holistic view [12,13]. Fourth, comparative studies across manufacturing sub-sectors or regions (e.g., Gadekar et al. [55,65]) to reveal contextual ESG-CFP link differences. Fifth, applying advanced econometrics (instrumental variables, difference-in-differences, system GMM) to better address endogeneity and causality [17,85]. Sixth, integrating qualitative case studies with quantitative analysis for richer insights into how firms translate ESG efforts and tech innovations (e.g., AI for predictive maintenance [50,51,75], edge computing [68,69,79], human-robot collaboration [30,61,67,70,71,77,86]) into financial value.
6. Conclusions
This study empirically investigated the complex link between various ESG factors and excess stock returns of global manufacturing firms. Amidst rapid technological advancements and a rising sustainability imperative in this key sector, the research aimed for new insights by contextualizing ESG/financial data analysis within these "Current Trends and Innovations" and using a multi-method approach (econometrics and machine learning).
Primary findings show a nuanced, often indirect, immediate connection between most analyzed ESG metrics and stock performance. Two-Way Fixed Effects panel models indicated aggregate ESG scores (Overall, Environmental, Social, Governance) and most specific operational ESG indicators (e.g., CO2 emissions, energy use) lacked a statistically significant direct link with annual excess stock returns. Board_Size was a notable exception, showing a positive, significant relationship with higher returns, suggesting board structure in complex global manufacturers may be market-valued. A Random Effects model found firms in 'High' ESG risk categories (vs. 'Low' risk) had a marginally significant (p=0.0761) tendency towards higher excess returns, a counter-intuitive finding needing cautious interpretation. Machine learning models (Random Forest, XGBoost) showed reasonable predictive power for excess returns, with ESG factors (Environmental Score, ESG Risk Category) consistently among influential predictors, alongside traditional market factors. This highlights ESG data's potential to inform investment strategies even without direct linear econometric significance.
This research contributes to EFP literature by framing the ESG-CFP nexus within the profound technological and sustainability-driven transformations in global manufacturing (e.g., Industry 4.0, circular economy, Industry 5.0's human-centric principles [2,30,69,71,79]). It offers a more theoretically grounded and practically relevant interpretation of why ESG factors might (or might not appear to) matter contemporaneously in linear models in this dynamic context. Implications for managers, investors, and policymakers suggest that while specific governance attributes like board size link to financial outcomes, broader benefits of ESG strategies and sustainable manufacturing practices may be long-term, indirect, or manifest beyond immediate stock appreciation. ML's predictive insights further show ESG data's potential for investment strategies.
The evolving global manufacturing sector, driven by "Current Trends," demands ongoing assessment of ESG's role and financial materiality. As firms integrate sustainability and leverage advanced technologies, ESG-financial value connections will likely grow more intricate and significant. This study, acknowledging its limitations, aims to spur further research into these complex interrelationships, fostering a global manufacturing industry that is economically prosperous, environmentally sound, and socially equitable.
7. Patents
There are no patents resulting from the work reported in this manuscript.
Supplementary Materials
The following supporting information can be downloaded at the website of this paper posted on Preprints.org, Figure 1: Example Feature Importance Plot from Random Forest Model; Table 1: Panel Model Specification Tests Summary; Table 2: Detailed Output of Individual Fixed Effects Regressions for Operational ESG Metrics.
Author Contributions
Conceptualization, H.E.O.O.; methodology, H.E.O.O.; software, H.E.O.O.; validation, H.E.O.O.; formal analysis, H.E.O.O.; investigation, H.E.O.O.; resources, H.E.O.O.; data curation, H.E.O.O.; writing—original draft preparation, H.E.O.O.; writing—review and editing, H.E.O.O.; visualization, H.E.O.O.; supervision, H.E.O.O.; project administration, H.E.O.O.; funding acquisition, H.E.O.O. The author has read and agreed to the published version of the manuscript.
Funding
This research received no external funding.
Institutional Review Board Statement
Not applicable.
Informed Consent Statement
Not applicable.
Data Availability Statement
The Fama-French factor data are publicly available from Kenneth R. French's Data Library [37]. ESG and financial data were primarily sourced from commercial providers Bloomberg L.P. [3] and Refinitiv (LSEG) [4]. Stock price data were obtained using the yfinance Python library and supplemented by commercial providers. The specific derived datasets generated and analyzed during the current study, along with the Python scripts used for analysis, are available from the author upon reasonable request and will be made available as supplementary material on the publisher's website upon publication, where feasible.
Acknowledgments
Not applicable.
Conflicts of Interest
The author declares no conflicts of interest.
Abbreviations
| AI | Artificial Intelligence |
| AR | Augmented Reality |
| CFP | Corporate Financial Performance |
| CMA | Conservative Minus Aggressive (Fama-French Factor) |
| CPS | Cyber-Physical Systems |
| ESG | Environmental, Social, and Governance |
| FE | Fixed Effects (Panel Model) |
| HML | High Minus Low (Fama-French Factor) |
| HRC | Human-Robot Collaboration |
| IoT | Internet of Things |
| MDPI | Multidisciplinary Digital Publishing Institute |
| MES | Manufacturing Execution Systems |
| MICE | Multiple Imputation by Chained Equations |
| ML | Machine Learning |
| MSE | Mean Squared Error |
| OLS | Ordinary Least Squares |
| PdM | Predictive Maintenance |
| PE | Price-to-Earnings (Ratio) |
| R2 | R-squared (Coefficient of Determination) |
| RE | Random Effects (Panel Model) |
| RF | Random Forest (Machine Learning Model) |
| RMW | Robust Minus Weak (Fama-French Factor) |
| ROA | Return on Assets |
| ROI | Return on Investment |
| RPA | Robotic Process Automation |
| SMB | Small Minus Big (Fama-French Factor) |
| VIF | Variance Inflation Factor |
| VR | Virtual Reality |
| WML | Winners Minus Losers (Momentum Factor) |
| XGB | XGBoost (Machine Learning Model) |
| XR | eXtended Reality |
References
- Wang, M.; Yin, S.; Lian, S. Collaborative elicitation process for sustainable manufacturing: A novel evolution model of green technology innovation path selection of manufacturing enterprises under environmental regulation. PLoS ONE 2022, 17, e0266169. [Google Scholar] [CrossRef]
- Onomakpo, H.E. ESG Risk Ratings and Stock Performance in Electric Vehicle Manufacturing: A Panel Regression Analysis Using the Fama-French Five-Factor Model. J. Insurance. Bank. Finance. 2025, 3, 12. [Google Scholar] [CrossRef]
- Bloomberg, L.P. Bloomberg Professional Services: Sustainable Finance Solutions. https://www.bloomberg.com/professional/solutions/sustainable-finance/.
- Refinitiv (LSEG). ESG Data. https://www.lseg.com/en/data-analytics/financial-data/company-data/esg-data.
- Gallala, A.; Kumar, A.A.; Hichri, B.; Plapper, P. Digital Twin for Human–Robot Interactions by Means of Industry 4.0 Enabling Technologies. Sensors 2022, 22, 4950. [Google Scholar] [CrossRef] [PubMed]
- Qureshi, K.M.; Mewada, B.G.; Kaur, S.; Khan, A.; Al-Qahtani, M.M.; Qureshi, M.R.N.M. Investigating industry 4.0 technologies in logistics 4.0 usage towards sustainable manufacturing supply chain. Heliyon 2024, 10, e30661. [Google Scholar] [CrossRef] [PubMed]
- Faheem, M.; Butt, R.A. Big datasets of optical-wireless cyber-physical systems for optimizing manufacturing services in the internet of things-enabled industry 4.0. Data Brief 2022, 42, 108026. [Google Scholar] [CrossRef] [PubMed]
- De Alwis, A.M.L.; De Silva, N.; Samaranayake, P. Industry 4.0-enabled sustainable manufacturing: Current practices, barriers and strategies. Benchmarking Int. J. 2024, 31, 2061–2089. [Google Scholar] [CrossRef]
- Ghaithan, A.M.; Alshammakhi, Y.; Mohammed, A.; Mazher, K.M. Integrated Impact of Circular Economy, Industry 4.0, and Lean Manufacturing on Sustainability Performance of Manufacturing Firms. Int. J. Environ. Res. Public Health 2023, 20, 5119. [Google Scholar] [CrossRef]
- Tegethoff, T.; Santa, R.; Bucheli, J.M.; Cabrera, B.; Scavarda, A. Navigating Industry 4.0: Leveraging additive technologies for competitive advantage in Colombian aerospace and manufacturing industries. PLoS ONE 2025, 20, e0318339. [Google Scholar] [CrossRef]
- Tamir, T.S.; Xiong, G.; Shen, Z.; Leng, J.; Fang, Q.; Yang, Y.; Jiang, J.; Lodhi, E.; Wang, F.Y. 3D printing in materials manufacturing industry: A realm of Industry 4.0. Heliyon 2023, 9, e19689. [Google Scholar] [CrossRef]
- Friede, G.; Busch, T.; Bassen, A. ESG and financial performance: Aggregated evidence from more than 2000 empirical studies. J. Sustain. Financ. Invest. 2015, 5, 210–233. [Google Scholar] [CrossRef]
- Revelli, C.; Viviani, J.L. Financial performance of socially responsible investing (SRI): What have we learned? A meta-analysis. Bus. Ethics Eur. Rev. 2015, 24, 158–185. [Google Scholar] [CrossRef]
- Freeman, R.E. Strategic Management: A Stakeholder Approach; Pitman: Boston, MA, USA, 1984. [Google Scholar]
- Parmar, B.L.; Freeman, R.E.; Harrison, J.S.; Wicks, A.C.; Purnell, L.; de Colle, S. Stakeholder Theory: The State of the Art. Acad. Manag. Ann. 2010, 4, 403–445. [Google Scholar] [CrossRef]
- Margolis, J.D.; Elfenbein, H.A.; Walsh, J.P. Does it Pay to Be Good? A Meta-Analysis and Redirection of Research on the Relationship between Corporate Social and Financial Performance. SSRN Electron. J. 2007. [CrossRef]
- Orlitzky, M.; Schmidt, F.L.; Rynes, S.L. Corporate Social and Financial Performance: A Meta-analysis. Organ. Stud. 2003, 24, 403–441. [Google Scholar] [CrossRef]
- Ali, K.; Johl, S.K. Driving forces for industry 4.0 readiness, sustainable manufacturing practices and circular economy capabilities: Does firm size matter? J. Manuf. Technol. Manag. 2023, 34, 838–871. [Google Scholar] [CrossRef]
- Ahmad, S.; Wong, K.Y.; Butt, S.I. Status of sustainable manufacturing practices: Literature review and trends of triple bottom-line-based sustainability assessment methodologies. Environ. Sci. Pollut. Res. 2023, 30, 43068–43095. [Google Scholar] [CrossRef]
- Bai, X.; Wan, Y. Analysis of the factors influencing the sustainable development of the manufacturing industry under the wave of Industry 4.0. Int. J. Manuf. Technol. Manag. 2025, 39, 1–18. [Google Scholar] [CrossRef]
- Jamwal, A.; Agrawal, R.; Sharma, M. A Framework to Overcome Blockchain Enabled Sustainable Manufacturing Issues through Circular Economy and Industry 4.0 Measures. Int. J. Math. Eng. Manag. Sci. 2022, 7, 764–790. [Google Scholar] [CrossRef]
- Edmans, A. Does the stock market fully value intangibles? Employee satisfaction and equity prices. J. Financ. Econ. 2011, 101, 621–640. [Google Scholar] [CrossRef]
- Shleifer, A.; Vishny, R.W. A Survey of Corporate Governance. J. Financ. 1997, 52, 737–783. [Google Scholar] [CrossRef]
- Kim, S.; Hernandez, I.; Nussbaum, M.A.; Lim, S. Teleoperator-Robot-Human Interaction in Manufacturing: Perspectives from Industry, Robot Manufacturers, and Researchers. IISE Trans. Occup. Ergon. Hum. Factors 2024, 12, 28–40. [Google Scholar] [CrossRef] [PubMed]
- Emma-Ikata, D.; Doyle-Kent, M. Industry 5.0 Readiness–“Optimization of the Relationship between Humans and Robots in Manufacturing Companies in Southeast of Ireland”. IFAC-PapersOnLine 2022, 55, 419–424. [Google Scholar] [CrossRef]
- Rogers, E.M. Diffusion of Innovations, 5th ed.; Free Press: New York, NY, USA, 2003. [Google Scholar]
- Matin, A.; Islam, R.; Wang, X.; Huo, H.; Xu, G. AIoT for sustainable manufacturing: Overview, challenges, and opportunities. Internet Things 2023, 24, 100901. [Google Scholar] [CrossRef]
- Pansare, R.; Yadav, G. Repurposing production operations during COVID-19 pandemic by integrating Industry 4.0 and reconfigurable manufacturing practices: An emerging economy perspective. Oper. Manag. Res. 2022, 15, 1270–1289. [Google Scholar] [CrossRef]
- Li, Y.C.; Wang, X. Human-robot collaboration assembly line balancing considering cross-station tasks and the carbon emissions. Adv. Prod. Eng. Manag. 2024, 19, 31–45. [Google Scholar] [CrossRef]
- Rahman, M.; Khatun, F.; Jahan, I.; Devnath, R.; Bhuiyan, A.A. Cobotics: The Evolving Roles and Prospects of Next-Generation Collaborative Robots in Industry 5.0. J. Robot. 2024, 2024, 2918089. [Google Scholar] [CrossRef]
- Subramanian, S. IoT and Edge Computing for Smart Manufacturing: Architecture and Future Trends. Int. J. Eng. Comput. Sci. 2024, 13, 26504–26522. [Google Scholar] [CrossRef]
- Weiss, C.H. Evaluation: Methods for Studying Programs and Policies, 2nd ed.; Prentice Hall: Upper Saddle River, NJ, USA, 1998. [Google Scholar]
- Porter, M.E.; van der Linde, C. Toward a New Conception of the Environment-Competitiveness Relationship. J. Econ. Perspect. 1995, 9, 97–118. [Google Scholar] [CrossRef]
- King, A.A.; Lenox, M.J. Does it Really Pay to Be Green? An Empirical Study of Firm Environmental and Financial Performance. J. Ind. Ecol. 2001, 5, 105–116. [Google Scholar] [CrossRef]
- Fama, E.F.; French, K.R. Common risk factors in the returns on stocks and bonds. J. Financ. Econ. 1993, 33, 3–56. [Google Scholar] [CrossRef]
- Fama, E.F.; French, K.R. A five-factor asset pricing model. J. Financ. Econ. 2015, 116, 1–22. [Google Scholar] [CrossRef]
- Clark, G.L.; Feiner, A.; Viehs, M. From the Stockholder to the Stakeholder: How Sustainability Can Drive Financial Outperformance. University of Oxford Working Paper, 2015.
- Sims, C.A. Macroeconomics and Reality. Econometrica 1980, 48, 1–48. [Google Scholar] [CrossRef]
- Gillan, S.L.; Koch, A.; Starks, L.T. Firms and social responsibility: A review of ESG and CSR research in corporate finance. J. Corp. Financ. 2021, 66, 101889. [Google Scholar] [CrossRef]
- Bauer, R.; Koedijk, K.; Otten, R. International evidence on ethical mutual fund performance and investment style. J. Bank. Financ. 2005, 29, 1751–1767. [Google Scholar] [CrossRef]
- Liang, H.; Renneboog, L. On the foundations of corporate social responsibility. J. Financ. 2017, 72, 853–910. [Google Scholar] [CrossRef]
- Eccles, R.G.; Ioannou, I.; Serafeim, G. The Impact of Corporate Sustainability on Organizational Processes and Performance. Manag. Sci. 2014, 60, 2835–2857. [Google Scholar] [CrossRef]
- Geissdoerfer, M.; Savaget, P.; Bocken, N.M.P.; Hultink, E.J. The Circular Economy–A new sustainability paradigm? J. Clean. Prod. 2017, 143, 757–768. [Google Scholar] [CrossRef]
- Ioannou, I.; Serafeim, G. The Consequences of Mandatory Corporate Sustainability Reporting: Evidence from China. Harv. Bus. Sch. Account. Manag. Unit Work. Pap. 2017, No. 11-100. [CrossRef]
- Ye, C.; Song, X.; Liang, Y. Corporate sustainability performance, stock returns, and ESG indicators: Fresh insights from EU member states. Environ. Sci. Pollut. Res. 2022, 29, 87680–87691. [Google Scholar] [CrossRef]
- Christensen, H.B.; Hail, L.; Leuz, C. Mandatory CSR and sustainability reporting: Economic analysis and literature review. Rev. Account. Stud. 2021, 26, 1176–1248. [Google Scholar] [CrossRef]
- Berg, F.; Kölbel, J.F.; Rigobon, R. Aggregate Confusion: The Divergence of ESG Ratings. Rev. Financ. Stud. 2022, 35, 5446–5495. [Google Scholar] [CrossRef]
- Khamisu, M.S.; Paluri, R.A. Emerging trends of environmental social and governance (ESG) disclosure research. Clean. Prod. Letters 2024, 7, 100079. [Google Scholar] [CrossRef]
- Nazir, M.; Akbar, M.; Yu, X.; Hussain, A.; Svobodová, L. Environmental, social, and governance performance as an influencing factor of financial sustainability: Evidence from the global high-tech sector. Corp. Soc. Responsib. Environ. Manag. 2024, 31, 4746–4758. [Google Scholar] [CrossRef]
- El Ghoul, S.; Guedhami, O.; Kwok, C.C.Y.; Mishra, D.R. Does corporate social responsibility affect the cost of capital? J. Bank. Financ. 2011, 35, 2388–2406. [Google Scholar] [CrossRef]
- Lacy, P.; Rutqvist, J. Waste to Wealth: The Circular Economy Advantage; Palgrave Macmillan: London, UK, 2015. [Google Scholar] [CrossRef]
- WBCSD. The Cement Sustainability Initiative: Progress report. World Business Council for Sustainable Development: Geneva, Switzerland, 2012. https://www.worldcement.com/europe-cis/19062012/cement_csi_wbcsd_report_2012_sustainability_progress/.
- Tian, Y.; Wang, J.; Hu, X.; Song, X.; Han, J.; Wang, J. Energy Prediction Models and Distributed Analysis of the Grinding Process of Sustainable Manufacturing. Micromachines 2023, 14, 1603. [Google Scholar] [CrossRef]
- Lasi, H.; Fettke, P.; Kemper, H.G.; Feld, T.; Hoffmann, M. Industry 4.0. Business Inf. Syst. Eng. 2014, 6, 239–242. [Google Scholar] [CrossRef]
- Gadekar, R.; Sarkar, B.; Gadekar, A. Model development for assessing inhibitors impacting Industry 4.0 implementation in Indian manufacturing industries: An integrated ISM-Fuzzy MICMAC approach. Int. J. Syst. Assur. Eng. Manag. 2024, 15, 646–671. [Google Scholar] [CrossRef]
- Lee, J.; Bagheri, B.; Kao, H.A. A Cyber-Physical Systems architecture for Industry 4.0-based manufacturing systems. Manuf. Letters 2015, 3, 18–23. [Google Scholar] [CrossRef]
- Rakholia, R.; Suárez-Cetrulo, A.L.; Singh, M.; Carbajo, R.S. Advancing Manufacturing Through Artificial Intelligence: Current Landscape, Perspectives, Best Practices, Challenges, and Future Direction. IEEE Access 2024, 12, 131621–131637. [Google Scholar] [CrossRef]
- Cheng, X.; Chaw, J.K.; Goh, K.M.; Ting, T.T.; Sahrani, S.; Ahmad, M.N.; Kadir, R.A.; Ang, M.C. Systematic Literature Review on Visual Analytics of Predictive Maintenance in the Manufacturing Industry. Sensors 2022, 22, 6321. [Google Scholar] [CrossRef]
- Lin, C.J.; Lukodono, R.P. Learning performance and physiological feedback-based evaluation for human–robot collaboration. Appl. Ergon. 2025, 124, 104425. [Google Scholar] [CrossRef]
- Chen, H.; Shao, H.; Deng, S.; Wang, L.; Wang, X. Comprehensive Survey of the Landscape of Digital Twin Technologies and Their Diverse Applications. Comput. Model. Eng. Sci. 2024, 138, 125–165. [Google Scholar] [CrossRef]
- Rybalskii, I.; Kruusamäe, K.; Singh, A.K.; Schlund, S. An Augmented Reality Interface for Safer Human-Robot Interaction in Manufacturing. IFAC-PapersOnLine 2024, 58, 581–585. [Google Scholar] [CrossRef]
- Khalaj, O.; Jamshidi, M.; Hassas, P.; Mašek, B.; Štadler, C.; Svoboda, J. Digital Twinning of a Magnetic Forging Holder to Enhance Productivity for Industry 4.0 and Metaverse. Processes 2023, 11, 1703. [Google Scholar] [CrossRef]
- Baldassarre, A.; Dion, J.L.; Peyret, N.; Renaud, F. Digital twin with augmented state extended Kalman filters for forecasting electric power consumption of industrial production systems. Heliyon 2024, 10, e27343. [Google Scholar] [CrossRef]
- S, P.M.T.; Nurraihan, F. The effectiveness of digital twins in reducing downtime in the manufacturing industry: A literature analysis. Int. J. Mech. Comput. Manuf. Res. 2025, 13, 113–121. [Google Scholar] [CrossRef]
- Singh, S. Manufacturing Industry: A Sustainability Perspective On Cloud And Edge Computing. J. Survey Fish. Sci. 2023, 10, 1592–1598. [Google Scholar] [CrossRef]
- Kubiak, K.; Dec, G.; Stadnicka, D. Possible Applications of Edge Computing in the Manufacturing Industry—Systematic Literature Review. Sensors 2022, 22, 2445. [Google Scholar] [CrossRef] [PubMed]
- Yang, W.; Xiao, Q.; Zhang, Y. HAR2bot: A human-centered augmented reality robot programming method with the awareness of cognitive load. J. Intell. Manuf. 2024, 35, 1985–2003. [Google Scholar] [CrossRef]
- Asaad, H.; Askar, S.; Kakamin, A.; Nayla, F. Exploring the Impact of Artificial Intelligence on Human-Robot Cooperation in the Context of Industry 4.0. Appl. Comput. Sci. 2024, 20, 138–156. [Google Scholar] [CrossRef]
- Orlando, E.M.; Nenna, F.; Zanardi, D.; Buodo, G.; Mingardi, M.; Sarlo, M.; Gamberini, L. Understanding workers’ psychological states and physiological responses during human–robot collaboration. Int. J. Human-Computer Studies 2025, 200, 103516. [Google Scholar] [CrossRef]
- Younas, M.A.; Abdullah, A.H.; Din, G.M.; Faisal, M.; Mudassar, M.; Yasir, A.B. Smart Manufacturing System Using LLM for Human-Robot Collaboration: Applications and Challenges. Eur. J. Theor. Appl. Sci. 2025, 3, 215–226. [Google Scholar] [CrossRef] [PubMed]
- Niedzielski, B.; Buła, P.; Yang, M. Hyperautomation as a vital optimization tool in organizations: Cognitive approach with the use of Euler circles. J. Electron. Bus. Digit. Econ. 2024, 3, 61–73. [Google Scholar] [CrossRef]
- Nick, G.; Zeleny, K.; Kovács, T.; Járvás, T.; Pocsarovszky, K.; Kő, A. Artificial intelligence enriched industry 4.0 readiness in manufacturing: The extended CCMS2.0e maturity model. Prod. Manuf. Res. 2024, 12, 2357683. [Google Scholar] [CrossRef]
- Chinthamu, N.; Ashish, A.; Mathiyalagan, P.; Deepa, B.R.; Kannadhasan, S.; Suganya, M. Data Mining Techniques for Predictive Maintenance in Manufacturing Industries a Comprehensive Review. ITM Web Conf., 76 (2025) 05012. [CrossRef]
- Gadekar, R.; Sarkar, B.; Gadekar, A. Key performance indicator based dynamic decision-making framework for sustainable Industry 4.0 implementation risks evaluation: Reference to the Indian manufacturing industries. Ann. Oper. Res. 2022, 318, 189–249. [Google Scholar] [CrossRef] [PubMed]
- Cibulski, L.; Schmidt, J.; Aigner, W. Reflections on Visualization Research Projects in the Manufacturing Industry. IEEE Comput. Graph. Appl. 2022, 42, 21–32. [Google Scholar] [CrossRef]
- Chen, M.; Wei, Z.; Li, L.; Zhang, K. Edge computing-based proactive control method for industrial product manufacturing quality prediction. Sci. Rep. 2024, 14, 1288. [Google Scholar] [CrossRef]
- Fan, Y.; Antonelli, D.; Simeone, A.; Bao, N. Intelligent robot assistants for the integration of neurodiverse operators in manufacturing industry. Procedia CIRP 2024, 126, 236–241. [Google Scholar] [CrossRef]
- Scholz, C.; Cao, H.L.; Imrith, E.; Roshandel, N.; Firouzipouyaei, H.; Burkiewicz, A.; Amighi, M.; Menet, S.; Sisavath, D.W.; Paolillo, A.; et al. Sensor-Enabled Safety Systems for Human–Robot Collaboration: A Review. IEEE Sens. J. 2025, 25, 65–88. [Google Scholar] [CrossRef]
- Sarkar, A. IT in manufacturing: Industry 4.0 and beyond. World J. Adv. Eng. Technol. Sci. 2025, 15, 739–746. [Google Scholar] [CrossRef]
- Bebchuk, L.A.; Cohen, A.; Ferrell, A. What Matters in Corporate Governance? Rev. Financ. Stud. 2009, 22, 783–827. [Google Scholar] [CrossRef]
- Yermack, D. Higher market valuation of companies with a small board of directors. J. Financial Economics 1996, 40, 185–211. [Google Scholar] [CrossRef]
- Eriandani, R.; Winarno, W.A. ESG and firm performance: The role of digitalization. Jurnal Akuntansi dan Investasi 2023, 24, 993–1010. [Google Scholar] [CrossRef]
- Sun, Y.; Ti, J.; Yang, F.; Chen, H.H. Blessing or Curse? The Impact of the Penetration of Industrial Robots on Green Sustainable Transformation in Chinese High-Energy-Consuming Industries. Energies 2025, 18, 684. [Google Scholar] [CrossRef]
- Habib, A.M. Does real earnings management affect a firm's environmental, social, and governance (ESG), financial performance, and total value? A moderated mediation analysis. Environ. Dev. Sustain. 2024, 26, 28239–28268. [Google Scholar] [CrossRef]
- Wooldridge, J.M. Econometric Analysis of Cross Section and Panel Data, 2nd ed.; MIT Press: Cambridge, MA, USA, 2010; https://www.jstor.org/stable/j.ctt5hhcfr. [Google Scholar]
- van Buuren, S. Flexible Imputation of Missing Data, 2nd ed.; CRC Press: Boca Raton, FL, USA, 2018. [Google Scholar] [CrossRef]
- Petersen, M.A. Estimating Standard Errors in Finance Panel Data Sets: Comparing Approaches. Rev. Financ. Stud. 2009, 22, 435–480. [Google Scholar] [CrossRef]
- Sims, C.A. Macroeconomics and Reality. Econometrica 1980, 48, 1–48. [Google Scholar] [CrossRef]
- Juškaitė, L.; Tamošiūnienė, R. Cryptocurrencies investing trends in the context of Environmental, Social and Governance. IOP Conf. Ser. Earth Environ. Sci. 2024, 1429, 012005. [Google Scholar] [CrossRef]

Table 1.
Panel Model Specification Tests Summary (subset of vars).
| Test | Statistic | P-value | Conclusion |
|---|---|---|---|
| F-test (Entity FE vs Pooled) | 0.68 | 0.935 | FE not sig or N/A |
| Hausman (Informal) | Comparison | FE: -0.004, RE: -0.002 | If F-test sig, FE preferred |
| Breusch-Pagan (Entity FE resids) | 4.5 | 0.876 | Homoskedasticity |
Table 2.
Fixed Effects Model Results for Aggregate ESG Scores and Operational Metrics.
| IV_Tested | Model_Type | Coefficient | P-Value | N_Obs | Significant_5pct |
|---|---|---|---|---|---|
| Board_Size | FE_TwoWay | 0.0018 | 0.0019 | 438 | TRUE |
| Injury_rate | FE_TwoWay | -0.0077 | 0.1593 | 438 | FALSE |
| Water_recycle | FE_TwoWay | 0 | 0.2977 | 438 | FALSE |
| Env_Score | FE_TwoWay | -0.0014 | 0.3362 | 438 | FALSE |
| Turnover_empl | FE_TwoWay | -0.0048 | 0.3417 | 438 | FALSE |
| Women_Employees | FE_TwoWay | -0.003 | 0.3971 | 438 | FALSE |
| ESG_Score | FE_TwoWay | -0.0018 | 0.4101 | 438 | FALSE |
| Social_Score | FE_TwoWay | -0.0013 | 0.4791 | 438 | FALSE |
| Water_use | FE_TwoWay | 0 | 0.6804 | 438 | FALSE |
| CO2_emissions | FE_TwoWay | 0 | 0.6862 | 438 | FALSE |
| Energy_use | FE_TwoWay | 0 | 0.7146 | 438 | FALSE |
| Gov_Score | FE_TwoWay | 0.0003 | 0.7275 | 438 | FALSE |
Note: Coefficients for Water_recycle, Energy_use, Water_use, and CO2_emissions are minimal, appearing as 0.0000 due to four-decimal-place rounding in this summary table; their full detailed output reveals non-zero values.
Table 3.
Random Effects Model Outcomes for ESG Risk Categories.
| Variable | Parameter | Std. Err. | T-stat | P-value | Lower CI | Upper CI |
|---|---|---|---|---|---|---|
| const | 0.016 | 0.2514 | 0.0636 | 0.9493 | -0.4781 | 0.5101 |
| MKT_RF | 1.4243 | 0.1284 | 11.095 | 0 | 1.172 | 1.6767 |
| SMB | 0.3261 | 0.2387 | 1.366 | 0.1727 | -0.1432 | 0.7954 |
| HML | -0.4709 | 0.2926 | -1.6097 | 0.1082 | -1.046 | 0.1041 |
| RMW | -0.4898 | 0.3797 | -1.2898 | 0.1978 | -1.2362 | 0.2566 |
| CMA | 1.3336 | 0.4765 | 2.7985 | 0.0054 | 0.3969 | 2.2703 |
| WML | -0.271 | 0.1231 | -2.2006 | 0.0283 | -0.513 | -0.0289 |
| Log_Market_cap | 0.0694 | 0.0214 | 3.2394 | 0.0013 | 0.0273 | 0.1115 |
| Log_Total_assets | -0.0718 | 0.0198 | -3.6177 | 0.0003 | -0.1108 | -0.0328 |
| FNCL_LVRG | 1.068E-06 | 0.0001 | 0.0102 | 0.9919 | -0.0002 | 0.0002 |
| RETURN_ON_ASSET | 0.0024 | 0.0045 | 0.5327 | 0.5945 | -0.0065 | 0.0113 |
| PE_RATIO | 0.0013 | 0.001 | 1.2698 | 0.2049 | -0.0007 | 0.0032 |
| ASSET_GROWTH | 0.0005 | 0.0003 | 1.6504 | 0.0996 | -8.66E-05 | 0.001 |
| Log_BVPS | -0.0064 | 0.016 | -0.3997 | 0.6896 | -0.0379 | 0.0251 |
| QUICK_RATIO | 0.0046 | 0.0161 | 0.2844 | 0.7762 | -0.0271 | 0.0363 |
| RiskCat_High | 0.045 | 0.0253 | 1.7771 | 0.0763 | -0.0048 | 0.0948 |
| RiskCat_Medium | 0.007 | 0.0224 | 0.3132 | 0.7543 | -0.0371 | 0.0511 |
Table 4.
Summary of Machine Learning Model Performance.
| Model | MSE | R2 |
| Random Forest | 0.0487 | 0.3005 |
| XGBoost | 0.0499 | 0.2835 |
Disclaimer/Publisher’s Note: The statements, opinions and data contained in all publications are solely those of the individual author(s) and contributor(s) and not of MDPI and/or the editor(s). MDPI and/or the editor(s) disclaim responsibility for any injury to people or property resulting from any ideas, methods, instructions or products referred to in the content. |
© 2025 by the authors. Licensee MDPI, Basel, Switzerland. This article is an open access article distributed under the terms and conditions of the Creative Commons Attribution (CC BY) license (http://creativecommons.org/licenses/by/4.0/).
Copyright: This open access article is published under a Creative Commons CC BY 4.0 license, which permit the free download, distribution, and reuse, provided that the author and preprint are cited in any reuse.


