Submitted:
24 February 2025
Posted:
24 February 2025
You are already at the latest version
Abstract
This document is meant to show how machine learning can analyze the raw material costs that are affecting the business operations of small-to-medium enterprises. Currently, SMEs face the challenge of rising raw material costs, cost inefficiencies and lack of predictive insights into cost management, which create problems for trying to operate a small business smoothly in Malaysia. Machine learning can help find solutions to those operational problems through using regression to analyze and forecast the costs of raw materials in general. To do that, three regression models are used which are Linear Regression (LR), Decision Tree Regression (DTR) and Random Forest Regression (RFR). By analyzing the dataset by raw material prices, it is shown that the DTR outperforms the other models in forecasting the prices of raw materials in general with an R2-score of 0.91, followed by the RFR at 0.87, and LR at 0.79. With these findings in mind, it could serve as how machine learning can help in enhancing in how SMEs can adapt to factors with the implementations of cost management strategies, helping decision-making to ensure competitiveness and profit sustainability, with the framework serving as a solution that is both practical and scalable to offer SMEs opportunities to respond to market shifts and mitigate risk.
Keywords:
I. Introduction
1. Background to the Proposed Solution
- a). Problem to be Solved and Proposed Relevant Solution Problem Identification
- Rising Raw Material Costs
- Cost Inefficiencies
- Lack of Predictive Insights into Cost Management
- Proposed Solution
- Linear Regression (LR)
- Decision Tree Regression (DTR)
- Random Forest Regression (RFR)
- Objective
- b). Compare and Discuss the Proposed Solution with Recent Exciting Solutions
- Solution 1: Walmart’s Predictive Analytics for Supply Chain Management
- Key Features:
- It employs sophisticated algorithms in cost prediction, demand forecasting, and inventory management.
- Provides real-time data updates for effectiveness in decision-making.
- Decision trees and random forest models are used to predict the costs of the ingredients using past data and demand estimates.
- Concentrates on the proper control of the procurement process so that the cost of procurement is kept low.
II. Literature Review
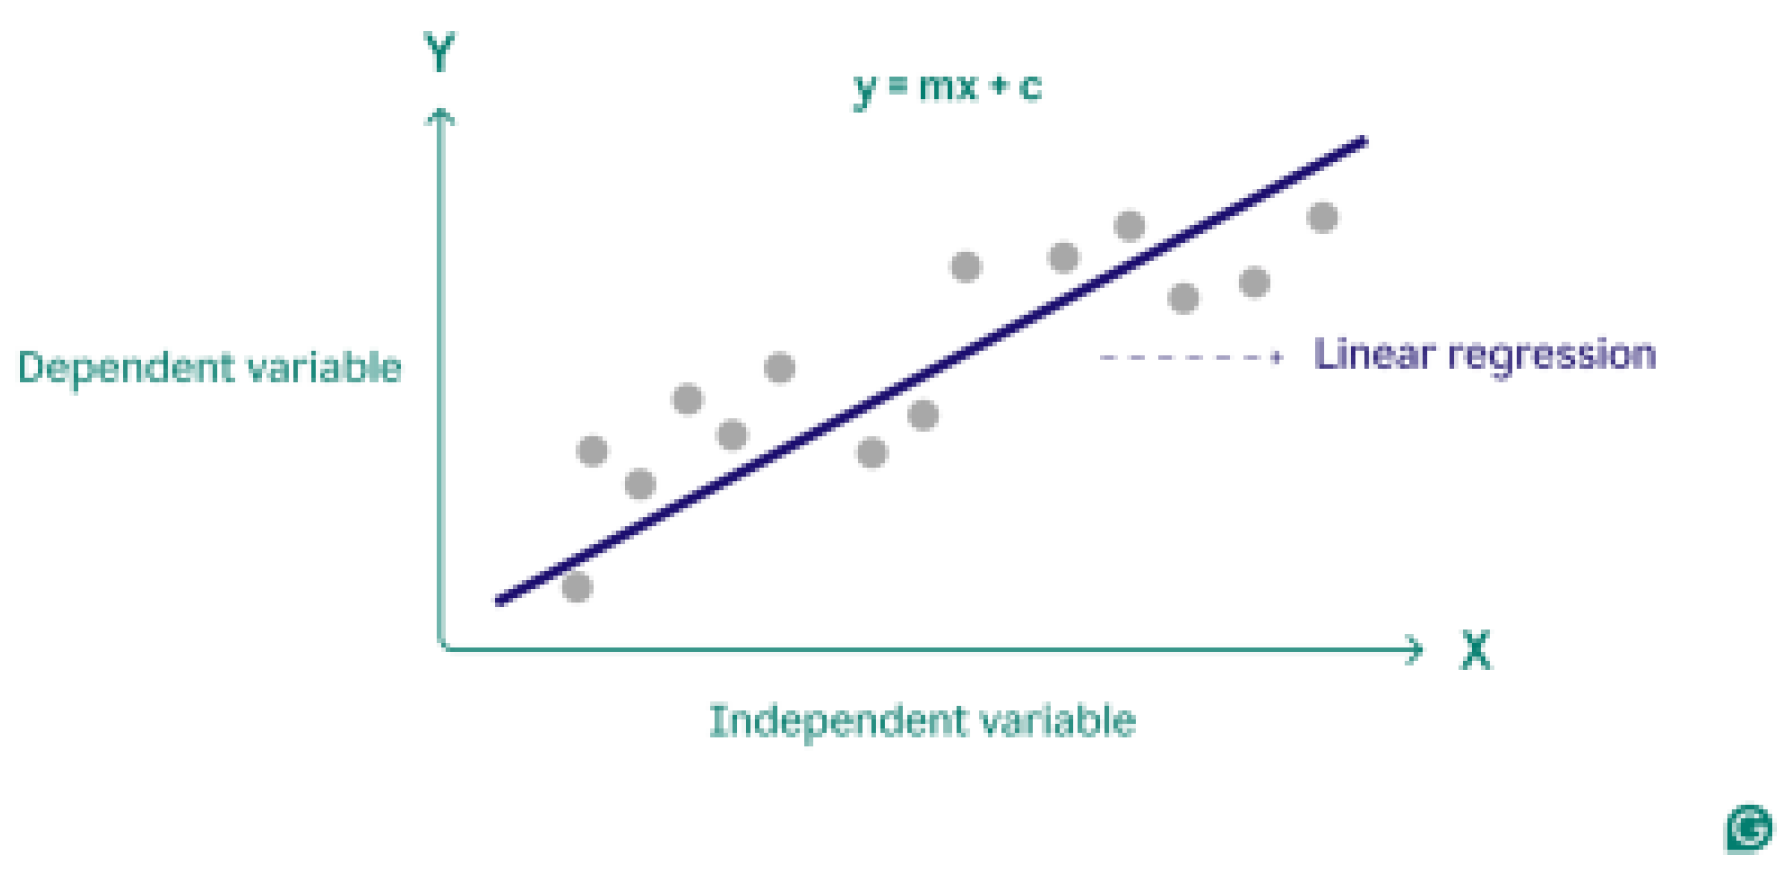
1. Linear Regression Model
2.3.1. Challenges of Random Forest Regression
2.1.1. Benefits of Using Linear Regression Model:
2.1.2. Disadvantages of Linear Regression Model:
2.2. Decision Tree Regression
2.3. Random Forest Regression
III. Analysis
3.1. Overview of Data Preprocessing
- Noise: Errors, outliers, and inconsistencies are examples of noisy data that can skew learning and impair model performance. (Arinze, 2024)
3.2. Data Preprocessing into Action
3.2.1. Data Acquisition
3.2.2. Exploratory Data Analysis
- BULAN: representing the months
- TARIKH: representing the day of the month
- BAHAN: representing the item that was purchased
- CATATAN: representing the location of where the item was purchased
- JUMLAH: representing the cost of the item that was purchased
- KATEGORI: classifying what kind of item that was bought, either as “BAHAN MENTAH” (raw materials) or “LAIN-LAIN” (others).
3.2.3. Handling Missing Values
3.2.4. Data Encoding
3.3. Machine Learning
3.3.1. Dataset Splitting
3.3.2. Model Fitting
- Linear Regression:
- Decision Tree Regression:
- Random Forest Regression:
3.3.3. Model Evaluation
- Mean Squared Error (MSE): measures the closeness between a regression line to its data points. A lower score indicates a better performance. (Gupta, 2024)
- R2 score: How well the machine learning model interprets the data that is observed. A high r-squared scored indicates the best performance, but it is not necessarily good as it may indicate problems in the dataset, such as overfitting or underfitting. (Taylor, 2024)
- Mean Absolute Error (MAE): measures the overall accuracy of the machine learning model used. The lower the score, the better it can align with predictions. (Ahmed, 2023)
3.3.3. Performance Visualization
IV. Result and Discussion
4.1.1. Reporting and Visualization of the Proposed Solution
4.1.2. In Detailed Steps Taken in the Report (Name WIP)
- Utilizes tabular summaries to show encoded and cleaned data typically used to handle missing values in the dataset if there were any.
- Model Evaluation Report
- As seen in Table 1 this is typically used to evaluate a model in our case we utilize it to obtain the mean squared error score, R2 score, and mean absolute error score which all together should allow us to evaluate how each of the models performed.
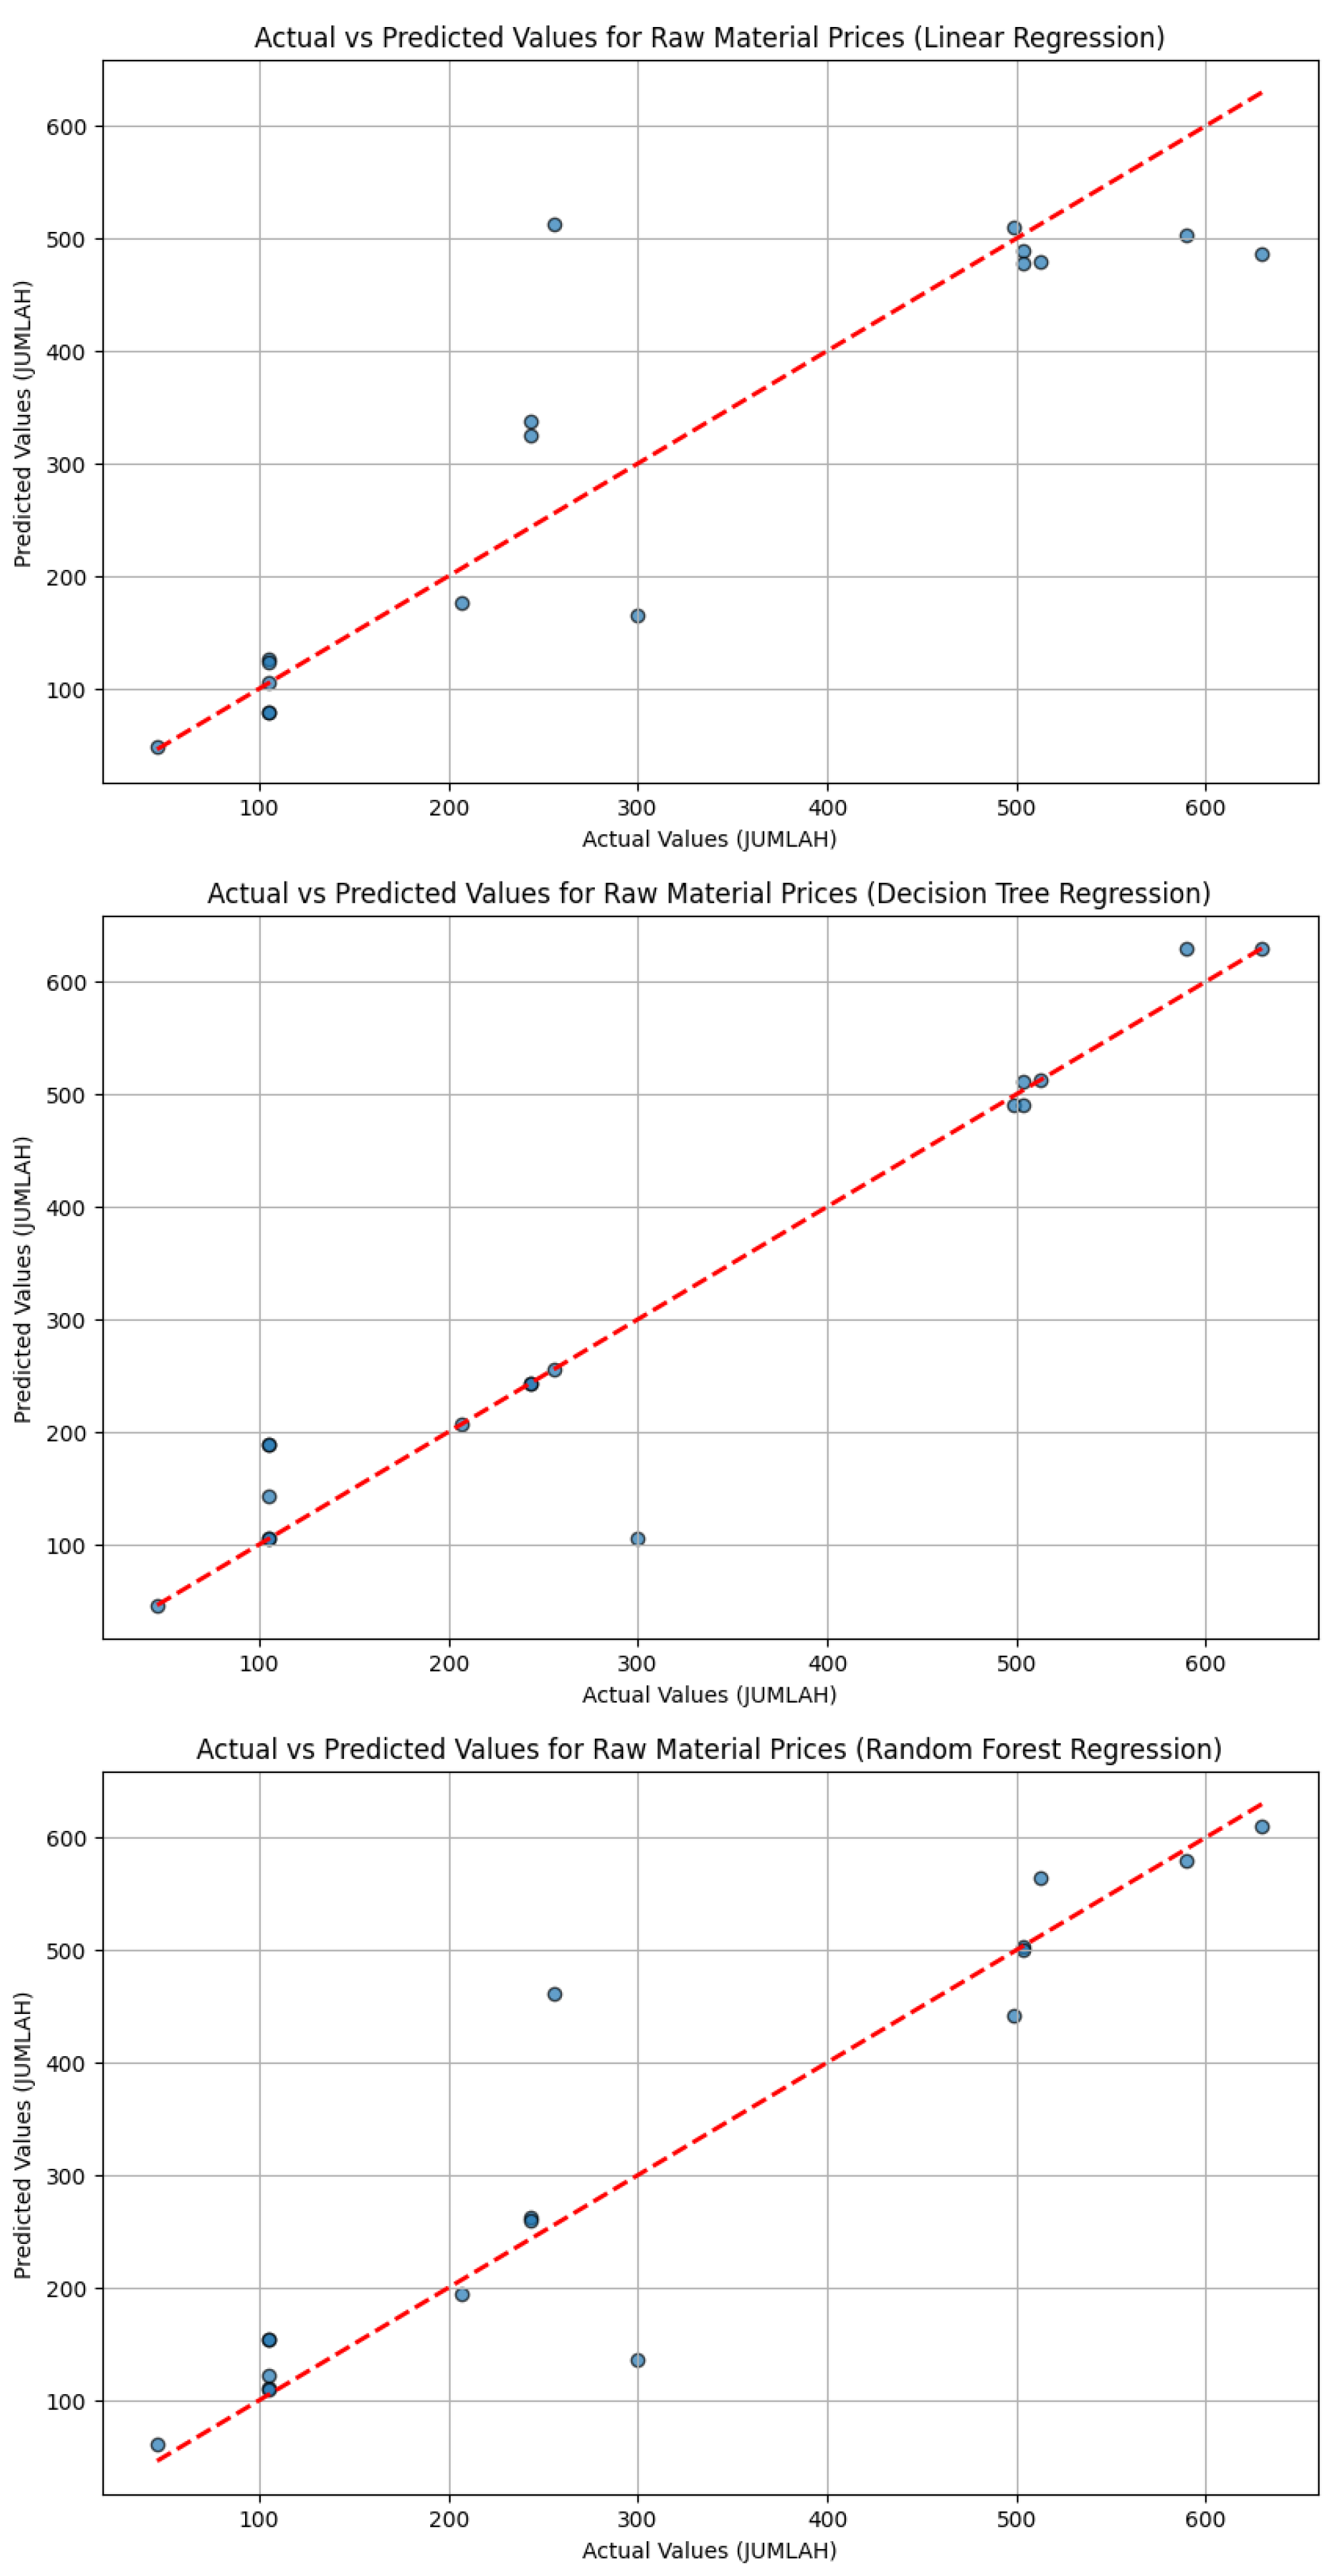
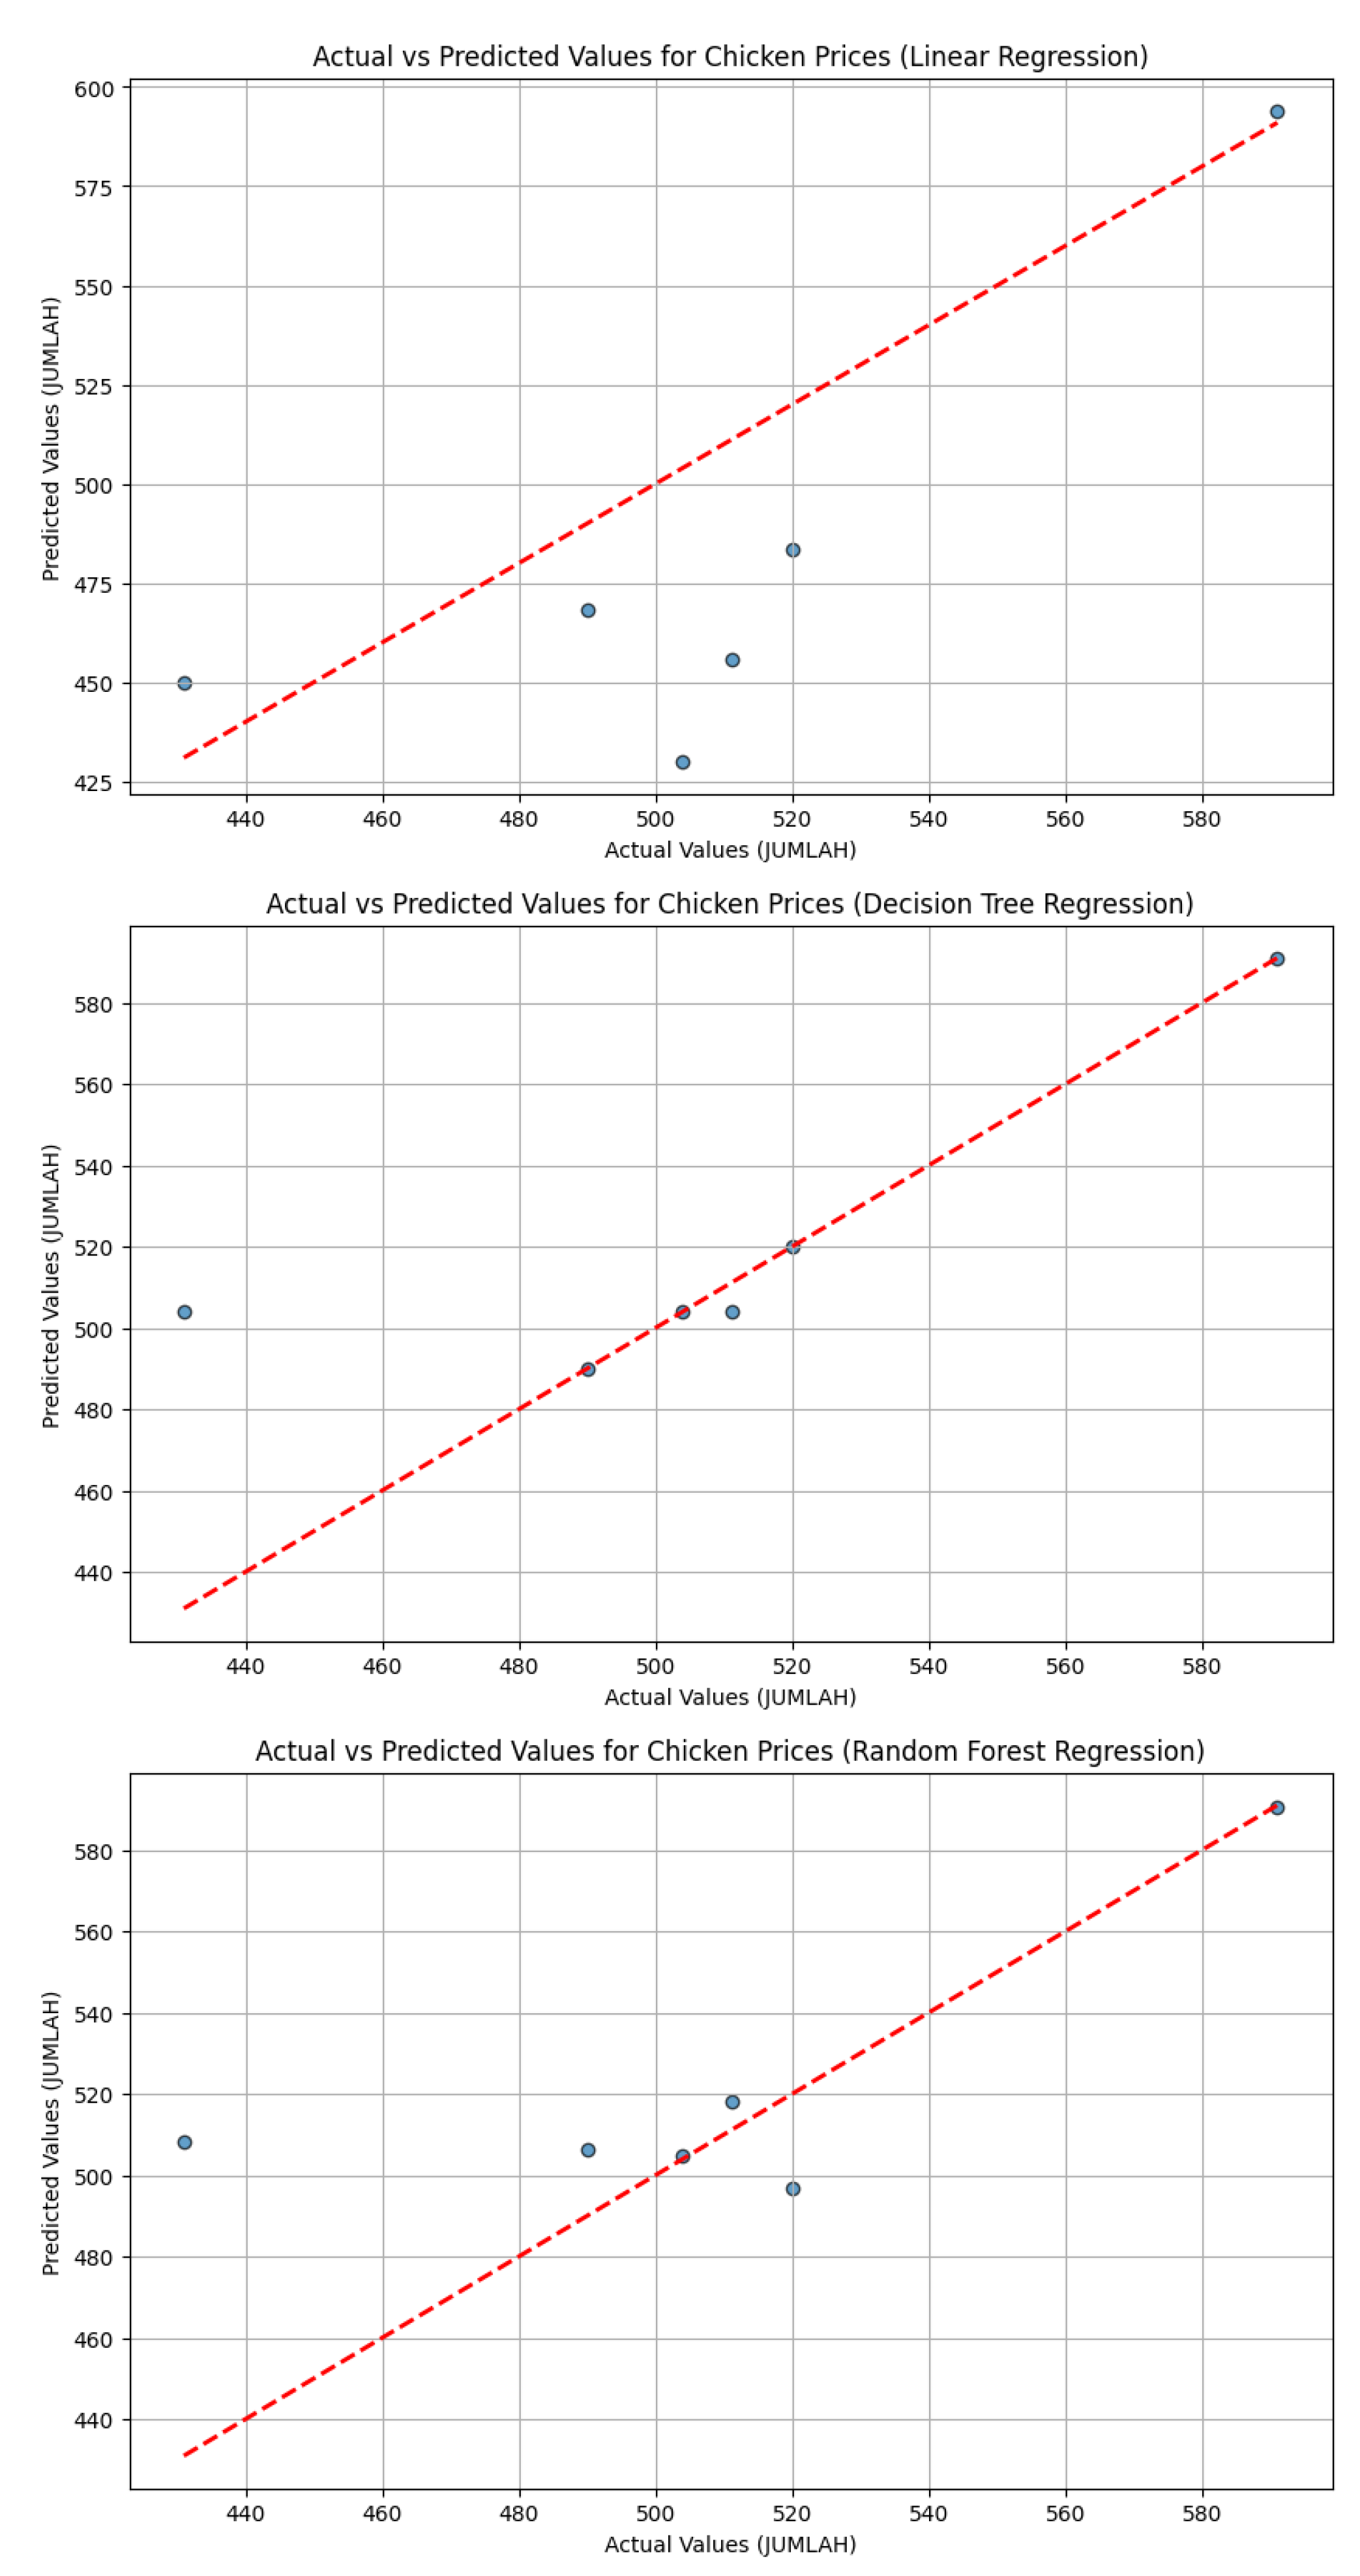
- Shown in Figure 2 these scatter plots are utilized to compare the actual and predicted values obtained from the trained machine-learning models. These graphs should help SMEs interpret complex data which in hand helps them in their decision-making for their business model/plan.
4.2.1. Tools and Used for Reporting and Visualization
-
Matplotlib (“import matplotlib.pyplot as plt”)
- This library is mainly used to provide a comprehensive visualization aid that are either in a static form, animated form, or an interactive form. An example of matplotlib usage is the graphs in Figure 3 where it is used to make scatter plots and line plots and can be utilized to show the predicted against the actual price of the raw materials.
-
Seaborn (“import seaborn as sns”)
- This is a library used to create statistical graphs. It in a way functions similarly to matplotlib except it is way more focused on the statistical graph side.
-
Pandas DataFrame (“import pandas as pd”)
- Is a type of library used in importing the dataset which will be used as the training info for the machine-learning model as well as used in helping display evaluation metrics of the model’s performance.
-
Google Colab Compiler
- Used in sharing the progress of the code is a cloud-based platform mainly where all the codes are viewed and tracked for progress in the group. Used by everyone in the group to get an understanding of the code as well as discuss and provide solutions in the case of any error occurring within the codes.

| Model | Mean Squared Error | R2 score | Mean Absolute Error |
| Linear Regression | 1780.37 | 0.20 | 34.88 |
| Decision Tree Regression | 894.86 | 0.60 | 13.38 |
| Random Forest Regression | 1135.72 | 0.49 | 20.79 |
V. Conclusions
Acknowledgment
References
- Ahmed, M. W. (2023, August 24). Understanding mean absolute error (MAE) in regression: A practical guide. Medium. https://medium.com/@m.waqar.ahmed/understanding-mean-absolute-error-mae-in-regression-a-practical-guide-26e80ebb97df.
- AIML. (2024). What are the advantages and disadvantages of random forest? AIML. https://aiml.com/what-are-the-advantages-and-disadvantages-of-random-forest/.
- Arinze, C. P. (2024, November 25). Effective strategies for handling noisy data in machine learning. Medium. https://medium.com/@InsightCoder/effective-strategies-for-handling-noisy-data-in-machine-learning-79f02f216b63.
- Brownlee, J. (2020). Train-test split for evaluating machine learning algorithms. Machine Learning Mastery. https://machinelearningmastery.com/train-test-split-for-evaluating-machine-learning-algorithms/.
- García, S., Luengo, J., & Herrera, F. (2014). Data preprocessing in data mining. Springer International Publishing. [CrossRef]
- GeeksforGeeks. (2024). Linear regression in machine learning. GeeksforGeeks. https://www.geeksforgeeks.org/ml-linear-regression/#cost-function-for-linear-regression.
- GeeksforGeeks. (2024). Decision tree. GeeksforGeeks. https://www.geeksforgeeks.org/decision-tree/.
- GeeksforGeeks. (2024). Random forest regression in Python. GeeksforGeeks. https://www.geeksforgeeks.org/random-forest-regression-in-python/.
- Grammarly. (2024). What is linear regression in machine learning? Grammarly. https://www.grammarly.com/blog/ai/what-is-linear-regression/.
- Gupta, A. (2024). Mean squared error: Overview, examples, concepts, and more. Simplilearn. https://www.simplilearn.com/tutorials/statistics-tutorial/mean-squared-error.
- IBM. (n.d.). What is linear regression? IBM. https://www.ibm.com/topics/linear-regression.
- IBM. (n.d.). What is random forest? IBM. https://www.ibm.com/think/topics/random-forest.
- Kanade, V. (2023). What is linear regression? Types, equation, examples, and best practices for 2022. Spiceworks. https://www.spiceworks.com/tech/artificial-intelligence/articles/what-is-linear-regression/.
- Raut, O. (2022, January 6). Data pre-processing - Machine learning concepts. Medium. https://medium.com/machine-learning-concepts/data-pre-processing-edfc1eecd0c2.
- Taylor, S. (2024). R-Squared. Corporate Finance Institute. https://corporatefinanceinstitute.com/resources/data-science/r-squared/.
- Viswa. (2024). Unveiling decision tree regression: Exploring its principles, implementation. Medium. https://medium.com/@vk.viswa/unveiling-decision-tree-regression-exploring-its-principles-implementation-beb882d756c6.
- Wilson, R. (2024, April 17). Strategies to mitigate high raw material cost impact. AuditComply. https://www.auditcomply.com/2024/04/17/strategies-to-mitigate-high-raw-material-cost-impact/.
- Gill, S. H., Razzaq, M. A., Ahmad, M., Almansour, F. M., Haq, I. U., Jhanjhi, N. Z., ... & Masud, M. (2022). Security and privacy aspects of cloud computing: a smart campus case study. Intelligent Automation & Soft Computing, 31(1), 117-128. [CrossRef]
- Muzafar, S., & Jhanjhi, N. Z. (2020). Success stories of ICT implementation in Saudi Arabia. In Employing Recent Technologies for Improved Digital Governance (pp. 151-163). IGI Global.
- Shah, I. A., Jhanjhi, N. Z., & Laraib, A. (2023). Cybersecurity and blockchain usage in contemporary business. In Handbook of Research on Cybersecurity Issues and Challenges for Business and FinTech Applications (pp. 49-64). IGI Global.
- Lee, S., Abdullah, A., & Jhanjhi, N. Z. (2020). A review on honeypot-based botnet detection models for smart factory. International Journal of Advanced Computer Science and Applications, 11(6). [CrossRef]
- Attaullah, M., Ali, M., Almufareh, M. F., Ahmad, M., Hussain, L., Jhanjhi, N., & Humayun, M. (2022). Initial stage COVID-19 detection system based on patients’ symptoms and chest X-ray images. Applied Artificial Intelligence, 36(1), 2055398. [CrossRef]
- Aldughayfiq, B., Ashfaq, F., Jhanjhi, N. Z., & Humayun, M. (2023). Explainable AI for retinoblastoma diagnosis: interpreting deep learning models with LIME and SHAP. Diagnostics, 13(11), 1932. [CrossRef]
- Kumar, M. S., Vimal, S., Jhanjhi, N. Z., Dhanabalan, S. S., & Alhumyani, H. A. (2021). Blockchain based peer to peer communication in autonomous drone operation. Energy Reports, 7, 7925-7939. [CrossRef]
- Aherwadi, N., Mittal, U., Singla, J., Jhanjhi, N. Z., Yassine, A., & Hossain, M. S. (2022). Prediction of fruit maturity, quality, and its life using deep learning algorithms. Electronics, 11(24), 4100. [CrossRef]
- Jena, K. K., Bhoi, S. K., Malik, T. K., Sahoo, K. S., Jhanjhi, N. Z., Bhatia, S., & Amsaad, F. (2022). E-learning course recommender system using collaborative filtering models. Electronics, 12(1), 157. [CrossRef]
- Jhanjhi, N. Z., Humayun, M., & Almuayqil, S. N. (2021). Cyber security and privacy issues in industrial internet of things. Computer Systems Science & Engineering, 37(3). [CrossRef]
- Babbar, H., Rani, S., Masud, M., Verma, S., Anand, D., & Jhanjhi, N. (2021). Load balancing algorithm for migrating switches in software-defined vehicular networks. Comput. Mater. Contin, 67(1), 1301-1316. [CrossRef]
- Alferidah, D. K., & Jhanjhi, N. Z. (2020, October). Cybersecurity impact over bigdata and iot growth. In 2020 International Conference on Computational Intelligence (ICCI) (pp. 103-108). IEEE.
- Alkinani, M. H., Almazroi, A. A., Jhanjhi, N. Z., & Khan, N. A. (2021). 5G and IoT based reporting and accident detection (RAD) system to deliver first aid box using unmanned aerial vehicle. Sensors, 21(20), 6905. [CrossRef]
- Alex, S. A., Jhanjhi, N. Z., Humayun, M., Ibrahim, A. O., & Abulfaraj, A. W. (2022). Deep LSTM model for diabetes prediction with class balancing by SMOTE. Electronics, 11(17), 2737. [CrossRef]
- Fatima-tuz-Zahra, N. Jhanjhi, S. N. Brohi, N. A. Malik and M. Humayun, “Proposing a Hybrid RPL Protocol for Rank and Wormhole Attack Mitigation using Machine Learning,” 2020 2nd International Conference on Computer and Information Sciences (ICCIS), Sakaka, Saudi Arabia, 2020, pp. 1-6. [CrossRef]
| Model | Mean Squared Error | R2 score | Mean Absolute Error |
| Linear Regression | 7859.67 | 0.79 | 59.43 |
| Decision Tree Regression | 3263.07 | 0.91 | 27.69 |
| Random Forest Regression | 4906.82 | 0.87 | 41.58 |
Disclaimer/Publisher’s Note: The statements, opinions and data contained in all publications are solely those of the individual author(s) and contributor(s) and not of MDPI and/or the editor(s). MDPI and/or the editor(s) disclaim responsibility for any injury to people or property resulting from any ideas, methods, instructions or products referred to in the content. |
© 2025 by the authors. Licensee MDPI, Basel, Switzerland. This article is an open access article distributed under the terms and conditions of the Creative Commons Attribution (CC BY) license (http://creativecommons.org/licenses/by/4.0/).


