

Submitted:
18 August 2023
Posted:
18 August 2023
You are already at the latest version
Abstract
The capability of extracting information and analyze it into a common format is essential for performing predictions, comparing projects through cost benchmarking, and for having a deeper understanding of the project costs. However, the lack of standardization and the manual inclusion of the data makes this process very time-consuming, unreliable, and inefficient. To tackle this problem, a novel approach with a big impact is presented combining the benefits of data mining, statistics, and machine learning to extract and analyze the information related to railway costs infrastructure data. To validate the suggested approach, data from 23 real historical projects from the client network rail was extracted, allowing their costs to be comparable. Finally, some machine learning and data analytics methods were implemented to identify the most relevant factors allowing for costs benchmarking. The presented method proves the benefits of data extraction being able to gather, analyze and benchmark each project in an efficient manner, and deeply understand the relationships and the relevant factors that matter in infrastructure costs.
Keywords:
data extraction
; data mining
; railway infrastructure costs
; infrastructure costs data analysis
; cost analysis
1) Introduction
The lack of standardization in railway infrastructure costs projects provokes data to be stored in different formats and structures. This is greatly amplified when comparing data from different organizations (Soibelman et al., 2008). This issue makes more difficult and unreliable the decision-making process since it does not leave room for comparison and analysis (Fereshtehnejad & Shafieezadeh, 2018).
Data extraction and data mining are technologies that offer great potential on this field since they can provide many benefits: They allow for a better comparison and analysis, they are an efficient and cost-effective solution, and they help companies to gather reliable information.
However, real projects demand big amounts of information be extracted systematically. When the process of data gathering happens manually, many limitations appear such as time inefficiencies, and subjectivity as the classifications are based on human judgement, and the process becomes error prone. (Schonlau et al., 2019).
The capability of data mining for automatization offers great potential for overcoming all these pitfalls. Allowing to make a robust, unbiased, and efficient system where the more data is being handled the more benefits in efficiency and data analysis will be obtained (Wang et al., 2018).
Different approaches have been raised in this field. Unfortunately, none of them targets railway costs infrastructure data which highlights the novelty of the presented method. The approach of (Soibelman et al., 2008) proves the lack of standardization by analyzing a wide variety of data structures researching infrastructure documents and performing deep text analysis. As constructive criticism, it could be said that the scope of the method becomes too wide without allowing to delve very deeply into each aspect. Alternatively, (Miller & Meggers, 2017) presents a framework combining the capabilities of data mining and machine learning to predict different parameters for non-residential buildings.
To contribute to the field, a novel method is presented mainly composed of three sequential processes: Data extraction, where the documentation is being analyzed and the existing information is parsed to fit a common standard. Data merging, where the different types of information are being combined, and data analytics where the main factors that matter in infrastructure costs are being identified.
Thus, a novel method is presented based on the application of data mining and machine learning to extract and analyze the existent information coming from 23 different CAF (Cost Analysis Forms) input files which a big variety of information and structures. The suggested approach was able to increase the efficiency in the processes of data gathering and analysis and demonstrating the benefits of automatic data extraction and analysis with practical implementation.
2) Related work
Data mining and machine learning offer great benefits and strong capabilities to cope with the lack of standardization and the manual inclusion of data in railway infrastructure costs projects. It is important to point out that to our knowledge there are no other methods for performing automatic data extraction on railway infrastructure costs implying a high novelty on the paper. There have been found however some other related paper where it is possible to learn from.
The related literature has been classified in three categories: Firstly, the most relevant studies that implement data science and machine learning in infrastructure costs will be mentioned. Secondly, the closest related studies on railway infrastructures will be assessed. Finally, the strongly related studies that implemented data mining on similar scenarios will be commented on.
2.1) Data science and machine learning on infrastructure costs
To summarize the most relevant literature in this category, Table 1 is presented showing the reference, the main aim, and the way of approaching it for all relevant studies implementing whether data science or machine learning on infrastructure costs with similar approaches.
Firstly, the paper (Desai, n.d.) consists of a method for improving the data classification inside construction projects with the usage of the variable’s correlation and machine learning. For its validation, the study presents a practical scenario with a clear scope-
Alternatively, the approach presented in (Zhong, n.d.) encompasses a method for optimizing risks and evaluating the model through rough set theory. Finally, a decision tree is implemented for optimization purposes. The approach becomes easily reproducible with strong results that demonstrate the efficacy of the approach.
Additionally, other studies focus on infrastructure costs data analysis, such as (Soibelman et al., 2008) where a wide range of data structures are being assessed, as the main benefit, the method avoids common mistaking through the usage of data mining and construction knowledge.
Finally, (Chen et al., 2019) presents a method for automating the cost analysis, benchmarking, and prediction with the usage of machine learning and the surveyor’s knowledge. Their robust results explained in detail prove the efficacy of the suggested method.
2.2) Railway infrastructure studies
The most related studies inside the field of railway infrastructures have been gathered on Table 2 where it is possible to see the reference, the main goal, and the way of approaching it for each of them.
Firstly, in (Ji et al., n.d.) a new method is suggested for a better assessment of costs in railway infrastructures considering the type of train by promoting efficiency and creating a framework for allocating costs in an automatized and systematic manner.
Secondly,(Caíno-Lores et al., 2017) builds a simulation model with a previously given set of objectives and restrictions to support the execution of thousands of scenarios in a scalable, efficient, and fault-tolerance approach that is being deployed in a cloud computing environment for time efficiency purposes. Although the results are difficult to validate since they are performing simulation the model shows potential for saving 88.20% of all the costs presented in the simulation.
Thirdly, (Durazo-Cardenas et al., 2018) builds a proof of concept for maintenance scheduling merging data from railway´s condition, planning and costs with optimized intervention plans that make an added value and a great impact on costs. As a constructive criticism, it could be mentioned that the validation is a bit weak since it relies on the subjective consideration of twenty-five individuals.
Fourthly, the paper (Allan et al., 2004) presents an econometric analysis of costs, traffic, and infrastructure for the Swedish railway during the years 1999 and 2002. The missing recovery data techniques since to have a great impact on the understanding of traffic data which is however their main weakness due to the unreliability of the generated information.
Finally, (Rama & Andrews, 2016) suggests a framework to perform a whole system lifecycle costs analysis for asset management which is based on railway network performance and costs analysis. The framework seems to be able to predict not only an individual asset but also the whole infrastructure allowing for a better railway system evaluation.
2.3) Strongly related studies
To conclude, the studies that are the most related with the presented approach will be commented and assessed. Highlighting those studies that implemented data mining techniques on a similar manner.
Firstly, in (Kouris et al., 2005) an information retrieval algorithm is presented which consists of an enhancement of the previously stablished “a priori” algorithm. Their approach works as a search engine specifically implemented for making recommendations to their customers borrowed from information retrieval. Their approach has been well tested assessing not only the results but also its efficiency with synthetic and real data. As a constructive criticism it could be said that the previously stablished “a priori” algorithm was already suitable for some data categories.
Secondly, (Fan et al., 2013) suggests an event-driven data service method demonstrated with a prototype. Their approach first selects a subset of the observed properties using event-filtering technologies. To finally push the data that meets the subscription requirements on time. The results show that the proposed method can achieve actively pushing the desired data to subscribers in the shortest possible time.
Thirdly, (Deb & Zhang, 2004) presents a review of different content-based image retrieval approaches. The results show that the main challenges remain to be the image segmentation and to find semantic meanings of an image.
Finally, (Miller & Meggers, 2017) presents a two-step framework able to identify the statistics and the inner pattern of the analyzed data harnessing machine learning capabilities. Their main aim is to reduce the expert intervention to utilized measured raw data to infer different types of information of the non-residential buildings such as performance class, operational behavior or building use type. Strong results validate the method specially in the case of building operations becoming 63.6% more accurate compared to the baselines.
3) Materials and methods
The suggested method takes as input the disseminated information about railway costs infrastructures coming from 299 historical projects. The different steps of the presented approach have been summarized in Figure 1. First, the system performs data extraction from different input files mostly focusing on four data categories: project details, cost details, stage details and possession strategy. As a second step, the method performs tasks about reclassification and data merging. Finally, the result information is used to perform some data analysis and to make some useful inferences based on the given data.
3.1) Materials
For de development of the suggested method the following technologies have been used:
- Anaconda navigation version 2.2.
- The IDE (Integrated development environment) Jupyter notebook version 6.4.5.
- Python language.
- Different open-source libraries have been used from them we can highlight: “xlrd” for reading excel files or “os” for accessing some operative system capabilities.
3.2) The scenario
The input data is composed of 23 different CAF coming from real projects from the client network rail. Each input file has been developed according to the Rail Method of Measurement (RMM). They are used for breaking down the expenses of each project into a big number of assets classified among different cost categories.
The information regarding each asset is structured differently, and the attributes are classified in a distinct manner depending on the version of each file. 5 different versions can be distinguished: 1.5, 1.7, 2.0, 2.1 and 2.2. It is important to remark that there is a big gap between the versions 1.7 and 2.0, whereas the rest of them only include small modifications.
VERSIONS 1.5 AND 1.7:
The assets located on the CAF files coming from these versions are described with the following attributes:
- Tier 1: Describes costs at projects or sub-projects level for either ‘buildings’ or ‘Civil engineering’. The following categories can be found for this attribute: Buildings and property, civil engineering, electrical power plant, operational telecommunications, permanent way, railway control systems and train power systems.
- Tier 2: Describes broad ‘cost categories’ such as Acquisition Costs; Construction Costs; Renewal Costs; Operation Costs; Maintenance Costs; End of Life Costs; and Life Cycle Cost. And it takes a wider range of values: AC (OLE), AC Traction Power System, Buildings, Businesses, Canopies, Car parks and roads, DC, DC Traction Power System, Depot plant, Drainage, Earthworks, Electrical, Fencing, Level crossing, Lifts and escalators, Mechanical, Network, Operational telecoms, Plain line, Platforms, Signaling, Signaling power supplies, Station Information and Security Systems, Structures, Switches and crossings, Train sheds.
- Tier 3: Describes ‘cost groups’ covering the sub-division of cost category totals into a more detailed breakdown in each case. For instance, in construction costs category, this includes key elements such as Substructure, Structure, Preliminaries, Services and Equipment and it can take the following values: Approaches, Auto (MSL), Auto (RTL), Auxiliary Transformer, Ballast, Business Voice, Cables, Cabling and Containments, Clocks, Closed Circuit, Television, Coastal and Estuarine Defenses, Concentrator, Conductor Rail System, Control, Control System Only, Controls and Interlocking , Culverts, Customer Information Systems, Disconnectors, DNO Supply, Driver Only Operation System Components, Embarkments, Footbridges, FSP Auto Reconfigurable, FSP Manual Reconfigurable, FSP Radial Feed, Generator, GSM-R, HV Cables, HV Switchgear, HV Transformers, Interlocking Only, Level Crossing Refurbishment Treatments, Lineside Telephone, LV dc Cables, LV Switchgear, Negative Short Circuit Device, Neutral Section, OLE system, Operational Voice, Over bridges, Phones only, Power, Principal Supply Point, Protection Relays, Protection System Upgrade, Public Address, Public Address / Voice Alarm, Public Emergency Telephone System, Radio, Rail, Rail Ballast, Rail Sleepers, Rail sleepers ballast, Retaining Walls, Rock Cuttings, RTU (SCADA), Signaling System, Sleepers, Soil cuttings, Station Help Points, Structures, TNO/DNO HV Supply, Trackside Equipment Only, Transformers/Rectifiers, Transmission FTN, Transmission IP, Transmission Legacy, Tunnels, Under bridges, Uninterruptable Power Supply, User Operated, Voice Recorders, Wire Run.
- Work Type: A label that describes the work that has been done such as refurbishment, replace full or replace partial.
- Work Type code: The unique identifier code linking the work type that has been carried out.
VERSIONS 2.0, 2.1 AND 2.2:
Alternatively, the assets located on the CAF files coming from these versions are described with the following attributes:
- Primary reference: A group of eight numbers and letters uniquely identifying each asset of each project.
- Asset: A generic classification attribute which is slightly like the old Tier 1 attribute on the previous sections. The range of values that this attribute can take are the following: Buildings and property, civils (drainage - resilience), civils (drainage - earthworks), civils (drainage - track), civils (earthworks), civils (structures), electric power and plant, permanent way, railway control systems, telecommunications, train power systems.
- Structures: A more specific classification attribute slightly similar to the previous Tier 3 categories where a wider range of attributes can be distinguished: AC HV Cables, AC HV switchgear, AC HV transformer, AC overhead line equipment (OLE), AC protection Relay, AC remote terminal unit, AC transmission or distribution network operator HV supply, auxiliary transformer, bespoke color light signaling, buildings, canopies, car parks and roads, chamber, channel, coastal defenses, conductor rail heating, control system, controls and interlocking, culvert, DC conductor rail system, DC disconnectors, DC HV cables, DC HV switchgear, DC HV transformer, DC LV cables, DC LV switchgear, DC negative short circuit device, DC protection relay, DC remote terminal unit, depot plant, distribution network operator (DNO), electrical wiring and lighting system, embarkment, European train control system (ETCS), fencing, footbridges, FSP auto reconfiguration, FSO manual reconfiguration, FSP radial feed, generator, gravel drain, hot axle box detector (HABD), interlocking, level crossing, lifts and escalators, lighting, mechanical heating, mineworking’s – deep, mineworking’s – shallow, mineworking’s – surface, moving bridges, network, operational communications, over bridge, pantograph measuring system (PMS), pipe, plain line, platforms, points heating, principal supply point (PSP), pumps, ramp, remote condition monitoring (RCM), retaining wall, rock cutting, signaling cables, simple modular color light signaling, soil cutting, station information and surveillance system, switch and crossings, trackside equipment, train sheds, tunnel, under bridge, uninterruptible power supply, water tanking, wheel force measuring system.
- Work type: A label that identifies uniquely the work that has been done such as refurbishment or new building.
- Work solution: An attribute which shortly describes the work that has been carried out to accomplish the task.
3.3) The output structure
After the suggested method has been implemented. The input information has been gathered and is processed into big chunks of information. There are four different types of information within the output data structure for each project: project details, cost details, GRIP (Governance for Railway Investment Project) stage details and possession strategy whose data structures are described as follows.
PROJECT DETAILS:
The first chunk of data describes different attributes of each project including information such as the geographical region, the topography, or the project strategy for designing it and for managing it. For a better clarification Figure 2 has been included showing sample values for the first registered items in the dataset.
COST DETAILS:
Secondly, the algorithm extracts data describing costs divided into different categories such as management, design, and other costs. For clarification, Figure 3 has been included showing the values of cost details for some of the registered items as an example.
GRIP STAGE DETAILS:
GRIP Stage details contain different information regarding the project in the beginning and at the end of each GRIP stage that the different projects have went through. Due to confidentiality purposes some sample data about grip stage details will not be provided. However, a list of the attributes composing its data structure will be showed: ’CAF Title’, ’1 - Output Definition - Start’, ’1 - Output Definition - Finish’, ’2 - Pre-Feasibility - Start’, ’2 - Pre-Feasibility - Finish’, ’3 - Optioneering - Start’, ’3 - Optioneering - Finish’,’4 - Single Option Development - Start’, ’4 - Single Option Development - Finish’, ’5 - Detailed Design - Start’, ’5 - Detailed Design - Finish’, ’6 - Construct, Test & Commission - Start’, ’6 - Construct, Test & Commission - Finish’, ’7 - Scheme Handover / Handback - Start’, ’7 - Scheme Handover / Handback - Finish’, ’8 - Project Close Out - Start’, ’8 - Project Close Out - Finish’.
POSESSION STRATEGY:
Finally, some possession strategy data is being gathered out of the CAF files indicating a summary of the number of works that has been done where they are classified by the number of hours that were necessary to be carried out. For a better clarification, Figure 4 is being providing showing some sample data for the first projects registered in the dataset.
3.4) The method step by step
As stated before, the suggested method can be divided into three main steps that happen on a sequential basis: Firstly, all the different CAF files are analyzed and a data extraction process is being carried out, secondly, some merging processes and data parsing are being executed to finally provide an analysis and perform some tests to prove the benefits of data mining in the current scenario:
STEP 1: DATA EXTRACTION:
- Description: During this step, the suggested method loads iteratively each of the CAF files taken as inputs to extract inside them four different types of information: Project details, cost details, stage GRIP details and possession strategy.
- Input: The input of this step consists of the information distributed into 23 CAF files coming from real historical projects with different structure depending on their version which ranges from 1.5 until 2.3.
- Output: As a main result for this step, four different folders are being created one of them for storing the project information, the second one for project details, whereas the last two would be for GRIP stage details and possession strategy respectively. Each folder contains 299 different excel files with information extracted from the initial CAF files.
STEP 2: DATA MERGING:
- Description: During the process of data merging the data generated in the previous step is being gathered and combined, considering not only the fact that there are four types of information that will be merged into one file but also that that different versions of CAF files contain different attributes.
- Input: The input for this step would be the same as the output for the previous step consisting of four different folders each of them with 299 different files with its information extracted for each CAF.
- Output: There are two main outputs that can be distinguished for this step: On the one hand, a new folder is generated with 299 different files combining the four types of information. Alternatively, five breakdown documents are created summarizing all project depending on the existing CAF version (1.5,1.7,2.0,2.1 and 2.2)
STEP 3: DATA ANALYSIS:
- Description: As a final step, some analysis techniques are being implemented to demonstrate that converting data to a common format allows to see the whole picture and to find the relationships between the different attributes. Additionally, three different machine learning algorithms are being implemented to predict future project costs: Linear regression, lasso regression and random forest. Additionally, different machine learning algorithms are implemented.
- Input: A main input for this step all the attributes extracted in the precious step coming from 23 CAF files are combined for analysis and comparison.
- Output: As a main result some inferences will be made, and some knowledge of the current data is extracted to validate the suggested method.
4) Results
For validating the suggested method. The data coming from 23 different CAF files from real historical projects have been gathered and parsed into a common data format. The results have been materialized into a set of 88 different attributes coming from four different categories for each project. This allows the client to perform data analysis, to have a deeper knowledge of their projects and to implement machine learning to predict the future project costs.
For a better clarification of the dataset that is being handled the average project costs classified by different categories will be showed. Firstly, Figure 5 shows the average project costs depending on the region where it is possible to appreciate that those projects carried out in the midlands and in the south were meaningfully cheaper than the other three categories.
Secondly, Figure 6 shows a summary of the costs average classified by the route where the most expensive with a great difference would be Anglia followed by Western and Wales respectively.
Finally, Figure 7 shows the average of project costs classified by their main work type where it is possible to find a big gap between the three most expensive categories: Replace-full, refurbishment and new build.
The process of data gathering and reclassification into a common data format is useful not only for having a better understanding of the data but also for estimating future project costs based on the already registered ones. As a proof of that, three different machine learning algorithms have been implemented: Linear regression, Lasso regression and random forest.
To assess the accuracy of each algorithm two folds have been randomly generating using the 15% of the available data as test set and the remaining 85% as test set. The R square results of each algorithm have been gathered in Table 1 where it is possible to see that linear regression and lasso regression were only able to obtain a score of 0.83 whereas the random forest seemed to be the most accurate obtaining an average of 0.934 in both folds.

Table 1.
R square results of the three main algorithms.
| First fold | Second fold | average | |
|---|---|---|---|
| Linear regression | 0,845 | 0,832 | 0,839 |
| Lasso regression | 0,844 | 0,833 | 0,838 |
| Random Forest | 0,939 | 0,928 | 0,934 |
5) Conclusions
The presented paper describes and proves a method for extracting and parsing railway cost infrastructure data. The suggested method takes as inputs 23 CAF files from historically registered projects. Within the main challenges of the paper, it is possible to highlight the high volume of data found in each CAF and big variety of structures found on the input data that has been materialized into five different versions of the input files.
The results showed in the last step of data analysis are a prove that demonstrate the benefits of data mining. Allowing the capability for comparing projects, perform costs predictions and stablish cost benchmarking. This capability can be potentially used not only for the current dataset but also for the future projects.
It is also worth mentioning the potential for increasing the efficiency since the presented approach is completely automatized it can potentially replace the manual inclusion of data bringing an enormous benefit in terms of saving costs and time.
For the comparison with other studies, it is worth to highlight that to our knowledge there is no other automatic data mining system applied to railway cost infrastructure data. There have been however other approaches that used data mining such us (Kouris et al., 2005) where a two-step approach is presented with the main difference that in this case, they seek for the relationship between the assets instead of gathering the information and analyzing it.
Alternatively, in (Miller & Meggers, 2017) implements data retrieval techniques and machine learning for cost infrastructures. However, their approach is focused on predicting the future costs of the infrastructures based on the prices of the already registered data. Additionally, their approach is not based on railway infrastructure but on building data.
The main inference that we can extract for this paper is that data mining, machine learning and data science are very powerful tools that when implemented into railways cost infrastructure data, they can overcome the issues provoked for the manual inclusion of data and the lack of standardization allowing some room for comparison and cost benchmarking.
Acknowledgements
This research was supported by the UK Department for Transport and received funding under the Innovate UK project “Transport Infrastructure Efficiency Strategy Living Lab (45382)”
References
- Allan, J. J., Wessex Institute of Technology., & International Conference on Computer Aided Design, M. and O. in the R. and O. A. M. T. S. (9th : 2004 : D. (2004). Swedish Data For Railway Infrastructure Maintenance And Renewal Cost Modelling. WIT Transactions on The Built Environment, 74, 1015. [CrossRef]
- Caíno-Lores, S., García, A., García-Carballeira, F., & Carretero, J. (2017). Efficient design assessment in the railway electric infrastructure domain using cloud computing. Integrated Computer-Aided Engineering, 24(1), 57–72. [CrossRef]
- Chen, D., Hajderanj, L., & Fiske, J. (2019). Towards automated cost analysis, benchmarking and estimating in construction: A machine learning approach. Multi Conference on Computer Science and Information Systems, MCCSIS 2019 - Proceedings of the International Conferences on Big Data Analytics, Data Mining and Computational Intelligence 2019 and Theory and Practice in Modern Computing 2019, 85–91. [CrossRef]
- Deb, S., & Zhang, Y. (2004). An overview of content-based image retrieval techniques. Proceedings - International Conference on Advanced Information Networking and Application (AINA), 1, 59–64. [CrossRef]
- Desai, V. S. Desai, V. S. (n.d.). Improved Decision Tree Methodology for the Attributes of Unknown or Uncertain Characteristics-Construction Project Prospective. The International Journal of Applied Management and Technology.
- Durazo-Cardenas, I., Starr, A., Turner, C. J., Tiwari, A., Kirkwood, L., Bevilacqua, M., Tsourdos, A., Shehab, E., Baguley, P., Xu, Y., & Emmanouilidis, C. (2018). An autonomous system for maintenance scheduling data-rich complex infrastructure: Fusing the railways’ condition, planning and cost. Transportation Research Part C: Emerging Technologies, 89, 234–253. [CrossRef]
- Fan, M., Fan, H., Chen, N., Chen, Z., & Du, W. (2013). Active on-demand service method based on event-driven architecture for geospatial data retrieval. Computers and Geosciences, 56, 1–11. [CrossRef]
- Fereshtehnejad, E., & Shafieezadeh, A. (2018). A multi-type multi-occurrence hazard lifecycle cost analysis framework for infrastructure management decision making. Engineering Structures, 167, 504–517. [CrossRef]
- Ji, C., Conferences, C. X.-E. W. of, & 2021, undefined. (n.d.). New method for allocating high-speed railway infrastructure costs among train types. E3s-Conferences.Org. [CrossRef]
- Kouris, I. N., Makris, C. H., & Tsakalidis, A. K. (2005). Using Information Retrieval techniques for supporting data mining. Data & Knowledge Engineering, 52(3), 353–383. [CrossRef]
- Miller, C., & Meggers, F. (2017). Mining electrical meter data to predict principal building use, performance class, and operations strategy for hundreds of non-residential buildings. Energy and Buildings, 156, 360–373. [CrossRef]
- Rama, D., & Andrews, J. D. (2016). Railway infrastructure asset management: the whole-system life cost analysis. IET Intelligent Transport Systems, 10(1), 58–64. [CrossRef]
- Schonlau, M. , Gweon, H., & Wenemark, M. (2019). Automatic Classification of Open-Ended Questions: Check-All-That-Apply Questions: Https://Doi.Org/10.1177/0894439319869210, 39(4), 562–572. [CrossRef]
- Soibelman, L., Wu, J., Caldas, C., Brilakis, I., & Lin, K. Y. (2008). Management and analysis of unstructured construction data types. Advanced Engineering Informatics, 22(1), 15–27. [CrossRef]
- Wang, Y., Kung, L. A., & Byrd, T. A. (2018). Big data analytics: Understanding its capabilities and potential benefits for healthcare organizations. Technological Forecasting and Social Change, 126, 3–13. [CrossRef]
- Zhong, Y. (n.d.). Research on Construction Engineering Project Management Optimization Based on C4.5 Improved Algorithm. [CrossRef]
Figure 1.
Sketch of the different iterative processes that composed the suggested method.
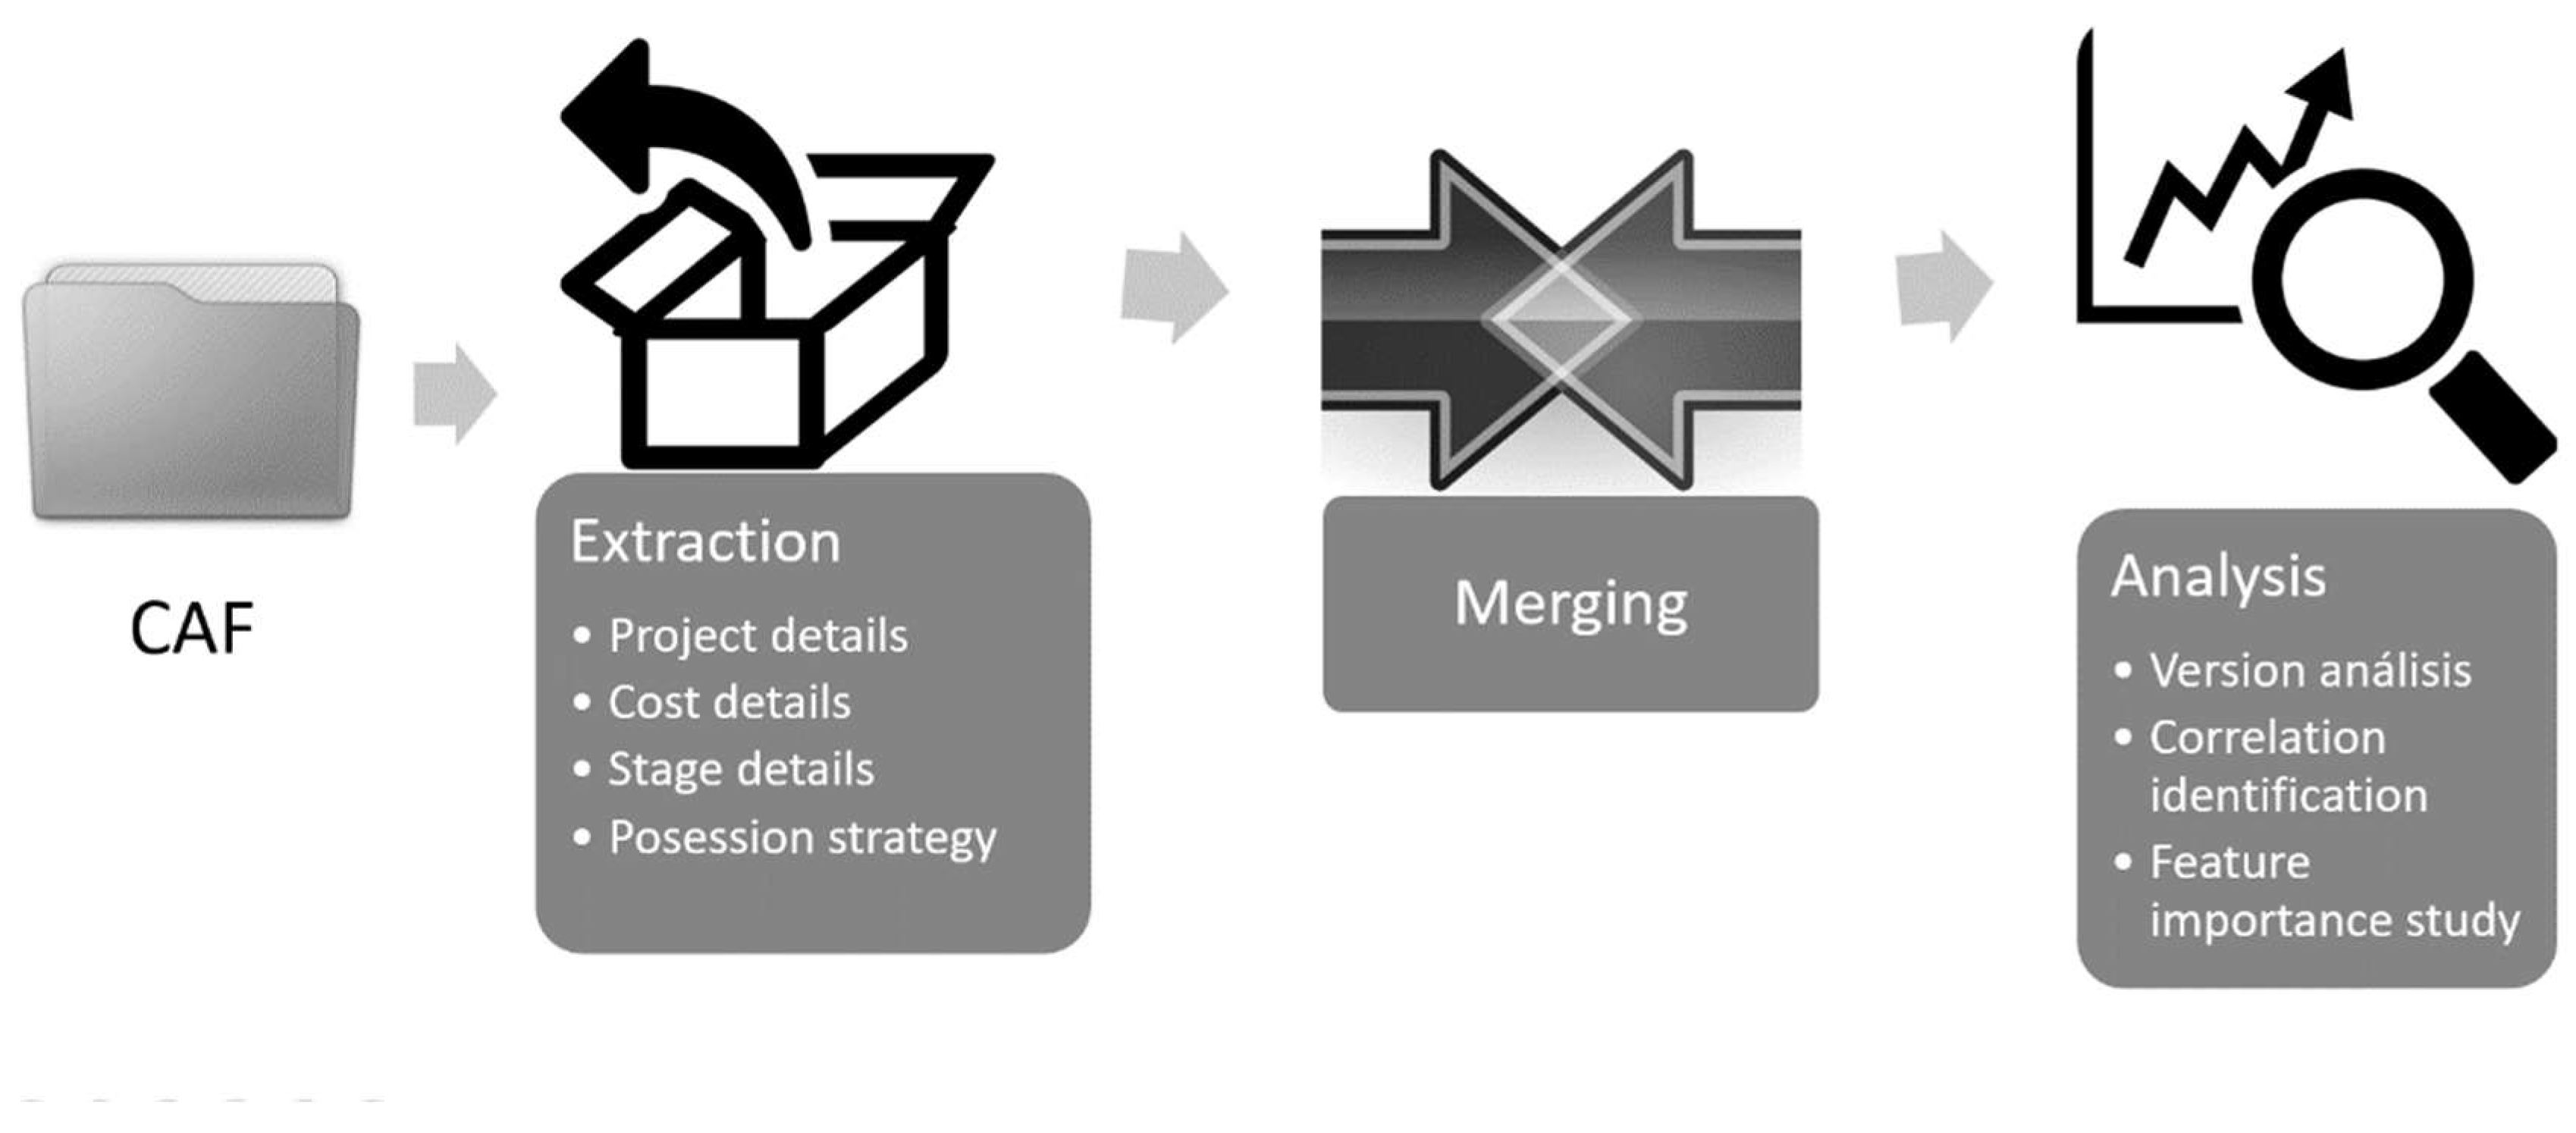
Figure 2.
Values showing the first rows containing project details data.
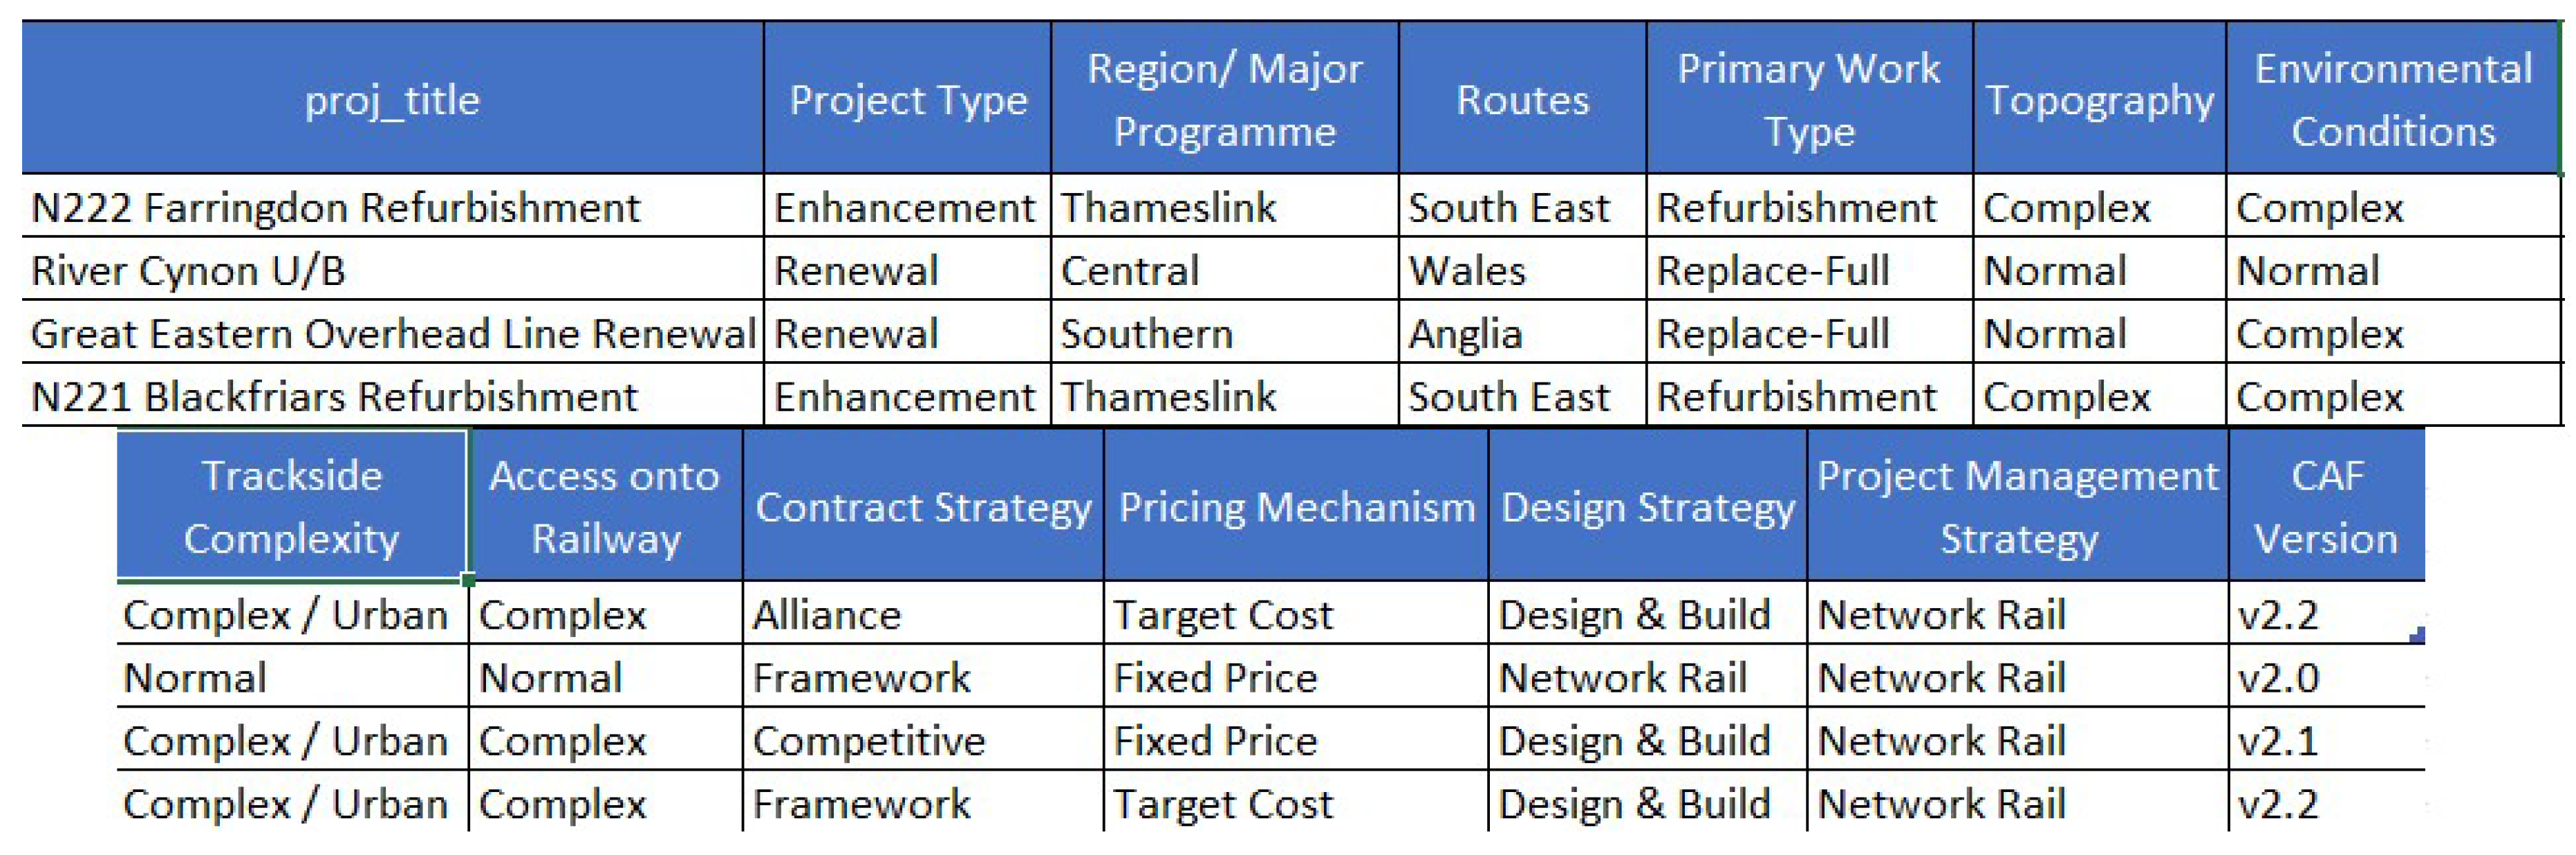
Figure 3.
Values showing the first rows containing cost details data.
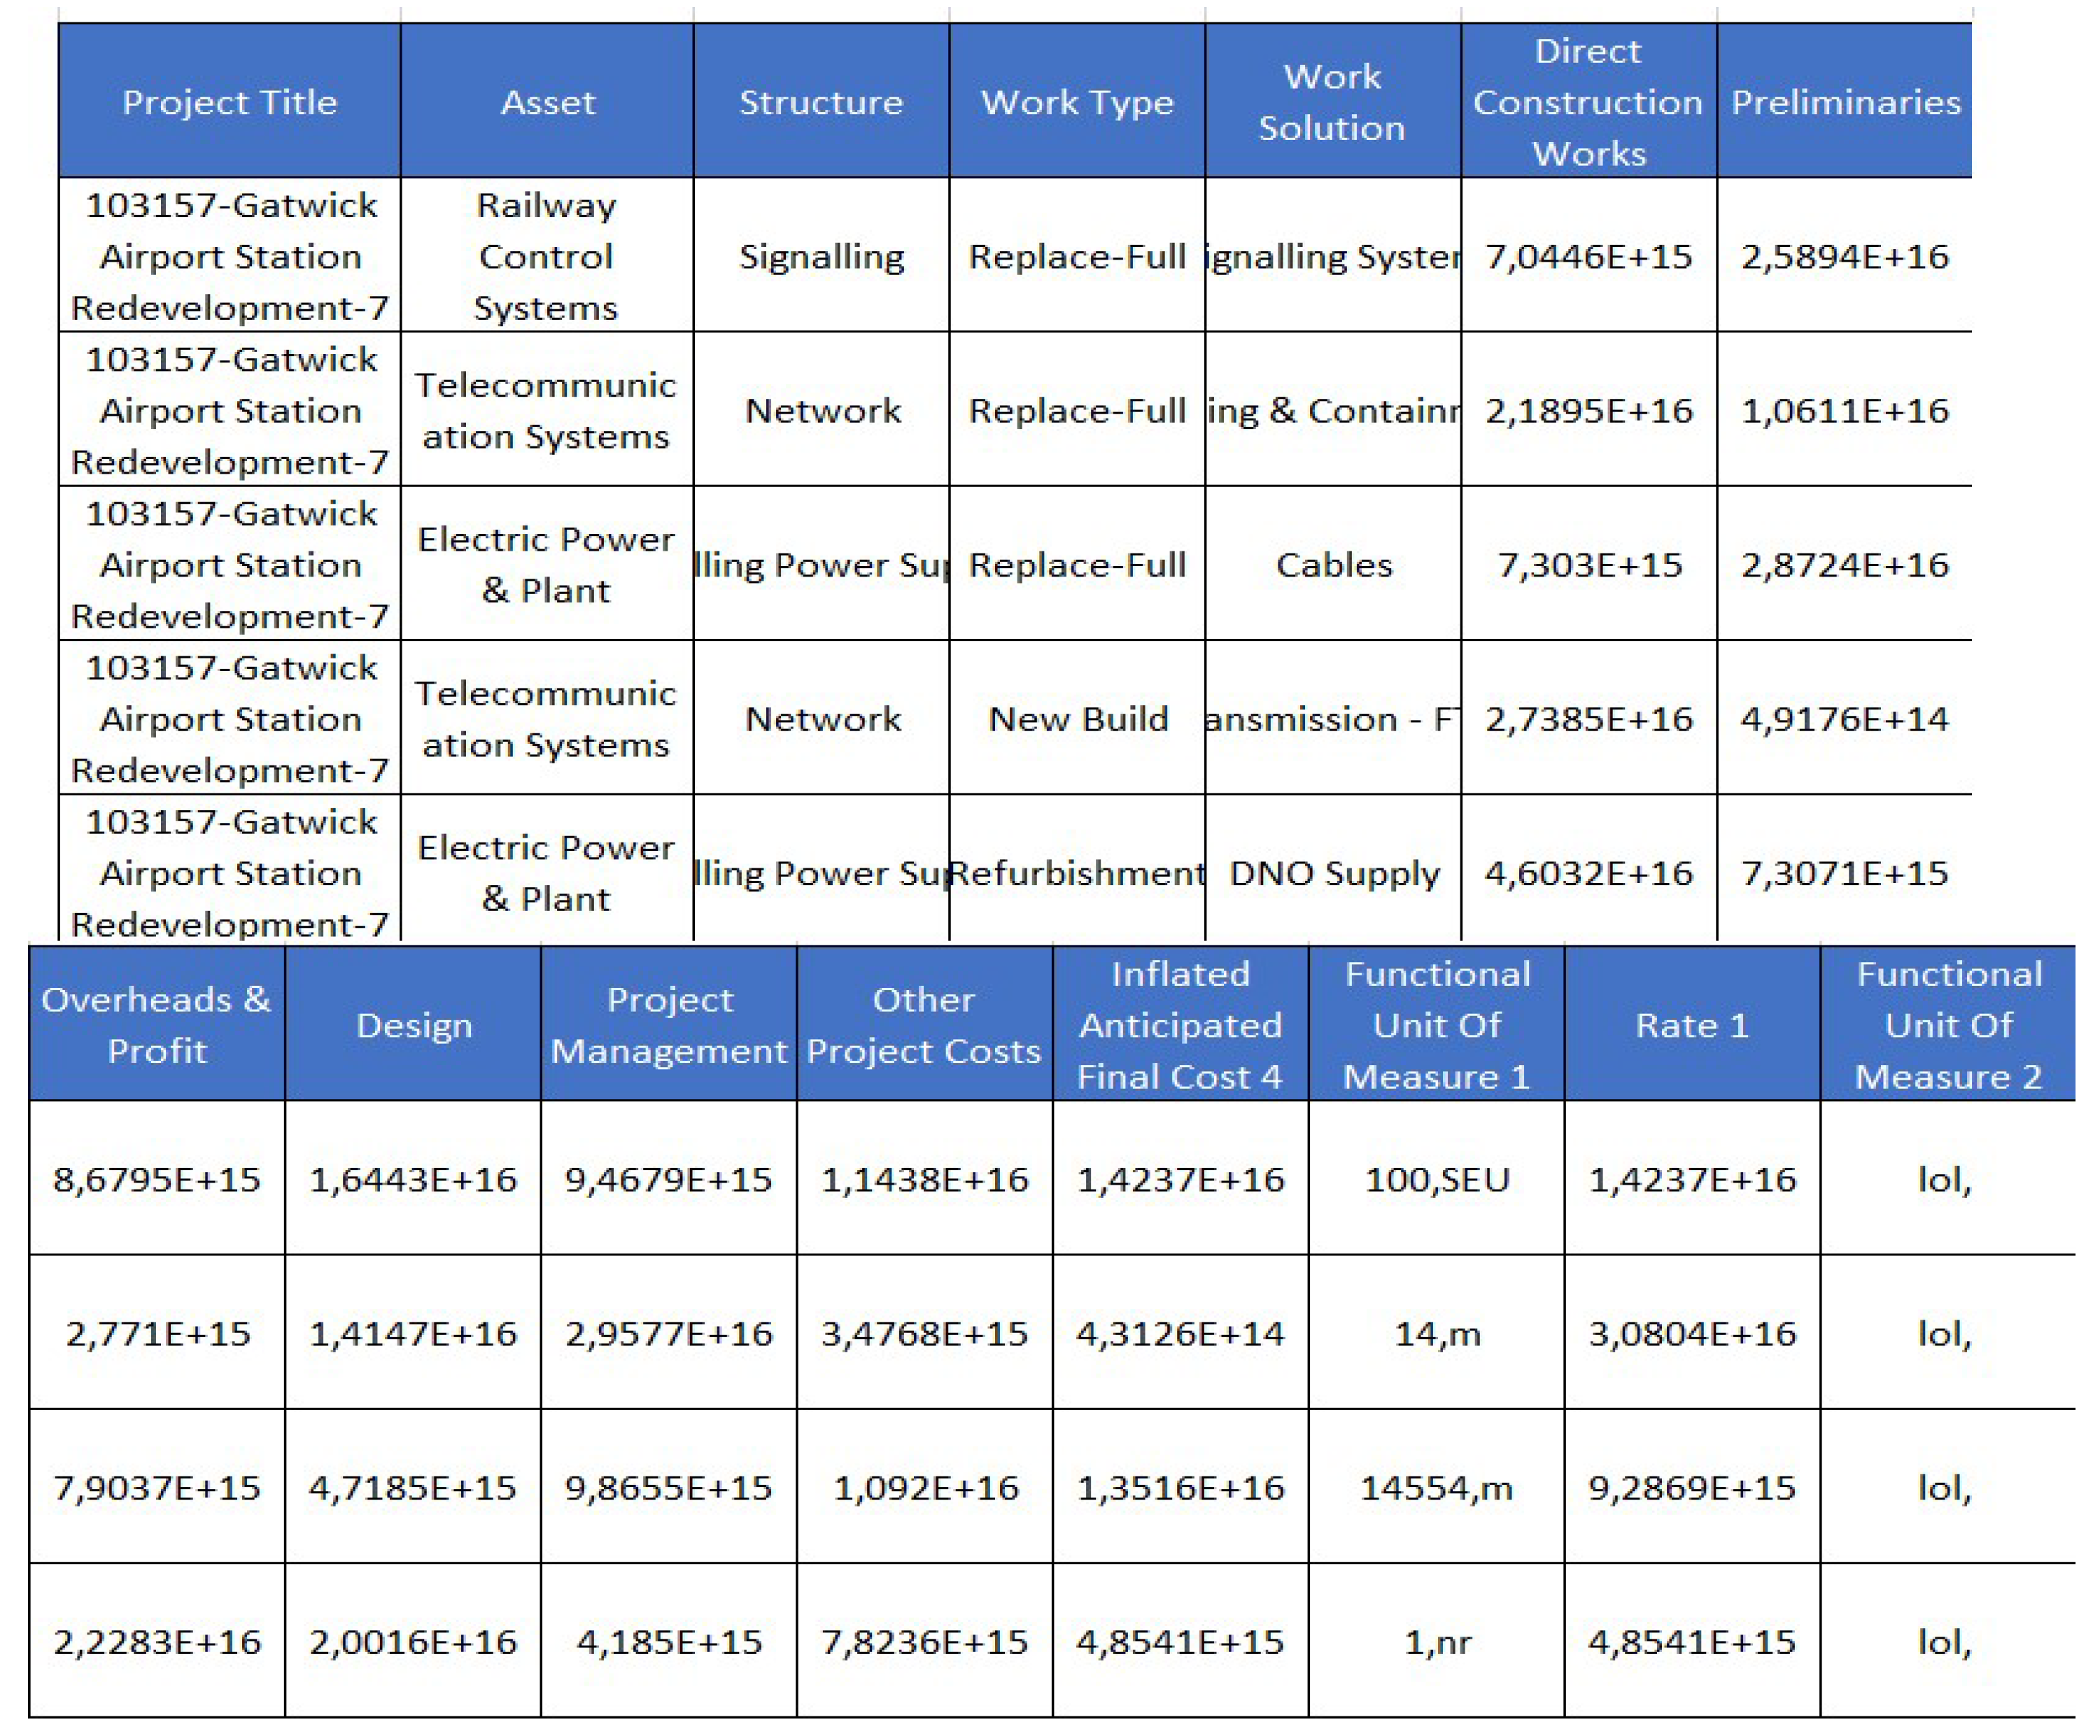
Figure 4.
Values showing the first rows containing possession strategy data.
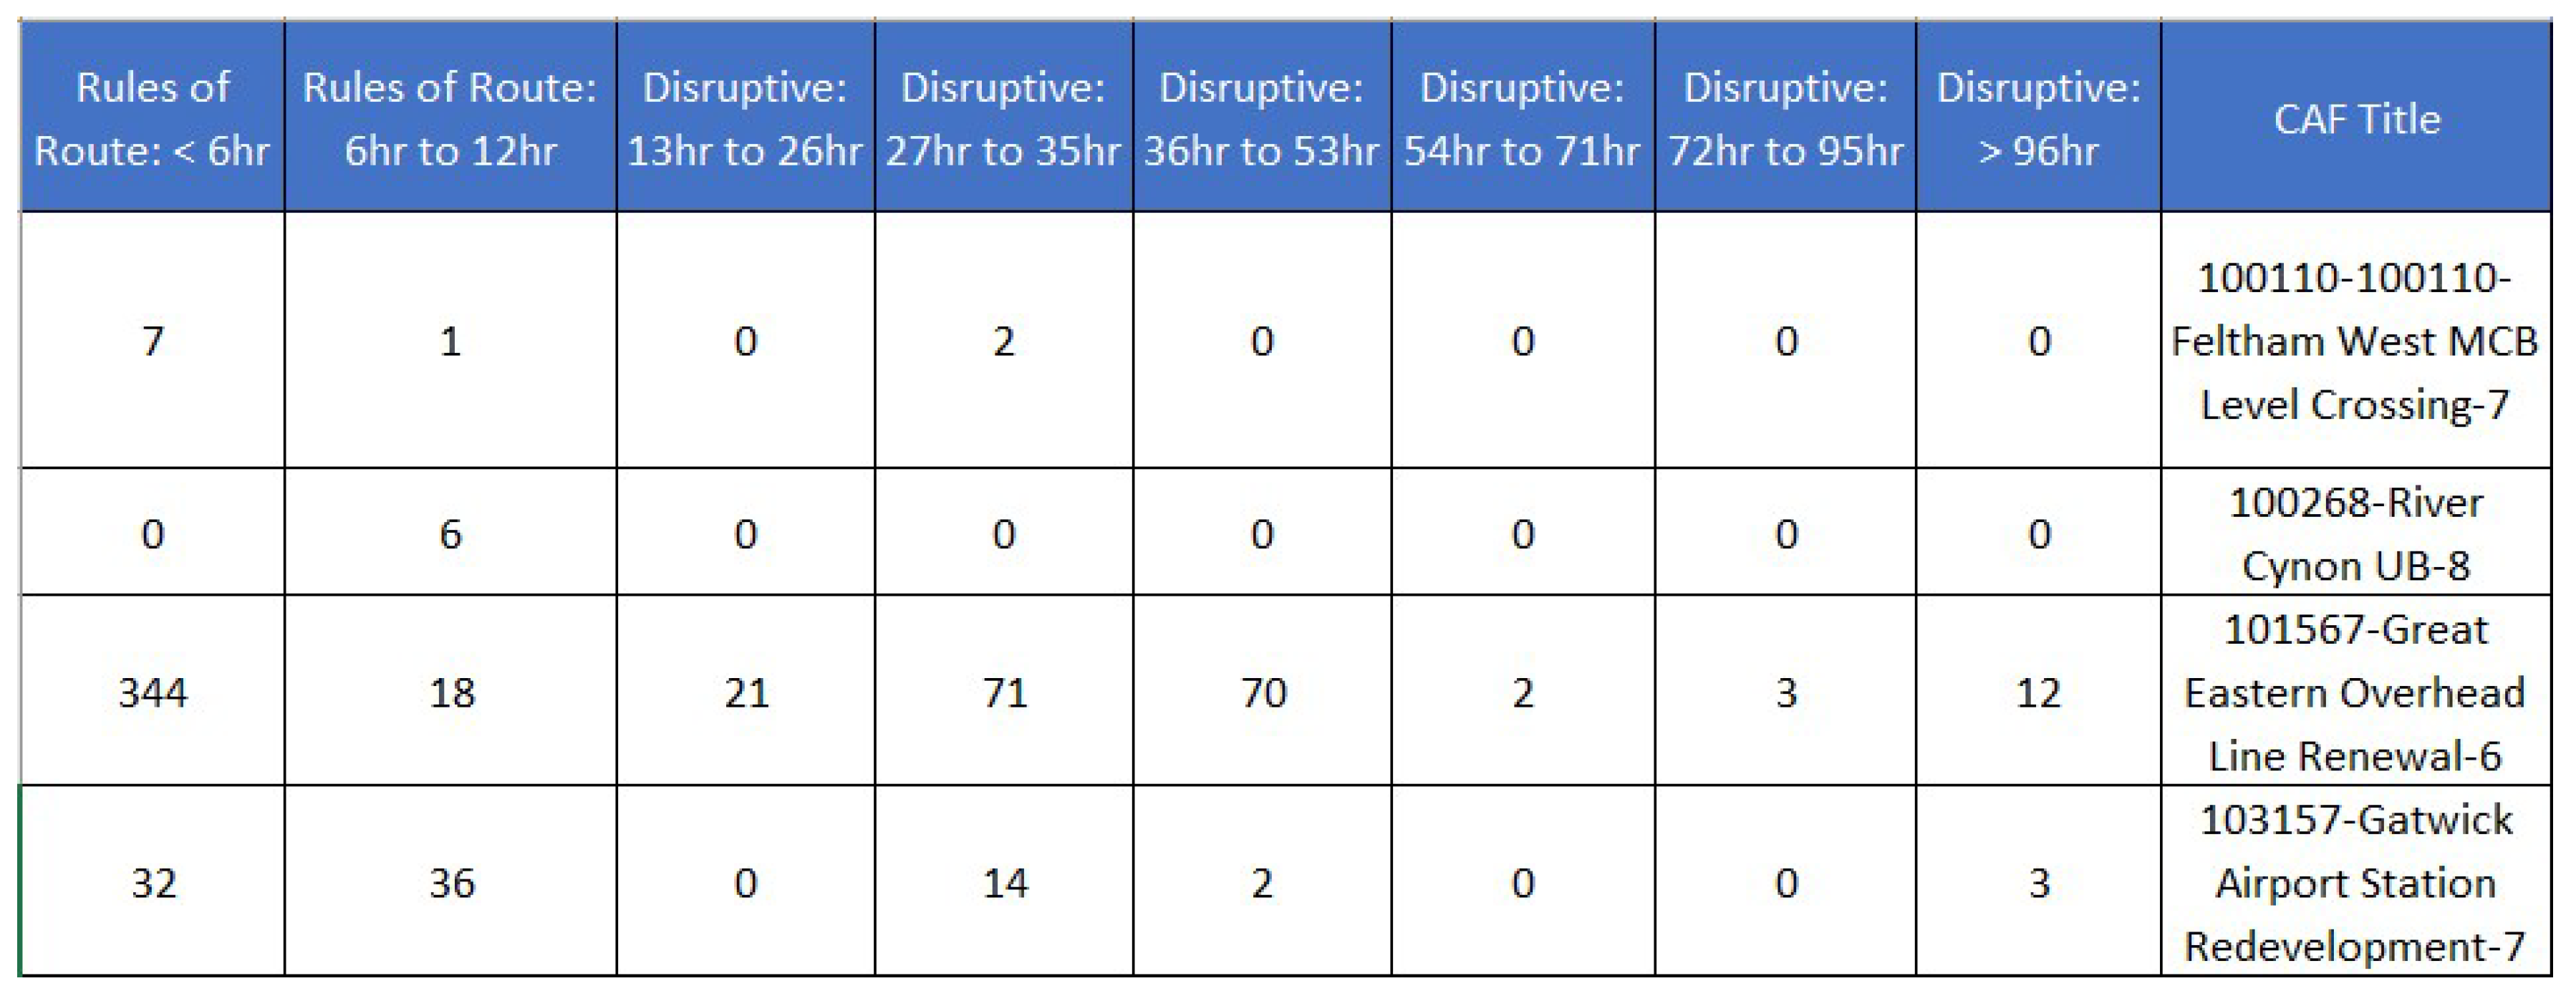
Figure 5.
Summary of the average project cost classified by region.
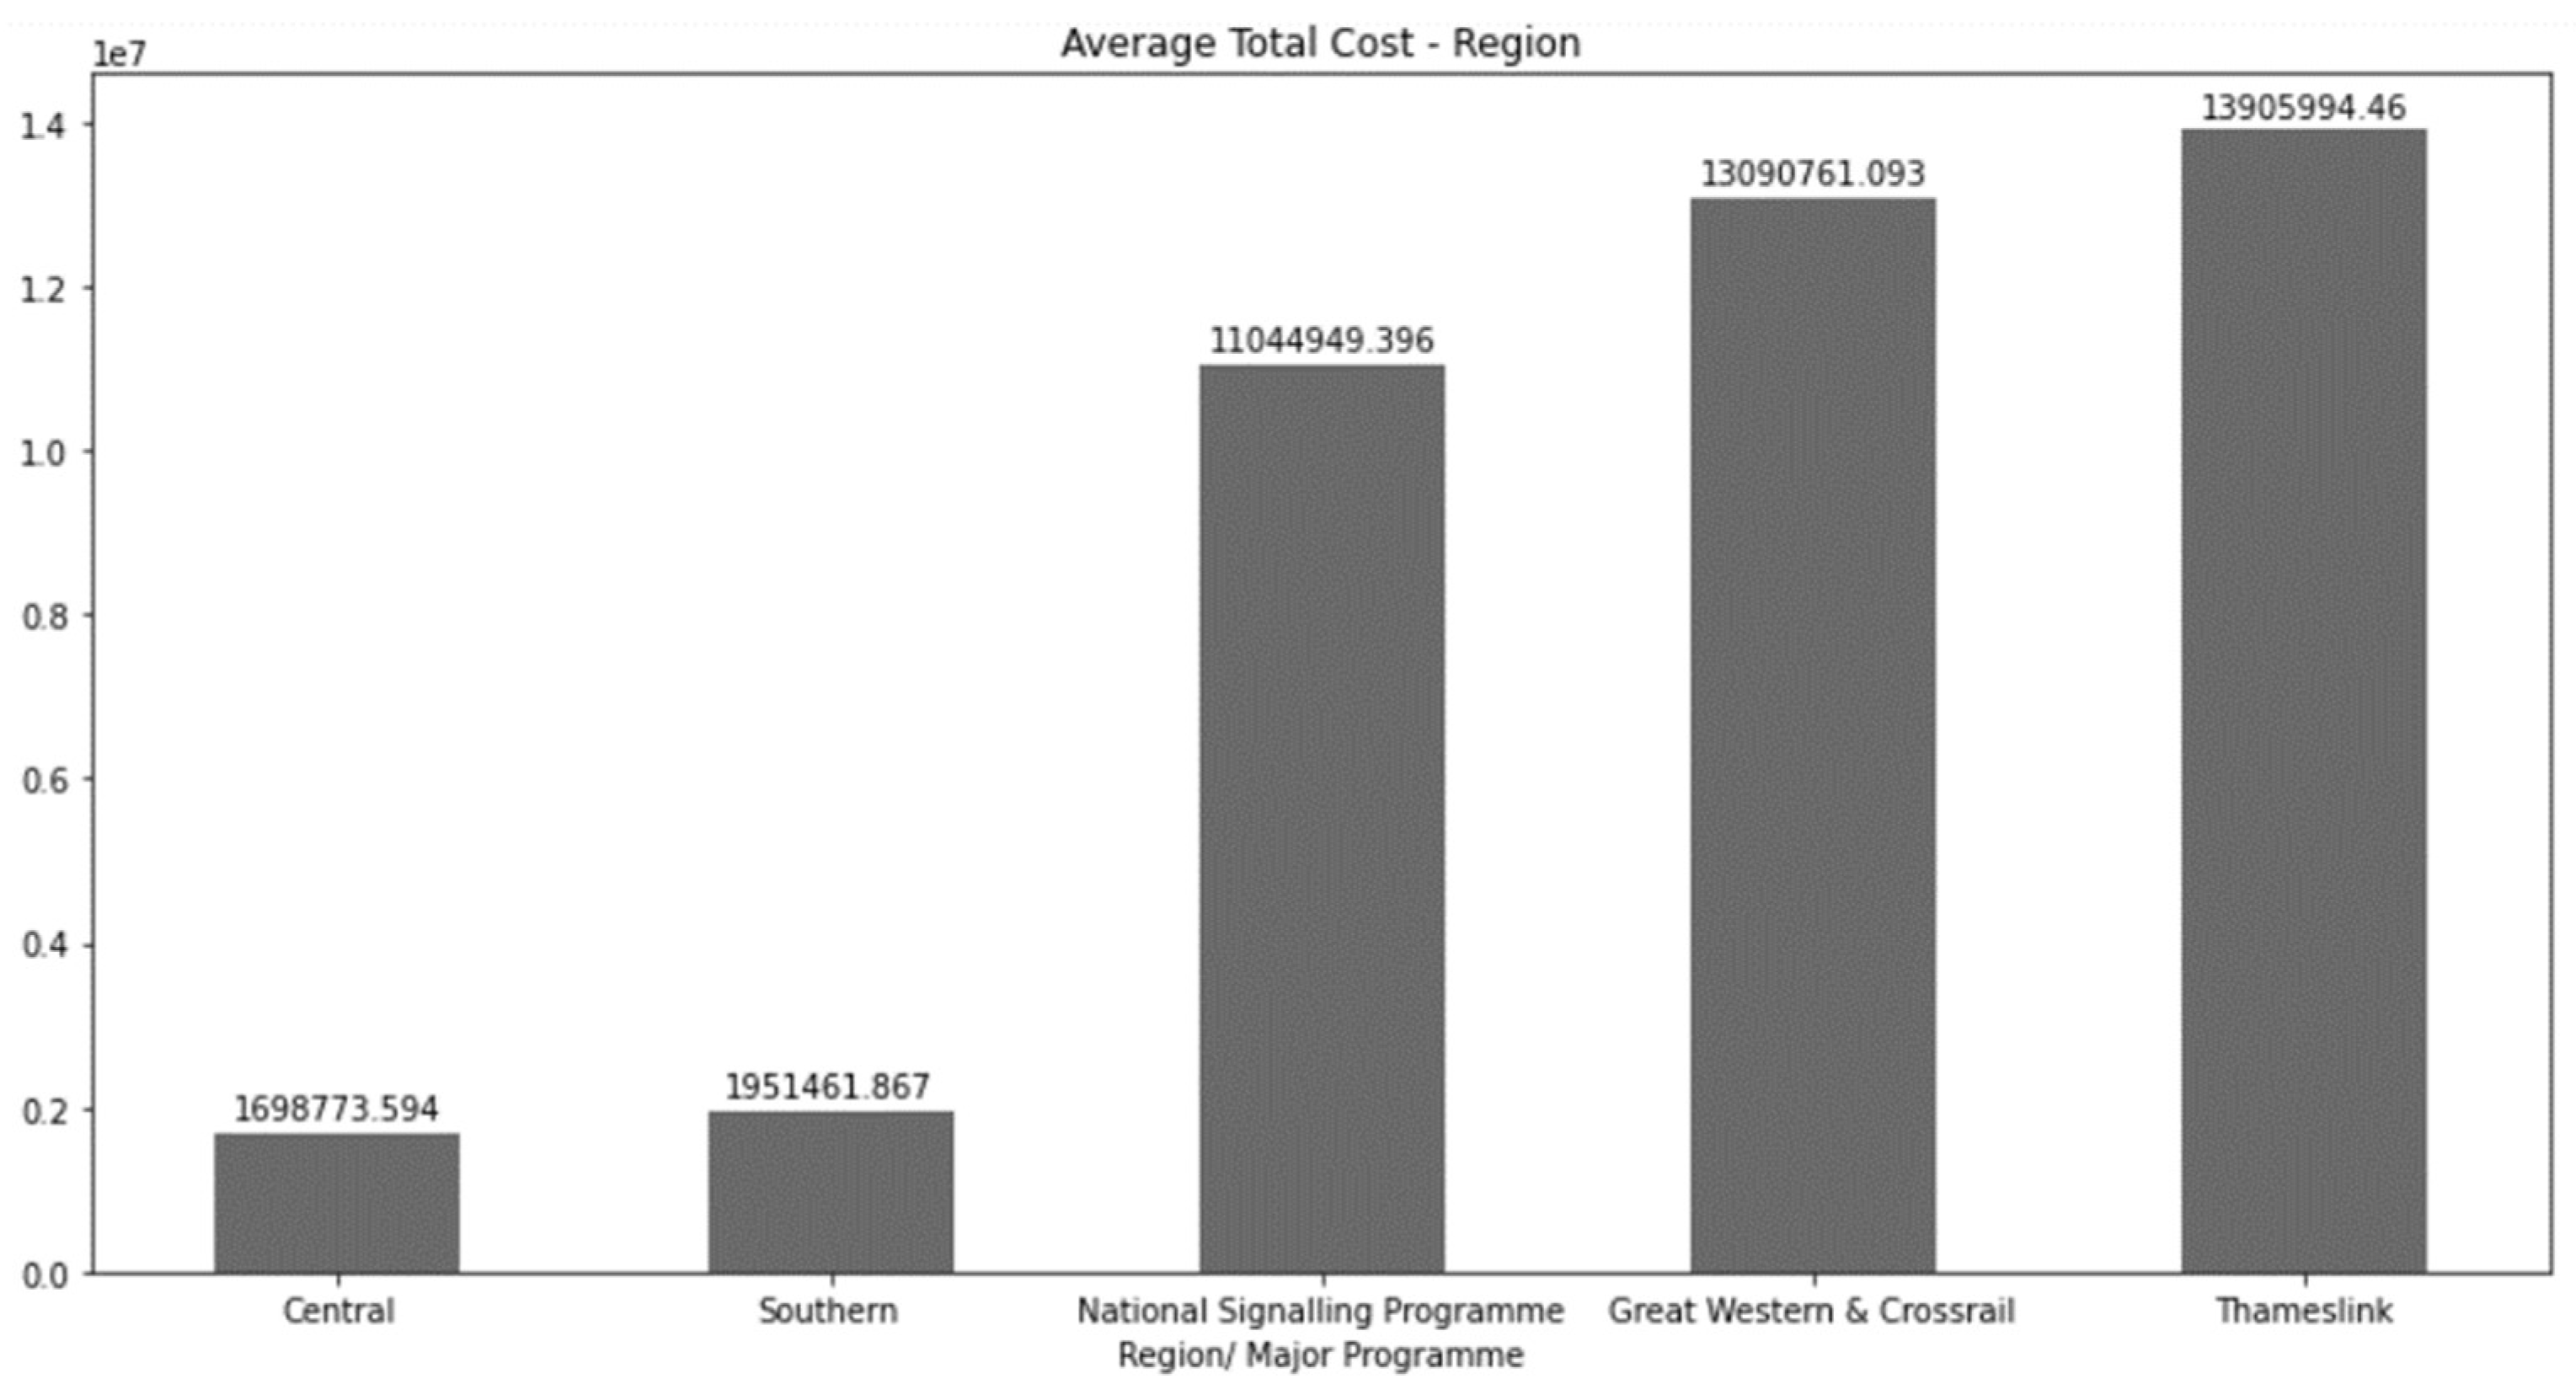
Figure 6.
Summary of the average cost classified by route.
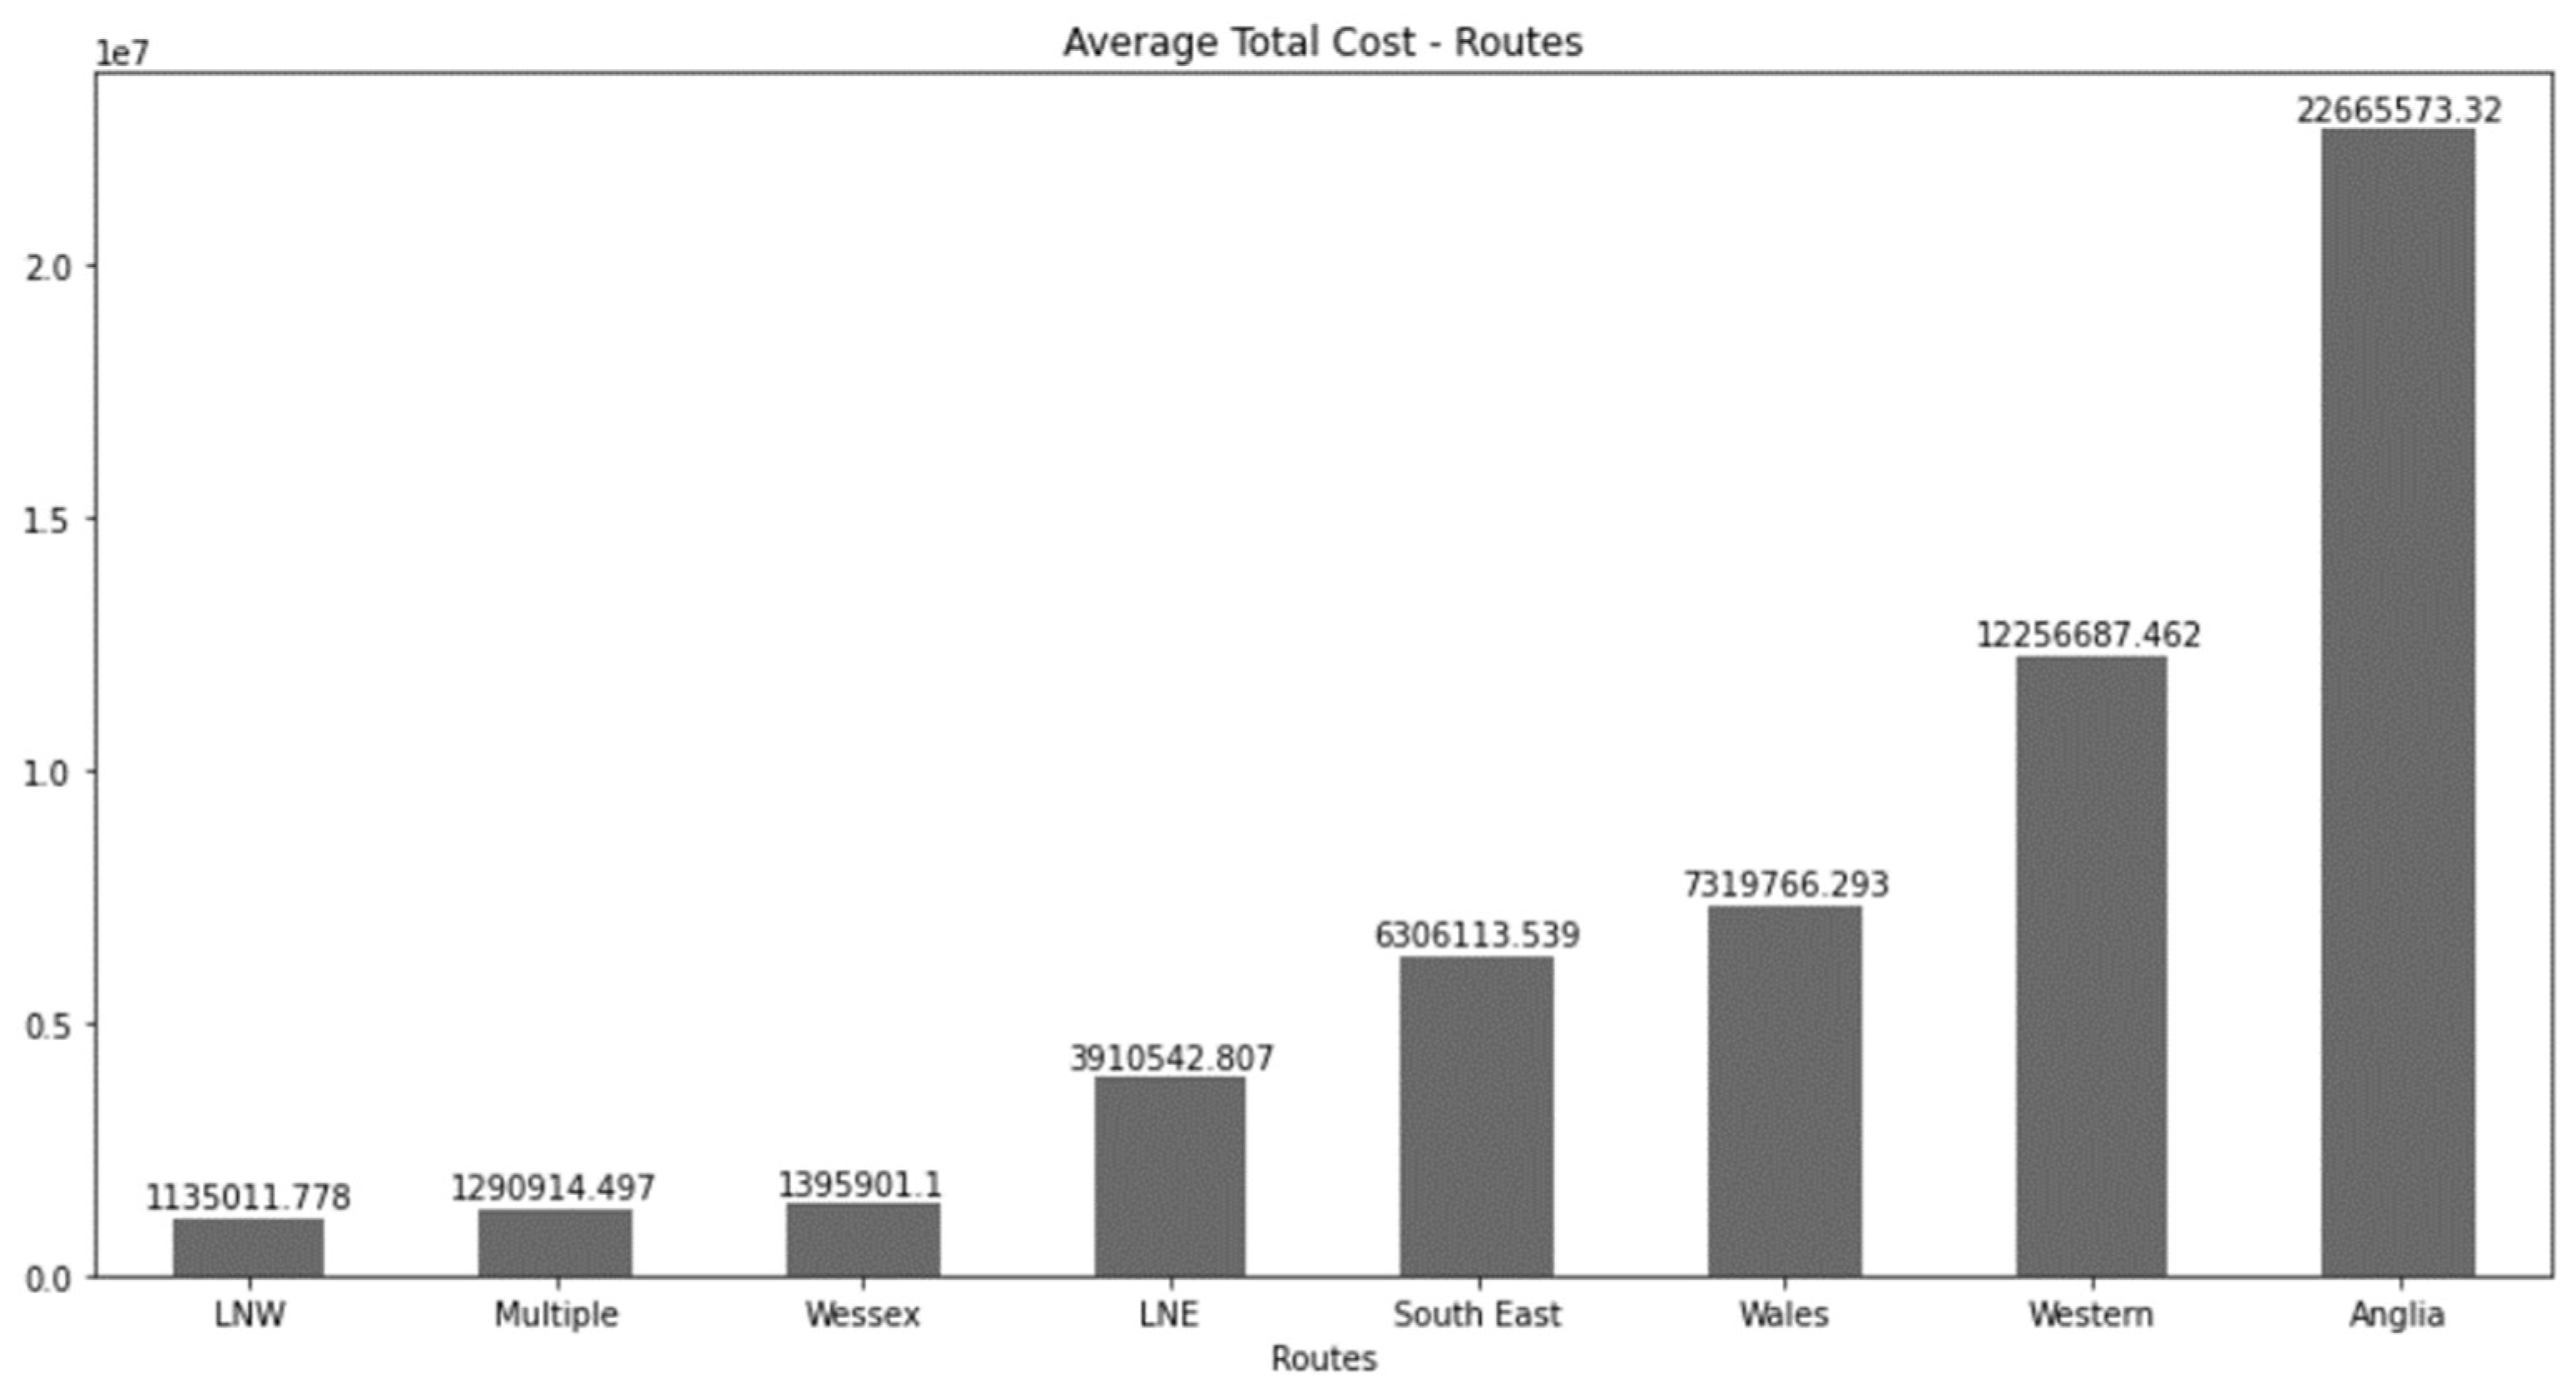
Figure 7.
Summary of the average cost classified by their primary work type.
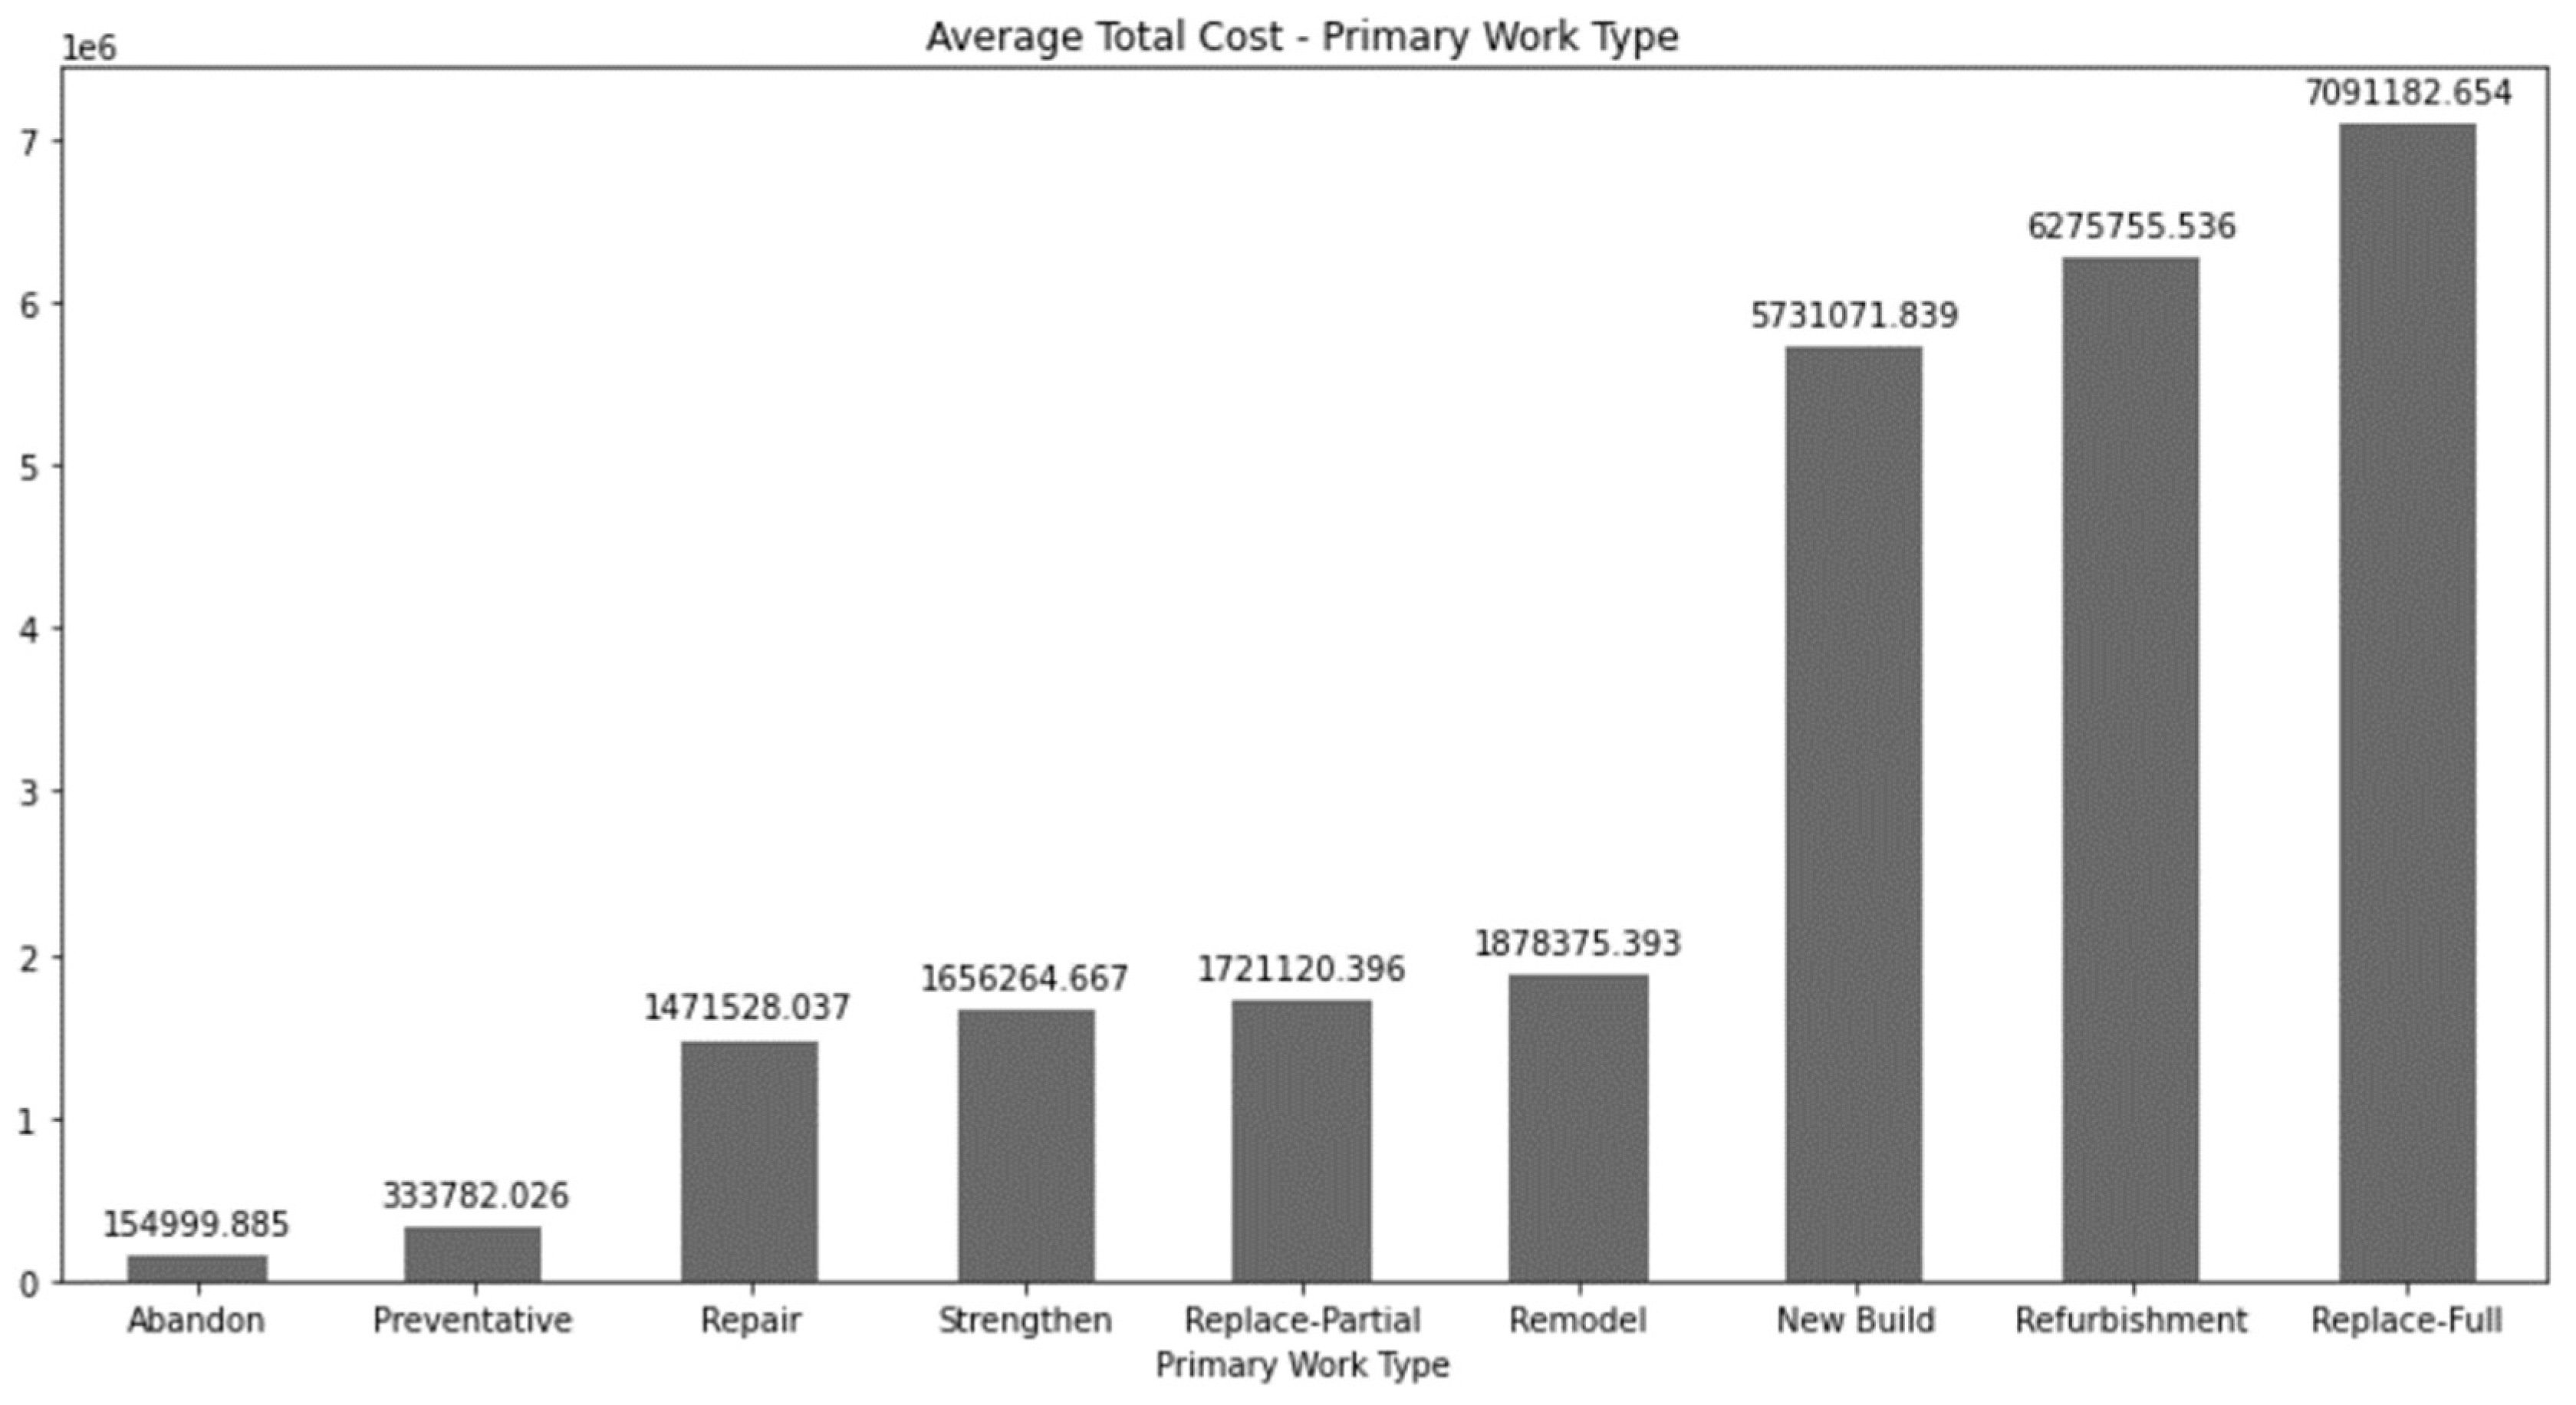
Table 1.
Summary of the aims and approaches for the related studies using machine learning and data science on infrastructure costs.
Table 1.
Summary of the aims and approaches for the related studies using machine learning and data science on infrastructure costs.
| Reference | Main aim | Approach |
|---|---|---|
| (Desai, n.d.) | To enhance the data classification in construction projects | The creation of a method implementing machine learning and the knowledge for variable correlation |
| (Zhong, n.d.) | To optimize the management in construction engineering projects | The creation of a method that performs a risk assessment, an evaluation using rough set theory and the implementation of machine learning for optimization |
| (Soibelman et al., 2008) | To identify and analyze a big variety of data structures in construction projects | A study that encompasses the search and extraction of different data structures used in a big range project. |
| (Chen et al., 2019) | To analyze and estimate costs in construction projects | The development of a method that combines surveyors’ knowledge with machine learning to effectively assess and predict costs |
Table 2.
Summary of the aims and approaches of related studies from railway infrastructure projects.
Table 2.
Summary of the aims and approaches of related studies from railway infrastructure projects.
| Reference | Main aim | Approach |
|---|---|---|
| (Ji et al., n.d.) | To perform a deeper analysis of high-speed railway infrastructure costs | To develop a framework considering the type of train to perform a better costs estimation |
| (Caíno-Lores et al., 2017) | To perform a massive number of simulations to make an efficient design in railway electric infrastructures | A simulation model to perform a massive number of simulations efficiently in a cloud environment |
| (Durazo-Cardenas et al., 2018) | An automatic and efficient job scheduling maintenance on railways infrastructures | The fusion of technical and business drivers scheduling and optimizing the intervention plans that impact on costs. |
| (Allan et al., 2004) | To perform an analysis of infrastructure, costs, and traffic on Swedish railway infrastructures | The study incorporates data gathering and data recovering techniques to conclude with some data analysis |
| (Rama & Andrews, 2016) | Railway infrastructure asset management | A proposed framework to assess the lifecycle cost analysis |
Table 3.
Summary of the aims and approaches of the strongly related studies.
| Reference | Main aim | Approach |
|---|---|---|
| (Kouris et al., 2005) | The usage of information retrieval techniques to support data mining | To develop a two-step algorithm acting as a search engine for making recommendations to customers using data mining. |
| (Fan et al., 2013) | A service for geospatial data retrieval on-demand | The development of a prototype based on sensor web technologies |
| (Deb & Zhang, 2004) | To review the extract of information using content-based image retrieval techniques | A systematic review analyzing a group of selected papers with content-based image retrieval systems. |
| (Miller & Meggers, 2017) | To predict the building use, performance, and operations strategies of non-residential buildings | To use data mining and machine learning for analyzing predicting data. |
Disclaimer/Publisher’s Note: The statements, opinions and data contained in all publications are solely those of the individual author(s) and contributor(s) and not of MDPI and/or the editor(s). MDPI and/or the editor(s) disclaim responsibility for any injury to people or property resulting from any ideas, methods, instructions or products referred to in the content. |
© 2023 by the authors. Licensee MDPI, Basel, Switzerland. This article is an open access article distributed under the terms and conditions of the Creative Commons Attribution (CC BY) license (https://creativecommons.org/licenses/by/4.0/).
Copyright: This open access article is published under a Creative Commons CC BY 4.0 license, which permit the free download, distribution, and reuse, provided that the author and preprint are cited in any reuse.


