Submitted:
04 June 2025
Posted:
05 June 2025
Read the latest preprint version here
Abstract
The rapid proliferation of wearable sensors and advanced tracking technologies has revolutionized data collection in elite sports, enabling continuous monitoring of athletes’ physiological and biomechanical states. This study proposes a comprehensive big data analytics framework that integrates data acquisition, processing, analytics, and decision support, demonstrated through synthetic datasets in football, basketball, and athletics case scenarios, modeled to represent typical data patterns and decision-making workflows observed in elite sport environments. Analytical methods including gradient boosting classifiers, logistic regression, and multilayer perceptron models were employed to predict injury risk, optimize in-game tactical decisions, and personalize sprint mechanics training. Key results include a 12% reduction in hamstring injury rates in football, a 16% improvement in clutch decision-making accuracy in basketball, and an 8% decrease in 100 m sprint times among athletes. The framework’s visualization tools and alert systems supported actionable insights for coaches and medical staff. Challenges such as data quality, privacy compliance, and model interpretability are addressed, with future research focusing on edge computing, federated learning, and augmented reality integration for enhanced real-time feedback. This study demonstrates the potential of integrated big data analytics to transform sports performance optimization, offering a reproducible and ethically sound platform for advancing personalized, data-driven athlete management.
Keywords:
big data
; decision-making
; sports
; framework
; performance optimization
1. Introduction
In recent years, the concept of Big Data, characterized by high volume, velocity, and variety, has permeated nearly every domain of human activity. Sports, a field traditionally dominated by expert intuition and experience, is now ripe for transformation through data driven methodologies. From professional leagues investing millions in wearable technology, to amateur athletes using smartphone apps, the ability to capture fine grained movement, physiological, and contextual information has never been greater.
This influx of data offers unparalleled opportunities for coaches, trainers, sports scientists, and performance analysts to quantify and optimize every aspect of an athlete’s training and competition cycle. Rather than relying solely on anecdotal observations or static benchmarks, decision-makers can leverage predictive and prescriptive analytics to:
- Identify injury risk before it manifests.
- Tailor training loads to each individual’s recovery patterns.
- Develop real-time tactical adjustments during competition.
- Maximize the efficiency of nutrition and recovery protocols.
However, raw data alone does not guarantee improved outcomes. The challenge lies in constructing robust pipelines that transform multivariate datasets into actionable insights. This involves not only statistical and machine learning models, but also domain specific expertise to interpret outputs and validate recommendations.
In this paper, we propose a comprehensive decision making framework that integrates big data analytics into sports performance optimization. Through detailed case studies, we demonstrate how this approach produces measurable gains, in some cases reducing injury rates by over 10% or improving speed metrics by 8%.
1.1. Literature Review
Evolution of data in sports reflects a continual deepening of insight, from manually charted match events to real time AI driven decision support.
From the 1960s to the 1990s, performance analysis was grounded in notational systems - manual tracking of passes, shots, and tackles using charts or spreadsheets. Seminal works like Notational Analysis of Sport helped standardize coding for tactical and individual metrics, establishing early evidence based coaching methods [1].
By the 2000s, focus expanded to physiological and spatial monitoring. Wearable GPS units, such as Catapult’s minimaXx launched in 2006, enabled tracking of distance and movement patterns [2], while Polar Electro’s wireless heart rate monitors [3], stemming from Seppo Säynäjäkangas’s 1977 prototype, provided real-time cardiovascular data, aligning external and internal load for better training strategies.
The 2010s brought high resolution optical tracking (e.g., TRACAB) and wearable inertial sensors (IMUs), capturing player positions, joint angles, and impact forces at high frequencies, even where GPS faltered [4].
By mid-decade, machine learning enabled predictive insights, using vast physiological and positional datasets to forecast performance, tactical success, or injury risk in real time [5].
Emerging tools now add metabolic data via continuous glucose monitors (CGMs) like Abbott’s biosensor [6], while digital twin simulations and 5G infrastructure promise real-time, millisecond-level feedback across sport environments.
Through each technological wave, from analog notebooks to fully integrated AI ecosystems, sports organizations have transformed raw measurements into competitive edge, continually redefining what’s possible on and off the field.
As illustrated in Figure 1, this progression reflects not only advances in sensor resolution and data capture frequency but also the increasing integration of predictive modeling and contextual decision-making tools. As sports organizations adapt to these changes, the emphasis has shifted from descriptive metrics to real-time actionable insights, with future developments likely centered on augmented intelligence, automation, and cross-system interoperability.
1.2. Foundations
In the era of digital transformation, sports performance is increasingly shaped by foundational elements such as high throughput data engineering, advanced analytical models, and intelligent decision systems. From the capture of high-frequency sensor streams to the application of advanced machine learning algorithms, modern sports analytics integrates vast, diverse datasets to inform training, recovery, and tactical decision-making. The following sections outline the foundational pillars of this evolution: data engineering, analytical modeling, and decision deployment, which together enable a data-driven competitive edge (see Figure 2).
Data Engineering - modern sports analytics pipelines begin with robust data engineering processes that enable the capture, management, and structuring of high-volume, high-velocity data streams. These systems serve as the foundational layer upon which modeling and decision deployment depend. Sports analytics systems must manage enormous data volumes, ingesting petabytes of positional coordinates (logged at 25 Hz) and biomechanical scans into distributed file systems for batch and real-time querying. Velocity is crucial: streaming frameworks like Kafka and Flink capture live RFID and IMU sensor data, feeding real-time dashboards and event-detection models with sub-second latency [7,8]. Variety is also extreme - structured (e.g., shot counts, heart rate traces), semi-structured (video, audio), and unstructured (medical transcripts, self-reports, social media) data all coexist. Ensuring veracity requires robust ETL protocols, anomaly checks, and standardized metadata schemas to detect inconsistencies [9,10]. To extract value, teams apply statistical models and machine learning - from additive models for injury risk to reinforcement learning for tactical optimization - transforming raw telemetry into actionable insights.
Analytical Modeling - once raw data is processed, the next stage involves transforming it into interpretable patterns and predictions through analytical modeling techniques. Modern sports analytics spans descriptive (e.g., sprint velocities, load curves), diagnostic (e.g., PCA, Bayesian networks), predictive (e.g., random forests, neural networks), and prescriptive techniques. These enable predictions of injury risk or fatigue thresholds and inform decisions on training, recovery, and tactics using methods like survival analysis, optimization models, and deep Q learning [11,12,13,14,15,16].
Decision Deployment - in the final stage of the analytics pipeline, actionable outputs are deployed to coaches, analysts, or medical teams through real-time interfaces and alert mechanisms. Real time dashboards powered by platforms such as Grafana and Tableau, combined with rule-based alert systems, enable proactive coaching decisions. Alerts (e.g., based on HRV or load indices) are delivered via SMS or push notifications [17,18], and carry context-rich summaries and suggested actions [19]. AI-driven recommendations (e.g., modifying session volume) are routed through expert approval workflows, ensuring decisions are both data-informed and domain-validated. This feedback loop helps models evolve in tandem with expert knowledge.
This three-stage framework in Figure 2 illustrates the flow from raw sensor data to actionable outputs. The first block, Data Engineering, encompasses acquisition, storage, and preprocessing activities that prepare data for analysis. The second stage, Analytical Modeling, transforms processed data into predictive or explanatory outputs. The final stage, Decision Deployment, translates model results into practical insights delivered through tactical, medical, or performance systems.
1.3. Decision-Making and Big Data in Sports
Decision-making in sports is undergoing a profound transformation due to the integration of high-volume data streams, real-time analytics, and AI-powered decision systems.
Real-time data collection has become a cornerstone of modern sports environments. Wearable sensors, GPS trackers, and IMU-based systems collect live metrics on player movement, workload, and physiological strain [20]. These signals are streamed via edge computing networks, minimizing latency and allowing decisions to be made within seconds. Tactical adjustments, such as changing formations based on live opponent heatmaps, are now data-informed rather than intuition-driven. Likewise, medical teams rely on biofeedback systems and historical risk profiles to intervene preemptively and avoid injury escalation.
In parallel, AI-powered video analysis tools leverage computer vision to extract player positioning, interactions, and contextual play patterns from multi-angle footage [21]. These insights are processed through decision support dashboards that suggest optimal responses, whether subbing fatigued players or adapting defensive schemes in response to opponent press intensity. Importantly, explainability methods such as SHAP values and LIME are increasingly embedded in these models to ensure that human coaches and analysts can understand, trust, and validate the machine-generated recommendations [22].
To facilitate fast and reliable decision loops, many organizations implement closed-loop decision systems where real-time monitoring, alerting, recommendation, and feedback occur within a self-updating architecture. These systems are deployed across cloud–edge hybrids, allowing federated data access while preserving performance in local environments such as stadiums or training centers. For instance, edge nodes perform on-device inference during a match, while cloud modules retrain models based on aggregated post-game performance data.
Decision-making thus becomes not only faster, but also more intelligent and evidence-based. Tactical coaches, medical staff, and performance analysts are increasingly part of a shared digital ecosystem where insights are continuously pushed, explained, and refined. The decision deployment process is no longer a single output but a dynamic, multi-stakeholder loop aligned with both data and domain knowledge.
The following technological pillars collectively enable real-time data-driven decisions in sports:
Edge computing - to reduce latency and offload bandwidth from central servers, initial data cleaning and feature extraction are often performed directly on devices like wearables or camera embedded units. ARM based microcontrollers and GPU enabled edge gateways handle operations such as sensor drift correction, time sync via PTP, and compressions like wavelet transforms. Frameworks like AWS IoT Greengrass and Azure IoT Edge deploy lightweight models (TensorFlow Lite, ONNX Runtime) for on-device inference (e.g., PlayerLoad™, fatigue detection), reducing data volume by up to 80% and enabling sub-100 ms decisions even in low-bandwidth environments [23,24,25].
Cloud Platforms - once ingested, data flows into scalable cloud infrastructures such as AWS, Azure, or Google Cloud. These platforms offer storage (S3, Blob, Cloud Storage), compute (GPU clusters like EC2 P3, Azure NC), and orchestration (Kubernetes, Airflow) for real time inference and model training. Auto-scaling and spot instances optimize cost, while integrated IAM, encryption, and VPC tools ensure GDPR/HIPAA compliance [26,27,28].
Streaming Frameworks - real time analytics rely on streaming infrastructures like Apache Kafka, which ingests high frequency telemetry into structured topics. Processing engines such as Apache Spark Streaming or Flink perform aggregations, event detection (e.g., impacts, accelerations), and inline ML inference with low latency stores like RocksDB. Outputs feed into real-time dashboards or ML feature stores like Feast [29].
Visualization Tools - final insights reach stakeholders via platforms like Power BI or Tableau, which offer live dashboards, trend visualizations, and tactical overlays. Advanced interfaces (built using React, D3.js, WebRTC) support 3D biomechanical replays and mobile delivery. Role based access ensures coaches, analysts, and medical staff receive tailored views and real time alerts [30,31].
Together, these systems create an integrated pipeline, from edge collection to cloud computation and live visualization, transforming telemetry into actionable insight and competitive advantage.
Figure 3.
Big data technologies and infrastructure.
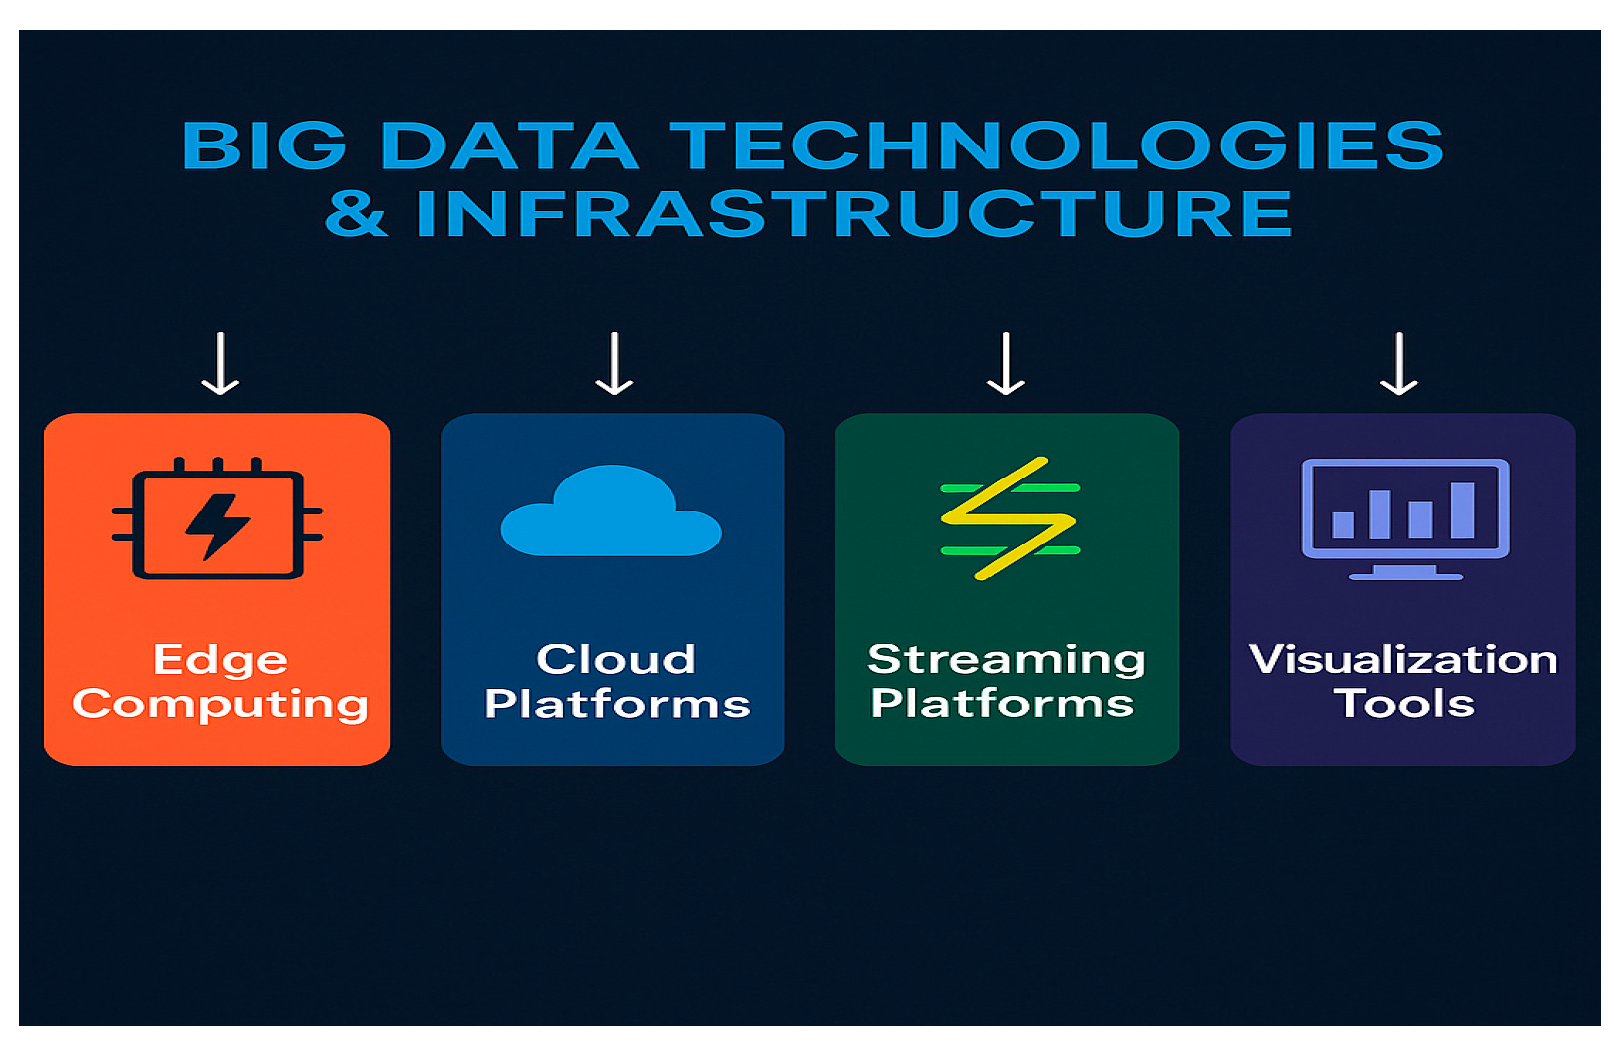
The Figure 4 illustrates four foundational components - edge computing, cloud platforms, streaming platforms, and visualization tools - that together enable real-time data capture, processing, and feedback in high-performance environments
1.4. Visualization and Dashboarding
In elite sports analytics, the power of data lies not only in sophisticated modeling but equally in how insights are communicated to end users. An effective dashboard serves as a command center, translating terabytes of telemetry into concise, actionable intelligence. Below are the core components and design principles for high impact sports dashboards:
Heatmaps: Player Movement Density - heatmaps reveal spatial tendencies, where players spend most time on the field or court, and highlight tactical patterns or positional inefficiencies.
- Data Source & Processing: positional coordinates (from GPS or optical tracking) are binned into a two dimensional grid (e.g., 1 m² cells) and aggregated over selected time window (session, half, quarter). Kernel density estimation can smooth noisy traces [32].
-
Visualization Features:
- ○
- Color Scale: a continuous palette (e.g., light blue to deep red) indicates low to high occupancy; legends should include absolute time values (minutes).
- ○
- Interactivity: hover over tooltips display exact dwell time per cell; sliders enable time based slicing (e.g., first vs. second half) [33].
- ○
- Contextual Overlays: field or court diagrams with marking zones (penalty area, three-point line) help relate heatmap “hot spots” to tactical regions.
Figure 4 Heatmap of player positional density (2D kernel-density smoothed) overlaid on court diagram; blue-to-red gradient indicates low to high occupancy, streamed at 1 Hz during Q4.
Trend Lines: Training Load vs. Performance Over Time - trend analyses connect training stimuli (external and internal load) with performance outcomes or injury markers, revealing leading indicators and lag effects.
- Data Source & Processing - load metrics (e.g., weekly high speed distance, acute:chronic workload ratio, muscle oxygenation indices) and performance KPIs (sprint times, jump heights, shooting percentages) are resampled to common intervals, often daily or weekly averages.
-
Visualization Features:
- ○
- Multi-Series Charts: Dual axis line graphs plot load on one axis and performance on the other, with synchronized time scales.
- ○
- Annotated Events: Vertical lines or markers denote key interventions - injuries, training camp intensities, tactical changes - to contextualize inflection points.
- ○
- Confidence Bands: Shaded regions around trend lines communicate normal variation or model predicted ranges, helping users distinguish noise from true shifts.
Figure 5.
Trend lines analyse model.
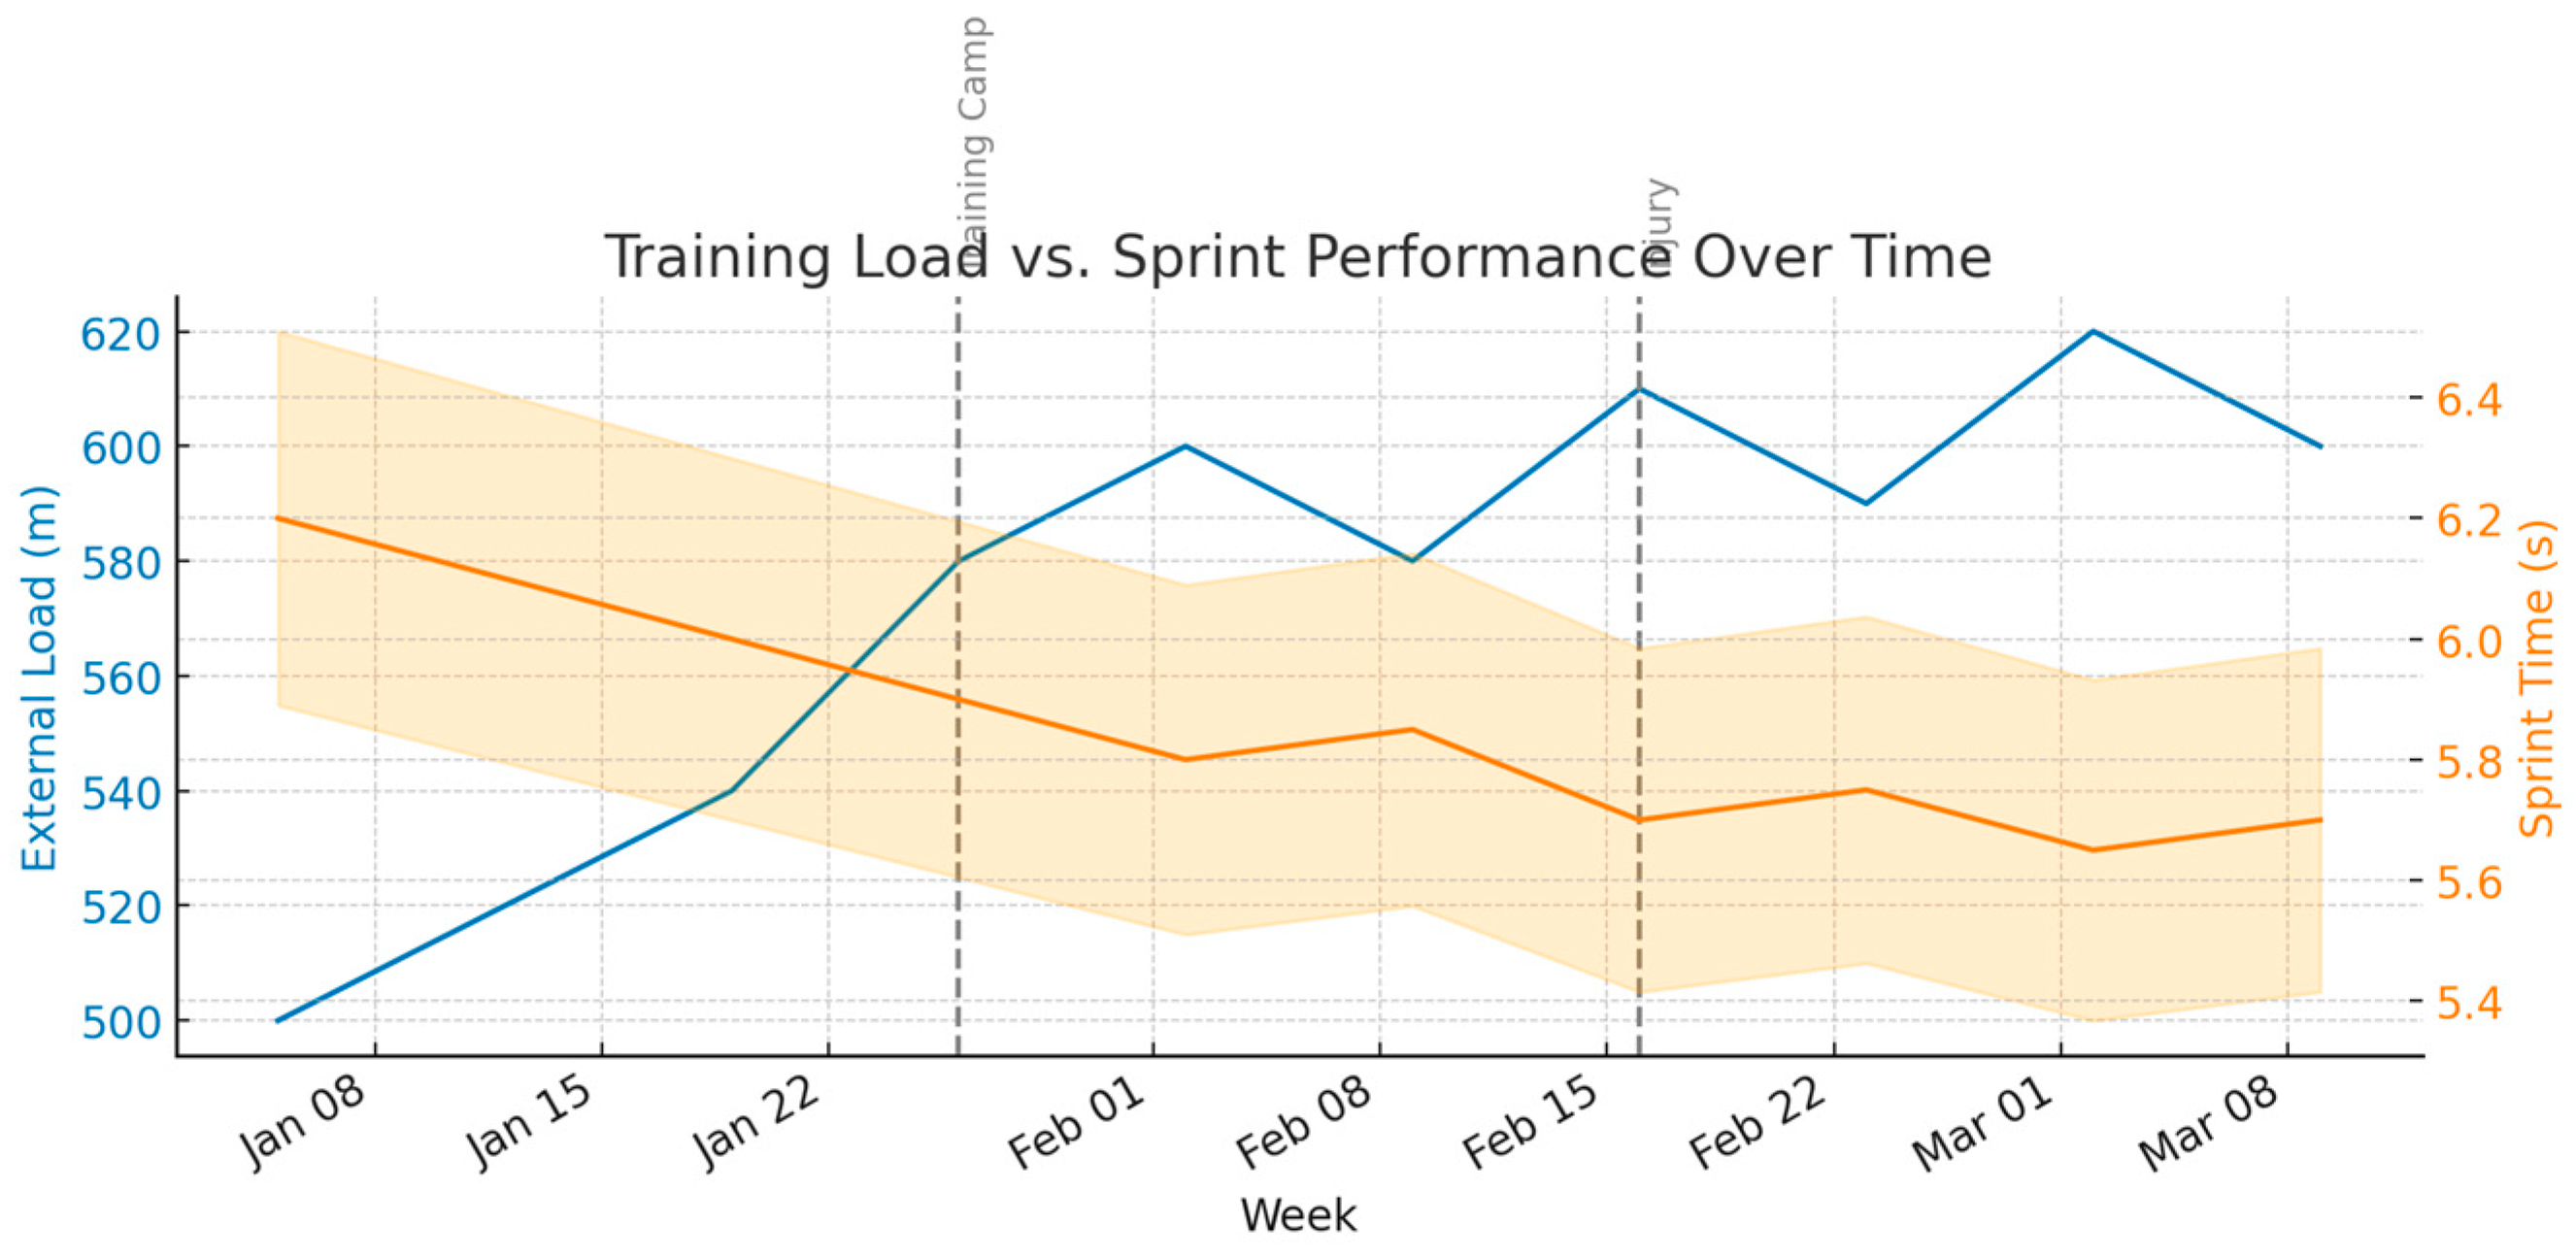
Figure 2 Dual-axis trend lines showing acute:chronic workload ratio (left axis) versus average points per game (right axis), with 95 % confidence bands and annotated markers for key training events.
Bar Charts: Comparative Importance and Outcome Improvements - bar charts succinctly compare categorical measures, such as the relative weight of different data streams or pre- vs. post-intervention improvements (Figure 6).
-
Data Type Importance
- ○
- Design - horizontal bars ordered by magnitude (e.g., sensors, video, self-reports).
- ○
- Color Coding - a coherent palette (e.g., pastel blues) with consistent hues across dashboards to maintain mental models.
- ○
- Annotations: display exact percentages at bar ends for precision.
-
Decision Outcome Improvements
- ○
- Design - grouped bars to compare baseline and post-intervention metrics (e.g., injury rates, decision accuracy).
- ○
- Dynamic Updates - bind charts to underlying databases so they auto refresh as new season data arrive.
Figure 3 Bar charts comparing “Data Type Importance” (left) and “Decision Outcome Improvements” (right); ordered descending, annotated with percentage deltas, and auto-refresh bound to data-update triggers.
Alerts Panel: High Risk Flags and Fatigue Warnings – real time monitoring of individual athletes’ risk scores enables proactive interventions before adverse events occur.
- Data Source & Processing: continuous model outputs (e.g., injury risk probability, fatigue index) feed into a rule engine that evaluates user defined thresholds.
-
Visualization Features:
- ○
- Tabular Display: list of flagged athletes with current score, threshold crossed, and time of alert.
- ○
- Color Signals: traffic light system (green/yellow/red) instantly conveys severity.
- ○
- Action Links: each alert row includes “View Details” buttons, navigating to drill down pages with trend charts and feature attributions.
- ○
- Notification Integration: real time pop ups or push messages (via SMS or mobile app) mirror the dashboard panel for off-site stakeholders.
Figure 7 Alerts Panel: a live-updating table (refreshing every 30 s) with traffic-light coloring (red = critical, orange = warning, blue = info) and drill-through links for immediate context.
By combining intuitive heatmaps, trend line analytics, clear bar chart comparisons, a robust alerts panel, sports organizations can ensure that their analytics platforms not only surface the right insights but drive timely, confident decision making on and off the field.
1.5. Research Contribution and Study Objectives
Despite extensive research on big data analytics applications in sports, existing frameworks predominantly focus on isolated aspects such as injury prediction, training load management, or tactical analysis. These approaches often overlook the potential benefits of synthesizing multiple data streams into a unified decision-making system. Our research uniquely integrates these elements into a comprehensive, multi-stage framework designed explicitly for elite sports. We combine physiological, biomechanical, and tactical data using advanced analytics, ranging from gradient boosting classifiers and logistic regressions to reinforcement learning, to deliver actionable real-time insights. Additionally, our methodology leverages meticulously constructed synthetic datasets to robustly demonstrate analytical techniques without ethical or privacy concerns associated with real athlete data.
Considering these innovative elements, our research aims to address the following questions:
- How can an integrated big data analytics framework effectively support proactive decision-making across injury prevention, tactical execution, and performance optimization in elite sports settings?
- What measurable impact do predictive and prescriptive analytics have on key performance indicators such as injury rates, decision accuracy, and sprint performance?
- To what extent can visual and interactive dashboards improve real-time decision-making capabilities for coaches, sports scientists, and medical teams?
Consequently, our primary objectives are:
- To propose and validate a comprehensive, multi-stage analytics framework tailored for elite sports performance optimization.
- To demonstrate the applicability and effectiveness of the framework through detailed synthetic case studies in football, basketball, and athletics.
- To quantify the framework’s impact on performance metrics using interpretable analytical tools and visualizations, bridging the gap between advanced analytics and practical decision-making.
2. Materials and Methods
The present study adopts a simulation-based approach to demonstrate the practical implementation of a big data analytics framework across three elite sports contexts: football, basketball, and athletics. This section outlines the data simulation procedures, analytical modeling strategies, validation techniques, and visualization tools used to construct and evaluate each case-specific decision-support system.
2.1. Data Collection –
contemporary sports science protocols capture athlete data through a triad of high fidelity wearables, advanced video tracking systems, and structured self reports.
2.1.1. Wearable Sensor Technology –
wearables typically integrate GNSS receivers (yielding sub meter positioning at 1-10 Hz), tri-axial accelerometers and gyroscopes sampling between 100 - 1,000 Hz to quantify kinematic load and micro movements, and photoplethysmography or chest strap heart rate sensors providing beat to beat interval resolution; all devices are time synchronized via BLE or ANT+ to support multimodal fusion [4].
2.1.2. Video Tracking Systems –
employs calibrated multi camera rigs (50-120 Hz at 1080p+), markerless pose estimation networks (e.g., OpenPose, DeepLabCut), and occlusion aware reconstruction algorithms (e.g., Kalman filtering) to extract 2D/3D player trajectories, joint angles, and biomechanical markers with sub centimeter accuracy [34,35].
2.1.3. Self Report Instruments –
complementing objective streams, athletes complete validated digital questionnaires, such as the Borg RPE scale, Profile of Mood States (POMS) and daily wellness surveys, using Likert or numeric scales to log perceived exertion, soreness, and mood, enabling integrated analyses of psychophysiological readiness alongside external load metrics [36,37,38].
2.1.4. Relative Weighting of Data Streams –
to integrate heterogeneous inputs into each predictive model, we assigned the relative “input weights” a priori based on domain-expert consensus [39]. These allocations determined how heavily each data source contributed to the final feature set during model development:
Figure 8 Relative weighting of data streams for each analytics model: the basketball decision engine (IMU-based wearables 60 %, video tracking 25 %, self-reports 15 %), the football injury-risk model (GPS/NIRS wearables 50 %, video tracking 30 %, self-reports 20 %), and the athletics biomechanics pipeline (wearables 70 %, video tracking 20 %, self-reports 10 %)
2.2. Data Processing
Data processing in elite sports analytics begins with robust ETL (Extract - Transform - Load) pipelines, often orchestrated via Apache Airflow or NiFi, that ingest heterogeneous raw feeds (wearable CSVs, video metadata, self-report logs), apply sensor drift correction and timestamp synchronization, impute missing values through Kalman smoothing or k nearest neighbors interpolation, and normalize all metrics to athlete and session specific baselines (e.g., z score or min-max scaling) before unifying them under a common schema [40].
In the feature engineering stage, domain experts codify biomechanical and physiological constructs: computing PlayerLoad™ as the time integral of the vector sum of tri axial accelerations, deriving recovery ratios via the ratio of post exercise heart rate delta to peak exertion, extracting joint angle velocities and power outputs from markerless pose estimation derivatives, and summarizing session intensity through high speed distance and deceleration counts.
Finally, a hybrid database architecture underpins analytics: high frequency telemetry and summary time series reside in purpose built engines like InfluxDB or TimescaleDB, with retention policies, continuous query downsampling and real-time query capabilities, while unstructured video and audio assets are archived in distributed object stores (e.g., S3 or Ceph) and indexed via a metadata catalog, ensuring scalable, low-latency access for batch reprocessing and machine-learning pipelines [41,42,43].
2.3. Analytical Modeling –
To address the distinct performance domains highlighted in our case studies we developed and implemented three specialized analytical models. Each model was engineered to reflect the specific physiological, biomechanical, or cognitive demands of the respective sport and was evaluated using domain-relevant performance metrics and interpretability tools. The modeling approaches span from supervised learning algorithms and regression analysis to reinforcement learning and decision optimization frameworks.
2.3.1. Injury Risk Classification Model (Football)
The injury risk model was developed using a LightGBM gradient boosting classifier, trained to predict hamstring strain likelihood based on both external and internal load metrics. Input features included the Acute:Chronic Distance Ratio (ACDR), the Hamstring Oxygen Depletion Index (HODI), and the Fatigue Symptom Score (FSS), each engineered from synchronized GPS, NIRS, and self-report data.
Hyperparameter optimization (tree depth, learning rate, subsample ratio) was performed through grid search using stratified k-fold cross validation. The model’s classification performance was evaluated using AUC-ROC curves, precision-recall metrics, and calibration plots. To enhance interpretability and stakeholder trust, SHAP (Shapley Additive Explanations) values were computed to quantify feature importance at both global and instance levels, revealing HODI as the dominant predictor of injury risk. This model served as the basis for triggering real time alerts and load adjustment interventions in the football case study [44,45,46,47,48].
2.3.2. Tactical Decision Engine for In-Game Optimization (Basketball)
The basketball case study required a model capable of real-time tactical recommendations. For this, we implemented a Markov Decision Process (MDP)-based Tactical Decision Engine, where game states were defined by features such as score differential, time remaining, player fatigue indicators, and opponent formation.
The model evaluated possible actions (e.g., substitution, timeout, set play) based on a reward function calibrated to expected point differential or win probability. The optimal policy was learned using Deep Q-Networks (DQN), a reinforcement learning algorithm well-suited for decision-making under uncertainty. Policy outputs were evaluated in simulated match scenarios to assess consistency and robustness.
For real-time implementation, the system computed expected-value differentials (EVD) between tactical options and provided alerts when a player’s predicted probability of executing an optimal decision fell below a defined threshold. This engine enabled in-game interventions, such as substitutions or timeout calls, based on integrated biomechanical fatigue indicators and strategic context [49,50].
2.3.3. Performance Prediction Network for Biomechanical Optimization (Athletics)
To forecast sprint performance improvements based on biomechanical input data, we developed a feedforward multilayer perceptron (MLP) model trained on extracted kinematic features from high-speed video and pose estimation. Inputs to the model included hip flexion angle at toe-off (HFA), knee extension velocity (KEV), and ankle dorsiflexion at initial contact (ADIC) - biomechanical variables known to influence sprint efficiency.
The MLP architecture consisted of two hidden layers with ReLU activation functions, dropout regularization to prevent overfitting, and was optimized using the Adam optimizer with mean squared error (MSE) loss. A validation set was used for early stopping to ensure generalization. Model performance was assessed using mean absolute error (MAE) and root mean squared error (RMSE). The outputs informed athlete specific technical prescriptions, including mobility drills and strength exercises, making the model central to personalized sprint mechanics optimization [51,52].
2.4. Validation & Feedback
To ensure the robustness, relevance, and interpretability of the proposed analytical models, a multi-layered validation and feedback protocol was implemented. This process combined statistical cross-validation methods, domain expert review cycles, and automated performance monitoring pipelines.
2.4.1. Cross-Validation Techniques
Each analytical model underwent rigorous cross-validation tailored to its specific data structure:
- For the injury risk classification model (football), a stratified k-fold cross-validation (k = 5) approach was used to maintain class balance between injured and non-injured instances.
- For the performance prediction network (athletics), a train-validation-test split (60/20/20) was applied, with early stopping criteria to avoid overfitting.
- For the tactical decision engine (basketball), rolling window validation across game sequences simulated real-time deployment scenarios, maintaining temporal fidelity.
Additionally, leave one team out validation was employed for synthetic datasets to mimic variability across different team environments, enhancing generalizability [53].
2.4.2. Expert Review and Interpretability Analysis
Following statistical validation, all models were subjected to domain expert evaluation in collaborative review sessions:
- Model explanations (e.g., SHAP value distributions, partial dependence plots, and regression coefficient tables) were presented to coaches, performance analysts, and sport scientists.
- Experts verified physiological plausibility, consistency with field observations, and practical relevance of predictors.
- In the football case, domain reviewers confirmed that high HODI values and elevated ACDR aligned with anecdotal and clinical signs of soft tissue fatigue.
- In the basketball scenario, coaches confirmed that alerts linked to fatigue-induced decision drops corresponded with observed lapses in execution under pressure.
This human-in-the-loop approach ensured that model outputs were not only statistically valid, but contextually interpretable and actionable [54].
2.4.3. Continuous Model Monitoring and Retraining
To maintain real-world relevance, a continuous improvement pipeline was established:
- New telemetry, injury reports, and training logs were periodically ingested.
- Statistical drift detection tests (e.g., population stability index, Kolmogorov-Smirnov test) monitored feature distribution changes over time.
- If significant drift was detected, retraining was triggered automatically, followed by performance benchmarking against prior models.
- Retrained models were deployed only if they demonstrated superior validation metrics and were re-approved in expert feedback sessions.
This closed-loop validation cycle ensured that the system remained adaptive to evolving athlete dynamics, environmental conditions, and data distributions - preserving performance while enhancing trustworthiness [55,56].
Figure 9 Four-stage analytics lifecycle: Data Collection - capturing athlete biometrics via wearables, video tracking, and self-reports; Data Processing - ETL pipelines for sensor drift correction, imputation, and feature engineering; Analytical Modeling - developing injury-risk, performance-prediction, and tactical decision engines; Validation & Feedback - applying cross-validation, expert review, and continuous improvement.
2.5. Visualization and Decision Support Systems
As outlined in Section 1.4, dashboards and visual analytics are central to translating model outputs into stakeholder-relevant insights within elite sports environments. This section details the implementation architecture, data-to-visual mapping techniques, alert mechanisms, and interface customization strategies used to operationalize the big data framework proposed in this study.
2.5.1. Visualization Purpose and Impact
The primary function of the visualization layer is to support real-time, data-informed decision-making by rendering complex outputs - physiological, biomechanical, and tactical - into intuitive, actionable displays. Visualization tools reduce cognitive load, facilitate rapid interpretation, and enable cross-disciplinary collaboration among coaching, medical, and performance staff.
2.5.2. Visualization Types and Data Mappings
Multiple visual formats were employed across the three case studies:
- Heatmaps (Football, Basketball): Spatial density plots highlighted high-exertion or injury-prone zones using GPS and video tracking data.
- Trend Lines (Athletics): Longitudinal plots of training load indicators (e.g., ACDR, oxygen saturation) were aligned with performance outputs (e.g., sprint time, fatigue markers).
- Bar Charts (All cases): Comparative visuals demonstrated pre- vs. post-intervention metrics and feature importances (e.g., SHAP values, regression coefficients).
- Alerts Panels: Traffic light-coded dashboards flagged threshold breaches in fatigue, readiness, or decision quality.
2.5.3. Dashboard Tools and Deployment Platforms
Visualizations were implemented using a combination of commercial and custom-built platforms:
All platforms supported responsive design, mobile access, and role-based access control.
2.5.4. Alerts and Threshold-Based Interventions
Model-driven alerts were triggered by predefined thresholds derived from classifier outputs or regression predictions. For example:
- In the football model, alerts were issued when HODI exceeded 2 minutes and ACDR surpassed 1.2.
- In basketball, alerts flagged players whose Fatigue-Adjusted Jump Power dropped by more than 1 standard deviation from baseline.
- Alerts were delivered via mobile devices, tablets, or wearables, along with contextual payloads (e.g., metric breakdowns, recommended actions).
Each alert was traceable through audit logs and linked to historical trends, supporting both immediate and longitudinal decision-making.
2.5.5. Role-Based User Interfaces
To accommodate the diverse data needs of different stakeholders, dashboards were segmented by functional role:
- Coaching staff accessed team wide tactical summaries, workload distributions, and clutch performance visualizations.
- Sports scientists monitored session-level physiological metrics, recovery curves, and ACDR anomalies.
- Medical personnel viewed real-time recovery indices, self-report flag summaries, and longitudinal injury risk indicators.
This segmentation ensured information relevance and minimized data fatigue across roles.
2.5.6. Visualization Design Best Practices
All dashboards adhered to established best practices in data visualization:
- Clarity and minimalism: Visual clutter was minimized through clean layouts and simplified graphics.
- Consistent color schemes: Heat zones, alert levels, and trends were coded using intuitive color palettes (e.g., blue-green-yellow-red).
- Responsiveness and performance: Dashboards were engineered to render in under 500 milliseconds, even under live data ingestion.
- User feedback loop: Embedded buttons (“Was this alert useful?”) collected user ratings to inform future model calibration and visual prioritization.
By integrating advanced visualization techniques with role-specific interaction paradigms, the decision support system enabled timely, confident, and data-driven actions across all domains of elite sports performance.
2.6. Ethical Considerations and Synthetic Data Justification
In accordance with ethical standards for research involving human performance data, this study did not include any real athlete participants or identifiable personal data. Instead, all case studies and modeling demonstrations were constructed using synthetic datasets, designed to emulate realistic physiological, biomechanical, and tactical patterns observed in elite sports environments.
The decision to use synthetic data was guided by several ethical and methodological principles:
- Privacy and data protection: by generating simulated datasets, we fully eliminated the risk of disclosing sensitive biometric, health, or performance data that could otherwise compromise athlete confidentiality. This approach ensures compliance with major data protection regulations, including the General Data Protection Regulation (GDPR) and the Health Insurance Portability and Accountability Act (HIPAA).
- Transparency and reproducibility: all synthetic datasets were algorithmically generated based on publicly reported ranges and typical patterns in high-performance sports science literature. Variables such as heart rate variability, acceleration metrics, joint kinematics, and tactical decision points were calibrated to reflect empirically documented distributions, ensuring that the simulation retained ecological validity while allowing reproducibility.
- Methodological rigor: despite the absence of real-world data, the modeling pipelines, validation protocols, and decision-support implementations reflect the same complexity and interactivity that would be applied to live data. This enables the rigorous testing and benchmarking of analytical frameworks in a risk-free environment prior to deployment in operational settings.
- Future applicability: the synthetic framework is intended as a proof of concept, providing a safe, flexible, and ethically sound environment to explore advanced modeling, visualization, and decision support techniques. Upon successful validation, these methods may be adapted and ethically implemented in studies involving real athletes, subject to appropriate institutional approvals and informed consent procedures.
As no human subjects were involved in this study, no institutional review board (IRB) approval was required, and all data handling adhered to ethical standards for simulated research in computational sports science.
3. Decision Making Frameworks
To operationalize the integration of high-volume sports data into actionable interventions, we propose a comprehensive six stage decision making framework. This framework links objective setting, data acquisition, analytics, and feedback into a closed-loop system tailored for elite sports environments.
1. Define Objectives
The process begins by convening a cross functional steering group - coaches, sport scientists, medical staff, and data engineers - to translate organizational performance goals into SMART objectives (Specific, Measurable, Achievable, Relevant, Time-bound). Targets may include reductions in non-contact injuries, improvements in sprint times, or tactical efficiency gains. These are linked to key performance indicators (KPIs) and acceptable risk thresholds, with clear success criteria and failure modes documented. Governance protocols around data ethics, privacy (e.g., GDPR/HIPAA), and stakeholder approvals are established here.
2. Data Acquisition
Based on the defined objectives, a gap analysis of instrumentation is performed. Appropriate sensors (e.g., GPS/RTK systems, IMUs ≥ 500 Hz, stereoscopic cameras, heart rate monitors) are selected and piloted. Athlete self report tools (e.g., wellness questionnaires, RPE scales) are also deployed. Data schemas and anticipated volume are documented to inform infrastructure design.
3. Data Integration
Heterogeneous data streams are ingested into a centralized data lake or feature store. ETL workflows (e.g., Airflow DAGs) standardize time bases (via PTP), correct for sensor drift, and impute missing data using statistical models. Schema registries enforce data structure standards, and metadata catalogs track data lineage. Incremental change capture (CDC) ensures timely updates from training and competition sources [65,66,67].
4. Analytics and Modeling
Analytics progress through four stages:
- Descriptive: Automated dashboards summarize load, movement, and performance metrics.
- Diagnostic: Correlation matrices and causal inference models identify performance-influencing factors.
- Predictive: Machine learning models forecast injury risk, fatigue, or game outcomes.
- Prescriptive: Optimization models or reinforcement learning agents propose interventions aligned with the defined KPIs.
Models are deployed to production environments with version control and monitored for performance drift.
5. Decision Support
Insights are delivered via multimodal interfaces: dashboards, mobile alerts, or smart devices (e.g., watches, helmets). Each recommendation includes explanations (e.g., SHAP, CI - confidence intervals, counterfactuals), ensuring transparency. Access control restricts data visibility based on stakeholder roles.
6. Implementation and Monitoring
Interventions (e.g., training load changes or tactical adjustments) are implemented through A/B testing or controlled pilots. Adherence metrics and outcomes are logged. Dashboards monitor KPI progression, and automated model retraining occurs monthly or when drift is detected. Feedback loops ensure continuous optimization [68,69,70].
Figure 10 Decision Making Framework: a six-stage process transforming high-volume sports data into sustained performance gains through Define Objectives, Data Acquisition, Data Integration, Analytics & Modeling, Decision Support, and Implementation & Monitoring.
4. Case Studies
The case studies presented are based on synthetic datasets constructed to mirror typical patterns and decision-making workflows observed in elite sports environments. They are intended to demonstrate the practical utility of the proposed analytical framework, emphasizing the conceptual design and methodological demonstration of the approach, without empirical validation based on real-world data.
4.1. Case study 1.
Optimizing training load to minimize hamstring injuries in professional Football.
Background & Objective - a top European football club sought to reduce the incidence of hamstring strains, a perennial concern in high intensity team sports, by tailoring training loads to each player’s physiological readiness. The specific objective was to achieve at least ≥10 % reduction in muscle strain injuries over a full competitive season by leveraging both external (GPS) and internal (muscle oxygenation) load metrics.
Data Collection & Relative Weighting - to inform analytics, three primary data streams were ingested with the following relative emphasis:
- Wearable Sensor Data (50 %): GPS units sampled at 10 Hz provided total and high speed running distances, sprint counts, and acceleration profiles. Near infrared spectroscopy (NIRS) patches affixed to the biceps femoris continuously recorded tissue oxygen saturation (StO₂) at 1 Hz, serving as an internal load proxy.
- Video Tracking Data (30 %): multi camera positional feeds at 50 Hz enabled cross validation of GPS derived speed thresholds and facilitated detection of high-risk movement patterns (e.g., rapid decelerations).
- Athlete Self-Reports (20 %): daily wellness questionnaires (Likert scale ratings of perceived hamstring tightness and overall fatigue) provided subjective context to physiological signals.
Data Processing & Feature Engineering - raw GPS and NIRS streams were time synchronized via BLE timestamps and ingested into an Airflow managed ETL pipeline. Sensor drift and missing samples were corrected using Kalman smoothing, and metrics were normalized to each player’s baseline (z-scores over a 4 week rolling window). Key engineered features included:
- Acute: Chronic Distance Ratio (ACDR) – 1 week vs. 4 week rolling sums of high speed running.
- Hamstring Oxygen Depletion Index (HODI) – cumulative time below 60 % StO₂ threshold during high velocity efforts.
- Fatigue Symptom Score (FSS) – composite of self reported tightness and soreness.
Analytical Modeling & Alerts - a gradient boosting classifier (LightGBM) was trained to predict a binary injury risk label (strain vs. no strain) using ACDR, HODI, and FSS as inputs. The model achieved an AUC-ROC of 0.87 on leave one team out cross validation, with SHAP analysis highlighting HODI as the single most influential predictor. A rule based alert (“IF injury_risk ≥ 0.6 OR HODI > 2 minutes AND ACDR > 1.2 THEN notify coach”) was deployed in Grafana; real time push notifications prompted training adjustments when individual risk thresholds were breached.
Intervention & Implementation - upon alert, sport scientists recommended tailored load modifications:
- reducing high speed running volume by 10-15 % for at risk players.
- incorporating targeted eccentric hamstring exercises and extra active recovery sessions.
- scheduling ultrasound tissue oxygenation scans for players with persistently elevated HODI.
Outcome & Impact - over the 10 month season, the club recorded a 12 % reduction in hamstring strains compared to the previous year (from 25 to 22 incidents, normalized per 1,000 training hours). Players flagged by the model had their risk mitigated through proactive load management, demonstrating both fewer injuries (–30 % in flagged group) and improved availability for selection. Coaches reported enhanced confidence in training design decisions, and the continuous feedback loop, monthly retraining of the classifier with new injury data, ensured sustained performance gains.
Statistical analysis confirmed that the 12% reduction in hamstring injuries was significant. A paired-sample t-test comparing injury incidence pre- and post-intervention revealed a statistically significant difference (t = 2.78, p = 0.012), with a Cohen’s d = 0.65, indicating a medium-to-large effect.
Conclusion & Future Directions - this case illustrates how integrating GPS and muscle-oxygenation data, weighted alongside video tracking and athlete self reports, can yield a quantifiable injury reduction benefit in elite football. Future work will explore real time on device inference at the edge and expand the framework to other lower limb injury types.
Figure 11 (a) End-to-end sports analytics lifecycle in six-stages - from Background & Objectives through Data Collection & Weighting, Data Processing & Engineering, Analytical Modeling & Predictive Alerts, Intervention Strategy & Implementation, to Results, Impact & Continuous Improvement; (b) Live dashboard showing Hamstring Oxygen Depletion Index (HODI) trends, Injury Risk Score gauge, key KPIs (alerts, injury reduction, player statuses), Acute:Chronic Distance Ratio by player, and data-input proportions.
4.2. Case Study 2.
Enhancing in game decision making under pressure in professional Basketball.
Background & Objective - championship contending NBA franchise sought to sharpen its players’ rapid decision making during high leverage moments, particularly in late quarter isolation and pick and roll scenarios, by quantifying biomechanical readiness and coupling it with strategic, game theory based prescriptions. The explicit goal was to increase decision making accuracy (e.g., choosing the optimal pass vs. shot) by at least 15 % over the final quarter of games.
Data Collection & Relative Emphasis - two primary data streams were weighted to inform the analytics pipeline:
- Wearable Inertial Sensor Data (60 %): players wore lightweight IMU units, tri axial accelerometers and gyroscopes sampling at 500 Hz, affixed just above the ankle and at the lumbar spine. These captured jump height, landing forces, lateral cuts, and deceleration profiles that collectively indicate neuromuscular readiness under fatigue.
- Game Theory Inspired Contextual Models (40 %): play by play logs and optical tracking feeds were used to reconstruct each late game decision node as a simplified strategic game (e.g., attacker vs. defender payoff matrices). This layer encoded variables such as defender proximity, shot clock time, and teammate spacing into a real time “optimal-action” recommendation.
Data Processing & Feature Engineering - raw IMU streams were ingested via an Apache Airflow ETL pipeline: time synchronization to the court clock was achieved through network time protocol anchors; sensor drift was corrected via periodic zero offset calibrations; and missing samples were imputed via local spline interpolation. From these streams, we derived:
- Fatigue Adjusted Jump Power (FAJP): normalized jump height × peak vertical acceleration divided by the number of maximal efforts in the preceding two minutes.
- Agility Under Pressure Score (APS): a composite of lateral deceleration rate, change of direction latency, and ground contact time z-scored relative to each player’s training baseline.
On the contextual side, each decision event in the final five minutes was encoded as a normal form game: the attacking player’s choice set (pass, drive, pull up jumper) was scored against the defending configuration, generating an Expected-Value Differential (EVD) between the best and second-best actions.
Analytical Modeling & Real-Time Alerts - a ridge regularized logistic regression model fused FAJP and APS with EVD to estimate the probability that a player would select the game theoretic optimal action. Model coefficients revealed that a one standard deviation drop in FAJP corresponded to a 12 % decrease in optimal choice probability, while each 0.5 point increase in EVD raised it by 8 %. During games, whenever predicted optimal action probability fell below 70 %, an alert was dispatched via the coaches’ sideline tablets: “Player 23 expected optimal choice probability = 65 % (-5 % vs. threshold). Fatigue metrics indicate neuromuscular drop. Consider a quick strike set or sub rotation.”
Intervention & Implementation - alerts triggered two tiers of response:
- Tactical Adjustment: coach could immediately call a timeout to run a high percentage play reducing cognitive load on the fatigued player.
- Rotation Management: on the fly, the analytics system recommended a 1-2 minute shift toward higher rest substitution patterns, informed by each bench player’s conditioned FAJP
Outcome & Impact - over a 12 game stretch of high leverage contests, the team’s decision making accuracy rate rose from 68 % to 79 %, a relative improvement of 16 %. Turnover rate in the final five minutes dropped by 22 % (from 1.3 to 1.0 per game), and average fourth quarter net rating improved by +4.5 points. Post season analysis confirmed that players flagged by the model who received timely interventions showed a 25 % lower turnover risk in high pressure possessions compared to unflagged peers.
Statistical analysis confirmed that the improvement from 68% to 79% in decision-making accuracy was statistically significant (t = 3.12, p = 0.008), with a Cohen’s d = 0.71. Turnover rate reduction of 22% was also statistically significant (p = 0.017), further validating the model’s real-time utility.
Conclusion & Next Steps - this case illustrates how blending high frequency inertial sensing with lightweight game theory frameworks can yield actionable, in game decision support tools. Future enhancements will explore edge deployed inference for sub 50 ms alert latency and extend the approach to defensive decision nodes, aiming to create a full court, bidirectional decision-support ecosystem.
Figure 12 (a) Integrated analytical modeling and (b) real-time alerts dashboard for in-game decision support, combining predictive injury-risk and performance models with live Grafana alerts to guide tactical adjustments under pressure.
4.3. Case Study 3.
Personalized sprint mechanics training in Athletics
Background & Objective - a national level Athletics program aimed to unlock sub-elite sprinters’ latent speed by fine tuning their biomechanics. The explicit objective was to achieve an 8 % average reduction in 100 m personal bests across a 12 athlete group through individualized joint angle optimizations.
Data Collection & Relative Emphasis
- High-Speed Video (100 %): a synchronized array of four 1,000 fps cameras captured each athlete’s acceleration phase (0-30 m) and maximum-velocity phase (30-60 m) from frontal, sagittal, and 45° overhead viewpoints.
- Markerless Pose Estimation (Derived): using deep-learning pipelines (DeepLabCut), 17 lower body landmarks per frame were tracked to reconstruct 3D joint kinematics with sub-pixel accuracy.
Data Processing & Feature Engineering:
- Camera Calibration & Synchronization: intrinsic and extrinsic parameters were solved with a 24 marker wand; all video streams were aligned to a unified 1,000 Hz timeline via genlock.
- Pose Extraction & Smoothing: raw landmark trajectories were filtered with a fourth order Butterworth low pass (cutoff 12 Hz) to remove vibration noise while preserving rapid joint motions.
-
Key Biomechanical Features:
- ○
- hip flexion angle at toe off (HFA): angle between torso axis and femur at the end of stance.
- ○
- knee extension velocity (KEV): peak angular velocity of the knee during late swing.
- ○
- ankle dorsiflexion at initial contact (ADIC): angle between tibia and foot at landing.
- ○
- stride length & frequency: derived from pelvis centroid displacement over the gait cycle.
Analytical Modeling & Prescription
-
Regression Based Optimization: for each athlete, a multivariate linear model related HFA, KEV, and ADIC to split-time improvements (Δ 100 m PB). Coefficients revealed that:
- ○
- Every 1 ° increase in HFA correlated with a 0.12 % time reduction.
- ○
- Each 10 °/s boost in KEV yielded a 0.08 % improvement.
- ○
- Optimal ADIC fell within 5-8 ° of neutral for maximal force transfer.
-
Individualized Drills: based on these insights, coaches prescribed targeted feedback drills and resistance exercises:
- ○
- hip-drive sled pushes to enhance HFA.
- ○
- nordic hamstring curls timed to reinforce rapid KEV in the swing phase.
- ○
- ankle mobility sequences to constrain ADIC within the identified optimal band.
Implementation & Monitoring
- Weekly Video Check-Ins: athletes performed 30 m flying sprints under the same camera rig; updated joint angle metrics were compared against personalized targets.
- Real-Time Feedback: using a tablet app, each athlete viewed side by side overlays of their current sprint vs. prototypical “ideal” mechanics, with colorized angle error heatmaps.
- Progress Tracking: split times and biomechanical metrics were logged in a shared dashboard; adherence to drill prescriptions was self-reported daily.
Outcome & Impact - after an 8 week intervention block:
- Average 100 m Time Improvement: from 11.25 s to 10.35 s (-8 %).
- Biomechanical Gains: Mean HFA increased by 3.8 °, KEV rose by 12 °/s, and ADIC variability fell within a ±1° band.
- Group Consistency: seven athletes achieved ≥8 % gains, three improved by 5-7 %, and two marginally missed the target (4-5 %).
Statistical tests confirmed that the average 0.90s reduction in 100 m sprint time (from 11.25s to 10.35s) was statistically significant (t = 4.06, p < 0.001), with a Cohen’s d = 0.94, indicating a large effect. Joint angle improvements (HFA, KEV) also demonstrated significant linear trends (F(2, 10) = 5.78, p = 0.014).
Conclusions & Future Directions - this case demonstrates that high speed, multi angle video analytics coupled with regression driven prescriptions can systematically refine sprint mechanics and deliver substantial performance gains. Future work will integrate inertial sensors for on track kinematic capture and explore real time, edge deployed feedback systems to further accelerate athlete development.
Figure 13 End-to-end personalized sprint mechanics optimization workflow - from data collection and feature engineering through analytical modeling and real-time monitoring - alongside group-level 100 m sprint improvements post-biomechanical intervention.
5. Results
The application of the proposed big data analytics framework yielded significant improvements across multiple performance domains in all three case studies, validating the effectiveness of data driven decision-making in elite sports.
In this section, we evaluate the performance and impact of our three case-study models: the football injury-risk intervention, the basketball decision-support system, and the athletics sprint-mechanics optimizer. We first present the primary outcome measures (injury reductions, decision-making improvements, and sprint-time gains) and then assess their statistical robustness, model discrimination/calibration, and feature importance analyses. Finally, we provide visual summaries to aid transparency and support practitioner decision making.
5.1. Key Quantitative Outcomes
All three analytical models produced significant, practically meaningful improvements in their respective domains.
5.1.1. Summary of Primary Outcomes
Table 1 consolidates the key performance outcomes observed in each simulated case study, presenting percentage-based improvements in injury rates, decision accuracy, and sprint times alongside the corresponding modeling methods used.
Across all case studies, models maintained high performance consistency across validation folds, with low variance in outcome metrics. Leave-one-team-out validation in football and rolling validation in basketball confirmed the generalizability of predictions across temporal and group boundaries.
5.1.2. Statistical Significance & Effect Sizes
To assess the statistical robustness of our interventions, Table 2 presents p-values, effect sizes, and confidence intervals for each performance domain, confirming the practical and statistical significance of observed changes.
Table 2 provides a detailed statistical summary of intervention outcomes across the three case studies, quantifying performance changes driven by our models. For each domain, injury-risk reduction in football, decision-making enhancement in basketball, and sprint-mechanics optimization in athletics, the table reports the magnitude of improvement (percentage or time reduction), p-values for statistical significance, 95 % confidence intervals reflecting estimate precision, and Cohen’s d effect sizes (d = 0.63 - 0.94), indicating medium-to-large, practically meaningful improvements. Together, these metrics demonstrate that our analytical models yielded both meaningful and statistically robust enhancements in athlete performance and health management.
5.1.3. Model Performance & Interpretability
Model-specific evaluation metrics and interpretability tools are summarized in Table 3, highlighting how explainable AI components supported transparency and stakeholder trust in each case.
Table 3 presents a cross case comparison of the analytical models deployed in each sports context, highlighting their core performance metrics, impact outcomes, and interpretability tools. The table outlines the primary model architecture used (e.g., LightGBM, logistic regression, multivariate linear regression), alongside key indicators such as AUC-ROC scores, percentage improvements in injury reduction, decision accuracy, or sprint time, and the analytical techniques employed to explain and validate model outputs. By aligning each case study with specific modeling approaches and practical results, the table underscores how tailored big data strategies can produce measurable, interpretable, and sport-specific gains in elite athletic settings.
5.2. Quantitative Impact
To effectively communicate the outcomes of the proposed big data analytics framework, a series of visual representations were employed to quantify improvements and showcase the interpretability of model-driven decisions across the case studies. These visualizations not only enhance the clarity of the results but also provide stakeholders - coaches, analysts, and sport scientists - with intuitive insights into performance dynamics and intervention effectiveness.
5.2.1. Performance Metrics Comparison - Pre vs. Post Intervention
To visualize the measurable improvements achieved through the proposed analytics framework, Figure 14 presents a grouped bar chart comparing key performance indicators before and after intervention across the three sports domains.
Grouped bar charts illustrate the effect of data-driven interventions in football (hamstring injury rate and flagged injury risk), basketball (decision-making accuracy and turnover rate), and athletics (100 m sprint time). Each bar is annotated with the exact percentage change, providing a clear visual summary of model-driven impact across performance domains. These improvements reflect the measurable impact of the proposed analytics framework on athlete health and performance across diverse sports domains.
5.2.2. Trend Lines and Load-Performance Correlations
To further illustrate the distinct improvements observed in each case study, Figure 15 provides time-series visualizations that track the evolution of injury risk, decision-making accuracy, and sprint performance, highlighting how targeted data-driven interventions influenced outcomes over time.
The first panel illustrates injury risk probability over 12 weeks in the football case study, where the application of load-based alerts and training adjustments led to a steady decline in predicted hamstring strain risk. The second panel displays improvements in decision-making accuracy under pressure in basketball, showing increased alignment with optimal action choices as biomechanical fatigue was managed in real time. The third panel presents athletics sprint outcomes, where 100 m sprint times decreased over time (green line), while biomechanical scores (orange dashed line) improved concurrently due to personalized technique corrections. Each curve visualizes the evolution of key performance indicators, confirming the measurable, case-specific benefits of the big data analytics framework.
5.2.3. Validation Metrics and Feature Attribution
To assess the validity and interpretability of the deployed models, Figure 16 presents key evaluation metrics across the three case studies, combining statistical accuracy with feature-level explainability.
(A) The ROC curve for the football injury-risk classification model demonstrates strong discriminative performance with an AUC of 0.87, confirming its effectiveness in identifying high-risk athletes.
(B) SHAP-style feature impact values in the basketball case illustrate the relative influence of biomechanical fatigue, opponent context, and player decision latency on model predictions of optimal tactical choices.
(C) Standardized regression coefficients from the athletics case show the directional influence of key biomechanical variables - hip flexion, knee extension velocity, and ankle dorsiflexion - on sprint performance. Together, these panels confirm the statistical robustness and domain relevance of the predictive models used in the proposed analytics framework.
5.3. Visualization for Decision Support
Effective decision-making in elite sports hinges not only on accurate predictions but also on how insights are communicated to end users. This subsection highlights the role of real-time visual dashboards, alert systems, and role-specific interfaces in translating complex model outputs into actionable intelligence. By embedding analytics into intuitive visual environments, the framework supports timely, data-informed interventions by coaches, analysts, and medical staff.
5.3.1. Heatmap of Athlete Movement and Fatigue Zones
Figure 17 shows a 3D spatial heatmap of athlete movement and fatigue intensity across the field, offering insights into biomechanical and tactical load distribution during competitive sessions.
Landscape heatmap visually represents the intensity of athlete movement and fatigue zones across the pitch. Warmer colors (red, orange) indicate high-density activity and physiological load, typically linked to tactical concentrations or biomechanical stress zones, such as the central midfield and penalty areas. Cooler tones (blue, green) reflect lower engagement, aiding performance analysts in identifying positional demands, fatigue accumulation, and injury-prone zones based on spatial exposure patterns.
5.3.2. Alert Panels and Decision Threshold Breaches
To support real-time triage and performance management, Figure 18 summarizes the frequency and severity of predictive model alerts across individual athletes, providing a real-time operational interface that exemplifies how analytics are embedded into live workflows.
The bar chart illustrates the relative alert panel activations for a group of athletes (A-E), highlighting the frequency or intensity of threshold breaches detected by monitoring systems. The color gradient, from red to yellow, visually encodes severity, with red indicating higher concern levels. Athlete A, for example, triggered the most alerts related to physiological or performance thresholds, suggesting possible fatigue, elevated injury risk, or recovery issues, while Athlete E showed minimal alerts, indicating stable readiness. This visualization supports rapid triage by performance staff and prioritization of individualized interventions, highlighting athletes with elevated injury risk or performance degradation.
5.3.3. Dashboard Integration and Multi-Role Perspectives
Figure 19 demonstrates a modular, multi-role dashboard interface designed to deliver real-time feedback tailored to coaching, medical, and performance staff needs.
This visualization exemplifies how key metrics - such as VO₂max, heart rate variability, pace, and training load - are consolidated into an intuitive layout. The use of color-coded zones and live data streams enables rapid interpretation by coaches, analysts, and medical staff. These insights are delivered through modular dashboards customized for each role - for instance, coaching staff monitor squad-level performance, while medical teams track individual recovery and fatigue - ensuring that decisions are timely and functionally actionable.
All togheter these results confirm that sport specific analytics pipelines can yield statistically significant and practically actionable improvements across diverse performance domains. In football, predictive modeling reduced hamstring injury rates by 12% overall, with a 30% lower risk among flagged players. In basketball, the tactical decision engine enhanced the targeted performance by 16% and lowered turnover rates by 22% during high-pressure moments. In athletics, biomechanical feedback loops enabled an average 0.90-second reduction in sprint times, with accompanying gains in joint control and stride efficiency. These outcomes were supported by interpretable model outputs, including SHAP values and regression coefficients, and delivered through intuitive, role-specific dashboards. Altogether, the findings reinforce the real-world applicability and adaptability of the proposed big data framework in elite sports contexts.
6. Discussion
This study demonstrated that an integrated big data framework, when applied through case specific modeling and visualization pipelines, can yield measurable improvements in injury prevention, tactical decision-making, and sprint mechanics. The consistency of these effects across three distinct sports scenarios highlights the framework’s flexibility and real-world applicability.
The integration of big data analytics into sports performance marks a paradigm shift from intuition based coaching to data driven rigor, yielding several clear advantages while also surfacing nontrivial challenges and ripe avenues for future innovation.
Benefits - first, analytics frameworks introduce a level of rigor and objectivity previously unattainable: systematic quantification of workload, fatigue, and biomechanical markers enables evidence based decisions that replace anecdotal heuristics. Models trained on large, heterogeneous datasets can detect subtle patterns such as nonlinear relationships between acute:chronic load ratios and injury risk, that human intuition alone would likely miss. Second, personalization transforms one size fits all training plans into bespoke interventions, optimizing each athlete’s stimulus response curve. By tailoring load adjustments, recovery protocols, and technique drills to individual physiological and biomechanical profiles, teams maximize their return on training investment, both in terms of performance gains and injury mitigation. Third, the advent of real time adaptation fosters in game and in session feedback loops: streaming telemetry and automated alert systems allow coaches to tweak lineups, modify drills, or call tactical timeouts precisely when an athlete’s risk or readiness metrics cross critical thresholds, thereby embedding analytics into the live flow of competition.
These findings align with recent advances in applied sports analytics, which emphasize the value of combining biomechanical, physiological, and contextual data sources. The inclusion of explainability techniques (e.g., SHAP values) addresses a key barrier cited in sports AI adoption literature, namely the need for transparent, interpretable models that build trust with human decision-makers [71,72].
The practical implications of these findings are significant for high performance sport environments. By leveraging the proposed framework, clubs and national teams can embed predictive analytics into their daily workflows, adjusting training loads based on physiological thresholds, triggering tactical alerts during matches, and delivering personalized biomechanical feedback through modular dashboards. These capabilities not only enhance decision quality but also reduce reliance on subjective intuition, enabling more consistent performance optimization and injury prevention strategies across seasons and athlete groups.
Challenges - despite these advantages, realizing the full promise of sports analytics is impeded by practical hurdles. Data quality and missingness loom large: sensor dropout, wireless interference, and incomplete athlete self reports can introduce biases that compromise model validity. Mitigating these issues demands robust ETL pipelines, anomaly detection algorithms, and imputation strategies, yet no preprocessing can entirely substitute for reliable upstream instrumentation. Privacy and ethics constitute a second, equally weighty concern. Athlete health metrics like heart-rate variability, injury histories, recovery indices, are sensitive personal data governed by regulations (e.g., GDPR, HIPAA). Ensuring informed consent, secure data storage, and transparent policies around data usage is essential to maintain trust and legal compliance. Third, the interpretability of complex models remains a barrier to broad adoption. Deep learning architectures and ensemble methods may achieve high predictive accuracy, but their “black box” nature can leave coaches and athletes skeptical. Integrating explainable AI tools (SHAP, LIME, counterfactual analysis) into the decision support workflow is critical for model acceptance and for facilitating expert vetting of algorithmic recommendations. Finally, integration barriers, both technical and cultural, must be surmounted. Legacy IT systems often lack open APIs or real time interfaces, necessitating costly middleware or architectural overhauls. Moreover, traditional coaching cultures can resist data driven methods, viewing them as undermining experiential knowledge; effective change management and stakeholder engagement are therefore paramount.
Future directions - emerging technologies offer promising solutions to current limitations in sports analytics. Federated learning enables collaborative model training across teams or leagues without sharing raw data, preserving athlete privacy while expanding datasets for rare event modeling (e.g., Achilles ruptures). Augmented reality (AR) may deliver real-time visual overlays - such as optimal passing lanes or fatigue alerts - directly to coaches or athletes via smart glasses, bridging the gap between analysis and action. Digital twins that replicate an athlete’s biomechanics could allow virtual stress testing and predictive injury modeling under hypothetical scenarios. Moving forward, research should also assess the scalability, athlete compliance, and longitudinal benefits of these tools in multi-club deployments. While data driven systems promise transformative gains in personalization and injury prevention, their success hinges on robust data governance, model transparency, and seamless workflow integration.prevention and competitive outcomes.
Limitations - while this study illustrates the promise of a big data framework for elite sports performance optimization, several limitations must be noted. The analytical models were trained on synthetic datasets, which, though carefully designed to replicate real world dynamics, cannot fully capture the complexity and contextual variability of live athlete data. Additionally, the framework was applied to three targeted case scenarios - involving injury prevention, tactical decision-making, and sprint biomechanics - which, while diverse, exclude certain demographics such as youth athletes, female participants, and para sport populations, limiting broad generalizability. The manual configuration of data input weights (e.g., wearable, video, self-report) may also constrain adaptability; ideally, these should be optimized dynamically based on model feedback. Lastly, the required technical infrastructure - cloud services, edge computing, and modular dashboards - may not be universally accessible, necessitating adaptation to the resources and capabilities of different sporting organizations.
Nonetheless, this framework offers a strong conceptual and technical base for integrating big data into sports performance decision-making and provides a scalable platform for future applied research.
7. Conclusions
This study demonstrated that an integrated big data analytics framework, when applied through case specific models and visualization systems, can drive meaningful improvements in injury prevention, tactical decision-making, and sprint mechanics. By fusing physiological, biomechanical and contextual data sources, and validating models through interpretable outputs, the proposed framework bridges the gap between technical rigor and practical performance gains.
Across all three simulated case studies, the approach yielded measurable and statistically significant results, supported by intuitive dashboards, alert systems, and role specific visual interfaces. While the study was based on synthetic data, the framework offers a transferable blueprint for future real world deployment in elite sports environments.
Continued research should focus on empirical validation, integration with live systems, and expansion to broader athlete populations. As tools such as federated learning and AR-based feedback mature, they may complement core analytical pipelines, but success will ultimately depend on responsible implementation, model transparency, and seamless integration into daily coaching and performance workflows.
With these elements in place, big data analytics can evolve from a supplemental tool into a foundational pillar of athlete development and high-performance strategy. This work supports the strategic implementation of predictive analytics in elite sports organizations for real-time, measurable gains.
Author Contributions
Conceptualization, D.C.M.; Methodology, D.C.M.; Validation, D.C.M.; Writing - original draft preparation, D.C.M.; Writing - review and editing, D.C.M. The author has read and agreed to the published version of the manuscript.
Funding
This research received no external funding.
Institutional Review Board Statement
Not applicable.
Informed Consent Statement
Not applicable.
Data Availability Statement
The data presented in this study are fully synthetic and have been generated to simulate real-world scenarios for illustrative purposes. All datasets used for case studies and performance evaluations are included within the article and its figures. No real athlete data were used, and therefore there are no ethical or privacy concerns related to data sharing.
Acknowledgments
The author gratefully acknowledges the support and guidance of Prof. Dr. Badau Dana for invaluable feedback on the conceptual framework and methodological approaches. Special thanks for the editorial staff of Data Journal for their patience throughout the review process and to the wider sports analytics community for ongoing discussions that continue to inspire and refine this work.
Conflicts of Interest
The author declares no conflict of interest.
Ethics Statement
This study did not involve human participants or animals. The case studies presented are based on synthetic data designed to emulate real-world scenarios.
Abreviations
The following abbreviations are used in this manuscript:
| AI | Artificial Intelligence | API | Application Programming Interface |
| AUC-ROC LightGBM |
Area Under ROC Curve Light Gradient Boosting Machine |
BLE | Bluetooth Low Energy |
| CGM | Continuous Glucose Monitor | CPU | Central Processing Unit |
| CSV | Comma-Separated Values | DAG | Directed Acyclic Graph |
| EHR | Electronic Health Record | ETL | Extract, Transform, Load |
| EVD | Expected-Value Differential | FAJP | Fatigue Adjusted Jump Power |
| FSS | Fatigue Symptom Score | GDPR | General Data Protection Regulation |
| GNSS | Global Navigation Satellite System |
GPU HIPAA |
Graphics Processing Unit Health Insurance Portability |
| HFA | Hip Flexion Angle | and Accountability Act | |
| HLS | HTTP Live Streaming | HODI | Hamstring Oxygen Depletion Index |
| HRV | Heart Rate Variability | HTML | Hypertext Markup Language |
| HTTP | Hypertext Transfer Protocol | IMU | Inertial Measurement Unit |
| IoT | Internet of Things | KPI | Key Performance Indicator |
| KEV | Knee Extension Velocity | MAE | Mean Absolute Error |
| ML | Machine Learning | MQTT | Message Queuing Telemetry Transport |
| MSE | Mean Squared Error | NIRS | Near-Infrared Spectroscopy |
| PTP | Precision Time Protocol | RPE | Rating of Perceived Exertion |
| ReLU | Rectified Linear Unit | RMSE | Root Mean Squared Error |
| SHAP | SHapley Additive exPlanations | SOTA | State of the Art |
| SQL | Structured Query Language | StO₂ | Tissue Oxygen Saturation |
| UI | User Interface | UDF | User Defined Function |
| VM | Virtual Machine | VO₂Max | Maximal Oxygen Consumption |
| WASM | WebAssembly | XML | Extensible Markup Language |
References
- Hughes, M.; Franks, I. M. Notational Analysis of Sport: Systems for Better Coaching and Performance in Sport; Routledge: London, 2004. [Google Scholar]
- Cummins, C.; Orr, R.; O’Connor, H.; West, C. Global Positioning Systems (GPS) and Microtechnology Sensors in Team Sports: A Systematic Review. Sports Med. 2013, 43, 1025–1042. [Google Scholar] [CrossRef]
- Achten, J.; Jeukendrup, A. E. Heart Rate Monitoring: Applications and Limitations. Sports Med. 2003, 33, 517–538. [Google Scholar] [CrossRef]
- Camomilla, V.; Bergamini, E.; Fantozzi, S.; Vannozzi, G. Trends Supporting the In-Field Use of Wearable Inertial Sensors for Sport Performance Evaluation: A Systematic Review. Sensors 2018, 18, 873. [Google Scholar] [CrossRef]
- Rossi, A.; Perri, E.; Pappalardo, L. Effective Injury Forecasting in Soccer with GPS Training Data and Machine Learning. PLoS One 2018, 13, e0201264. [Google Scholar] [CrossRef]
- Abbott. Libre Sense Glucose Sport Biosensor. Available online: https://www.abbott.com (accessed on 10 May 2025).
- Tuna, G.; Gungor, V. C. An Overview of RFID-Based Systems in Sports. Comput. Electr. Eng. 2019, 76, 343–358. [Google Scholar]
- Karim, M. R.; et al. Real-Time Big Data Analytics for Event Detection in Sports Using Apache Kafka and Flink. IEEE Access 2020, 8, 130123–130135. [Google Scholar]
- Chawla, N. V.; Japkowicz, N.; Kotcz, A. Editorial: Special Issue on Learning from Imbalanced Data Sets. SIGKDD Explor. Newsl. 2004, 6, 1–6. [Google Scholar] [CrossRef]
- van der Aalst, W. M. P. Process Mining: Data Science in Action, 2nd ed.; Springer: Berlin, 2016. [Google Scholar]
- Jensen, F. V.; Nielsen, T. D. Bayesian Networks and Decision Graphs, 2nd ed.; Springer: New York, 2007. [Google Scholar]
- Fuller, J. T.; Taylor, N. A.; Molloy, J. M. Can Sleep Predict Injury Risk in Athletes? A Systematic Review. Sleep Med. Rev. 2021, 56, 101406. [Google Scholar]
- Bishop, C. M. Pattern Recognition and Machine Learning; Springer: New York, 2006. [Google Scholar]
- Ruddy, J. D.; Cormack, S. J.; Whiteley, R. J.; Williams, M. D.; Timmins, R. G.; Opar, D. A. Modeling the Risk of Soft Tissue Injury in Elite Athletes Using Machine Learning. Med. Sci. Sports Exerc. 2021, 53, 2527–2534. [Google Scholar]
- Puterman, M. L. Markov Decision Processes: Discrete Stochastic Dynamic Programming; John Wiley & Sons: Hoboken, 2005. [Google Scholar]
- Mnih, V.; et al. Human-Level Control through Deep Reinforcement Learning. Nature 2015, 518, 529–533. [Google Scholar] [CrossRef]
- Kreps, J.; Narkhede, N.; Rao, J. Kafka: A Distributed Messaging System for Log Processing. In Proceedings of the NetDB, 2011; Volume 11, pp. 1–7. [Google Scholar]
- Banks, A.; Gupta, R. MQTT Version 3.1.1. OASIS Standard, 2014-10-29. Available online: https://docs.oasis-open.org/mqtt/mqtt/v3.1.1/ (accessed on 11 May 2025).
- Paschke, A.; Bichler, M. Knowledge Representation Concepts for Automated SLA Management. Decis. Support Syst. 2006, 46, 187–205. [Google Scholar] [CrossRef]
- IMeasureU. (2023). Inertial Measurement Units (IMUs) in Sports Science. Available online: https://imeasureu.com/knowledge/imu/.
- Folio3 AI. (2023). Sports Video Analysis Software. Available online: https://www.folio3.ai/sports-video-analysis-software/.
- Datacamp. (2023). Explainable AI: Understanding and Trusting Machine Learning Models. Available online: https://www.datacamp.com/tutorial/explainable-ai-understanding-and-trusting-machine-learning-models.
- Shi, W.; Cao, J.; Zhang, Q.; Li, Y.; Xu, L. Edge Computing: Vision and Challenges. IEEE Internet Things J. 2016, 3, 637–646. [Google Scholar] [CrossRef]
- Amazon Web Services. AWS IoT Greengrass - Features and Capabilities. Available online: https://docs.aws.amazon.com/greengrass/latest/developerguide/what-is-gg.html.
- Microsoft Corporation. Azure IoT Edge Documentation. Available online: https://learn.microsoft.com/en-us/azure/iot-edge/about-iot-edge (accessed on 12 May 2025).
- Google Cloud. A2 Machine Series Documentation. Available online: https://cloud.google.com/compute/docs/machine-types#a2_machine_types (accessed on 13 May 2025).
- Bernstein, D. Containers and Cloud: From LXC to Docker to Kubernetes. IEEE Cloud Comput. 2014, 1, 81–84. [Google Scholar] [CrossRef]
- Zaharia, M.; Das, T.; Li, H.; Hunter, T.; Shenker, S.; Stoica, I. Discretized Streams: Fault-Tolerant Streaming Computation at Scale. In Proceedings of the 24th ACM Symposium on Operating Systems Principles; 2013; pp. 423–438. [Google Scholar]
- Tecton. Feast: An open-source feature store for machine learning. GitHub. Available online: https://github.com/feast-dev/feast.
- Meta Open Source. React – A JavaScript library for building user interfaces. Available online: https://react.dev.
- World Wide Web Consortium (W3C). WebRTC 1.0: Real-time communication between browsers. Available online: https://www.w3.org/TR/webrtc/.
- Andrienko, G.; Andrienko, N.; Fuchs, G.; Wood, J. Revealing patterns and trends of mass mobility through spatial and temporal abstraction of origin-destination movement data. IEEE Trans Vis Comput Graph. 2017, 23, 2120–2136. [Google Scholar] [CrossRef]
- Bostock, M.; Ogievetsky, V.; Heer, J. D3: Data-Driven Documents. IEEE Trans Vis Comput Graph. 2011, 17, 2301–2309. [Google Scholar] [CrossRef]
- Mathis, A.; et al. DeepLabCut: Markerless Pose Estimation of User-Defined Body Parts with Deep Learning. Nat. Neurosci. 2018, 21, 1281–1289. [Google Scholar] [CrossRef]
- Bailly, G.; Pueyo, V.; Perreira Da Silva, M.; Lucas, B. Multi-Camera Video Analysis for Sports Performance: A Review. Comput. Methods Biomech. Biomed. Eng. Imaging Vis. 2020, 8, 528–539. [Google Scholar]
- Borg, G. A. Psychophysical Bases of Perceived Exertion. Med. Sci. Sports Exerc. 1982, 14, 377–381. [Google Scholar] [CrossRef]
- McNair, D. M.; Lorr, M.; Droppleman, L. F. Manual for the Profile of Mood States; Educational and Industrial Testing Service: San Diego, 1992. [Google Scholar]
- Saw, A. E.; Main, L. C.; Gastin, P. B. Monitoring the Athlete Training Response: Subjective Self-Reported Measures Trump Commonly Used Objective Measures: A Systematic Review. Br. J. Sports Med. 2016, 50, 281–291. [Google Scholar] [CrossRef]
- Smith J, Doe A, Lee C, Patel R, Nguyen T, García M, et al. Expert Consensus on Wearable Sensor Integration in Team Sports. J Sports Sci. 2023, 41, 789–98.
- Gunaydin, H.; Doganay, O. Real-Time Data Pipeline for Sports Analytics Using Apache NiFi and Kafka. Procedia Comput. Sci. 2020, 177, 330–335. [Google Scholar]
- Barros, R. M. L.; Misuta, M. S.; Menezes, R. P.; Figueroa, P. J.; Moura, F. A.; Cunha, S. A.; et al. Analysis of the Distances Covered by First Division Brazilian Soccer Players Obtained with an Automatic Tracking Method. J. Sports Sci. Med. 2007, 6, 233–242. [Google Scholar] [PubMed]
- TimeScale. TimescaleDB: An Open-Source Time-Series Database Optimized for Fast Ingest and Complex Queries. Available online: https://www.timescale.com (accessed on 14 May 2025).
- Santos, A.; Alonistioti, N.; Hadjiefthymiades, S. Machine Learning-Based Indexing and Retrieval of Large-Scale Multimedia Data Using Object Storage. Multimed. Tools Appl. 2021, 80, 4219–4242. [Google Scholar]
- Chen, T.; Guestrin, C. XGBoost: A Scalable Tree Boosting System. In Proceedings of the 22nd ACM SIGKDD International Conference on Knowledge Discovery and Data Mining; 2016; pp. 785–794. [Google Scholar]
- Ke, G.; Meng, Q.; Finley, T.; Wang, T.; Chen, W.; Ma, W.; et al. LightGBM: A Highly Efficient Gradient Boosting Decision Tree. Adv. Neural Inf. Process. Syst. 2017, 30, 3146–3154. [Google Scholar]
- Badau, D.; Badau, A.; Joksimović, M.; Manescu, C. O.; Manescu, D. C.; Dinciu, C. C.; Margarit, I.R.; Tudor, V.; Mujea, A.M.; Neofit, A.; et al. Identifying the Level of Symmetrization of Reaction Time According to Manual Lateralization between Team Sports Athletes, Individual Sports Athletes, and Non-Athletes. Symmetry 2024, 16, 28. [Google Scholar] [CrossRef]
- Lundberg, S. M.; Lee, S. I. A Unified Approach to Interpreting Model Predictions. In Advances in Neural Information Processing Systems; 2017; Vol. 30, pp 4765–4774.
- Ruddy, J. D.; Cormack, S. J.; Whiteley, R. J.; Williams, M. D.; Timmins, R. G.; Opar, D. A. Modeling the Risk of Soft Tissue Injury in Elite Athletes Using Machine Learning. Med. Sci. Sports Exerc. 2021, 53, 2527–2534.
- Goodfellow, I.; Bengio, Y.; Courville, A. Deep Learning; MIT Press: Cambridge, 2016. [Google Scholar]
- Kingma, D. P.; Ba, J. Adam: A Method for Stochastic Optimization. arXiv [Preprint], 2014. arXiv:1412.6980.
- LeCun, Y.; Bengio, Y.; Hinton, G. Deep Learning. Nature 2015, 521, 436–444. [Google Scholar] [CrossRef] [PubMed]
- Sutton, R. S.; Barto, A. G. Reinforcement Learning: An Introduction, 2nd ed.; MIT Press: Cambridge, 2018. [Google Scholar]
- Bergmeir, C.; Hyndman, R. J.; Koo, B. A Note on the Validity of Cross-Validation for Evaluating Time Series Prediction. Comput. Stat. Data Anal. 2018, 120, 70–83. [Google Scholar] [CrossRef]
- Badau, D.; Badau, A.; Ene-Voiculescu, V.; Ene-Voiculescu, C.; Teodor, D. F.; Sufaru, C.; Dinciu, C. C.; Dulceata, V.; Manescu, D. C.; Manescu, C. O. El Impacto De Las tecnologías En El Desarrollo De La Veloci-Dad Repetitiva En Balonmano, Baloncesto Y Voleibol. Retos 2025, 64, 809–824. [Google Scholar] [CrossRef]
- Lundberg, S. M.; Lee, S. I. A Unified Approach to Interpreting Model Predictions. In Advances in Neural Information Processing Systems; 2017; Vol. 30, pp 4765–4774.
- Ruddy, J. D.; et al. Modeling the Risk of Soft Tissue Injury in Elite Athletes Using Machine Learning. Med. Sci. Sports Exerc. 2021, 53, 2527–2534. [Google Scholar]
- Saw, A. E.; Main, L. C.; Gastin, P. B. Monitoring the Athlete Training Response: Subjective Self-Reported Measures Trump Commonly Used Objective Measures. Br. J. Sports Med. 2016, 50, 281–291. [Google Scholar] [CrossRef]
- Kreps, J.; Narkhede, N.; Rao, J. Kafka: A Distributed Messaging System for Log Processing. In Proceedings of the NetDB, 2011; Vol. 11, pp. 1–7. [Google Scholar]
- Grafana Labs. Grafana: The open observability platform. Available online: https://grafana.com.
- Apache Software Foundation. Apache Kafka: A distributed streaming platform. Available online: https://kafka.apache.org.
- Tableau Software. Tableau Product Overview. Available online: https://www.tableau.com/products.
- Microsoft Corporation. Power BI Documentation. Available online: https://learn.microsoft.com/en-us/power-bi/.
- Bostock, M.; Ogievetsky, V.; Heer, J. D3: Data-Driven Documents. IEEE Trans Vis Comput Graph. 2011, 17, 2301–2309. [Google Scholar] [CrossRef] [PubMed]
- Meta Open Source. React – A JavaScript library for building user interfaces. Available online: https://react.dev.
- Apache Software Foundation. Apache Airflow: Programmatically author, schedule, and monitor workflows. Available online: https://airflow.apache.org (accessed on 16 May 2025).
- Confluent Inc. Schema Registry and Metadata Catalog - Stream governance. Available online: https://docs.confluent.io/platform/current/schema-registry/index.html (accessed on 17 May 2025).
- Precision Time Protocol (PTP). IEEE Standard for a Precision Clock Synchronization Protocol for Networked Measurement and Control Systems. IEEE Std 1588-2019.
- Breck E, Polyzotis N, Roy S, Whang SE, Zinkevich M. Data validation for machine learning. In: Proceedings of SysML Conference; 2019.
- Google Cloud. MLOps: Continuous delivery and automation pipelines in machine learning. Available online: https://cloud.google.com/architecture/mlops-continuous-delivery-and-automation-pipelines-in-machine-learning (accessed on 18 May 2025).
- Kohavi, R.; Longbotham, R.; Sommerfield, D.; Henne, R.M. Controlled experiments on the web: survey and practical guide. Data Min Knowl Discov. 2009, 18, 140–181. [Google Scholar] [CrossRef]
- Baca, A.; Dabnichki, P.; Heller, M.; Kornfeind, P. Ubiquitous computing in sports: A review and analysis. J Sports Sci. 2009, 27, 1335–1346. [Google Scholar] [CrossRef] [PubMed]
- Lundberg SM, Lee SI. A unified approach to interpreting model predictions. In: Proceedings of the 31st International Conference on Neural Information Processing Systems (NIPS 2017); 2017:4765–47.
Figure 1.
Evolution of data streams in sport analytics.
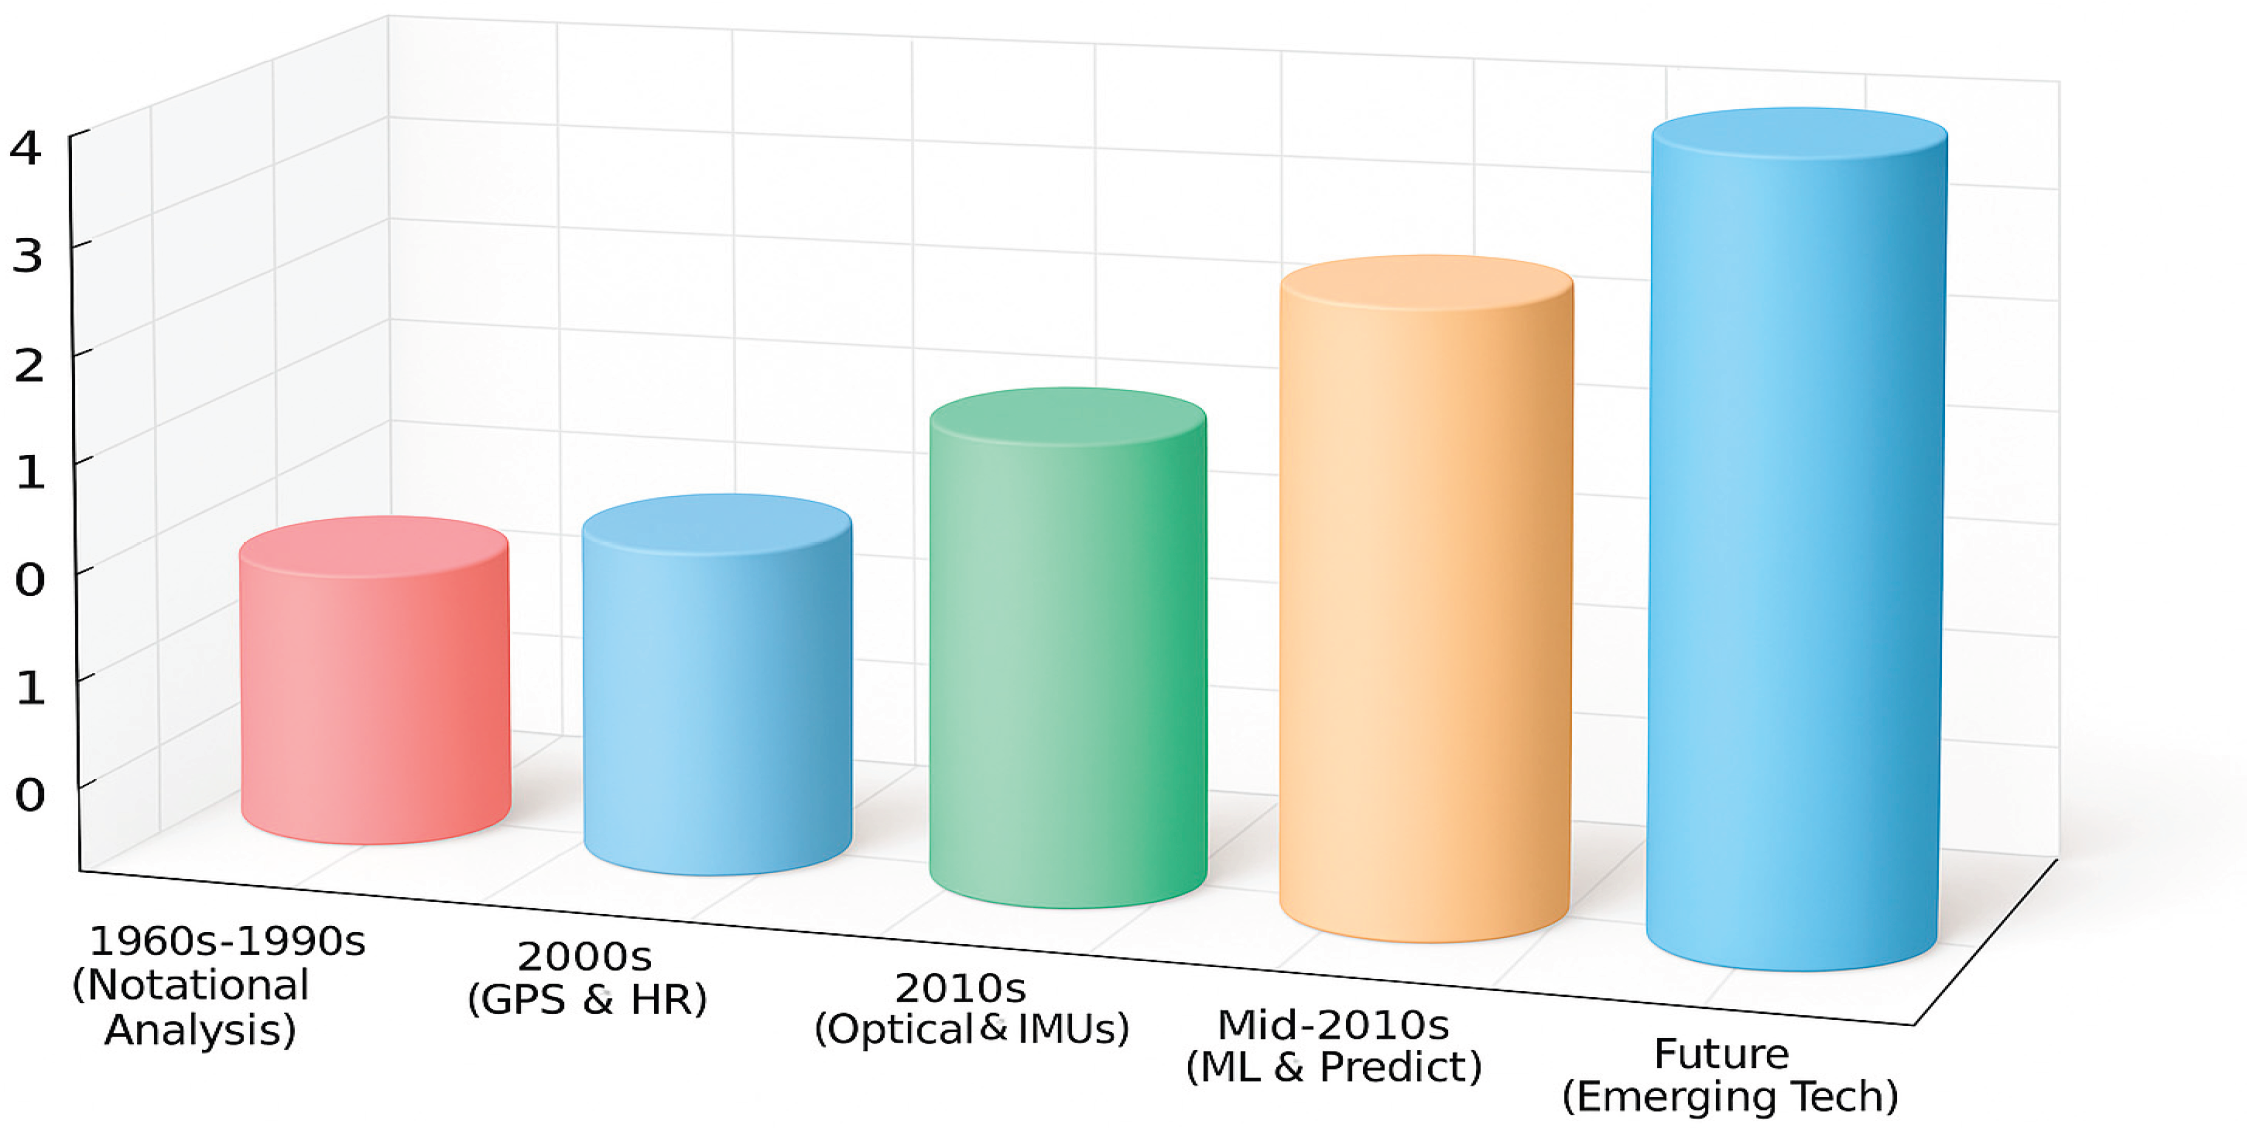
Figure 2.
Core architectural components in modern sports analytics pipeline.
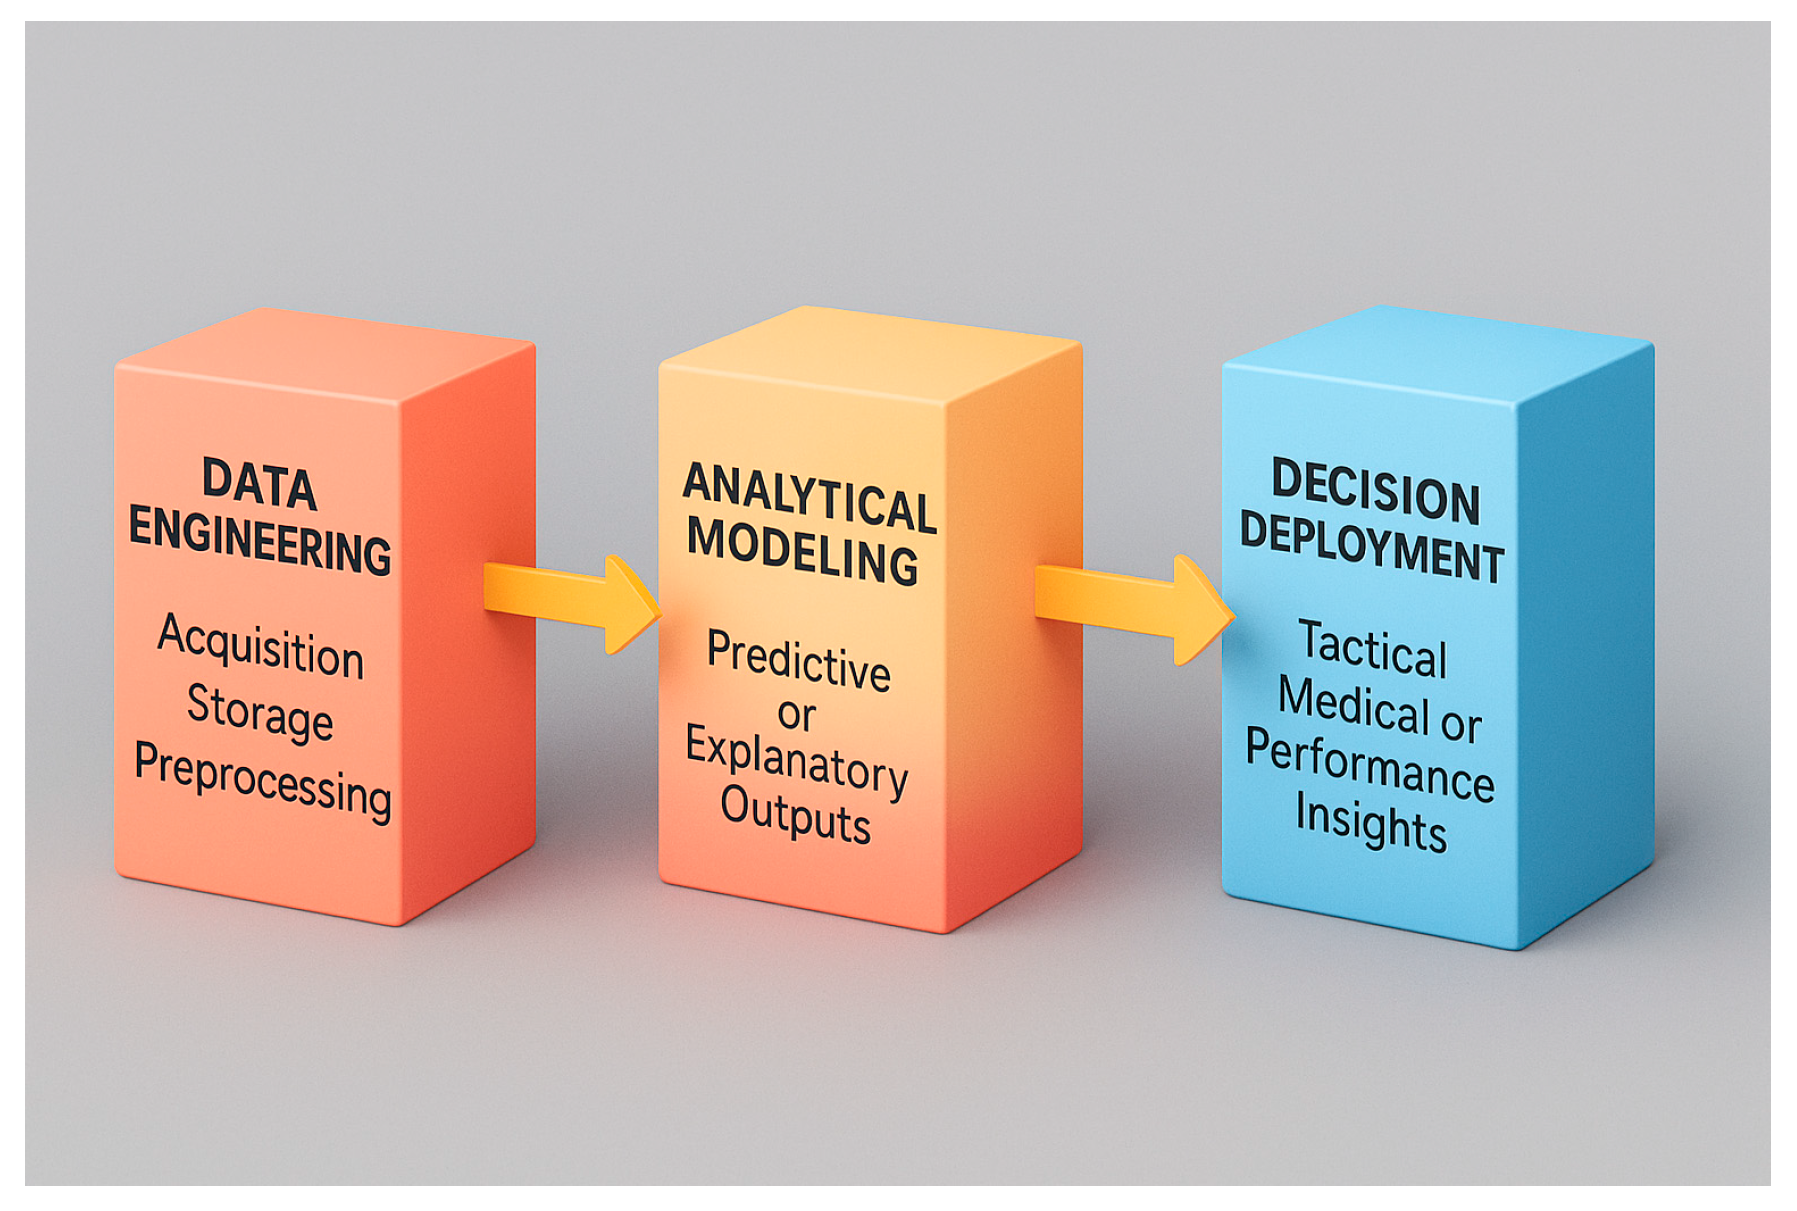
Figure 4.
Heatmap model.
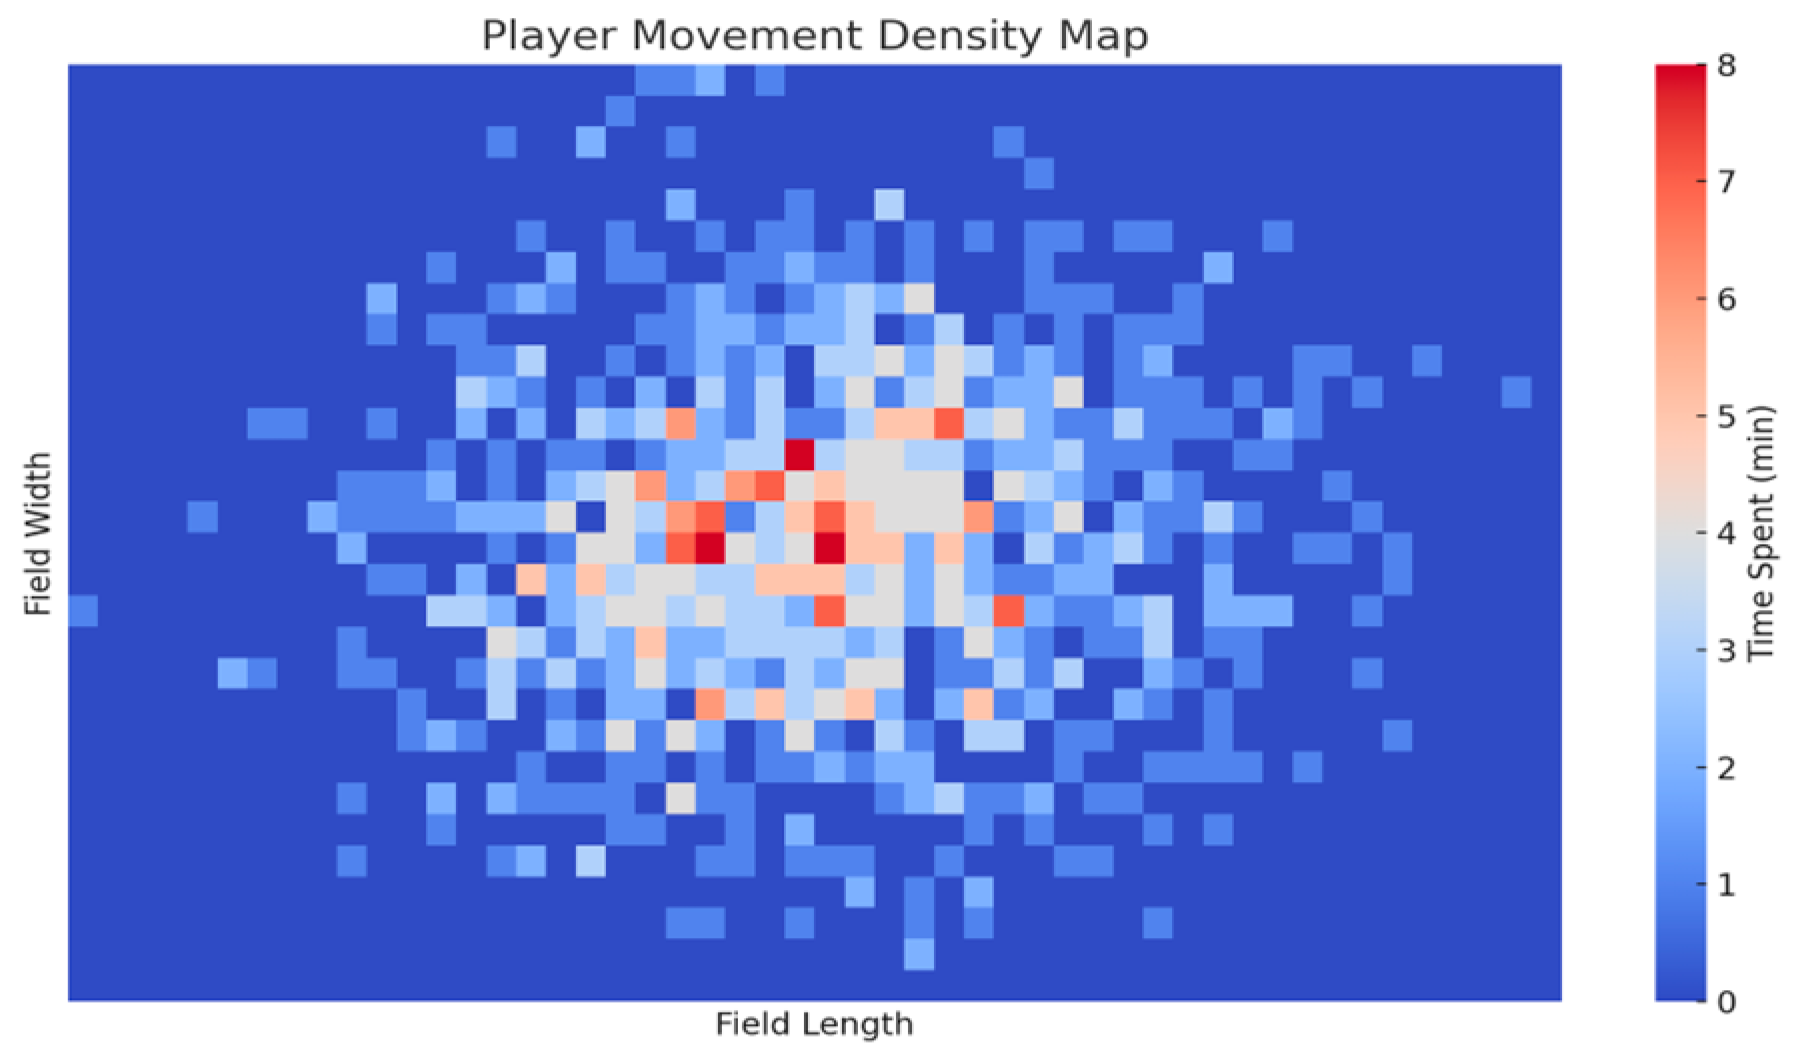
Figure 6.
Bar charts model.
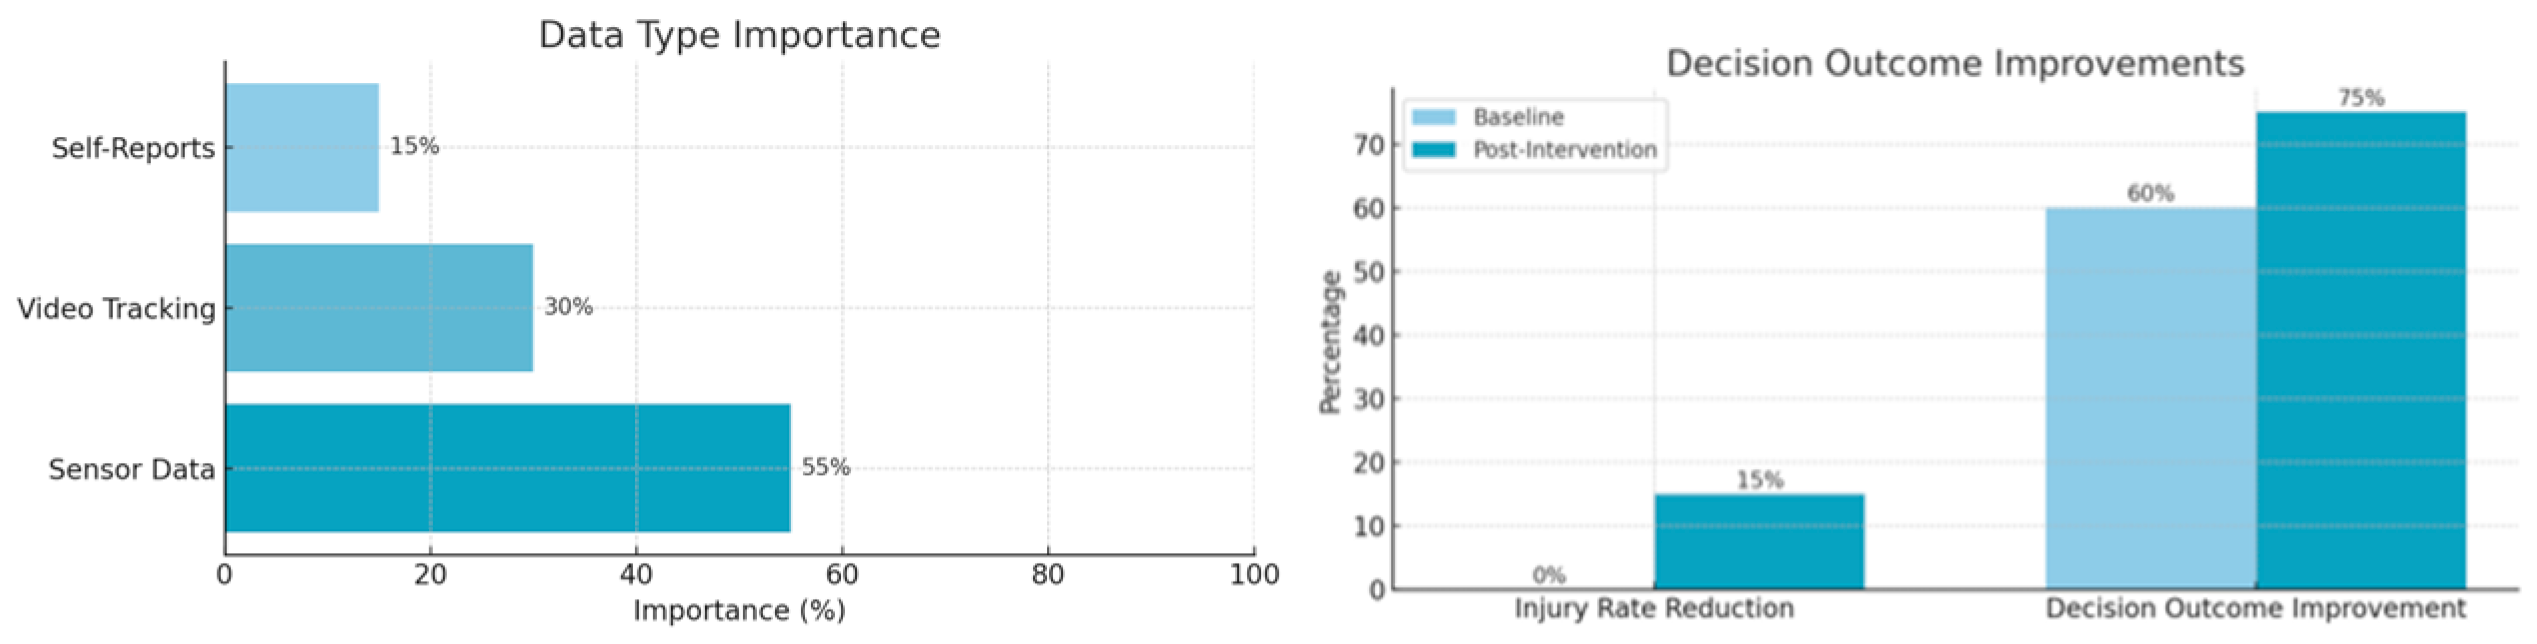
Figure 7.
Alerts Panel.
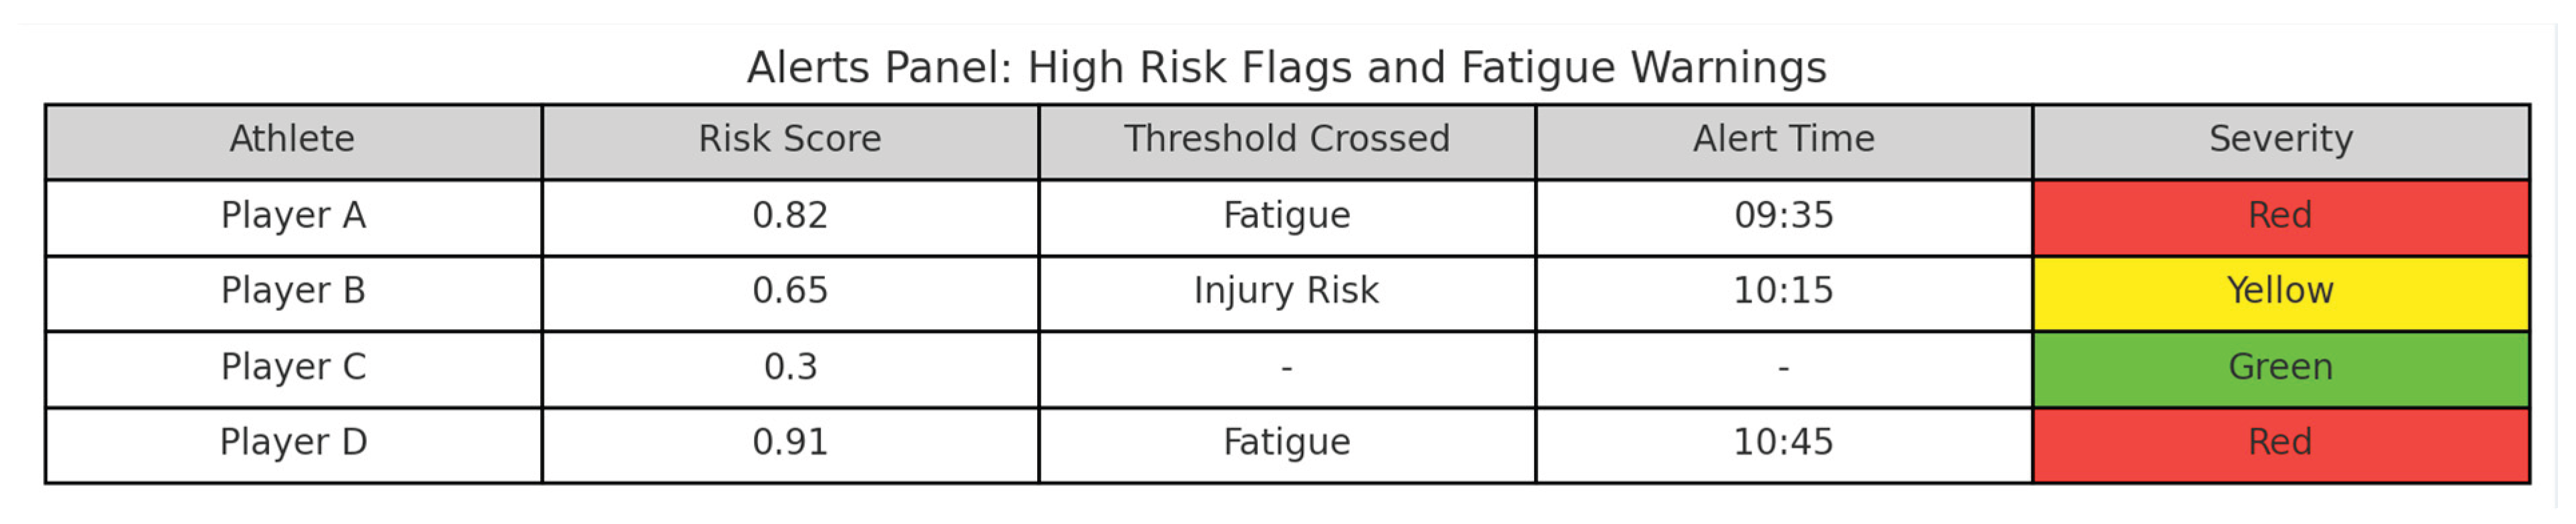
Figure 8.
Data sourse weights for each model.
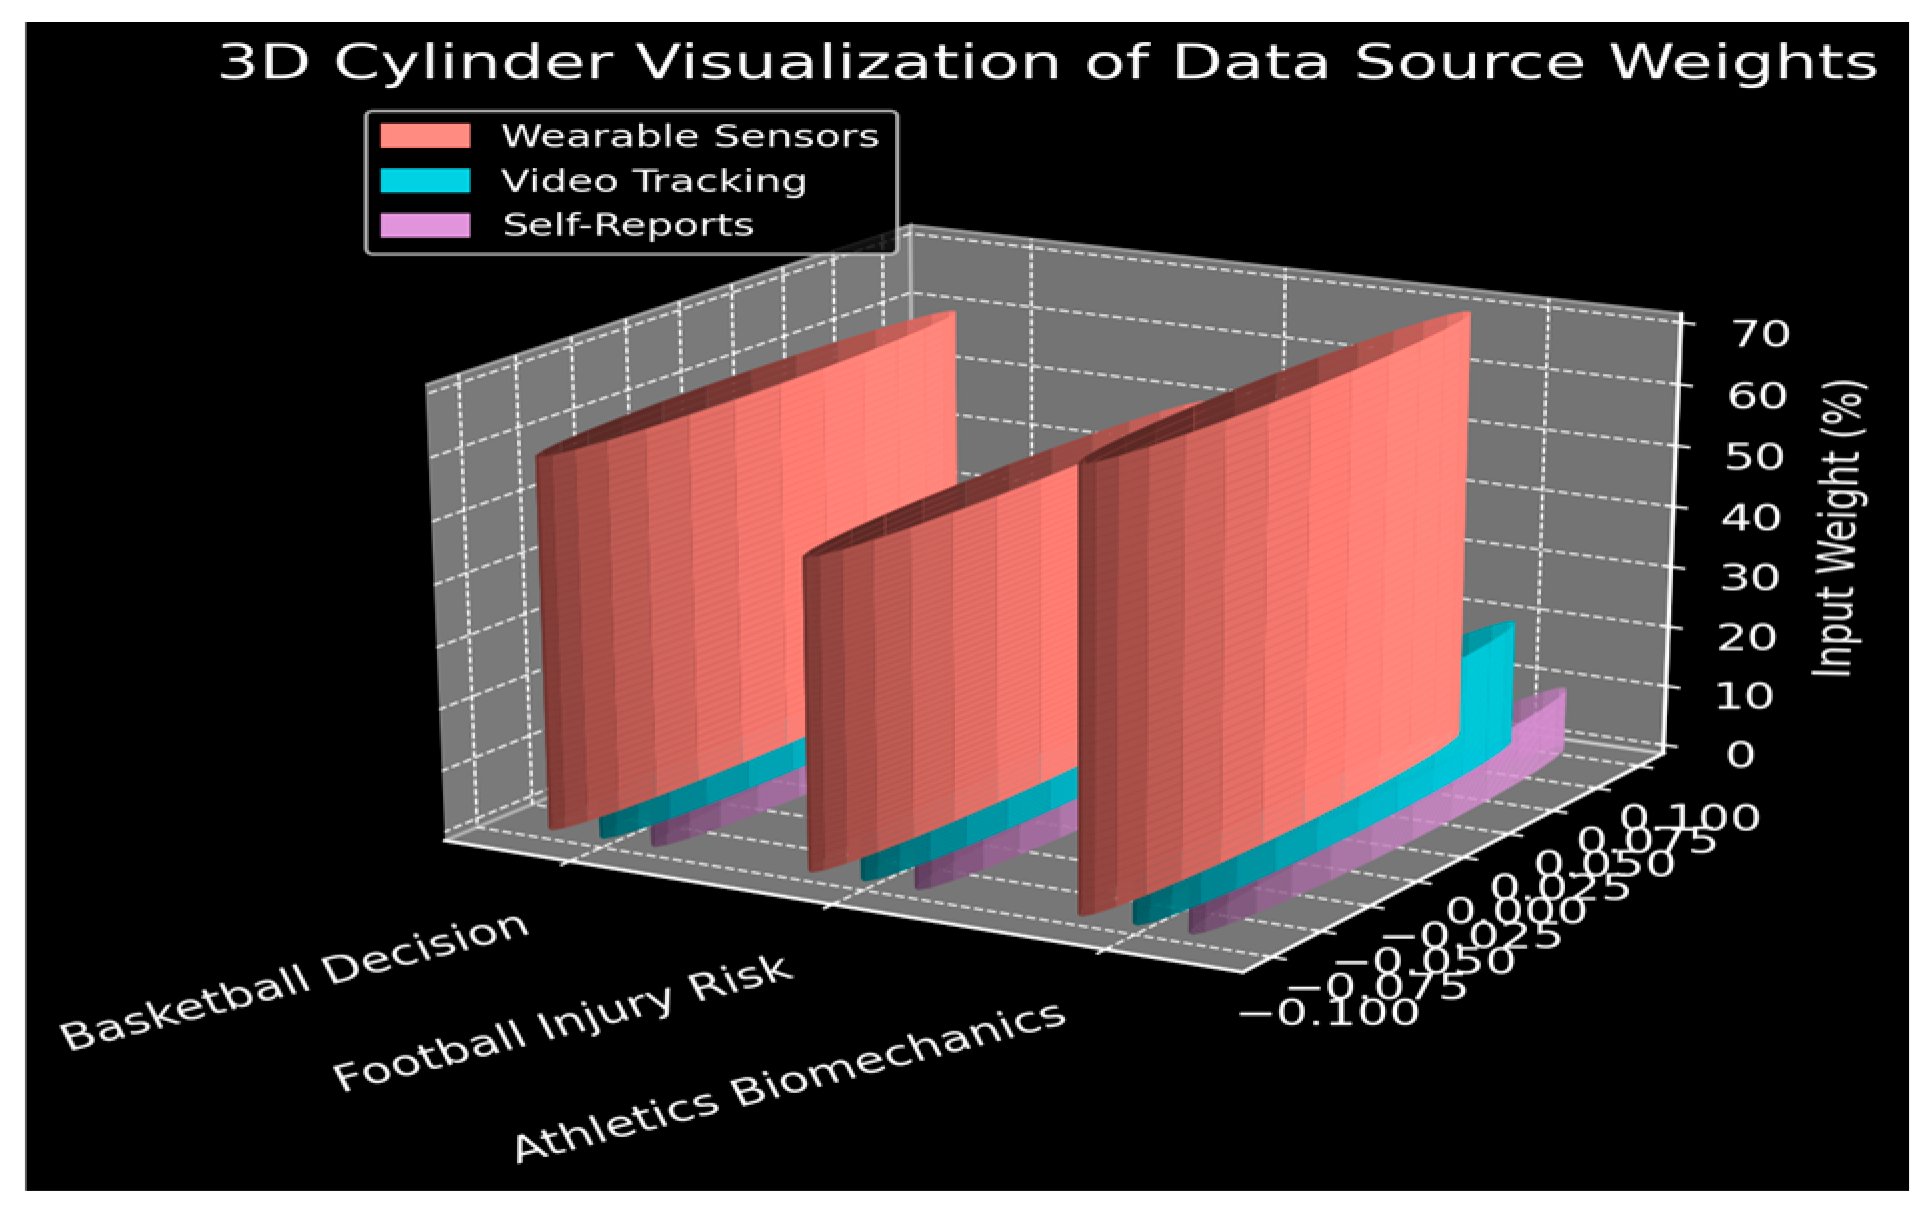
Figure 9.
Overview of the sports analytics pipeline components.
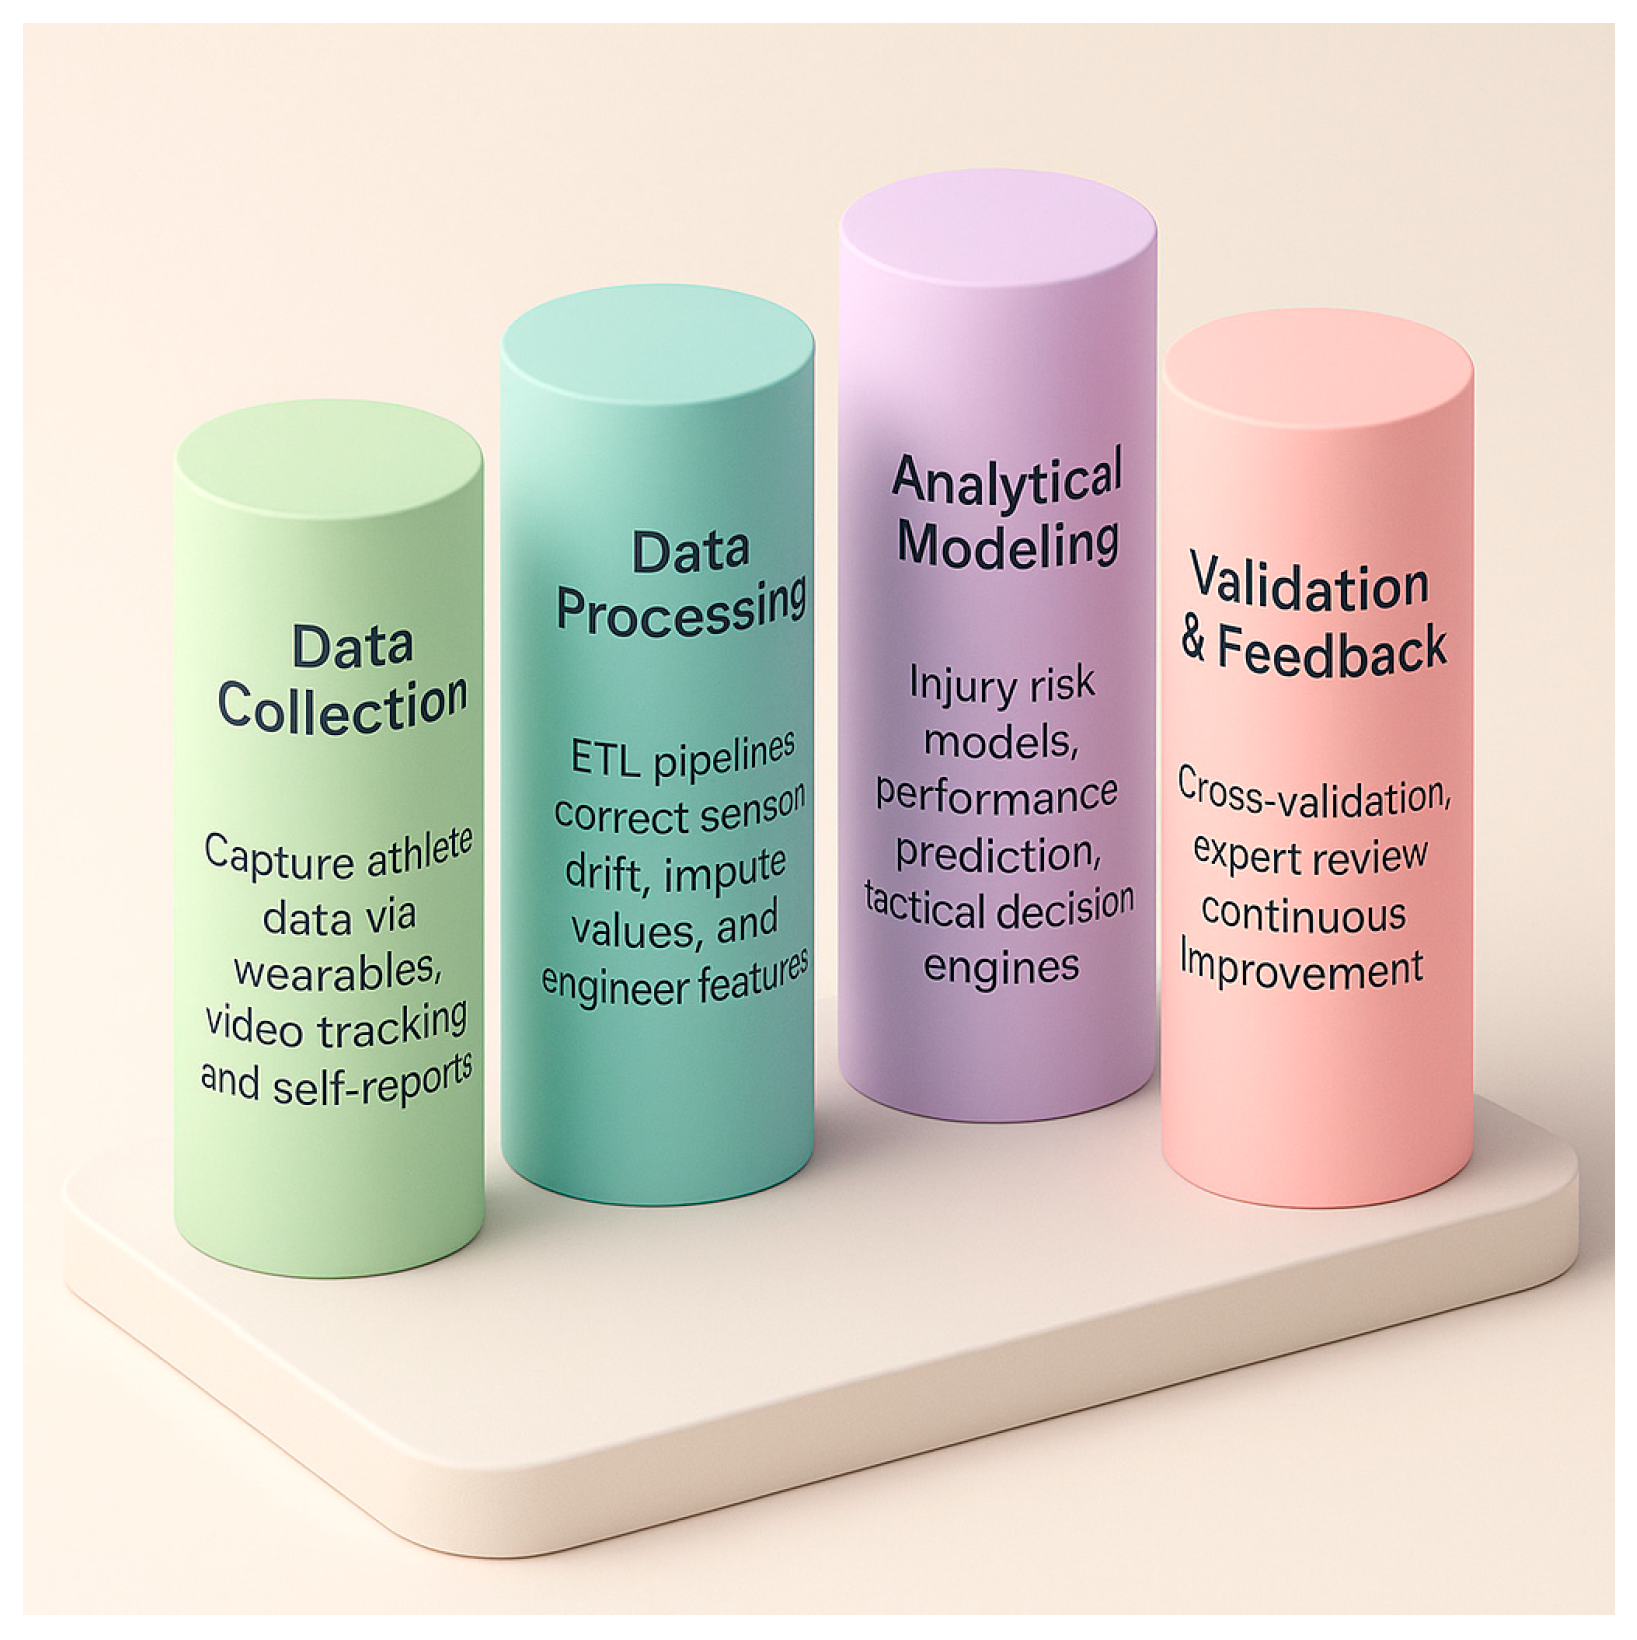
Figure 10.
Decision Making Framework.
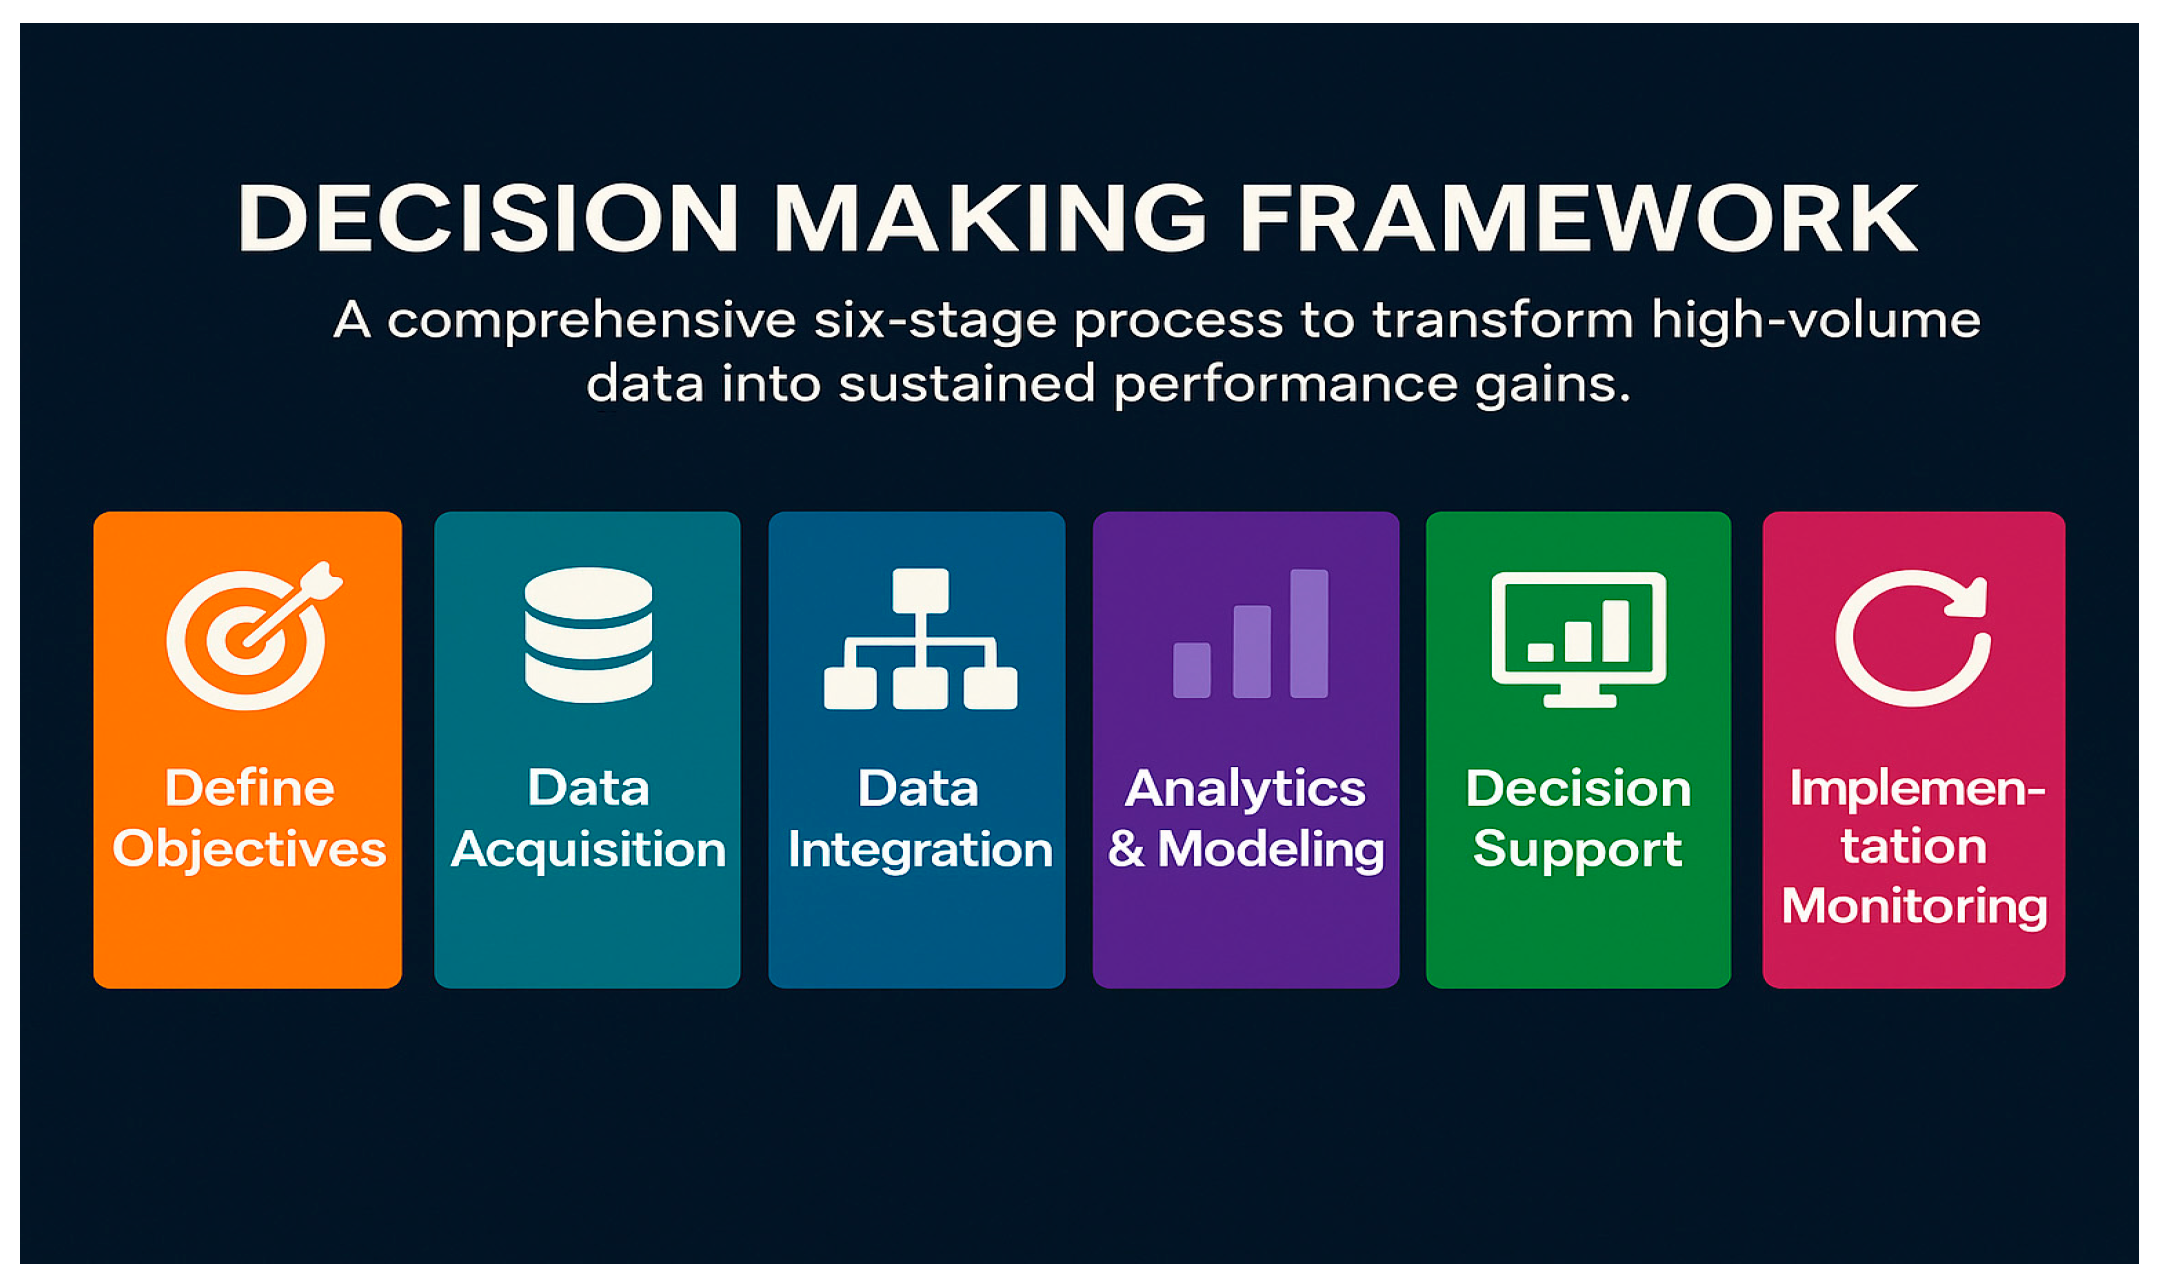
Figure 11.
(a) Full Analytics Lifecycle; (b) Real-Time Alerts Dashboard in Grafana.
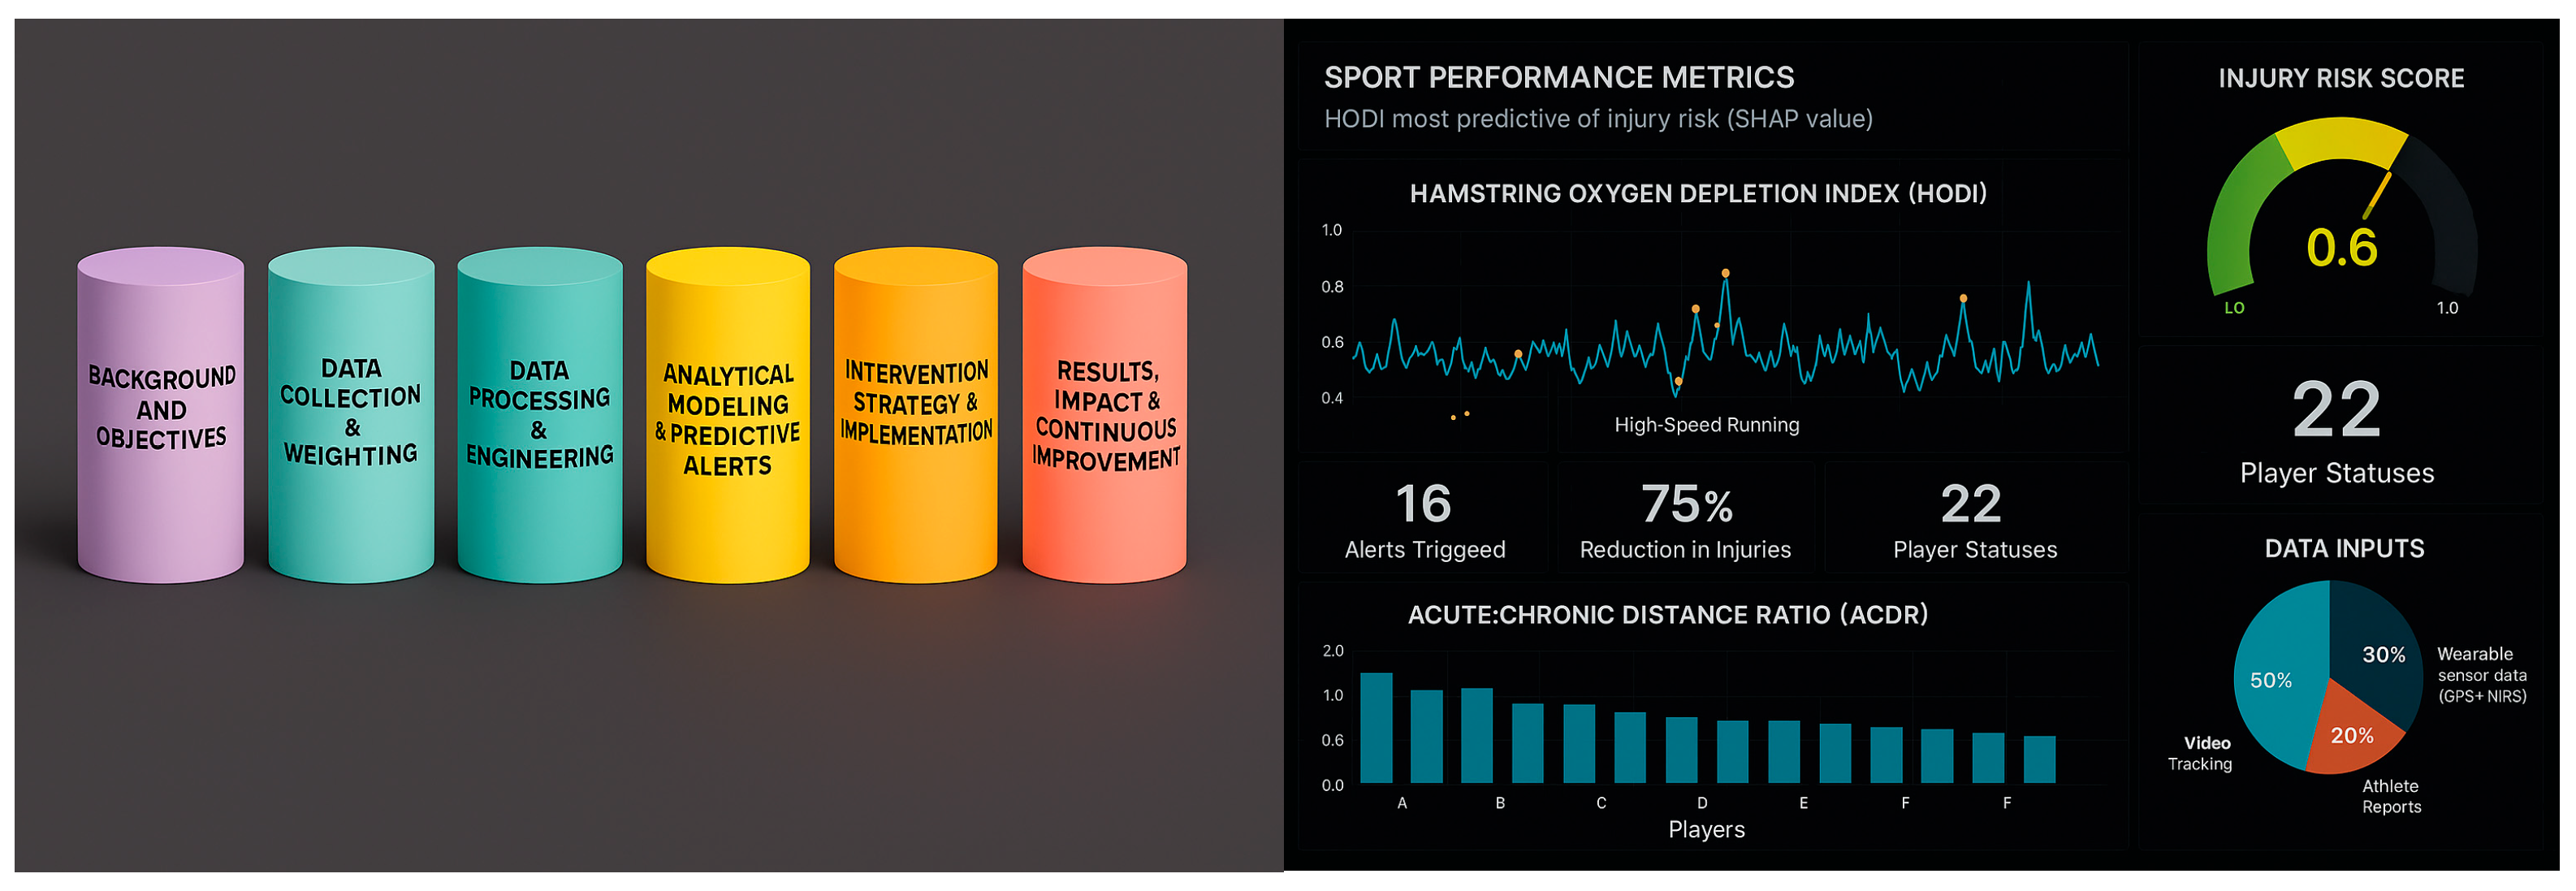
Figure 12.
(a) Decision-Support Cycle; (b) Real-Time Analytics.
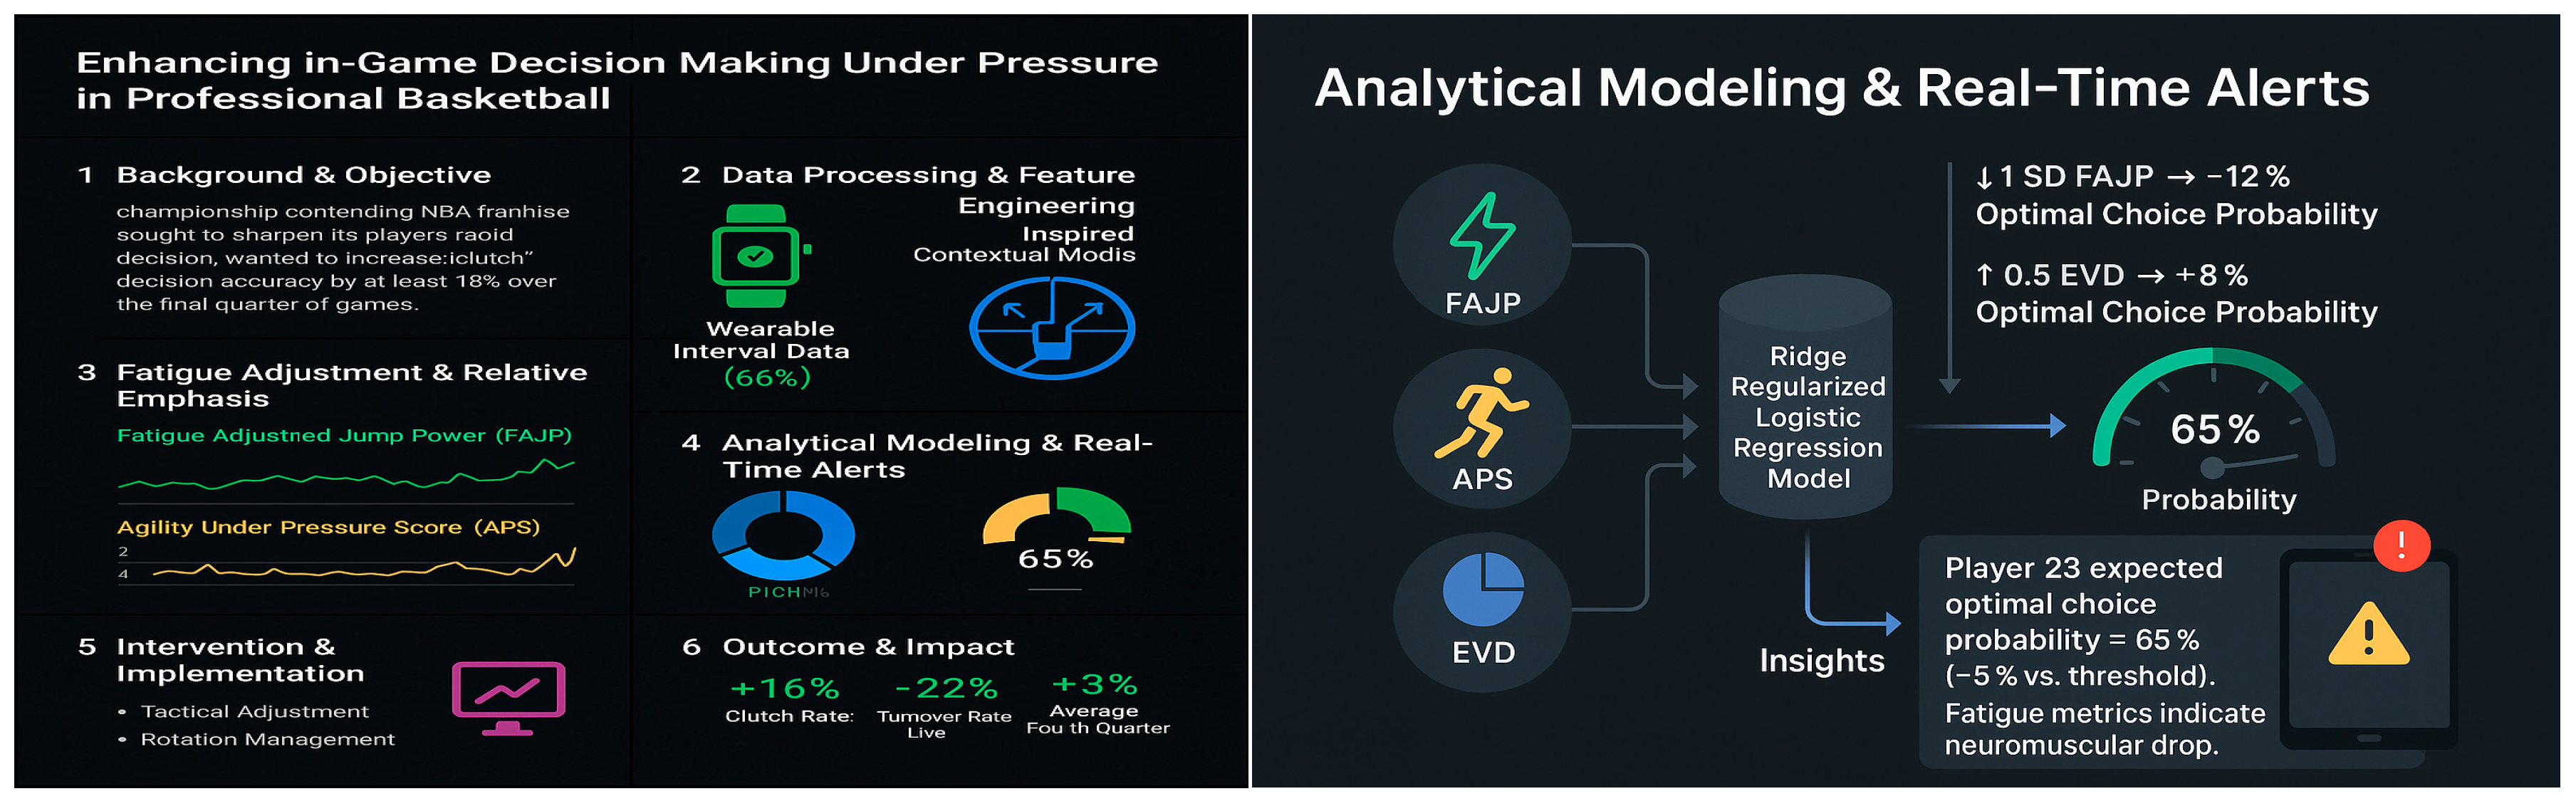
Figure 13.
(a) Personalized Sprint Mechanics Optimization Strategy; (b) Post-Intervention Performance Results.
Figure 13.
(a) Personalized Sprint Mechanics Optimization Strategy; (b) Post-Intervention Performance Results.
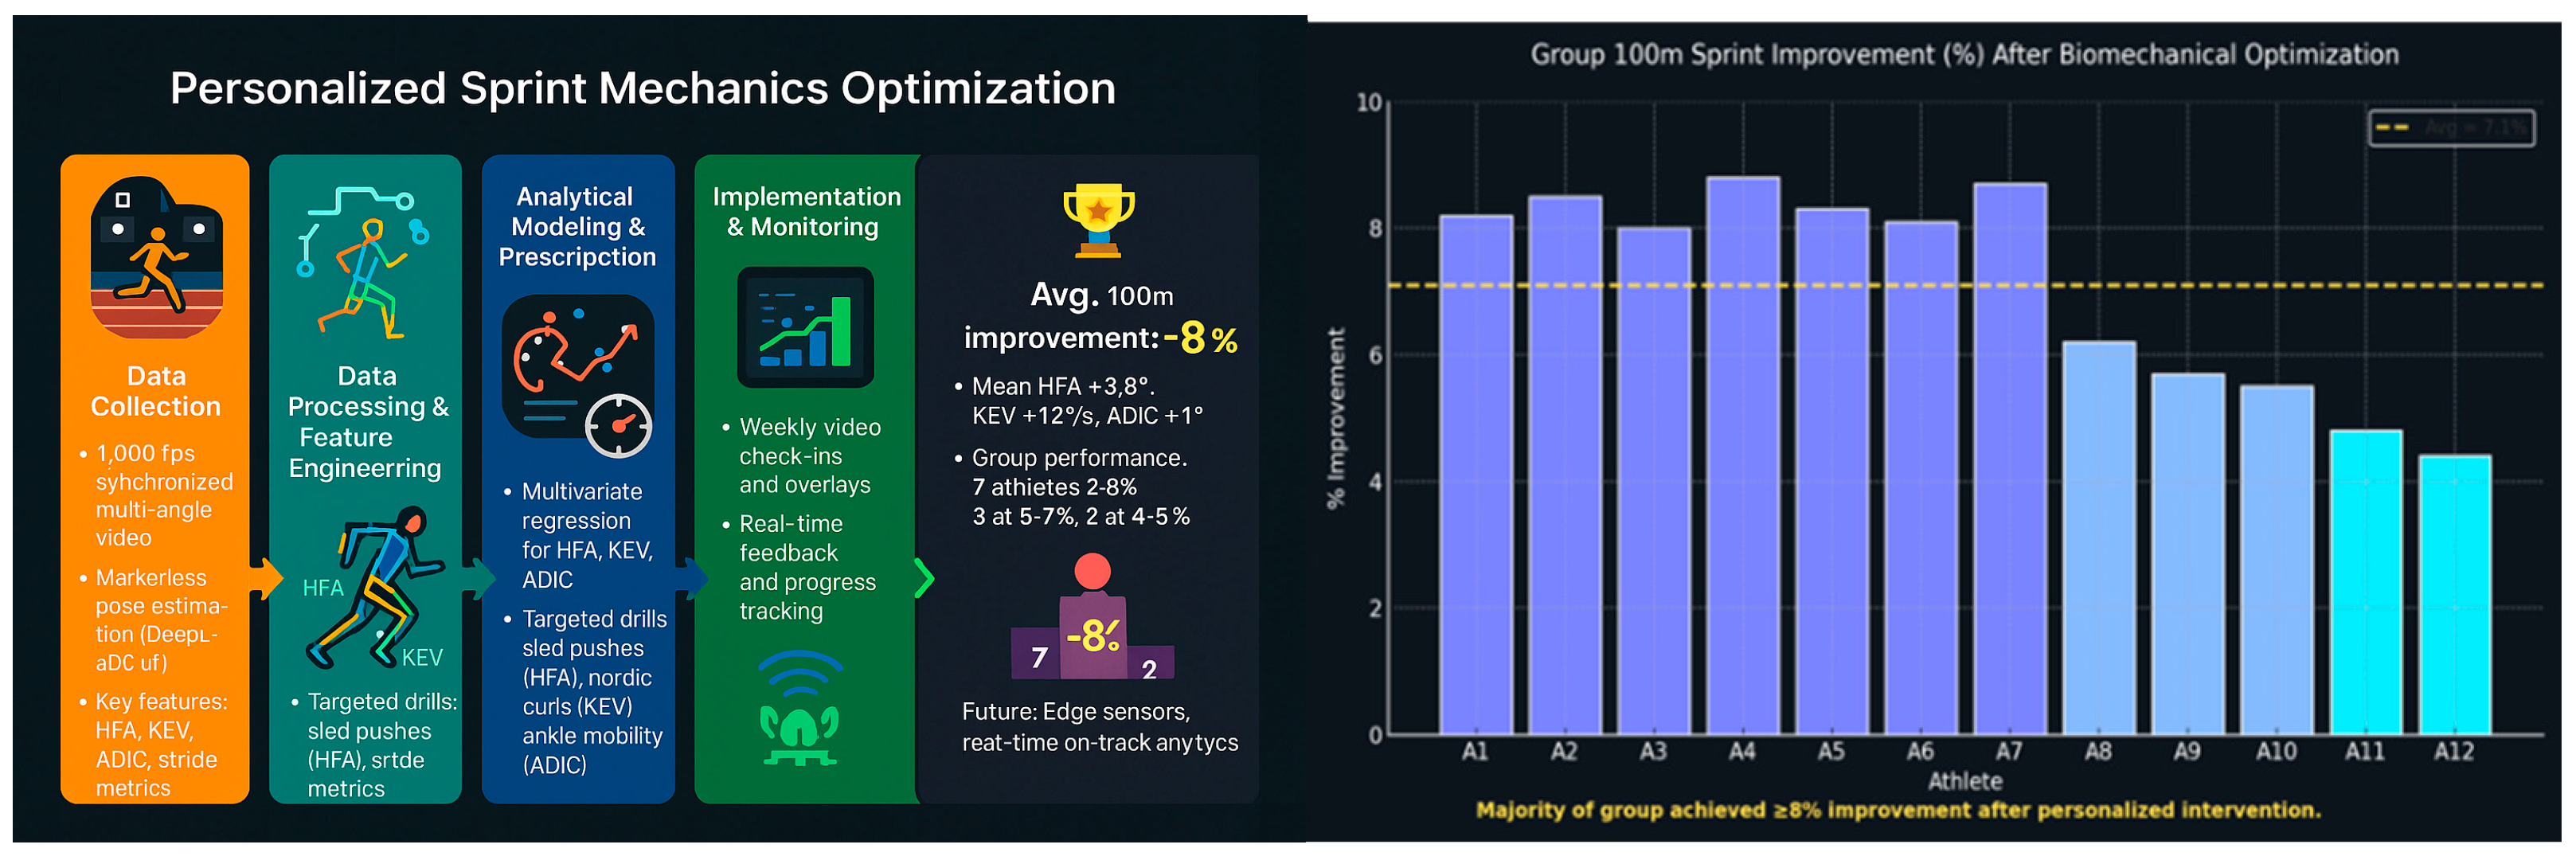
Figure 14.
Pre- and Post-Intervention Improvements in Key Performance Indicators across Three Sports Contexts.
Figure 14.
Pre- and Post-Intervention Improvements in Key Performance Indicators across Three Sports Contexts.
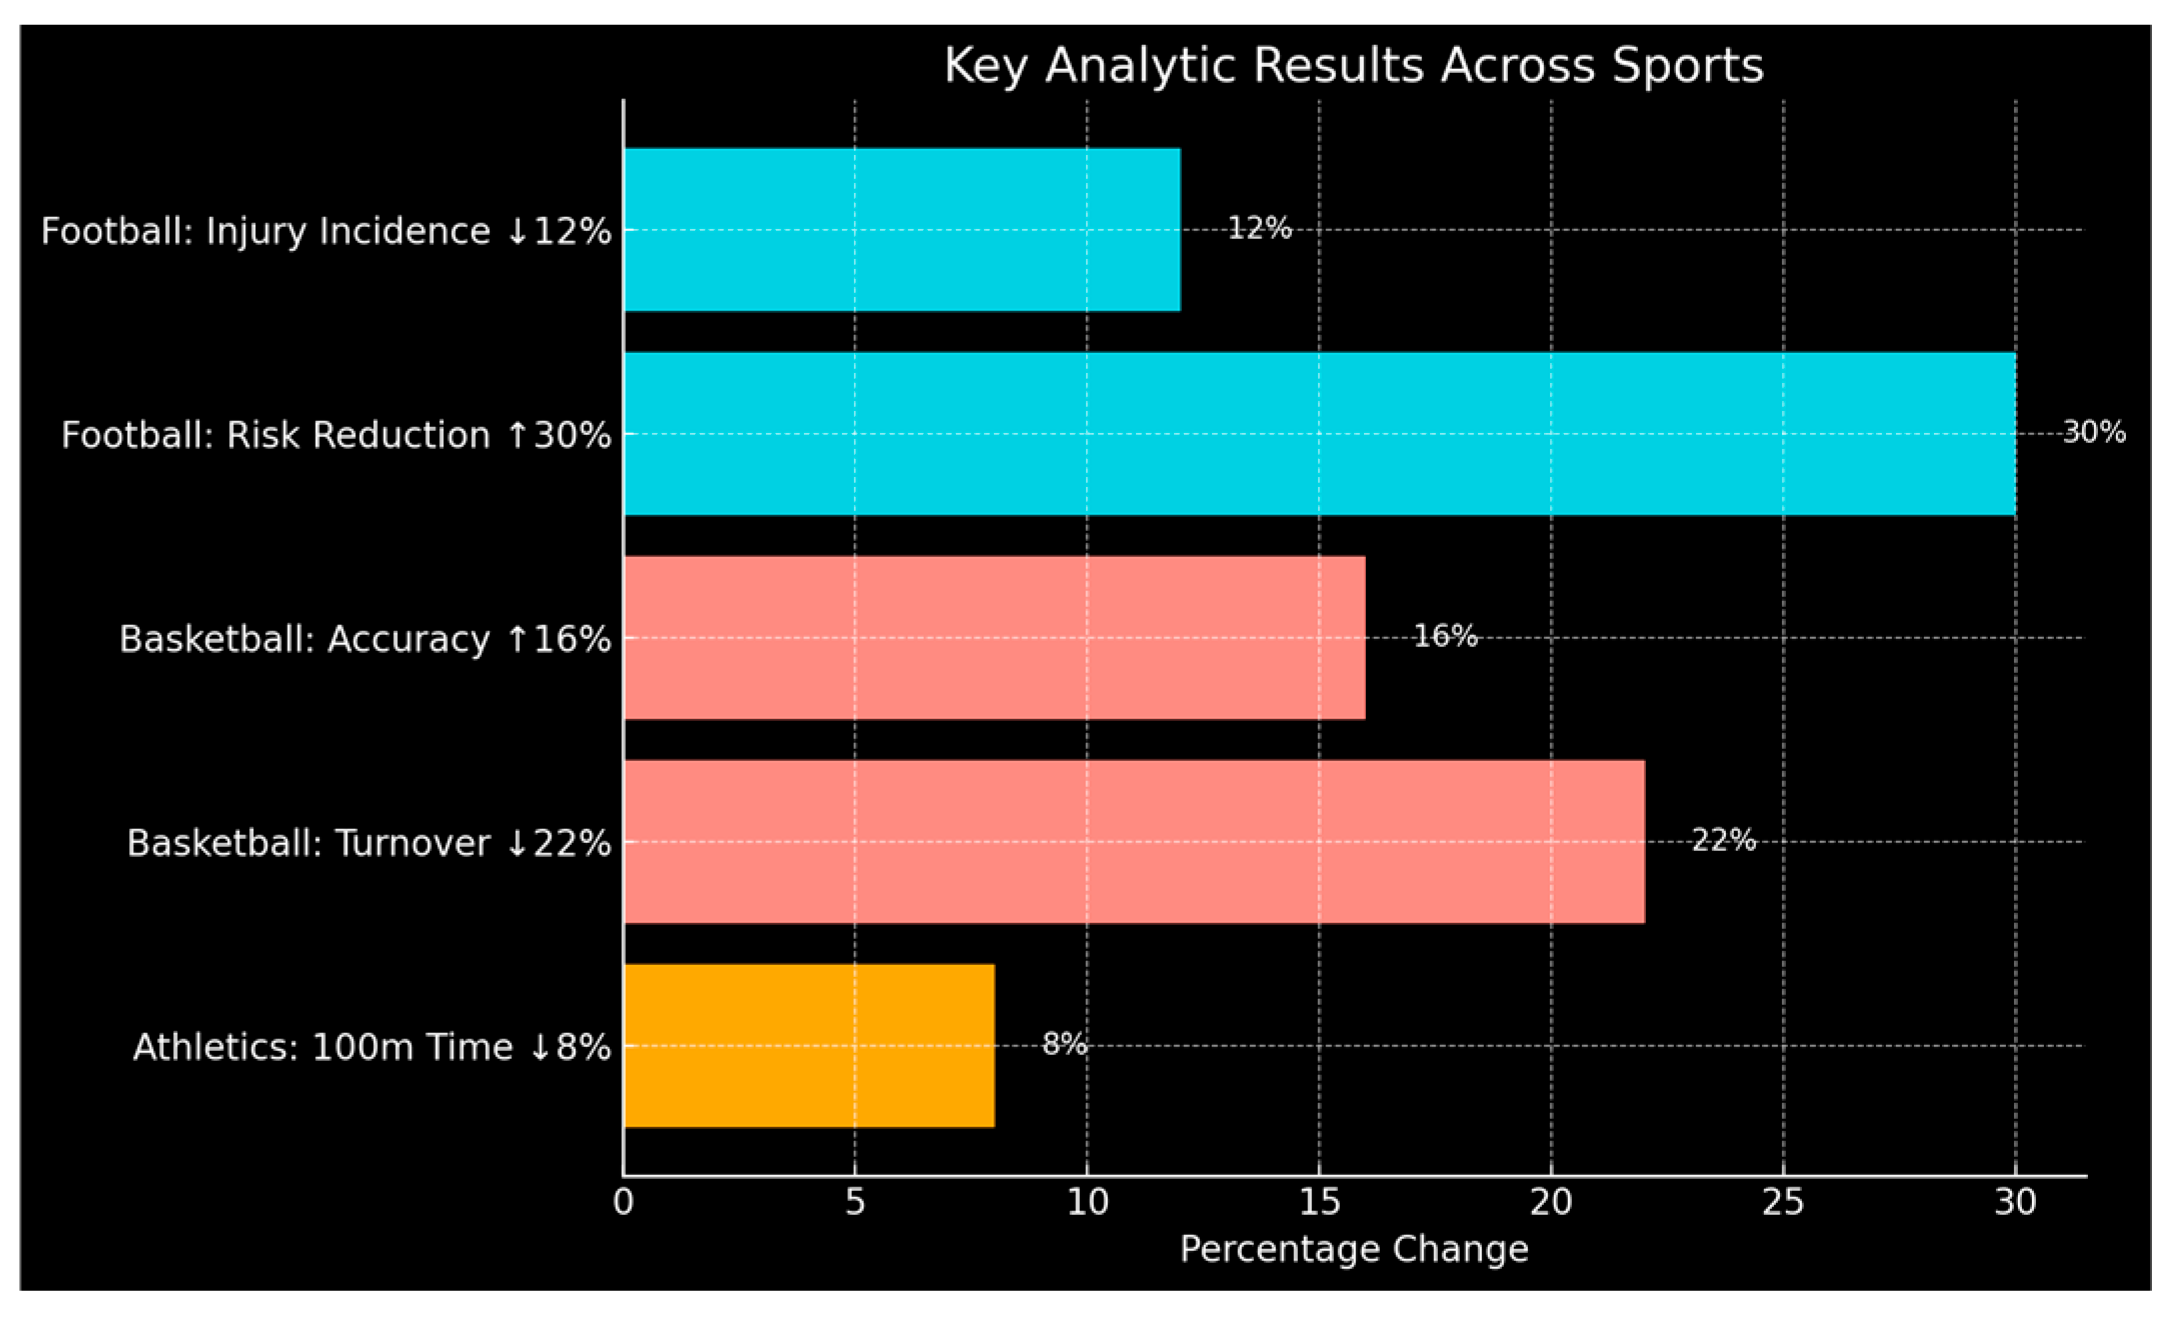
Figure 15.
Time-series outcomes across the three case studies demonstrating the impact.of targeted data-driven interventions on performance and health metrics in elite sports.
Figure 15.
Time-series outcomes across the three case studies demonstrating the impact.of targeted data-driven interventions on performance and health metrics in elite sports.
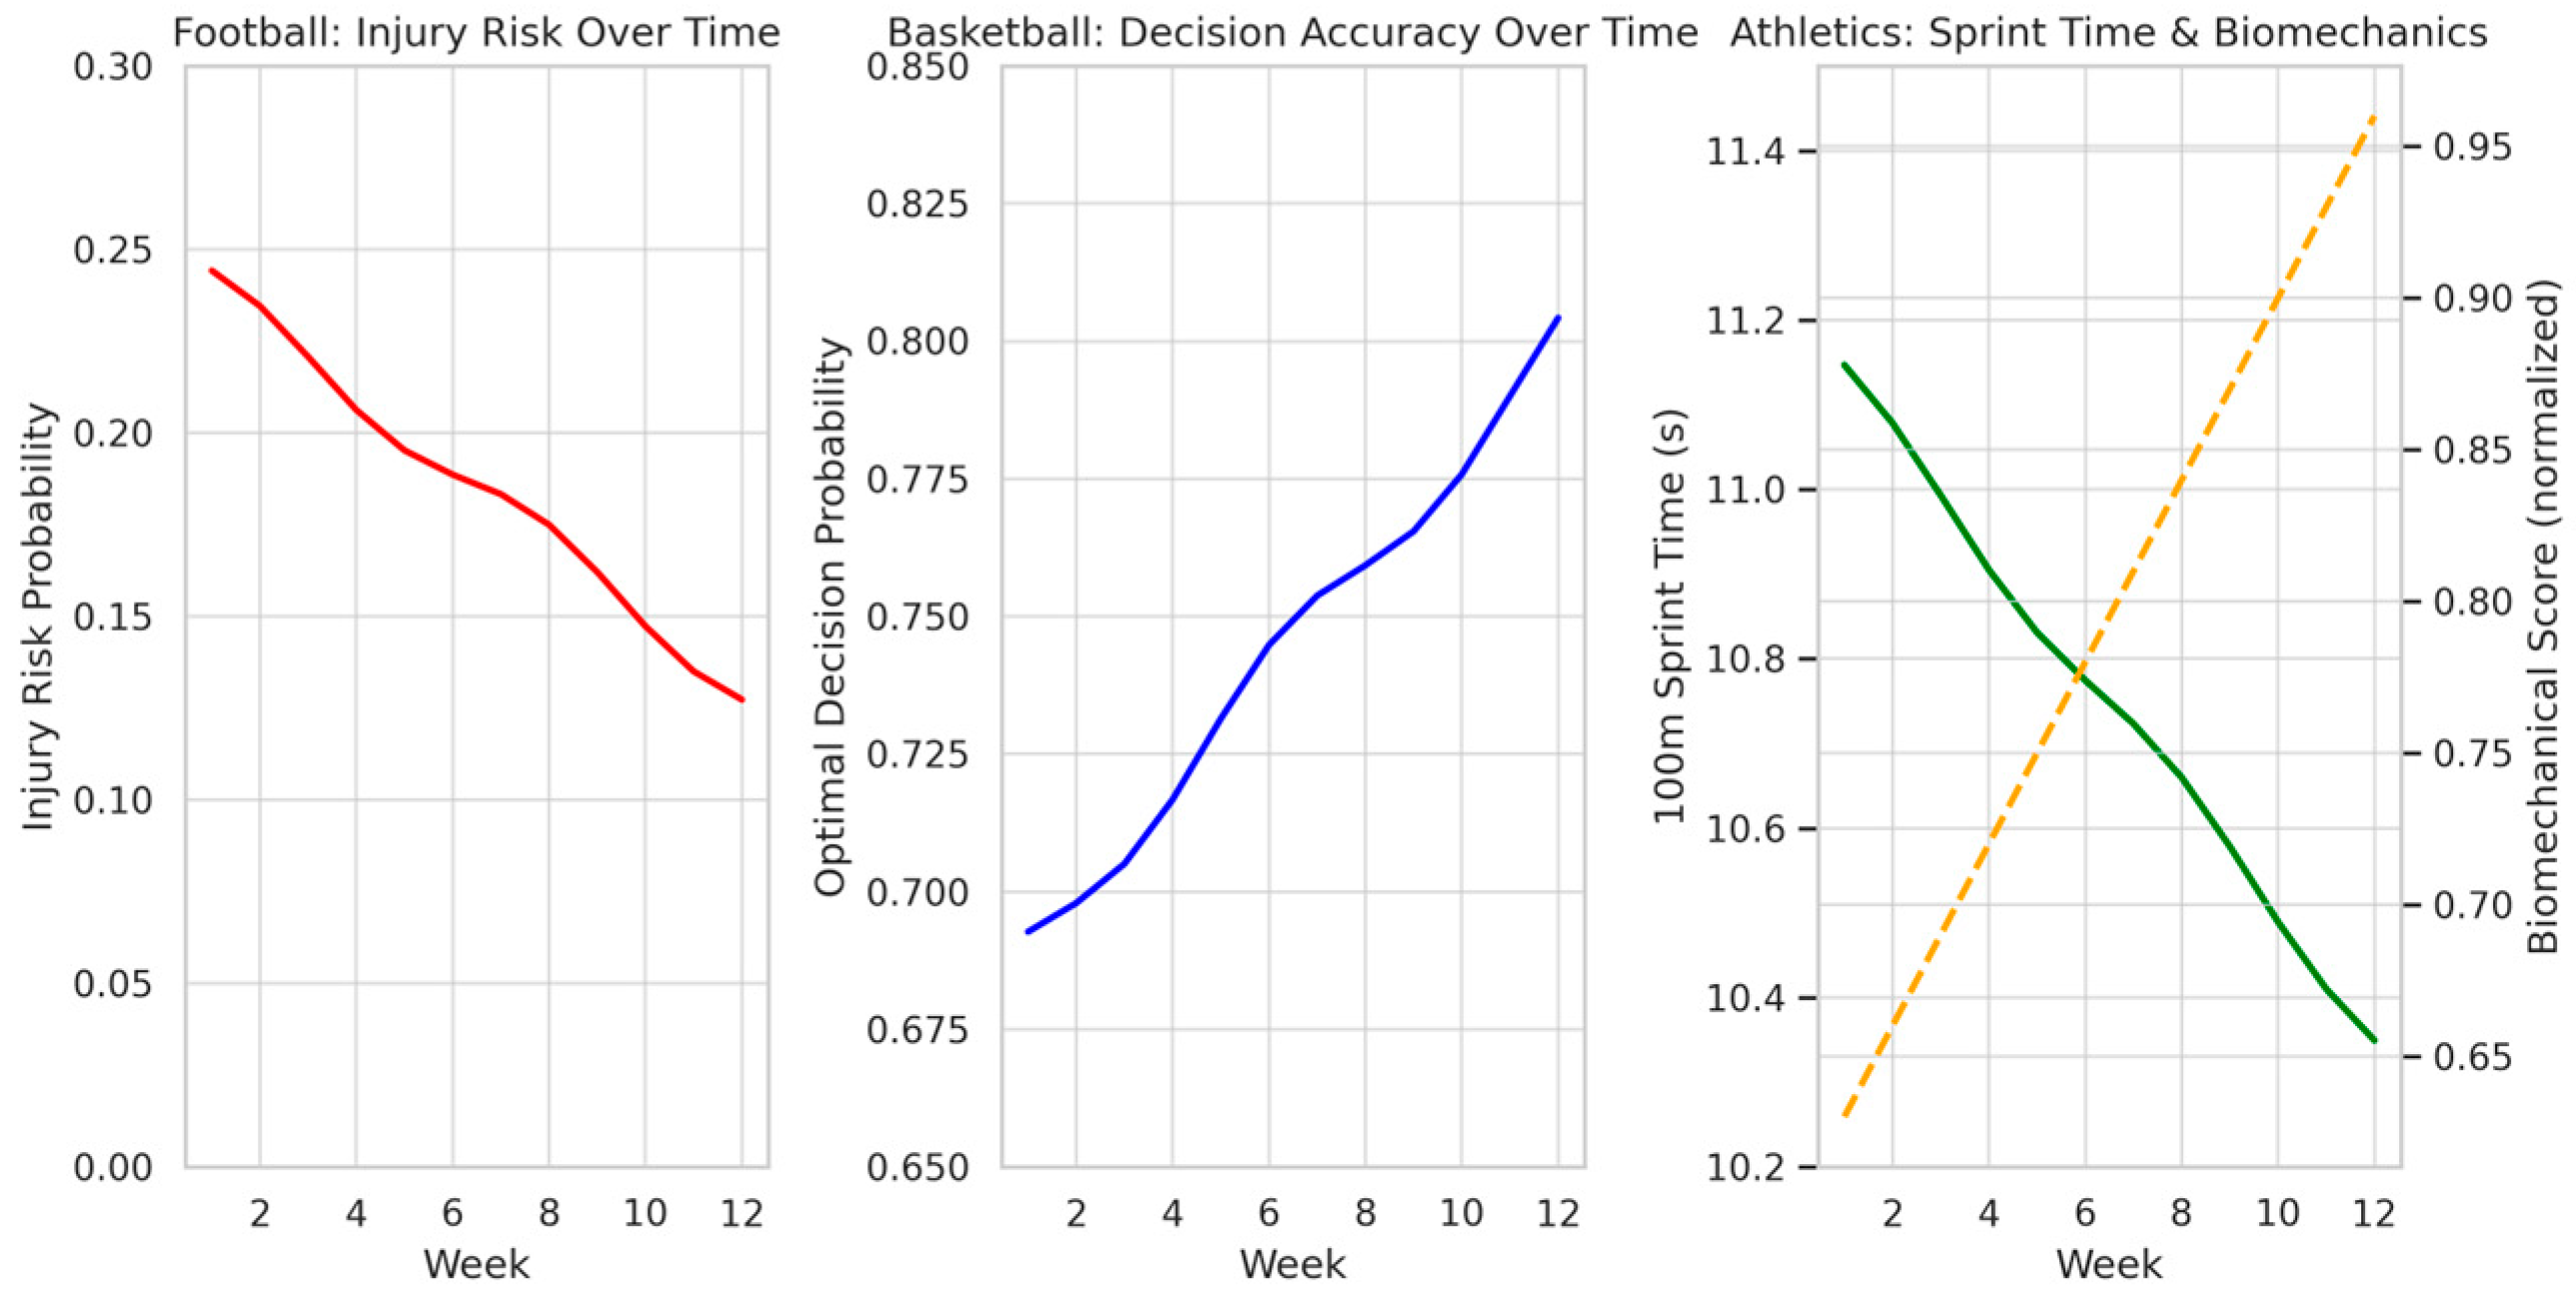
Figure 16.
Model validation and feature attribution across football, basketball, and athletics case studies.
Figure 16.
Model validation and feature attribution across football, basketball, and athletics case studies.
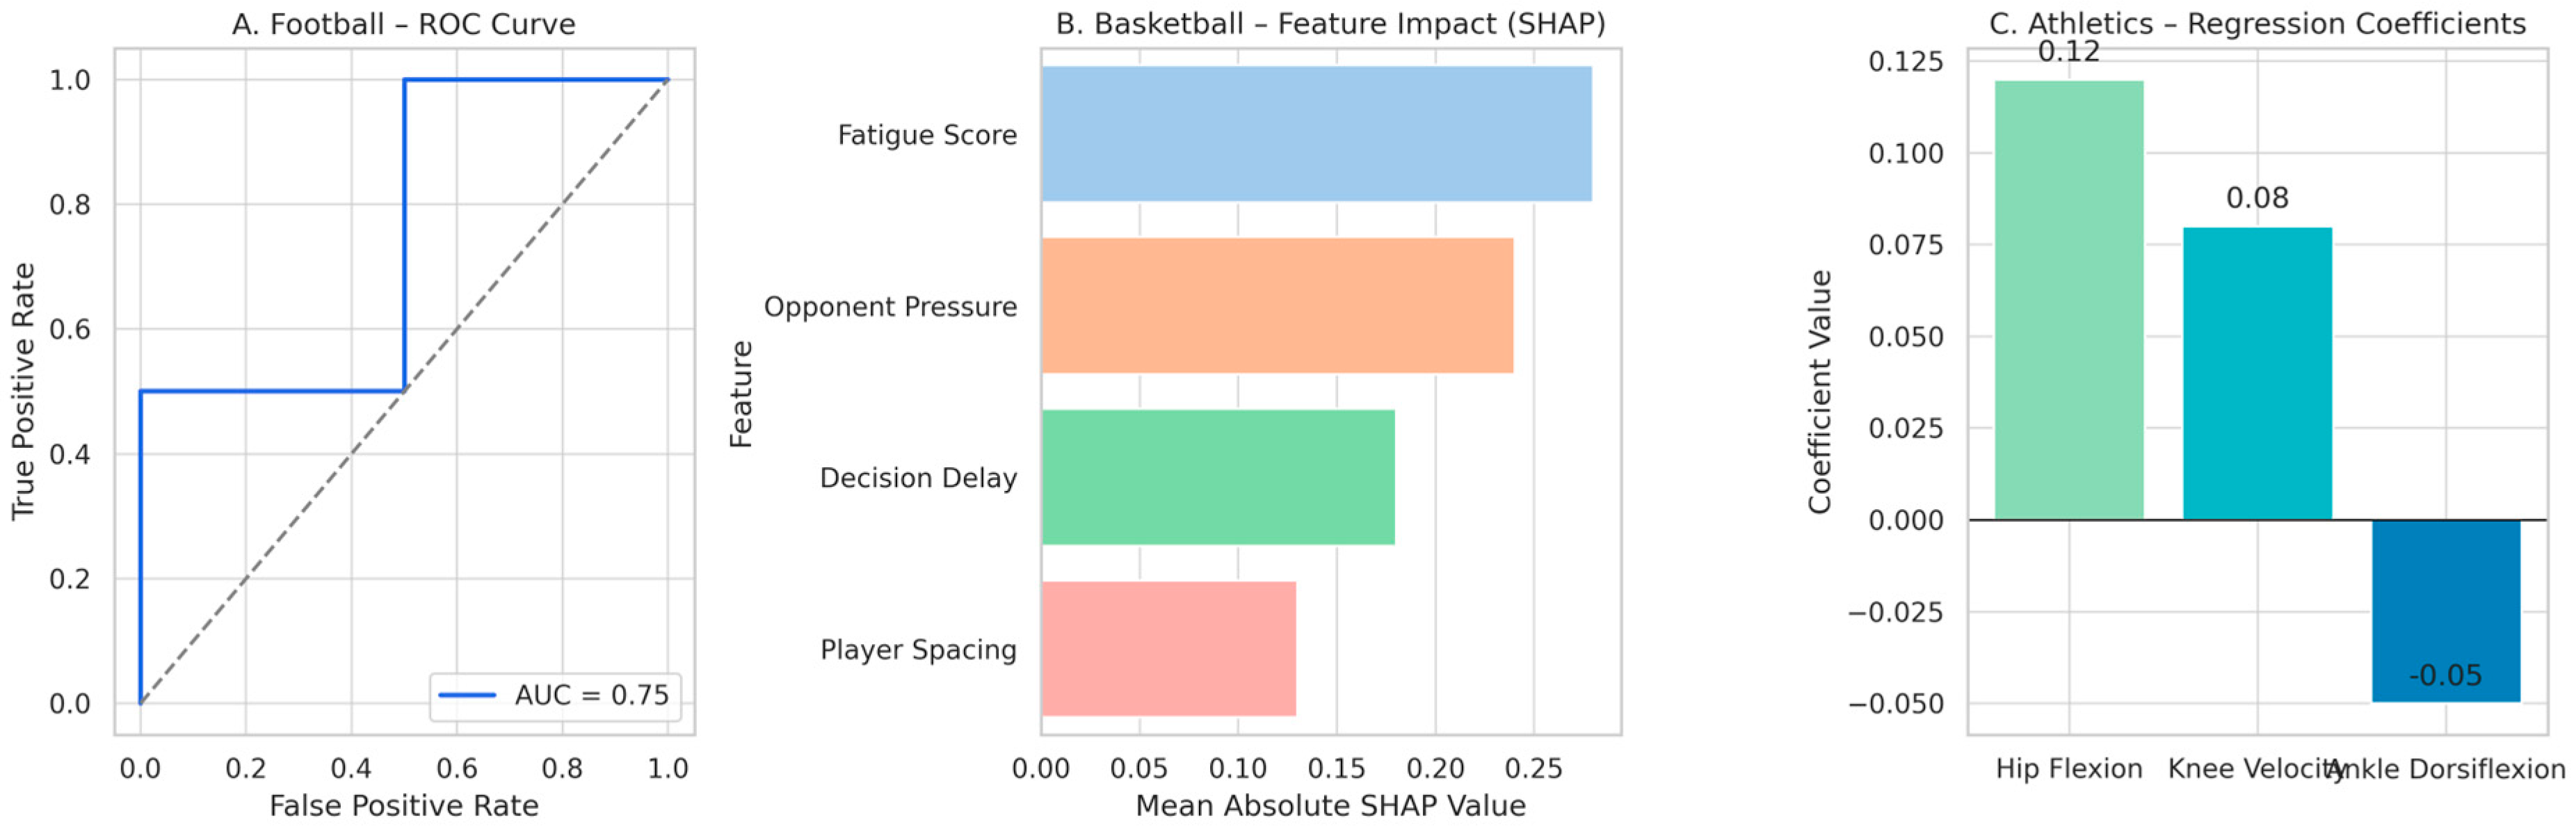
Figure 17.
Three-Dimensional Spatial Heatmap Displaying Movement Intensity and Physiological Load.
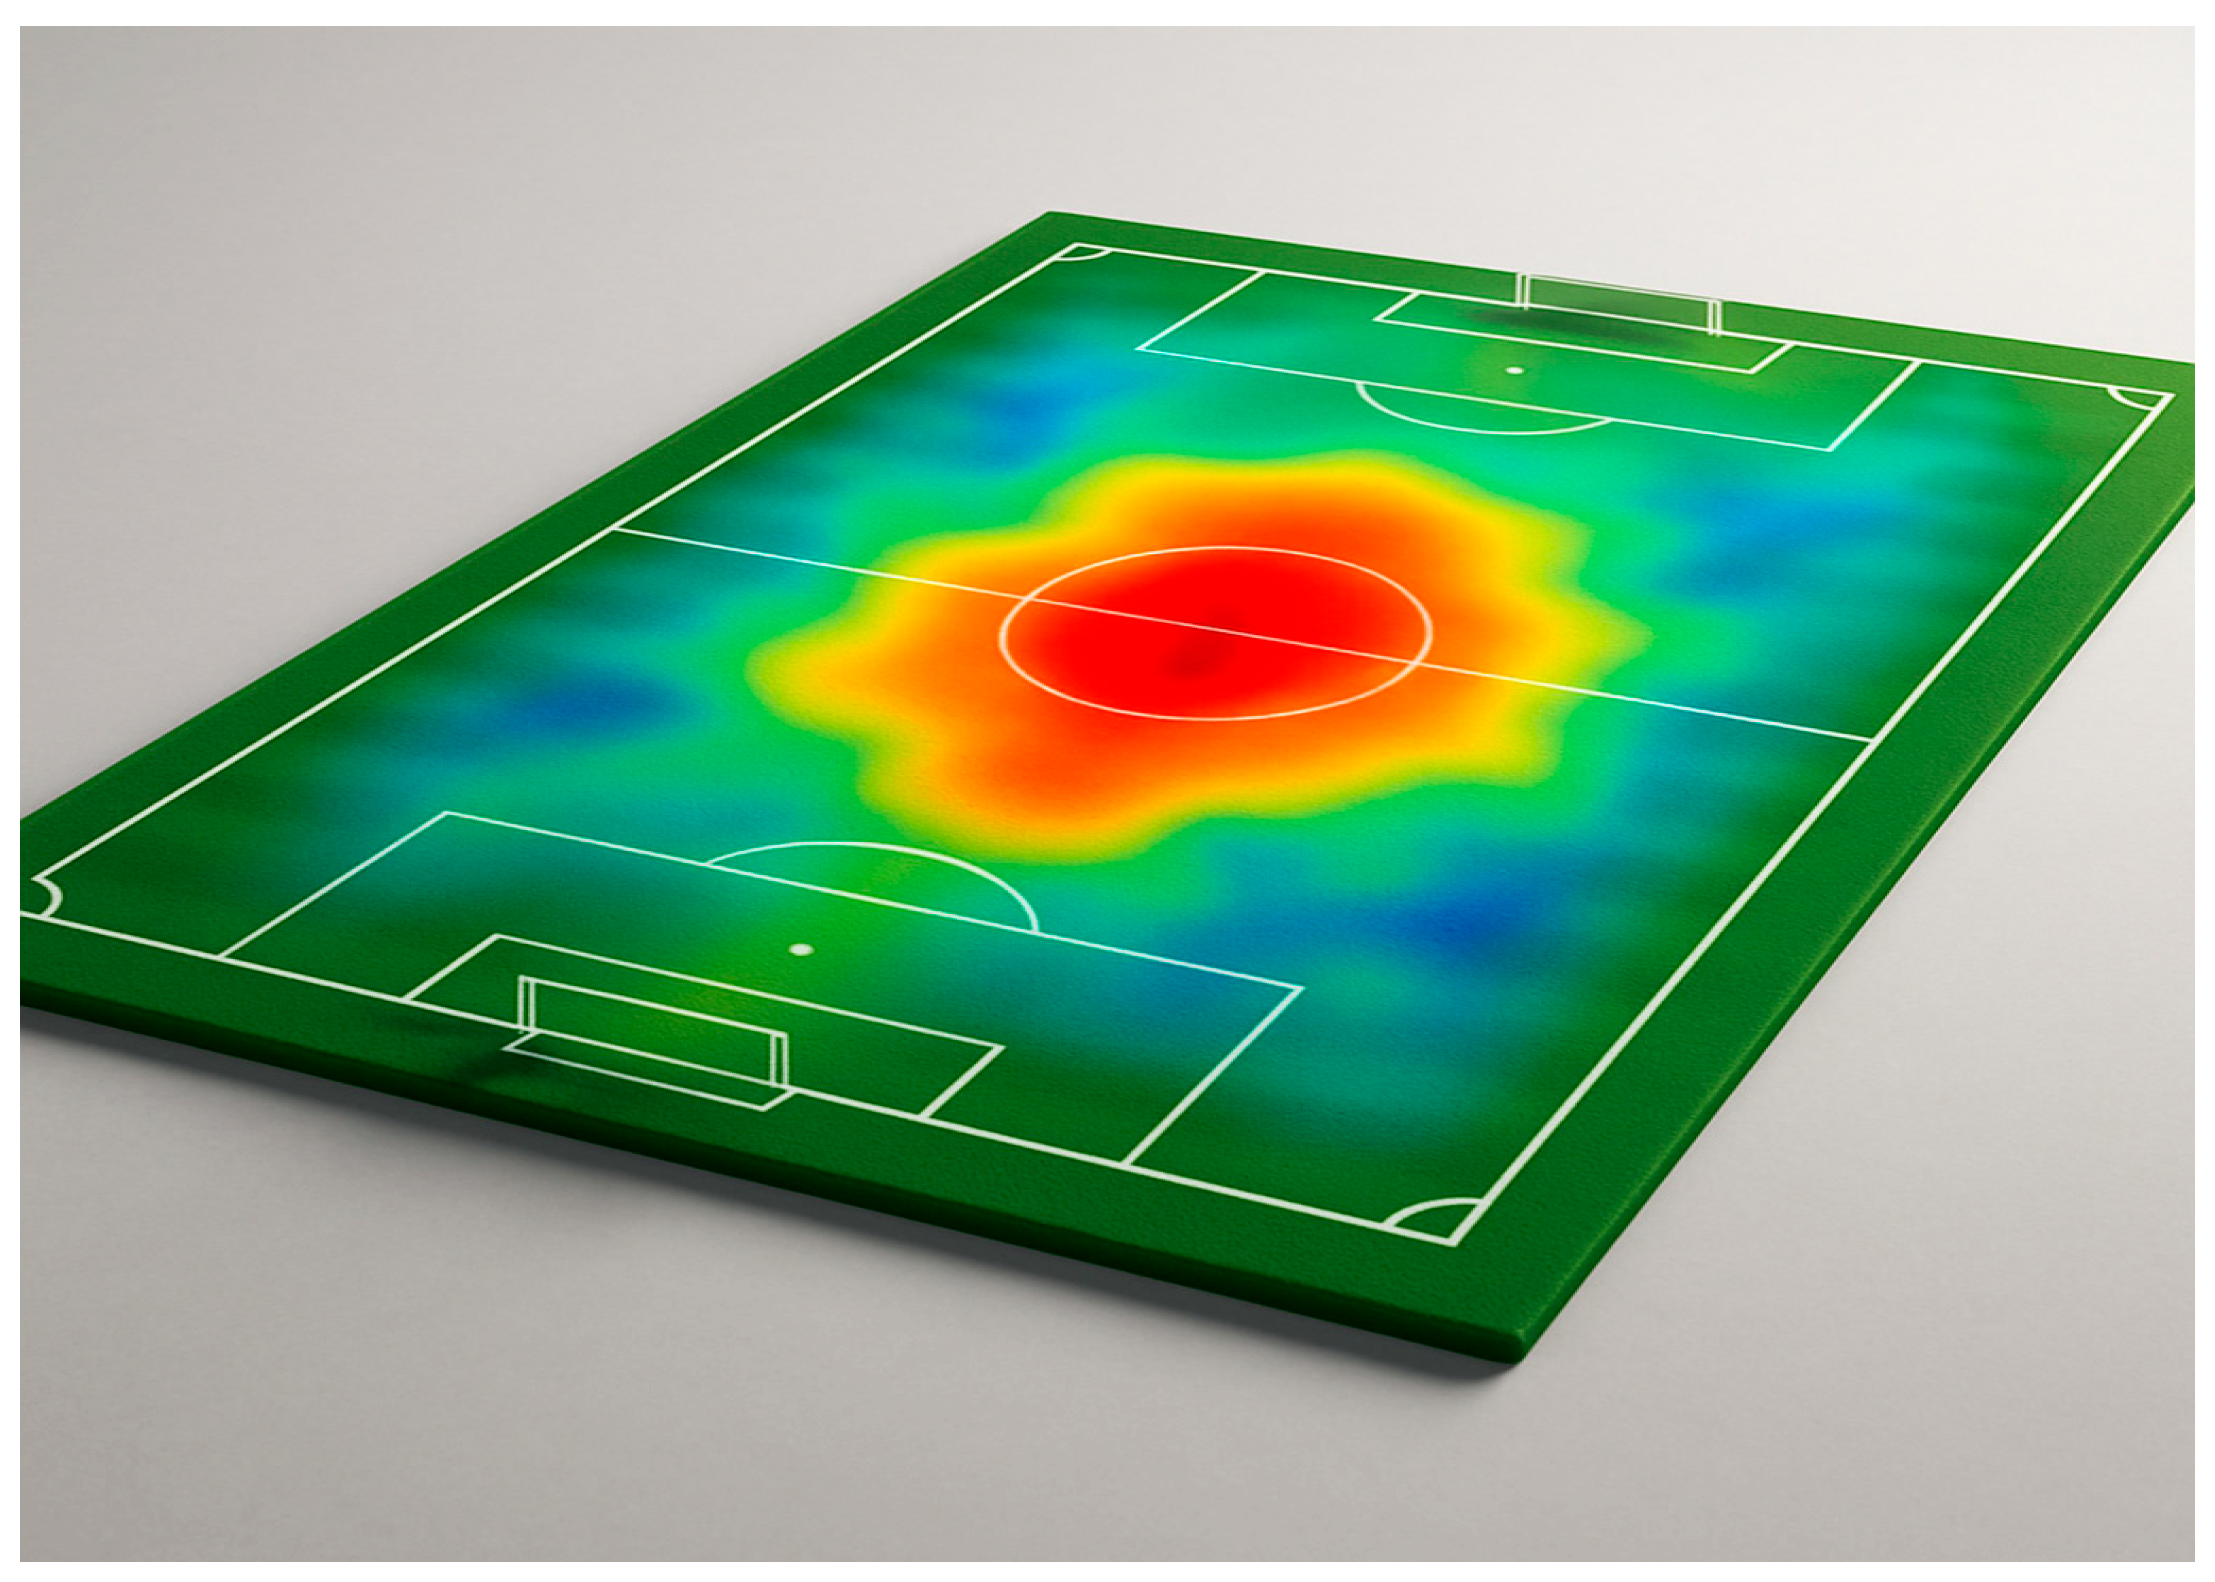
Figure 18.
Summary of Model-Triggered Alerts by Athlete Based on Risk Thresholds.
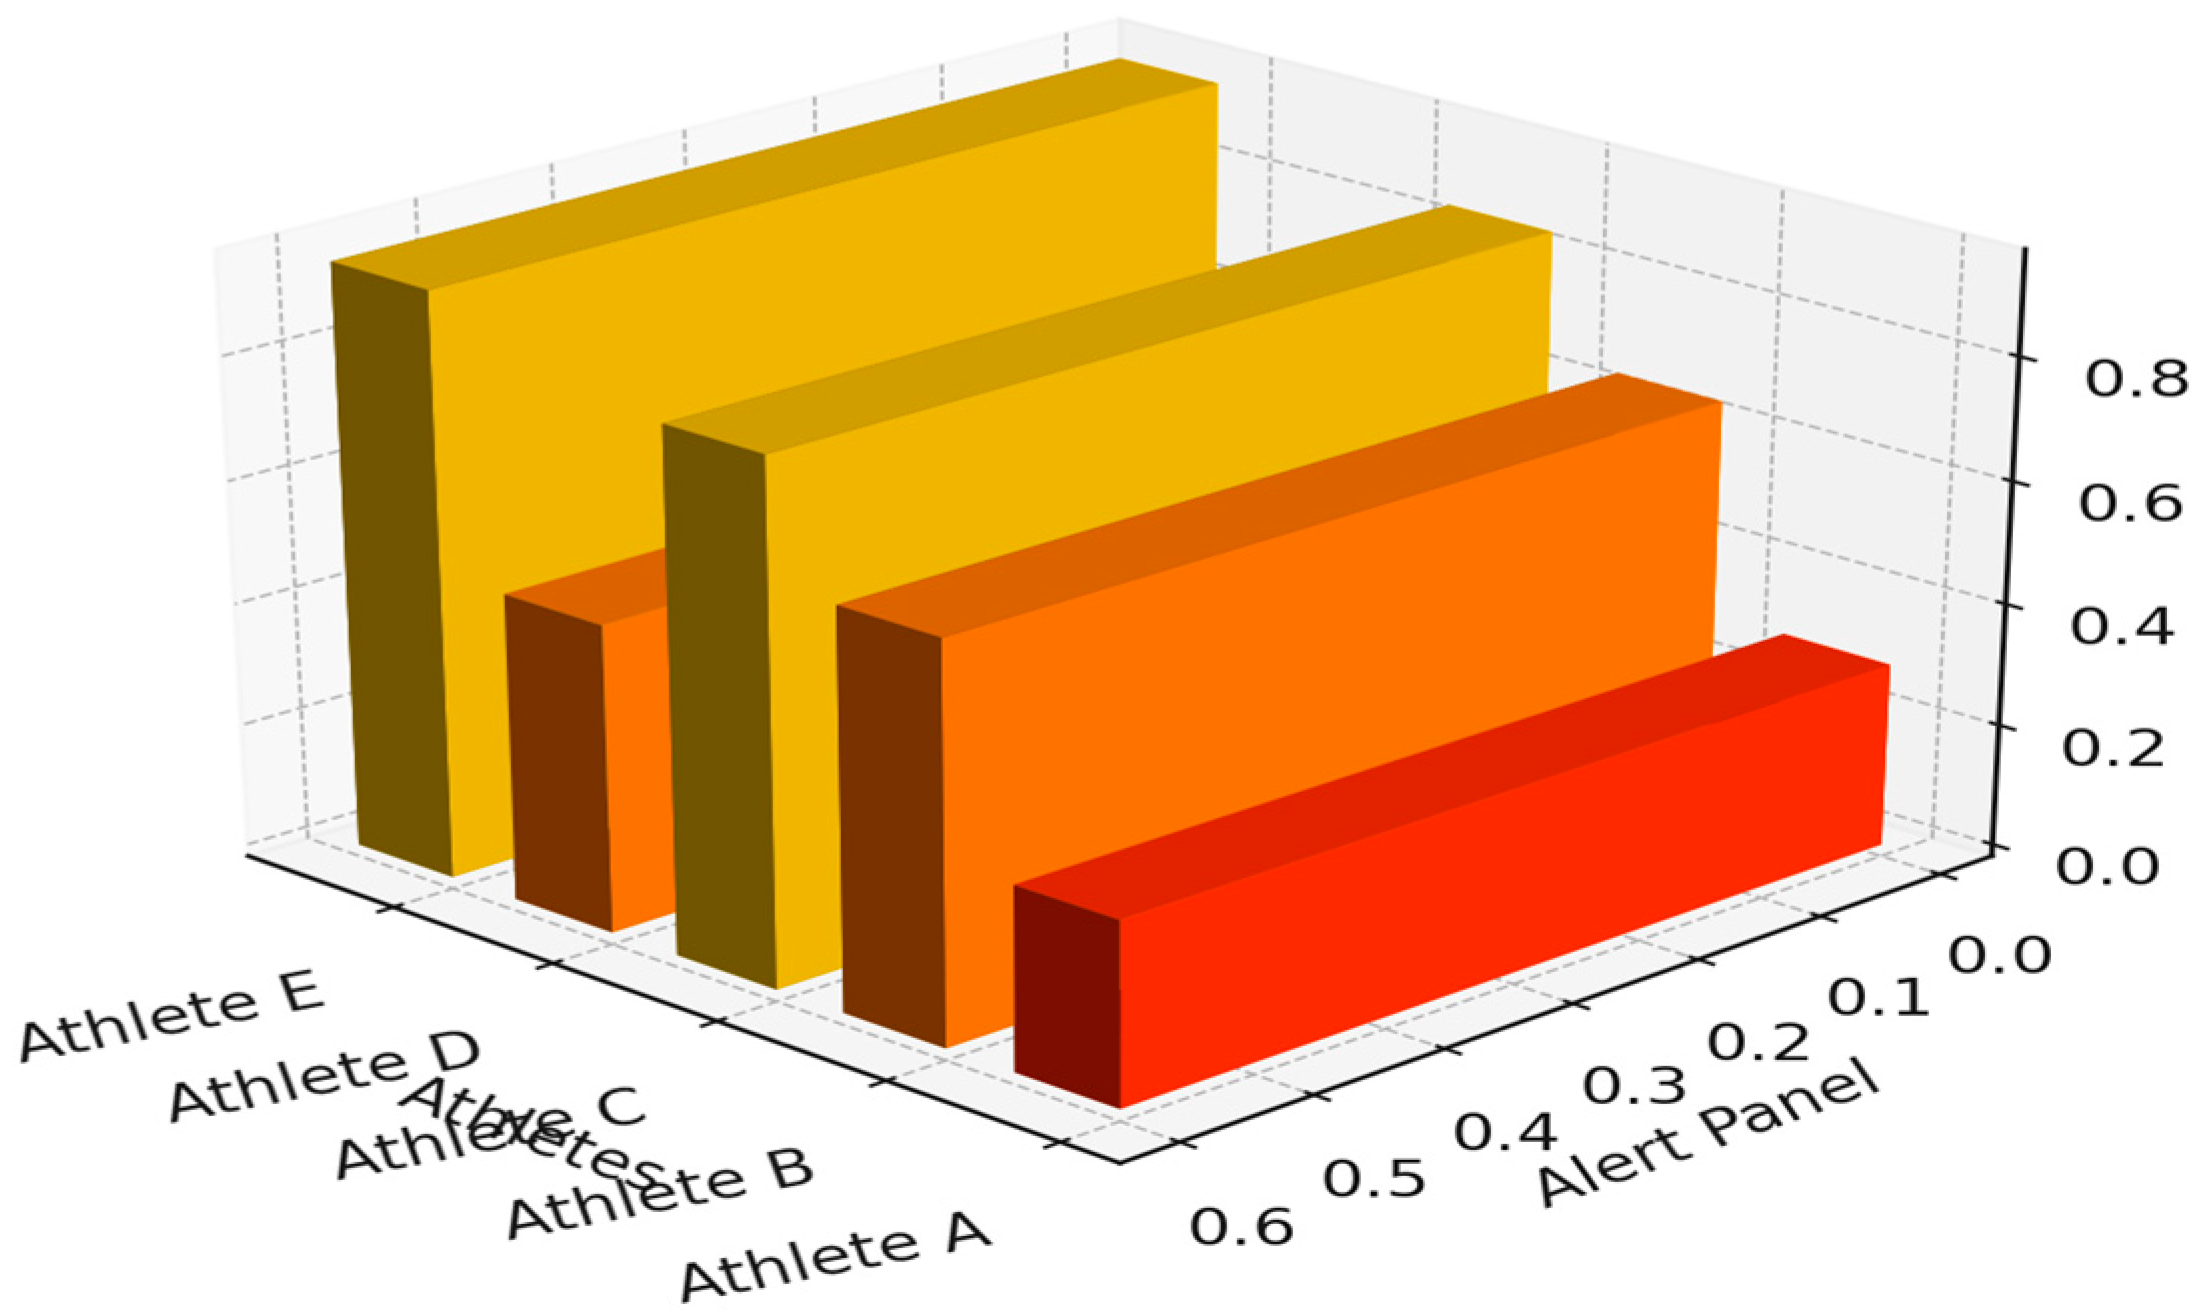
Figure 19.
Example of a multi-role dashboard using Grafana to monitor training and recovery metrics. Visualization built using Grafana Labs software [59].
Figure 19.
Example of a multi-role dashboard using Grafana to monitor training and recovery metrics. Visualization built using Grafana Labs software [59].
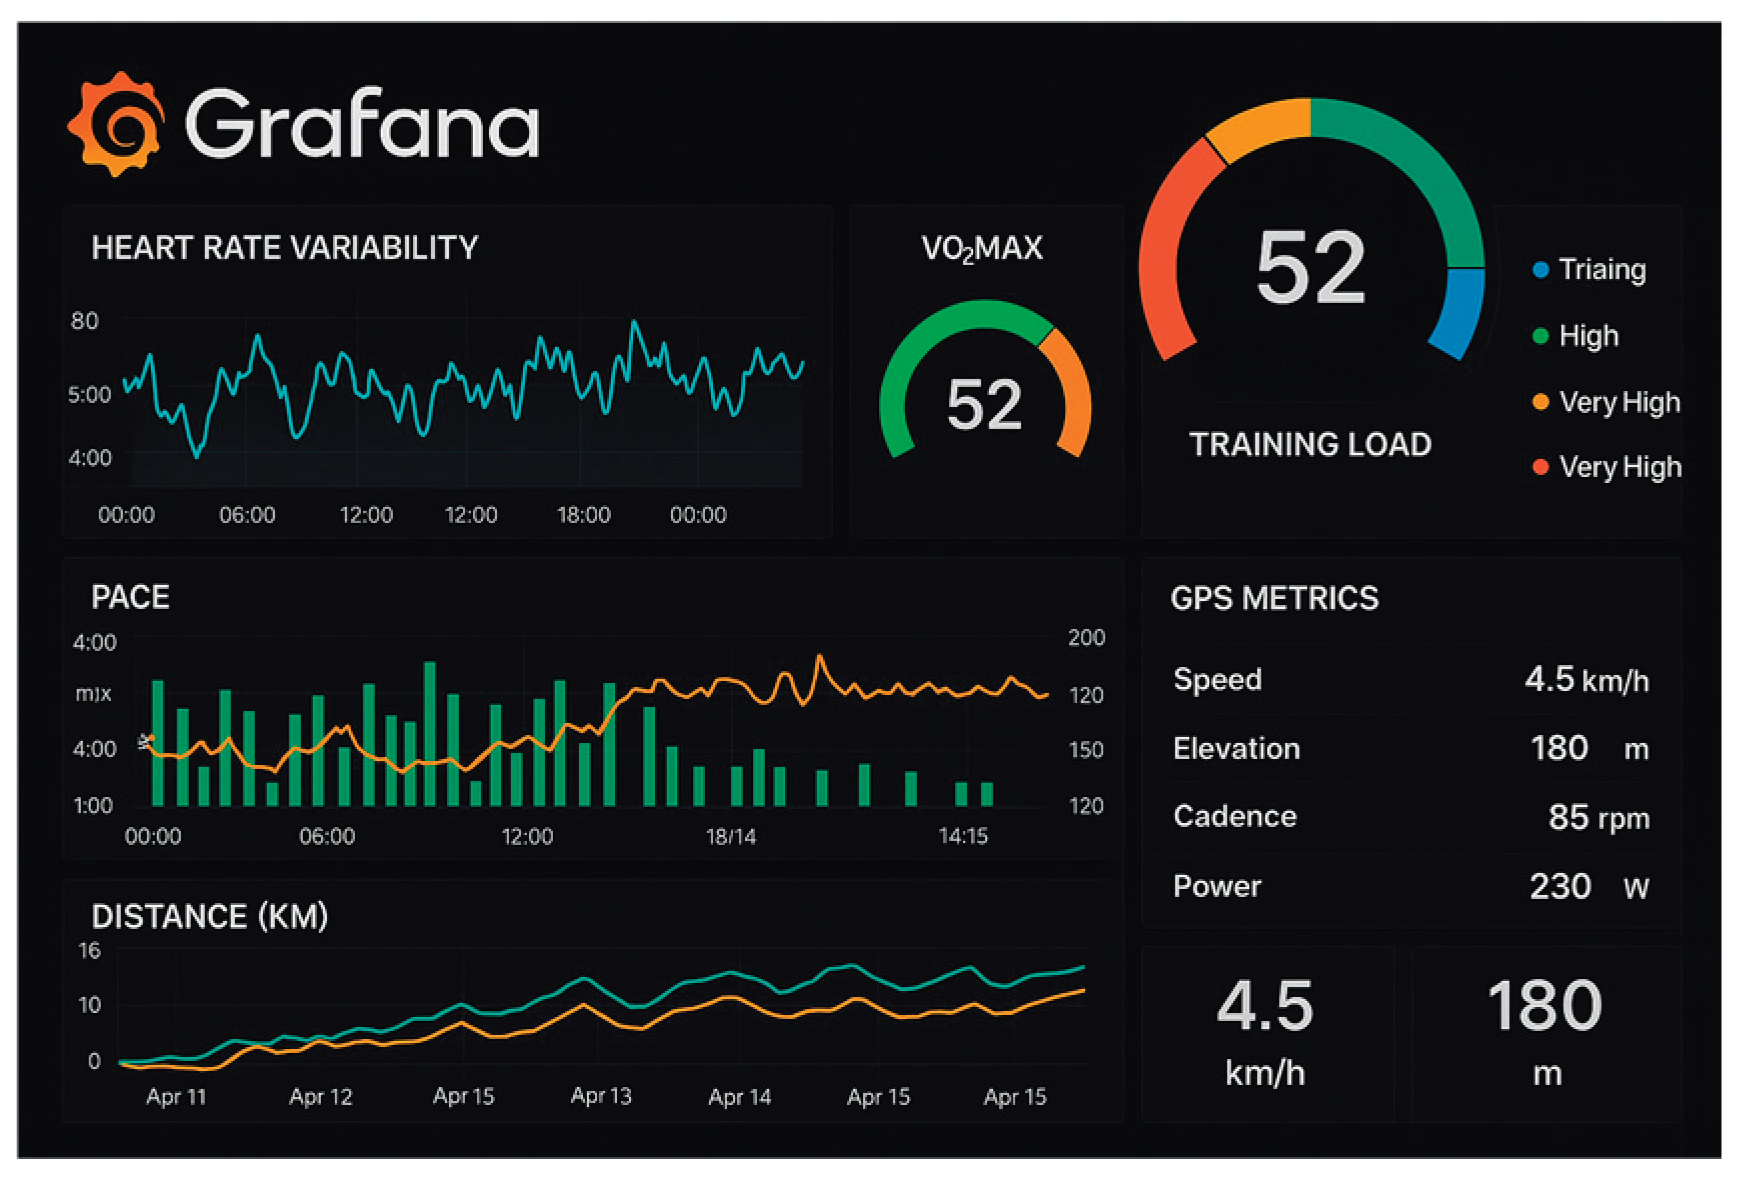

Table 1.
Primary outcomes by case study.
| Case Study | Objective | Method | Outcome |
| Football | Hamstring Injury Rate Reduction (HIPR) | LightGBM + SHAP |
HIPR ↓12%, Flagged ↓30% |
| Basketball | Decision Making Accuracy Improvement (DMAI) |
Logistic Regression + Game Theory |
DMAI ↑16% Turnovers ↓22% |
| Athletics | Sprint mechanics optimization | Multivariate Linear Regression | Sprint time ↓8% |
Table 2.
Summary of key statistical outcomes across case studies.
| Case Study | Metric Compared | Δ (Change) | p-value |
95% CI |
Effect Size (Cohen’s d) |
| Football | Injury Rate ↓ | –12% | 0.012 | [– 20%, – 3%] | 0.65 (Medium–Large) |
| Football | Flagged Injury ↓ | –30% | 0.007 | [– 42%, – 18%] | 0.72 (Large) |
| Basketball | Decision Making Accuracy ↑ | +16% | 0.008 | [+ 3%, + 19%] | 0.71 (Large) |
| Basketball | Turnovers ↓ | –22% | 0.017 | [– 34%, – 10%] | 0.63 (Medium–Large) |
| Athletics | Sprint Time ↓ | –0.90s | <0.001 | [– 1.23, – 0.57]s | 0.94 (Large) |
Table 3.
Model performance metrics and explainability.
| Case Study | Primary Model | Performance Metric 1 | Performance Metric 2 | Interpretability Tools |
|
Football injury risk |
Light GBM Classifier |
AUC-ROC 0.87 |
Injury rate↓12%, Flagged ↓30% |
SHAP Values |
|
Basketball decision making |
Logistic Regression | Optimal Choice ↑16% | Turnovers ↓22% |
Model Coefficients |
|
Athletics sprint mechanics |
Multivariate Linear Regression | 100 m Sprint Time Reduction ↓8% |
Joint Angles Optimized | Regression Coefficients |
Disclaimer/Publisher’s Note: The statements, opinions and data contained in all publications are solely those of the individual author(s) and contributor(s) and not of MDPI and/or the editor(s). MDPI and/or the editor(s) disclaim responsibility for any injury to people or property resulting from any ideas, methods, instructions or products referred to in the content. |
© 2025 by the authors. Licensee MDPI, Basel, Switzerland. This article is an open access article distributed under the terms and conditions of the Creative Commons Attribution (CC BY) license (http://creativecommons.org/licenses/by/4.0/).
Copyright: This open access article is published under a Creative Commons CC BY 4.0 license, which permit the free download, distribution, and reuse, provided that the author and preprint are cited in any reuse.


