Submitted:
09 June 2025
Posted:
10 June 2025
You are already at the latest version
Abstract
As smart wearable devices become increasingly popular, the collection and analysis of large-scale sports data has provided new possibilities for optimizing training effects. Based on the fitness tracker dataset, this study conducts in-depth analysis and modeling of user exercise data using machine learning methods. The study compares multiple algorithms including random forest, decision tree, support vector machine, and naive Bayes. Results show that the random forest model performs best in prediction accuracy and model stability, with a Mean Absolute Error (MAE) of 156.42 calories and a coefficient of determination (R²) of 0.857. Feature importance analysis reveals that body fat percentage, maximum heart rate, and age are the three most significant factors affecting exercise outcomes, providing a scientific basis for selecting monitoring indicators in intelligent sports equipment. The study also finds that the optimal single exercise duration is between 1.2-1.6 hours, and immediate physiological indicators are more valuable than long-term exercise habits in predicting short-term exercise effects. The findings of this study provide theoretical support and practical guidance for the optimization of intelligent physical exercise equipment, which is significant for improving user training effects. This study bridges the gap between raw fitness data and actionable insights for equipment optimization.
Keywords:
intelligent sports equipment
; machine learning
; random forest
; sports data analysis
1. Introduction
With the rapid development of science and technology and the continuous improvement of people’s health awareness, intelligent physical exercise equipment plays an increasingly important role in the modern fitness field [1]. These devices can not only record the user’s sports data in real time, but also provide personalized training suggestions. However, how to effectively analyze and utilize these massive sports data and provide users with more accurate training effect feedback is still an urgent problem.
Based on the large-scale fitness tracker data set, this study uses machine learning method to deeply analyze and model the user’s motion data. The main goal of the study is to reveal the key factors that affect the exercise effect through data mining and artificial intelligence algorithm, and provide data support for the optimization of intelligent physical exercise equipment. Specifically, this study is devoted to solving the following three core problems. To address these challenges, this paper presents a systematic analysis based on machine learning approaches. First, identify and quantify the main characteristics that affect the sports effect. Secondly, build an accurate sports effect prediction model. Finally, it provides algorithm support for personalized recommendation system of intelligent sports equipment.
2. Literature Review
In recent years, the research of intelligent physical exercise equipment has been widely concerned by academic circles. This section reviews the current research on intelligent sports equipment, data analysis methods and the application of artificial intelligence in sports effect prediction.
In the research of intelligent sports equipment, Seshadri et al. (2019) systematically evaluated the accuracy of commercial wearable devices in the research published in NPJ Digital Medicine, and found that these devices have high reliability in heart rate monitoring [2]. McGinnis et al. (2021) confirmed the important value of these devices in sports performance evaluation by studying the application of wearable sensors in sports [3].
In the research of sports data analysis method, Bai et al. (2022) proposed a fitness activity identification method based on machine learning, which showed good performance in practical application [4]. Patiño-Saucedo et al. (2022) summarized the feature selection methods in sports data analysis, which provided an important methodological reference for the follow-up research [5].
In the application of artificial intelligence, Ramanujam et al. (2021) compared the performance of different machine learning algorithms in motion pattern recognition in the research published in Sensors, and the random forest algorithm showed the best comprehensive performance [6]. Guo et al. (2020) discussed the application of deep learning in the prediction of exercise intensity and achieved remarkable results [7].
Through literature review, it can be found that although the research has made progress in the application of intelligent sports equipment, there is still room for improvement in the accuracy of data analysis and personalized recommendation. Especially in the integration of multi-source data and accurate prediction of training effect, further research and exploration are needed. However, few studies have systematically compared multiple machine learning models on a standardized fitness dataset, which is the primary focus of this study.
3. Research Design
3.1. Data Introduction
In this study, the large-scale fitness tracker data set is used as the research basis, which covers the multi-dimensional data information generated by many users in the daily exercise process, providing a solid data foundation for the in-depth analysis of this study. In terms of basic characteristics of users, the data set records demographic characteristics including user ID, age, gender, height and weight, which is helpful for hierarchical analysis of people and generation of personalized suggestions.
In the aspect of sports data collection, the data set records the user’s sports performance indicators in real time through smart wearable devices, including key indicators such as daily steps, heart rate changes, calorie consumption, exercise duration and exercise intensity. At the same time, the data set also contains the user’s sleep quality data, which provides an important basis for studying the correlation between exercise and rest. All the data are equipped with accurate time stamp information, which enables the research to analyze from the perspective of time series and track the dynamic changes of users’ exercise habits and health status. Figure 1 shows the case of missing data values.
In order to ensure the scientific research and data quality, this paper systematically preprocesses the original data. Identify and deal with abnormal values through statistical methods to ensure the validity of data; Standardize the data of different dimensions to eliminate the influence of dimensional differences.
Specifically, in the treatment of outliers, this paper uses the quartile distance (IQR) method to identify and truncate the values above Q3+1.5*IQR or below Q1-1.5*IQR. In the data standardization stage, Z-score is used to standardize continuous variables, and Min-Max is used to standardize variables with natural boundaries (such as heart rate and body fat rate).
The remarkable advantages of this data set are its sufficient sample size, rich data dimensions and high recording accuracy, which provide strong support for the in-depth development of this study. Through the mining and analysis of these data, we can better understand the user’s exercise pattern, evaluate the training effect, and provide data support for making personalized exercise suggestions.
3.2. Descriptive Statistical Analysis
Based on the descriptive statistical analysis of the data set in Figure 2, the results show that the demographic characteristics and sports performance indicators of the user groups show significant distribution characteristics. In terms of age distribution, the sample group is mainly concentrated between 20 and 60 years old, and the users in the age group of 20-30 have the highest frequency, showing obvious characteristics of youthfulness. The weight distribution range is 40-120kg, showing the characteristics of approximate normal distribution, mainly concentrated in the range of 60-80kg. The height data shows that the height of most users is between 1.5 and 2.0 meters, and the user group of about 1.7 meters is the most concentrated, which is consistent with the height distribution characteristics of the general population.
In terms of sports-related indicators, the data show that the BMI of users is mainly distributed between 15 and 50, and the BMI of most users is within the normal range. Calorie consumption data presents a relatively uniform distribution, mainly concentrated in the range of 400-1800 calories, and the peak value appears in the range of 800-1200 calories. The distribution of exercise duration shows that the single exercise duration of most users is between 0.6 and 2.0 hours, of which 1.2-1.4 hours is the most common exercise duration. The data of body fat rate shows that the distribution range of user groups is between 10% and 35%, showing a relatively concentrated feature, while the water intake fluctuates between 1.5 and 3.5 liters.
The correlation matrix analysis in Figure 3 reveals the internal correlation among the indicators. The data shows that the correlation between most variables is weak, and the absolute value of correlation coefficient is generally lower than 0.2. It is worth noting that there is a certain negative correlation between heart rate indicators (Max_BPM and Avg_BPM), and the correlation coefficient is about -0.07, which indicates that there may be a certain regulation mechanism between the maximum heart rate and the average heart rate. There is a weak positive correlation between exercise duration and calorie consumption, which accords with the basic principle of exercise physiology. There is also a positive correlation between weight and height, but the degree of correlation is not high, which may be related to the diversity of samples.
Through the in-depth analysis of Figure 4 and Figure 5, it can be found that there are some significant characteristics and correlations between the gender distribution of users, the choice of exercise types, the duration of exercise and calorie consumption in the data set. In terms of gender distribution, the data shows that the number of female users is slightly higher than that of male users, but overall, the gender distribution is relatively balanced, and this balanced sample distribution is helpful to reduce the biased influence of gender factors on the research results. In the choice of sports types, the data presents obvious characteristics of differentiated distribution. Strength is the most popular type of exercise, with about 500 records. Followed by Yoga and Cardio, with about 400 records respectively. The participation frequency of high-intensity interval training (HIIT) is relatively low, which reflects that users tend to traditional and basic training methods in the choice of exercise types.
In the analysis of the relationship between exercise duration and calorie consumption, the scatter chart presents some interesting characteristics. First of all, the distribution range of data points shows that the user’s exercise duration is mainly between 0.6 and 2.0 hours, while the calorie consumption is between 300 and 1800 calories. Through the scattered distribution of gender distinction, it can be observed that there are certain differences between men and women in sports performance. Although the distribution of exercise duration between men and women is similar, under the same exercise duration, the calorie consumption of male users is generally slightly higher than that of female users.
The data distribution in the scatter chart shows great discreteness, which indicates that the duration of exercise is not the only determinant of calorie consumption. Even under the same exercise duration, there may be significant differences in calorie consumption among different users. Especially in the interval of 1.2-1.6 hours of exercise duration, the density of data points is the highest, which may represent the best exercise duration choice for most users.
3.3. oftware and Hardware Configuration
The data processing and model training of this study are mainly carried out in the following software and hardware environments. In terms of hardware configuration, the workstation equipped with Intel Core i7 processor, 16GB RAM memory and NVIDIA GeForce RTX 3060 graphics card (8GB memory). The operating system adopts 64-bit Windows 10 Professional Edition to provide a stable running environment.
In the aspect of software environment configuration, Python 3.8 is mainly used as the core programming language. Data processing and analysis mainly rely on PANDAS (version 1.5.3) and NUMPY (version 1.23.5) libraries, which provide efficient support for large-scale data processing and numerical calculation. Data visualization is realized by Matplotlib (version 3.7.1) and Seaborn (seaborn(0.12.2).The construction and training of machine learning model mainly use SCI Kit-Learn (version 1.2.2) framewor.
In the aspect of development environment, JupyterLab (version 3.6.3) is chosen as the main interactive development environment. At the same time, VSCode (VSCode(1.78.0) is used as a supplementary development tool for editing large-scale code files and project structure management.
3.4. Model Introduction
In this study, a variety of classic machine learning algorithms are used to model and analyze the data of intelligent physical exercise equipment, including four methods: random forest, decision tree, support vector machine (SVM) and naive Bayes. These models have their own characteristics and can analyze and predict the motion data from different angles.
As a representative of integrated learning method, random forest model predicts by constructing multiple decision trees and voting or averaging. The model shows strong feature processing ability, which can effectively deal with multi-dimensional features in sports data Another advantage of random forest is that it can evaluate the importance of features. Decision tree model provides an intuitive data classification and regression method. The model constructs a tree-like decision structure by recursively dividing the feature space. As a powerful supervised learning algorithm, Support Vector Machine (SVM) realizes data classification and regression by finding the optimal hyperplane. SVM model is mainly used to deal with nonlinear motion data relations, and kernel function technology is used to deal with pattern recognition in high-dimensional feature space. Naive Bayesian model is based on Bayesian theorem, and adopts the method of probability and statistics to make classification prediction. It has high computational efficiency and performs well when the features are relatively independent.
The combined application of these four models not only ensures the reliability of the prediction results, but also provides a multi-angle analysis perspective for the evaluation of sports effects in different scenes. By comparing the prediction effects of different models, we can understand all the factors that affect the exercise effect more comprehensively, thus providing more reliable data support for the optimization of intelligent physical exercise equipment. Together, these models offer a comprehensive perspective for evaluating training effects and developing intelligent recommendation systems.
3.5. Parameter Tuning
In order to ensure the optimization of model performance, this study systematically optimizes the parameters of each model. Grid Search combined with 50% cross-validation method is used to optimize the parameters. The main parameters are as follows: the number of trees in random forest model (n_ estimators: [100,200,300,500]), the maximum depth (max_depth: [10,20,30,none]) and the minimum sample segmentation number. Support vector machine kernel function type (kernel: [‘RBF’,’ linear’]), regularization parameter C([0.1, 1, 10, 100]) and gamma value of RBF kernel function ([0.01,0.1,1,’ auto’]); Maximum depth of decision tree (max_depth: [5,10,15,20]) and minimum number of sample divisions (min_samples_split: [2,5,10]). Through cross-validation, the performance of different parameter combinations is evaluated, and finally the optimal parameter configuration on the validation set is selected. After optimization, the optimal parameter combination of random forest model is: n_estimators=300, max_depth=20, min_samples_split=5, which effectively avoids the over-fitting problem while maintaining the generalization ability of the model.
4. Experimental Result
Through the comparative analysis of the performance indexes of each machine learning model in Table 1, we can understand the performance characteristics of different algorithms in data processing of intelligent physical exercise equipment. In this study, four dimensions of mean absolute error (MAE), root mean square error (RMSE), determination coefficient (R) and calculation time are used for comprehensive evaluation, so as to obtain the best model selection basis.
The random forest model is the best in all evaluation indexes, with the MAE of 156.42 calories, RMSE of 198.73 calories and r of 0.857, which indicates that the model has the highest prediction accuracy and goodness of fit. The excellent performance of random forest is mainly due to its integrated learning characteristics, which can effectively deal with the nonlinear relationship and complex feature interaction in motion data.
The decision tree model shows fast calculation efficiency, and it only takes 1.58 seconds to complete the training and prediction, but its prediction accuracy is relatively low, with 187.65 calories for MAE, 235.91 calories for RMSE and 0.812 for r.
The support vector machine (SVM) model ranks second in the prediction performance, and its MAE is 172.83 calories, RMSE is 215.46 calories, and r is 0.834, which shows good generalization ability. However, the computing time of SVM model is the longest, reaching 3.67 seconds, which may be due to the high computational complexity of its kernel function when dealing with large-scale data.
Although naive Bayesian model has the fastest calculation speed (1.12 seconds), its prediction accuracy is the lowest, with MAE reaching 195.24 calories, RMSE 248.35 calories and r only 0.795. This result reflects that the conditional independence assumption of the model may be too strong to adapt to the complex feature dependence in motion data.
The comprehensive evaluation results show that the random forest model has obvious advantages in prediction accuracy and model stability, and is suitable as the core algorithm of intelligent physical exercise equipment.
By analyzing the scatter plot of actual calorie consumption and predicted calorie consumption shown in Figure 6, we can observe the prediction effect and potential characteristics of the model. The red dotted line in the scatter chart represents the ideal prediction line, and the distribution of data points reflects the prediction accuracy of the model. From the overall distribution, most data points are concentrated around the ideal prediction line, which shows that the model has certain prediction ability. However, we can also observe that there is a certain degree of dispersion, especially in the higher calorie consumption range (1400-1800 calories), and the predicted value fluctuates greatly. In the lower calorie consumption range (400-800 calories), the prediction of the model is relatively more concentrated, which indicates that the model is more stable in dealing with the prediction of moderate intensity exercise.
Figure 7 shows the relative importance of different properties by predicting training results using random forest algorithms. The horizontal bar chart indicates that body_fat_percentage appears to be the most impressive prophet, showing the highest importance of about 0.14. This discovery corresponds to physical principles, as the body structure is directly correlated with metabolic efficiency and calorie expenses during physical activity.
MAX_BPM (maximum heart rate) ranks as the second most important function of importance points around 0.12, reflecting its important role as an indicator of the heart’s reaction and the intensity of the exercise. The third is the most impressive variable age, which scores about 0.11, which corresponds to age -related changes in metabolism, heart capacity and general fitness levels.
Interestingly, the weight reflects moderate significance (approx. 0.10), while the height shows relatively low significance (about 0.08). This pattern suggests that body composition measurements provide more prognosis than simple anthropometric measurements. The remaining features including AVG_BPM, Water_intake, Workout_Frequency and Session_Duration, from 0.07 to 0.05, show the score of low significance. These results indicate that immediate physiological parameters have more predictive power than behavior or ordinary exercise properties, which support the findings from the study of the superiority of real -time biomarkers in training results.
5. Conclusions
It is found that the user’s movement pattern presents obvious individual differences. There is a significant correlation between age, gender, weight and sports effect, which provides an important basis for the formulation of personalized training programs. At the same time, the study also found that the most suitable single exercise duration interval is 1.2-1.6 hours, which is of great guiding significance for optimizing the training plan.
In the aspect of model construction, by comparing many machine learning algorithms such as random forest, decision tree, support vector machine and naive Bayes, the research shows that random forest model has the best performance in prediction accuracy and model stability, with its MAE of 156.42 calories and R of 0.857. This result verifies the advantages of ensemble learning method in dealing with complex motion data.
Through the analysis of feature importance, the key factors affecting the sports effect are identified. Body fat percentage, maximum heart rate and age are the three most influential characteristics, and this discovery provides a scientific basis for the selection of monitoring indicators for intelligent sports equipment. At the same time, the study also found that immediate physiological indicators are more valuable than long-term exercise habits in predicting short-term exercise effects.
The results of this study not only provide theoretical support and practical guidance for the optimization of intelligent physical exercise equipment, but also lay the foundation for subsequent related research. In practical terms, this study supports the development of adaptive fitness systems tailored to individual users. With the continuous development of artificial intelligence technology, intelligent sports equipment will be able to provide more accurate training effect feedback, thus better serving the health management needs of users.
References
- Nigg, C.R. Technology’s influence on physical activity and exercise science: the present and the future[J]. Psychology of Sport and Exercise 2003, 4, 57–65. [Google Scholar] [CrossRef]
- Seshadri, D.R.; et al. “Wearable sensors for monitoring the physiological and biochemical profile of the athlete. ” NPJ Digital Medicine 2019, 2, 1–16. [Google Scholar] [CrossRef] [PubMed]
- McGinnis, R.S.; et al. “Wearable sensors in sport: a practical guide to usage and implementation. ” Journal of Sports Sciences 2021, 39, 1–12. [Google Scholar]
- Bai, L.; et al. “A survey on deep learning for human activity recognition. ” ACM Computing Surveys, 2022, 54, 1–37. [Google Scholar]
- Patiño-Saucedo, J.A.; Ariza-Colpas, P.P.; Butt-Aziz, S.; Piñeres-Melo, M.A.; López-Ruiz, J.L.; Morales-Ortega, R.C.; De-la-Hoz-Franco, E. Predictive model for human activity recognition based on machine learning and feature selection techniques. International journal of environmental research and public health 2022, 19, 12272. [Google Scholar] [CrossRef] [PubMed]
- Ramanujam, E.; Perumal, T.; Padmavathi, S.J.I.S.J. Human activity recognition with smartphone and wearable sensors using deep learning techniques: A review. IEEE Sensors Journal 2021, 21, 13029–13040. [Google Scholar] [CrossRef]
- Guo, Y.; et al. “Deep learning for human activity recognition: A resource efficient implementation on low-power devices. ” IEEE Internet of Things Journal 2020, 7, 5246–5259. [Google Scholar]
Figure 1.
Missing Data Heatmap.
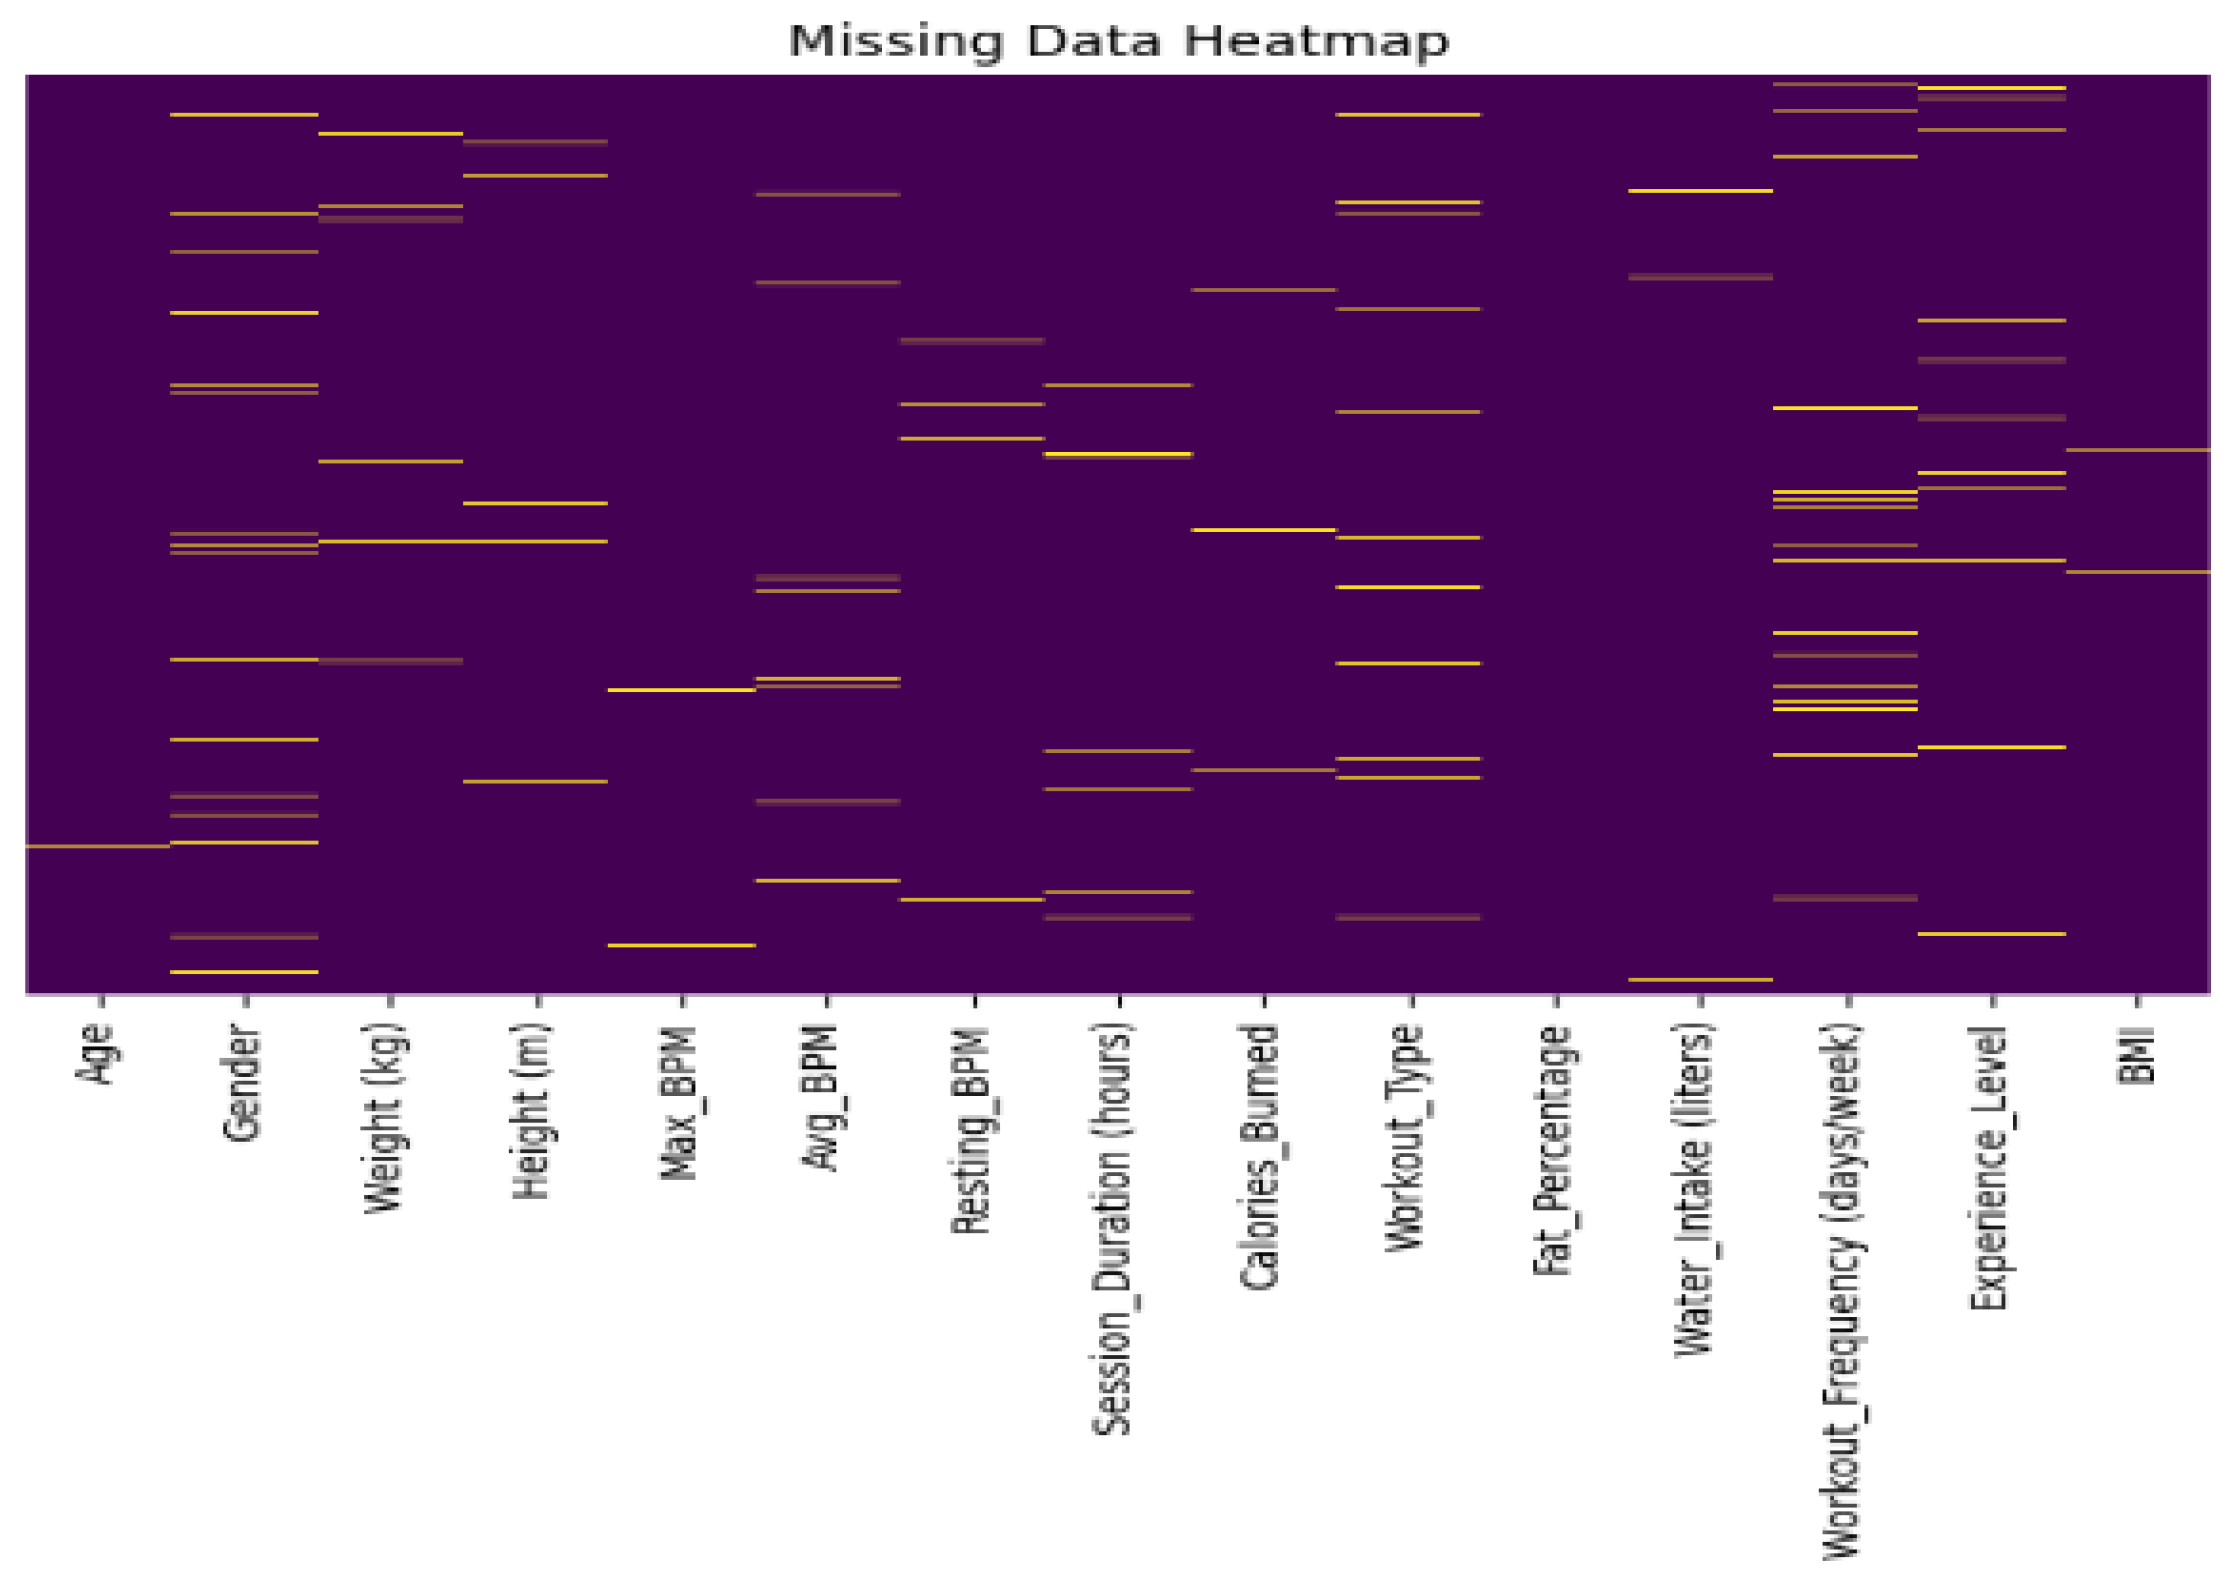
Figure 2.
Descriptive statistical analysis of variables.
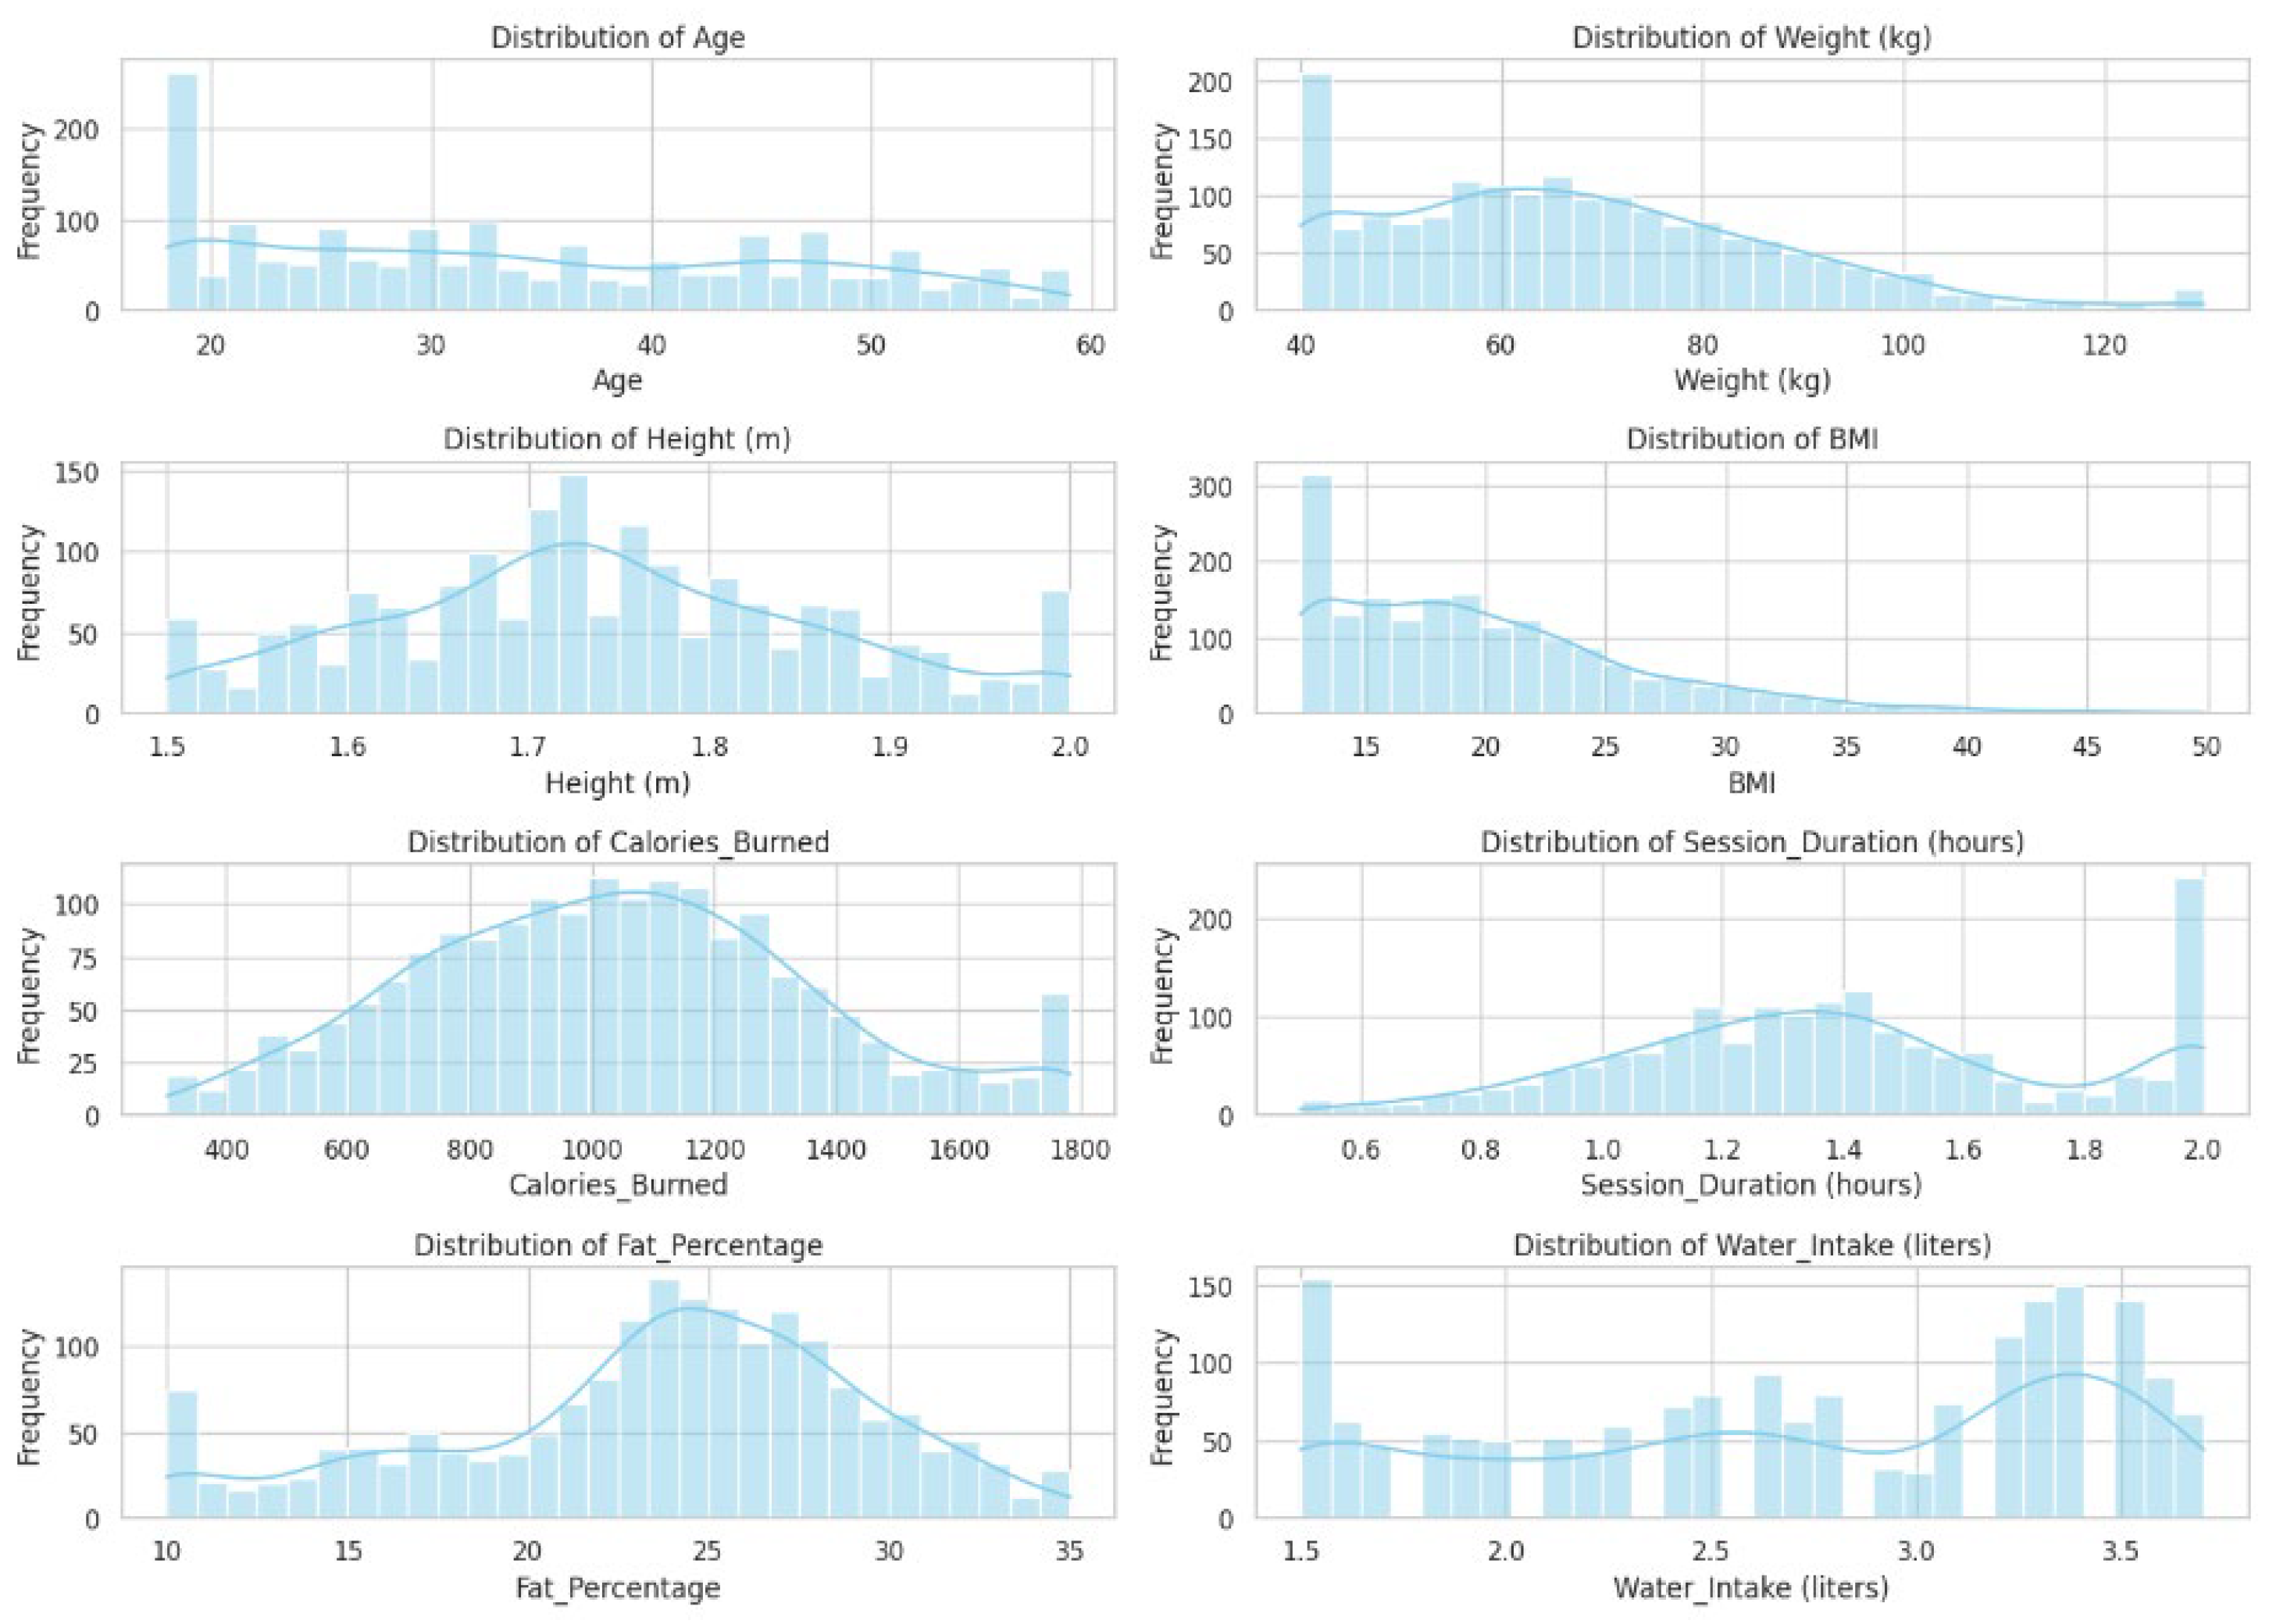
Figure 3.
Correlation Matrix of Numerical Features.
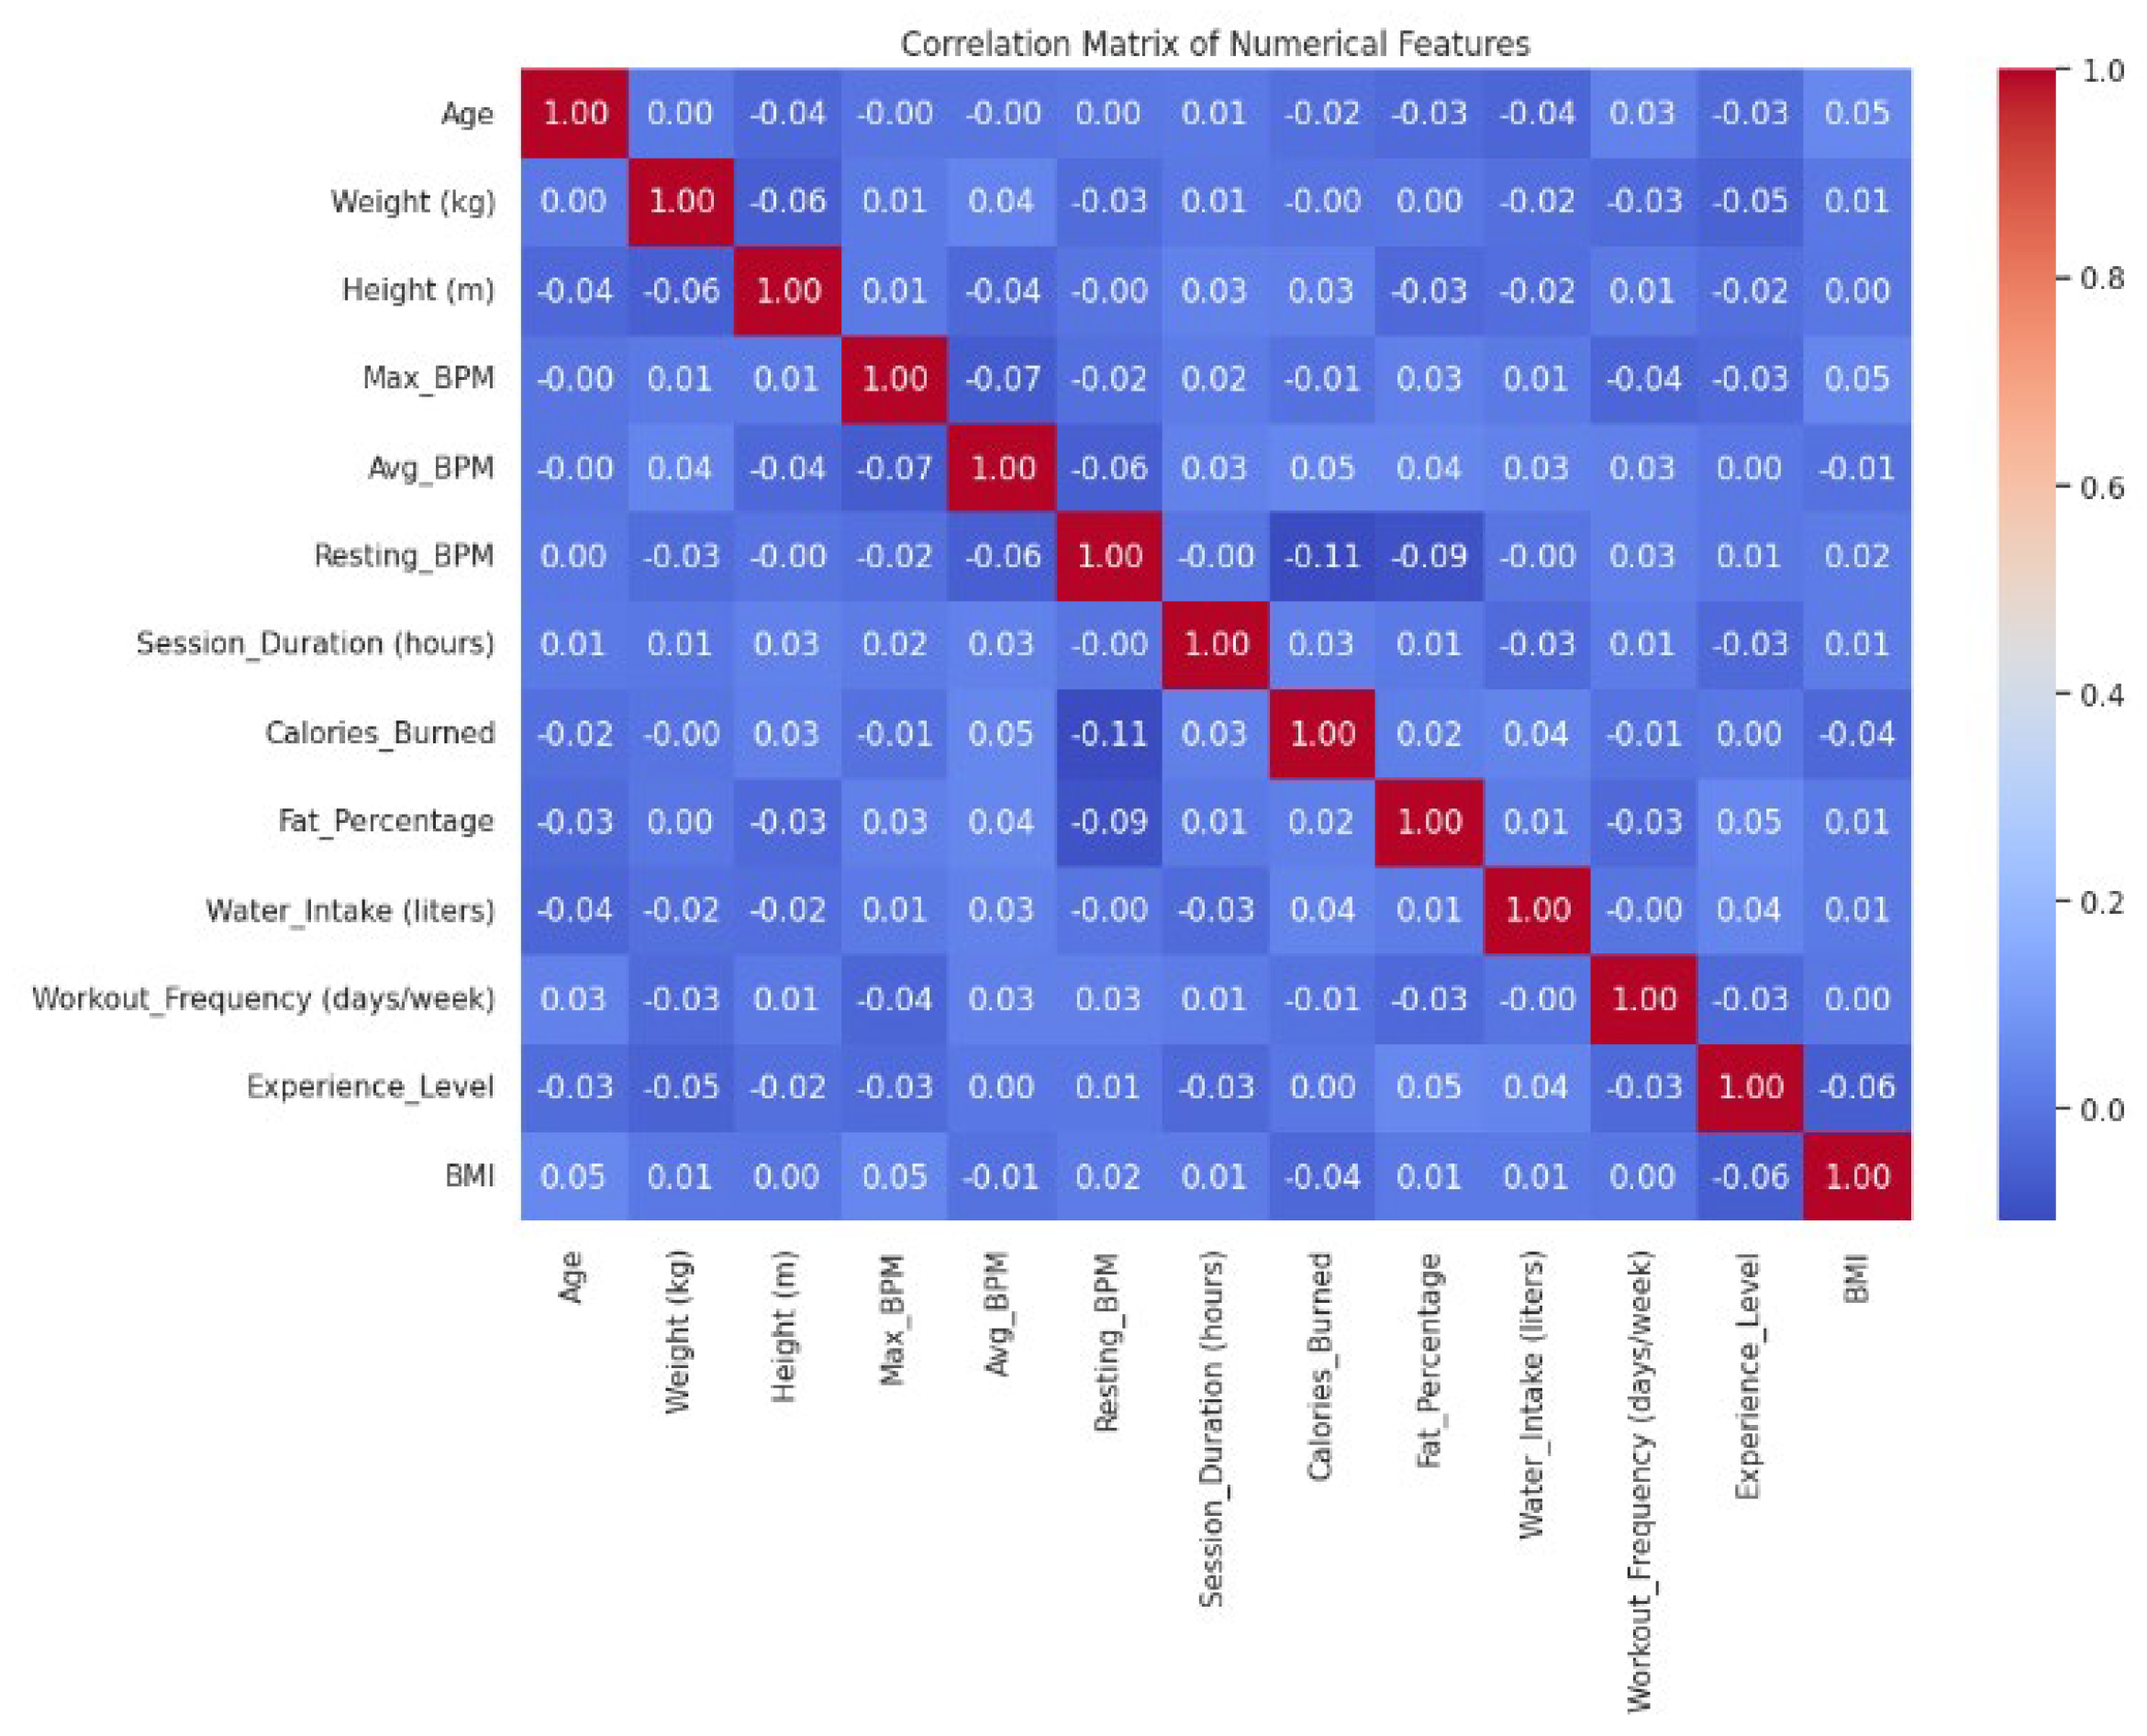
Figure 4.
Countplot of Gender and Workout_Type.
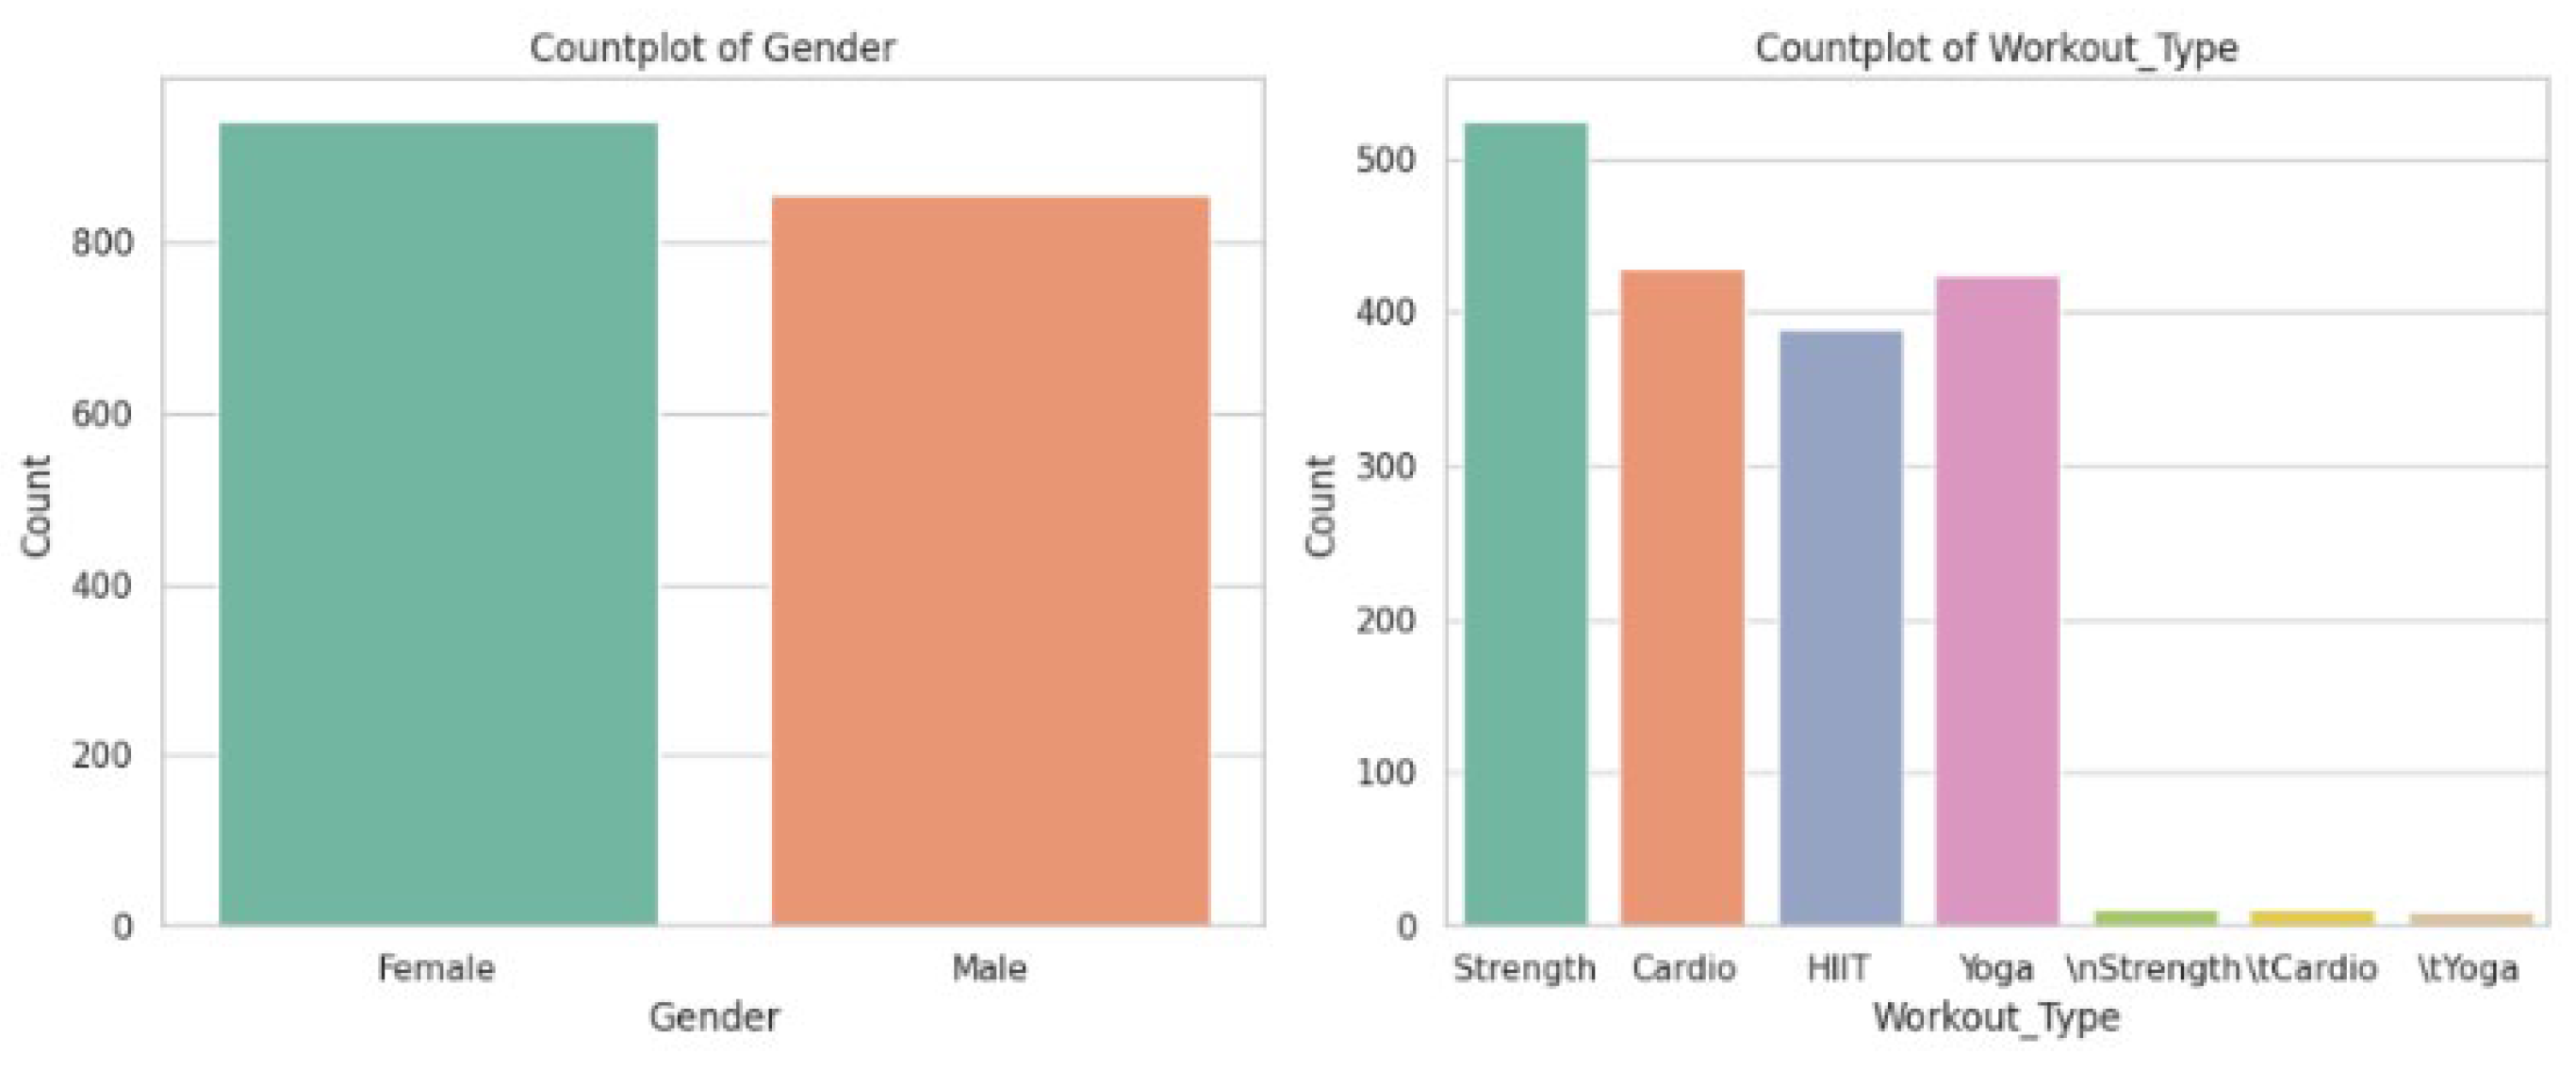
Figure 5.
Calories Burned vs. Session Duration.
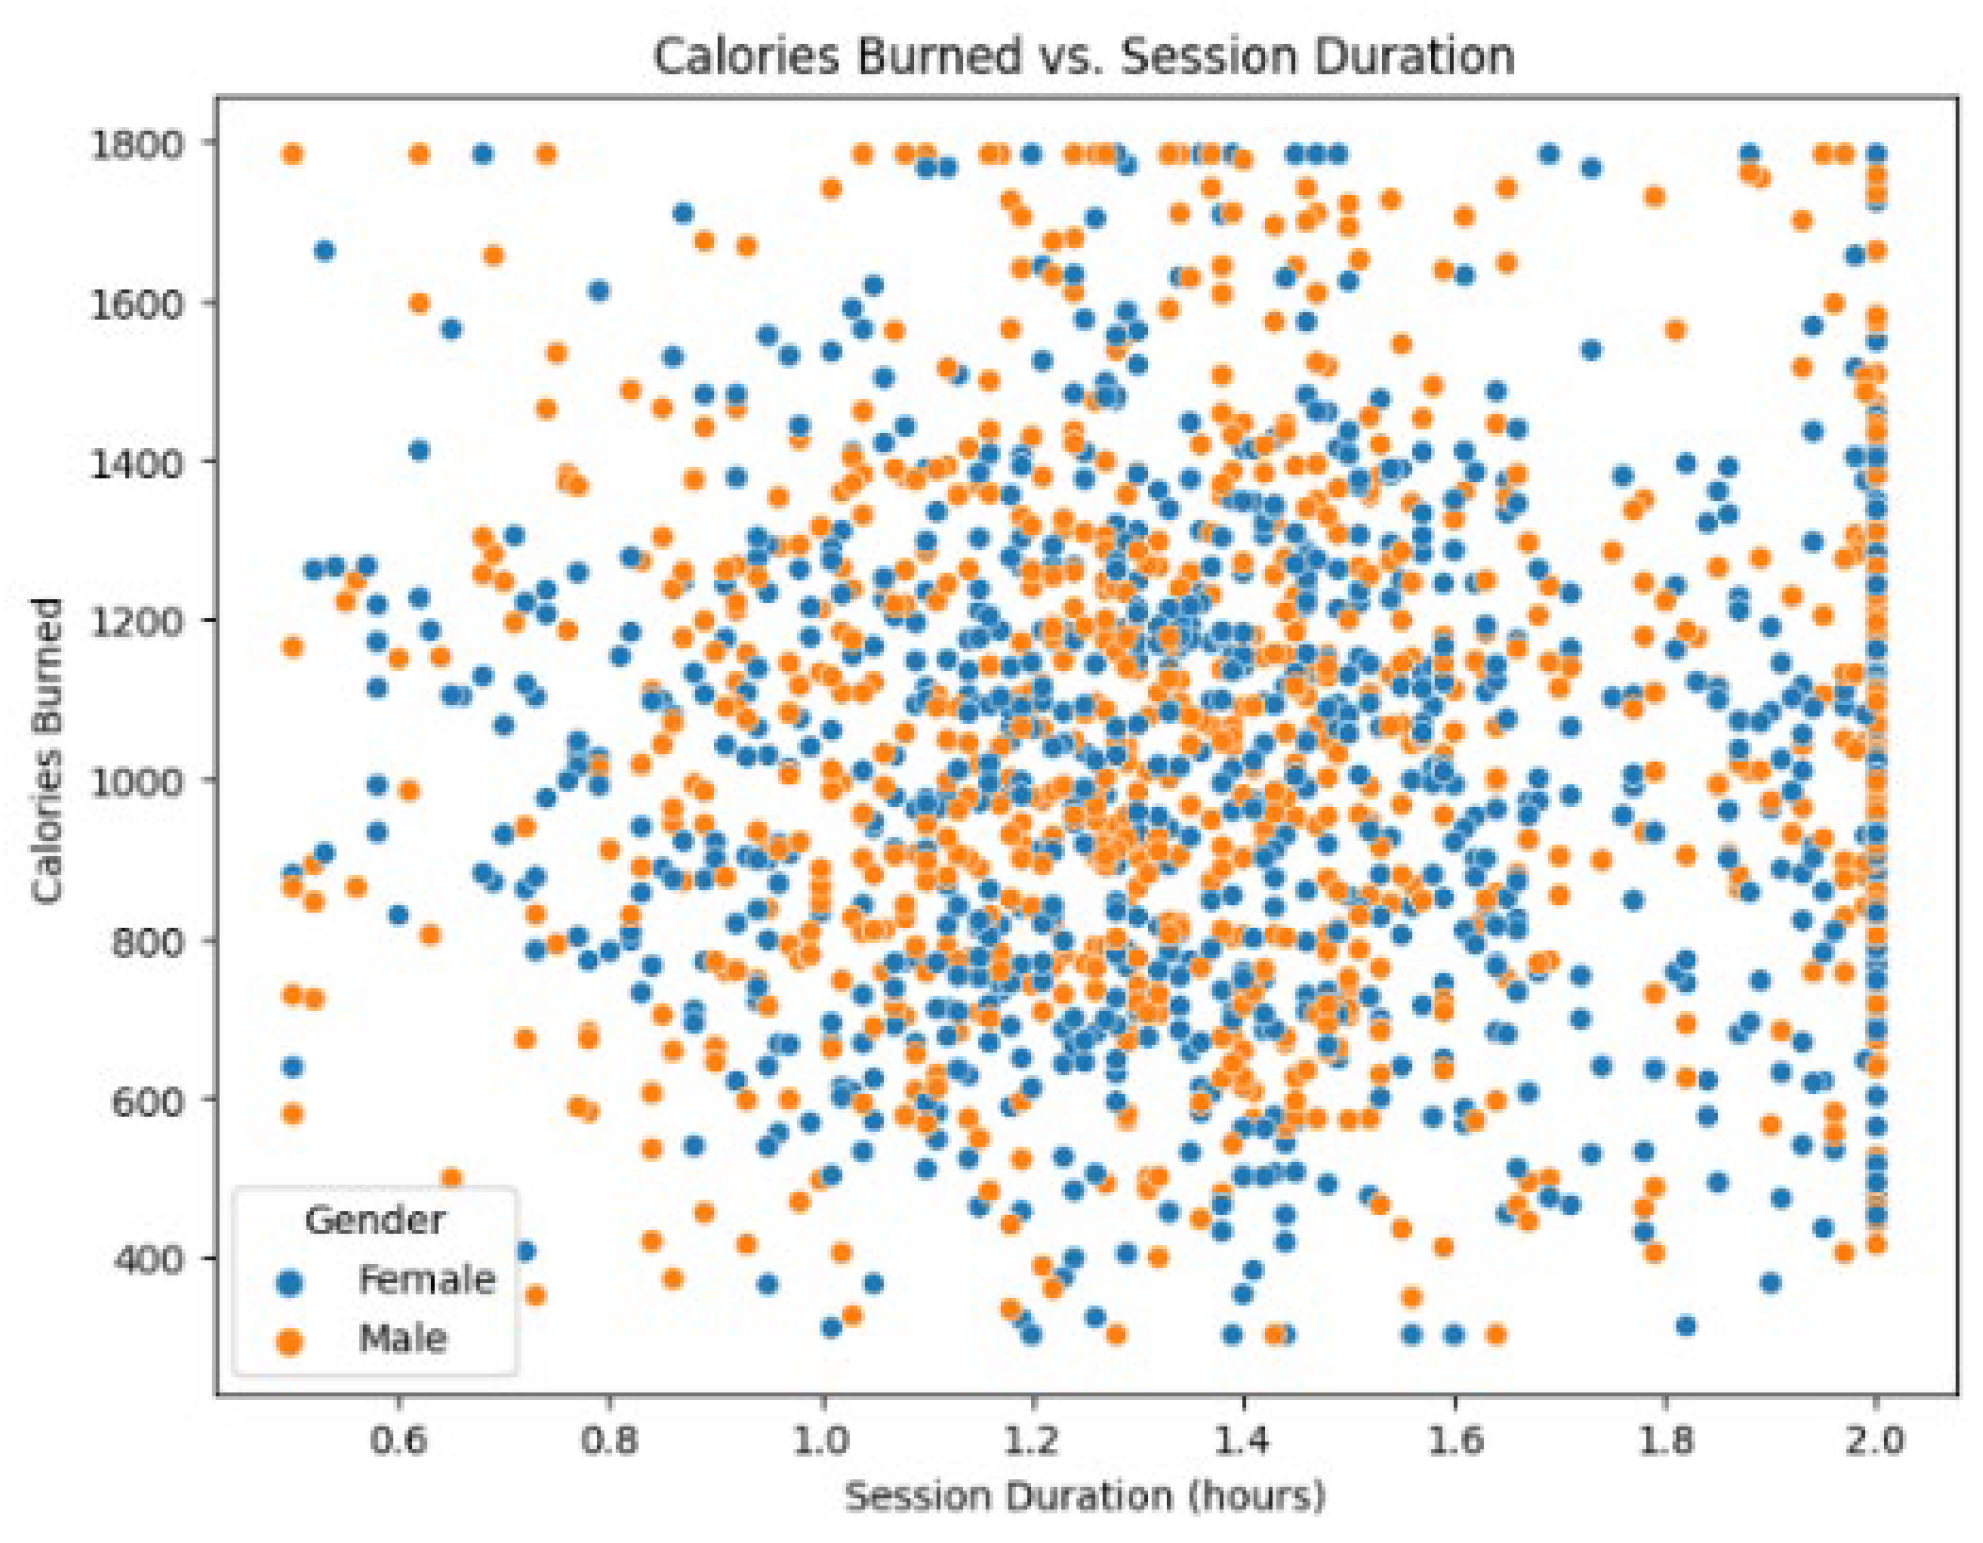
Figure 6.
Actual vs Predicted Calories Burned.
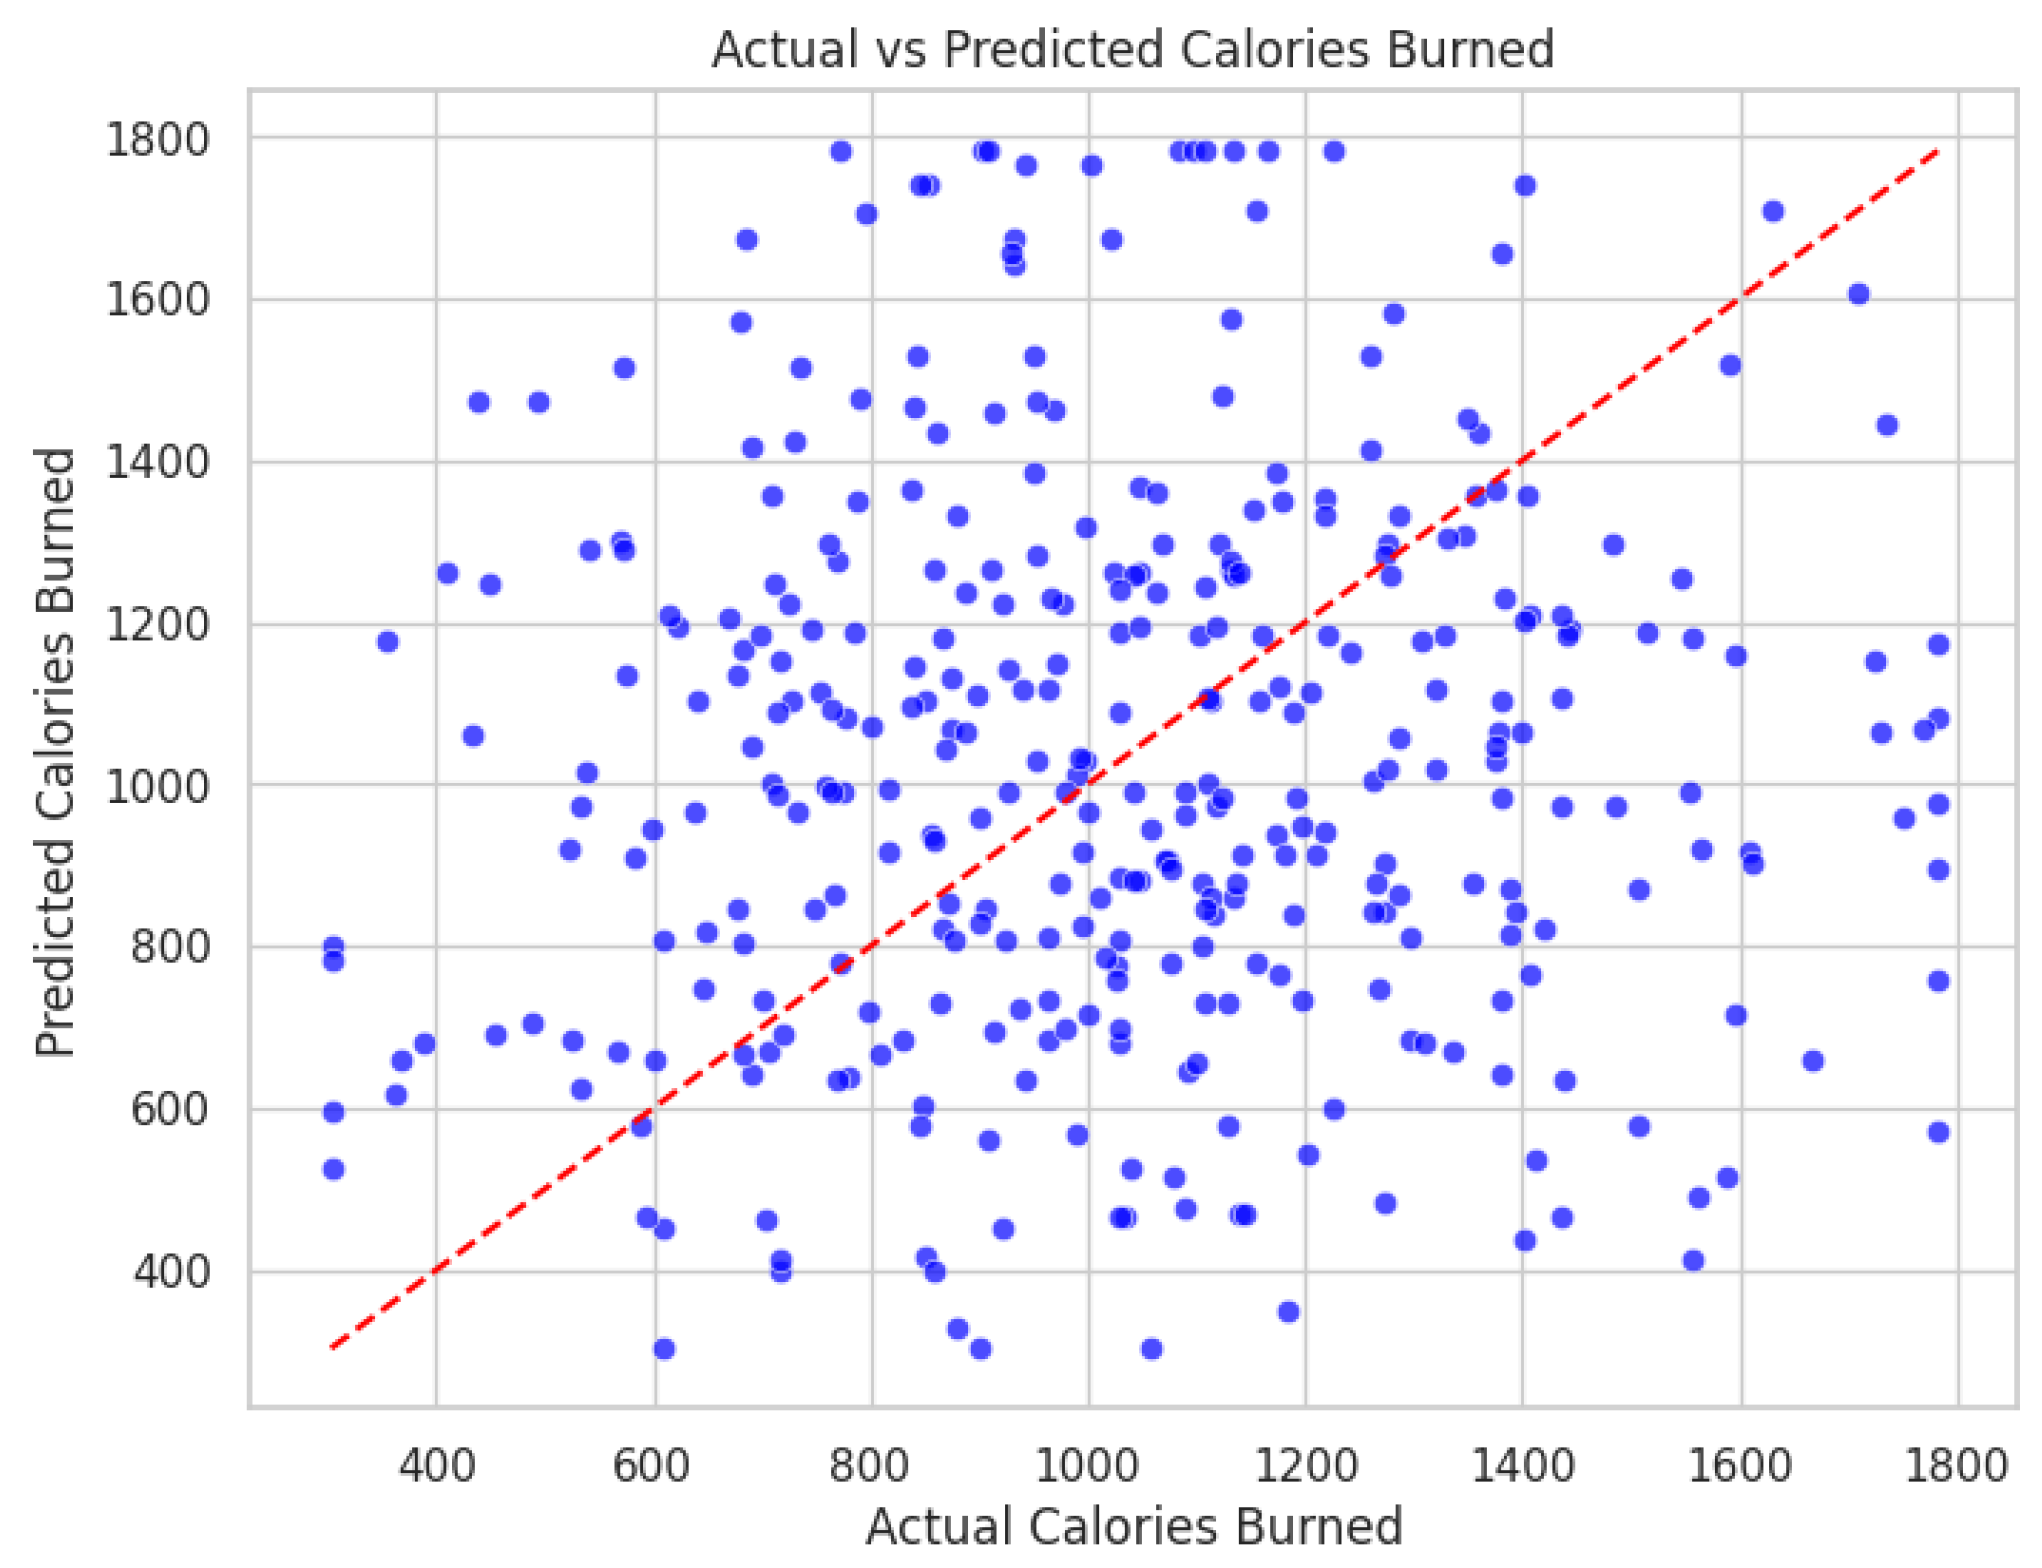
Figure 7.
Feature Importance in Random Forest Model.
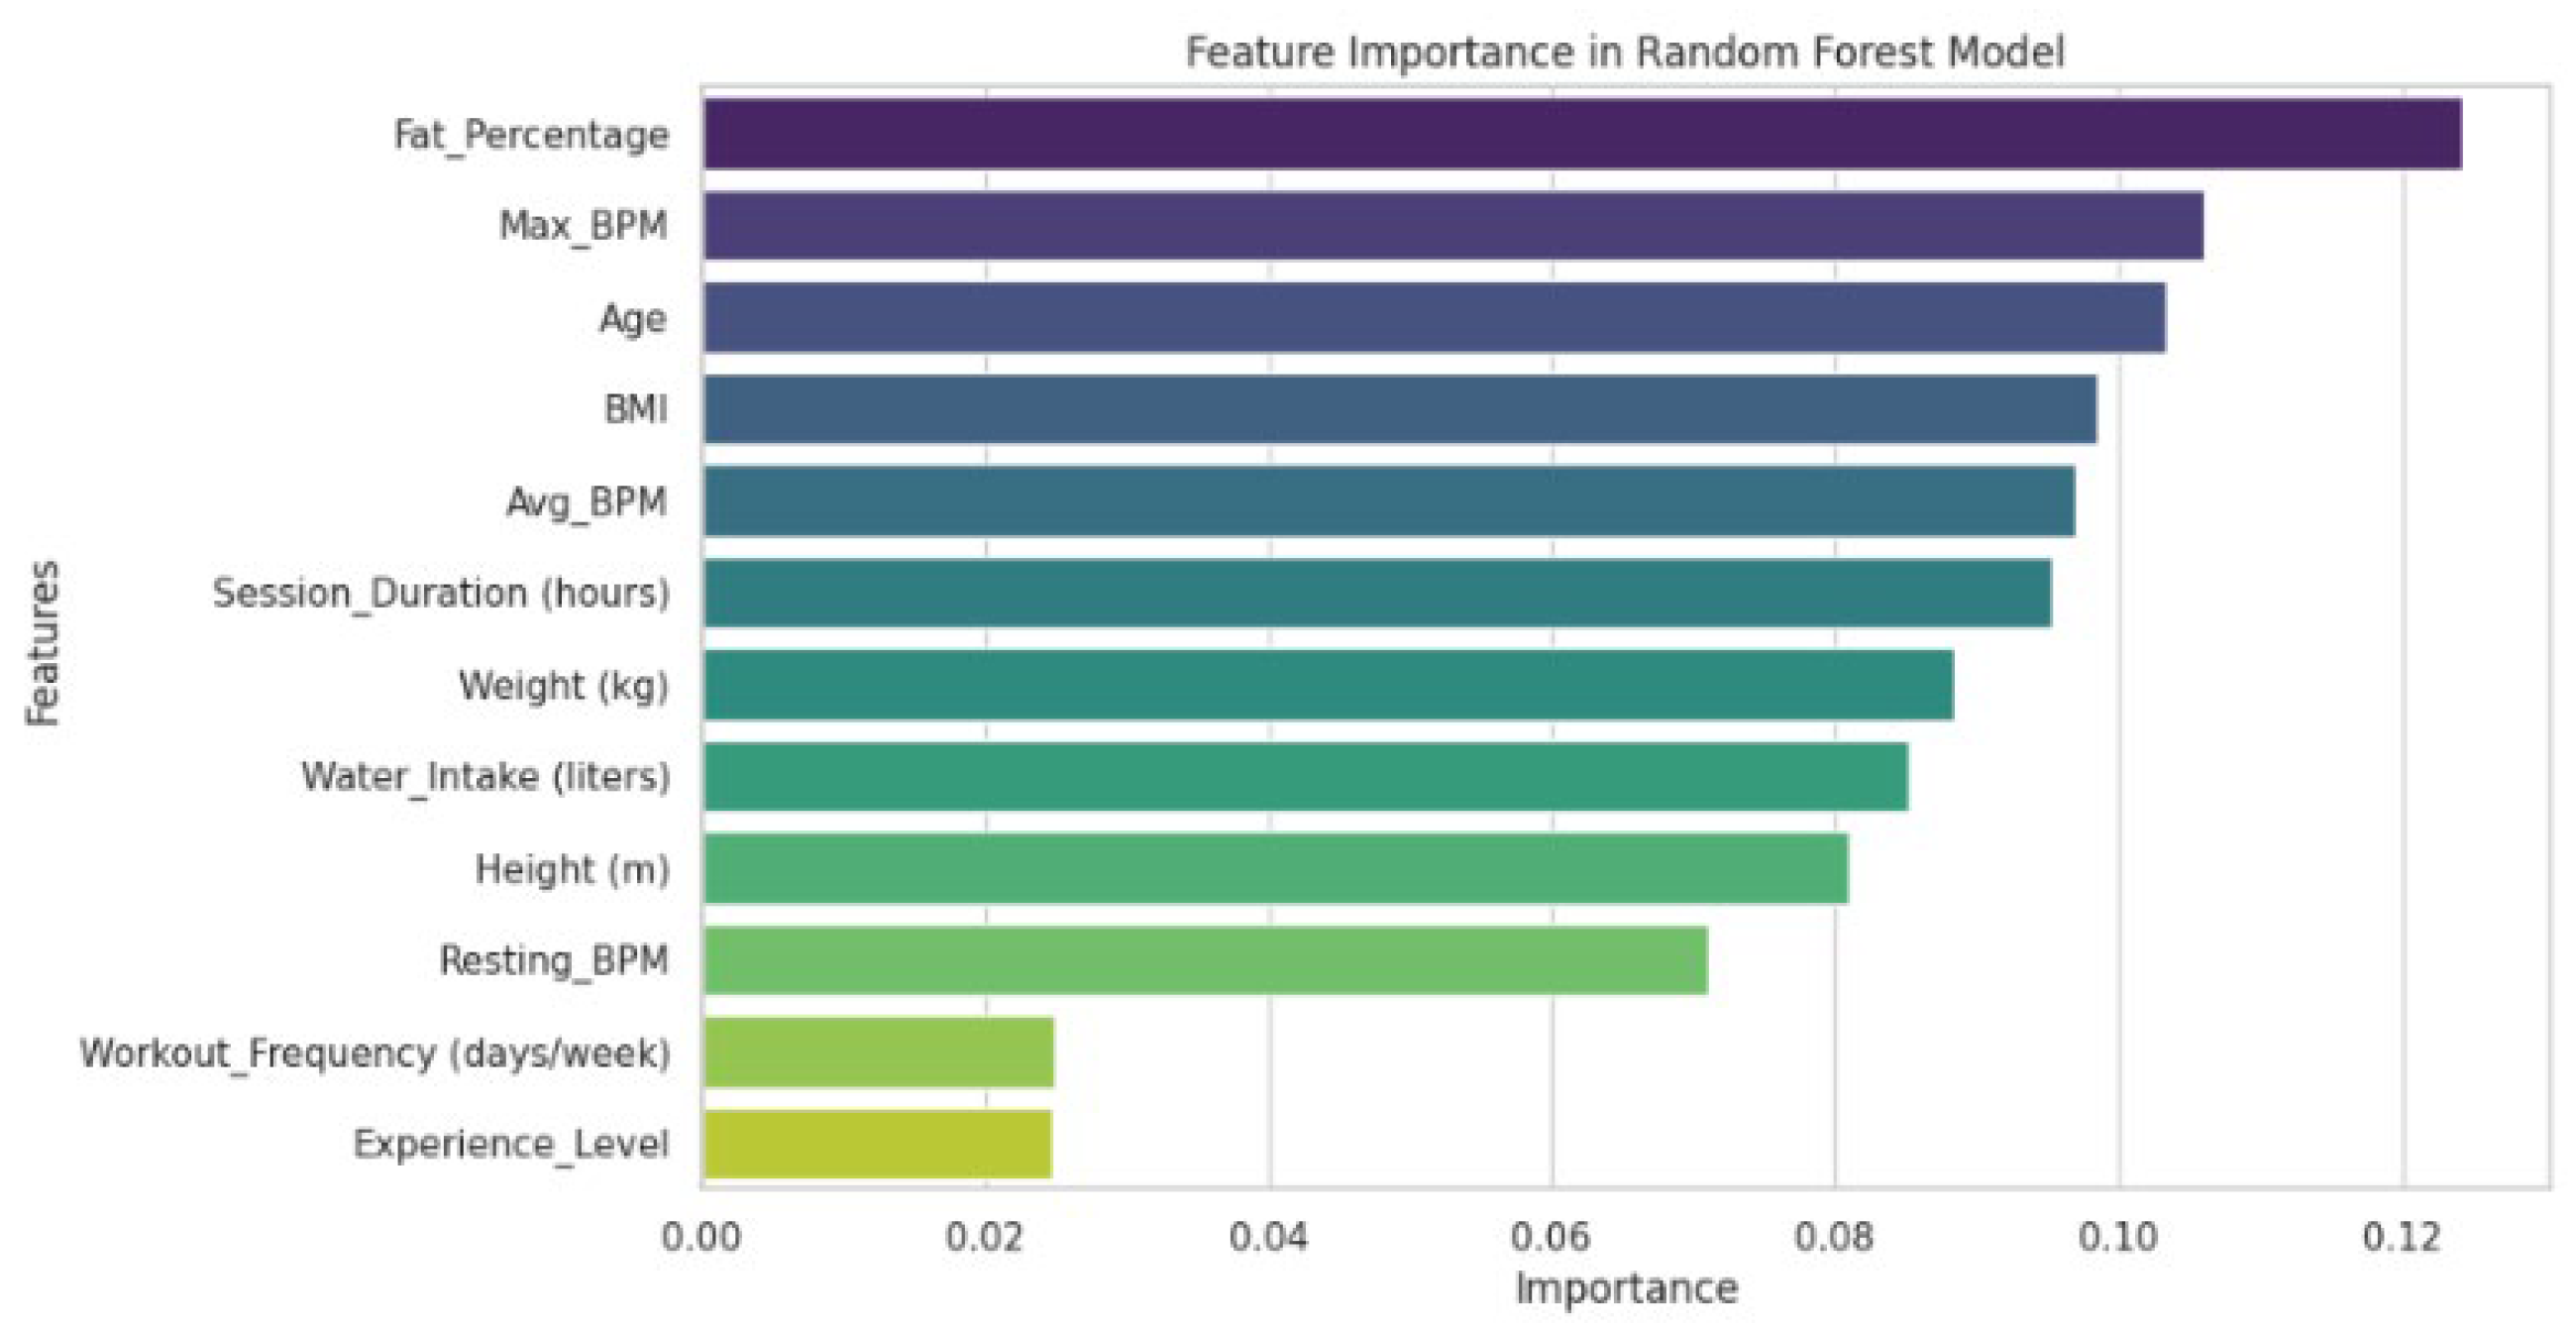

Table 1.
Comparison of results of each model.
| Model | MAE | RMSE | R² | Time |
| Random Forest | 156.42 | 198.73 | 0.857 | 2.34 |
| Decision Tree | 187.65 | 235.91 | 0.812 | 1.58 |
| SVM | 172.83 | 215.46 | 0.834 | 3.67 |
| Naive Bayes | 195.24 | 248.35 | 0.795 | 1.12 |
Disclaimer/Publisher’s Note: The statements, opinions and data contained in all publications are solely those of the individual author(s) and contributor(s) and not of MDPI and/or the editor(s). MDPI and/or the editor(s) disclaim responsibility for any injury to people or property resulting from any ideas, methods, instructions or products referred to in the content. |
© 2025 by the authors. Licensee MDPI, Basel, Switzerland. This article is an open access article distributed under the terms and conditions of the Creative Commons Attribution (CC BY) license (http://creativecommons.org/licenses/by/4.0/).
Copyright: This open access article is published under a Creative Commons CC BY 4.0 license, which permit the free download, distribution, and reuse, provided that the author and preprint are cited in any reuse.


