
Submitted:
12 December 2024
Posted:
13 December 2024
You are already at the latest version
Abstract
In this study, an action recognition system was developed to identify fundamental basketball movements using a single Inertial Measurement Unit (IMU) sensor embedded in a wearable vest. The study aims to enhance basketball training by providing a high-performance, low-cost solution that minimizes discomfort for athletes. Data were collected from 21 collegiate basketball players, and movements such as dribbling, passing, shooting, lay-ups, and idle stance were recorded. The collected IMU data underwent preprocessing and feature extraction, followed by the application of machine learning algorithms including KNN, Decision Tree, Random Forest, AdaBoost, and XGBoost. Among these, the XGBoost algorithm with a window size of 250 and a 75% overlap yielded the highest accuracy of 96.6%. The system demonstrated superior performance compared to other single-sensor systems, achieving an overall classification accuracy of 96.9%. This research contributes to the field by presenting a new dataset of basketball movements, comparing the effectiveness of various feature extraction and machine learning methods, and offering a scalable, efficient, and accurate action recognition system for basketball.
Keywords:
action recognition
; basketball training
; inertial measurement unit (imu)
; machine learning
; wearable sensors
1. Introduction
The practice of sports clearly shows that the success of an individual athlete or a team is highly dependent on how well the fundamental techniques of the sport are applied and mastered [1]. Proper application of technical skills allows the athlete to use movements more efficiently and economically. This can contribute to an increase in athletic performance, reduce the risk of injuries, and enhance the benefits gained from training, ultimately contributing to long-term success in sports. The technique in basketball represents all the specific movements performed by an athlete while playing the game, in accordance with the rules and tasks set by the team during a competition [2]. In basketball, dribbling, passing, shooting, and rebounding are the fundamental technical skills that enable players to play the game effectively and are often the focus of training. These movements are fundamental to both offensive and defensive play. Therefore, technical skills in basketball are considered one of the prerequisites for success [3].
Major sports events, like the Olympic Games and the NBA, significantly impact the popularity of basketball[4]. In their study, Kennedy and Dimick reported that 48% of college basketball players expect to become professional athletes[5]. For this reason, just like in all sports and different leagues, the goal in college basketball is to improve athlete performance. This can be achieved by combining the coach's knowledge with data-driven scientific strategies, making training more personalized [6].
To improve athlete performance in basketball, wearable sensors can analyze and identify athletes' movements, helping them master basketball skills and enhance their game performance [7,8]. Action recognition technologies using Inertial Measurement Unit (IMU) sensors significantly increase the performance of basketball players by providing quantitative analysis and guidance for shooting techniques [9]. Additionally, wearable sensors can monitor the athlete's body posture and movement trajectory in real-time, transmitting data to a mobile image processing system for analysis and processing [10]. IMUs assist in workload assessment and performance evaluation by offering precise data collection on body movements [11]. These technologies enable the accurate recognition of various basketball movements, such as shooting stances and gestures, contributing to personalized training plans and improving training effectiveness [12,13]. Moreover, wearable sensors like IMUs can identify individuals based on unique movement patterns, such as walking, showcasing their potential for personalized feedback and skill development in sports like basketball [14]. Basketball players can benefit from IMU-based action recognition technologies by receiving detailed feedback on their shooting techniques, which can lead to enhanced skill development and overall performance on the court.
The IMU sensors are utilized in basketball for activity recognition, capturing dynamic movements such as dribbling, shooting, and passing [15,16,17,18,19,20,9,21,22]. IMUs are sophisticated microelectromechanical (MEMS) sensors that integrate accelerometers, gyroscopes, and sometimes magnetometers to measure motion and orientation in three-dimensional space. IMU sensors provide very useful and critical information in the field of sports, as they can be used to detect acceleration, speed and angular position changes, as well as to determine the forces generated/applied by providing mass information. This capability is essential for performance analysis, training optimization, and injury prevention, as it allows coaches to provide tailored feedback based on players' movements. However, accurately classifying basketball activities poses challenges due to the overlap of movements and variability in playing styles, particularly when considering cultural differences, as highlighted by the Hang-Time HAR dataset, which includes data from 24 players across the USA and Germany during both structured drills and unstructured games [21]. This dataset is significant for evaluating machine learning algorithms, particularly deep learning architectures, as it enables researchers to assess generalization across different players using techniques like leave-one-subject-out (LOSO) cross-validation. The research aims to establish the Hang-Time HAR dataset as a benchmark for the human activity recognition community, paving the way for future studies on preprocessing algorithms and neural network architectures tailored for sports applications, especially in complex scenarios where activities overlap and vary in pace. IMU-based action recognition technology can recognize shooting movements, such as set shots, layups, jump shots, and tipping, with an accuracy of 98.0% and an overall recognition accuracy of 98.5% [9]. Additionally, IMU sensors can detect fundamental basketball movements like standing, walking, running, jumping, dribbling, set shots, and jump shots with an impressive accuracy of 98.9% by employing neural network algorithms [23]. Furthermore, a new method based on image feature extraction and machine learning can accurately classify and recognize basketball shooting movements, providing a scientific foundation for the development of modern basketball training [12]. These advancements in IMU based technologies offer valuable insights for coaches and players, enhancing training, performance, skill development, and injury prevention in basketball. In various studies, some have used a single sensor [15,16,22], while others have employed multiple sensors [9,17,18,19,20]. These studies show that wearable devices are typically worn on the arms, body, or legs, focusing mainly on movements such as shooting, passing, dribbling, and blocking. Hu et al. placed reflective markers on the bony landmarks of 10 college players and 10 novice basketball players according to the Full Body Plug-in Gait Model. They examined four basketball skills: jump shot, lay-up, passing the ball, and dribbling the ball. For classification, they used Dynamic Time Warping (DTW) and a basketball activity classification model based on body kinematic measurements, achieving accuracy, recall, and specificity values of 98.4%, 98.3%, and 99.4%, respectively [17]. Asmara et al. used a smartwatch device as a wearable to collect information on passing, dribbling, and shooting activities among basketball players. They found that the action recognition accuracy was 81.62% [19]. Liu and Zhang collected data from 100 basketball players in four postures: shooting, passing, dribbling, and catching [20]. In this study, two IMU sensors were worn by the athletes to gather data. They extracted multidimensional action posture features from both time and frequency domains. Deep Q-Learning with Recurrent Neural Networks (DRQN) was used for posture recognition, resulting in an average accuracy of 99.3% for posture recognition. Eggert et al. developed an IMU-based algorithm to recognize jump shots in random basketball action sequences in 10 male basketball players [18]. The cross-validation for excluding one subject from the network showed values above 0.970 for recall and precision, with an area under the receiver operating characteristic curve of 0.995. Hölzemann and Van Laerhoven aimed to track actions like dribbling, shooting, blocking, or passing during training and games using an IMU sensor in a smartwatch worn by three basketball players [15]. The highest overall accuracy performance of 87.5% was achieved with the Random Forest algorithm. They obtained 95% accuracy for specific actions like shooting, while for some types of dribbling, the recall was only 44%. Jiang and Zhang designed a hardware module to create a classification structure for basketball postures and collect data using inertial sensors [22]. Their study showed that a wearable device based on an improved algorithm achieved the highest accuracy of 99.4% in recognizing basketball sport postures. Ross et al. used clustering-type machine learning algorithms, inputting segment linear accelerations and angular velocities to classify basketball players as elite or novice [16]. They included 542 athletes in the study for model validation and asked them to perform 21 unique movements to test their range of action, stability, strength, and balance. They assessed seven dynamic movements: drop jump, bird-dog, hop-down, lunge, step-down, L-hop, and T-balance for analysis. However, using metrics obtained through IMUs and Linear Discriminant Analysis (LDA), they accurately classified 75.1% to 84.7% of the athletes as elite or novice based on their movement. In another study using multiple sensors, a IMU sensor-based bracelet was used to collect shooting action data from 15 amateur and 5 elite basketball players, focusing on fixed shots, layups, jump shots, and tip-ins [9]. They achieved an accuracy of 98.0% in recognizing shooting actions across four categories, with an overall recognition accuracy of 98.5% for 18 different shooting movements.
In addition to the benefits provided, action recognition technologies using IMUs in basketball face various challenges. These include the need for effective hardware-software collaboration [24], the requirement for accurate posture definition and gesture recognition [12], reliance on the coach's experience with traditional training methods [23], potential drift in speed and position vectors due to timing integration issues with IMU data [25], and the necessity for advanced spatial structure and temporal feature expression in skeletal sequences for better recognition performance [26]. These topics emphasize the importance of developing IMU-based technologies to improve gesture recognition, posture definition, and overall training effectiveness in basketball.
Research shows that as the number of sensors increases, the performance metrics of machine learning improve; however, increasing the number of sensors also raises costs and processing intensity, while comfort may decrease. In basketball, the chest or back is considered the most suitable body areas for using IMUs due to their advantages in predicting ground reaction forces during vertical jumps [27]. Placing IMUs on the chest offers benefits for various applications, such as activity recognition, posture analysis, and cardiopulmonary parameter estimation [28]. In contrast, using IMUs on the hands, arms, or legs can create limitations. For instance, IMUs placed on the sacrum have shown better performance in predicting ground reaction forces during jumps compared to those on the back and chest [27]. Additionally, IMU acceleration in lower extremities, such as the tibia and femur, can effectively measure peak acceleration during running, providing valuable insights into loading rates and impact peaks in runners [29]. Therefore, while chest and back placements are excellent for IMUs in basketball, other body regions may not offer the same level of accuracy and applicability.
This paper aims to develop a system capable of recognizing fundamental basketball movements by placing an IMU sensor on a vest-type wearable that will not cause discomfort while playing basketball. The intended scientific contributions of this paper include:
- Presenting a dataset that includes previously undefined movements in the field of basketball.
- Comparing high-performance feature extraction and machine learning methods aimed at action recognition in basketball.
- Offering a high-performance, low-cost action recognition system for the basketball field with fewer sensors.
- Integration of explainable artificial intelligence (XAI) to action recognition model.
The following sections will present the materials used, methods, findings, discussion, and conclusion in order.
2. Materials and Methods
In this paper, an action recognition system for basketball movements was developed using machine learning. To achieve this, 3-axis accelerometers and 3-axis gyroscope sensors were used. Basketball players wearing a vest equipped with an IMU were involved in the data collection and action labeling process while performing relevant basketball skills. The materials used for data collection and labeling are presented in detail. Then, the IMU signals undergo data preprocessing and feature extraction to prepare the dataset. The dataset is then subjected to machine learning, and the model with the highest performance is selected through performance evaluation before being deployed for use. The data collected from these sensors were processed using a specific classification algorithm to recognize certain basketball movements. The workflow for selecting the classification model is shown in Figure 1. After collecting and labeling the data, preprocessing and feature extraction steps were performed. Then, model training and evaluation were carried out. This process continues until the sliding window optimization and hyperparameter optimization for the chosen algorithm are complete. These optimization processes are done using grid search, which involves testing a certain number of parameters and selecting the one that gives the best result. On the optimized model, explainable artificial intelligence was applied to understand how the model works and to enable more detailed studies in the future. At this stage, feature importance and Shapley Additive Explanations (SHAP) were used.
2.1. Data Collection and Labeling
In the data collection process, the wearable device shown in Figure 2 is placed on top of the vest. The wearable device consists of a microcontroller (Deneyap Development Board). This microcontroller board consists of 240MHz Dual Core Tensilica LX6 microprocessor, Bluetooth Low Energy, an IMU (LSM6DSM 3-Axis Gyroscope and 3-Axis Accelerometer), a charging unit, and a Li-Po battery (3.3V). This board is placed in a 3D printed cover and attached on a vest. Data collection and labeling were carried out using the data collection and labeling program shown in Figure 3. The flowchart of the program is presented in Figure 4. First, the graphical user interface (GUI) shown in Figure 3 is set up. Then, the computer’s Bluetooth module is activated. It scans for nearby Bluetooth devices and connects to the wearable IMU device that has been previously paired with the program. If the device is not powered on or cannot be found during the scan, it will try to search again. Once the connection is established, the data received from the device is time stamped and parsed. Depending on the user's request, the data can be used for labeling or predicting actions based on incoming data. The incoming data is displayed in real time on the drawing screen for each axis. In labeling mode, the action entered manually by the user is assigned as a file label. In prediction mode, after the trained model is introduced to the program, the action corresponding to the incoming data is predicted automatically. The program can be terminated at any time if the user wishes to stop it.
Twenty-one basketball players (12 male and 9 female) aged between 19 and 24 years voluntarily participated in the study. The criteria for participation included having no medical conditions that would prevent completing the tests, not performing any high-intensity exercise before the study, being right-handed, and being a member of the team. The research protocol followed the Declaration of Helsinki and was approved by the Uşak University Institutional Ethics Committee (decision no: 376-376-10, dated 02.05.2024). The players were clearly informed about the procedures to be applied. For each participant, personal information, height, and weight measurements were taken and recorded. Then, they were asked to perform basketball-related actions, including dribbling, chest passing, shooting, right-handed pivoting, and standing still. The standing still action involved the player wearing a sensor and remaining stationary. Examples of movements captured during data collection are shown in Figure 5. IMU used for data collection operated at a sampling rate of 250 Hz, and the data for each movement was recorded for a duration of 30 seconds.
2.2. Data Preprocessing and Feature Extraction
After data collection, preprocessing and feature extraction are carried out at this stage. During the movements of basketball players, data from a 3-axis accelerometer and a 3-axis gyroscope were collected using IMU sensors. A sliding window technique is applied to each axis and each sensor. The collected data were recorded for 30 seconds for each movement. Data readings that were inaccurate have been filtered, and normalization processes have been applied. Using the sliding window method on the raw data, features such as minimum, maximum, peak-to-peak, integral of simple squares, root mean square of squares, total of absolute differences, total of absolutes, skewness, and kurtosis have been extracted, as presented in Table 1.
2.3. Model Training and Test
The feature extraction process was carried out on a sample basis, not a subject basis. After feature extraction was performed from all subject data, the examples were combined to form a single data set. The overlap value in the sliding window technique directly changes the number of samples extracted. Increasing the overlap value causes an increase in the intersecting data on the time series and increases the number of samples. Since the technique used in the study focuses on selecting the optimum sliding window parameters, firstly the method selection was performed with k-fold cross validation. Then, we used the Leave One Subject Out (LOSO) cross validation method to rigorously evaluate the generalizability of the proposed action recognition model.
2.3.1. K-Fold Cross Validation and Model Selection
The dataset has been divided into two parts: 75% for training and 25% for testing. For selecting the best model, learning models were evaluated on the training dataset using stratified 5-fold cross-validation. Test results were then applied separately to the test dataset after selecting the best model. The training data is divided into 5 equal parts while preserving the class distribution. Each part is used once as a test set, while the remaining four parts are used for training the model. After this process, the model with the best performance is selected. Finally, the selected model is tested on the test dataset, which helps to understand how well it performs on data it has never seen before. Classification models were created using algorithms including K-Nearest Neighbors (KNN), Decision Tree (DT), Random Forest (RF), Adaptive Boosting (AdaBoost), and Extreme Gradient Boosting (XGBoost). These models were trained to classify actions such as standing still, passing, shooting, dribbling, and jumping. The trained models were then tested on the test dataset, and their classification performance was evaluated.
The KNN is a simple machine learning algorithm used for classification and regression. It works by finding the 'k' closest data points (neighbors) to a given input and making predictions based on these neighbors. The key idea is that similar data points will be close to each other. The main hyperparameters for KNN are 'k', the number of neighbors to consider, and the distance metric, such as Euclidean or Manhattan distance, which determines how the distance between points is calculated. Choosing the right 'k' value and distance metric is crucial for the algorithm's performance [30,31].
The DT algorithm works by splitting data into smaller subsets based on certain conditions. It starts at the root node and divides the data at each node based on the feature that best separates the data into different classes or values. This process continues until the algorithm reaches a predefined depth or until it can’t split the data any further. Hyperparameters for decision trees include the maximum depth of the tree, the minimum number of samples required to split a node, and the minimum number of samples required to be at a leaf node. These hyperparameters help control the complexity of the tree and prevent overfitting. [32,33].
The RF algorithm is an ensemble learning method used for classification and regression tasks. It works by creating multiple decision trees during training and outputting the mode of the classes (classification) or the mean prediction (regression) of the individual trees. Key hyperparameters include the number of trees (n_estimators), the maximum depth of each tree (max_depth), and the number of features considered for splitting at each node (max_features). Adjusting these hyperparameters can help improve the model's performance and prevent overfitting [34,35].
The AdaBoost is a boosting algorithm that combines multiple weak learners to create a strong learner. It works by training a series of weak classifiers, typically decision trees, on different distributions of the training data. In each iteration, it adjusts the weights of incorrectly classified examples to focus on harder cases. The final model is a weighted sum of the individual weak learners. Key hyperparameters include the number of weak learners (n_estimators) and the learning rate, which controls the contribution of each weak learner [36,37].
The XGBoost is a powerful machine learning algorithm based on gradient boosting. It builds a series of decision trees, where each tree corrects the errors of the previous one. This method helps improve the accuracy of predictions. XGBoost uses several important hyperparameters to tune its performance, such as `learning_rate`, which controls how much each tree influences the final prediction, `n_estimators`, which determines the number of trees, and `max_depth`, which limits the depth of each tree to prevent overfitting. Properly tuning these hyperparameters is essential for getting the best results from the model [38].
2.3.2. Leave One Subject Out Cross Validation
To rigorously evaluate the generalizability of the proposed action recognition model, we employed the LOSO cross-validation method. LOSO provides a subject-independent estimate of model performance, which is essential for ensuring that the model can generalize well to new users[39]. The use of leave-one-subject-out (LOSO) cross-validation in sports action recognition offers several significant benefits, particularly in enhancing the reliability and generalizability of models. This method addresses the inherent correlations in data collected from the same subjects, which can lead to overestimation of model performance when traditional k-fold cross-validation is applied[40]. By ensuring that the training and testing datasets are independent, LOSO cross-validation provides a more accurate assessment of a model's ability to generalize to unseen data. This approach involves iteratively using data from one subject as the test set, while the data from all other subjects are used for training the model. LOSO ensures that the model is tested on unseen data from individuals not included in the training set, making it particularly suitable for scenarios where inter-subject variability can significantly influence performance. The LOSO process was implemented as follows:
- Data Partitioning: For each iteration, data from one subject was completely withheld from the training set and used exclusively for testing. This process was repeated for all 21 subjects in the dataset, ensuring each subject served as the test set exactly once.
- Model Training: The selected learning algorithm was trained on the data from the remaining 20 subjects, utilizing the optimized hyperparameters identified in prior experiments.
- Evaluation: The trained model was then applied to the withheld subject's data to generate predictions. Performance metrics such as accuracy, precision, recall, and F1-score were computed for each iteration.
- Aggregation: The final performance metrics were calculated by averaging the results across all iterations.
The inclusion of LOSO cross-validation provides a robust evaluation framework by simulating a real-world scenario where the model must perform on new, unseen individuals. This method inherently tests the model's ability to generalize across different participants, accounting for variations in movement styles, physical attributes, and sensor placement inconsistencies.
2.4. Action Classification Performance Metrics
The performance metrics of the models obtained for action classification are presented in Table 2. For comparison, the main metric used is accuracy value. Accuracy is a metric that measures how well the model performs on all test data. It is calculated as the ratio of correctly classified examples to the total number of examples. In other words, it shows how accurate the model's predictions are. Precision measures how many of the predictions made by the model for the positive class are actually true. In other words, it shows how accurate the model's positive predictions are. Recall measures the rate at which a model correctly identifies positive examples. In other words, it shows how many of the actual positives were predicted correctly. The F1-Score creates a balance between precision and recall. It is particularly useful for evaluating the overall performance of a model when there is class imbalance. The F1-Score is calculated as the harmonic mean of precision and recall.
2.5. Optimized Model Explantion
Explainable Artificial Intelligence (XAI) aims to enhance the transparency and interpretability of machine learning models by explaining how model works. In this context, this study employs feature importance and Shapley Additive Explanations (SHAP) methods. Feature importance helps identify which features significantly impact model predictions, aiding in model improvement and decision-making [41]. A common method is to measure how performance metrics change by permuting the features to determine their importance [42]. One of the most popular methods involves selecting accuracy as the performance metric and observing the decrease in accuracy within the model. This method ensures a clear understanding of feature importance by maximizing the contribution of the remaining features to the model's performance [43,44]. SHAP aims to explain the model by addressing the "black box" nature of machine learning models, assigning importance scores to features based on their contributions to model predictions [45]. SHAP values are calculated using game theory principles, where each feature's contribution is evaluated considering all possible combinations of features [46]. SHAP calculates the contribution of each feature by considering all possible combinations of features and their interactions. For a given prediction, SHAP values are computed by evaluating the change in the expected prediction when a feature is included versus when it is excluded. The basic steps of SHAP can be summarized as follows [47,48]:
- Model Training: A machine learning model is trained on the dataset, capturing the relationships between input features and the output.
- Shapley Value Calculation: For each prediction, SHAP computes Shapley values, which quantify the contribution of each feature by considering all possible combinations of features. The Shapley value ϕi for a feature i is calculated using the equation (1). In this equation N is the set of all features, S is a subset of features that does not include feature i, f(S) is the model’s prediction when only the features in subset S are included. f(S∪{i}) is the prediction when feature I is added to subset S.
- Feature Attribution: The calculated Shapley values are used to assign importance scores to each feature, indicating their influence on the model's output.
- Visualization: The results can be visualized using various plots to facilitate understanding of feature impacts on predictions
3. Results And Discussion
3.1. Model Selection with Sliding Window and Hyperparameter Optimization
In this study, we first tested the KNN, Decision Tree, Random Forest, AdaBoost, and XGBoost algorithms using various window sizes [100, 150, 200, 250] and hop overlap percentages [75, 50, 25, 0]. The accuracy values of the machine learning algorithms based on sliding window width and hop overlap percentages are presented in Table 3. According to the results, the highest performance was achieved using the XGBoost algorithm with a window size of 250 and a hop overlap percentage of 75%, yielding an accuracy value of 0.966. Examining Table 3, we can observe that as the window size increases and the overlap percentage rises, the accuracy value also increases.
After model selection and sliding window optimization, the chosen algorithm is XGBoost, with a sliding window width of 250 and an overlap value of 75%. For these parameters, the number of estimators for the XGBoost algorithm is [100, 150, 200], the learning rate is [0.1, 0.05, 0.01], the maximum depth is [3, 4, 5], the minimum child weight is [1, 2, 3], the subsample rate is [0.6, 0.7, 0.8], and the subsample ratio of columns is [0.6, 0.7, 0.8]. Within the scope of optimization of hyperparameters of XGBoost algorithm, the changes in accuracy values obtained for different parameter settings are summarized in Table 4 (Q1: First Quartile (25th percentile), Q3: Third Quartile (75th percentile)). The results obtained during the hyperparameter optimization of the XGBoost algorithm have allowed the identification of key hyperparameters that significantly impact the model's accuracy. Increasing the number of estimators from 100 to 200 led to a noticeable improvement in accuracy, with the median value rising from 0.941 to 0.955. Similarly, increasing the learning rate from 0.01 to 0.1 enhanced accuracy by 4.36%, raising it from 0.919 to 0.959. When the maximum depth parameter was increased from 3 to 5, the median accuracy also improved, reaching 0.955 from 0.941. The optimization of other parameters, such as the minimum child weight and subsample ratio, resulted in the best performance of the model with 200 estimators, a learning rate of 0.1, a maximum depth of 5, a minimum child weight of 2, and a subsample ratio of 0.6. With these settings, the model achieved an accuracy of 0.969, precision of 0.970, recall of 0.969, and an F1 score of 0.969.
To evaluate the generalizability of the proposed model, LOSO cross-validation was performed, where the data from one subject was entirely left out for testing while the model was trained on the remaining subjects. This process was repeated for all subjects, ensuring that each individual contributed to the testing phase. The results obtained using the optimized XGBoost algorithm with LOSO cross-validation demonstrated robust performance, achieving an accuracy of 0.878, an F1-score of 0.878, a precision of 0.879, and a recall of 0.841. These metrics confirm the model’s ability to generalize well across different participants, even in the presence of inter-subject variability. While the LOSO results are slightly lower compared to those achieved using stratified cross-validation, the slight decrease in performance is expected due to the more stringent nature of LOSO, which simulates real-world variability. This validation highlights the robustness of the model and its potential applicability in practical settings, where the system may encounter data from unseen individuals. Additionally, the consistency of the performance metrics across subjects underscores the reliability of the model for recognizing basketball movements using a single wearable IMU sensor.
The distribution of the outputs in the final dataset obtained after feature extraction according to the number of samples is presented in Figure 6. Accordingly, there are standing still (235 samples), passing (673 samples), shooting (296 samples), dribbling (733 samples) and jumping (515 samples) classes in a total of 2452 samples. When the entire data set was divided into 75% training and 25% test, 1839 samples were split into train and 613 samples were split into test. According to the confusion matrix analysis, which is shown in Figure 7, the model exhibited high accuracy and consistency, with a very low rate of misclassification. These results demonstrate that the XGBoost algorithm can be significantly optimized with the correct hyperparameter settings. In general, the most effective features in the obtained model are presented in Figure 8. Accordingly, the mean absolute of the gyroscope's z-axis (gyro_z_mav), simple square integral (SSI) of the y-axis accelerometer (acc_y_SSI) and the maximum of the accelerometer's x-axis (acc_x_max) are the features that have the most effect on the accuracy value.
In the explanation of the model's performance, SHAP values were calculated for each class. The SHAP values calculated for Standing still are presented in Figure 9. The three features with the highest impact for the standing still action are the mean absolute of the gyroscope's x-axis (gyro_x_mav), the mean absolute of the gyroscope's z-axis (gyro_z_mav), and the maximum of the accelerometer's x-axis (acc_x_max). Since a stationary posture is maintained during this movement, the gyroscope sensor data is more prominent.
The SHAP values calculated for passing class are presented in Figure 10. The three features with the highest impact are, respectively, the minimum value of the y-axis accelerometer (acc_y_min), the kurtosis value of the z-axis accelerometer (acc_z_kurtosis), and the simple square integral (SSI) of the z-axis accelerometer (acc_z_SSI). Five of the ten most important features in the classification of the Passing action were derived from the z-axis of the accelerometer. This indicates that the z-axis movements of the action have a high discriminative power. Although this action was performed while stationary, it involved some mobility, which is why the accelerometer features exhibited higher impact values.
The SHAP values calculated for shooting class are presented in Figure 11, with the top three features having the highest impact being the minimum value of the z-axis gyroscope (gyro_z_min), the maximum value of the z-axis gyroscope (gyro_z_max), and the mean absolute value of the z-axis gyroscope (gyro_z_mav), respectively. Due to the movement along the z-axis during the shooting action, the gyroscope values on the z-axis have shown high impact values. Since this action involves posture/orientation and aiming processes, it is observed that the gyroscope-related features have a higher impact.
The SHAP values calculated for dribbling class are presented in Figure 12. The three features with the highest impact are, respectively, the mean absolute value of the gyroscope on the z-axis (gyro_z_mav), the maximum value of the gyroscope on the x-axis (gyro_x_max), and the peak-to-peak value of the accelerometer on the z-axis (acc_z_ptp). Since dribbling involves movements in various directions, no axis can be said to be dominant during this action. Both gyroscope and accelerometer features show diversity.
The SHAP values calculated for jumping class are presented in Figure 13. The features with the highest impact for this action are, in order, the y-axis accelerometer simple square integral (acc_y_SSI), the z-axis gyroscope mean absolute value (gyro_z_mav), and the x-axis gyroscope minimum value (gyro_x_min). In the Jumping action, the dribbling and shooting actions are combined, so similar features show a high impact in this action as well. The z-axis gyroscope maximum value is among the top three features with the highest impact in Jumping, Dribbling, and Shooting actions. Similarly, the kurtosis value of the y-axis accelerometer is also among the top ten most effective features for these three actions. The x-axis accelerometer mean absolute value (acc_x_mav) and the kurtosis value of the z-axis accelerometer are common influential features for both Shooting and Jumping.
3.2. Comparison with Related Works
In this paper, the proposed method and current studies in the field of basketball are summarized in Table 5. Action recognition technologies that use IMUs in basketball face various challenges. These include the need for effective hardware-software collaboration [24], the requirement for accurate posture definition and gesture recognition [12], reliance on the coach's experience with traditional training methods [23], potential drift in speed and position vectors due to issues with time integration of IMU data [25], and the necessity for advanced spatial structures and temporal feature expressions in skeleton sequences to improve recognition performance [26]. These topics emphasize the importance of developing IMU-based technologies to enhance gesture recognition, posture definition, and overall training effectiveness in basketball. Studies show that as the number of sensors increases, the performance metrics of machine learning also improve. However, increasing the number of sensors can lead to higher costs and processing intensity, while comfort may decrease. In basketball, the chest or back are the most suitable body areas for using IMUs, particularly because of their advantages in predicting ground reaction forces during vertical jumps [27]. Placing IMUs on the chest offers benefits for various applications, such as activity recognition, posture analysis, and predicting cardiopulmonary parameters [28]. Back-mounted sensors can be integrated into clothing, making them less intrusive compared to limb sensors that may restrict movement [49]. Studies show that back-mounted IMUs can yield reliable data for various activities, including vertical jumps, with high correlation coefficients, indicating their effectiveness in performance analysis [50]. On the other hand, using IMUs on the hands, arms, or legs may present limitations. For instance, IMUs placed on the sacrum have shown better performance in predicting ground reaction forces during jumps compared to those on the back or chest [27]. Additionally, the acceleration of IMUs positioned on the lower extremities, like the tibia and femur, can effectively measure peak acceleration during running and provide valuable insights into loading rates and impact peaks for runners [29]. Therefore, while the chest and back placements are ideal for IMUs in basketball, other body regions may not offer the same level of accuracy and applicability. Hu et al. used Dynamic Time Warping (DTW) as a classifier based on body kinematic measurements for classifying basketball activities [17]. The accuracy, recall, and specificity achieved by this system are high, but it used 39 sensors in this study. Thirty-nine reflective markers were placed on bony landmarks according to the Full Body Plug-in Gait Model, and included movements like jump shots, passes, and dribbling. Asmara et al. used a smartwatch device for gathering information on passing, dribbling, and shooting activities in basketball [19]. However, the average action recognition accuracy was low, and only 2 sensors were used. In a study conducted by Liu and Zhang, athletes were equipped with 2 IMU sensors for data collection [20]. Features of multidimensional action posture were extracted from both time and frequency domains. In this study, Deep Q-Learning with Recurrent Neural Networks (DRQN) was used for posture recognition, demonstrating a high average accuracy for this task. However, this study also relied on multiple sensors. An IMU-based algorithm developed by Eggert et al. aimed to recognize jump shots in random sequences of basketball movements [18]. This approach showed high values for cross-validation, recall, and precision, with a high area under the curve for receiver operating characteristics. Yet again, this related study used four sensors placed on the foot, lower back, upper back, and shooting hand. Hölzemann and Van Laerhoven's study involved basketball players wearing a smartwatch with an IMU sensor on their wrist, aiming to track actions like dribbling, shooting, blocking, or passing during training and games [15]. They achieved a top overall accuracy of 87.5%. While high accuracy was attained for specific actions like shooting, lower recall was observed for some types of dribbling. In the module proposed by Jiang and Zhang, a wearable device based on an improved algorithm had the highest accuracy for posture recognition in basketball [22]. However, this study focused only on basketball stances. Ross et al. conducted a study with a single sensor and included 542 athletes [16]. Based on the action, metrics obtained using IMUs and Linear Discriminant Analysis (LDA) accurately classified 75.1% to 84.7% of athletes as elite or novice. Lian et al. included players using an IMU sensor-based wristband [9]. Although they achieved high accuracy in recognizing shooting movements across four categories, such as fixed shots, layups, jump shots, and free throws, this study focused solely on shooting skills and used 5 sensors. This study differs from existing research by designing a system that recognizes basketball actions with high performance, placing the IMU sensor in the less intrusive area of the lower back during games or training. With just one IMU sensor, it can classify a total of 5 different basketball movements with an impressive accuracy of 96.9%, surpassing other single-sensor systems.
4. Conclusions and Future Works
In this study, we developed a highly accurate movement recognition system using a single IMU sensor placed on a vest to recognize the movements of basketball players. The system successfully classified five different basic basketball movements with a high accuracy of 96.9%, thanks to the IMU sensor located on the back. This was achieved without causing discomfort during basketball training or matches, and it outperformed other single-sensor systems. This result shows that low-cost and user-friendly systems can also provide high performance in sports like basketball.
One of the key contributions of this study is the introduction of a new dataset to the existing literature and the comparative analysis of different movement recognition algorithms in the context of basketball. Additionally, developing a system that performs with high accuracy using fewer sensors serves as an important reference for future research. The system stands out as a significant tool for preparing individual training programs. Athletes can receive real-time feedback on their movements, which can help them improve their sports performance. At the same time, this system acts as a functional support tool for coaches, reducing their workload and minimizing the impact of subjective judgments. This enables athletes to be guided in a more scientific and data-driven manner.
In future studies, we aim to expand the system’s capabilities to recognize a broader range of basketball actions, including complex, multi-step sequences and movements under competitive conditions. Additionally, the inclusion of subjective feedback from athletes regarding comfort and usability will be prioritized, providing empirical support for system design refinements. Further research will explore alternative sensor placements and combinations with other physiological sensors such as EMG or heart rate monitors to enrich the dataset with biomechanical and physiological data, enhancing action recognition accuracy and providing holistic insights into athletic performance. Integrating deep learning techniques and training on larger datasets may also improve the system’s adaptability, allowing for personalized training analytics and more comprehensive real-time feedback for players and coaches.
Author Contributions
Conceptualization, A.Ç.S. and B.A.; methodology, A.Ç.S., H.S., E.B. and B.A; software, A.Ç.S., H.S. and E.B. validation, A.Ç.S., H.S., E.B. and B.A; investigation, A.Ç.S., H.S., E.B. and B.A; resources, A.Ç.S., H.S., E.B. and B.A; data curation, A.Ç.S., H.S., E.B. and B.A; writing—original draft preparation, A.Ç.S., H.S., E.B. and B.A; writing—review and editing, A.Ç.S., H.S., E.B. and B.A; visualization, A.Ç.S., H.S., E.B. and B.A; supervision, A.Ç.S.; project administration, A.Ç.S. and H.S.; funding acquisition, H.S. All authors have read and agreed to the published version of the manuscript
Funding
This research was funded by The Scientific and Technological Research Council of Turkey (TÜBİTAK), project application number: 1919B012305480.
Institutional Review Board Statement
The research protocol followed the Declaration of Helsinki and was approved by the Uşak University Institutional Ethics Committee (decision no: 376-376-10, dated 02.05.2024).
Data Availability Statement
The raw data supporting the conclusions of this article will be made available by the authors on request.
Acknowledgments
This study was conducted within the scope of the graduation thesis titled H.S. and E.B., under the supervision of A.Ç.S. Support was received from The Scientific and Technological Research Council of Turkey (TÜBİTAK) for this study within the scope of TÜBİTAK-2209 graduation project (project application number: 1919B012305480). The research protocol followed the Declaration of Helsinki and was approved by the Uşak University Institutional Ethics Committee (decision no: 376-376-10, dated 02.05.2024).
Conflicts of Interest
The authors declare no conflicts of interest.
References
- Schack, T.; Bar-Eli, M. Psychological Factors of Technical Preparation. In Psychology of sport training; Meyer & Meyer Verlag, 2007; Volume 2, pp. 62–103. ISBN 978-1-84126-202-4. [Google Scholar]
- Chicomban, M. A Fundamental Component of Sports Training in The Basketball Game. Bulletin of the Transilvania University of Braşov• Vol 2009, 2, 51. [Google Scholar]
- Guimarães, E.; Baxter-Jones, A.D.G.; Williams, A.M.; Tavares, F.; Janeira, M.A.; Maia, J. Modelling the Dynamics of Change in the Technical Skills of Young Basketball Players: The INEX Study. PLOS ONE 2021, 16, e0257767. [Google Scholar] [CrossRef]
- Wen, D. Analysis of Influencing Factors and Development Trends of College Basketball Teaching Reform. In Proceedings of the 2019 International Conference on Education Science and Economic Development (ICESED 2019); Atlantis Press; 2020; pp. 288–291. [Google Scholar]
- Kennedy, S.R.; Dimick, K.M. Career Maturity and Professional Sports Expectations of College Football and Basketball Players. Journal of College Student Personnel 1987. [Google Scholar]
- Stone, J.D.; Merrigan, J.J.; Ramadan, J.; Brown, R.S.; Cheng, G.T.; Hornsby, W.G.; Smith, H.; Galster, S.M.; Hagen, J.A. Simplifying External Load Data in NCAA Division-I Men’s Basketball Competitions: A Principal Component Analysis. Front. Sports Act. Living 2022, 4. [Google Scholar] [CrossRef] [PubMed]
- Seçkin, A.Ç.; Ateş, B.; Seçkin, M. Review on Wearable Technology in Sports: Concepts, Challenges and Opportunities. Applied Sciences 2023, 13, 10399. [Google Scholar] [CrossRef]
- Huang, J.; Lv, Q.; Zeng, X. Application of Wearable Sensors Based on Infrared Optical Imaging in Mobile Image Processing in Basketball Teaching. Opt Quant Electron 2024, 56, 499. [Google Scholar] [CrossRef]
- Lian, C.; Ma, R.; Wang, X.; Zhao, Y.; Peng, H.; Yang, T.; Zhang, M.; Zhang, W.; Sha, X.; Li, W.J. ANN-Enhanced IoT Wristband for Recognition of Player Identity and Shot Types Based on Basketball Shooting Motion Analysis. IEEE Sensors Journal 2022, 22, 1404–1413. [Google Scholar] [CrossRef]
- Chen, Y.; Cao, Z.; Zhang, J.; Liu, Y.; Yu, D.; Guo, X. Wearable Ultraviolet Sensor Based on Convolutional Neural Network Image Processing Method. Sensors and Actuators A: Physical 2022, 338, 113402. [Google Scholar] [CrossRef]
- Hoareau, D.; Jodin, G.; Chantal, P.-A.; Bretin, S.; Prioux, J.; Razan, F. Synthetized Inertial Measurement Units (IMUs) to Evaluate the Placement of Wearable Sensors on Human Body for Motion Recognition. The Journal of Engineering 2022, 2022, 536–543. [Google Scholar] [CrossRef]
- Ji, R. Research on Basketball Shooting Action Based on Image Feature Extraction and Machine Learning. IEEE Access 2020, 8, 138743–138751. [Google Scholar] [CrossRef]
- Ren, H.; Wang, X. Application of Wearable Inertial Sensor in Optimization of Basketball Player’s Human Motion Tracking Method. J Ambient Intell Human Comput 2021. [Google Scholar] [CrossRef]
- Dehzangi, O.; Taherisadr, M.; ChangalVala, R. IMU-Based Gait Recognition Using Convolutional Neural Networks and Multi-Sensor Fusion. Sensors 2017, 17, 2735. [Google Scholar] [CrossRef]
- Hölzemann, A.; Van Laerhoven, K. Using Wrist-Worn Activity Recognition for Basketball Game Analysis. In Proceedings of the Proceedings of the 5th International Workshop on Sensor-based Activity Recognition and Interaction; Association for Computing Machinery: New York, NY, USA, September 20, 2018; pp. 1–6. [Google Scholar]
- Ross, G.B.; Dowling, B.; Troje, N.F.; Fischer, S.L.; Graham, R.B. Classifying Elite From Novice Athletes Using Simulated Wearable Sensor Data. Front. Bioeng. Biotechnol. 2020, 8. [Google Scholar] [CrossRef]
- Hu, X.; Mo, S.; Qu, X. Basketball Activity Classification Based on Upper Body Kinematics and Dynamic Time Warping. International Journal of Sports Medicine 2020, 41, 255–263. [Google Scholar] [CrossRef] [PubMed]
- Eggert, B.; Mundt, M.; Markert, B. IMU-Based Activity Recognition of the Basketball Jump Shot. ISBS Proceedings Archive 2020, 38, 344. [Google Scholar]
- Asmara, R.A.; Hendrawan, N.D.; Handayani, A.N.; Arai, K. Basketball Activity Recognition Using Supervised Machine Learning Implemented on Tizen OS Smartwatch. Jurnal Ilmiah Teknik Elektro Komputer dan Informatika (JITEKI) 2022, 8, 447. [Google Scholar] [CrossRef]
- Liu, F.; Zhang, W. Basketball Motion Posture Recognition Based on Recurrent Deep Learning Model. Mathematical Problems in Engineering 2022, 2022, 8314777. [Google Scholar] [CrossRef]
- Hoelzemann, A.; Romero, J.L.; Bock, M.; Laerhoven, K.V.; Lv, Q. Hang-Time HAR: A Benchmark Dataset for Basketball Activity Recognition Using Wrist-Worn Inertial Sensors. Sensors 2023, 23, 5879. [Google Scholar] [CrossRef] [PubMed]
- Jiang, L.; Zhang, D. Deep Learning Algorithm Based Wearable Device for Basketball Stance Recognition in Basketball. International Journal of Advanced Computer Science and Applications (IJACSA) 2023, 14. [Google Scholar] [CrossRef]
- Ma, R.; Yan, D.; Peng, H.; Yang, T.; Sha, X.; Zhao, Y.; Liu, L. Basketball Movements Recognition Using a Wrist Wearable Inertial Measurement Unit. In Proceedings of the 2018 IEEE 1st International Conference on Micro/Nano Sensors for AI, Healthcare, and Robotics (NSENS); December 2018; pp. 73–76. [Google Scholar]
- Li, J.; Gu, D. Research on Basketball Players’ Action Recognition Based on Interactive System and Machine Learning. Journal of Intelligent & Fuzzy Systems 2021, 40, 2029–2039. [Google Scholar] [CrossRef]
- Achermann, B.; Oberhofer, K.; Lorenzetti, S. Introducing a Time-Efficient Workflow for Processing IMU Data to Identify Sport-Specific Movement Patterns. Current Issues in Sport Science (CISS) 2023, 8, 060–060. [Google Scholar] [CrossRef]
- Chen, D.; Ni, Z. Action Recognition Method of Basketball Training Based on Big Data Technology. International Journal of Advanced Computer Science and Applications (IJACSA) 2024, 15. [Google Scholar] [CrossRef]
- Kerns, J.A.; Zwart, A.S.; Perez, P.S.; Gurchiek, R.D.; McBride, J.M. Effect of IMU Location on Estimation of Vertical Ground Reaction Force during Jumping. Front. Bioeng. Biotechnol. 2023, 11. [Google Scholar] [CrossRef] [PubMed]
- Rahmani, M.H.; Berkvens, R.; Weyn, M. Chest-Worn Inertial Sensors: A Survey of Applications and Methods. Sensors 2021, 21, 2875. [Google Scholar] [CrossRef] [PubMed]
- Doyle, E.W.; Doyle, T.L.A.; Bonacci, J.; Fuller, J.T. Sensor Location Influences the Associations between IMU and Motion Capture Measurements of Impact Landing in Healthy Male and Female Runners at Multiple Running Speeds. Sports Biomechanics 2023, 1–15. [Google Scholar] [CrossRef]
- Cover, T.; Hart, P. Nearest Neighbor Pattern Classification. IEEE Transactions on Information Theory 1967, 13, 21–27. [Google Scholar] [CrossRef]
- Friedman, J.H.; Baskett, F.; Shustek, L.J. An Algorithm for Finding Nearest Neighbors. IEEE Transactions on Computers 1975, C–24, 1000–1006. [Google Scholar] [CrossRef]
- Quinlan, J.R. Induction of Decision Trees. Mach Learn 1986, 1, 81–106. [Google Scholar] [CrossRef]
- Dehghani, A.A.; Movahedi, N.; Ghorbani, K.; Eslamian, S. Decision Tree Algorithms. In Handbook of Hydroinformatics; Eslamian, S., Eslamian, F., Eds.; Elsevier, 2023; pp. 171–187. ISBN 978-0-12-821285-1. [Google Scholar]
- Breiman, L. Random Forests. Machine Learning 2001, 45, 5–32. [Google Scholar] [CrossRef]
- Biau, G.; Scornet, E. A Random Forest Guided Tour. TEST 2016, 25, 197–227. [Google Scholar] [CrossRef]
- Freund, Y.; Schapire, R.E. A Desicion-Theoretic Generalization of on-Line Learning and an Application to Boosting. In Proceedings of the Computational Learning Theory; Vitányi, P., Ed.; Springer: Berlin, Heidelberg, 1995; pp. 23–37. [Google Scholar]
- Favaro, P.; Vedaldi, A. AdaBoost. In Computer Vision: A Reference Guide; Ikeuchi, K., Ed.; Springer US: Boston, MA, 2014; pp. 16–19. ISBN 978-0-387-31439-6. [Google Scholar]
- Chen, T.; Guestrin, C. XGBoost: A Scalable Tree Boosting System. In Proceedings of the Proceedings of the 22nd ACM SIGKDD International Conference on Knowledge Discovery and Data Mining; pp. 132016785–794.
- Gholamiangonabadi, D.; Kiselov, N.; Grolinger, K. Deep Neural Networks for Human Activity Recognition With Wearable Sensors: Leave-One-Subject-Out Cross-Validation for Model Selection. IEEE Access 2020, 8, 133982–133994. [Google Scholar] [CrossRef]
- Dehghani, A.; Glatard, T.; Shihab, E. Subject Cross Validation in Human Activity Recognition 2019.
- Bhuyan, B.P.; Srivastava, S. Feature Importance in Explainable AI for Expounding Black Box Models. In Proceedings of the Proceedings of International Conference on Data Science and Applications; Saraswat, M., Chowdhury, C., Kumar Mandal, C., Gandomi, A.H., Eds.; Springer Nature: Singapore, 2023; pp. 815–824. [Google Scholar]
- Katayama, T.; Takahashi, K.; Shimomura, Y.; Takizawa, H. XAI-Based Feature Importance Analysis on Loop Optimization. In Proceedings of the 2024 IEEE International Parallel and Distributed Processing Symposium Workshops (IPDPSW); May 2024; pp. 782–791. [Google Scholar]
- Huang, J.; Wang, Z.; Li, D.; Liu, Y. The Analysis and Development of an XAI Process on Feature Contribution Explanation. In Proceedings of the 2022 IEEE International Conference on Big Data (Big Data); December 2022; pp. 5039–5048. [Google Scholar]
- Nakanishi, T.; Chophuk, P.; Chinnasarn, K. Evolving Feature Selection: Synergistic Backward and Forward Deletion Method Utilizing Global Feature Importance. IEEE Access 2024, 12, 88696–88714. [Google Scholar] [CrossRef]
- Salih, A.M.; Raisi-Estabragh, Z.; Galazzo, I.B.; Radeva, P.; Petersen, S.E.; Lekadir, K.; Menegaz, G. A Perspective on Explainable Artificial Intelligence Methods: SHAP and LIME. Advanced Intelligent Systems n/a 2024, 2400304. [Google Scholar] [CrossRef]
- Lan, Y.; Shi, Z.; Yao, W.; Zhou, R.; Luo, F.; Wen, J. SHAP Algorithm for Transparent Power System Transient Stability Assessment: Critical Impact Factors Identification. In Proceedings of the 2023 International Conference on Power System Technology (PowerCon); September 2023; pp. 01–06. [Google Scholar]
- Lellep, M.; Prexl, J.; Eckhardt, B.; Linkmann, M. Interpreted Machine Learning in Fluid Dynamics: Explaining Relaminarisation Events in Wall-Bounded Shear Flows. Journal of Fluid Mechanics 2022, 942, A2. [Google Scholar] [CrossRef]
- Lu, Y.; Fan, X.; Zhang, Y.; Wang, Y.; Jiang, X. Machine Learning Models Using SHapley Additive exPlanation for Fire Risk Assessment Mode and Effects Analysis of Stadiums. Sensors 2023, 23, 2151. [Google Scholar] [CrossRef] [PubMed]
- Madej, M.; Rumiński, J. Optimal Placement of IMU Sensor for the Detection of Children Activity. In Proceedings of the 2022 15th International Conference on Human System Interaction (HSI); July 2022; pp. 1–6. [Google Scholar]
- Liu, Y.; Chen, Q.; Zhu, M. Estimation of Vertical Jump Height Based on IMU Sensor. In Proceedings of the 2022 8th International Conference on Control, Automation and Robotics (ICCAR); April 2022; pp. 191–196. [Google Scholar]
Figure 1.
General Flowchart.
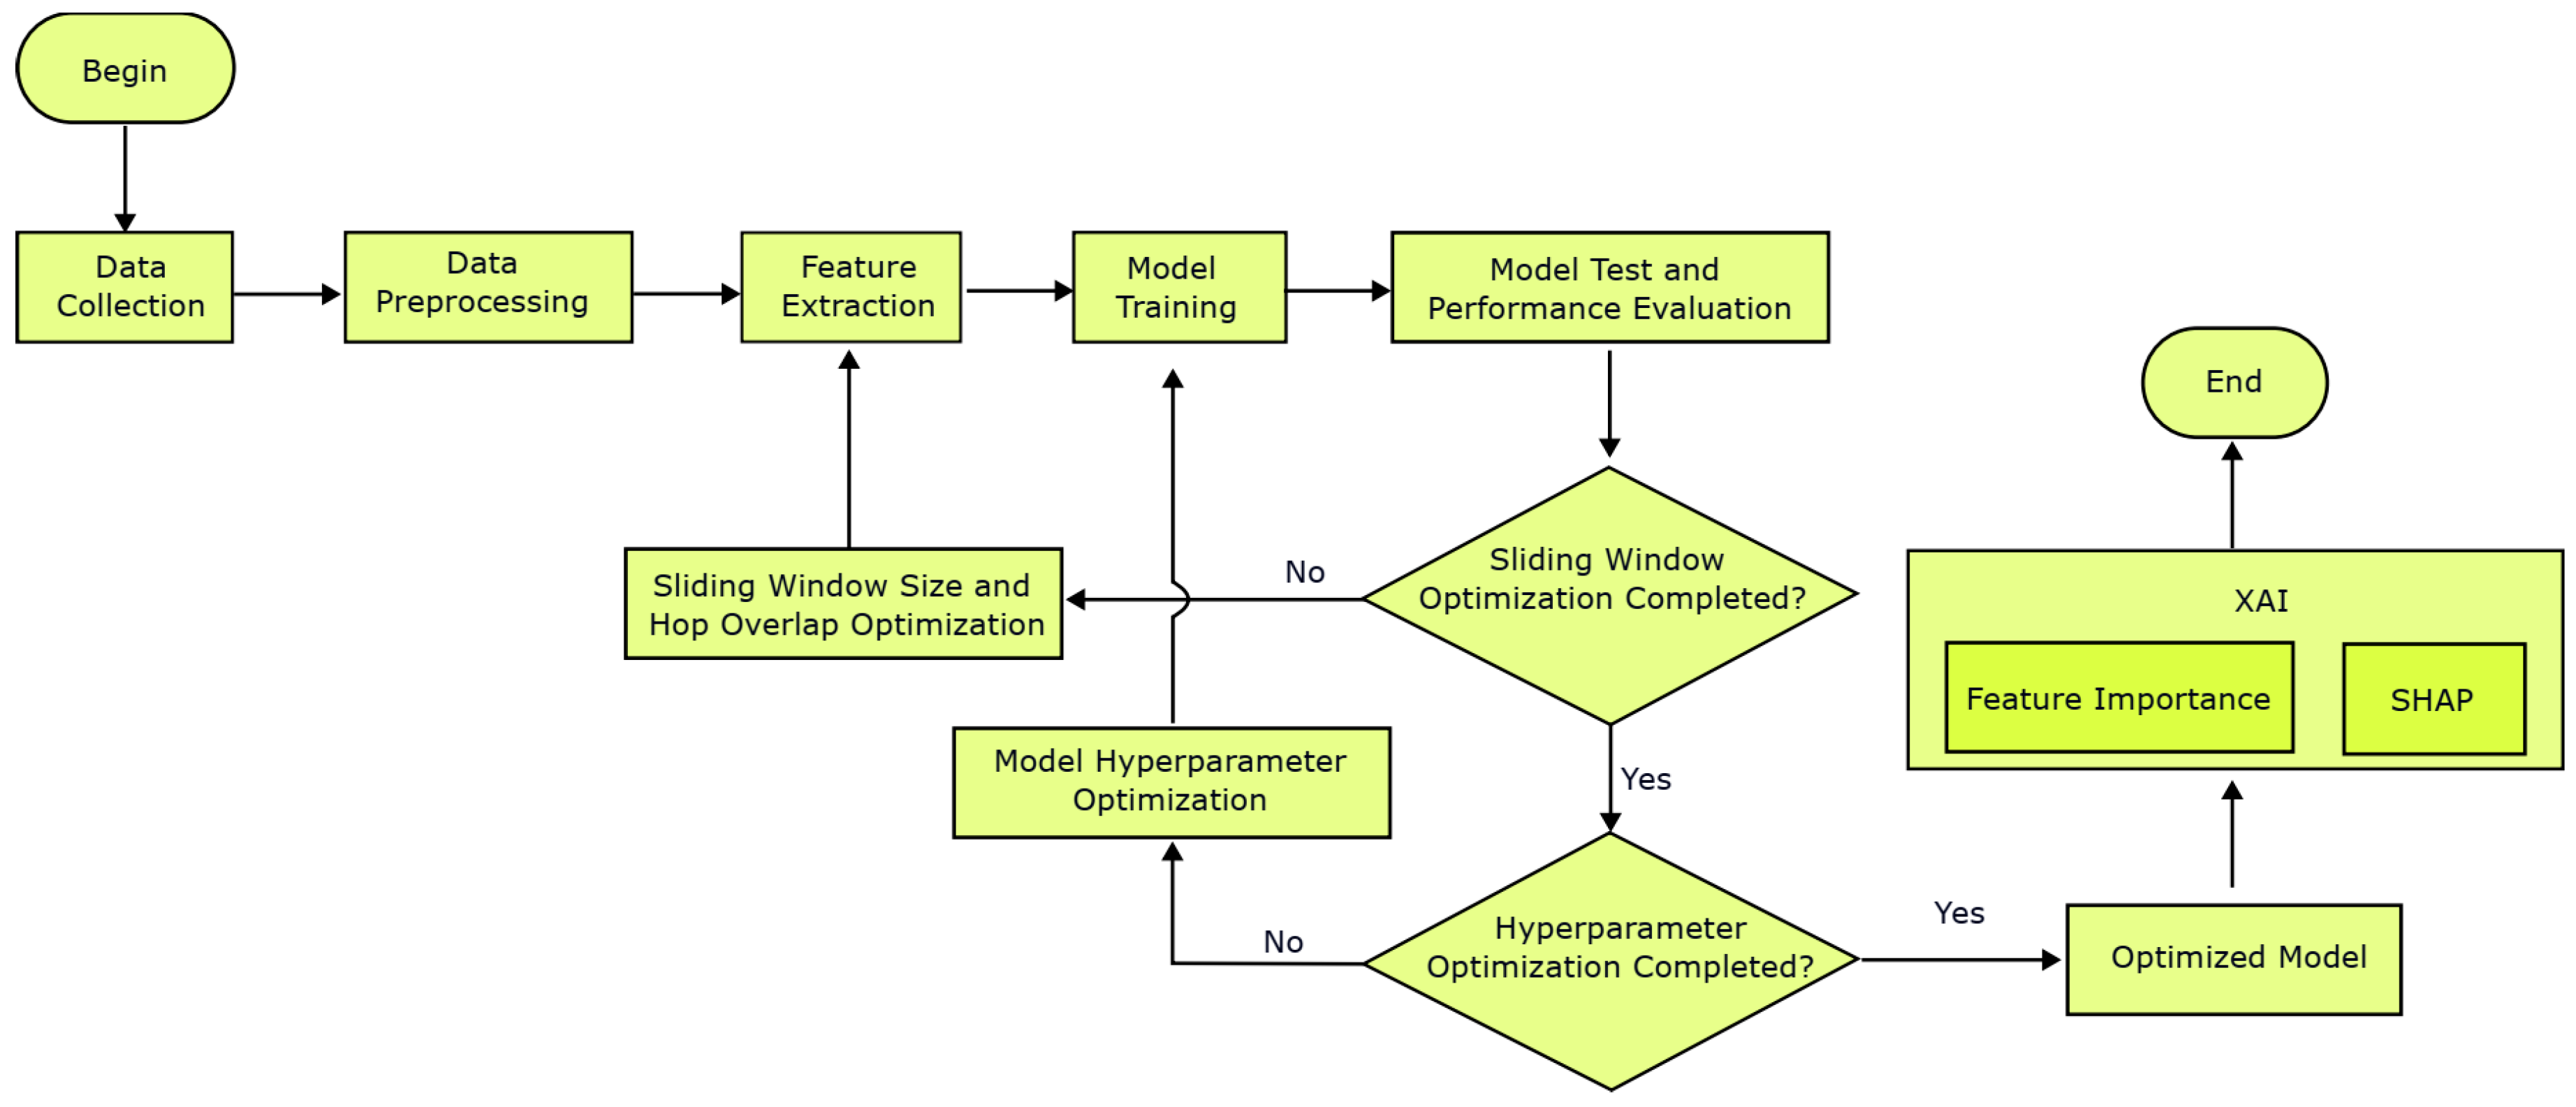
Figure 2.
Vest and IMU Sensor.
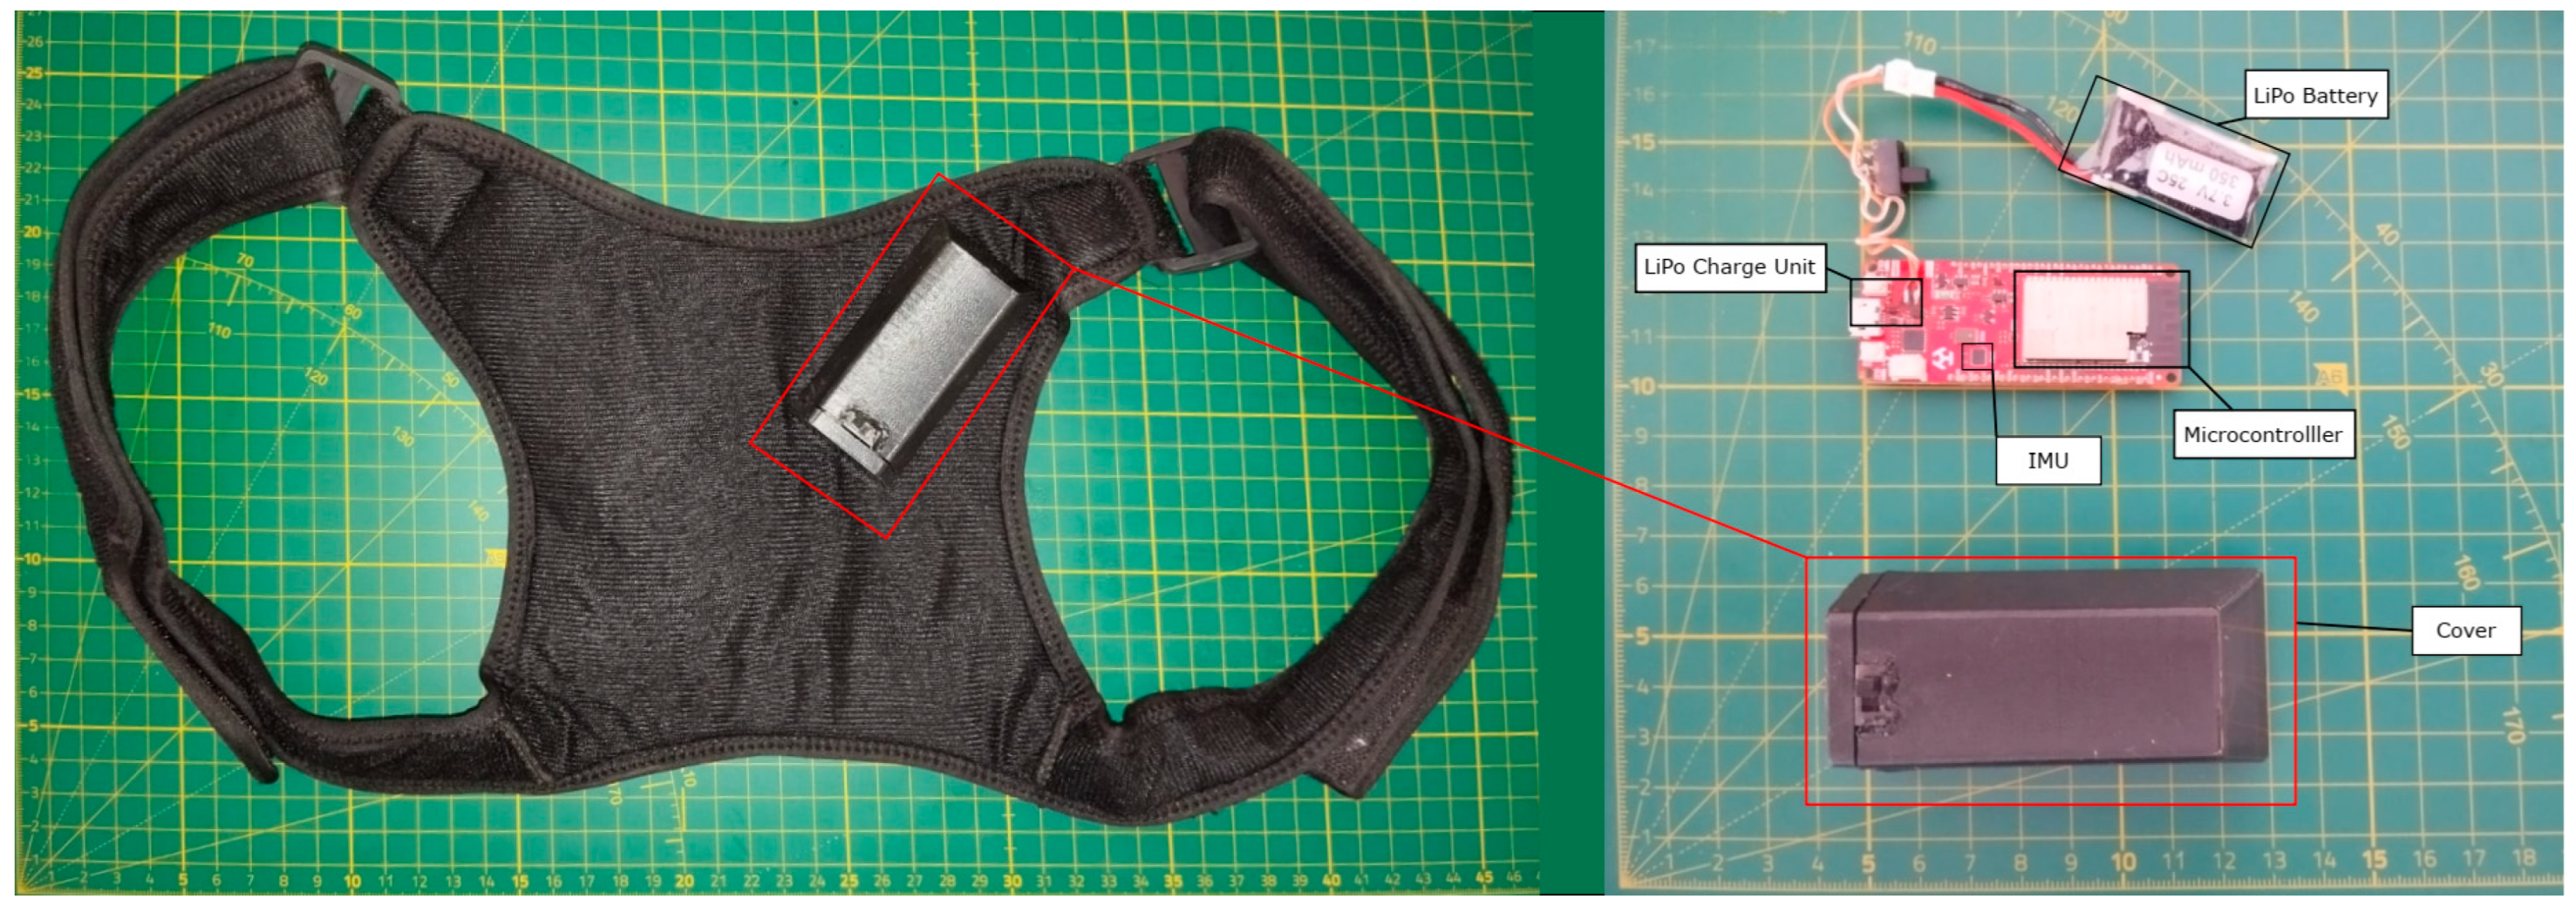
Figure 3.
Data Collection and Labeling Program GUI.
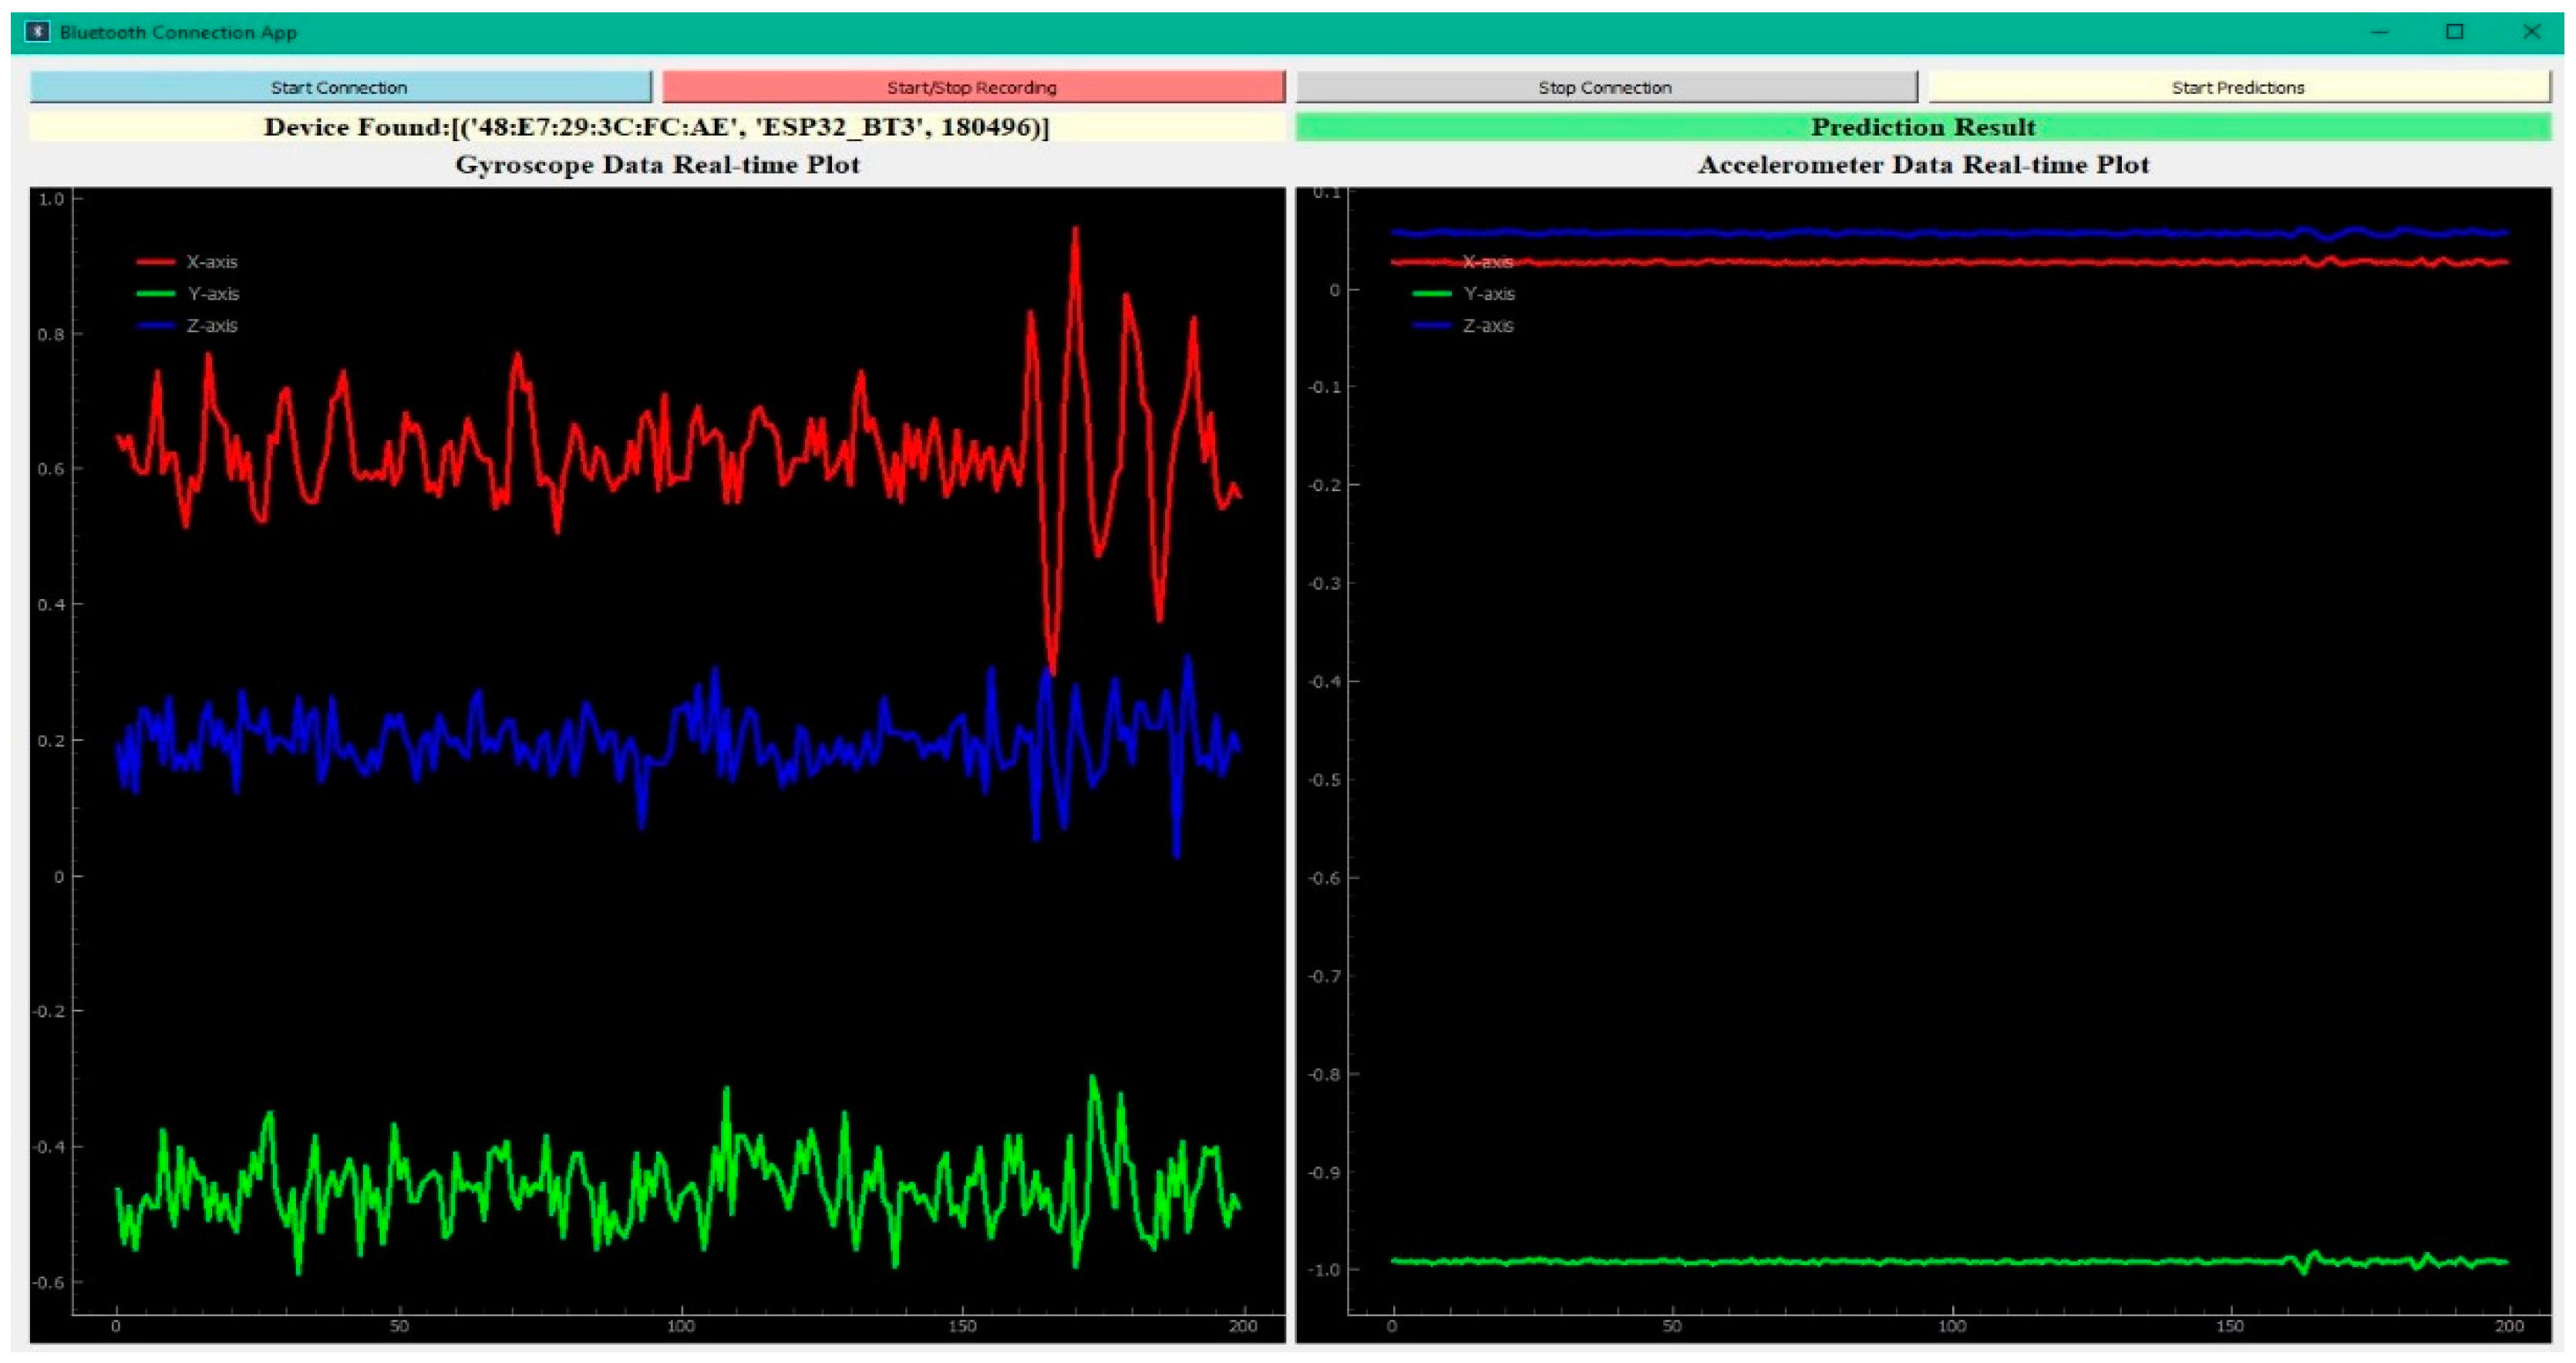
Figure 4.
Data Collection Program Flowchart.
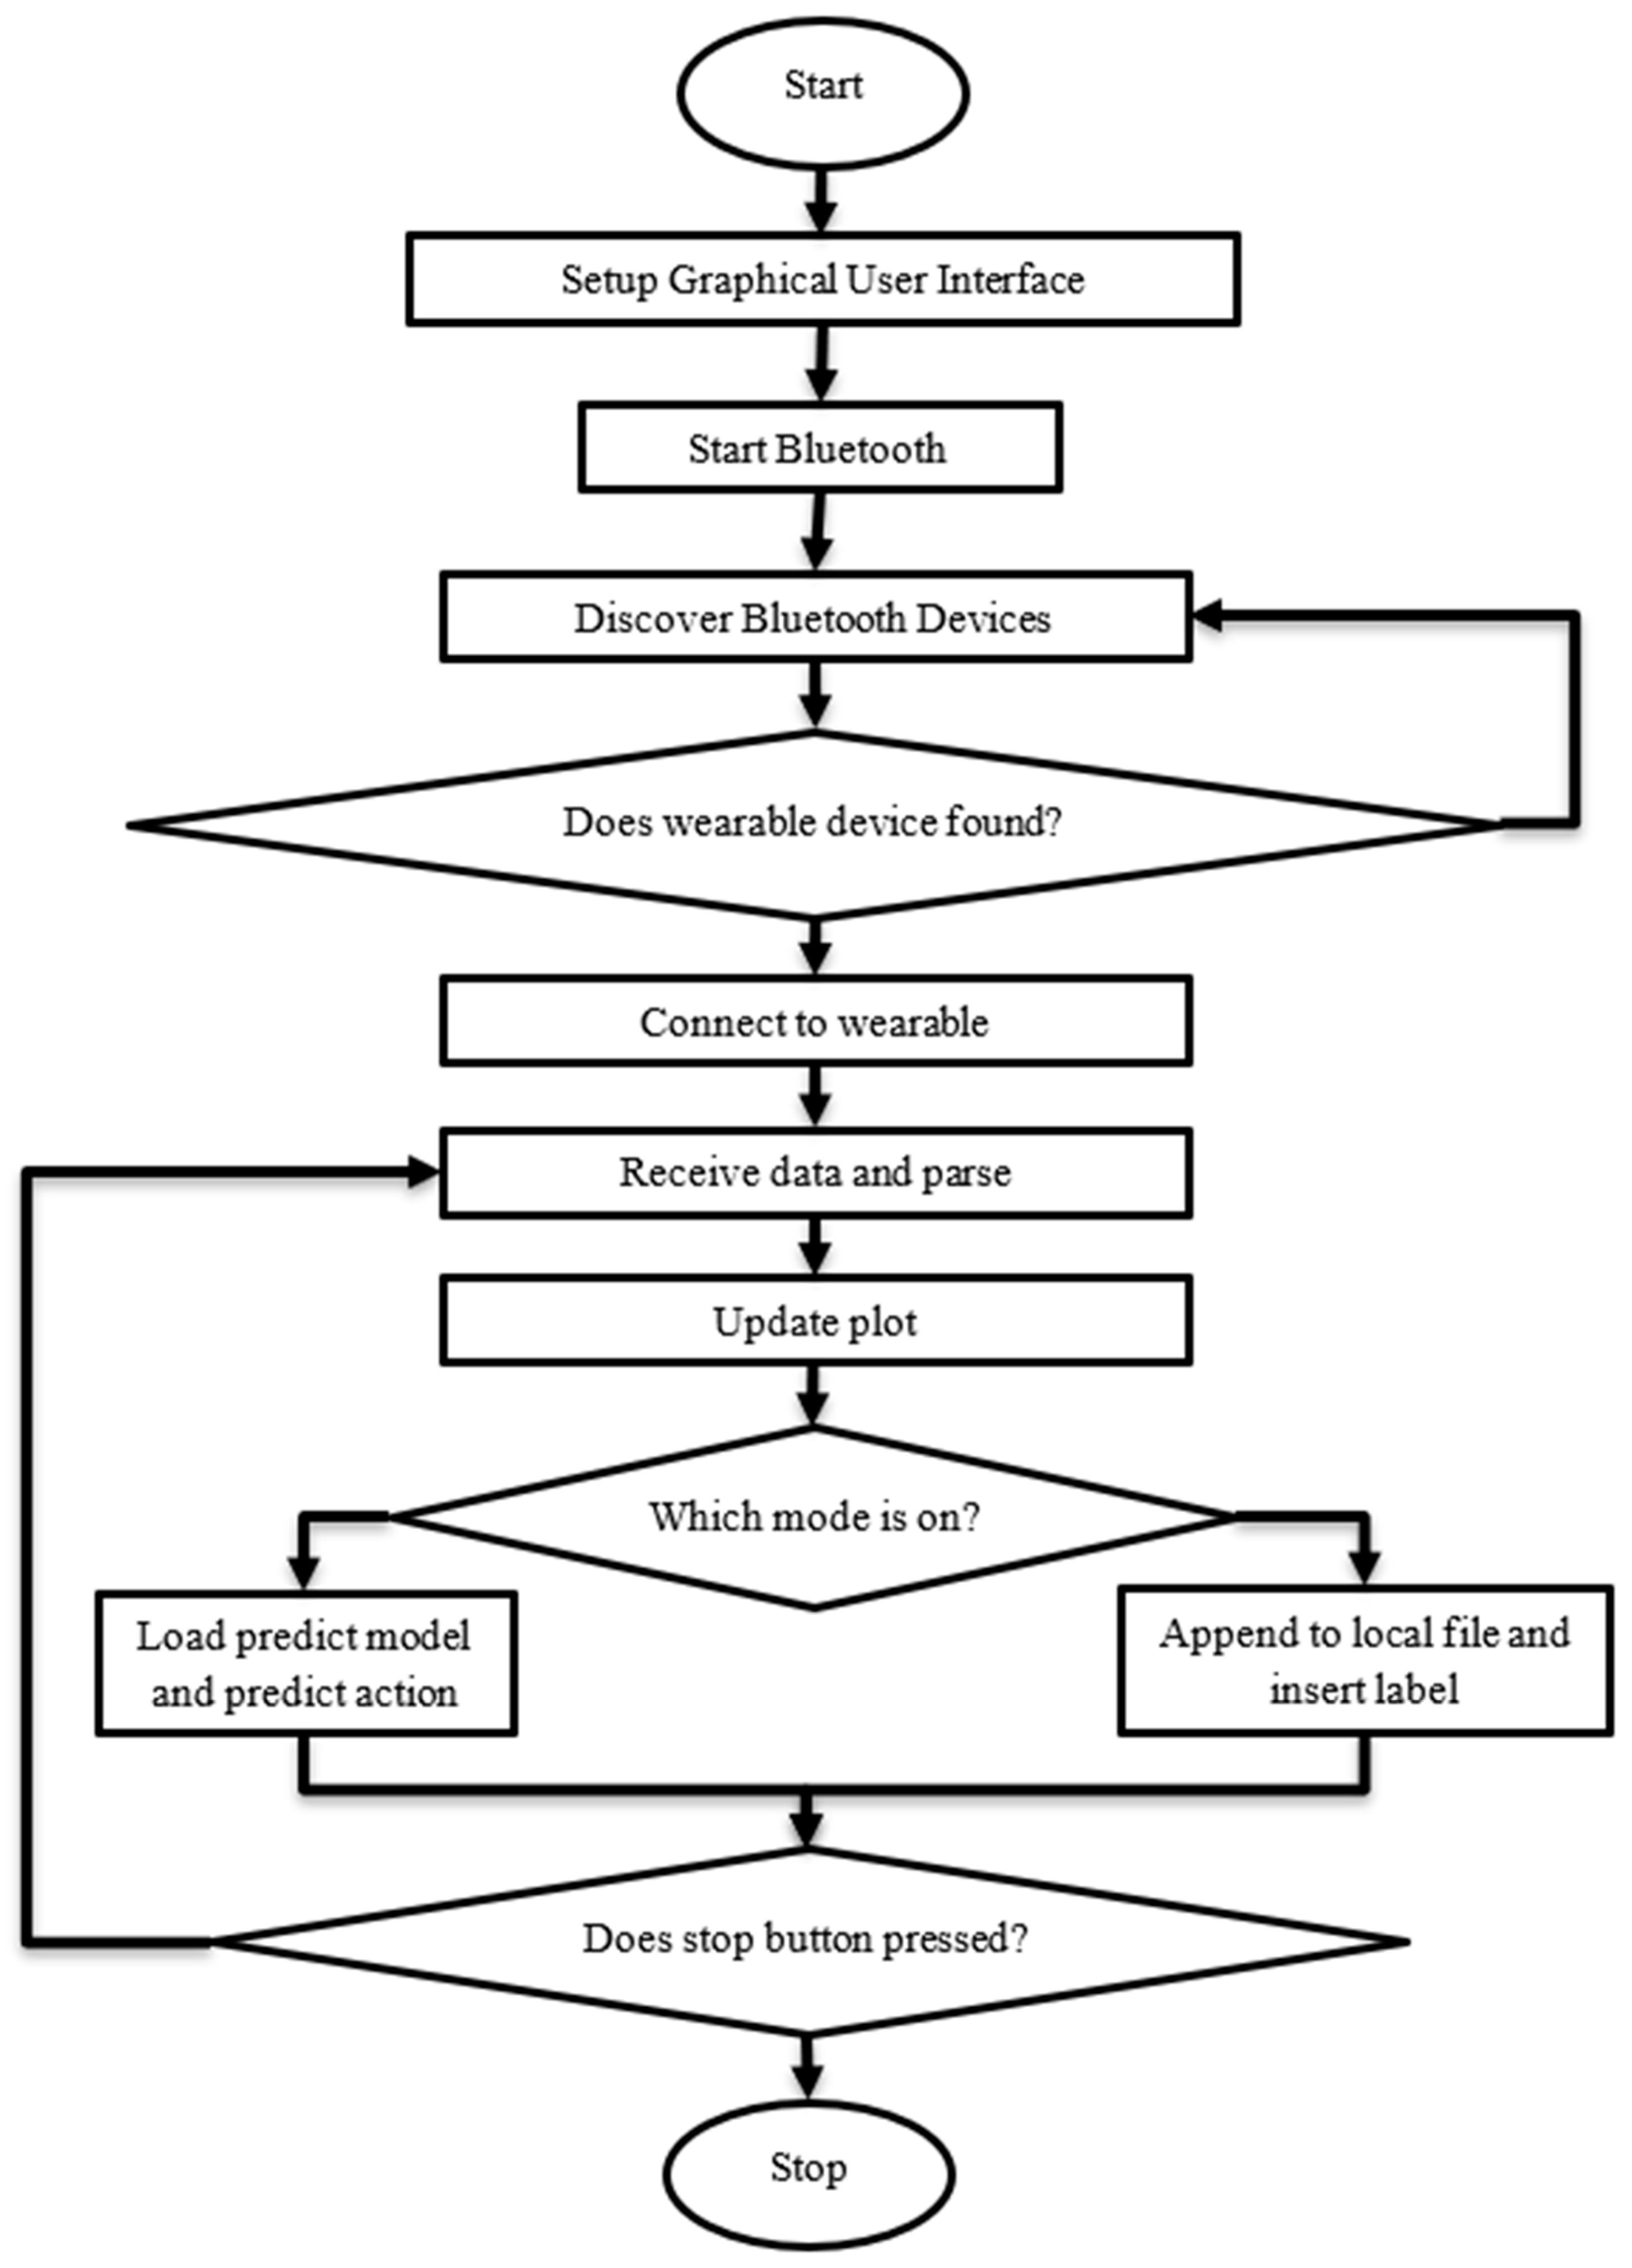
Figure 5.
Sample Basketball Actions with Wearable IMU.
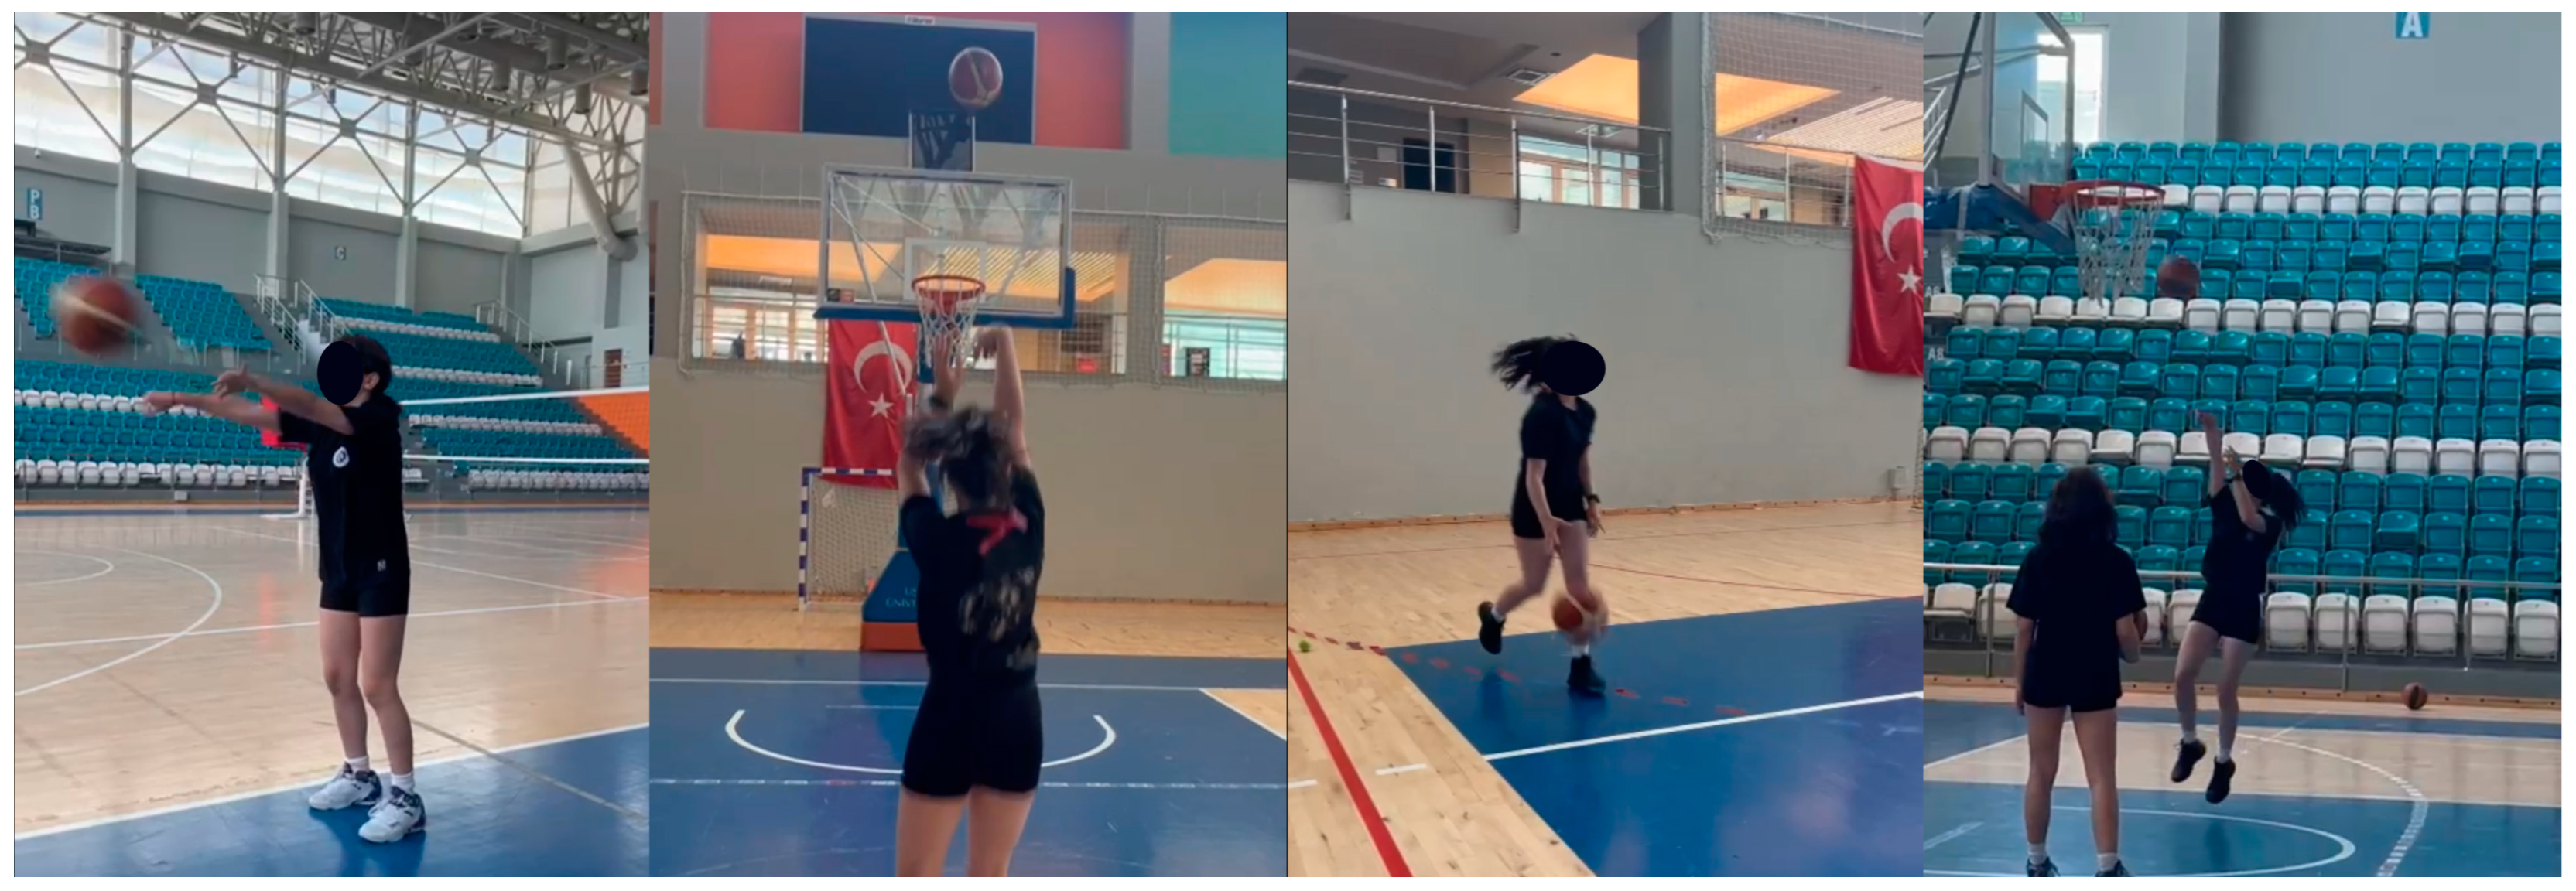
Figure 6.
Distribution of Dataset Outputs.
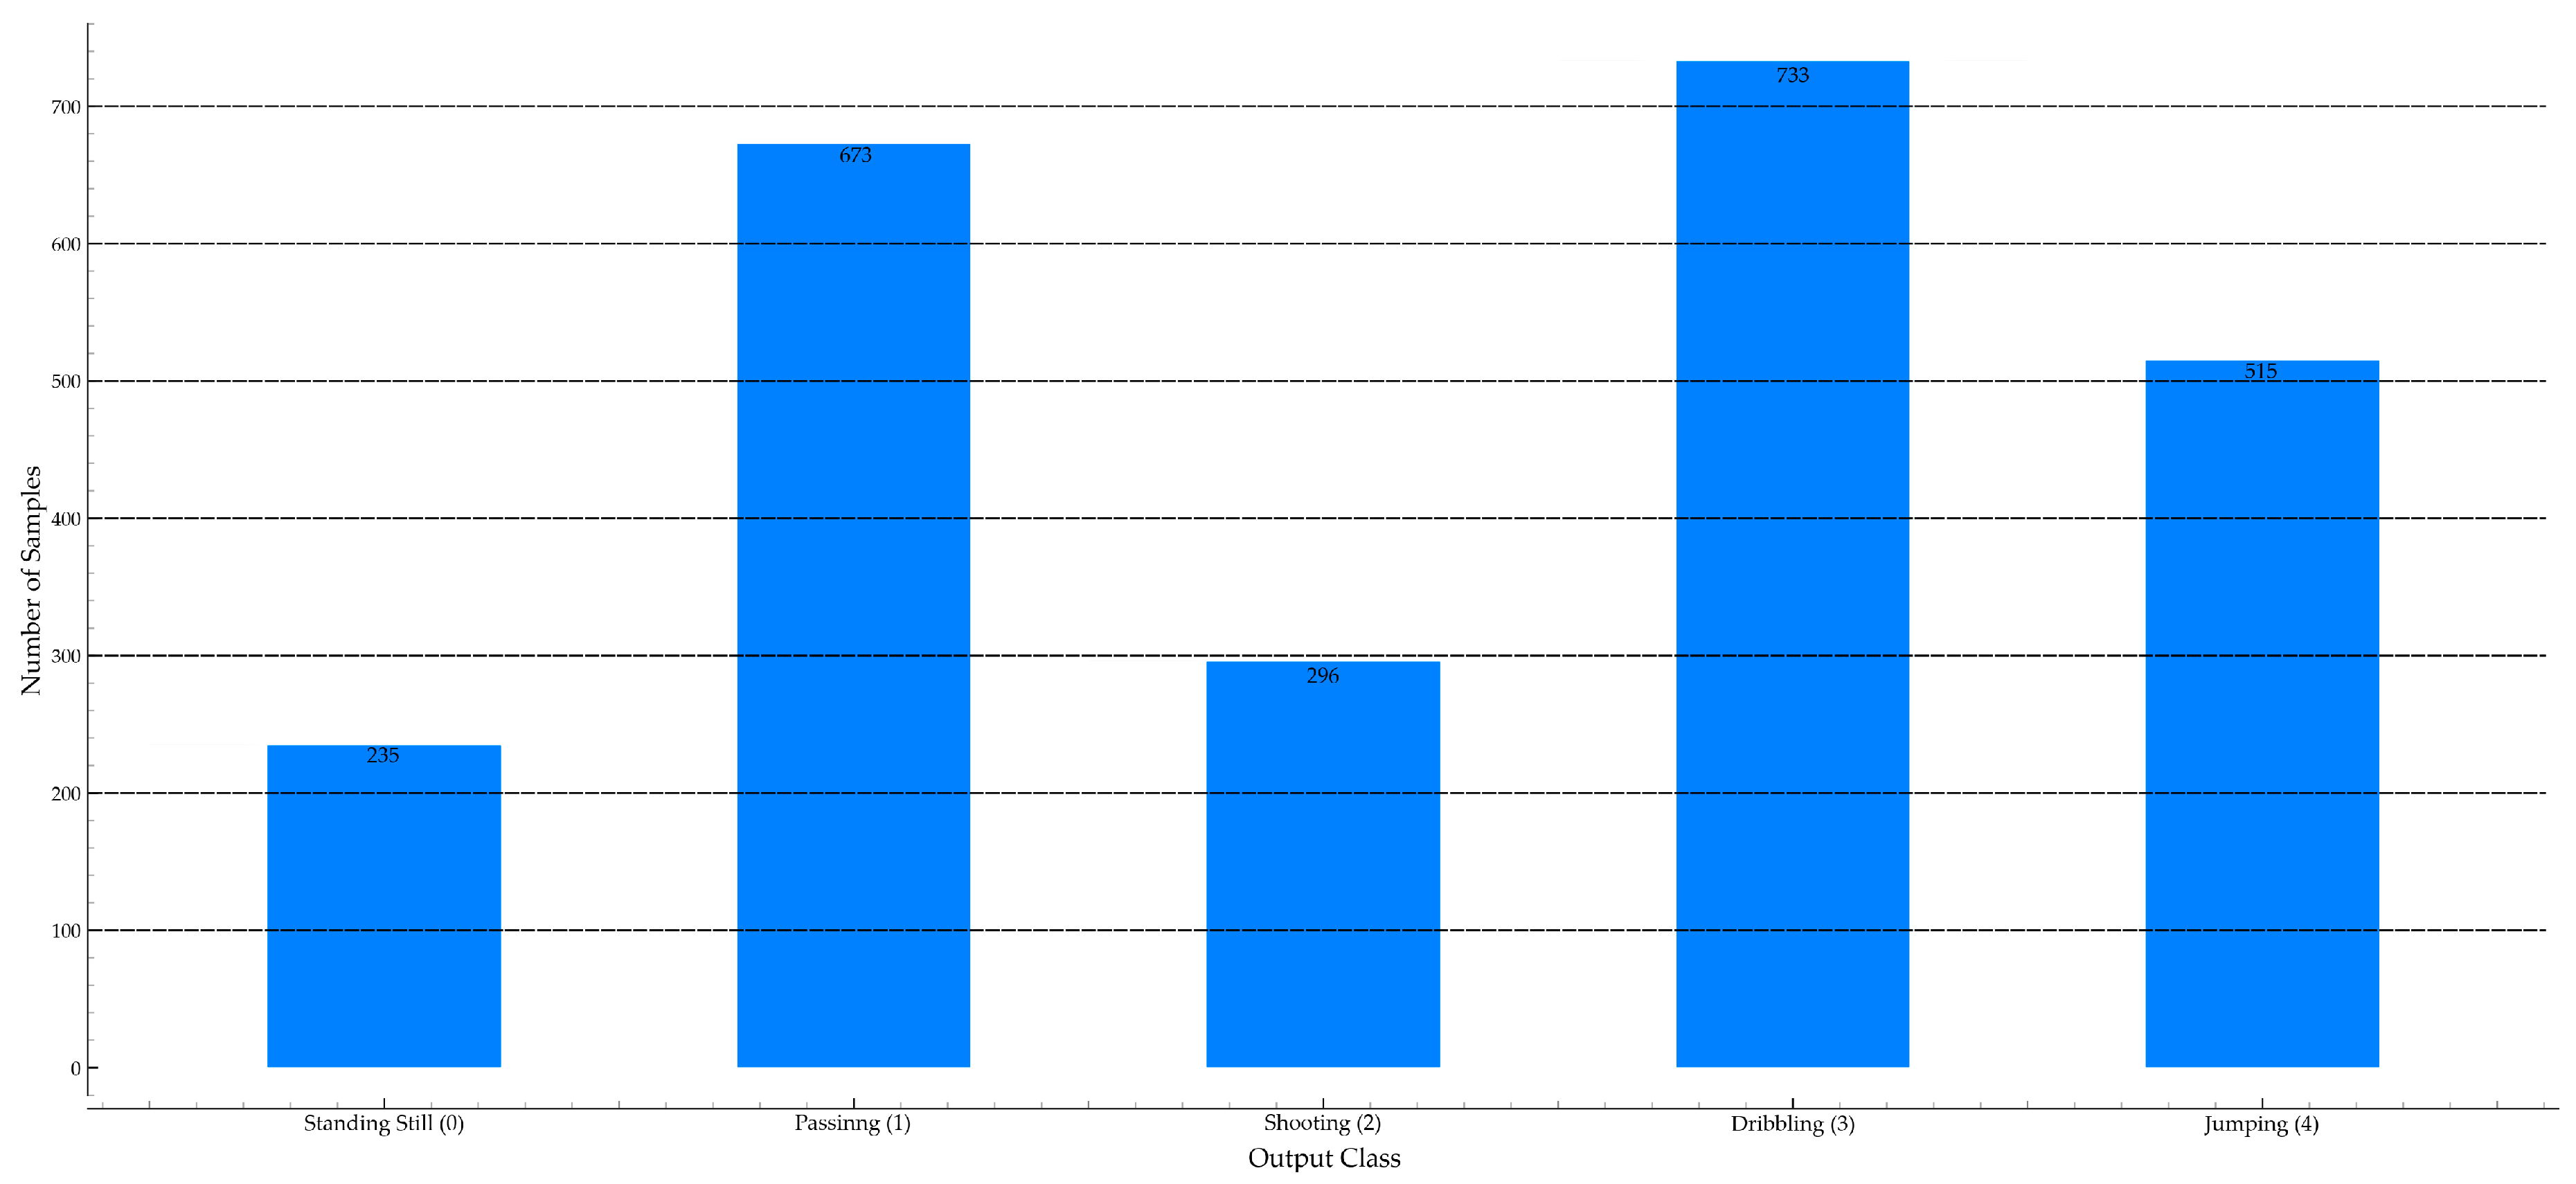
Figure 7.
Confusion matrix of XGBoost for Test Dataset.
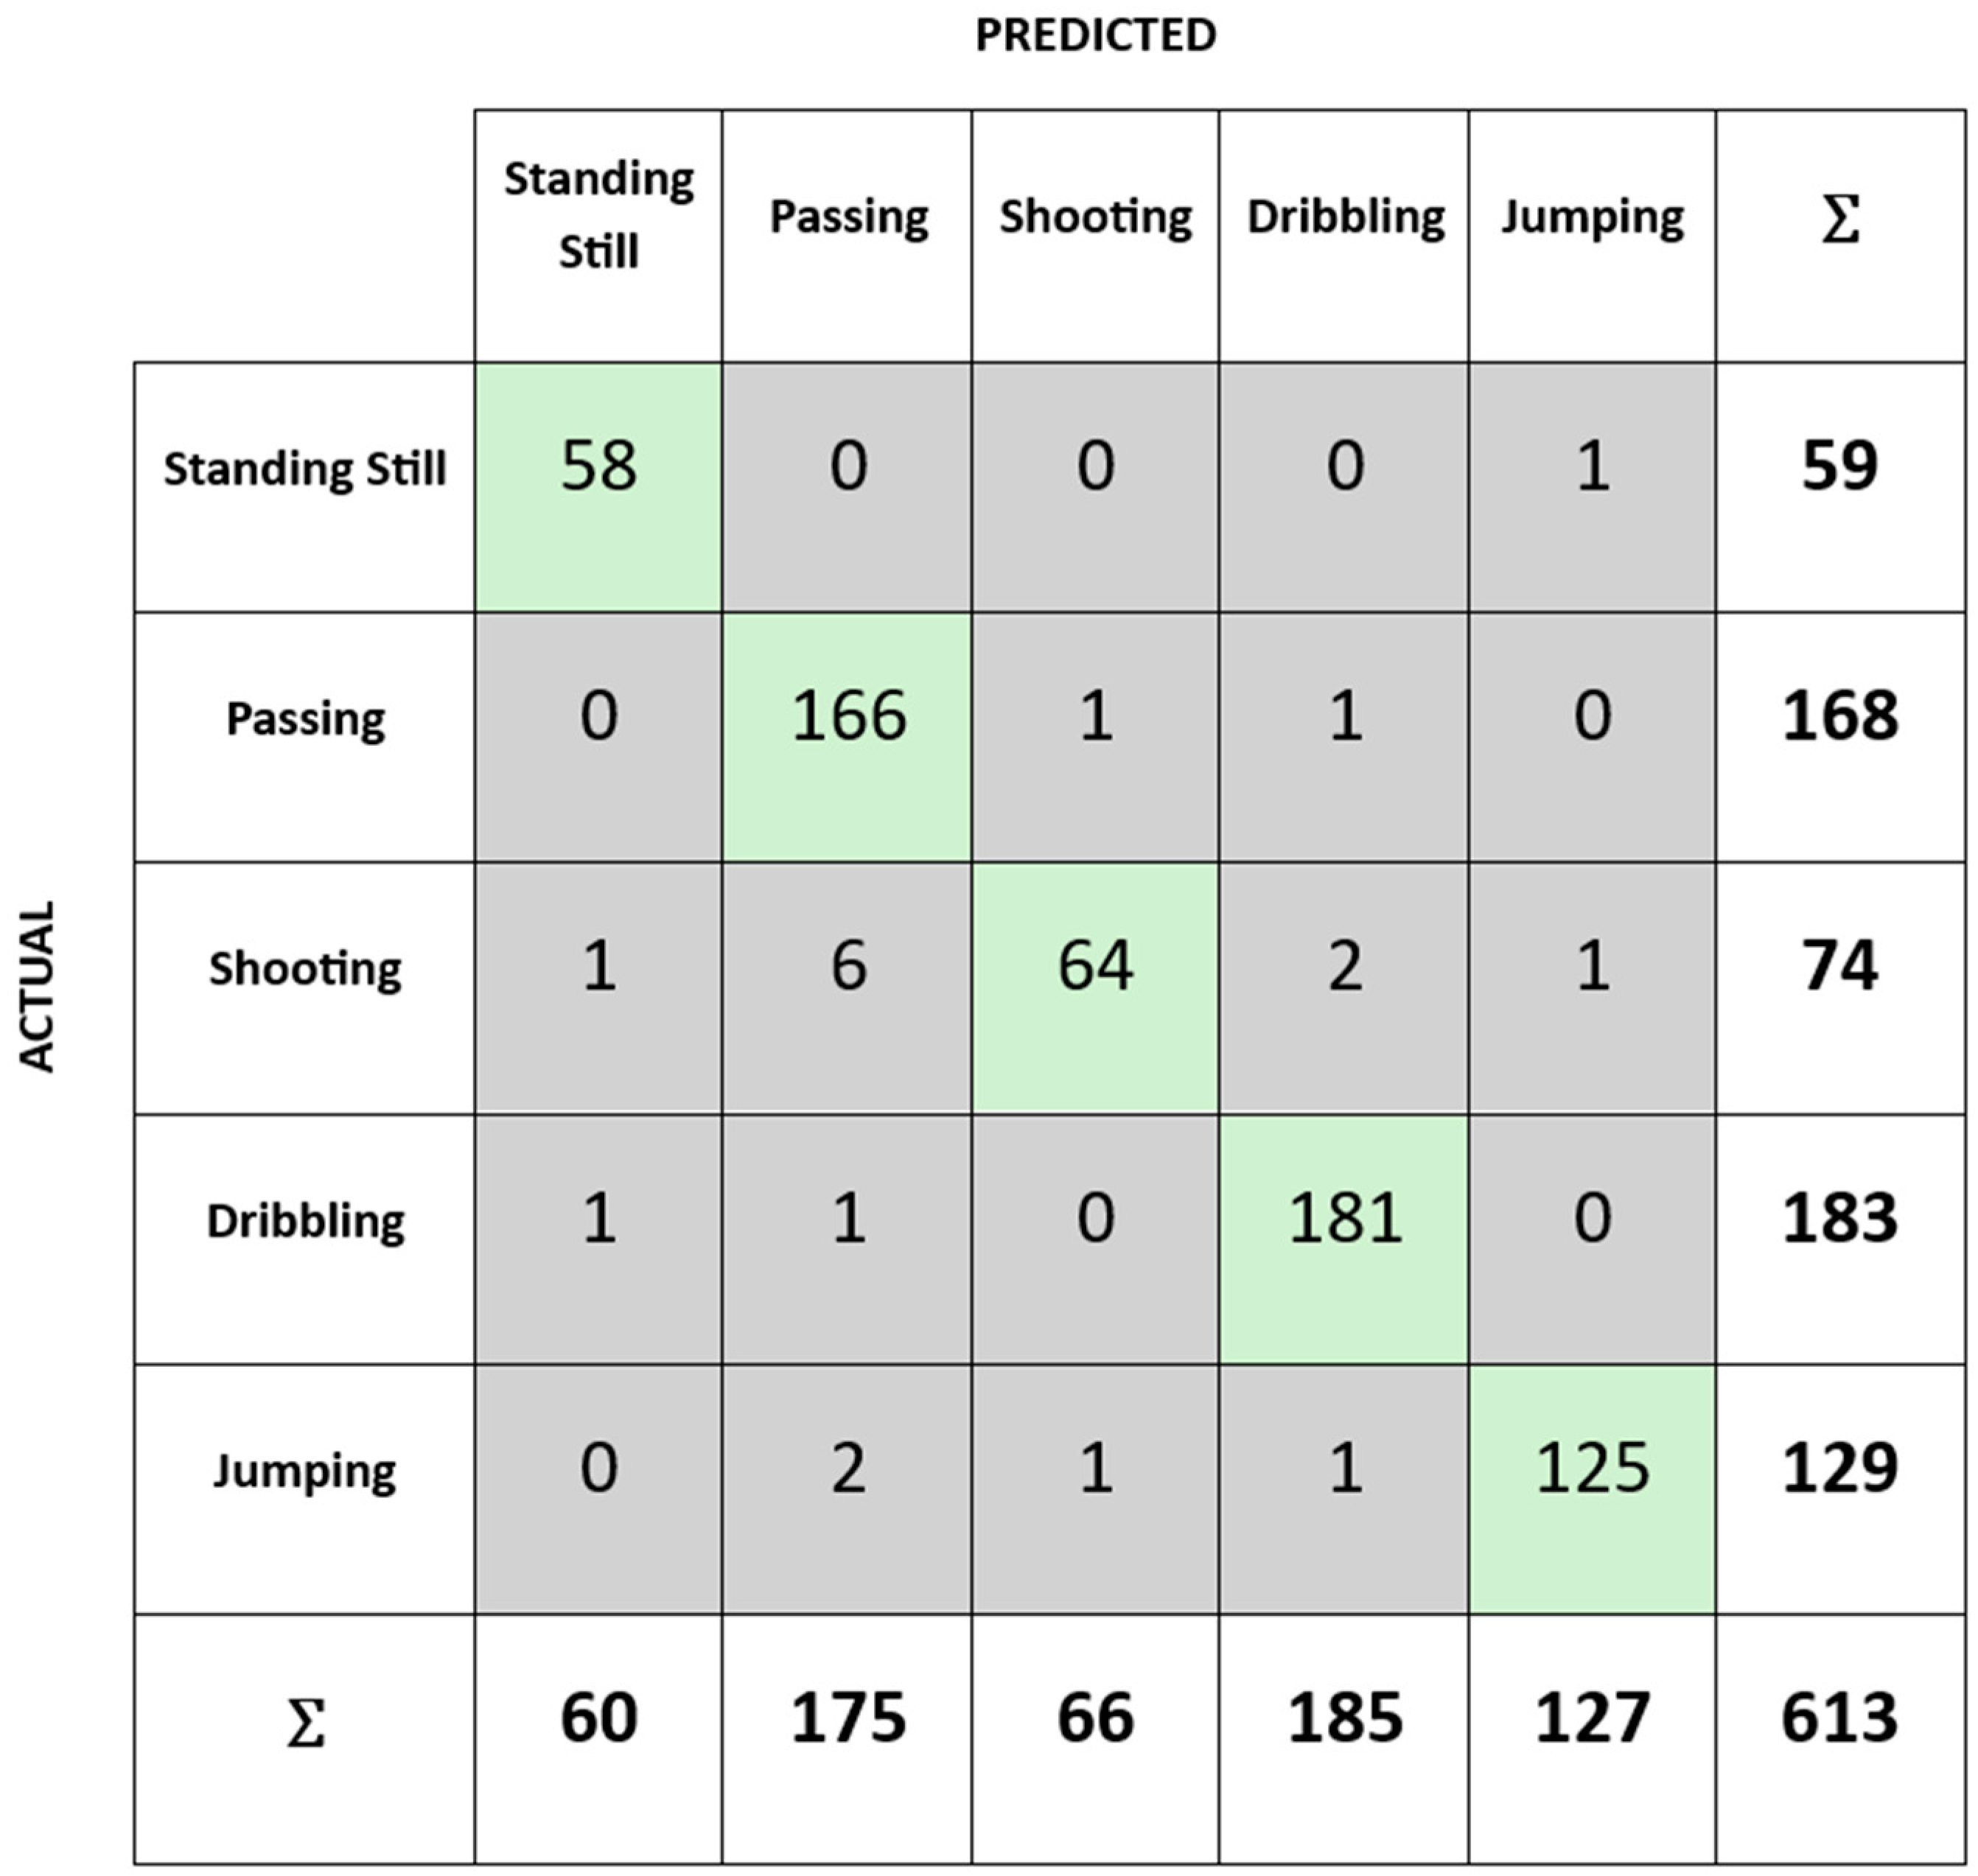
Figure 8.
Feature Importance on Action Classification with XGBoost.
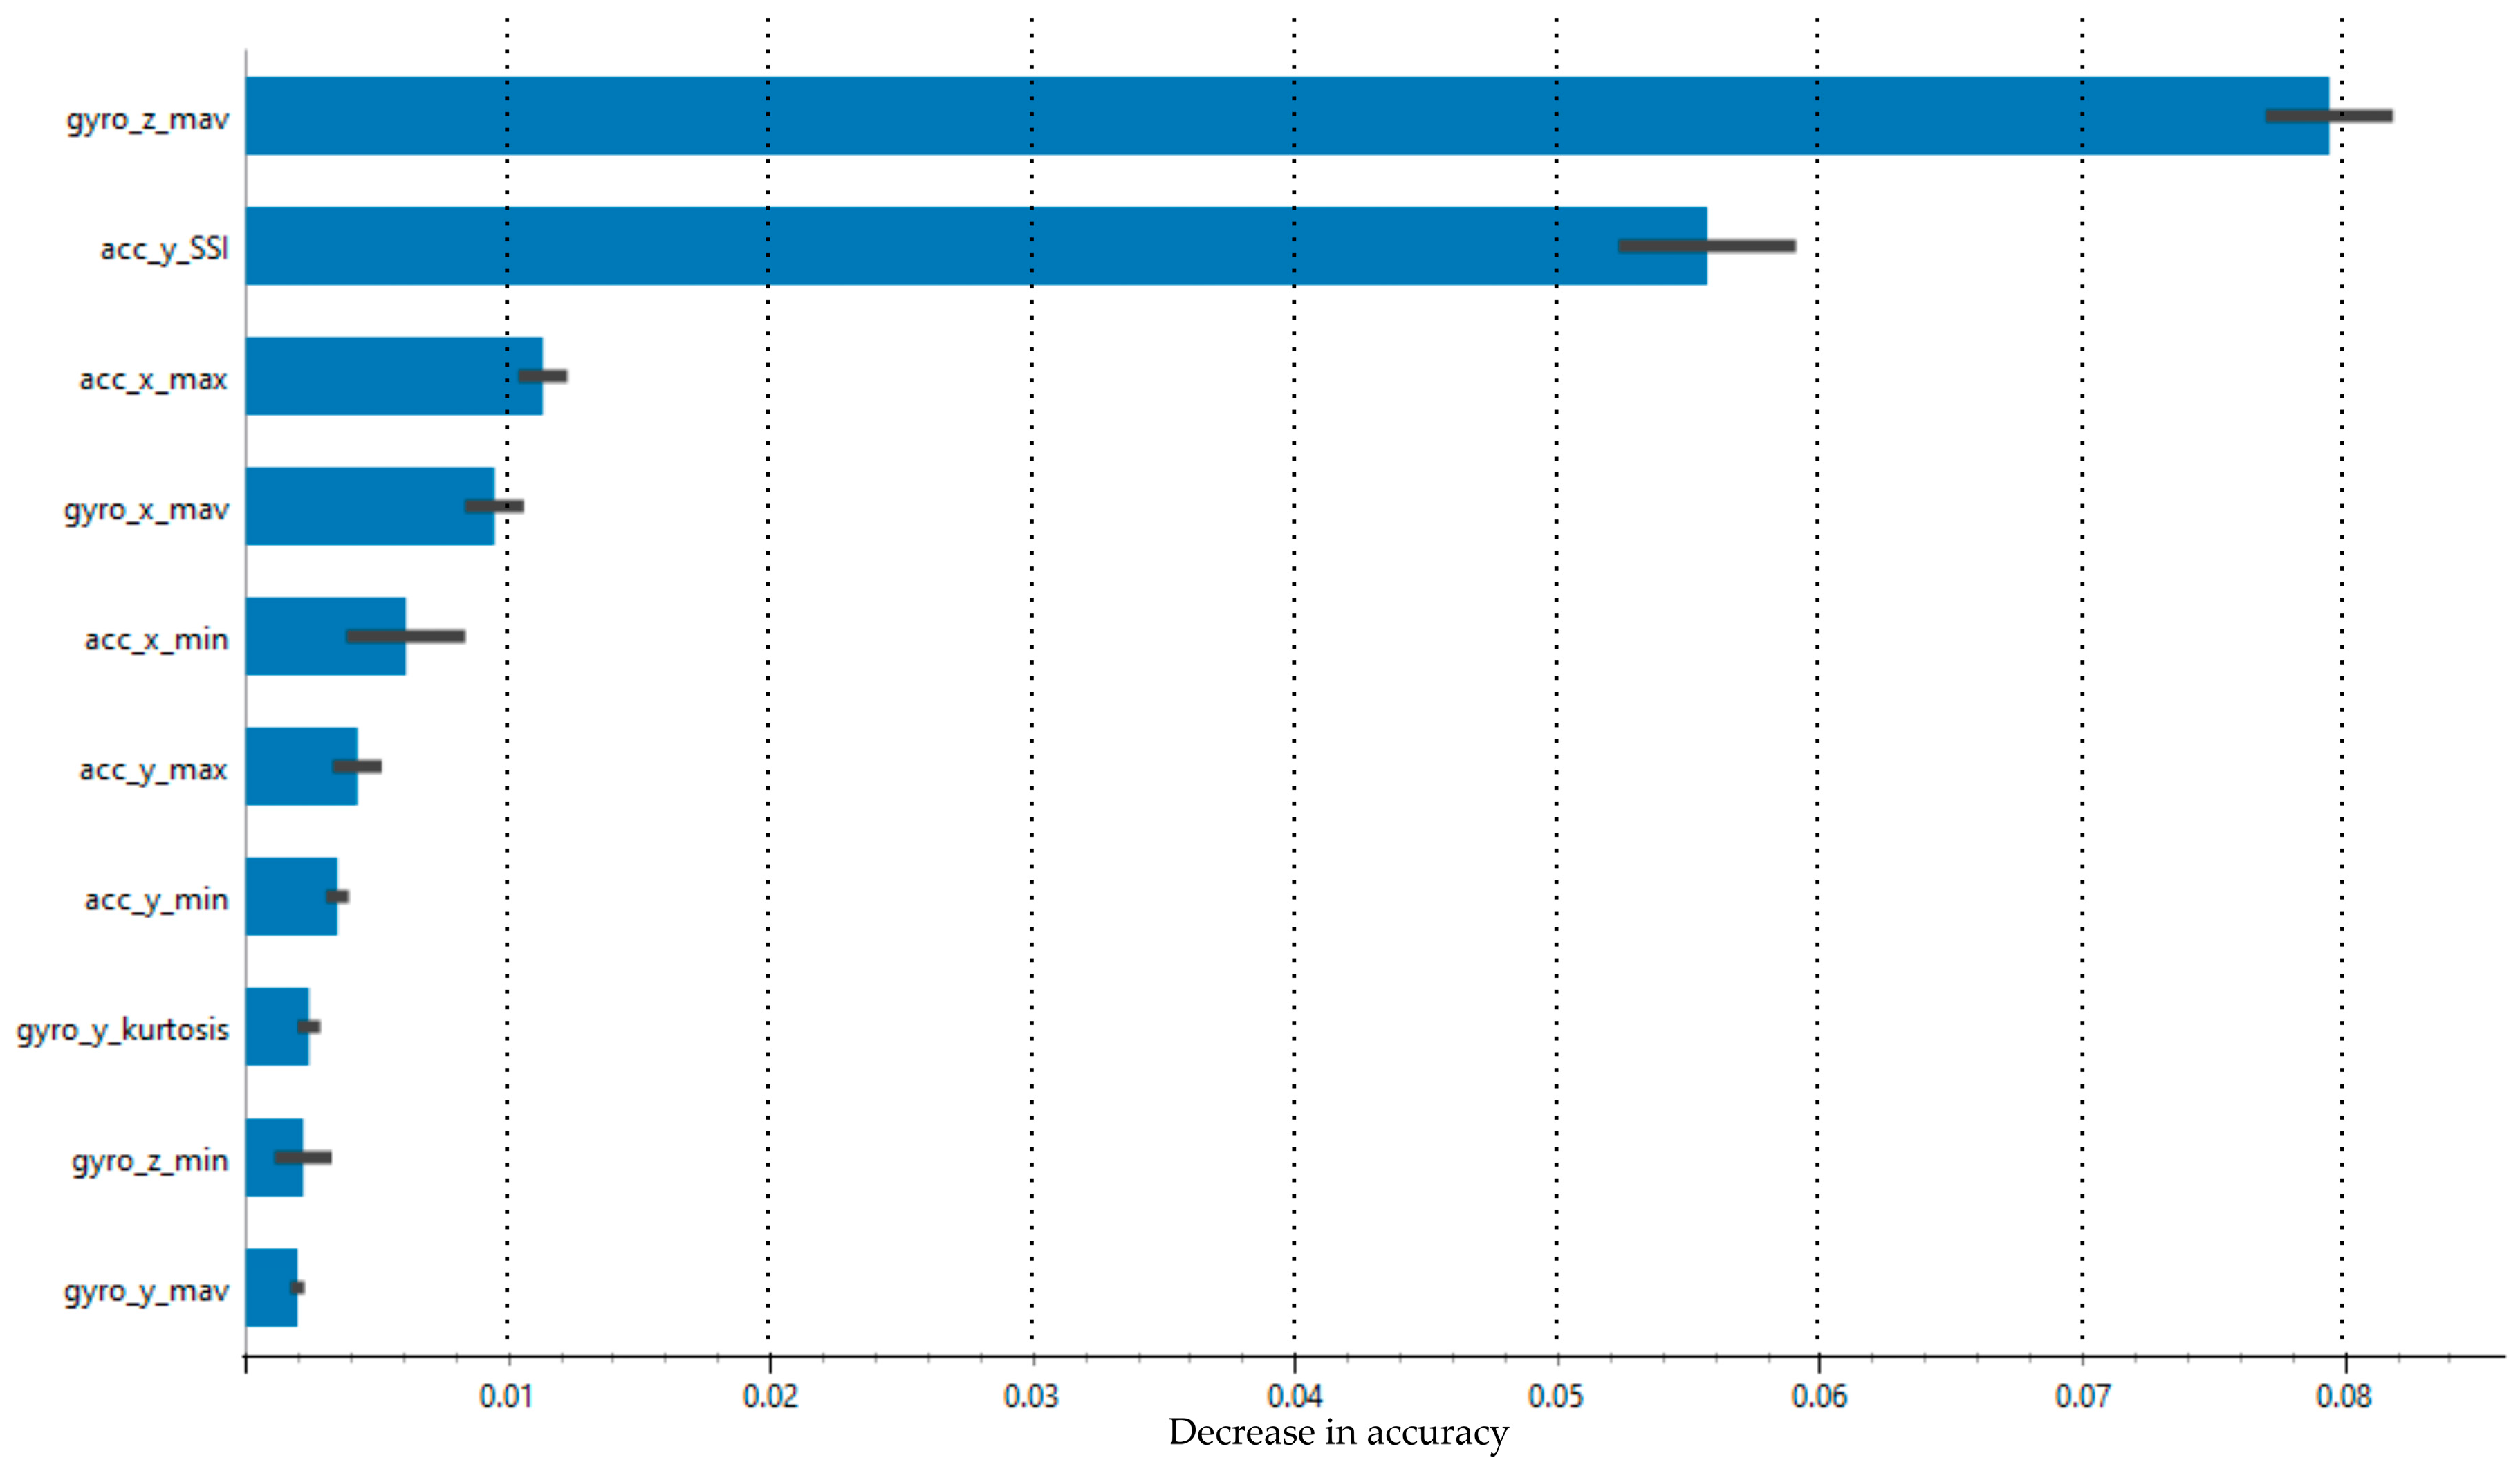
Figure 9.
SHAP values on standing still class.
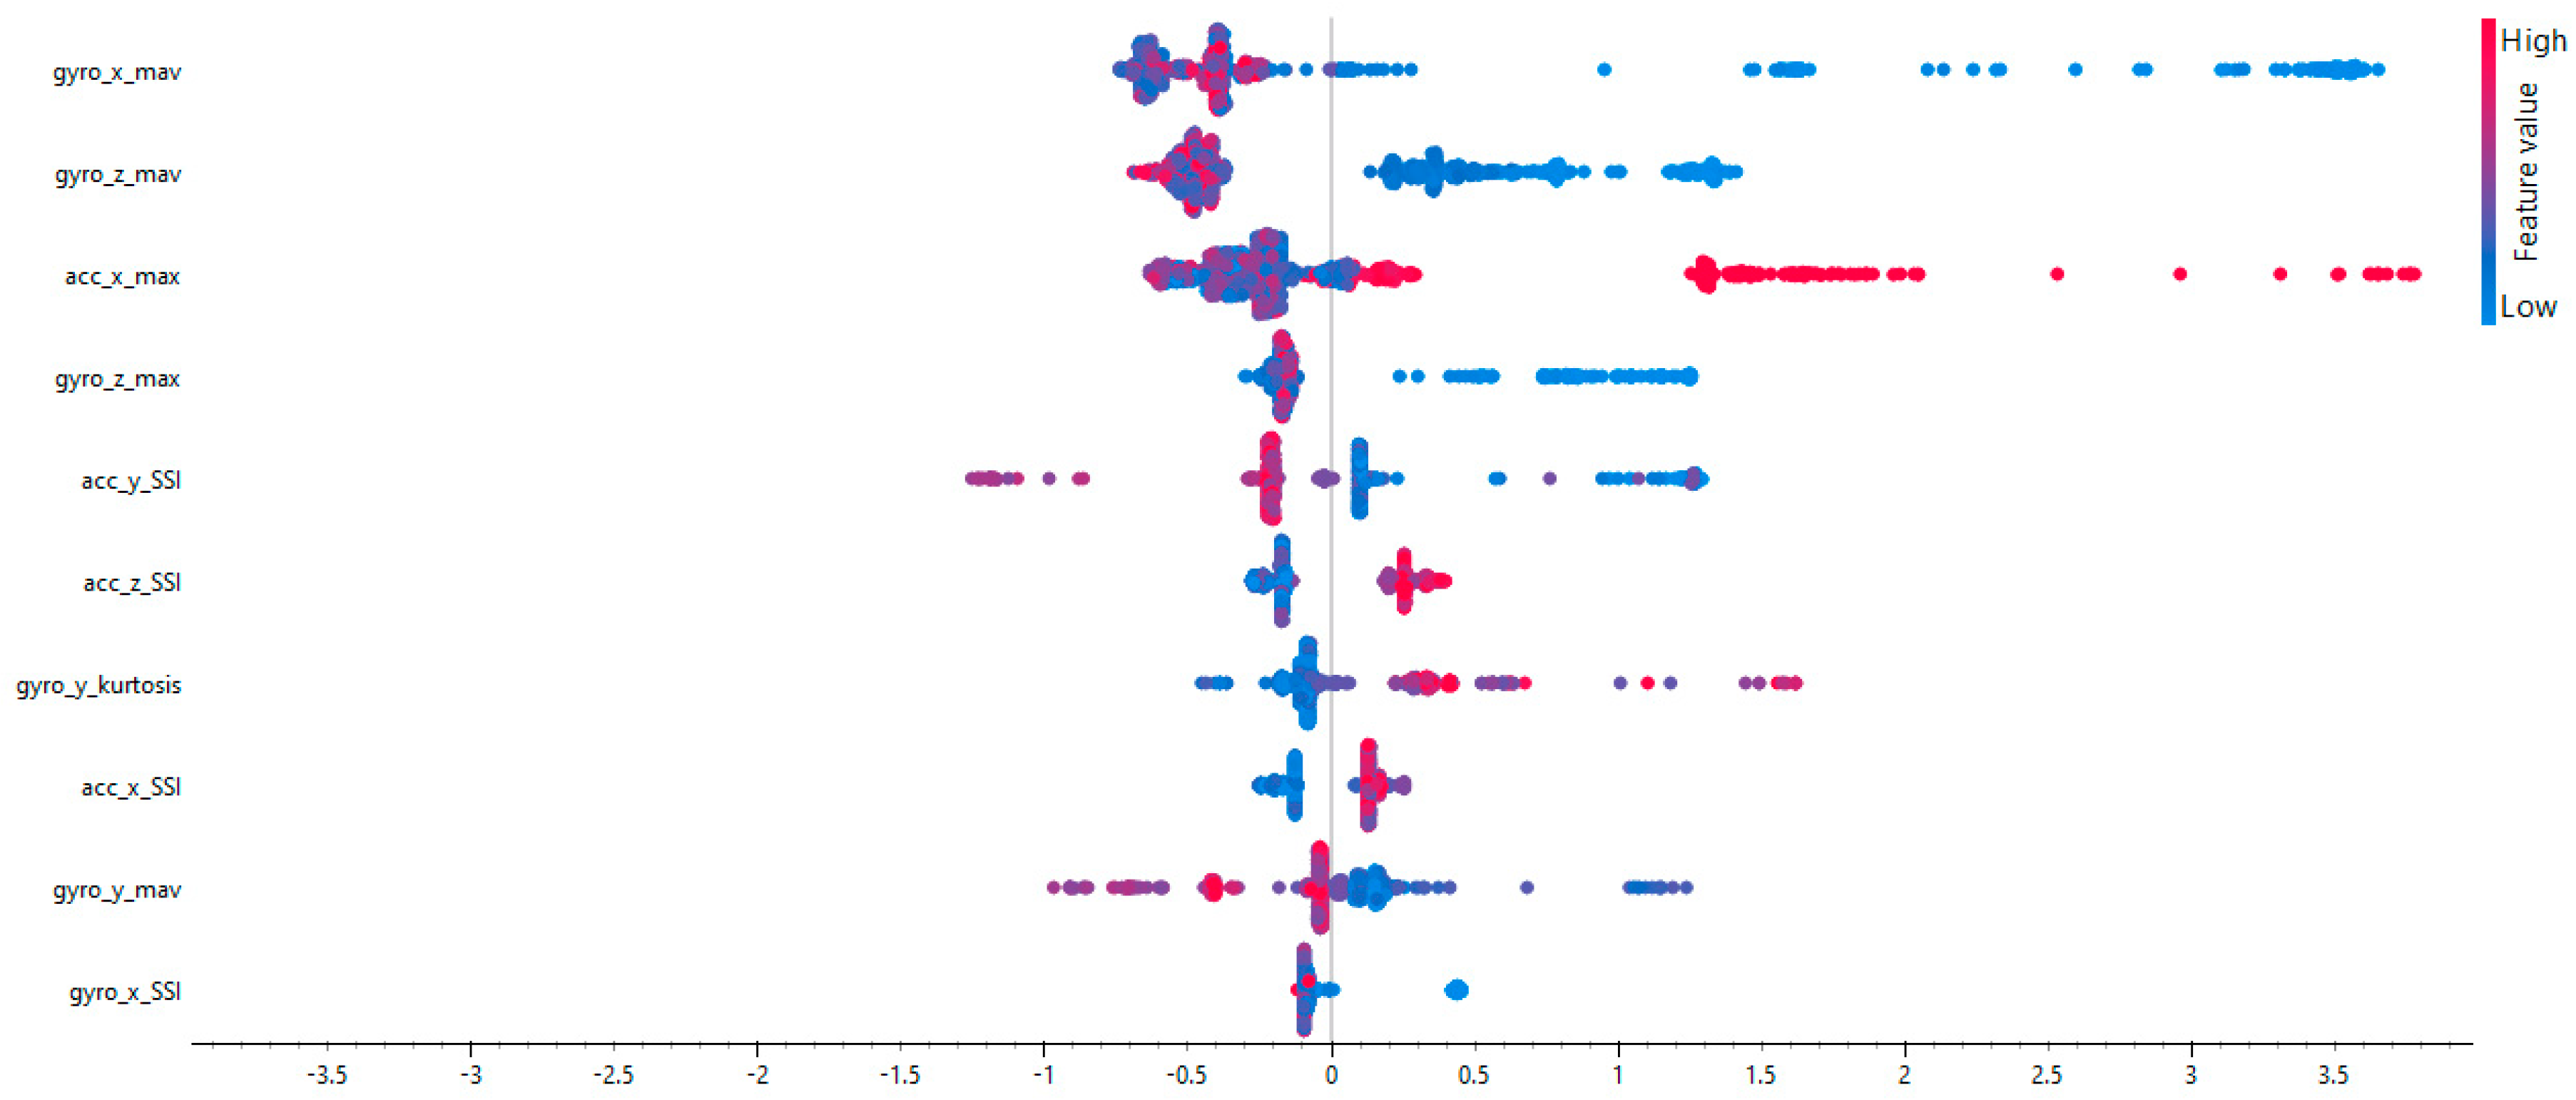
Figure 10.
SHAP values on passing class.
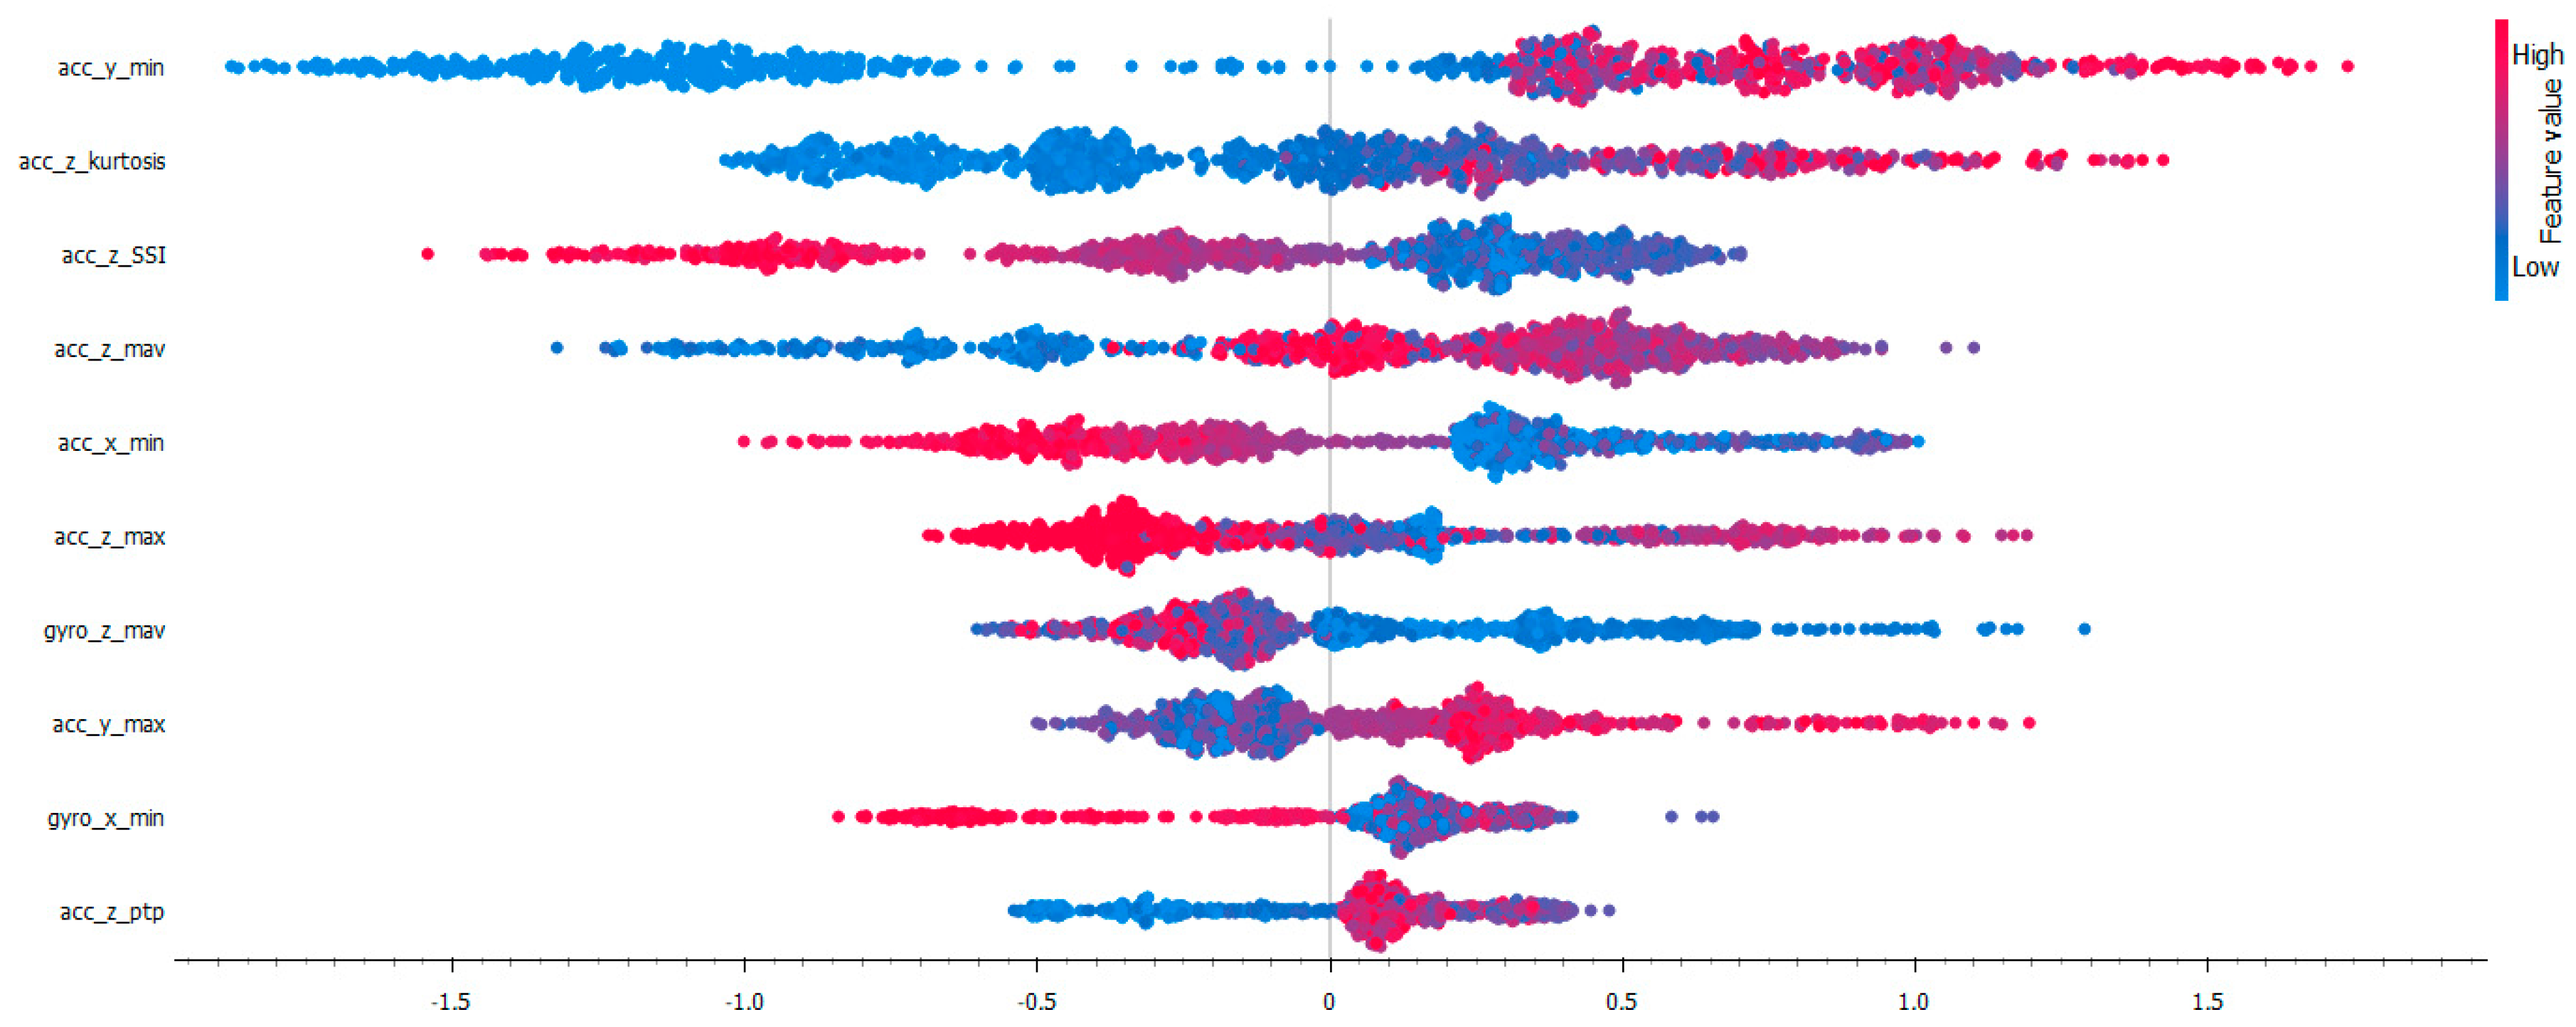
Figure 11.
SHAP values on shooting class.
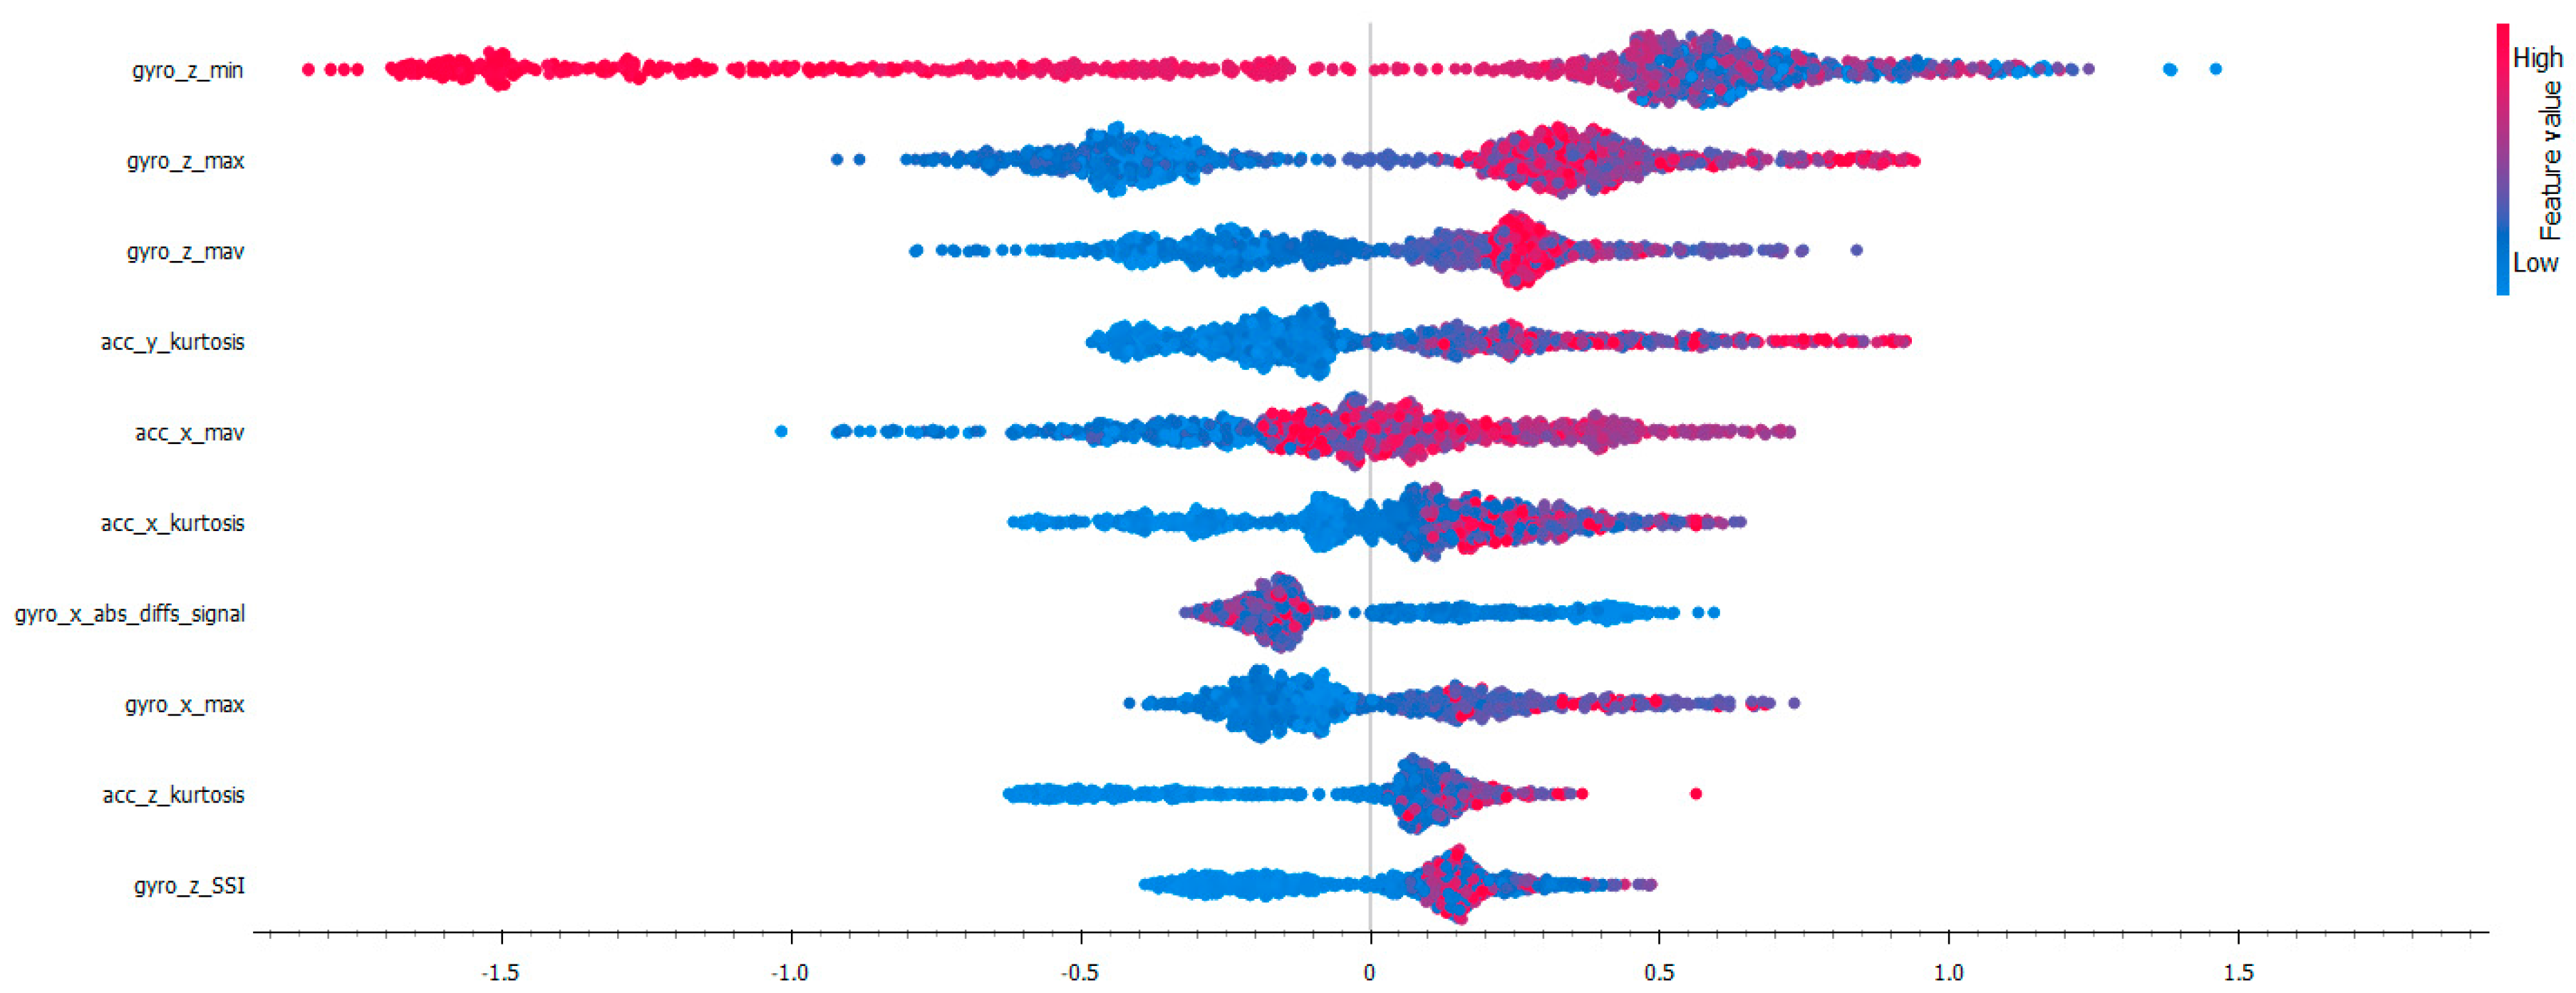
Figure 12.
SHAP values on dribbling class.
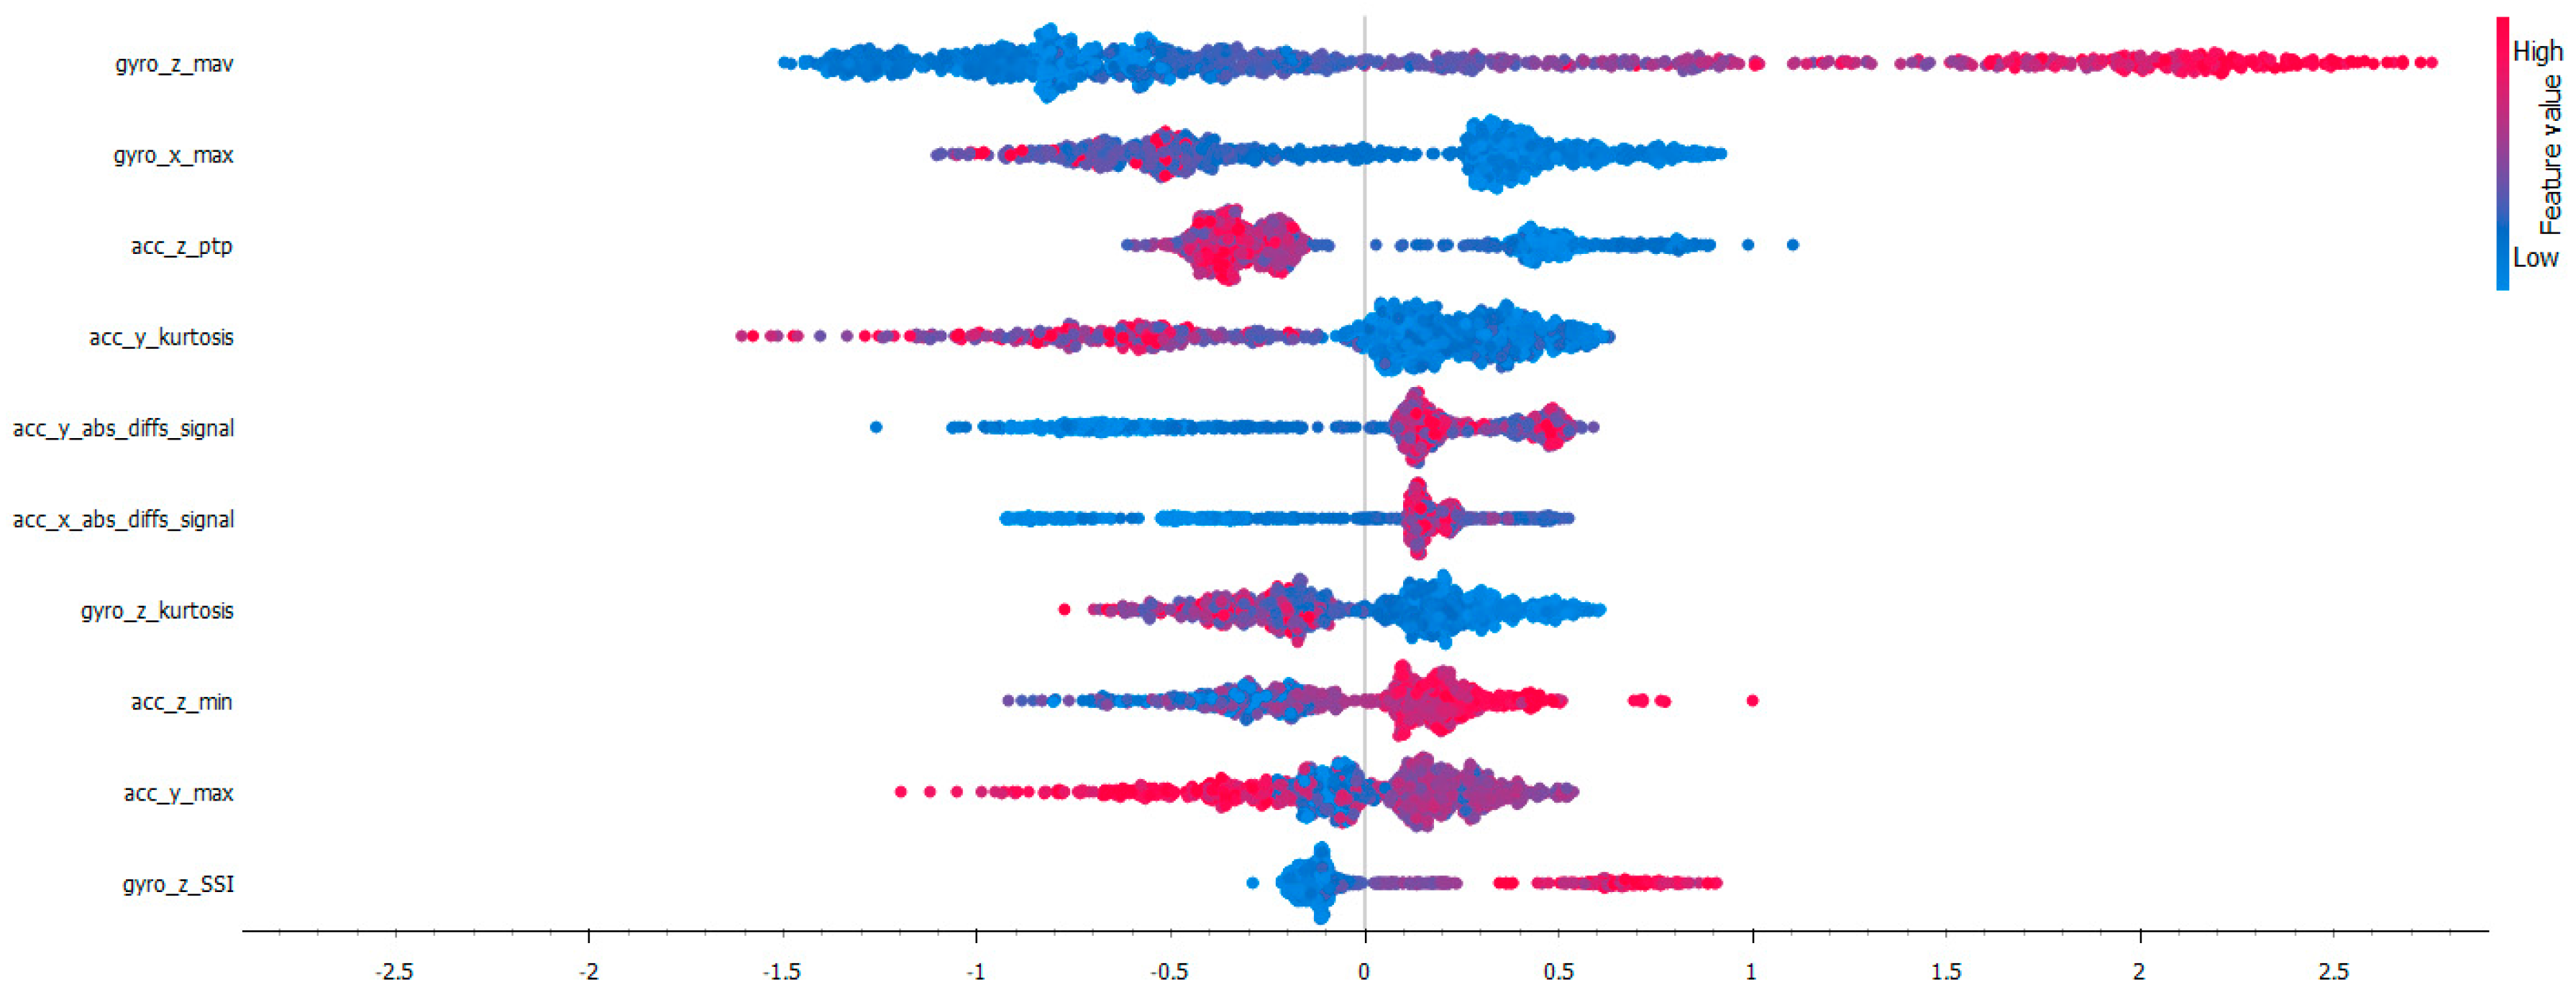
Figure 13.
SHAP values on jumping class.
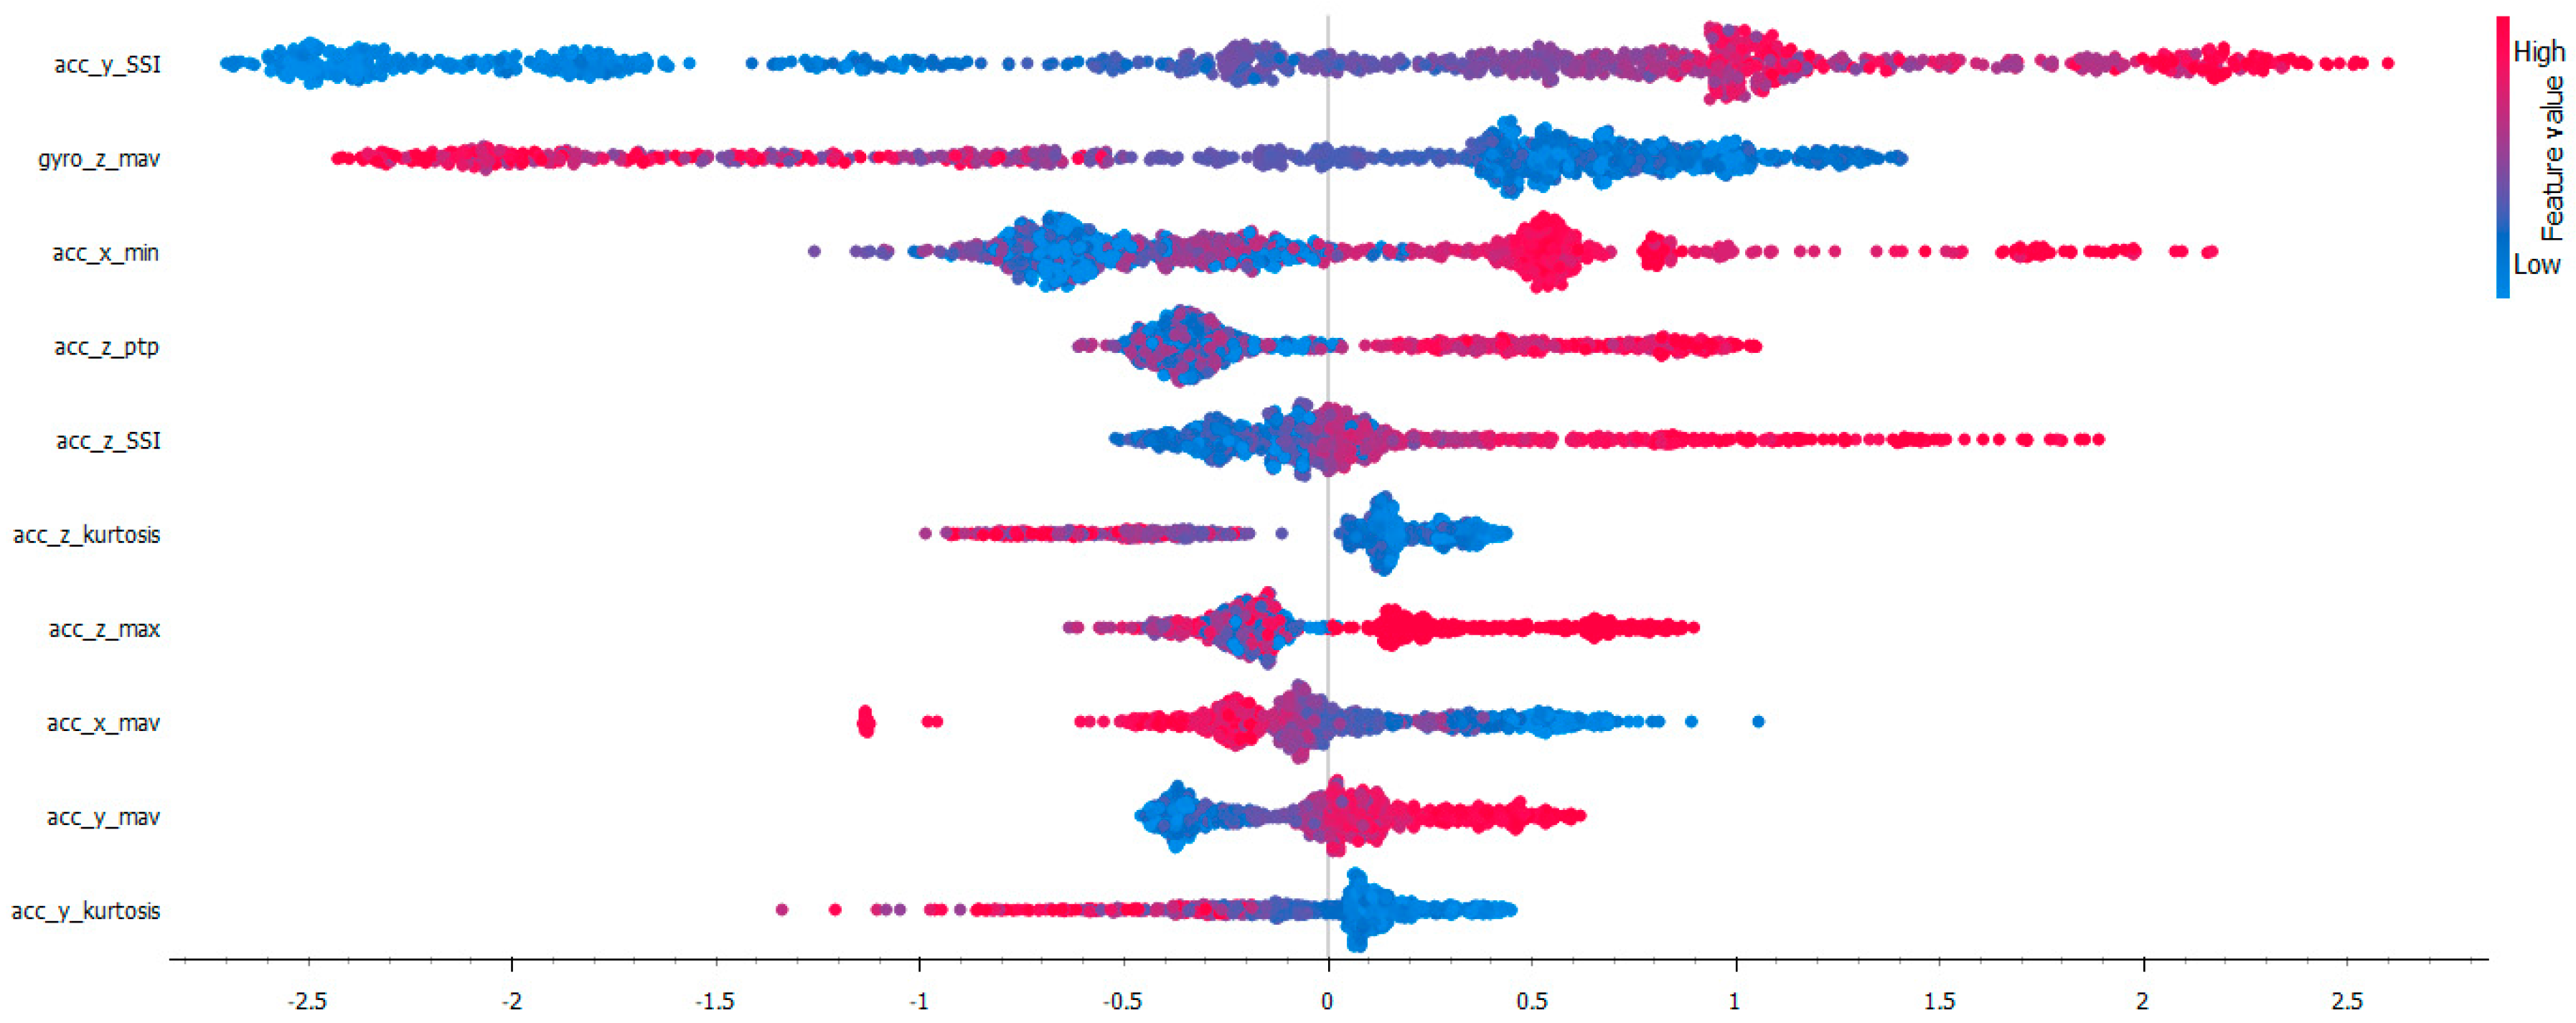

Table 1.
Features and Equations.
| Feature Name | Variable Abbreviation | Equation |
|---|---|---|
| Minimum | min | Min(x)=min(x1, x2,...xn) |
| Maximum | max | Max(x)=max(x1, x2,...xn) |
| Peak to Peak | ptp | PP(x)= max(x1, x2,...xn)- min(x1,x2,...xn) |
| Simple Square Integral | SSI | |
| Root Mean Square | rms | |
| Absolute Differences | abs_diffs_signal | |
| Mean Absolute | mav | |
| Skewness | skewness | |
| Kurtosis | kurtosis |
Table 2.
Performance Metrics.
| Metric | Equation |
|---|---|
| Accuracy | |
| Precision | |
| Recall | |
| F1-Score |
Table 3.
Accuracy of Machine Learning Algorithms According to Sliding Window Size and Hop Overlap Values.
Table 3.
Accuracy of Machine Learning Algorithms According to Sliding Window Size and Hop Overlap Values.
| Window Size | Window Hop Overlap Percentage | KNN | DT | RF | AdaBoost | XGBosst |
|---|---|---|---|---|---|---|
| 100 | 75 | 0.629 | 0.857 | 0.931 | 0.411 | 0.957 |
| 100 | 50 | 0.597 | 0.774 | 0.858 | 0.432 | 0.877 |
| 100 | 25 | 0.591 | 0.771 | 0.854 | 0.521 | 0.878 |
| 100 | 0 | 0.601 | 0.764 | 0.899 | 0.448 | 0.896 |
| 150 | 75 | 0.688 | 0.872 | 0.932 | 0.435 | 0.965 |
| 150 | 50 | 0.633 | 0.815 | 0.901 | 0.529 | 0.93 |
| 150 | 25 | 0.593 | 0.802 | 0.837 | 0.663 | 0.864 |
| 150 | 0 | 0.62 | 0.755 | 0.844 | 0.484 | 0.865 |
| 200 | 75 | 0.675 | 0.873 | 0.924 | 0.483 | 0.958 |
| 200 | 50 | 0.688 | 0.84 | 0.948 | 0.573 | 0.962 |
| 200 | 25 | 0.609 | 0.823 | 0.891 | 0.484 | 0.88 |
| 200 | 0 | 0.639 | 0.722 | 0.875 | 0.306 | 0.882 |
| 250 | 75 | 0.727 | 0.897 | 0.957 | 0.492 | 0.966 |
| 250 | 50 | 0.701 | 0.879 | 0.922 | 0.554 | 0.935 |
| 250 | 25 | 0.61 | 0.838 | 0.922 | 0.519 | 0.922 |
| 250 | 0 | 0.647 | 0.828 | 0.879 | 0.517 | 0.914 |
Table 4.
Accuracy Change in XGBoost Hyperparameters.
| Hyperparameter | Value | Median | Q1 | Q3 |
|---|---|---|---|---|
| Number of Estimators | 100 | 0.941 | 0.925 | 0.949 |
| 150 | 0.951 | 0.933 | 0.957 | |
| 200 | 0.955 | 0.935 | 0.961 | |
| Learning Rate | 0.01 | 0.919 | 0.902 | 0.929 |
| 0.05 | 0.947 | 0.943 | 0.955 | |
| 0.1 | 0.959 | 0.955 | 0.961 | |
| Maximum Depth | 3 | 0.941 | 0.902 | 0.949 |
| 4 | 0.949 | 0.921 | 0.957 | |
| 5 | 0.955 | 0.937 | 0.959 | |
| Minimum Child Weight | 1 | 0.947 | 0.929 | 0.959 |
| 2 | 0.945 | 0.931 | 0.957 | |
| 3 | 0.945 | 0.927 | 0.955 | |
| Subsample | 0.6 | 0.945 | 0.925 | 0.957 |
| 0.7 | 0.947 | 0.931 | 0.959 | |
| 0.8 | 0.945 | 0.929 | 0.957 |
Table 5.
Action Recognition in Basketball.
| Reference | Number of Wearable and Placement | Actions | Performance |
|---|---|---|---|
| [9] | 5 sensors worn to back, lower legs and feet | Player Identity, Shot Types | Accuracy:0.985 |
| [15] | 1 sensor worn to wrist | Dribbling, Shooting, Blocking, Passing | Accuracy: 0.875 |
| [16] | 1 sensor worn to wrist, foot, waist | Player Level Classification | Accuracy: 0.847 |
| [17] | 39 sensors worn to upper body | Shooting, Passing, Dribbling, Lay-up | Precision: 0.984Recall: 0.983Specificity: 0.994 |
| [18] | 4 sensors worn to foot opposite to the shooting hand, lower back, upper back, shooting hand | 34 different exercises | Recall:0.975 Precision: 0.980 |
| [19] | 2 sensors worn to wrists | Low Dribbling, Crossover Dribbling, High Dribbling, Jump Shot | Accuracy: 0.816 |
| [20] | 2 sensors worn to wrist, foot, waist | Various Basketball Movements | Accuracy: 0.993 |
| [21] | 1 sensor worn to wrist | Dribbling, shot, pass, rebound, layup, walking, running, standing, sitting | F1-score: 0.24 |
| [22] | 1 sensor worn to wrist | Basketball Stances | Accuracy:0.994 |
| Purposed System | 1 sensor worn to back | Dribbling, Shooting, Passing, Lay-up, idle | Accuracy: 0.969 |
Disclaimer/Publisher’s Note: The statements, opinions and data contained in all publications are solely those of the individual author(s) and contributor(s) and not of MDPI and/or the editor(s). MDPI and/or the editor(s) disclaim responsibility for any injury to people or property resulting from any ideas, methods, instructions or products referred to in the content. |
© 2024 by the authors. Licensee MDPI, Basel, Switzerland. This article is an open access article distributed under the terms and conditions of the Creative Commons Attribution (CC BY) license (http://creativecommons.org/licenses/by/4.0/).
Copyright: This open access article is published under a Creative Commons CC BY 4.0 license, which permit the free download, distribution, and reuse, provided that the author and preprint are cited in any reuse.


