
Submitted:
02 November 2023
Posted:
02 November 2023
You are already at the latest version
Abstract
(1) Background: The analysis of athletic performance has always aroused great interest from sport scientist. This study utilized machine learning methods to build predictive models using a comprehensive CrossFit (CF) dataset, aiming to reveal valuable insights into the factors influencing performance and emerging trends.; (2) Methods: The study used Random Forest (RF) and Multiple Linear Regression (MLR) models to predict performance in four key weightlifting exercises within CF: clean & jerk, snatch, back squat, and deadlift. Performance was evaluated using R-squared (R2) values and Mean Squared Error (MSE). Feature importance analysis was conducted using RF, XGBoost, and AdaBoost models.; (3) Results: The RF model excelled in deadlift performance prediction (R2 = 0.80), while the MLR model demonstrated remarkable accuracy in clean & jerk (R2 = 0.93). Across exercises, clean & jerk consistently emerged as a crucial predictor. The feature importance analysis revealed intricate relationships among exercises, with gender significantly impacting deadlift performance.; (4) Conclusions: This research advances our understanding of performance prediction in CF through machine learning techniques. It provides actionable insights for practitioners, optimize performance, and demonstrates the potential for future advancements in data-driven sports analytics.
Keywords:
machine learning
; crossfit
; sport analytics
; weightlifting
; performance prediction
1. Introduction
CrossFit® (CF) is a conditioning and training program that has garnered recognition and piqued the interest of the physically active population. Initially designed for military training, it has gradually gained popularity among civilians. This program is founded on a series of intricate exercises encompassing running, weightlifting, Olympic gymnastics, and ballistic movements [1]. The rapid rise in the popularity of the training program has also generated increased scientific interest over the past decade [2].
Training is organized into daily sessions referred to as ‘workouts of the day’ (WODs). These sessions encompass a variety of exercise modalities, including calisthenics (such as pull-ups, muscle-ups, and burpees), metabolic conditioning (involving cardiovascular exercises like running and rowing), and weightlifting [3]. The weightlifting component covers both Olympic movements, including the snatch and clean and jerk, as well as powerlifting movements, such as the squat, bench press, and deadlift [4,5]. This comprehensive approach has resulted in notable physical conditioning improvements, and the number of practitioners has significantly increased in recent years, with over 15,000 affiliates worldwide [6,7].
Numerous studies have been conducted in the field of CF. Several systematic reviews have demonstrated that CF workouts exhibit consistent anaerobic and aerobic characteristics, leading to significant metabolite accumulation, such as elevated blood lactate concentrations ranging from 6 to 18 mmol/L. These workouts also result in increased markers of muscle damage, including Creatine-phosphokinase (CPK), interleukin-6 (IL-6), and IL-10, as well as muscle fatigue, as evidenced by reduced countermovement jump (CMJ) values, mean power output (MPO), and plank time [8,9,10,11].
Furthermore, multiple studies have delved into examining the physiological adaptations resulting from CF training, particularly within the cardiovascular, respiratory, and muscular systems. These investigations have revealed associations between various factors, including body mass [12], strength and anaerobic power [12,13,14,15,16], aerobic capacity [9], sport-specific skill [14,16], and experience [15], and both CF workout performance and competitive ranking. These findings collectively suggest that athletes must focus on training across these diverse attributes to excel in competition [17].
Furthermore, there is a discernible upswing in contemporary research efforts dedicated to the intricate scrutiny and prognostication of CrossFit (CF) performance. One such study, conducted by a small group of 16 participants, involved them performing CF and analyzing the data to predict performance [18]. Additionally, other studies, as indicated in, focused on predicting performance by gathering surveys regarding participants’ athletic experiences and physical fitness [19,20].
However, it’s important to note that these studies employed very limited sample sizes. These smaller datasets possess limitations when it comes to predicting results, as they may be influenced by external environmental factors and individual characteristics.
The amelioration of these limitations and the accurate prediction of objective CF performance necessitate the utilization of comprehensive big data analysis. The significant potential of big data in the realm of sports is already undergoing validation across a diverse spectrum of athletic disciplines [21].
Unlike previous research, we harness the power of machine learning techniques, specifically designed for handling extensive datasets. Machine learning is a burgeoning field at the intersection of computer science and statistics. It empowers algorithms to learn patterns and make predictions from data.
The validity of employing big data analysis using machine learning is underscored by its remarkable success in predicting sports performance across various events [22,23,24]. Machine learning techniques have revolutionized our ability to glean meaningful insights from vast datasets. Their application in sports analytics has demonstrated impressive accuracy, and they have the potential to uncover nuanced relationships in CF performance data that traditional approaches might overlook.
To the best of our knowledge, no previous work has explored CF performance prediction using the big dataset (over 400,000 datas), which we have leveraged for our research. This study builds upon the limited sample sizes of previous research by harnessing the power of big data analysis and machine learning techniques. Furthermore, the insights gained from this study can serve as a foundation for evidence-based training programs tailored for CF athletes, aiming to maximize their physical capabilities while minimizing injury risks.
In this study, our research methodology employs machine learning techniques, specifically Random Forest (RF) and Multiple Linear Regression (MLR), to develop predictive models. These models will be instrumental in forecasting CF performance. Additionally, we will utilize feature importance analysis to evaluate the significance of various attributes in influencing performance outcomes. This approach allows us to gain insights into the key factors that contribute to an athlete’s success in CF, advancing our understanding of performance determinants in this context.
The primary objective of this research is to leverage machine learning techniques to construct a robust performance prediction model using the CF athlete dataset. This model’s primary goal is to provide accurate forecasts and insights into specific aspects of CF performance, as detailed in the subsequent sections of this paper
2. Materials and Methods
Figure 1 illustrates the data processing workflow, encompassing raw data processing, data preprocessing, exploratory data analysis (EDA), model learning, evaluation, and the derivation of final data-driven products.
2.1. Data Preprocessing and Exploratory Data Analysis
To better understand the characteristics and performance of CF athletes, a comprehensive dataset has been collected from competitions and events around the world. By analyzing the data, we can identify trends and patterns that may be associated with higher levels of performance, such as age, gender, training volume, and exercise selection.
We utilized the Kaggle dataset [25], an open-source data repository, which contains an extensive collection of athlete data. This dataset encompasses essential athlete demographics, including age, gender, and training experience, in addition to performance metrics such as time, weight lifted, and repetitions completed. Notably, the dataset encompasses a wide range of CF events and competitions, providing a wealth of information on athlete performance in various contexts and settings. In its entirety, the dataset comprises 423,006 rows and 27 columns.
From the initial dataset consisting of 27 columns, we meticulously curated a subset of 12 columns to form the foundation for our performance prediction model. This process involved deliberately removing columns unrelated to performance, such as ID, name, team, and affiliates. The selected subset encompasses a wide range of factors, including crucial demographic variables like age, gender, height, and weight. Moreover, it encompasses performance metrics relevant to distinct exercise categories: ‘Strength’ exercises, comprising back squat and deadlift, ‘Power’ exercises, which include clean & jerk and snatch, and ‘Conditioning’ exercises, specifically fran and grace. Additionally, our dataset incorporates essential insights into the athlete’s environment and training experience, thereby offering a holistic perspective on the multifaceted determinants of CF performance.
In our demographic data preprocessing, we initially considered only adults over 18 years of age and removed data entries that did not specify gender (non-male/female). Furthermore, we selected heights within the range of 4 to 8 feet, excluding any outliers such as weights recorded as ‘1750lbs’ and ‘2113lbs’. In the processing of exercise movement data, we excluded records expressed as negative numbers and any entries that exceeded world records. Subsequently, to maintain uniformity and ensure appropriate scaling, we applied the standard scaler to all the records. Lastly, we categorized the training environment as ‘house’ or ‘gym’ and quantified training experience into five groups: less than 6 months, 6-12 months, 1-2 years, 2-4 years, and over 4 years. To ensure compatibility with the model, we further encoded these categorical variables into numeric format using one-hot encoding.
All of the methods utilized in this study, including data preprocessing and machine learning model training, were conducted within the open-source Python (Ver 3.9.12).
2.2. Predictiction Models
2.2.1. Random Forest (RF)
RF, a robust ensemble learning technique, capitalizes on the amalgamation of multiple decision trees to bolster predictive accuracy while mitigating overfitting. The essence of RF lies in the construction of numerous decision trees, each trained on distinct data subsets generated through bootstrapping. These individual trees collectively coalesce to form a "forest" of models. Notably, RF introduces an element of randomness in feature selection during the tree-building process, introducing an additional layer of diversity into the model. This diversity, coupled with the amalgamation of predictions from the individual trees, culminates in the development of a highly accurate and resilient predictive model. [26].
In the context of predicting sports performance, RF has garnered considerable attention for its suitability and effectiveness [27]. CF performance is inherently multifaceted, influenced by a multitude of variables spanning physical attributes, athletic experience, location, and movement skills. The flexibility of RF allows it to accommodate this complexity, making it well-suited for modeling the intricate relationships between these variables and performance outcomes [28]. The advantages of RF include its ability to handle high-dimensional data, capture nonlinear relationships, and provide valuable insights into feature importance [29]. These attributes make RF an invaluable tool for CF performance prediction, enabling the development of models that not only deliver accurate forecasts but also shed light on the key factors influencing an athlete’s performance.
2.2.2. Multiple Linear Regression (MLR)
Multiple Linear Regression (MLR) is a robust statistical method employed for investigating intricate relationships between a dependent (response) variable and a multitude of independent (explanatory) variables. MLR serves as an extension of the fundamental concept of simple linear regression, which primarily addresses scenarios involving a single predictor variable, to scenarios marked by the presence of multiple predictors [30].
The utility of MLR transcends disciplinary boundaries, finding application in diverse domains encompassing public health and sports science [31,32,33]. It thrives in the modeling of intricate interactions among multiple variables and facilitates the generation of predictive models rooted in these intricate relationships. Notably, MLR contributes essential insights into the identification of pivotal independent variables that exert significant influence in elucidating the variances observed in the dependent variable.
As such, MLR serves as a fundamental tool for in-depth analysis. It enables us to meticulously explore intricate relationships within our domain of study, providing a structured approach to understanding the complex interactions among multiple variables.
2.3. Performance Metrics
To evaluate the performance of each algorithm, this study utilizes two metrics:
Where is the model’s prediction, is the true value, is the average true value, and n is the total number of predictions.
Mean Squared Error (MSE) is an estimator that measures average squared errors, R Squared (R2) is the percentage of the total variation in the dependent variable that is accounted for by the independent variable [34]. MSE serves as one of our primary performance metrics. It provides a valuable estimation by measuring the average squared errors within the model’s predictions [35]. The value of MSE is always positive. A value close to zero will represent better quality of the estimator/predictor (regression model).
Also, the R2 metric as the central tool for evaluating the effectiveness of our models in predicting CF performance. R2 quantifies the proportion of variance in the dependent variable explained by the independent variables in a regression model. It ranges from 0 (no explanatory power) to 1 (perfect fit), with higher values indicating a better model fit to the data. R2 is a standard measure for assessing model goodness of fit in regression analysis [36,37], aligning with our study’s objective of uncovering the predictive power of our models. Where is the model’s prediction, is the true value, is the average true value, and n is the total number of predictions.
2.4. Feature Importance Analysis
To gain insights into the significance of individual variables in shaping CF performance, we employed feature importance techniques.
2.4.1. Random Forest (RF)
RF facilitates the assessment of feature importance, aiding in the identification of key variables that significantly impact model performance [38]. Like the previous study, which employed feature importance for sports performance analysis, we intend to harness feature importance as a powerful tool to investigate the relationships between variables in our quest to comprehend and predict CF performance [39]. By utilizing feature importance, we aim to unveil the influence of individual variables and their significance in shaping performance outcomes. This approach capitalizes on the flexibility, interpretability, and exceptional predictive capabilities inherent to the RF model, enhancing the depth of our insights into CF performance dynamics.
2.4.2. Extreme Gradient Boosting (XGBoost) and Adaptive Boosting (AdaBoost)
These two boosting algorithms adopt an iterative approach to model building, aiming to enhance overall accuracy while enabling us to pinpoint pivotal variables that play a substantial role in influencing sports performance. They are notably popular choices for predicting sports performance with diverse sets of variables due to their ability to capture complex relationships within the data [40,41].
XGBoost is celebrated for its robustness and exceptional predictive capabilities. This algorithm functions by iteratively training a sequence of decision tree models, with each tree focusing on rectifying the prediction errors of the previous one. By aggregating these so-called "weak learners," XGBoost constructs a formidable predictive model renowned for its proficiency in capturing intricate patterns and relationships within the data. Within the context of CF performance prediction, XGBoost empowers us to delve deep into the complex dependencies that exist between various factors and performance outcomes. Moreover, its adaptability and capability to handle missing data significantly augment our feature importance analysis [42]
On the other hand, AdaBoost stands out for its aptitude in refining predictive models. This technique operates through the sequential training of a series of weak learners, with each learner being assigned more weight to instances that were previously misclassified. This iterative process revolves around enhancing the model’s accuracy while pinpointing influential variables. In our study, AdaBoost seamlessly complements our approach by accentuating the significance of specific features in predicting performance outcomes. Furthermore, its adaptability and prowess in addressing data imbalances serve to deepen and reinforce the reliability of our feature importance analysis [43].
In summary, our approach integrates RF and MLR models to predict CF performance, while feature importance techniques (RF, XGBoost, and AdaBoost) allow us to uncover the key variables driving performance outcomes. This methodological framework equips us with the tools needed to understand and forecast the multifaceted nature of CF performance effectively.
3. Results
This section describes the results achieved by machine learning models. The first step in Section 3.1 is the presentation of performance prediction, and the next part in Section 3.2 is devoted to the analysis of feature importance.
3.1. Prediction Model
In our pursuit of a comprehensive analysis of CF performance prediction, we applied both RF and MLR models to predict the performance outcomes of four key weightlifting exercises: clean & jerk, snatch, back squat and deadlift. Our analysis will emphasize the utilization of R-squared (R2) values and Mean Squared Error (MSE) as key performance metrics for each exercise.
The performance has been improved by RF and MLR approaches in terms of R2 and MSE values (Table 1). In particular, the random forest yielded the best result in the deadlift of testing datasets. Our examination of deadlift performance revealed that the RF model excelled, delivering the most promising outcomes across the various testing datasets. Specifically, an R2 value of 0.80 for deadlift showcases the model’s capacity to proficiently elucidate approximately 80% of the variability within deadlift scores. In essence, this indicates that our model effectively accounts for the majority of fluctuations in deadlift performance, leveraging the selected features or predictor variables. Such robust predictive prowess reaffirms the model’s competence in estimating deadlift performance.
In contrast, our evaluation of clean & jerk, snatch, and back Squat unveiled a noteworthy distinction. The MLR model exhibited a slightly superior R2 value, especially notable in clean & jerk performance. Here, an exceptional R2 value of 0.93 signifies the model’s ability to expound upon an impressive 93% of the variability inherent in clean & jerk performance. This result unequivocally positions the MLR model as the preeminent performer among the four exercises scrutinized.
In summation, our research underscores the formidable predictive capabilities of both MLR and RF models within the contours of our dataset, thoughtfully leveraging 11 pertinent features, as elucidated previously.
3.2. Feature Importances
This is summarizing the results of the ranked feature importance from the RF, XGBoost, and AdaBoost, as well as their combination (Table 2). Among a total of 11 features, the top three with the highest importance values were shown. These findings highlight the significance of various features in predicting performance across a range of exercises.
In clean & jerk, all results of three model indicated that snatch possessed the highest importance value, followed by back squat, and deadlift. Specifically, in snatch, clean & jerk showed the highest importance value at 0.889. This underscores the substantial impact of clean & jerk on snatch performance. Additionally, Clean & Jerk showed the highest importance value in back squat (0.498). For deadlift, back squat was identified as the primary predictor with the highest importance value of 0.605, followed by clean & jerk and gender.
Collectively, these findings emphasize the intricate interplay among individual exercises and their substantial influence on performance outcomes. They also highlight the importance of understanding how distinct exercises interact and influence one another within the context of performance prediction.
The feature importance bar graph plot based on RF, XGBoost and AdaBoost modeling is shown in Figure 2. The features are sorted based on their importance. Among a total of 11 features, variables are displayed in the order of highest feature importance.
The RF and XGBoost results indicated that snatch possessed the highest importance value, followed by back squat, deadlift, gender, and grace. Likewise, the AdaBoost results indicated that snatch possessed the highest importance value. By averaging the values obtained from the three models, snatch exhibited the highest importance value, followed by back squat, deadlift, gender, and grace in clean & jerk (Figure 2a–c).
In the case of snatch, clean & jerk consistently exhibited the highest importance values across all three models, registering values of 0.901, 0.920, and 0.848, signifying a robust correlation between these two exercises (Figure 2d–f).
In the back squat, feature importance demonstrated notably lower values compared to the weightlifting exercise (clean & jerk and snatch). Moreover, the distinctions between the first and second highest values were marginal. The RF results indicated that clean & jerk possessed the highest importance value, and unlike other models, weight was the third highest. However, the results of the other two models indicate that snatch has the third-highest importance value (Figure 2g–i).
In the deadlift, the backsquat showed the highest importance value in all three models, followed by grace, clean & jerk, and weight in RF, and clean & jerk and gender in the other two models (Figure 2j–l). Overall, there were 11 different features, but all three models showed similar pattern of feature importance in the four exercises.
To summarize, the CF prediction model, utilizing both RF and MLR, demonstrated outstanding performance across all four weightlifting exercises. Additionally, the significance of each variable was thoroughly confirmed through feature importance analysis employing RF, XGBoost and AdaBoost models.
4. Discussion
This study aims to bridge these gaps by conducting a comprehensive analysis of CF performance data using machine learning techniques. The importance of this research extends to its potential to offer fresh insights and implications for enhancing training thresholds, developing injury prevention strategies, and optimizing overall CF performance. Our dataset comprises a substantial repository of over 400,000 data points, further enriching the depth and breadth of our analysis.
Our study employed RF and MLR models to predict performance in four CF weightlifting exercises: clean & jerk, snatch, back squat, and deadlift. Notably, clean & jerk emerged as a consistent predictor across these exercises. Furthermore, the feature importance analysis consistently unveiled specific patterns among different models for each exercise, affirming the relevance of particular features in predicting performance across the weightlifting exercises.
In this study, we employed two widely recognized predictive models, RF and MLR, commonly utilized in the field of sports analytics for their efficacy in predictive modeling [44,45]. Our evaluation, utilizing R2 values and MSE as performance metrics for each exercise, aligns with prior studies in sports analytics [46,47], indicating the widespread pursuit of effective predictive models in various athletic disciplines [48,49]. While our study focuses on weightlifting exercises within CF, it’s important to recognize the broader context of predictive modeling in sports. For instance, RF demonstrated remarkable predictive capabilities in deadlift performance (R2 = 0.80), in line with findings from previous sports analytics studies emphasizing RF’s proficiency in predictive modeling [50]. Conversely, our analysis revealed that clean & jerk, snatch, and back squat performance prediction benefited from the MLR, with particularly noteworthy results in clean & jerk (R2 = 0.93), signifying an exceptionally high level of accuracy and reliability in predicting this exercise. Notably, an R2 value of 0.93 implies that our model can explain approximately 93% of the variability in clean & jerk performance, underlining its robust predictive capabilities. A study in sports analytics also underscored the significance of the MSE metric, reinforcing the importance of appropriate metrics and models for predictive analysis [51]. These parallels across different sports highlight the broader relevance of our research in the realm of sports analytics. Notably, our study represents the first attempt at performance prediction using CF big data.
In addition to achieving highly accurate predictions for these performance outcomes, it is imperative to address questions like "Why did the model make this weightlifting exercise prediction?" Thus, the need arises for providing high-quality, interpretable, and comprehensible explanations for a model’s predictions in sports, utilizing feature importance. Indeed, feature importance plays a pivotal role in delivering detailed explanations of machine learning models in sports [52,53].
Our feature importance analysis, conducted through RF, XGBoost, and AdaBoost models, provides valuable insights into the determinants of performance across various exercises. Our results consistently highlight clean & jerk as a primary predictor across exercises, aligning with previous findings that reported significant correlations between back barbell squats and clean and jerk one-repetition maximum (1 RM) (r2 = 0.83, 0.84, and 0.83, respectively) [54,55]. Additionally, another study observes very strong relationships between maximum strength measured by 1 RM back squats and competitive weightlifting performances [56]. These findings align with our results and collectively emphasize the significance of specific weightlifting exercises in predicting overall performance.
For clean & jerk, all three models consistently prioritize snatch as the feature with the highest importance value, followed by back squat. This underscores the significant correlation between snatch and clean & jerk, as highlighted in previous research that underscores the connection between power, speed, and agility in Olympic weightlifting, signifying shared fundamental mechanisms [57].
Conversely, in the context of back squat, the disparity between the highest and second-highest values is marginal. While RF ranks clean & jerk highest, other models place snatch in this position.
In the case of deadlift, back squat emerged as the feature with the highest importance value, while gender was notably ranked as the third in importance. This observation aligns with previous research that demonstrated significant differences between genders in terms of deadlift power and work output [58,59]. Notably, men exhibited greater average power and performed more work compared to women, corroborating the significance of gender in predicting deadlift performance.
Additionally, unlike clean & jerk and snatch, where a strong correlation was evident, snatch did not hold a high importance value in predicting deadlift performance. This trend is consistent with previous studies that reported no significant correlations between snatch or clean and jerk performance and deadlift performance [60,61]. Instead, the variance in snatch and clean and jerk performance was better explained by other factors such as overhead press and front squat performance. However, it’s important to note that speed, agility, and power performance, which are crucial in CF, rely on a combination of factors beyond foundational muscular strength abilities alone [62].
Overall, our feature importance analysis has illuminated the critical determinants of performance across diverse weightlifting exercises in CF. These insights significantly enhance our comprehension of how different exercises interact and collectively influence overall performance within the CF domain.
This study has several limitations. Firstly, self-entered subjective data in our dataset could introduce bias and inconsistency. Another limitation is the omission of external factors such as dietary habits, psychological factors, injuries and individual training regimens, which could influence CF performance but were not included in our dataset. These limitations may have influenced the results, introducing uncertainty and potential inaccuracies into our predictive models. Future research could benefit from more rigorous data collection methods, including validation of self-entered data and regular updates.
The insights gained from identifying the most crucial features for each exercise have practical applications for CF practitioners, coaches, and researchers. With this knowledge, practitioners can tailor their training programs to focus on the specific aspects that matter most for each exercise. Coaches can design more effective and personalized training regimens, optimizing their athletes’ performance potential. Moreover, understanding these key features can help in injury prevention by highlighting areas that may be more susceptible to strain or overuse.
For example, our study revealed that clean & jerk consistently played a pivotal role across different exercises. CF athletes and coaches can use this information to emphasize clean & jerk in their training routines, recognizing its significance in overall performance. Similarly, the prioritization of back squat in deadlift performance underscores the importance of lower body strength, which can guide targeted strength training exercises.
In conclusion, this research not only advances our understanding of performance prediction in CF through machine learning and data-driven techniques but also provides actionable insights for practitioners actively involved in the sport. By identifying the critical features that drive performance, individuals can fine-tune their training strategies, harnessing the power of data-driven decision-making to achieve enhanced performance outcomes while minimizing the risk of injuries. This study exemplifies the synergy between sports, technology, and data analysis, highlighting the potential for further advancements in the field of sports analytics.
Author Contributions
B.L. participated to the Conceptualization, methodology, software, formal analysis, visualization, data curation, and writing—original draft preparation. W.S. participated to the writing—review and editing and supervision. All authors have read and agreed to the published version of the manuscript.
Funding
This research received no external funding.
Institutional Review Board Statement
Not applicable.
Informed Consent Statement
Not applicable.
Data Availability Statement
Data are available upon request to the authors.
Acknowledgments
I would like to express my sincere gratitude to all those who contributed to this research in various ways.
Conflicts of Interest
The authors declare no conflict of interest.
References
- Glassman, G. Understanding CrossFit. Crossfit Journal 2007, 56, 1–2.
- Sprey, J. W.; Ferreira, T.; de Lima, M. V.; Duarte Jr, A.; Jorge, P. B.; Santili, C. An epidemiological profile of CrossFit athletes in Brazil. Orthopaedic Journal of Sports Medicine 2016, 4 (8), 2325967116663706. [CrossRef]
- CrossFit | About Affiliation. [cited 2020 Feb 9]. Available from: https://www.crossfit.com/affiliate.
- International Weightlifting Federation - International Weightlifting Federation. [cited 2020 Jan 25].
- IPF- International Powerlifting Federation IPF. [cited 2020 Jan 25].
- Maté-Muñoz, J. L.; Lougedo, J. H.; Barba, M.; et al. Muscular fatigue in response to different modalities of CrossFit sessions. PLoS One 2017, 12 (7), e0181855. [CrossRef]
- Feito, Y.; Heinrich, K. M.; Butcher, S. J.; Poston, W. S. C. High-intensity functional training (HIFT): Definition and research implications for improved fitness. Sports 2018, 6 (3), 76. [CrossRef]
- Claudino, J. G.; Gabbett, T. J.; Bourgeois, F.; Souza, H. S.; Miranda, R. C.; Mezêncio, B.; et al. CrossFit overview: Systematic review and meta-analysis. Sports Medicine Open 2018, 4 (1), 11. [CrossRef]
- Jacob, N.; Novaes, J. S.; Behm, D. G.; Vieira, J. G.; Dias, M. R.; Vianna, J. M. Characterization of hormonal, metabolic, and inflammatory responses in CrossFit® training: A systematic review. Frontiers in Physiology 2020, 11, 1001. [CrossRef]
- De Souza, R. A. S.; Da Silva, A. G.; De Souza, M. F.; Souza, L. K. F.; Roschel, H.; Da Silva, S. F.; et al. A systematic review of CrossFit® workouts and dietary and supplementation interventions to guide nutritional strategies and future research in CrossFit®. International Journal of Sport Nutrition and Exercise Metabolism 2021, 31, 187–205. [CrossRef]
- Meier, N.; Schlie, J.; Schmidt, A. Physiological effects of regular CrossFit® training and the impact of the COVID-19 pandemic—A systematic review. Frontiers in Physiology 2023, 14, 1146718. [CrossRef]
- Butcher, S. J.; Neyedly, T. J.; Horvey, K. J.; Benko, C. R. Do physiological measures predict selected CrossFit® benchmark performance? Open Access Journal of Sports Medicine 2015, 6, 241. pmid:26261428. [CrossRef]
- Martínez-Gómez, R.; Valenzuela, P. L.; Barranco-Gil, D.; Moral-González, S.; García-González, A.; Lucia, A. Full-Squat as a Determinant of Performance in CrossFit. International Journal of Sports Medicine 2019, 40 (09), 592–6. [CrossRef]
- Serafini, P. R.; Feito, Y.; Mangine, G. T. Self-reported measures of strength and sport-specific skills distinguish ranking in an international online fitness competition. Journal of Strength and Conditioning Research 2018, 32 (12), 3474–84. pmid:28195976. [CrossRef]
- Bellar, D.; Hatchett, A.; Judge, L.; Breaux, M.; Marcus, L. The relationship of aerobic capacity, anaerobic peak power, and experience to performance in CrossFit exercise. Biology of Sport 2015, 32 (4), 315–20. pmid:26681834. [CrossRef]
- Barbieri, J. F.; Correia, R. F.; Castaño, L. A. A.; Brasil, D. V. C.; Ribeiro, A. N. Comparative and correlational analysis of the performance from 2016 CrossFit Games high-level athletes. Manual Therapy, Posturology & Rehabilitation Journal = Revista Manual Therapy 2017, 15. [CrossRef]
- Mangine, G. T.; Stratton, M. T.; Almeda, C. G.; Roberts, M. D.; Esmat, T. A.; VanDusseldorp, T. A.; Feito, Y. Physiological differences between advanced CrossFit athletes, recreational CrossFit participants, and physically-active adults. PLoS One 2020, 15 (4), e0223548. [CrossRef]
- Leitão, L.; Dias, M.; Campos, Y.; Vieira, J. G.; Sant’Ana, L.; Telles, L. G.; Vianna, J. Physical and physiological predictors of FRAN CrossFit® WOD athlete’s performance. International Journal of Environmental Research and Public Health 2021, 18 (8), 4070. [CrossRef]
- Mangine, G. T.; Tankersley, J. E.; McDougle, J. M.; Velazquez, N.; Roberts, M. D.; Esmat, T. A.; Feito, Y. Predictors of CrossFit open performance. Sports 2020, 8 (7), 102. [CrossRef]
- Meier, N.; Rabel, S.; Schmidt, A. Determination of a CrossFit® benchmark performance profile. Sports 2021, 9 (6), 80. [CrossRef]
- Liu, H.; Zhu, X. Design of the Physical Fitness Evaluation Information Management System of Sports Athletes Based on Artificial Intelligence. Comput. Intell. Neurosci. 2022, 30, 1925757. [CrossRef]
- Kapadia, K.; Abdel-Jaber, H.; Thabtah, F.; Hadi, W. Sport Analytics for Cricket Game Results Using Machine Learning: An Experimental Study. Appl. Comput. Informatics 2020, 18(3/4), 256-266. [CrossRef]
- Sarlis, V.; Tjortjis, C. Sports Analytics—Evaluation of Basketball Players and Team Performance. Inf. Syst. 2020, 93, 101562. [CrossRef]
- Nguyen, N. H.; Nguyen, D. T. A.; Ma, B.; Hu, J. The Application of Machine Learning and Deep Learning in Sport: Predicting NBA Players’ Performance and Popularity. J. Inf. Telecommun. 2022, 6(2), 217-235. [CrossRef]
- Kaggle | Crossfit Athletes. [cited 2023 Feb 2]. Available from: https://www.kaggle.com/datasets/ulrikthygepedersen/crossfit-athletes/data.
- Breiman, L. Random forests. Machine Learning 2001, 45, 5-32. [CrossRef]
- Miah, J.; Mamun, M.; Rahman, M. M.; Mahmud, M. I.; Ahmad, S.; Nasir, M. H. B. Mhfit: Mobile health data for predicting athletics fitness using machine learning models. In 2022 2nd International Seminar on Machine Learning, Optimization, and Data Science (ISMODE), 2022; pp. 584-589. IEEE.
- Breiman, L. Bagging predictors. Machine Learning 1996, 24, 123–140. [CrossRef]
- Apostolou, K.; Tjortjis, C. Sports Analytics algorithms for performance prediction. In 2019 10th International Conference on Information, Intelligence, Systems and Applications (IISA), 2019; pp. 1-4. IEEE.
- Sinnakaudan, S. K.; Ghani, A. A.; Ahmad, M. S.; Zakaria, N. A. Multiple linear regression model for total bed material load prediction. Journal of Hydraulic Engineering 2006, 132 (5), 521-528. [CrossRef]
- Rath, S.; Tripathy, A.; Tripathy, A. R. Prediction of New Active Cases of Coronavirus Disease (COVID-19) Pandemic Using Multiple Linear Regression Model. Diabetes Metab. Syndr. 2020, 14(5), 1467-1474. [CrossRef]
- Xu, D.; Song, Y.; Meng, Y.; István, B.; Gu, Y. Relationship Between Firefighter Physical Fitness and Special Ability Performance: Predictive Research Based on Machine Learning Algorithms. Int. J. Environ. Res. Public Health 2020, 17(20), 7689. [CrossRef]
- Zaras, N.; Stasinaki, A. N.; Methenitis, S.; Karampatsos, G.; Fatouros, I.; Hadjicharalambous, M.; Terzis, G. Track and Field Throwing Performance Prediction: Training Intervention, Muscle Architecture Adaptations and Field Tests Explosiveness Ability. J. Phys. Educ. Sport 2019, 19, 436-443. [CrossRef]
- Hamilton, D. F.; Ghert, M.; Simpson, A. H. R. W. Interpretation of Regression Models in Clinical Outcome Studies Hamilton et al., 2015.
- Roy, B. Optimum Machine Learning Algorithm Selection for Forecasting Vegetation Indices: MODIS NDVI & EVI. Remote Sens. Appl. Soc. Environ. 2021, 23, 100582. [CrossRef]
- Chicco, D.; Warrens, M. J.; Jurman, G. The Coefficient of Determination R-Squared Is More Informative Than SMAPE, MAE, MAPE, MSE, and RMSE in Regression Analysis Evaluation. PeerJ Comput. Sci. 2021, 7, e623. [CrossRef]
- Gujarati, D. N. Basic Econometrics. Prentice Hall, 2022.
- Saarela, M.; Jauhiainen, S. Comparison of Feature Importance Measures as Explanations for Classification Models. SN Appl. Sci. 2021, 3, 1-12. [CrossRef]
- Gao, T.; Liu, J. Application of Improved Random Forest Algorithm and Fuzzy Mathematics in Physical Fitness of Athletes. J. Intell. Fuzzy Syst. 2021, 40(2), 2041-2053. [CrossRef]
- Khator, D.; Prajapati, D. IPL Prediction Using Machine Learning. [CrossRef]
- Zhu, Y.; Naikar, R. Predicting Tennis Serve Directions with Machine Learning. Int. Workshop Mach. Learn. Data Min. Sports Analytics 2022, 89-100. [CrossRef]
- Zamani Joharestani, M.; Cao, C.; Ni, X.; Bashir, B.; Talebiesfandarani, S. PM2.5 Prediction Based on Random Forest, XGBoost, and Deep Learning Using Multisource Remote Sensing Data. Atmosphere 2019, 10(7), 373. [CrossRef]
- Amendolara, A.; Pfister, D.; Settelmayer, M.; Shah, M.; Wu, V.; Donnelly, S.; Bills, K. An Overview of Machine Learning Applications in Sports Injury Prediction. Cureus 2023, 15(9). [CrossRef]
- Pantzalis, V. C.; Tjortjis, C. Sports Analytics for Football League Table and Player Performance Prediction. 2020 11th Int. Conf. Inf. Intell. Syst. Appl. (IISA) 2020, 1-8.
- Gao, Z.; Kowalczyk, A. Random Forest Model Identifies Serve Strength as a Key Predictor of Tennis Match Outcome. J. Sports Analytics 2021, 7(4), 255-262. [CrossRef]
- Al-Asadi, M. A.; Tasdemır, S. Predict the Value of Football Players Using FIFA Video Game Data and Machine Learning Techniques. IEEE Access 2022, 10, 22631-22645. [CrossRef]
- Sikka, D.; Rajeswari, D. Basketball Win Percentage Prediction using Ensemble-based Machine Learning. 2022 6th Int. Conf. Electron. Commun. Aerosp. Technol. 2022, 885-890.
- Shetty, M.; Rane, S.; Pandita, C.; Salvi, S. Machine Learning-based Selection of Optimal Sports Team based on the Players’ Performance. 2020 5th Int. Conf. Commun. Electron. Syst. (ICCES) 2020, 1267-1272.
- Rodrigues, N.; Sequeira, N.; Rodrigues, S.; Shrivastava, V. Cricket Squad Analysis Using Multiple Random Forest Regression. 2019 1st Int. Conf. Adv. Inf. Technol. (ICAIT) 2019, 104-108.
- Tümer, A. E.; Akyıldız, Z.; Güler, A. H., et al. Prediction of Soccer Clubs’ League Rankings by Machine Learning Methods: The Case of Turkish Super League. Proc. Inst. Mech. Eng., Part P J. Sports Eng. Technol. 2022, 0(0). [CrossRef]
- Li, H. Analysis on the Construction of Sports Match Prediction Model Using Neural Network. Soft Computing 2020, 24(11), 8343-8353. [CrossRef]
- Du, P.; Wang, Y.; Liao, C.; Xian, T. Sports Games Attendance Forecast Using Machine Learning. 2022 IEEE 2nd Int. Conf. Data Sci. Comput. Appl. (ICDSCA) 2022, 181-188.
- Geng, S.; Hu, T. Sports Games Modeling and Prediction Using Genetic Programming. 2020 IEEE Congress Evolutionary Comput. (CEC) 2020, 1-6.
- Lucero, R. A.; Fry, A. C.; LeRoux, C. D.; Hermes, M. J. Relationships Between Barbell Squat Strength and Weightlifting Performance. Int. J. Sports Sci. Coaching 2019, 14(4), 562-568. [CrossRef]
- Charniga, A., The relative value of the back squat in the training of weightlifters. 2018.
- Stone, M. H.; Sands, W. A.; Pierce, K. C., et al. Relationship of Maximum Strength to Weightlifting Performance. Med. Sci. Sports Exerc. 2005, 37, 1037–1043. [CrossRef]
- Moon, Y. J.; Park, T. M. Extraction of Major Training Methods Highly Related to Snatch Record and Jerk Record Improvement. Korean J. Sport Biomechanics 2021, 31(2), 148-153. [CrossRef]
- Jones, M. T.; Jagim, A. R.; Haff, G. G.; Carr, P. J.; Martin, J.; Oliver, J. M. Greater Strength Drives Difference in Power Between Sexes in the Conventional Deadlift Exercise. Sports 2016, 4(3), 43. [CrossRef]
- Lomasney, S.; Lessard, A.; Steitz, A.; Bosse, M., Gender Differences Between Overall Resistance Work and Overall Energy Costs. 2014.
- Zecchin, A.; Puggina, E. F.; Hortobágyi, T.; Granacher, U. Association Between Foundation Strength and Weightlifting Exercises in Highly Trained Weightlifters: Support for a General Strength Component. J. Strength Conditioning Res. 2023, 37(7), 1375-1381. [CrossRef]
- Zecchin, A.; Puggina, E. F.; Hortobágyi, T.; Granacher, U. Association between Foundation Strength and Weightlifting Exercises in Highly Trained Weightlifters: Support for a General Strength Component. J. Strength Conditioning Res. 2022, 10, 1519. [CrossRef]
- Brooks, T.; Cressey, E. Mobility Training for the Young Athlete. Strength Conditioning J. 2013, 35(3), 27-33. [CrossRef]
Figure 1.
Flowchart of data processing for CF performance prediction model.
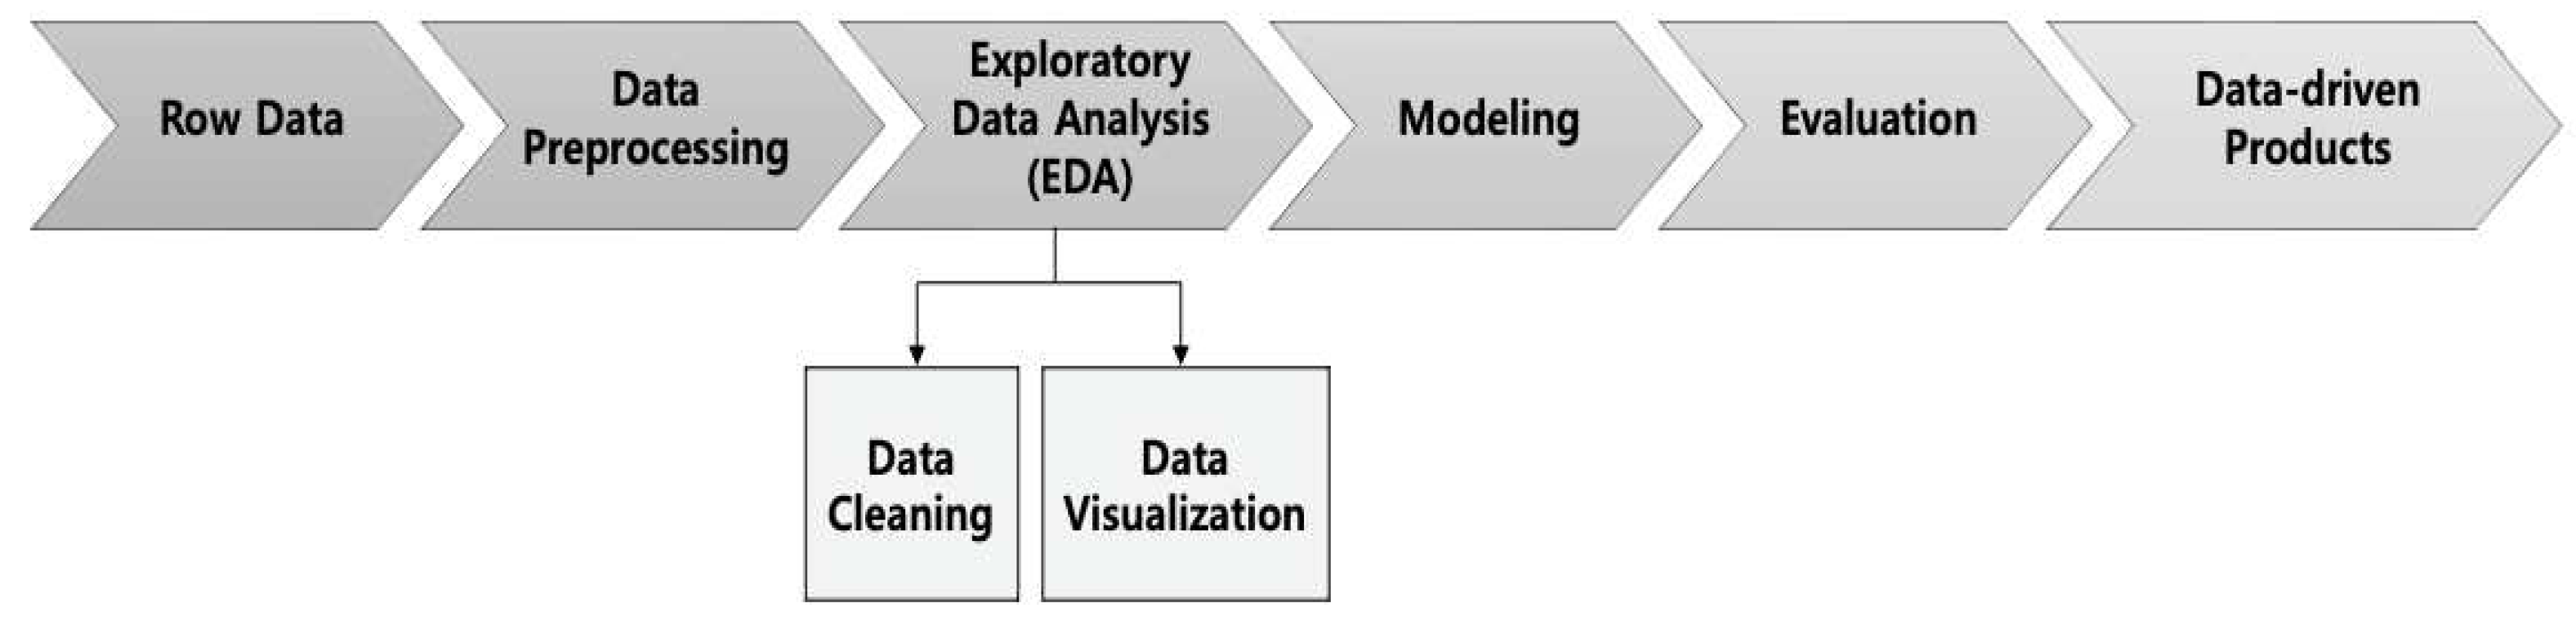
Figure 2.
Feature importance bar graph based on three models with four exercises. (a,b,c) Random forest; XGBoost; AdaBoost in clean & jerk; (d,e,f) Random forest; XGBoost; AdaBoost in snatch; (g,h,i) Random forest; XGBoost; AdaBoost in back squat; (j,k,l) Random forest; XGBoost; AdaBoost in deadlift.
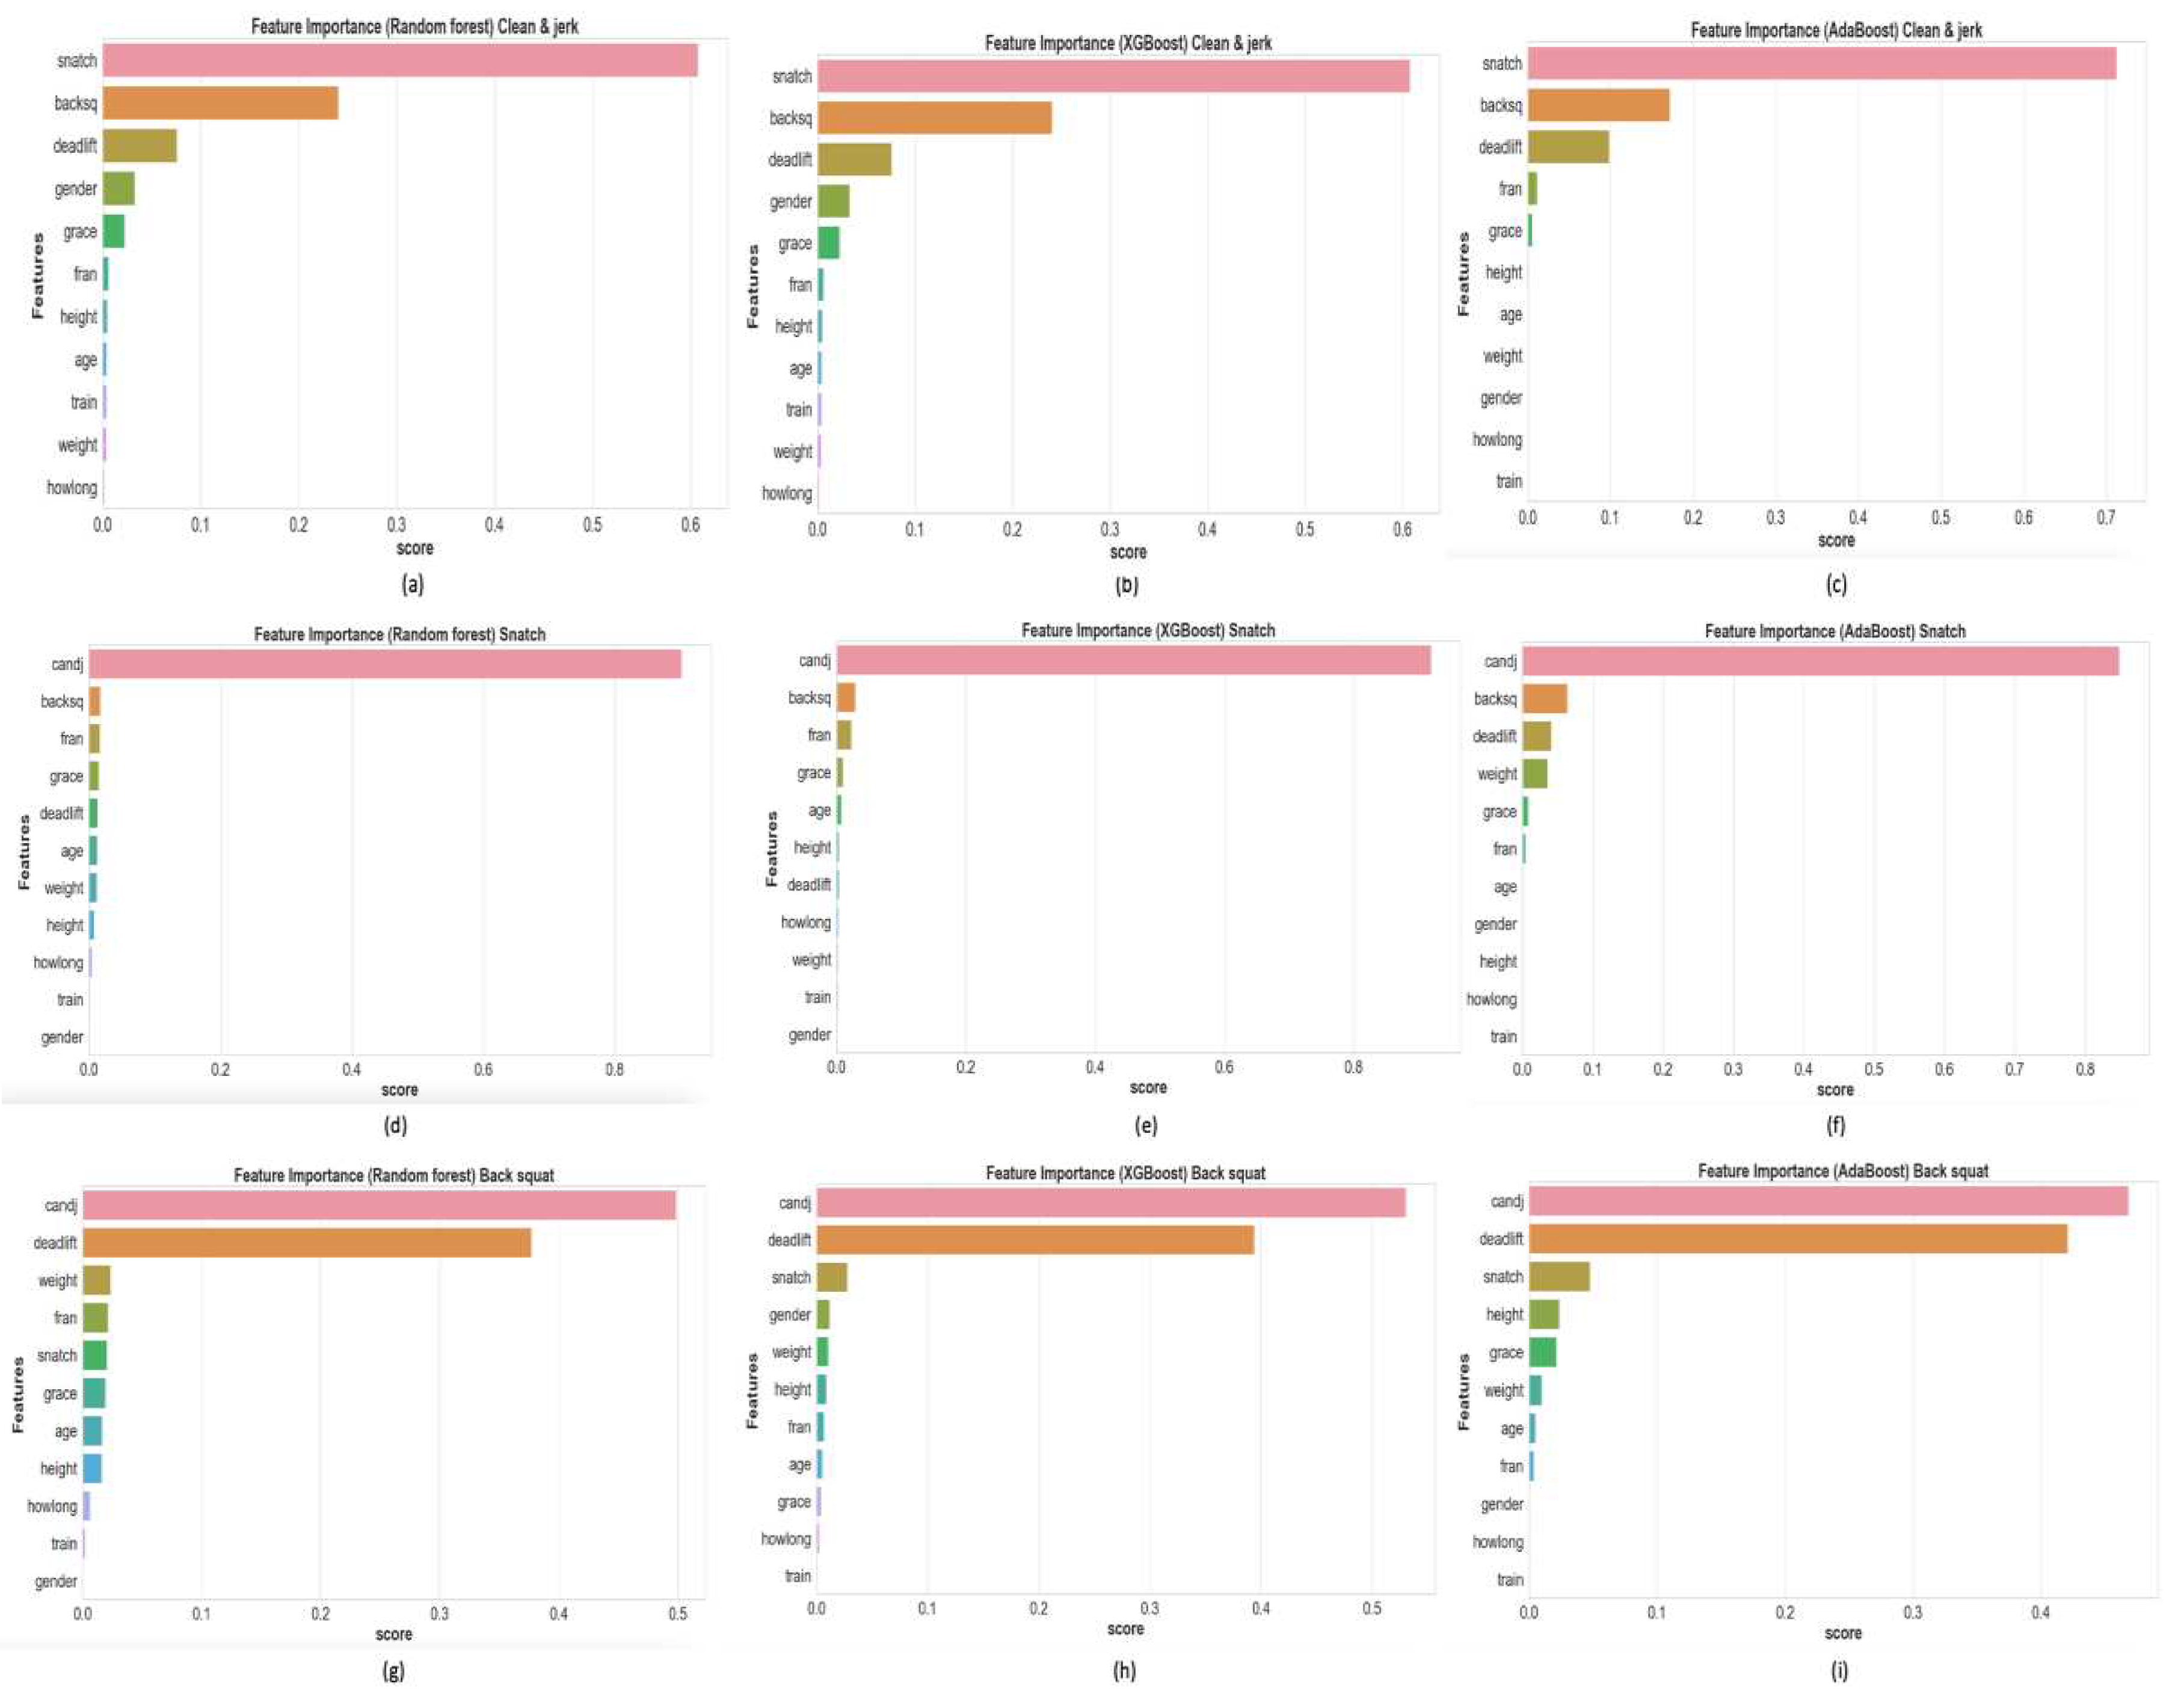
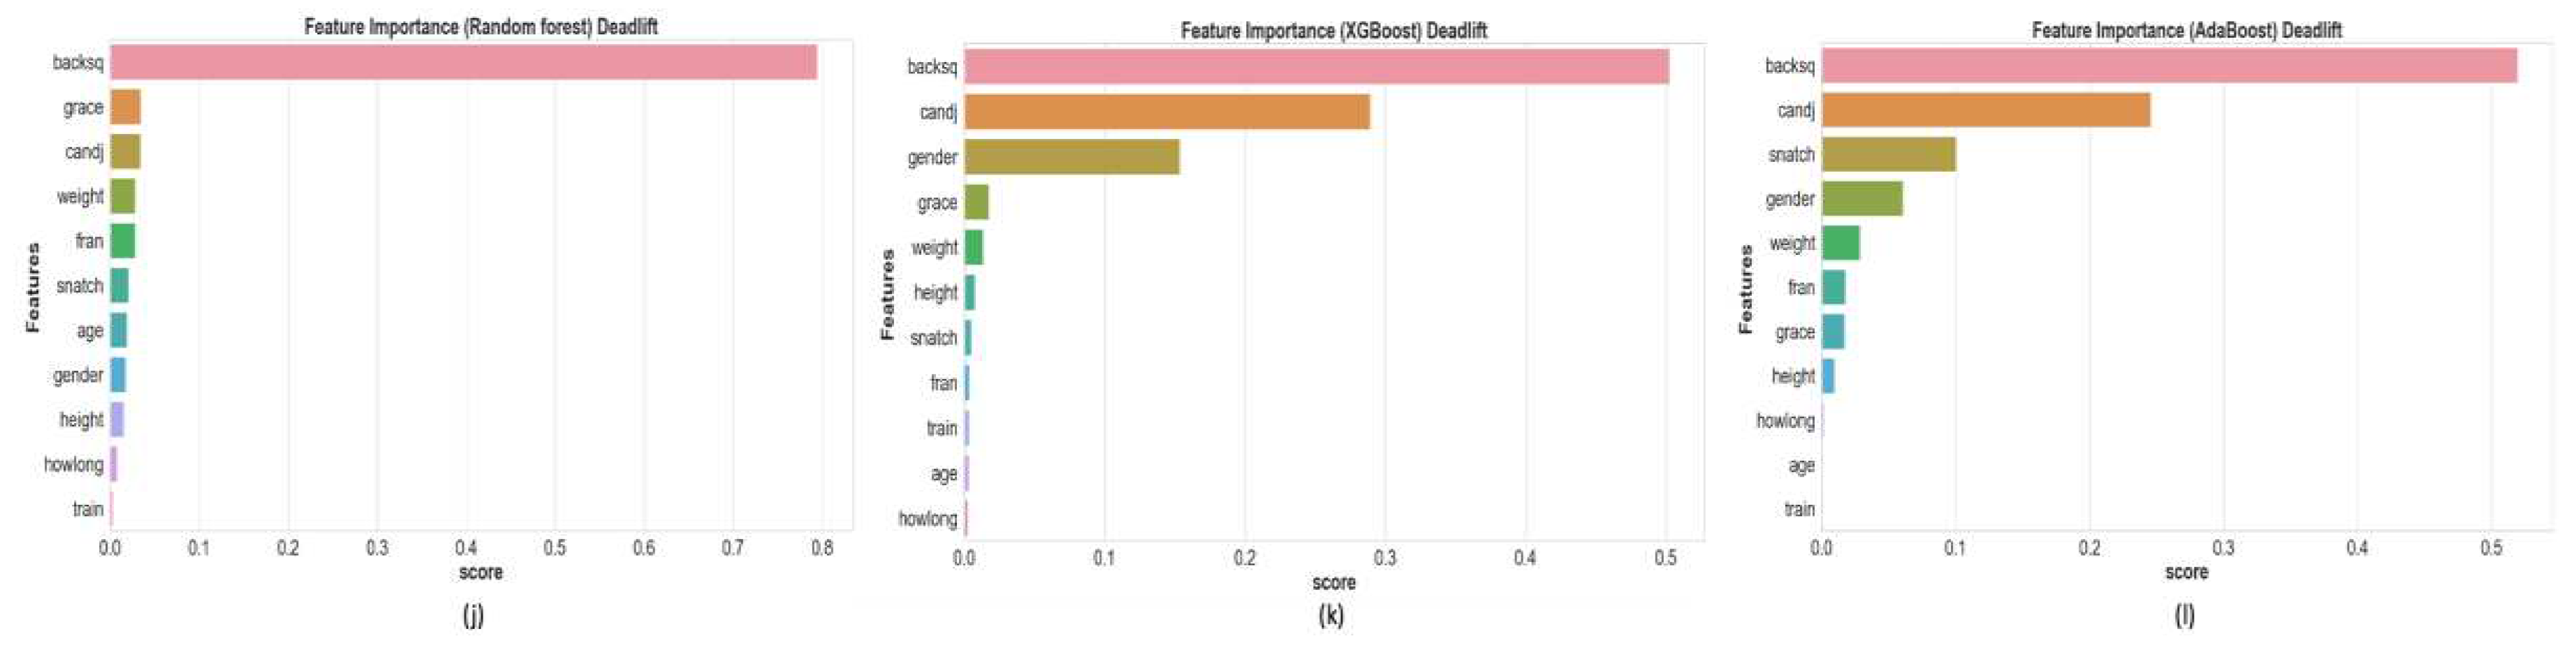

Table 1.
The performance of different prediction models for CF test data.
| Exercise | Metric | Random Forest | Multiple Linear Regression |
|---|---|---|---|
| Clean & jerk | R2 | 0.933 * | 0.929 |
| MSE | 0.063 * | 0.070 | |
| Snatch | R2 | 0.895 | 0.898 * |
| MSE | 0.100 * | 0.101 | |
| Back squat | R2 | 0.847 | 0.862 * |
| MSE | 0.113 * | 0.137 | |
| Deadlift | R2 | 0.805 | 0.819 * |
| MSE | 0.185 | 0.180 * |
Two machine learning methods (RF and deep MLR) used to predict clean&jerk, snatch, back squat and deadlift. The R2 and MSE were used to evaluate the prediction accuracy. MSE = Mean Squared Error, R2 = Coefficient of Determination, * Best Performance.
Table 2.
Features importance ranking based on different modeling approaches.
| Exercise | Rank | Feature Name | Random Forest | XGBoost | AdaBoost | Mean |
|---|---|---|---|---|---|---|
| 1 | Snatch | 0.892 | 0.607 | 0.734 | 0.744 | |
| Clean & jerk | 2 | Back squat | 0.044 | 0.240 | 0.168 | 0.145 |
| 3 | Deadlift | 0.013 | 0.075 | 0.069 | 0.047 | |
| 1 | Clean & jerk | 0.901 | 0.920 | 0.848 | 0.889 | |
| Snatch | 2 | Back squat | 0.016 | 0.028 | 0.063 | 0.035 |
| 3 | Deadlift | 0.016 | 0.003 | 0.040 | 0.019 | |
| 1 | Clean & jerk | 0.498 | 0.530 | 0.468 | 0.498 | |
| Back squat | 2 | Deadlift | 0.376 | 0.393 | 0.420 | 0.396 |
| 3 | Snatch | 0.020 | 0.027 | 0.047 | 0.031 | |
| 1 | Back squat | 0.794 | 0.502 | 0.519 | 0.605 | |
| Deadlift | 2 | Clean & jerk | 0.034 | 0.289 | 0.245 | 0.189 |
| 3 | Gender | 0.017 | 0.153 | 0.060 | 0.076 |
Disclaimer/Publisher’s Note: The statements, opinions and data contained in all publications are solely those of the individual author(s) and contributor(s) and not of MDPI and/or the editor(s). MDPI and/or the editor(s) disclaim responsibility for any injury to people or property resulting from any ideas, methods, instructions or products referred to in the content. |
© 2023 by the authors. Licensee MDPI, Basel, Switzerland. This article is an open access article distributed under the terms and conditions of the Creative Commons Attribution (CC BY) license (http://creativecommons.org/licenses/by/4.0/).
Copyright: This open access article is published under a Creative Commons CC BY 4.0 license, which permit the free download, distribution, and reuse, provided that the author and preprint are cited in any reuse.


