
Submitted:
04 June 2025
Posted:
05 June 2025
You are already at the latest version
Abstract
Peas possess significant nutritional properties due to their high protein levels, carbohydrates, fiber, and vitamins. Increased climate variability can lead to water stress in crops like peas. Therefore, priming plants through seed priming is a technique that has proven effective as a pre-conditioning method for plants to cope with more severe future stresses. Different doses and soaking times of 'Santa Isabel' pea seeds in NaCl and H2O2 were evaluated to enhance and promote germination. Two experiments were conducted under a completely randomized design with a 4 × 3 factorial arrangement, comprising 12 treatments in each trial. In the first trial, NaCl doses (0, 50, 100, or 150 mM) and the soaking time of the seeds in NaCl (12, 24, or 36 hours) were examined. In the second trial, H2O2 doses (0, 20, 40, or 60 mM) were tested with the same imbibition times. The 50 mM NaCl dose at 24 hours demonstrated the best values for germination rate index, mean germination time, germination rate (GR), and germination potential (GP). Seed imbibition for 24 hours in NaCl, as well as in H2O2, is the ideal time to achieve the best GR and GP. The dry mass of leaf and stipule recorded the highest values with a 60 mM dose of H2O2 and 24 hours of imbibition. An application of 150 mM NaCl resulted in the highest values of germinated seed dry mass, while causing lower dry mass in roots, stems, leaves, and stipules; however, it maintained similar total dry mass values.
Keywords:
imbibition
; stipules
; leaf area
; gibberellins
; dry biomass
1. Introduction
Peas are legumes with various uses, from human consumption to green fodder. Their importance lies in their nutritional health benefits, due to their high content of protein, carbohydrates, fiber, and vitamins A, B, and C [1]. The main producing countries include Canada, Russia, China, the United States, India, and Australia, with global production ranging between 10 and 11 million tons (t) across a planted area of 6.2 million hectares (ha) [2]. By 2021, Colombia reached a production of 68,058.3 tons over an area of 28,079.07 ha, with Nariño, Cundinamarca, and Boyacá being the most prominent producing departments [3].
One of the biggest problems in the germination of pea seeds during field sowing is the low uniformity of germination, which results in uneven plants and complicates crop management. Therefore, enhancing the speed and uniformity of seed germination is crucial to optimizing the crop cycle [4]. Rapid and uniform germination facilitates synchronous seedling emergence, making it easier to plan and execute agronomic tasks such as pest and disease management, fertilization, and irrigation [5]. Additionally, reducing the time between sowing and emergence decreases exposure to adverse conditions, such as water deficit or pathogen pressure, ultimately leading to more successful crop establishment and higher yields [6].
Priming is a strategy to mitigate the effects of water stress. It is used to improve germination rates and seed uniformity, and it helps prepare the plant to face subsequent stressful conditions [7]. In this context, priming is defined as a pre-germination technique that induces rapid and uniform seed emergence and can activate the stress response system through a stimulus that confers seed tolerance to specific future stress conditions [8]. Among the substances used in seed priming are sodium chloride (NaCl) and hydrogen peroxide (H2O2), which can enhance plant tolerance to stress conditions, such as osmotic or water stress. Furthermore, they have advantages over other substances due to their availability and ease of implementation [9].
According to Kiran et al. [10], plants produced from seed priming with NaCl increased their osmotic adjustment capacity due to a higher endogenous Na+ and Cl- content in the roots, as well as an increase in osmoprotective and antioxidant substances that reduce oxidative DNA damage caused by reactive oxygen species (ROS). In this regard, Pandolfi et al. [11] found that pea plants grew more at a concentration of 80 mM NaCl when previously exposed to 10 mM NaCl, compared to those exposed to 25 mM NaCl. Likewise, Senturk and Sivritepe [12] reported that priming pea seeds with 150 mM NaCl allowed the plants to develop salinity tolerance during germination and the seedling stage.
Priming with H2O2 induces an inductive pulse that helps protect plants under abiotic stress by restoring redox homeostasis and mitigating oxidative stress, thereby preventing damage to membranes, proteins, and lipids through modulation of stress signaling pathways [13]. In this regard, Moussa and Mohamed [14] found that pea seedlings treated with a seed priming of 70 mM H2O2 exhibited higher total chlorophyll content, carotenoids, photosynthetic activity, growth, and synthesis, along with accelerated production of proline and antioxidant enzymes, as well as reduced oxidative damage under water stress.
Therefore, this research aimed to evaluate various doses and exposure times of 'Santa Isabel' pea seeds to NaCl and H2O2 to enhance and promote germination.
2. Materials and Methods
2.1. Location
The experiment took place in a plastic-covered mesh house at the Universidad Pedagógica y Tecnológica de Colombia (UPTC) Tunja campus, located in Boyacá, at coordinates 5°33.10” N, 73°21.30” W, and an altitude of 2,692 m. The average temperature during the experiments was 14°C, relative humidity was 70%, and sunlight was provided for 4 to 6 hours a day, as shown in Figure 1.
2.1. Plant Material
The Santa Isabel variety was used, one of the most widely grown varieties in Colombia. This variety achieves an average yield of 1013.6 kilograms of dry peas per hectare in the Ipiales and Pasto areas [15]. It adapts to altitudes between 2000 and 3000 m, in environments with temperatures ranging from 13 to 18°C, with an average maximum of 21°C and a minimum of 9°C, also, it requires approximately 250 to 380 mm of water, well distributed throughout the growing cycle, with increased water demand between the growth and flowering stages [16].
2.3. Experimental Design and Field Establishment
For the development of the research, two experiments were conducted under a completely randomized design with a 4 × 3 factorial arrangement, comprising 12 treatments in each case. In the first trial, the first factor was the dose of NH60 NaCl (Carl Roth GmbH + Co KG, Germany) (0, 50, 100, or 150 mM), and the second factor was the imbibition time of the seeds in NaCl (12, 24, or 36 hours). In the second trial, the first factor was the dose of H2O2 (0, 20, 40, or 60 mM), and the second factor was the imbibition time of the seeds in H2O2 (12, 24, or 36 hours). Each trial treatment had five replicates, totaling 60 experimental units (EU) per trial. Each EU consisted of 48 seeds, which were sown in 72-cell germination trays of type A-BA72 (A and P of Colombia) at a depth of 5 mm. The substrate used was Seed Pro 8020 XL (Projar Group, Spain), a mixture of blond peat (80%) and black peat (20%). The substrate was watered daily to maintain humidity and thus promote germination. The first trial was sown on August 16 and completed on September 6, while the second trial was sown on September 16 and completed on October 6, 2023.
2.4. Response Variables
A seed is considered germinated when the epicotyl emerges through the substrate. Seeds germinated four days after sowing (DAS); the number of germinated seeds and the time to germination in days were measured daily. From these data, the germination rate (GR), germination potential (GP), mean germination time (MGT), and germination rate index (GRI) were calculated according to the equations in Table 1. Once the plants were ready for transplantation at 21 and 16 DAS, destructive sampling was performed for the first and second trials, where the dry mass of the roots, stems, leaflets, stipules, germinated seeds, and total mass was measured. The dry mass was determined using a Boeco Bas 31 plus balance (Boeckel & Co., and GmbH & Co. KG, Hamburg, Germany) with a precision of 0.0001 g, after subjecting the different plant organs to 70 ºC for 48 h in a Memmert UNB500 drying oven (Memmert GmbH, and Co. KG, Schwabach, Germany). The stipule leaf area (SLA) and leaflet area (LA) were determined by photographic analysis, with images processed using ImageJ software, following the methodology of [17], in which the total leaf area (TLA) was also calculated as the sum of SLA and LA and expressed in cm2.
2.5. Statistical Analysis
The data were initially assessed for normality using the Kolmogorov–Smirnov test to ensure adherence to the assumptions required for subsequent statistical analyses. After confirming normality (p < 0.05), an analysis of variance (ANOVA) was performed, revealing significant differences among treatments. Post hoc comparisons were conducted using Tukey’s test (p < 0.05) to categorize treatment groups. For variables exhibiting significant interaction effects, response surface models were developed using the RSREG procedure in SAS and adapted to Equation 1. All statistical analyses were conducted using SAS OnDemand for Academics (SAS Institute Inc., Cary, NC, USA). Figures were generated with SigmaPlot version 14.0.0.124 (Systat Software, Inc., San Jose, CA, USA). Additionally, data visualization and figure customization were performed using the open-source programming language Python 3.11 within the Visual Studio Code 1.98.2 environment, employing the NumPy and Matplotlib libraries.
Y = a+b×I+c×D+d×I2+e×I×D+f×D2,
Where Y is the response variable, a, b, c, d, e, f are the estimated parameters of the model, I is the imbibition time, and D is the doses of NaCl or H2O2.
3. Results and Discussion
3.1. Effect of Imbibition Time and NaCl Doses on Germination Parameters in Pea Seeds
The GR showed highly significant differences between imbibition times and NaCl doses, with only the interaction exhibiting significant differences (Table 2, Figure 2a). The 36-hour imbibition produced 5.8% more GR than the 12-hour imbibition. Similarly, the 50 mM NaCl dose yielded 7.9% more GR than the 0 mM dose. The evaluated factors indicated that 24-hour imbibition at 50 mM NaCl resulted in 6.2% more PG than 12-hour imbibition at 0 mM NaCl.
36-hour imbibition likely allows for uniform hydration of embryonic tissues, increasing gibberellin levels, which facilitates the activity of key hydrolytic enzymes in starch degradation [18]. In contrast, 12-hour imbibition may lead to incomplete hydration, which limits the mobilization of reserves and decreases germination. On the other hand, the 50 mM NaCl dose can create mild osmotic stress, activating kinase-type cell signaling pathways that accelerate the mobilization of reserves in the seed, generating energy and substrates for radicle growth and elongation [19] and subsequent germination. In comparison, the 0 mM dose does not promote this stimulus, and seed germination relies solely on endogenous signals.
The GP showed highly significant differences in imbibition time and significant differences in NaCl dose. The interaction between factors did not show significant differences. Imbibition for 36 h yielded 21.2% more GP than that for 12 h, while the 50 mM dose resulted in 25.6% more GP than the 150 mM dose. In terms of the interaction between factors, the combination of 100 mM NaCl and 36 h of imbibition produced 81.3% more GP than 150 mM NaCl for 24 h. Imbibition for 36 h allows for optimal hormonal synchronization; moreover, it is likely that with this imbibition time, ABA is progressively degraded, while gibberellins increase, stimulating cell expansion and uniform rupture of the seed coat [20], which raises the GP values. Regarding the NaCl dose, the application of 50 mM induces mild stress, activating enzymes and enhancing hormonal signaling, which acts as a tolerance priming mechanism that activates stress genes, such as osmoprotectors and aquaporins, to prepare the seedling for future challenges [21]. In contrast, the 0 mM dose does not provide a stimulus, likely due to residual latency or slower metabolic activation, which reduces uniformity in germination.
The MGT showed highly significant results regarding imbibition times, NaCl doses, and the interaction of the evaluated factors (Figure 2b). Imbibing pea seeds for 12 hours resulted in a 9.8% higher MGT than imbibing for 36 hours. Similarly, the application of 150 mM NaCl increased the MGT by 15.4% compared to the 50 mM dose, which aligns with [12]. They found that, under salinity conditions with a priming of 150 mM NaCl in pea cv. ‘Bolero’, the MGT averaged 12.25 days, higher than the 5.55 days obtained in the present study. They also noted a reduction in total emergence. The combination of 12 hours of imbibition with zero mM of NaCl produced the highest MGT, 23.2% greater than the MGT of the treatment with 36 hours of imbibition and zero mM of NaCl. Imbibition for 36 hours likely allows for the complete hydration of the embryo, accelerating the mobilization of reserves, as optimal activation of enzymes such as amylases occurs. This leads to the degradation of starch and proteins, releasing energy and sugars toward the radicle, which facilitates the rapid breaking of the seed coat and the onset of germination [18]. Furthermore, 36-hour imbibition enhances cell expansion through ABA degradation and increased levels of gibberellin [20].
The GRI of pea seeds showed highly significant differences based on imbibition times and priming with different NaCl doses. Imbibition for 36 hours resulted in a GRI that was 20.4% higher than that of imbibition for 12 hours. In terms of the imbibition dose, 50 mM led to a GRI that was 42.3% higher than the GRI observed with 150 mM NaCl. The interaction between the imbibition factor and NaCl dose also exhibited significant differences, with the combination of 24 hours of imbibition at 50 mM yielding the highest GRI, being 104% faster than the GRI from imbibition for 12 hours at a dose of 0 mM.
Similarly, the GRI reported by [12] was 11.09 for treatments with priming, whereas it was 13.2 for treatments without priming. This is comparable to the present study's findings, which showed GRI values of 7.13 and 7.59 for treatments with and without priming, respectively, indicating that 150 mM NaCl delays the germination rate in peas.
3.2. Effect of Imbibition Time and NaCl Doses on the Dry Mass Distribution of Different Organs in Pea Seedlings
Root dry mass showed significant differences based on imbibition times and highly significant differences regarding NaCl doses (Figure 2c and Figure 3a). The control treatment dose (0 mM) exhibited the highest values, while increasing NaCl doses led to a significant decrease in root dry mass, with the application of 150 mM NaCl resulting in a 21.9% reduction. Similarly, imbibition in NaCl for 24 hours produced the most significant root dry mass (Figure 3b). The interaction between imbibition and dose displayed significant differences, with 24-hour imbibition and 0 mM yielding the highest values. In comparison, imbibing 150 mM NaCl for 36 hours resulted in the lowest root dry mass, which was 40.3% lower.
Similarly, Naz et al. [22] reported that imbibition in the highest doses of NaCl (80 mM) reduced root length in pea seedlings compared to the control. They also noted that nutrient absorption and root growth rates decrease under salinity conditions. Souza et al. [23] found that imbibition of Myracrodruon urundeuva Allemäo seeds in 50 mM NaCl reduced fresh root mass by 57%. This reduction in root dry mass is attributed to NaCl-induced salt stress, which diminishes the plant's ability to absorb water, leading to decreased growth and the accumulation of toxic ions within the plant, which disrupts the osmotic balance [24]. In this regard, Atta et al. [25] mention that osmotic stress and water deficit increase the production of abscisic acid (ABA), which alleviates the effects of salinity on photosynthesis and growth due to the accumulation of K+, Ca2+, and proline in root vacuoles, counteracting the absorption of Na+ and Cl-. Similarly, Smolko et al. [26] state that exposure to salinity reduces the size of the root meristem, inhibits the formation of lateral roots, and limits auxin transport due to decreased levels of certain proteins.
Stem dry mass showed highly significant differences between imbibition times and significant differences between doses, while the interaction between the two factors did not reveal any significant differences. Imbibition for 24 hours resulted in the highest values of stem dry mass, whereas imbibition for 36 hours decreased stem dry mass gain by 20.2%. The 150 mM NaCl dose lowered stem dry mass accumulation by 2.6% compared to the control treatment. In this regard, salt stress reduces water uptake, which impacts cell elongation [25]. Additionally, the accumulation of ABA due to water stress may influence the biosynthesis and transport of auxins, hormones responsible for stem elongation [26].
Both leaflets and stipules exhibited highly significant differences in dry mass based on imbibition time, NaCl dose, and their interaction (Figure 2d,e). Imbibition for 36 hours resulted in a 21.9% and 16.7% increase in leaf dry mass accumulation, respectively, compared to imbibition for 12 and 24 hours. Likewise, the dry mass of stipules from seedlings obtained from seeds soaked for 36 hours was 28.1% and 33.6% higher than those soaked for 24 and 12 hours, respectively, indicating that a longer soaking time positively influences stipule dry mass accumulation. Regarding NaCl dose, the application of 150 mM reduced the dry mass of leaves and stipules by 18.8% and 32.7%, respectively, compared to the average of the other doses applied. For the interaction between factors, the combination of 36 hours of imbibition and 0 mM of NaCl produced the most significant dry mass of leaves and stipules, while the lowest results were observed with imbibition for 24 hours at 150 mM of NaCl, which was 46% and 63.9% lower, indicating that salinity has a more significant impact on the growth of stipules than on that of leaves.
This is attributed to the fact that ionic toxicity generated by salinity alters cellular homeostasis, inducing the accumulation of ABA, which causes stomatal closure and leads to decreased photosynthesis, ultimately resulting in reduced cell expansion. Similarly, salt-induced water deficit limits cell division in organs such as leaves and stipules [25]. Furthermore, due to oxidative stress, auxins and cytokinins exhibit diminished effects on leaf development [26]. Therefore, it is logical that the hormonal response prioritizes plant survival over plant growth, which would explain the more significant mass losses in stipules, the most sensitive tissues.
The dry mass of the germinated seeds showed highly significant differences between the two evaluated factors individually, while it displayed significant differences for the interaction (Figure 2f). The 36-hour soaking period resulted in the highest dry mass of germinated seeds, whereas the 24-hour soaking yielded 19.7% less. Regarding the NaCl dosage, the 150 mM dose produced the highest dry mass of germinated seeds, 27.1% greater than the average of the other treatments. Concerning the interaction, soaking pea seeds in 150 mM NaCl for 36 hours resulted in 86.6% more dry mass of germinated seeds compared to soaking for 24 hours in 0 mM NaCl.
The above suggests that the imbibition of pea seeds in NaCl alters the distribution of seed mass accumulation in seedling organs, as the 150 mM dose limits or delays the translocation of photoassimilates from the seed to the other seedling organs. This results in lower dry mass of roots, stems, leaves, and stipules. In this regard, Atta et al. [25] state that salt stress delays water absorption and favors the accumulation of ABA, which inhibits the activity of hydrolytic enzymes such as α-amylase on starch in the cotyledons. This affects the mobilization of reserves from the seed to the other plant organs, decreasing the initial growth and development of the seedling and generating greater residual dry mass of the seed at the time of measurement.
The total dry mass of pea seedlings showed significant differences in the imbibition time factor; however, no significant differences were observed in the NaCl doses or their interaction. The 36-hour imbibition treatment yielded the highest total dry mass values, with increases of 8.9% and 11.4% compared to the 12- and 24-hour periods, respectively. The different NaCl doses applied to pea seeds generated an average total seedling dry mass of 9.66 g. Although this difference was not statistically significant, the 150 mM dose resulted in a 0.3% reduction compared to the control treatment. Despite the saline stress, the total dry mass remained unchanged, suggesting a compensation strategy in peas where resource redistribution occurs. The 150 mM dose reduced the dry matter of roots, leaves, and stipules, did not affect that of the stems, and maintained a higher dry matter of germinated seeds compared to the control treatment. This suggests a delay in the transport of reserves, likely caused by the effects of salt stress as described by Atta et al. [25].
3.3. Effect of Imbibition Time and NaCl Doses on the Leaf Area of Pea Seedlings
The LA and SLA showed significant differences between the evaluated factors, imbibition time and NaCl dose, while the interaction did not present significant differences for either of the two variables (Table 3). A 36-h imbibition increased the SLA and LA by 100.3% and 66.4%, respectively, compared to a 12-h imbibition. In this sense, prolonged imbibition (36 h) likely allows for complete hydration of embryonic tissues, which increases the activity of amylase and protease enzymes that rapidly degrade starch [18], providing more substrates for the initial growth of stipules and leaflets.
On the other hand, applying a 0 mM NaCl dose resulted in a 72.2% and 37.9% increase in SLA and LA, respectively, compared to a 150 mM NaCl dose. This decrease can be attributed to the fact that a high concentration of NaCl (150 mM) limits water uptake by the plant, which restricts the cell turgor necessary for the expansion of both leaves and stipules [27]. Additionally, the salt stress caused by the NaCl dose can raise ABA levels, which may induce stomatal closure, thereby reducing the photosynthetic rate and cell growth [25].
When analyzing the TLA, highly significant differences were observed for the two evaluated factors, but not for the interaction, suggesting a parallel or additive effect between the factors. Soaking for 36 hours yielded the highest TLA values, 76.5% higher than the TAR generated by seedlings whose seeds were soaked for 12 hours. Conversely, the 150 mM NaCl dose decreased TLA by 31.4% compared to the control, which can be attributed to the possibility that seed priming may have induced osmotic stress, limiting water absorption and affecting cell expansion, thereby influencing the total leaf area [27].
3.4. Effect of Imbibition Time and H2O2 Doses on Germination Parameters in Pea Seeds
The GR, GP, MGT, and GRI exhibited highly significant differences based on imbibition times, but not in relation to H2O2 doses or the interaction of factors (Table 4). A 24-hour imbibition period resulted in 3.1% and 26.8% higher GR and GP, respectively, compared to a 12-hour imbibition. Similarly, the 24-hour imbibition increased GRI by 16.3% compared to the 12-hour imbibition. However, the 12-hour imbibition produced the highest MGT, being 12.9% greater than that of the 24-hour imbibition. The average GR across all treatments was 97.1%, while the GP was 43.8%, the MGT was 5.4 days to germination, and the GRI was 8.8 germinated seeds per day. Soaking for 24 hours provides sufficient hydration, creating an ideal balance for germination by reducing ABA and increasing gibberellins concentration [20], which lowers MGT [28]. Additionally, Hernández [29] notes that during germination, significant changes occur in the seeds' redox status, featuring a reduction in ABA that depends on H2O2. He also indicates that ROS contributes to lowering the ABA/GA ratio, which promotes germination.
The absence of significant differences in the germination parameters of pea seedlings subjected to different doses of H2O2 can be attributed to the fact that, in the absence of prior stress, the application of H2O2 did not need to regulate any metabolic processes internally. It is known that H2O2 plays an important role in signal transduction to increase tolerance to abiotic stress, thereby enhancing the survival capacity of plants under adverse conditions [30]. However, it has been demonstrated that under drought stress conditions, priming with low levels of H2O2 stimulates a positive response of genes to stress, resulting in increased vigor indices and germination percentages [31]. Likewise, Hemalatha et al. [30] mention that the germination percentage of rice seeds increased on average by 12% in treatments with H2O2 priming in both sensitive and tolerant varieties to salinity. Furthermore, soaking pea seeds in H2O2 enhances germination, seedling growth, and seedling vigor indices because H2O2 acts as a signaling molecule at the onset of germination, which involves specific changes at the hormonal and proteomic levels [32].
3.5. Effect of Imbibition Time and H2O2 Doses on the Dry Mass Distribution of Different Organs in Pea Seedlings
The root dry mass of pea seedlings showed highly significant differences for both imbibition times and hydrogen peroxide (H2O2) doses; however, the interaction between the factors did not show significant differences. The root dry mass obtained after 12 hours of imbibition was 17.3% lower compared to that obtained after 24 and 36 hours (Figure 4a). Conversely, the 60 mM H2O2 dose resulted in the highest root dry mass, being 4.2% and 26.3% higher than the control treatment and the 20 mM H2O2 dose, respectively (Figure 4b). Likely, 12 hours of imbibition does not provide sufficient hydration of the seed tissues, thus limiting the activation of hydrolytic enzymes and all the processes associated with germination [18]. Similarly, Rodrigues et al. [33] state that imbibition time affects the expression of genes related to the formation of adventitious roots.
At low concentrations, H2O2 serves as a cellular signaler and can activate antioxidant enzymes such as superoxide dismutase, catalase, and peroxidases, which enhance stress tolerance and promote growth. Furthermore, H2O2 is known to regulate the expression of genes related to meristematic cell proliferation in the root [34], which may explain the increased root dry mass obtained with the 60 mM dose.
Stem dry mass exhibited highly significant differences across imbibition times, while H2O2 doses and their interaction did not reveal significant differences for stem dry mass in pea seedlings. The 36-hour imbibition resulted in 22.6% and 60.8% more stem dry mass compared to the 12-hour imbibition, with the latter showing an average value of 0.88 g per seedling by the end of the evaluation. This can be attributed to the complete hydration of the embryo induced by the 36-hour imbibition. Conversely, the evaluated H2O2 concentrations were likely insufficient to induce a priming effect. Additionally, pea seeds contain enzymatic systems that neutralize H2O2, preventing oxidative stress [13] and leading to the absence of significant differences in stem dry mass.
Highly significant differences were observed in imbibition times, as well as significant differences in H2O2 doses and the interaction between factors for the leaflets' dry mass (Figure 5a). Imbibitions for 24 and 36 hours resulted in 24.7% and 30.4% more leaf dry mass, respectively, compared to imbibition for 12 hours. This is attributed to the fact that longer imbibition times lead to more efficient metabolic and hormonal activation, essential for faster leaf growth and development [35].
The 0 mM H2O2 dose produced 22.7% more leaf dry mass than the 60 mM H2O2 dose, which had the lowest values. Regarding the interaction, 36 h imbibition and 0 mM showed the highest leaf dry mass values, 72.4% higher than the 12 h imbibition and 60 mM H2O2 dose, which exhibited the lowest results. According to Barba-Espín et al. [32], the dose of 60 mM of H2O2 can be considered high, potentially inducing oxidative stress that causes damage to lipids, proteins, and DNA, leading to inhibition of cell division and elongation. This, in turn, affects leaf growth, as the process will require additional energy expenditure to activate defense mechanisms.
Stipule dry mass showed highly significant differences in imbibition times and significant differences in the interaction; however, the H2O2 dose factor did not display statistical differences. Imbibition for 24 hours was 21.2% and 47.4% greater than for 36 and 12 hours, respectively. The combination of a 24-hour imbibition time and a 60 mM H2O2 dose produced the highest stipule dry mass, 94.1% higher than the biomass reported for the treatment with 12 hours of imbibition and 20 mM H2O2.
The dry mass of germinated seeds exhibited highly significant differences concerning the imbibition time factor and the interaction, but it did not show differences regarding the H2O2 dose factor. A 12-hour imbibition period resulted in 20.4% and 89.9% more germinated dry matter than the 24- and 36-hour imbibition periods, respectively. The combination of factors that maximized the accumulation of germinated seed dry matter in pea seedlings was a 12-hour imbibition period with a dose of 60 mM H2O2, which was 124.4% higher than the combination of 36 hours and 60 mM, the latter having the lowest values. This indicates that adequate imbibition promotes the translocation of photoassimilates to other emerging parts of the plant. In contrast, a mere 12-hour imbibition period does not ensure complete seed hydration [35], leading to an initial delay in seedling development.
The total dry mass of pea seedlings showed highly significant differences between imbibition times and their interaction, while significant differences were observed only for the H2O2 dose (Figure 5b). Imbibition for 24 hours resulted in the highest total dry mass values, measuring 2.9% and 17.5% greater than those for imbibition times of 12 and 36 hours, respectively. Concerning the dose factor, the 0 mM H2O2 treatment had, on average, 5.7% more total seedling dry mass compared to the treatments that received H2O2 application. According to Makhaye et al. [35]), the imbibition process can be divided into three phases: in the first, rapid water absorption occurs; in the second, metabolic activation takes place; and in the third, embryo growth begins. Therefore, it is likely that 24-hour imbibition allows seeds to adequately complete these phases, especially Phase II, which is crucial for activating hydrolytic enzymes. It is known that high concentrations of H2O2, in addition to the oxidative damage they produce, alter hormone balance, as H2O2 stimulates the catalysis of ABA, inhibiting the germination process and generating an imbalance in the ABA/GA ratio [36].
3.6. Effect of Imbibition Time and H2O2 Doses on the Leaf Area of Pea Seedlings
The SLA showed highly significant differences between imbibition times and was significant among the different H2O2 doses, while the interaction demonstrated highly significant differences (Table 5, Figure 5c). Imbibition for 24 h was 39.4% and 6.9% higher than imbibition for 12 and 36 h, respectively. Regarding H2O2 doses, seedlings from the control treatment displayed the highest SLA values, surpassing all tested H2O2 doses, specifically 20.5% higher than the SLA recorded with the 40 mM H2O2 dose. Conversely, the combination of 36 h of imbibition and 60 mM H2O2 resulted in the highest SLA, being 78.7% higher than the application of 60 mM H2O2 with 12 h of imbibition.
Significant differences were observed for both LA and TLA regarding the imbibition factor and the interaction, while LA and TLA did not exhibit significant differences for the various H2O2 doses evaluated. The 36-hour imbibition period resulted in LA and TLA increases of 37.9% and 35.4%, respectively, compared to the 12-hour imbibition treatment. Conversely, the control indicated 11.5% and 10.8% higher LA and TLA, respectively, than the applications of 60 and 40 mM H2O2. Concerning the interaction, the combination of a 36-hour imbibition and a 20 mM H2O2 dose achieved the highest LA and TLA, being 119.7% and 91.8% greater than the 12-hour imbibition with a 60 mM dose, illustrating the significant impact that LA has on TLA.
3.6. Analysis of the Response Surface Models Obtained for Pea Seed Germination Parameters and Seedling Biomass
Table 6 presents the estimated coefficients of the response surface model obtained for the variables of seed germination and seedling growth of pea for NaCl doses. The GR shows a high base value (a = 84.58%) but a low coefficient of determination (r² = 0.3036), suggesting that other factors independent of those evaluated influence the GR. The MGT decreases with increasing NaCl doses and imbibition time (negative coefficients for b and c), with a moderate coefficient of determination (r²) (0.5580), indicating that these factors partially explain the observed variability. The dry mass of roots and leaves showed contrasting responses, since root dry mass increases with imbibition time (positive b), while leaflet dry biomass decreases (negative b). Stipule dry mass and germinated seed dry mass exhibited the highest r² values (0.6027 and 0.5706, respectively), indicating that the model best explains these variables. Salt stress and imbibition time differentially affect biomass distribution, with a notable impact on germination and initial seedling growth.
Table 7 presents the estimated coefficients for leaf and total dry mass, as well as for stipule leaf area (SLA) in response to the H₂O₂ assay. The SLA intercept (a) value is the highest at 78.39, indicating that stipules are sensitive to oxidative stress. Conversely, the negative coefficients for c (H₂O₂ dose) on total dry mass and stipule leaf area suggest that high concentrations reduce these parameters; however, the low r² values (0.3469 and 0.4763, respectively) indicate that other factors influence the variability. The estimated value for the product of imbibition time and dose (e) has a slight but significant effect on SLA, suggesting that imbibition time modulates the response to H₂O₂. Overall, H₂O₂ impacted leaf biomass more than total biomass.
5. Conclusions
Soaking seeds in NaCl or H₂O₂ for 24 hours was optimal for achieving the highest germination percentages and potentials. A 50 mM NaCl dose with 24-hour presoaking resulted in the best values for mean germination time, germination potential, and germination percentage. The application of 150 mM NaCl delayed the translocation of photoassimilates from the seed to other seedling organs; this dose led to the highest dry mass in germinated seeds while reducing the dry mass of roots, stems, leaves, and stipules, yet maintaining similar total dry mass values. Soaking for 24 hours increased the germination rate, germination potential, and germination rate index, while reducing the mean germination time. Applying H₂O₂ increased root dry mass but decreased leaf and total dry mass. Longer seed imbibition times had a positive influence on dry mass accumulation in leaves, stipules, and leaflet area. The 0 mM H₂O₂ dose produced the highest total biomass in pea seedlings.
Author Contributions
Conceptualization, O.A.S.; methodology, O.A.S. and J.S.L.; software, J.A.H.; validation, O.A.S. and J.A.H.; formal analysis, J.A.H.; investigation, J.S.L.; resources, O.A.S.; data curation, J.A.H.; writing—original draft preparation, J.S.L. and J.A.H.; writing—review and editing, O.A.S. and J.A.H.; visualization, J.A.H.; supervision, O.A.S.; project administration, J.A.H.; funding acquisition, O.A.S. and J.A.H. All authors have read and agreed to the published version of the manuscript.
Funding
This research was funded by the Research Directorate (DIN) of the Universidad Pedagógica y Tecnológica de Colombia, through project SGI 3477.
Institutional Review Board Statement
Not applicable.
Informed Consent Statement
Not applicable.
Data Availability Statement
Data will be available upon request.
Acknowledgments
We would like to thank DIN, Universidad Pedagógica y Tecnológica de Colombia, for financial support.
Conflicts of Interest
The authors declare no conflicts of interest.
References
- Parihar, A.K.; Dixit, G.P.; Singh, U.; Singh, A.K.; Kumar, N.; Gupta, S. Potential of field pea as a nutritionally rich food legume crop. In Breeding for Enhanced Nutrition and Bio-Active Compounds in Food Legumes, 1st ed.; Gupta, D.S., Gupta, S., Kumar, J., Eds.; Springer Cham, Switzerland, 2021; pp. 47-82. [CrossRef]
- Checa, O.; Rodríguez, D.; Ruiz, M.; Muriel, J. La Arveja-Investigación y tecnología en el sur de Colombia, Editorial Universidad de Nariño, San Juan de Pasto, Colombia, 2022. http://sired.udenar.edu.co/id/eprint/7303.
- Agronet. Agricultural statistics: Area, production, yield and participation in pea cultivation. Available online: https://www.agronet.gov.co/Docu-ments/8-ARVEJA_2017.pdf (accessed on 11 02 2024) (In Spanish).
- Jaime-Guerrero, M.; Álvarez-Herrera, J. G.; Torres-Piña, D. S. Obtención de plántulas a partir de diferentes tratamientos pregerminativos en semillas de arveja. Entramado 2025, 21(41), 1-12. [CrossRef]
- Wagan, M.A.; Shar, H.A.; Miano, T.F.; Chandio, S.R.; Suthar, M.; Wagan, M.K.; Kumar, A.; Wagan, F.A.; Magsi, H.A. Influence of seed priming on germination of pea (Pisum sativum). Int. J. Agric. Stud. 2022, 1(1), 31-37. [CrossRef]
- Mahawar, M.K.; Samuel, D.V.K.; Sinha, J. P.; Jalgaonkar, K. Optimization of pea (Pisum sativum) seeds hydropriming by application of response surface methodology. Acta Physiol. Plant. 2016, 38, 1-13. [CrossRef]
- Khan, M.O.; Irfan, M.; Muhammad, A.; Ullah, I.; Nawaz, S.; Khalil, M.K.; Ahmad, M. A practical and economical strategy to mitigate salinity stress through seed priming. Front. Environ. Sci. 2022, 10, 991977. [CrossRef]
- Lal, S.K.; Kumar, S.; Sheri, V.; Mehta, S.; Varakumar, P.; Ram, B.; Borphukan, B.; James, D.; Fartyal, D.; Reddy, M.K. Seed priming: an emerging technology to impart abiotic stress tolerance in crop plants. In Advances in seed priming, 1st ed.; Rakshit, A., Singh, H.B., Eds.; Springer Singapore, Singapore, 2018; pp. 41-50. [CrossRef]
- Savvides, A.; Ali, S.; Tester, M.; Fotopoulos, V. Chemical priming of plants against multiple abiotic stresses: mission possible?. Trends Plant Sci. 2016, 21(4), 329-340. [CrossRef]
- Kiran, K.R.; Deepika, V.B.; Swathy, P.S.; Prasad, K.; Kabekkodu, S.P.; Murali, T. S.; Satyamoorthy, K.; Muthusamy, A. ROS-dependent DNA damage and repair during germination of NaCl primed seeds. J. Photochem. Photobiol. B 2020, 213, 112050. [CrossRef]
- Pandolfi, C.; Mancuso, S.; Shabala, S. Physiology of acclimation to salinity stress in pea (Pisum sativum). Environ. Exp. Bot. 2012, 84, 44-51. [CrossRef]
- Senturk, B.; Sivritepe, O.H. NaCl priming alleviates the inhibiting effect of salinity during seeding growth of peas (Pisum sativum L.). Fresen. Environ. Bull. 2016, 25(10), 4202-4208. https://www.prt-parlar.de/download_list/?c=FEB_2016#.
- Ellouzi, H.; Oueslati, S.; Hessini, K.; Rabhi, M.; Abdelly, C. Seed-priming with H2O2 alleviates subsequent salt stress by preventing ROS production and amplifying antioxidant defense in cauliflower seeds and seedlings. Sci. Hortic. 2021, 288, 110360. [CrossRef]
- Moussa, H.R.; Mohamed, M.A.E.H. Role of nitric acid or H2O2 in antioxidant defense system of Pisum sativum L. under drought stress. Nat. Sci. 2011, 9, 211-216. https://www.sciencepub.net/nature/ns0905/30_5479ns0905_211_216.pdf.
- Cadena-Guerrero, M.M.; Yepes-Chamorro, D.B.; Romero, J.V. Estabilidad fenotípica de arveja (Pisum sativum L.) en la zona productora de Nariño, Colombia. Agron. Mesoam. 2021, 32, 841-853. [CrossRef]
- Checa, O.; Rodríguez, M.; Wu, X.; Blair, M. Introgression of the Afila gene into climbing garden pea (Pisum sativum L.). Agronomy 2020, 10(10), 1537. [CrossRef]
- Easlon, H.M.; Bloom, A.J. Easy Leaf Area: Automated digital image analysis for rapid and accurate measurement of leaf area. Appl. Plant Sci. 2014, 2(7), 1400033. [CrossRef]
- Pompelli, M.F.; Jarma-Orozco, A.; Rodríguez-Páez, L.A. Imbibition and germination of seeds with economic and ecological interest: Physical and biochemical factors involved. Sustainability 2023, 15(6), 5394. [CrossRef]
- Cao, Y.; Liang, L.; Cheng, B.; Dong, Y.; Wei, J.; Tian, X.; Peng, Y.; Li, Z. Pretreatment with NaCl promotes the seed germination of white clover by affecting endogenous phytohormones, metabolic regulation, and dehydrin-encoded genes expression under water stress. Int. J. Mol. Sci. 2018, 19(11), 3570. [CrossRef]
- Kyari, B.A.; Lawan, Z.A.; Waziri, M.S.; Ajiri, H.M.; Apagu, B.; Mari, H.; Ibrahim, M.A. Effect of imbibition time on hormonal changes of germinating Tamarindus indica and Prosopis juliflora. Indones. J. Agric. Res. 2022, 5(3), 219-230. [CrossRef]
- Saha, D.; Choyal, P.; Mishra, U.N.; Dey, P.; Bose, B.; Gupta, N.K.; Prathibha, M.D.; Mehta, B.K.; Kumar, P.; Pandey, S.; Chauhan, J.; Singhal, R.K. Drought stress responses and inducing tolerance by seed priming approach in plants. Plant Stress 2022, 4, 100066. [CrossRef]
- Naz, F.; Gul, H.; Hamayun, M.; Sayyed, A.; Khan, H.; Sherwani, S. Effect of NaCl stress on Pisum sativum germination and seedling growth with the influence of seed priming with potassium (KCL and KOH). Am.-Euras. J. Agric. Environ. Sci. 2014, 14(11), 1304-1311. [CrossRef]
- Souza, L.M.D.; Conceição, E.M.D.; Barbosa, M.R.; Palhares, L.; Santos, A.M.M.D.; Souza, R.A.D.; Houllou, L.M. Effect of seed priming with NaCl on the induction of salinity tolerance in Myracrodruon urundeuva Allemão in vitro. Ciênc. Florest. 2022, 32(4), 2199-2218. [CrossRef]
- Ehtaiwwesh, A.F.; Emsahel, M.J. Impact of salinity stress on germination and growth of pea (Pisum sativum L.) plants. Al-Mukhtar J. Sci. 2020, 35, 146-159. https://search.emarefa.net/detail/BIM-1324653.
- Atta, K.; Mondal, S.; Gorai, S.; Singh, A.P.; Kumari, A.; Ghosh, T.; Roy, A.; Hembram, S.; Gaikwad, D.J.; Mondal, S.; Bhattacharya, S.; Jha, U.C.; Jespersen, D. Impacts of salinity stress on crop plants: Improving salt tolerance through genetic and molecular dissection. Front. Plant Sci. 2023, 14, 1241736. [CrossRef]
- Smolko, A.; Bauer, N.; Pavlović, I.; Pěnčík, A.; Novák, O.; Salopek-Sondi, B. Altered root growth, auxin metabolism and distribution in Arabidopsis thaliana exposed to salt and osmotic stress. Int. J. Mol. Sci. 2021, 22(15), 7993. [CrossRef]
- Colin, L.; Ruhnow, F.; Zhu, J.K.; Zhao, C.; Zhao, Y.; Persson, S. The cell biology of primary cell walls during salt stress. Plant cell 2023, 35(1), 201-217. [CrossRef]
- Jaime-Guerrero, M.; Álvarez-Herrera, J. G.; Camacho-Tamayo, J. Germinación y crecimiento de semillas de arveja var. ‘Santa Isabel’ sometidas a diferentes dosis de giberelinas. Rev. Investig. Agrar. Ambient. 2023, 14(2), 91-112. [CrossRef]
- Hernández, J. A. Seed science research: Global trends in seed biology and technology. Seeds 2022, 1(1), 1-4. [CrossRef]
- Hemalatha, G.; Renugadevi, J.; Eevera, T. Studies on seed priming with hydrogen peroxide for mitigating salt stress in rice. Int. J. Curr. Microbiol. App. Sci. 2017, 6(6), 691-695. [CrossRef]
- Hameed, A.; Hussain, S.; Nisar, F.; Rasheed, A.; Shah, S. Z. Seed priming as an effective technique for enhancing salinity tolerance in plants: mechanistic insights and prospects for saline agriculture with a special emphasis on halophytes. Seeds 2025, 4(1), 14. [CrossRef]
- Barba-Espín, G.; Hernández, J.A.; Diaz-Vivancos, P. Role of H2O2 in pea seed germination. Plant Signal. Behav. 2012, 7(2), 193-195. [CrossRef]
- Rodrigues, L.; Nogales, A.; Nunes, J.; Rodrigues, L.; Hansen, L.D.; Cardoso, H. Germination of Pisum sativum L. seeds is associated with the alternative respiratory pathway. Biology 2023, 12(10), 1318. [CrossRef]
- Liu, H.; Mu, Y.; Xuan, Y.; Wu, X.; Wang, W.; Zhang, H. Hydrogen peroxide signaling in the maintenance of plant root apical meristem activity. Antioxidants 2024, 13(5), 554. [CrossRef]
- Makhaye, G.; Mofokeng, M.M.; Tesfay, S.; Aremu, A.O.; Van Staden, J.; Amoo, S.O. Influence of plant biostimulant application on seed germination. In Biostimulants for crops from seed germination to plant development, 1st ed.; Gupta, S., Staden, J., Eds.; Academic Press, Cambridge, 2021; pp. 109-135. [CrossRef]
- Wojtyla, Ł.; Lechowska, K.; Kubala, S.; Garnczarska, M. Different modes of hydrogen peroxide action during seed germination. Front. Plant Sci. 2016, 7, 66. [CrossRef]
Figure 1.
Temperature and relative humidity recorded in the mesh house at UPTC during the research period. The dotted lines mark the start (16/08/2023) and end (06/09/2023) of the first trial, and the period from 16/09/2023 to 06/10/2023 for the second trial.
Figure 1.
Temperature and relative humidity recorded in the mesh house at UPTC during the research period. The dotted lines mark the start (16/08/2023) and end (06/09/2023) of the first trial, and the period from 16/09/2023 to 06/10/2023 for the second trial.
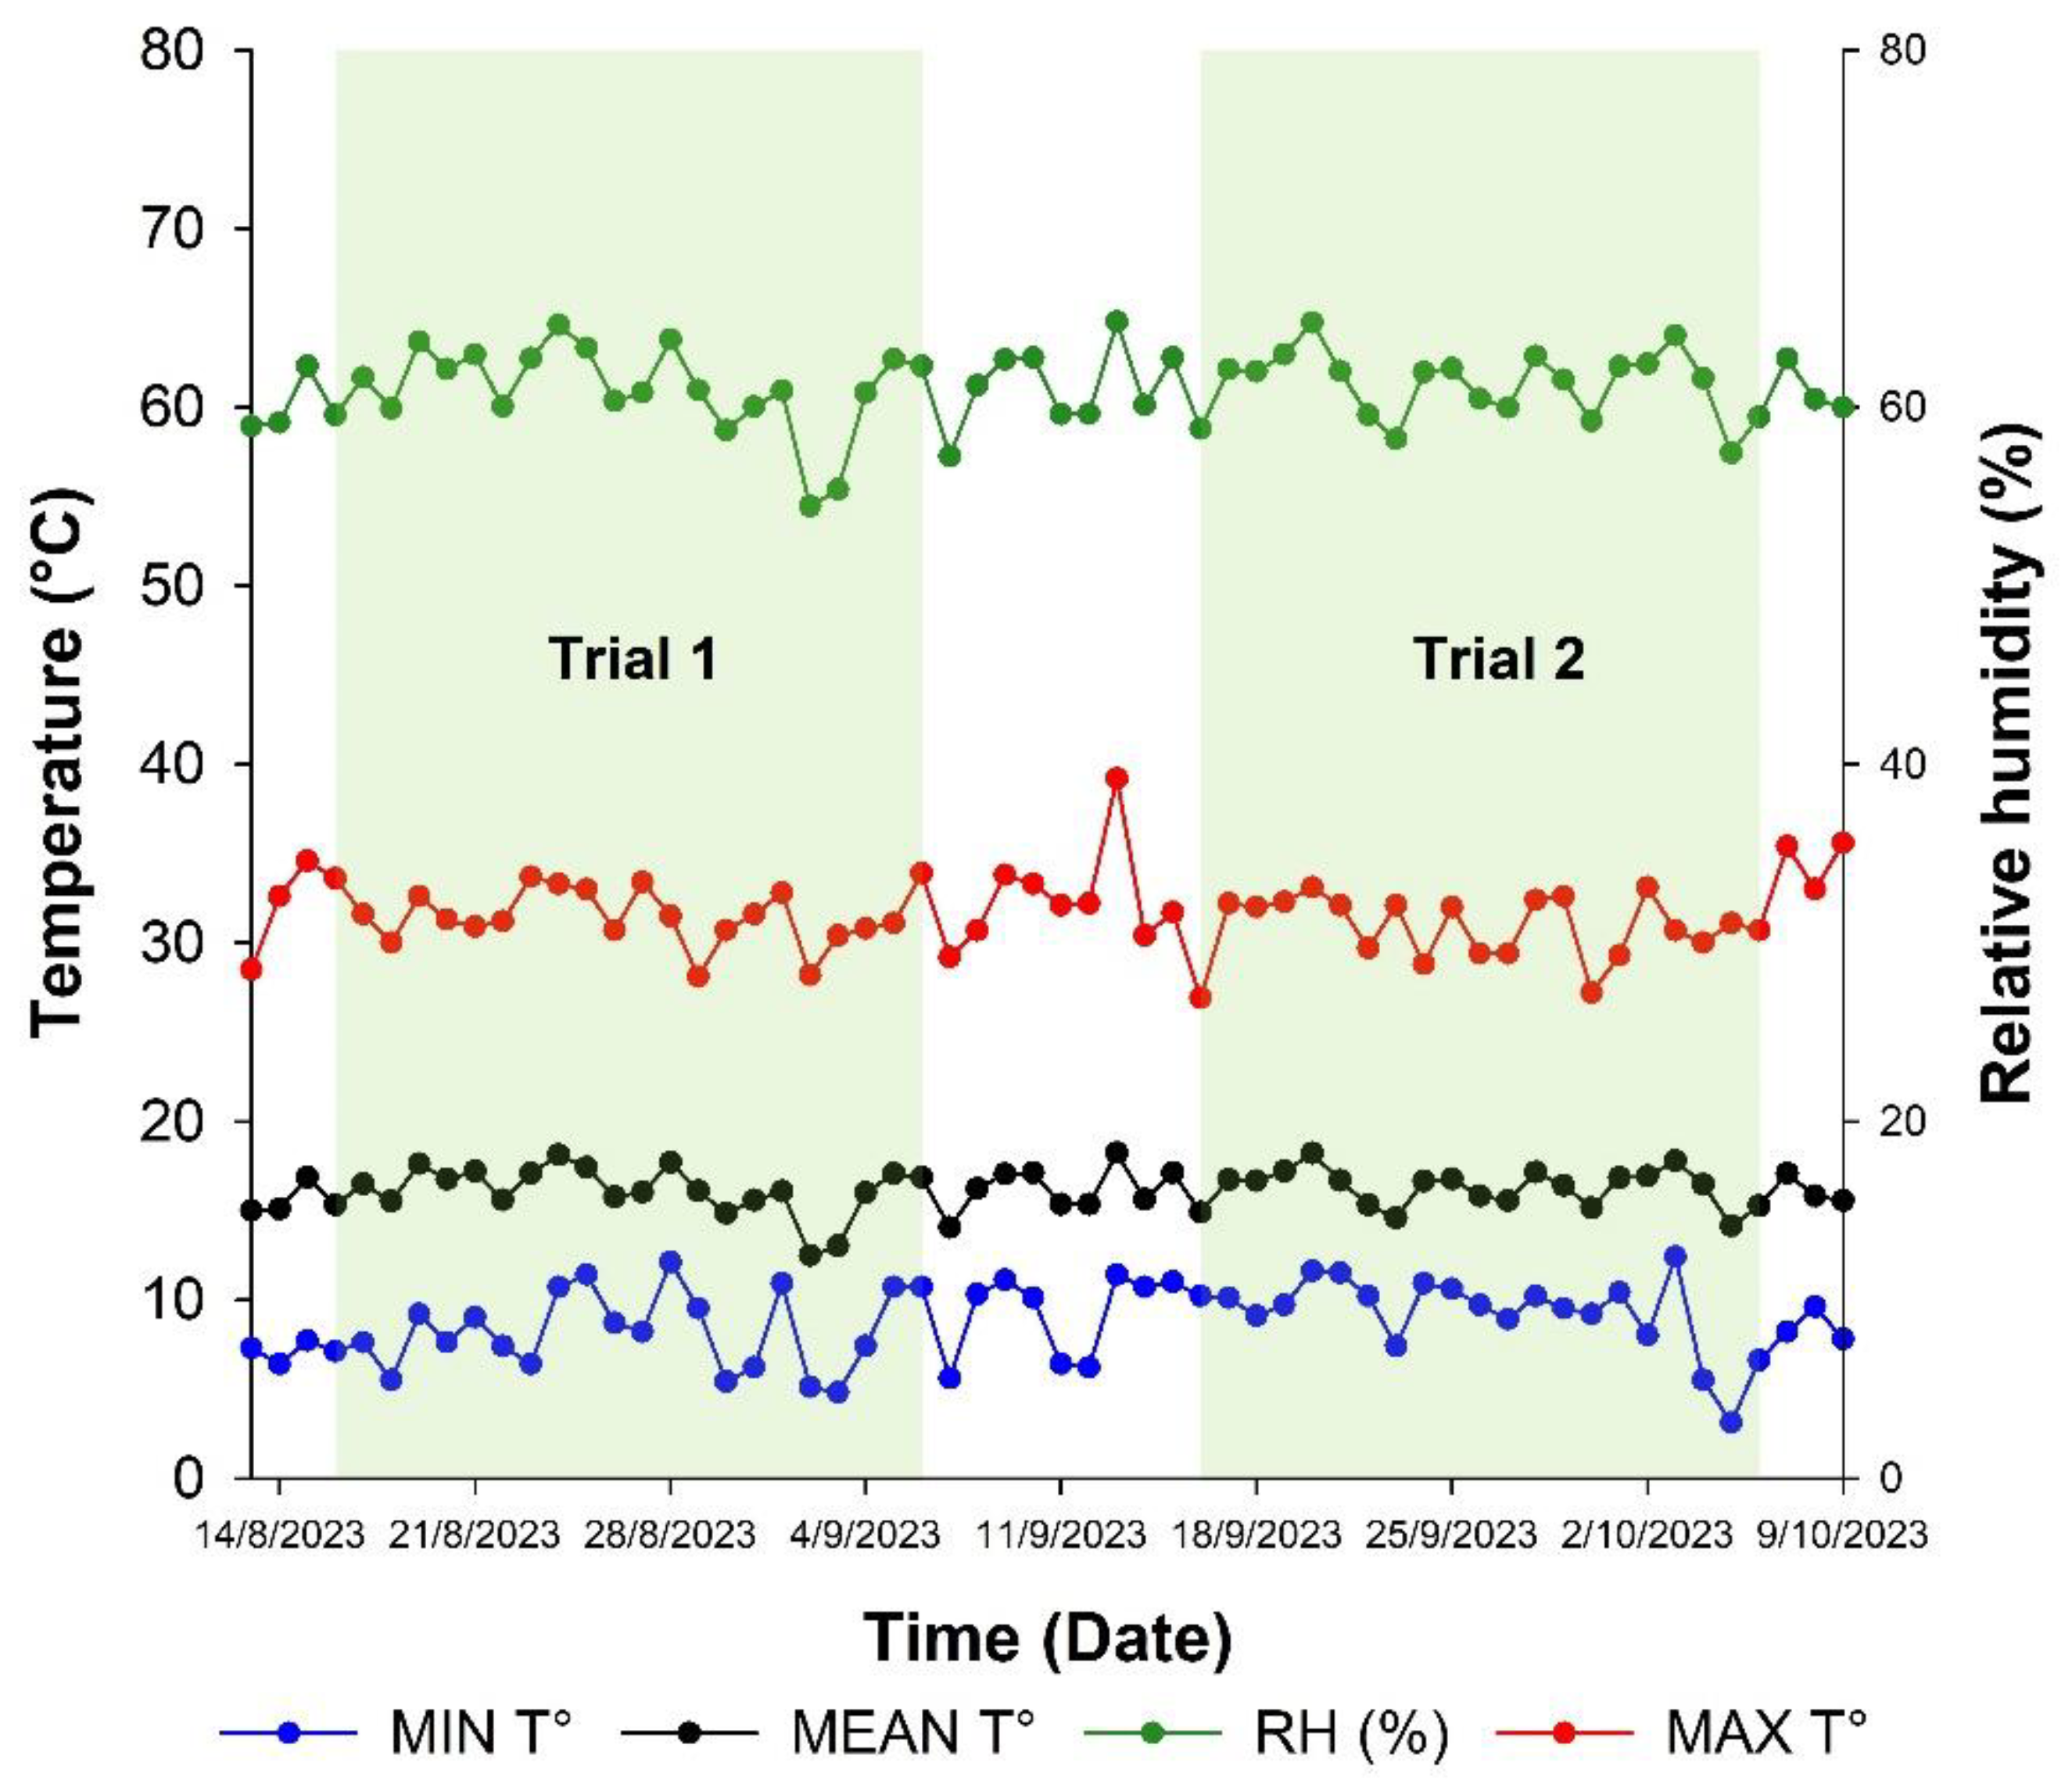
Figure 2.
Response surfaces of (a) germination rate, (b) MGT (mean germination time), (c) root, (d) leaflets, (e) stipule, (f) and germinated seed dry mass, of pea seedlings from seeds subjected to different imbibition times and NaCl doses.
Figure 2.
Response surfaces of (a) germination rate, (b) MGT (mean germination time), (c) root, (d) leaflets, (e) stipule, (f) and germinated seed dry mass, of pea seedlings from seeds subjected to different imbibition times and NaCl doses.
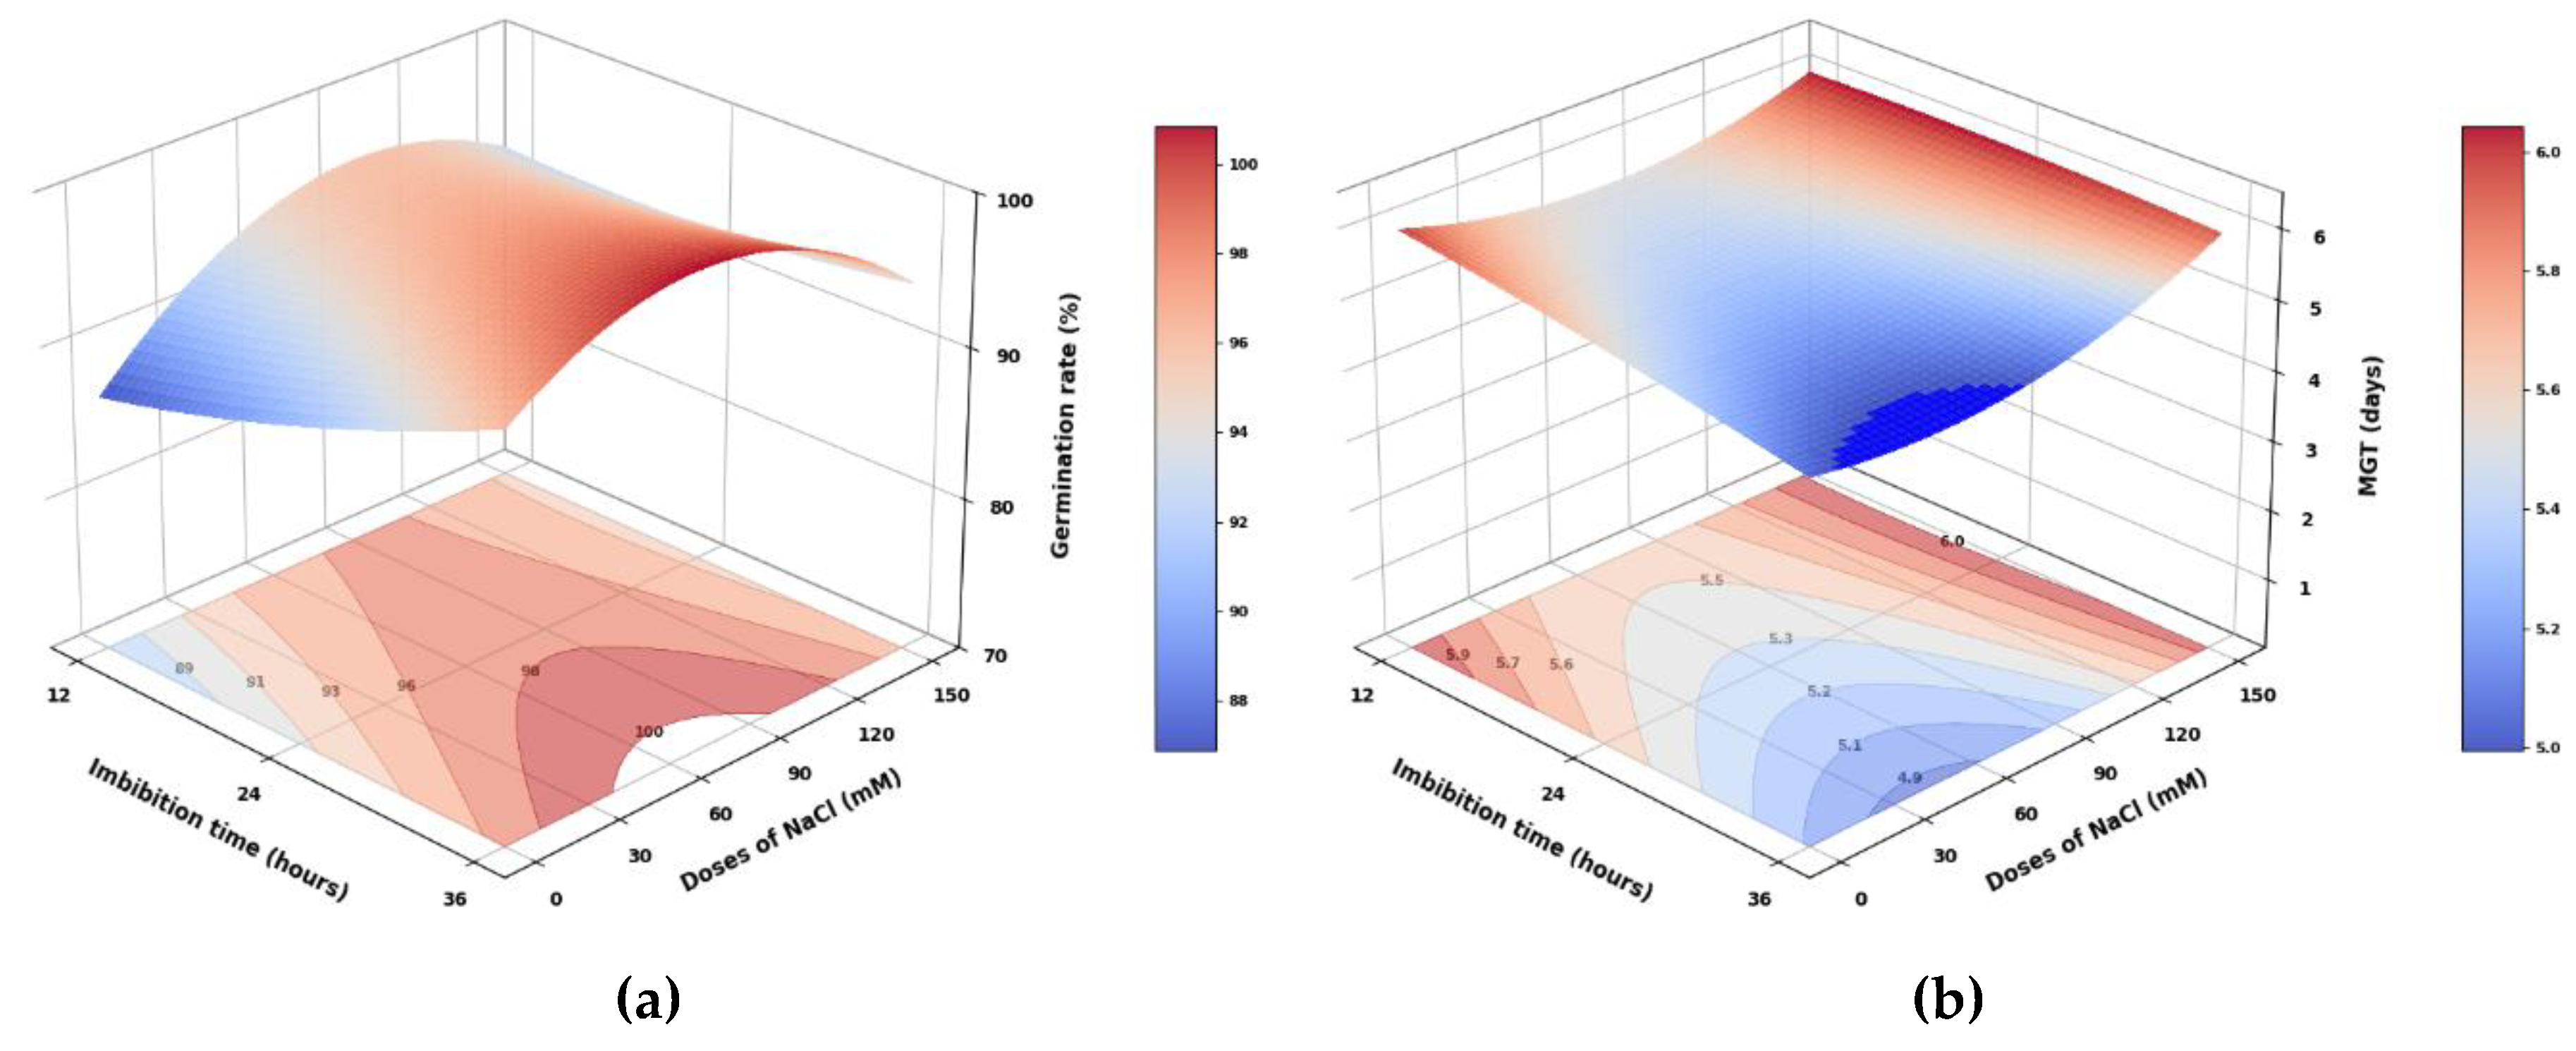
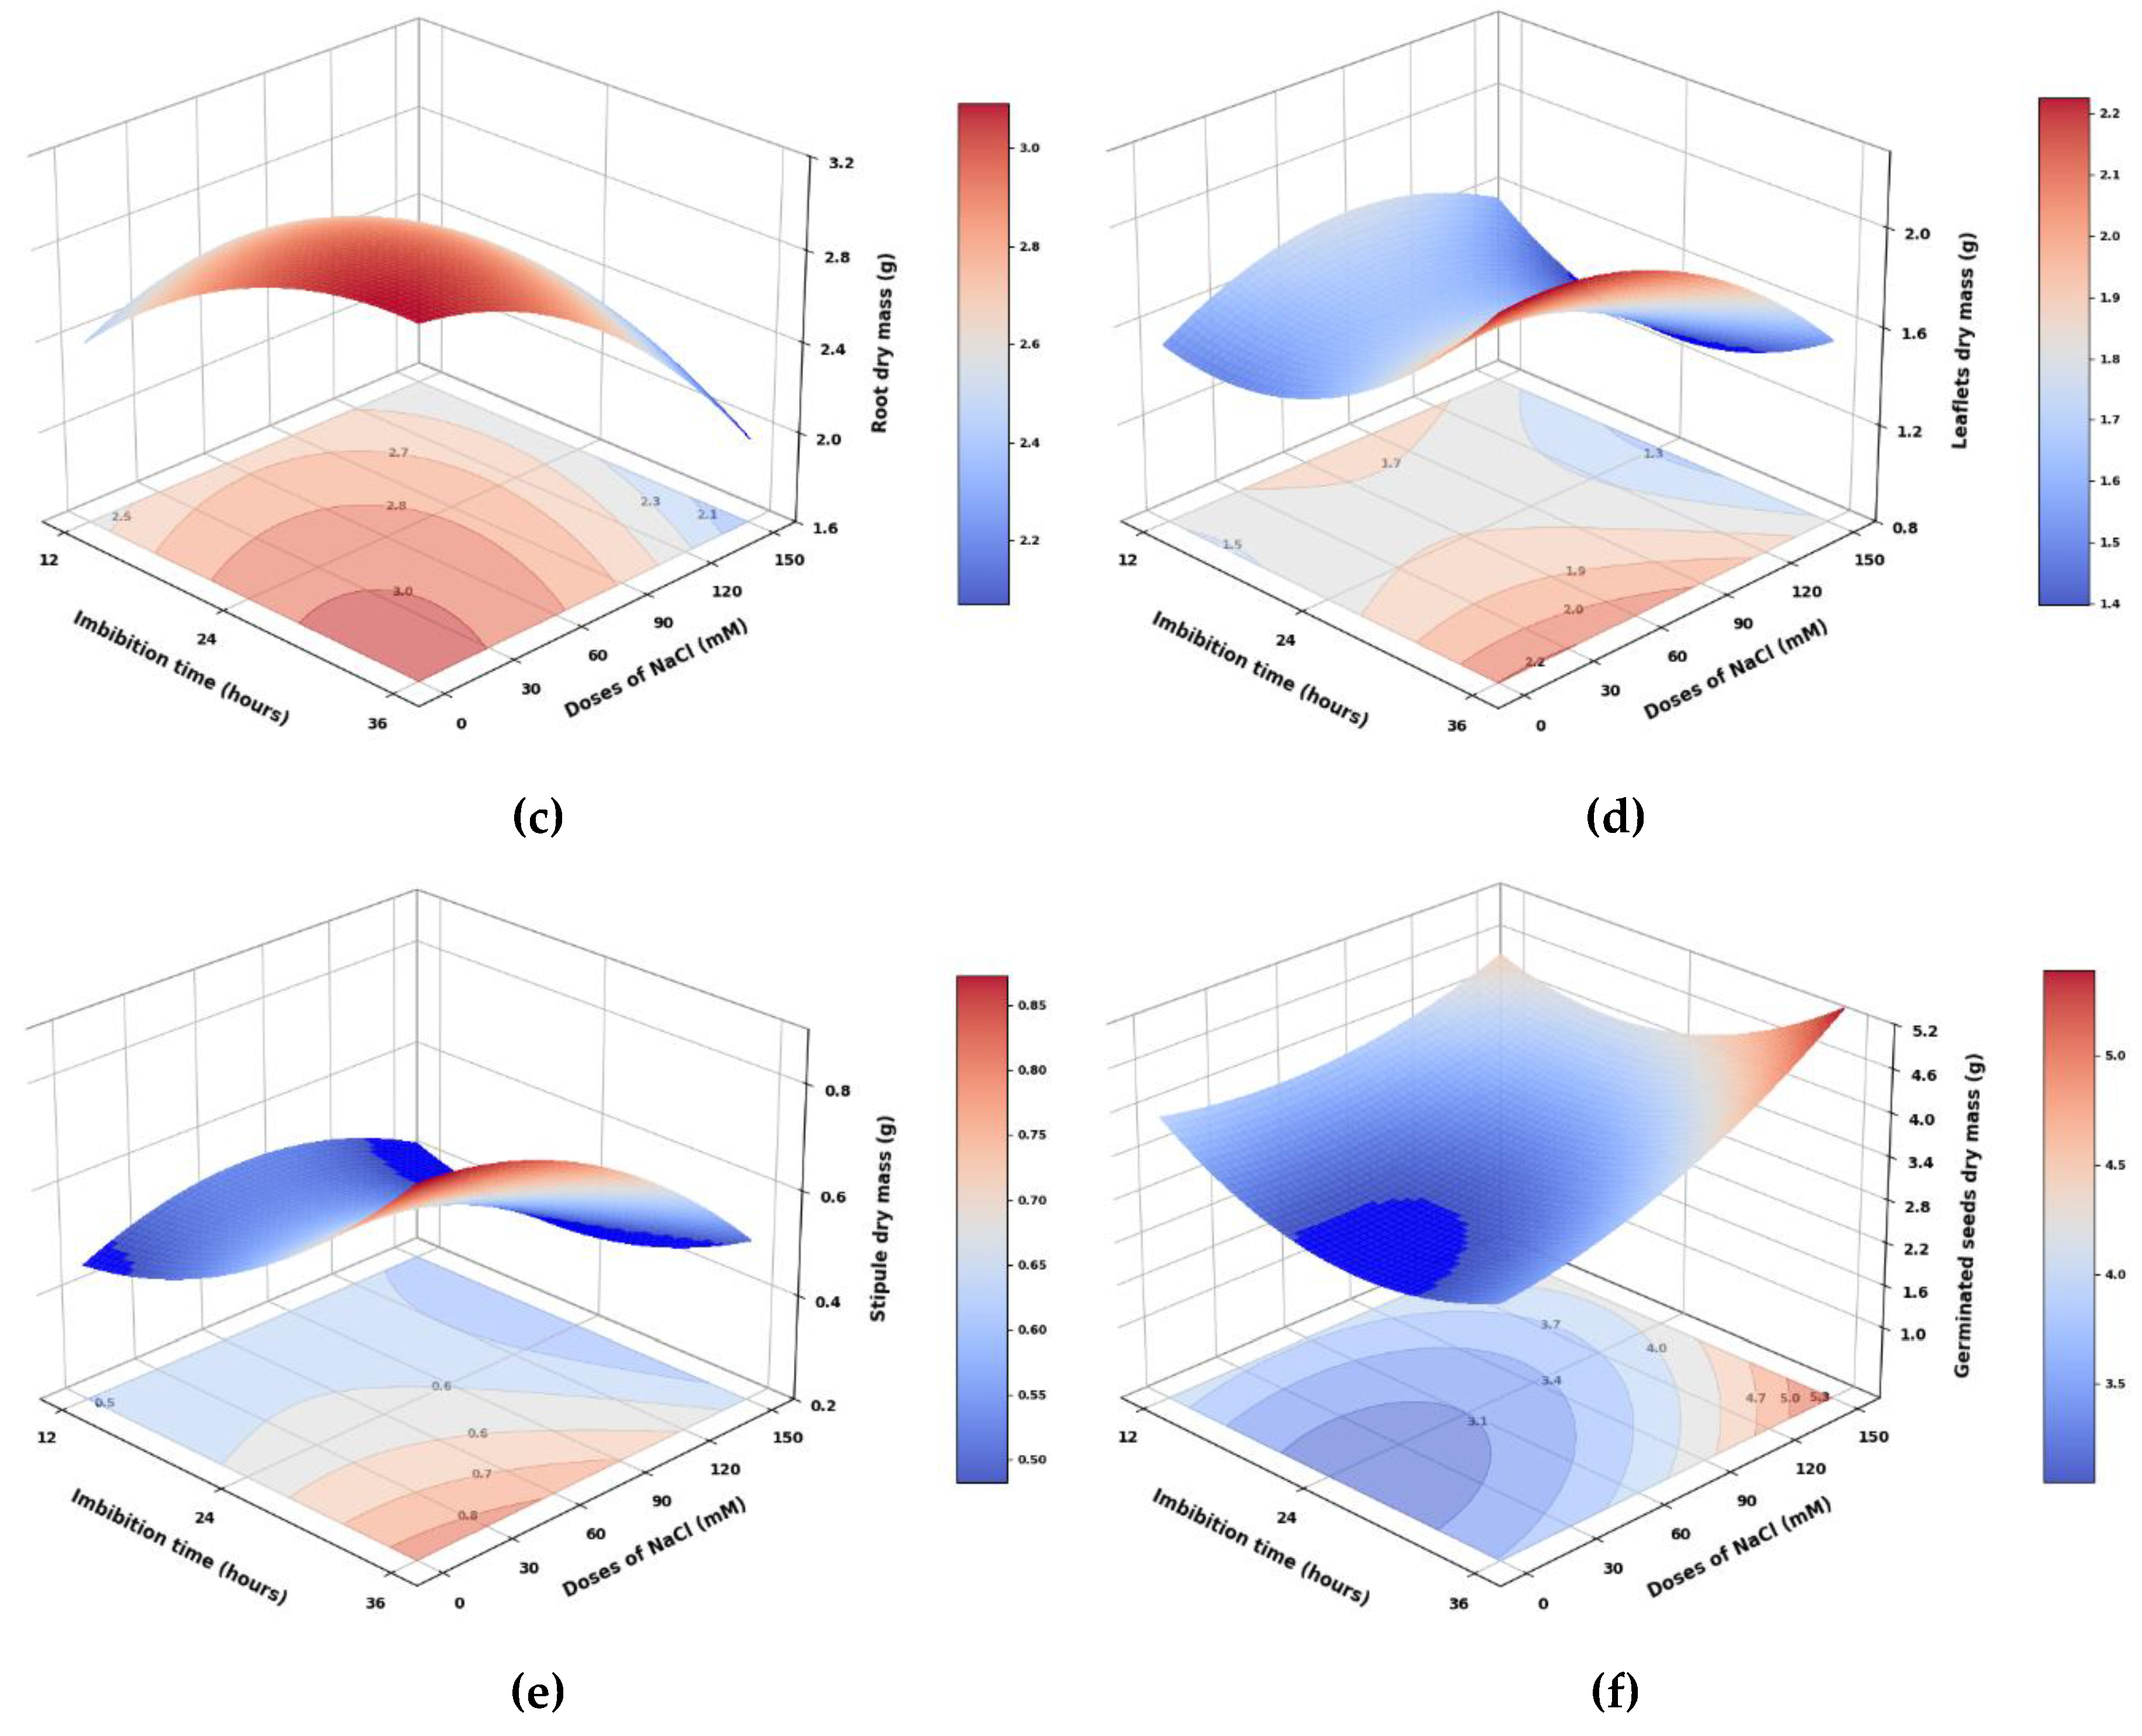
Figure 3.
Dry mass of root, stem, leaves, stipules, and germinated seed of pea seedlings from seeds subjected to different (a) imbibition times and (b) NaCl doses. Different lowercase letters indicate significant differences between treatments for the same seedling organ and total masses, respectively, according to Tukey (p < 0.05). Vertical bars indicate the standard error of the total dry mass for imbibition times and NaCl doses (n=20 and n=15, respectively).
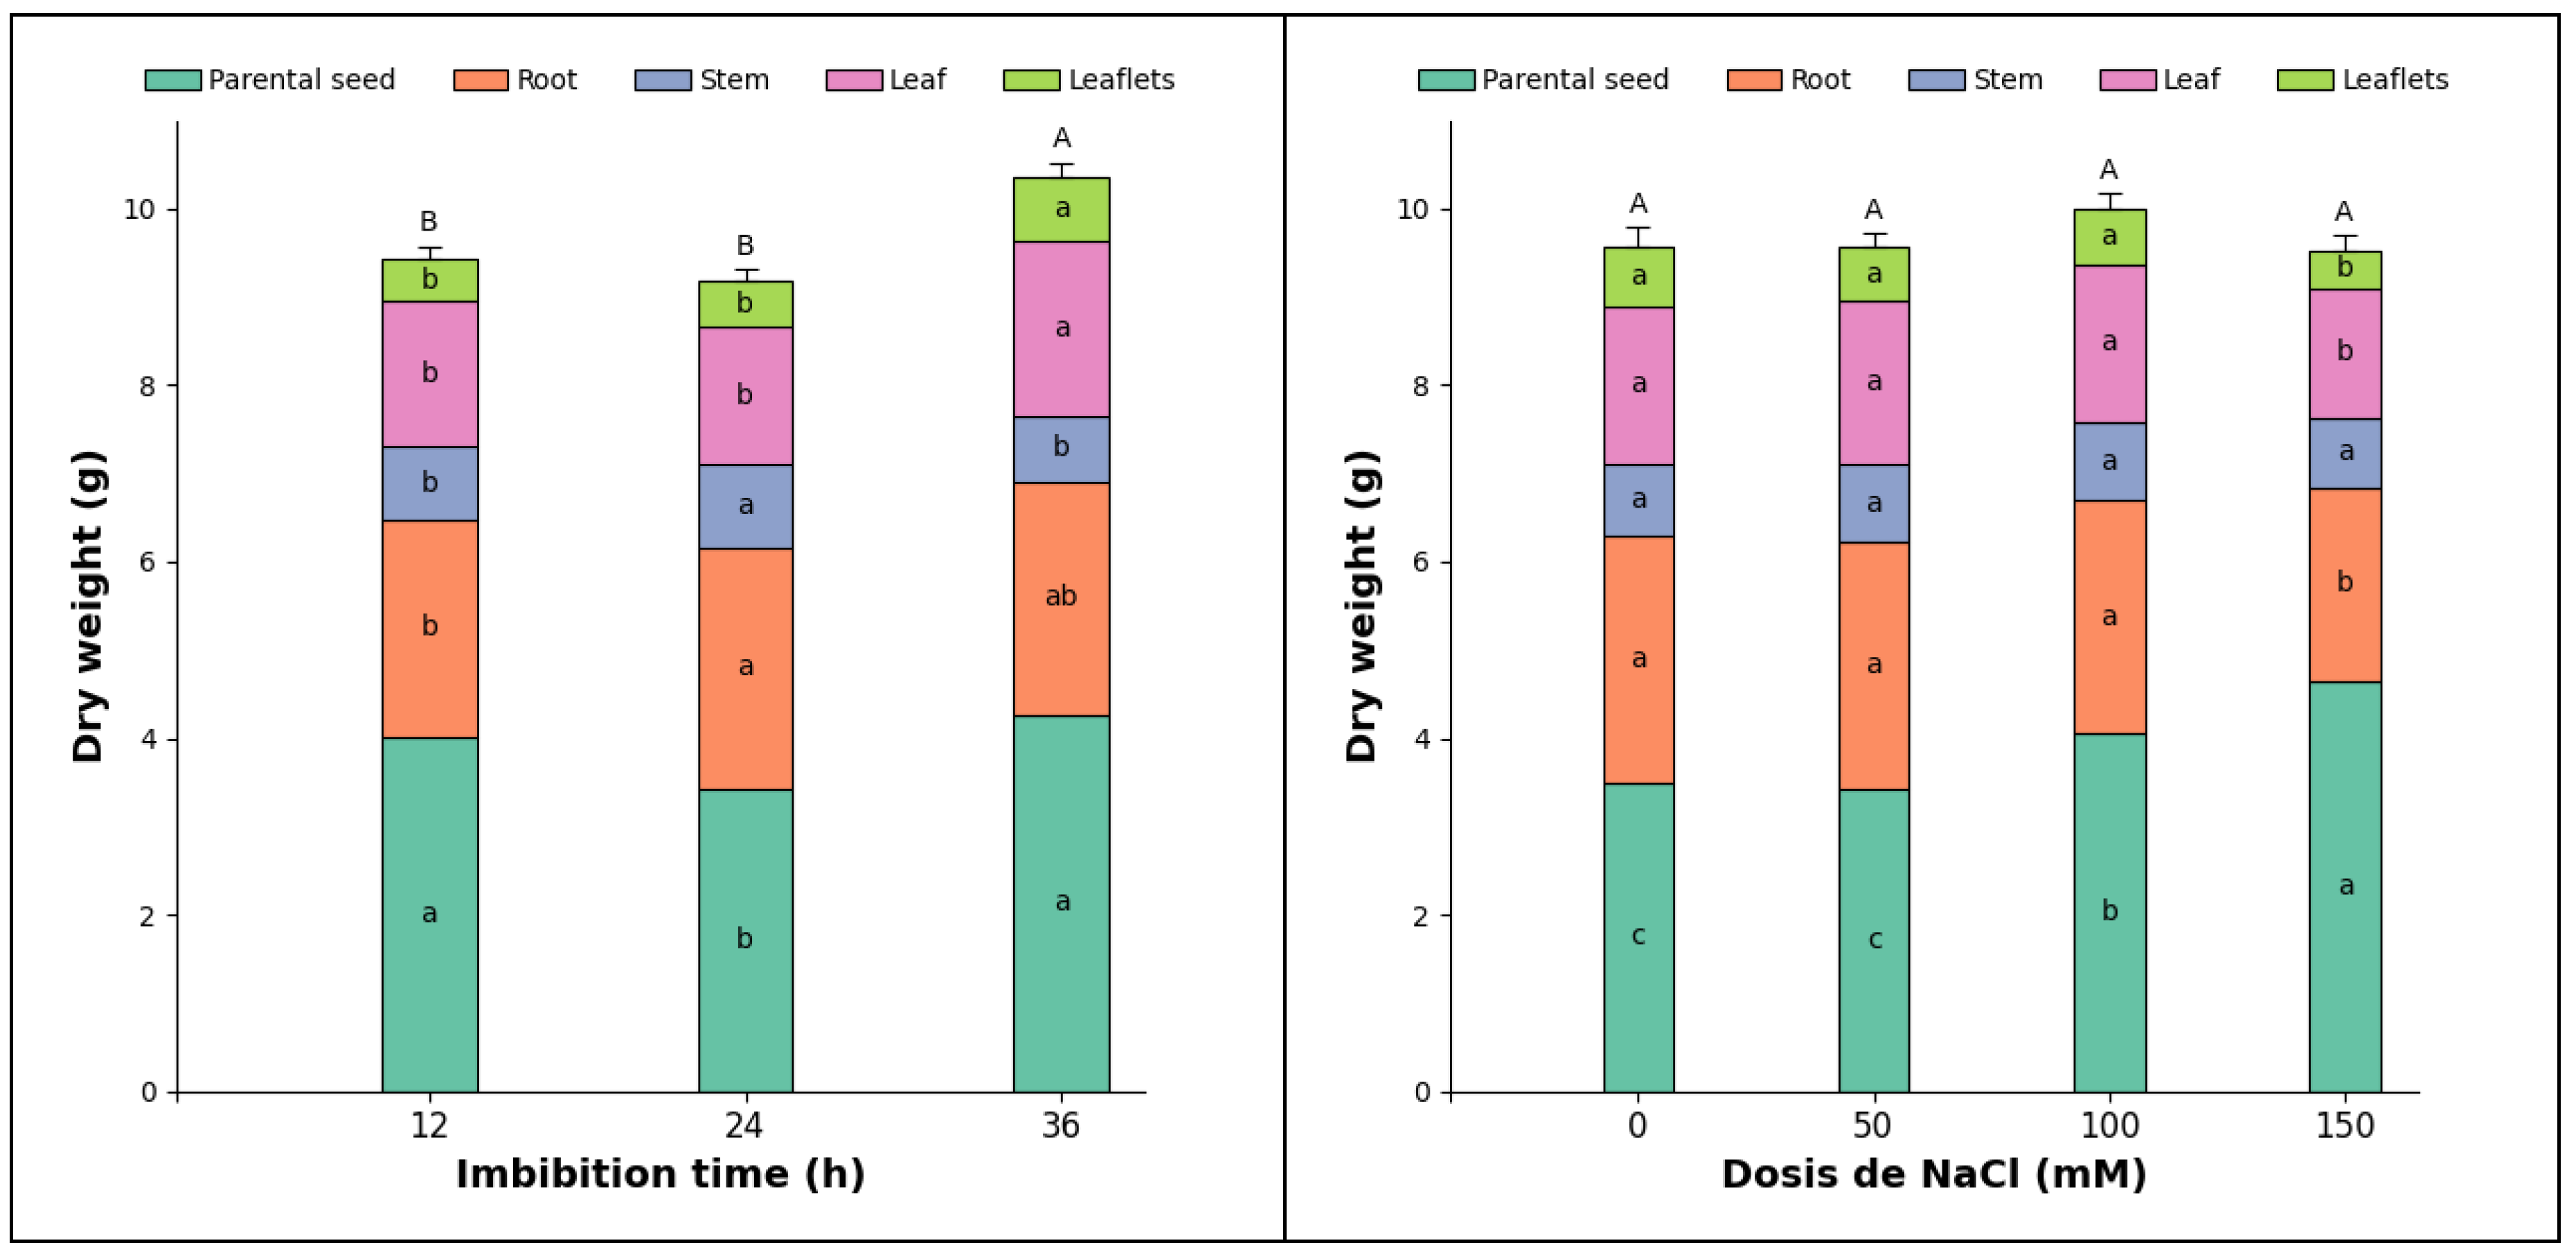
Figure 4.
Dry mass of root, stem, leaves, stipules, and germinated seed of pea seedlings from seeds subjected to different (a) imbibition times and (b) H2O2 doses. Different lowercase letters indicate significant differences between treatments for the same seedling organ and total masses, respectively, according to Tukey (p < 0.05). Vertical bars indicate the standard error of the total dry mass for imbibition times and H2O2 doses (n=20 and n=15, respectively).
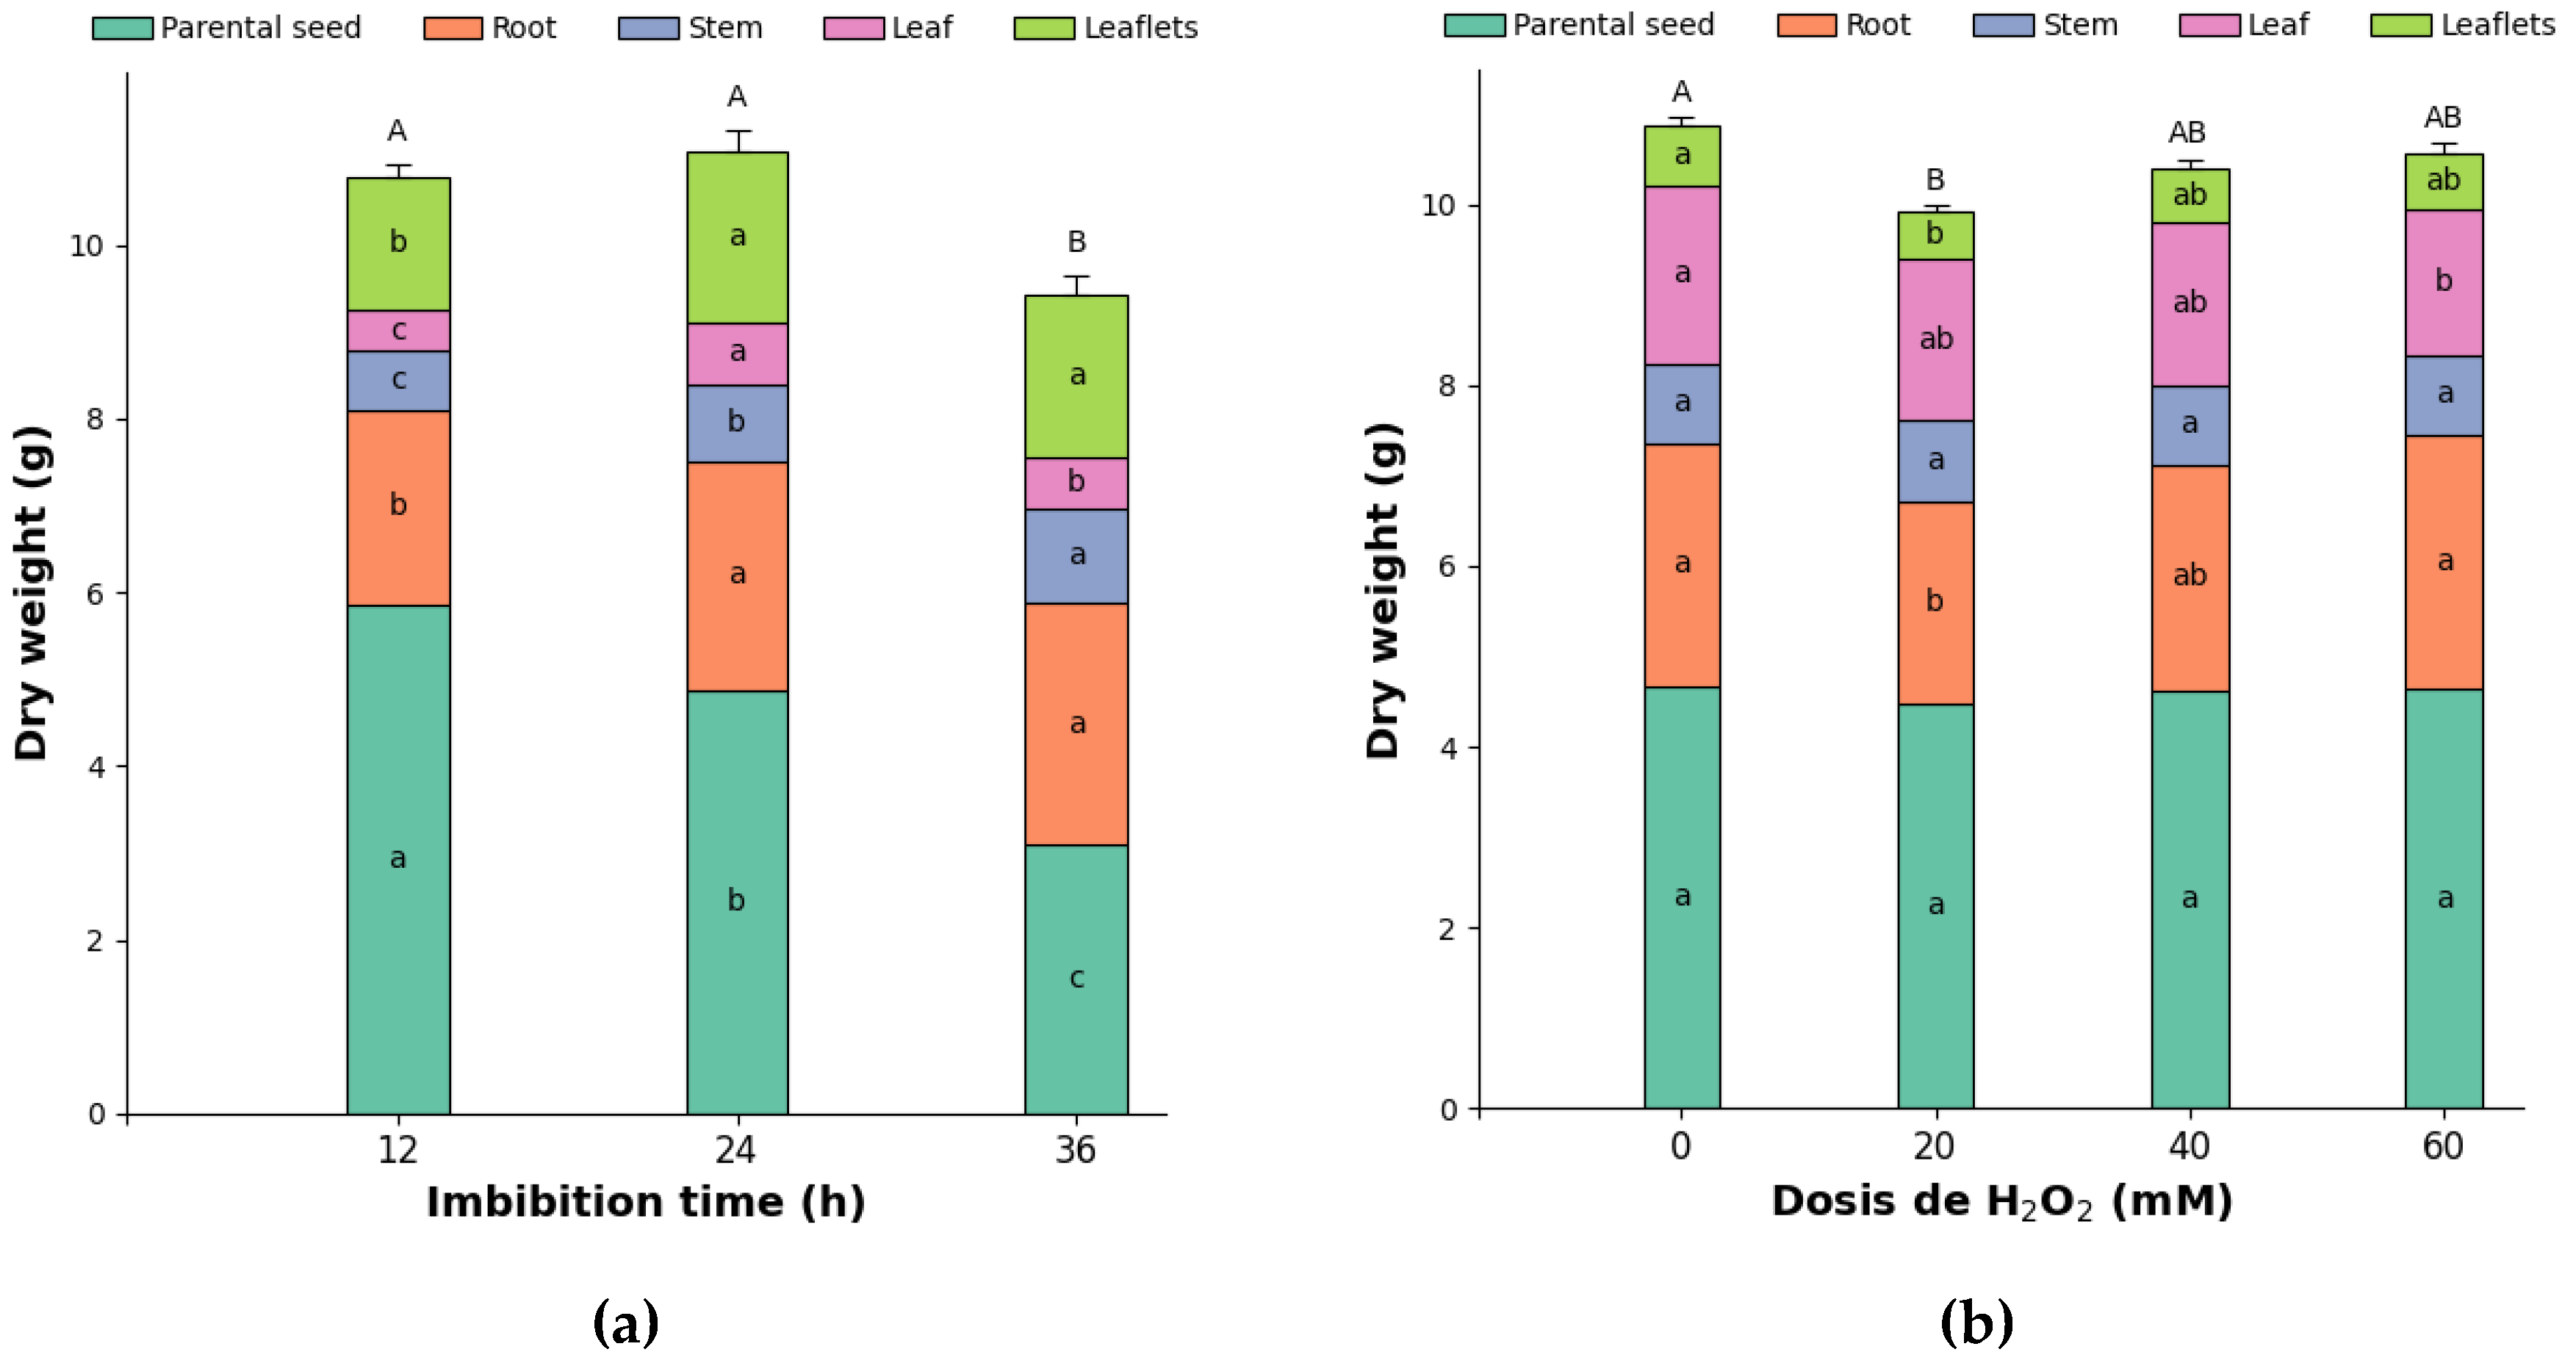
Figure 5.
Response surfaces of (a) dry mass of leaflets, (b) total dry mass and (c) stipule leaf area of pea seedlings from seeds subjected to different imbibition times and H2O2 doses.
Figure 5.
Response surfaces of (a) dry mass of leaflets, (b) total dry mass and (c) stipule leaf area of pea seedlings from seeds subjected to different imbibition times and H2O2 doses.
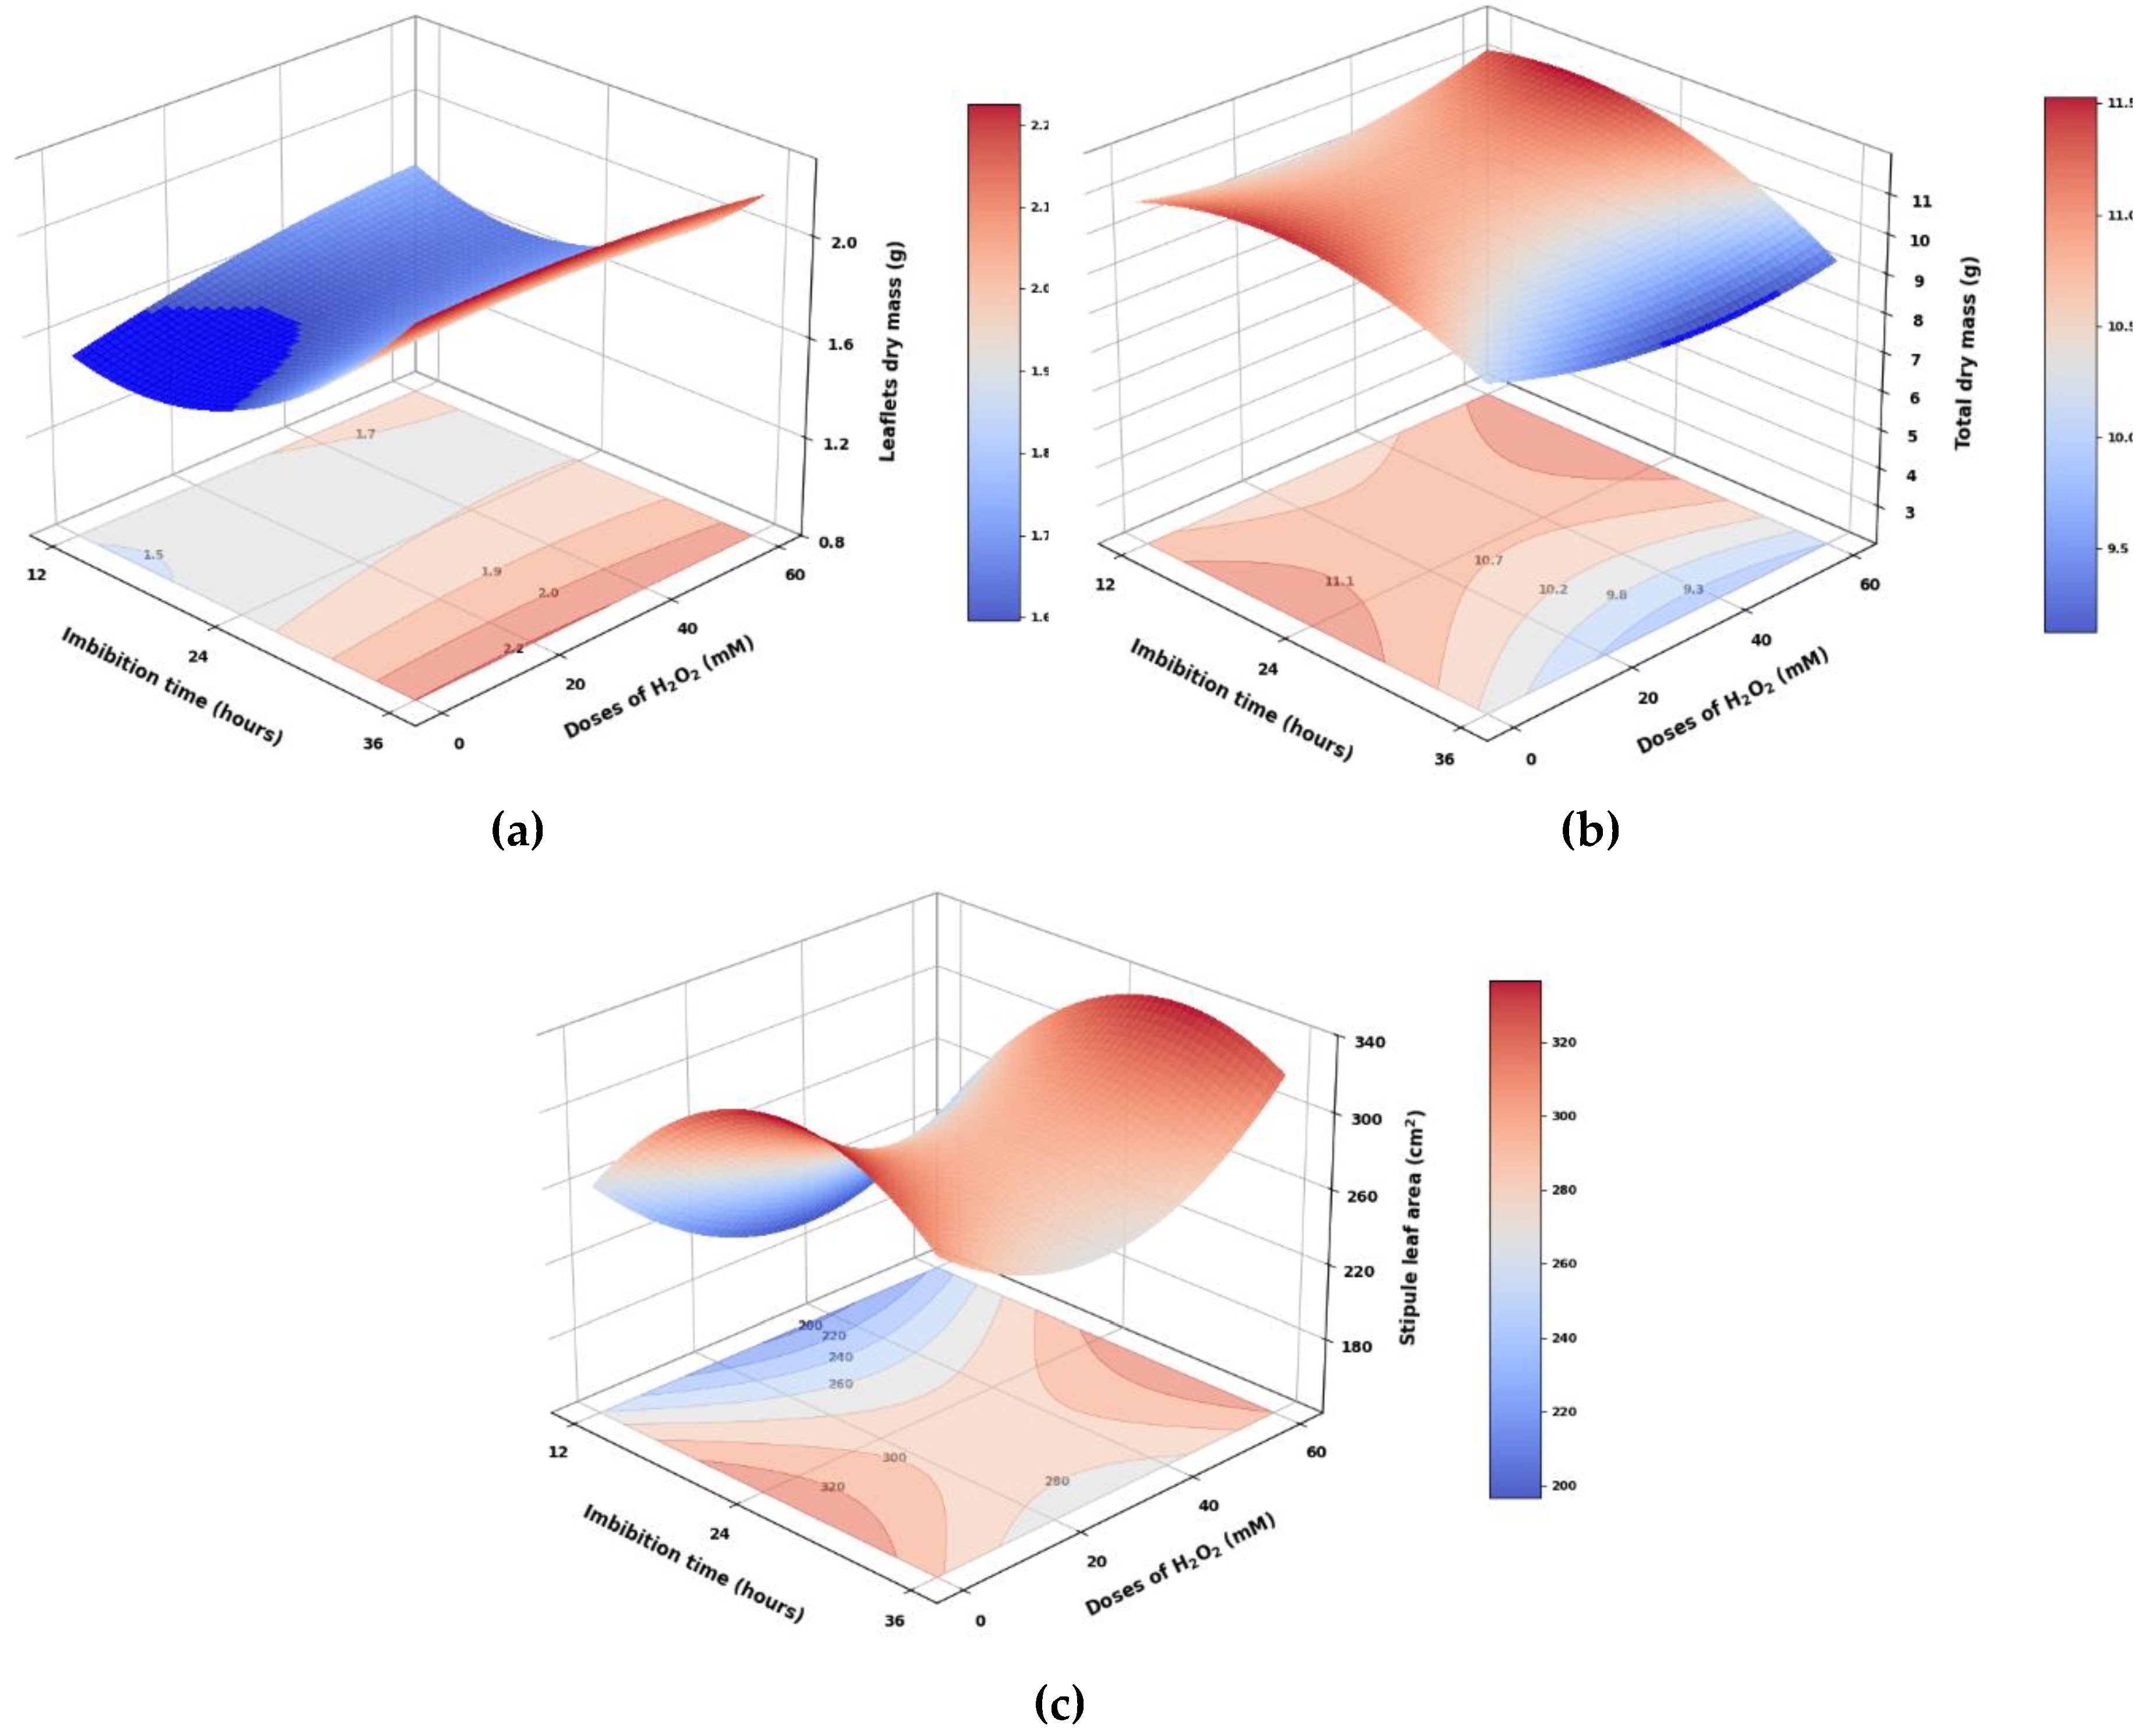

Table 1.
Average germination parameters in pea seeds subjected to different imbibition times and NaCl doses.
Table 1.
Average germination parameters in pea seeds subjected to different imbibition times and NaCl doses.
| Variable | Equation | Units |
| Germination rate | % | |
| Germination potential | % | |
| Mean germination time | Days to germination | |
| Germination rate index | Seeds germinated by day |
Table 2.
Average germination parameters in pea seeds subjected to different imbibition times and NaCl doses.
Table 2.
Average germination parameters in pea seeds subjected to different imbibition times and NaCl doses.
| Imbibition time (hours) | Doses of NaCl (mM) | GR (%) | GP (%) | MGT (days) | GRI (Number of seeds per day) |
| 12 | 0 | 82.92b | 34.17ab | 6.21a | 5.19d |
| 50 | 98.33a | 34.58ab | 5.30cd | 10.12ab | |
| 100 | 94.17ab | 35.00ab | 5.62abcd | 8.16abcd | |
| 150 | 93.75ab | 33.75ab | 6.04ab | 6.56cd | |
| 24 | 0 | 92.08ab | 37.92ab | 5.44bcd | 7.85abcd |
| 50 | 98.75a | 42.92a | 5.17d | 10.61a | |
| 100 | 96.25a | 32.50ab | 5.73abcd | 8.80abc | |
| 150 | 89.58ab | 24.58b | 6.01abc | 7.27bcd | |
| 36 | 0 | 97.50a | 41.67a | 5.04d | 9.73abc |
| 50 | 97.08a | 42.92a | 5.07d | 9.72abc | |
| 100 | 98.75a | 44.58a | 5.07d | 9.15abc | |
| 150 | 97.50a | 37.50ab | 5.91abc | 7.57abcd | |
| Factor | Level | ||||
| Imbibición time (hours) | 12 | 92.29b | 34.38b | 5.79a | 7.51b |
| 24 | 94.17ab | 34.48b | 5.59a | 8.63ab | |
| 36 | 97.71a | 41.67a | 5.27b | 9.04a | |
| Doses of NaCl (mM) | 0 | 90.83b | 37.92ab | 5.56b | 7.59bc |
| 50 | 98.06a | 40.14a | 5.18c | 10.15a | |
| 100 | 96.39a | 37.36ab | 5.47bc | 8.70ab | |
| 150 | 93.61ab | 31.94b | 5.98a | 7.13c | |
| Anova | Significance | ||||
| I | ** | ** | ** | ** | |
| D | ** | * | ** | ** | |
| I × D | * | ns | ** | * | |
I: imbibition time; D: doses of NaCl; GR: Germination rate; GP: Germination potential; MGT: mean germination time; GRI: germination rate index. Different lowercase letters indicate significant differences according to the grouping of interactions and individual factor levels, according to Tukey’s test (p < 0.05).
Table 3.
Average leaf areas of pea seedlings from seeds subjected to different imbibition times and NaCl doses.
Table 3.
Average leaf areas of pea seedlings from seeds subjected to different imbibition times and NaCl doses.
| Imbibition time (hours) | Doses of NaCl (mM) |
SLA (cm2) |
LA (cm2) |
TLA (cm2) |
| 12 |
0 | 114.11cd | 257.77cd | 371.88de |
| 50 | 83.15d | 233.97d | 317.12de | |
| 100 | 123.12cd | 263.42cd | 386.54de | |
| 150 | 90.91d | 221.85d | 312.75de | |
| 24 |
0 | 183.19abc | 288.23cd | 471.41bcde |
| 50 | 146.80bcd | 290.03cd | 436.84cde | |
| 100 | 184.95abc | 310.33cd | 495.28bcd | |
| 150 | 87.08d | 199.38d | 286.47e | |
| 36 |
0 | 246.08a | 470.16a | 716.24a |
| 50 | 214.57ab | 447.60ab | 662.16ab | |
| 100 | 208.26ab | 392.93abc | 601.18abc | |
| 150 | 154.95bcd | 315.27bcd | 470.22bcde | |
| Factor | Level | |||
| Imbibición time (hours) | 12 | 102.82c | 244.25b | 347.07c |
| 24 | 150.51b | 271.99b | 422.50b | |
| 36 | 205.97a | 406.49a | 612.45a | |
| Doses of NaCl (mM) | 0 | 181.13a | 338.72a | 519.85a |
| 50 | 148.17a | 323.87a | 472.04a | |
| 100 | 172.11a | 322.22a | 494.34a | |
| 150 | 110.98b | 245.50b | 356.48b | |
| Anova | Significance | |||
| I | ** | ** | ** | |
| D | ** | ** | ** | |
| I × D | ns | ns | ns | |
I: imbibition time; D: NaCl doses; SLA: stipules; LA: leaflet area; TLA: total leaf area. Different lowercase letters indicate significant differences according to the grouping of interactions and individual factor levels, according to Tukey's test (p < 0.05).
Table 4.
Average germination parameters in pea seeds subjected to different imbibition times and doses of H2O2.
Table 4.
Average germination parameters in pea seeds subjected to different imbibition times and doses of H2O2.
| Imbibition time (hours) | Doses of H2O2 (mM) | GR (%) | GP (%) | MGT (days) | GRI (Number of seeds per day) |
| 12 | 0 | 95.42ab | 37.92a | 5.68ab | 8.31cd |
| 20 | 97.50ab | 37.08a | 5.81a | 8.30cd | |
| 40 | 92.92b | 41.25a | 5.70a | 8.06d | |
| 60 | 95.00ab | 40.42a | 5.75a | 8.14d | |
| 24 | 0 | 99.17a | 51.67a | 5.06c | 9.64ab |
| 20 | 96.25ab | 51.25a | 5.05c | 9.42ab | |
| 40 | 99.58a | 47.08a | 5.02c | 9.80a | |
| 60 | 97.92ab | 48.75a | 5.18bc | 9.30abc | |
| 36 | 0 | 98.75a | 42.08a | 5.66ab | 8.58bcd |
| 20 | 98.33ab | 47.08a | 5.57ab | 8.68bcd | |
| 40 | 97.08ab | 41.25a | 5.45abc | 8.84abcd | |
| 60 | 97.08ab | 40.00a | 5.44abc | 8.84abcd | |
| Factor | Level | ||||
| Imbibición time (hours) | 12 | 95.21b | 39.17b | 5.74a | 8.20c |
| 24 | 98.23a | 49.69a | 5.08c | 9.54a | |
| 36 | 97.81a | 42.60b | 5.53b | 8.74b | |
| Doses of H2O2 (mM) | 0 | 97.78a | 43.89a | 5.47a | 8.84a |
| 20 | 97.36a | 45.14a | 5.48a | 8.80a | |
| 40 | 96.53a | 43.19a | 5.39a | 8.90a | |
| 60 | 96.67a | 43.06a | 5.46a | 8.76a | |
| Anova | Significance | ||||
| I | ** | ** | ** | ** | |
| D | ns | ns | ns | ns | |
| I × D | ns | ns | ns | ns | |
I: imbibition time; D: doses of H2O2; GR: Germination rate; GP: Germination potential; MGT: mean germination time; GRI: germination speed index. Different lowercase letters indicate significant differences according to the grouping of interactions and individual factor levels, according to Tukey's test (p < 0.05).
Table 5.
Average leaf areas of pea seedlings from seeds subjected to different imbibition times and H2O2 doses.
Table 5.
Average leaf areas of pea seedlings from seeds subjected to different imbibition times and H2O2 doses.
| Imbibition time (hours) | Doses of H2O2 (mM) |
SLA (cm2) |
LA (cm2) |
TLA (cm2) |
| 12 | 0 | 247.15bce | 542.38ab | 789.53abcd |
| 50 | 215.29cde | 383.00b | 598.29cd | |
| 100 | 230.63bcde | 433.59b | 664.22bcd | |
| 150 | 200.01e | 329.52b | 529.53e | |
| 24 | 0 | 336.69ab | 545.54ab | 882.23abc |
| 50 | 283.85abcde | 432.84b | 716.69bcd | |
| 100 | 306.01abcde | 528.34ab | 834.35abc | |
| 150 | 319.75abc | 552.30ab | 872.05abc | |
| 36 | 0 | 310.93abcd | 510.02ab | 820.94abcd |
| 50 | 291.74abcde | 724.12a | 1015.86a | |
| 100 | 205.40de | 544.28ab | 749.68abcd | |
| 150 | 357.51a | 551.22ab | 908.73ab | |
| Factor | Level | |||
| Imbibición time (hours) | 12 | 223.27b | 422.12b | 645.39b |
| 24 | 311.57a | 514.75a | 826.33a | |
| 36 | 291.39a | 582.41a | 873.80a | |
| Doses of H2O2 (mM) | 0 | 298.25a | 532.65a | 830.90a |
| 20 | 263.63ab | 513.32a | 776.95a | |
| 40 | 247.35b | 502.07a | 749.42a | |
| 60 | 292.42ab | 477.68a | 770.10a | |
| Anova | Significance | |||
| I | ** | ** | ** | |
| D | * | ns | ns | |
| I × D | ** | ** | ** | |
I: imbibition time; D: H2O2 doses; SLA: stipules; LA: leaflet area; TLA: total leaf area. Different lowercase letters indicate significant differences according to the grouping of interactions and individual factor levels, according to Tukey's test (p < 0.05).
Table 6.
Estimated parameters of the response surface equation for pea seedlings from seeds subjected to different imbibition times and NaCl doses.
Table 6.
Estimated parameters of the response surface equation for pea seedlings from seeds subjected to different imbibition times and NaCl doses.
| Estimated | GR | MGT | RDM | LDM | SDM | DMGS |
| a | 84.583333 | 6.292854 | 1.474960 | 1.982127 | 0.497687 | 6.332820 |
| b | 0.114583 | -0.020423 | 0.092714 | -0.060040 | -0.010087 | -0.259080 |
| c | 0.216667 | -0.015844 | 0.009269 | 0.008608 | 0.003287 | -0.011612 |
| d | 0.005787 | -0.000392 | -0.001329 | 0.001854 | 0.000573 | 0.004968 |
| e | -0.002222 | 0.000234 | -0.000288 | -0.000204 | -0.000095650 | 0.000415 |
| f | -0.001000 | 0.000088895 | -0.000042440 | -0.000038553 | -0.000015473 | 0.000065800 |
| r2 | 0.3036 | 0.5580 | 0.4111 | 0.5164 | 0.6027 | 0.5706 |
GR: germination rate; MGT: mean germination time; RDM: root dry mass; LDM: leaflets dry mass; SDM: stipule dry mass; DMGS: dry mass of germinated seed; r2: determination coefficient.
Table 7.
Estimated parameters of the response surface equation for pea seedlings from seeds subjected to different imbibition times and H2O2 doses.
Table 7.
Estimated parameters of the response surface equation for pea seedlings from seeds subjected to different imbibition times and H2O2 doses.
| Estimated | LDM | TDM | SLA |
| a | 0.445370 | 8.197823 | 78.391033 |
| b | 0.115916 | 0.298814 | 19.797850 |
| c | 0.001729 | -0.023079 | -4.055098 |
| d | -0.001893 | -0.006829 | -0.376688 |
| e | -0.000316 | -0.000886 | 0.037388 |
| f | 0.000006875 | 0.000700 | 0.049815 |
| r2 | 0.3469 | 0.4763 | 0.4126 |
LDM: leaflets dry mass; TDM: total dry mass; SLA: stipule leaf area; r2: determination coefficient.
Disclaimer/Publisher’s Note: The statements, opinions and data contained in all publications are solely those of the individual author(s) and contributor(s) and not of MDPI and/or the editor(s). MDPI and/or the editor(s) disclaim responsibility for any injury to people or property resulting from any ideas, methods, instructions or products referred to in the content. |
© 2025 by the authors. Licensee MDPI, Basel, Switzerland. This article is an open access article distributed under the terms and conditions of the Creative Commons Attribution (CC BY) license (http://creativecommons.org/licenses/by/4.0/).
Copyright: This open access article is published under a Creative Commons CC BY 4.0 license, which permit the free download, distribution, and reuse, provided that the author and preprint are cited in any reuse.


