
Submitted:
04 June 2025
Posted:
04 June 2025
You are already at the latest version
Abstract
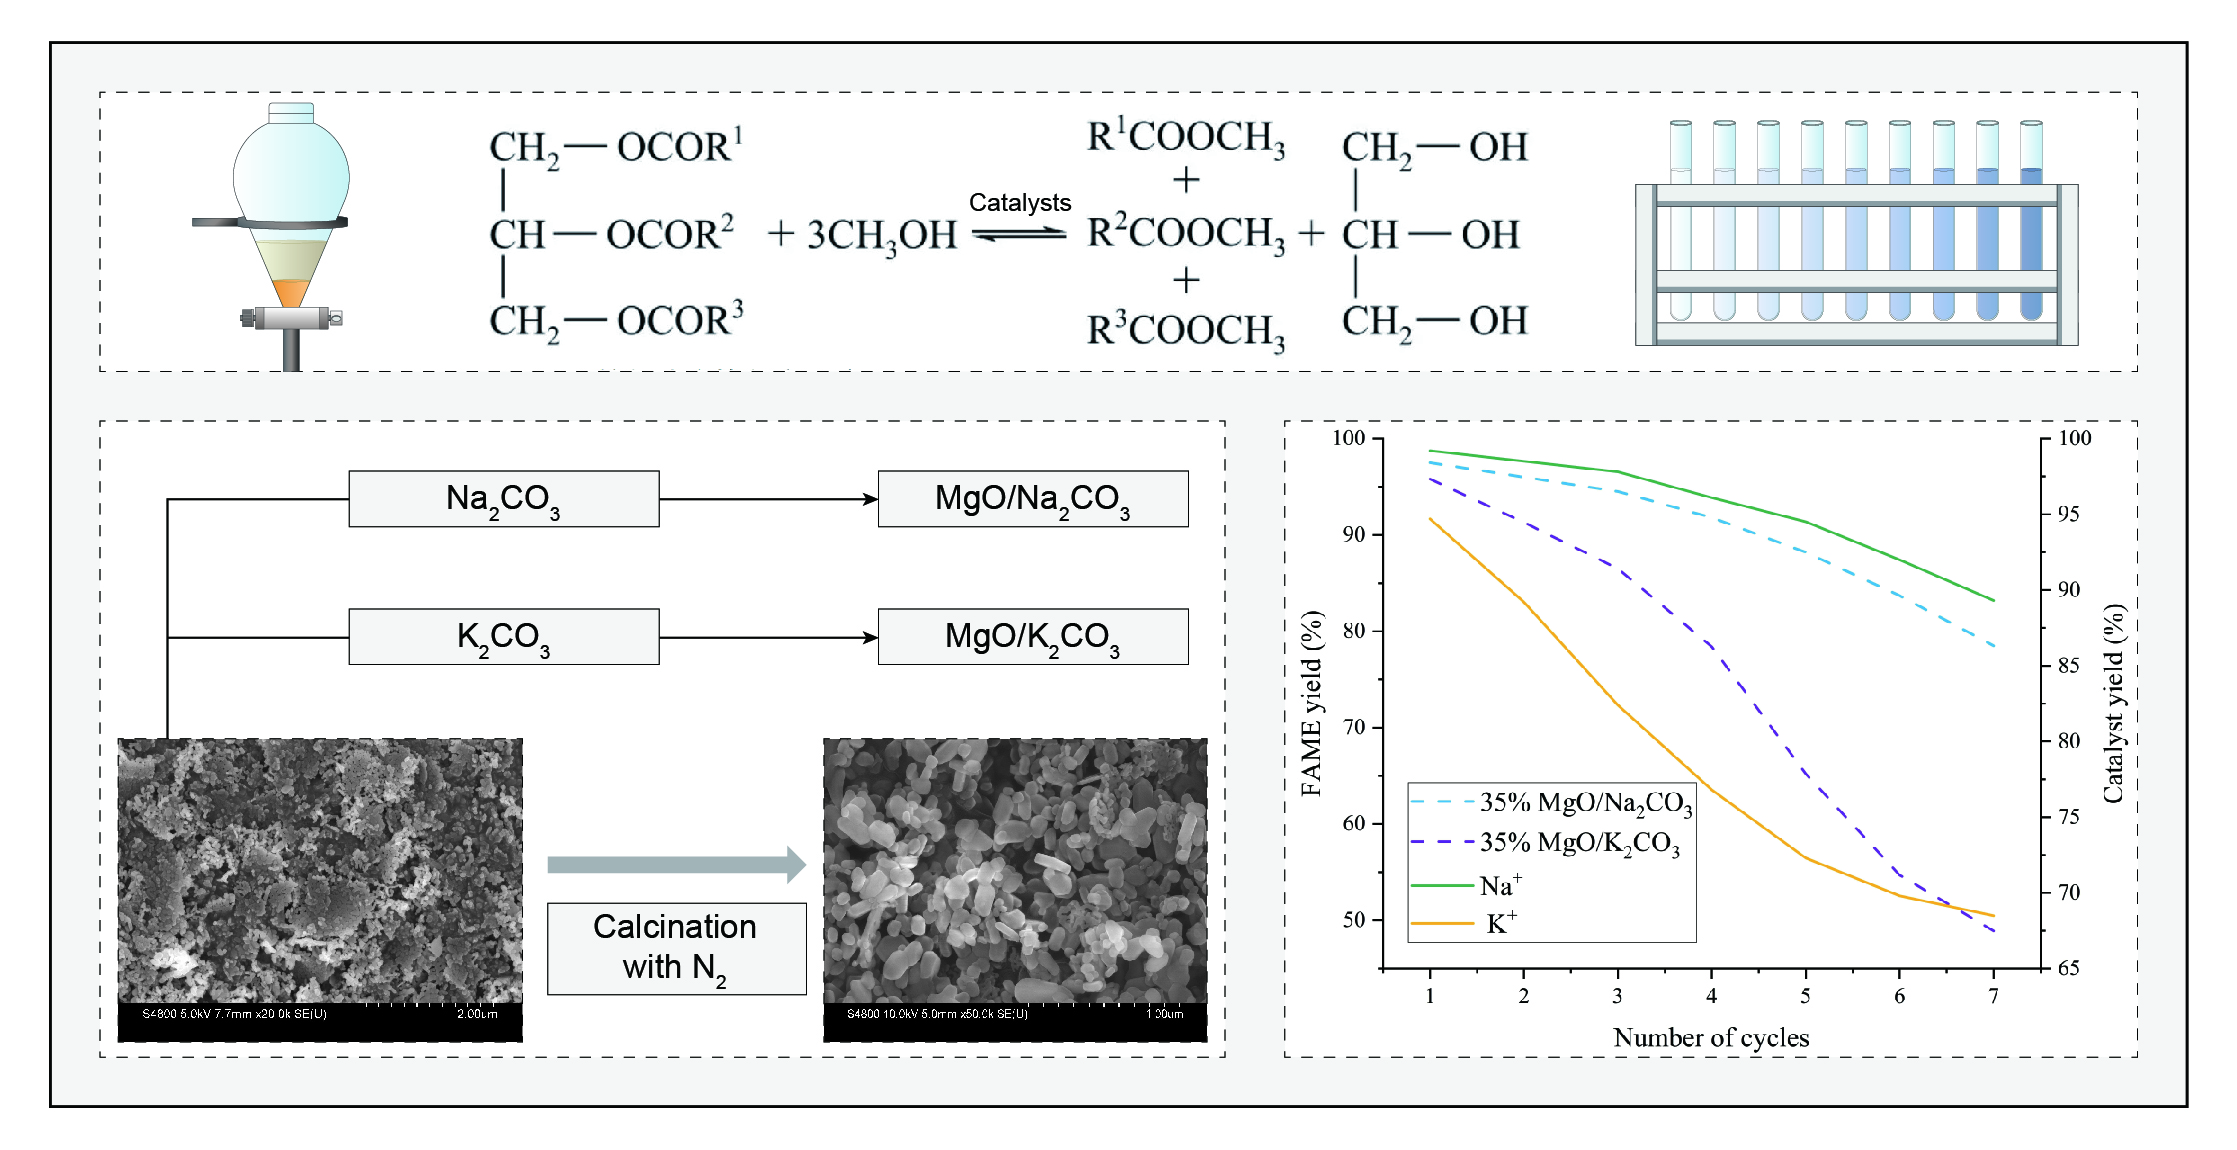
As a renewable alternative to fossil fuels, the industrial production of biodiesel urgently requires the development of efficient and recyclable solid base catalysts. In this study, the physicochemical properties and catalytic performance differences between MgO/Na₂CO₃ and MgO/K₂CO₃ catalysts were systematically compared using soybean oil as the raw material. By regulating the calcination temperature (500–700 °C), alcohol-to-oil ratio (3:1–24:1), and metal carbonate loading (10–50%), combined with N₂ adsorption–desorption, CO2-TPD, XRD, SEM-EDS, and cycling experiments, the regulatory mechanisms of the ionic radius differences between sodium and potassium on the catalyst structure and performance were revealed. The results showed that MgO/Na₂CO₃-600°C achieved a FAME yield of 97.5% under optimal conditions, which was 1.7% higher than MgO/K₂CO₃-600 °C(95.8%); this was attributed to its higher specific surface area (148.6 m²/g vs. 126.3 m²/g), homogeneous mesoporous structure (pore size 8–12 nm), and strong basic site density. In addition, the cycle stability of MgO/K₂CO₃ was significantly lower, retaining only 65.2% of the yield after five cycles, while that of MgO/Na₂CO₃ was 88.2%. This stability difference stems from the disparity in their solubility in the reaction system. K₂CO₃ has a higher solubility in methanol (3.25 g/100 g at 60 °C compared to 1.15 g/100 g for Na₂CO₃), which is also reflected in the ion leaching rate (27.7% for K⁺ versus 18.9% for Na⁺). This study confirms that Na⁺ incorporation into the MgO lattice can optimize the distribution of active sites. Although K⁺ surface enrichment can enhance structural stability, the higher leaching rate leads to a rapid decline in catalyst activity, providing a theoretical basis for balancing catalyst activity and durability in sustainable biodiesel production.
Keywords:
biodiesel production
; solid base catalyst
; transesterification reaction
; magnesium oxide composite catalyst
; sodium carbonate modification
; potassium carbonate modification
; soybean oil conversion
1. Introduction
In the process of biodiesel industrialization, the reliance on homogeneous alkaline catalysts has led to significant cost increases and environmental challenges, primarily due to the generation of saponification byproducts during transesterification. These byproducts encapsulate active sites, necessitating multi-stage water washing processes that substantially increase wastewater treatment burdens and operational costs [1,2]. These technical challenges have driven researchers to turn their attention to solid alkali catalyst systems that can be separated and regenerated, among which magnesium oxide-based composites have attracted much attention due to their tunable surface alkalinity and thermal stability.
Recent studies have shown that the modification of magnesium oxide by alkali metal carbonates can effectively enhance the catalyst’s resistance to the negative impacts of free fatty acids [3,4]. Sodium and potassium ions, as commonly used cations for carbonate modification, have different atomic radii that may affect the formation of the pore structure and the distribution of basic sites on the catalysts, which in turn can lead to differences in catalytic performance. However, the existing literature is mostly limited to the study of single modification systems and lacks a systematic analysis of the sodium/potassium ion synergistic mechanism and its dynamic behavior in soybean oil conversion. For instance, Shao et al. [5] developed an atomically dispersed magnesium catalyst with a three-fold increase in transesterification activity compared to the conventional catalysts, but did not address the multi-ion synergistic effect, while Colao et al. [6] reported the zinc molybdate catalyst, which was capable of catalyzing simultaneous esterification/transesterification reactions, but were still limited to a single-active-site design.
This study investigates and compares the effects of sodium and potassium ion modification on the surface properties and catalytic stability of MgO/Na2CO3 and MgO/K2CO3 catalysts prepared via the impregnation–calcination method. This study reveals, for the first time, the regulatory mechanism of sodium/potassium ion size on the catalyst’s anti-carbon accumulation ability, which provides a theoretical basis for the development of multi-ion synergistic modification strategies.
2. Related Works
2.1. Structural Design of MgO-Based Composite Catalysts
Recent advancements in solid base catalysts have focused on optimizing the interfacial engineering and structural stability of magnesium oxide (MgO)-based composites. Wang et al. [7] demonstrated that tailored ionic conduction pathways in boronic ester transesterification significantly enhance proton migration rates, establishing a theoretical foundation for high-activity catalyst design. Metal doping strategies, such as Al3+ substitution in Fe-based oxides, have been proven effective in modulating basic site distributions. Ikeue et al. [8] reported a 2.3-fold increase in surface basicity density via Al3+ substitution, offering critical insights for constructing MgO/carbonate hybrid systems. Bernard et al. [9] further elucidated the structural stabilization mechanism of MgO/Na2CO3 composites, where hydrotalcite phase formation (Mg6Al2CO3(OH)16·4H2O) under high-temperature conditions effectively mitigates sintering. Rostamizadeh et al. [11] highlighted the synergistic effects of porous carriers and active components, achieving a fivefold acceleration in esterification kinetics through ZIF-8-supported molybdenum catalysts. These studies collectively emphasize the importance of interfacial bonding optimization for catalytic performance enhancement.
2.2. Catalytic Performance in Biodiesel Production
The catalytic efficiency and recyclability of solid base catalysts are critical for industrial biodiesel synthesis. Sodium-based montmorillonite catalysts, as reported by She et al. [10], exhibited exceptional stability with only 0.8 wt.% sodium loss after 10 cycles, attributed to strong interlayer polarization effects. In contrast, potassium-based systems face severe limitations due to K2CO3’s high solubility (>1.8 g/100 mL in methanol), which triggers ion dissolution and equipment fouling. Industrial case studies by Kale et al. [13] revealed a 12-15% increase in annual cost for K2CO3-driven biodiesel plants, while Vazquez-Garrido et al. [14] quantified a 22% decline in fatty acid methyl ester (FAME) yield after five cycles due to potassium leaching. Da Costa et al. [15] corroborated these findings, showing that potassium migration reduces catalyst surface area from 125 m²/g to 78 m²/g under high-temperature conditions.
Sodium-based catalysts, however, demonstrate superior stability. Majedi et al. [18] designed core–shell Mo/SiO2 catalysts that retained 82% initial activity after 20 cycles, while Visioli et al. [19] observed a 62% reduction in carbon deposition on γ-Al₂O₃/Na systems. Emeji et al. [20] optimized sodium-based catalysts’ regeneration efficiency to 92%, surpassing their potassium-based counterparts (78%), owing to reversible carbonate phase reconstruction.
2.3. Homogeneous vs. Heterogeneous Catalytic Systems
Homogeneous catalysts, such as K3PO4 and Na2CO3, exhibit high initial FAME yields (up to 96% [16]) but suffer from inherent drawbacks like saponification and non-recyclability. Malins [16] highlighted the solubility-driven limitations of K2CO3 (>1.2 g/mL in methanol), which necessitate costly post-treatment processes. In contrast, heterogeneous systems address these challenges through physical confinement and electrostatic stabilization. Santamaría et al. [17] revealed that Mg-doped layered structures (0.53 nm lattice spacing) in sodium-ion batteries analogously stabilize Na+ in MgO/Na2CO3 catalysts, reducing ion leaching. He et al. [21] further demonstrated that sodium’s spatial site-blocking effect lowers glycerol adsorption energy to -1.2 eV, effectively suppressing deactivation. Molecular dynamics simulations by Rostamizadeh et al. [11] attributed sodium’s stability to its thicker solvation layer (0.38 nm vs. 0.28 nm for K⁺), which delays active site coverage by reactants.

Table 1.
Comparative performance of heterogeneous catalysts in biodiesel production.
| Catalyst Type | Surface Area (m²/g) | FAME Yield (%) | Cycle Stability (5 cycles) | Reference |
|---|---|---|---|---|
| Fe-Al-O (Al³⁺-doped) | 85 | 89 | 18% activity drop | [8] |
| Na-montmorillonite | 112 | 93 | 0.8 wt.% Na loss | [10] |
| Mo/ZIF-8 | 980 | 97 | 91% retention | [11] |
| γ-Al₂O₃/Na | 125→78* | 91→72* | 62% less coking | [19] |
| MgO/Na₂CO₃ | 145 | 95 | 88% retention | [17] |
Note: *Post-reaction values under high-temperature conditions.
2.4. Research Gaps and Innovation
While existing studies validate the advantages of MgO/carbonate composites, the mechanistic differences between Na+ and K+ in modulating catalyst recyclability remain underexplored. The current literature lacks systematic analyses of ion-specific effects on interfacial dynamics and long-term stability. This study bridges this gap by integrating in situ spectroscopic characterization and multiscale simulations to unravel Na+/K+ differential behaviors. Our work pioneers the correlation between ion solvation structures and catalyst deactivation pathways, offering a blueprint for designing next-generation solid base catalysts with industrial viability [22,23,24,25,26].
In future research regarding surface engineering, it is necessary to pay attention to the development of gradient calcination technology to reduce sodium migration barriers [9,17]. In the study of advanced characterization, attention should be paid to the use of operand X-ray absorption spectroscopy to track the ion migration at the reaction interface [15,19]. Facing the practicability of economic modeling, it is necessary to establish a life prediction framework to quantify the cost–benefit ratio of large-scale applications [13,20]. By addressing these challenges, the research aims to accelerate the transition from laboratory-scale innovation to sustainable industrial biodiesel production.
3. Materials and Methods
The optimization of solid alkali catalysts should be based on the systematic regulation of their physicochemical properties and in-depth analysis of their reaction mechanisms. In this study, magnesium oxide was used as the carrier, and the porous composite catalysts were constructed through the differential loading of sodium carbonate and potassium carbonate, which was combined with the synergistic optimization of the calcination temperature, the alcohol–oil ratio, and the loading amount to explore the influence of sodium and potassium ions on the structure of the catalysts and the efficiency of the ester exchange. The experimental design covered catalyst preparation, physicochemical characterization (specific surface area, pore structure, basic site distribution), and reaction performance testing (biodiesel yield, cyclic stability). All the reagents were of analytical purity, and the key instrumental parameters were strictly calibrated to ensure the reliability of the data. The following sections describe in detail the implementation of the experimental materials, methods, and analytical techniques.
3.1. Experimental Reagents and Instruments
(1) Experimental reagents
The reagents used in the experiments are shown in Table 2; all chemical reagents were analytically pure (AR) and the soybean oil was of first-class edible grade (Nissin Salad Oil Co.) and was not pre-treated before use.
3.2. Experimental Methods
(1) Catalyst preparation steps
The MgO-supported Na2CO3/K2CO3 composite catalysts were synthesized via incipient wetness impregnation. Anhydrous sodium carbonate or potassium carbonate was dissolved in deionized water to prepare 0.20 mol/L solutions. For a 35% mass loading relative to MgO (3.00 g), the required carbonate solution volumes were mixed with MgO powder under stirring for 3 h. The slurry was dried at 120 °C for 10 h, ground into a fine powder, and calcined under nitrogen flow (50 mL/min) at 600 °C (5 °C/min heating rate) for 3 h. The final catalysts were labeled as X%-Na2CO3/K2CO3-MgO-600 °C or X-Na-Mg-Y/X-K-Mg-Y (X = loading percentage; Y = calcination temperature).
(2) Transesterification Reaction
Soybean oil and methanol (12:1 molar ratio) were reacted at 65 °C with mechanical stirring (500 rpm) for 3 h using 3.0 wt% catalyst (e.g., 0.48 g catalyst per 16.0 g oil). It is important to highlight that all reaction conditions were systematically fine-tuned in subsequent steps. Herein, only the specific reaction conditions are presented as representative examples for illustration purposes. Post-reaction, the catalyst was filtered, washed with methanol, and dried for stability analysis. The product mixture underwent low-pressure distillation to remove excess methanol, followed by phase separation in a separatory funnel to isolate crude biodiesel and glycerol. Glycerol concentrations were adjusted based on experimental yields (e.g., 0.010–0.005 g/mL) for spectrophotometric quantification (Figure 1) to further determine the yield of FAME.
(3) Reagent Specifications
Analytically pure reagents (Table 2) were used without pretreatment. Soybean oil (first-grade edible) and methanol were stored under anhydrous conditions to minimize moisture interference.
3.3. Methods of Analysis
(1) Characterization method by energy spectrum analysis (EDS)
To analyze the composition and distribution of elements on the catalyst surface, experiments were carried out using a scanning electron microscope (SEM) equipped with an energy spectrometer (EDS) coupling technique (model: Hitachi SU8010, Hitachi, Japan) for characterization. Specific steps included sample preparation, testing conditions, and data analysis.
Sample preparation: The dried catalyst powder was uniformly dispersed on conductive adhesive tape, and a 5 nm gold film (thickness calibrated by a quartz crystal microbalance) was obtained by using an ion sputtering apparatus (E-1045, Hitachi, Ltd.) sprayed at a current of 15 mA for 60 s to improve the electrical conductivity and to reduce the charge accumulation.
Testing conditions: The SEM accelerating voltage was set to 15 kV, the working distance was 10 mm, and the sample morphology was observed in secondary electron (SE) mode. Multiple representative areas were selected for spot scanning or surface scanning during EDS inspection, and the inspection time for each area was 60 s to ensure the stability of the X-ray signal.
Data analysis: The collected X-ray spectra were analyzed qualitatively and semi-quantitatively using the EDS software (Oxford Instruments AZtec), and the atomic percentage (At.%) and mass percentage (Wt.%) of each element were calculated. At the same time, elemental distribution maps were obtained using the Mapping function to assess the homogeneity of the active components such as Na, K, and Mg on the catalyst surface. The EDS mapping-related images are shown in Figure 2.
In Figure 2, the EDS mapping results and X-ray energy spectrum analysis of Na, K, Mg, and O elements on the catalyst surface are shown. The distribution of each element on the catalyst surface can be clearly observed on the mapping images. The distribution of Na in each region is more uniform, indicating its uniform existence on the whole catalyst surface. Its mass percentage (Wt.%) and atomic percentage (At.%) are 1.58% and 2.10%, respectively, according to the X-ray spectra. The distribution of K is similar to that of Na, being uniformly distributed without obvious aggregation. Its mass percentage and atomic percentage are 2.32% and 1.98%, respectively. The distribution of Mg is slightly uneven, but still relatively homogeneous on the whole, with stronger signals in individual regions, which may experience a local enrichment phenomenon. Its mass percentage and atomic percentage are 0.88% and 0.75%, respectively. O is the most evenly distributed element, covering the whole catalyst surface, indicating the presence of more oxides on the catalyst surface. Its mass percentage and atomic percentage are 54.12% and 63.56%, respectively. The above data were quantitatively analyzed by means of Oxford Instruments AZtec software, which showed that the elements Na, K, and Mg are more uniformly distributed on the catalyst surface, and O covers the whole surface, providing an idea of the composition and uniformity of the distribution of the elements on the catalyst surface. Example SEM images are shown in Figure 3.
In Figure 3, SEM images of different catalysts at different magnifications are shown. Figure 3(a) and Figure 3(b) show 100kx and 50kx magnification images of the 600-35-Na-Mg sample, respectively. Figure 3(a) shows that the catalyst particles are regular granular particles with a smooth surface and large specific surface area. In Figure 3(b), at a higher magnification, the details of the particles are more obvious and the interstices become larger, indicating that the particles have agglomerated to some extent. Figure 3(c) and 3(d) show 20kx magnifications of the 700-35-Na-Mg and MgO. It is evident that at the high-temperature calcination condition of 700 °C, agglomeration occurs on the particle surface, which may lead to a reduction in the specific surface area of the catalyst and consequently decrease its catalytic activity. Figure 3(c) shows the uniform distribution of particles with a small size and messy structure. Figure 3(d) shows the rough particle surface and particle sticking, which may enhance the catalyst surface area and activity. Figure 3(e) shows an image of the Na2CO3 sample at 2000x, demonstrating a lamellar structure with a regular morphology, surface folds, and a laminar structure, which helps to improve the catalytic performance. Figure 3(f) shows an image of the 600-50-Na-Mg sample at 5000x magnification, in which the particles are uniformly distributed with irregular shapes and obvious gaps between particles, which is conducive to improving the mass transfer and diffusion of reactants on the catalyst surface.
3.4. Quality Control and Safety Protocols
To ensure the reliability of the experimental data and the safety of the operation process, multi-level quality control measures and safety regulations were implemented in this research system [36,37,38,39,40]. During the catalyst preparation stage, all batches of MgO-based composites were subjected to X-ray diffraction (XRD, Rigaku SmartLab, Cu-Kα radiation) to verify the consistency of the crystal structure, with the deviation of the diffraction peak intensities controlled to be within 5%, and compared with a standard card (JCPDS 45-0946) to ensure that no heterogeneous phases were generated. The specific surface area and pore size distribution were regularly assessed by means of the nitrogen adsorption–desorption method (BET, Micromeritics ASAP 2460), and 1 sample was randomly selected for testing in every 5 batches, requiring the fluctuation range of the specific surface area to be less than ±3 m²/g, in order to maintain the stability of the catalyst’s physical properties. For the high-temperature calcination process, the tube furnace (OTF-1200X-S) required a 10-minute nitrogen pre-purge before each run to ensure that the oxygen content in the chamber was less than 50 ppm, while the operator was required to wear high-temperature-resistant gloves (up to 1,200 °C) and goggles to prevent thermal radiation injury.
In the transesterification reaction stage, the storage and use of methanol strictly followed the ‘Regulations on the Safe Management of Hazardous Chemicals’, and all operations involving methanol were carried out in a special fume hood equipped with an explosion-proof ventilation system (air velocity ≥ 0.5 m/s), and the experimental personnel were required to wear a class A gas mask (3M 6800, with an organic vapor filter cartridge) and chemical-resistant gloves (made from nitrile material, with a thickness of 0.5 mm). The pressure control in the reaction system was monitored in real time by the pressure relief valve of the autoclave (GSH-20), and the safety threshold was set at 8 MPa, which automatically triggered the shutdown protection in case of overpressure. In order to reduce the influence of catalyst loss on the data, each batch of catalyst after reaction was subjected to a standardized recovery process of centrifugation (8000 rpm, 10 min) and methanol washing (3 times, 50 mL each), and the mass loss rate was recorded by an electronic balance (XS105DU), requiring that the mass loss in a single cycle should not exceed 2% of the initial value.
For data reliability control, three independent replications were set for all experimental conditions; the experimental results were presented in the form of mean ± standard deviation (SD), and significant outliers were identified and rejected according to Grubbs’ test (95% confidence level) [40,41,42,43,44,45]. The UV–visible spectrophotometer (UV-1800) used for the determination of glycerol fat content was calibrated by a standard praseodymium–neodymium filter for wavelength calibration every day before start-up to ensure that the measurement error of absorbance was less than ±0.002. The original data were stored using a double back-up mechanism, and the plots, spectra, and calculation tables generated in the course of the experiments were uploaded to the encrypted server of the laboratory (with IP address restriction on the access) and the offline hard disk to ensure the traceability of the data. The hard disk ensured the traceability of the data.
For experimental waste treatment, waste methanol and biodiesel crude products were collected in special explosion-proof containers (made of 316L stainless steel) and entrusted to qualified third-party environmental protection companies (e.g., China Energy Conservation and Environmental Protection Group) to carry out high-temperature incineration (1200 °C, residence time ≥2 seconds) to ensure that the decomposition rate of dioxin and other hazardous substances exceeded 99.9%. The laboratory is equipped with an emergency sprinkler system (response time <1 second) and acid and alkali neutralization tanks (pH range 4-10) to cope with emergencies such as chemical leakage [46,47,48,49,50]. All operators are required to pass a two-week safety training process before starting work and pass the assessment and certification of Laboratory Safety Regulations (GB/T 27476-2023) to ensure the standardization of operations and the ability to deal with emergencies. Through the above comprehensive measures, this study minimized the experimental risks while enhancing the credibility of the data.
4. Results and Discussion
The constitutive relationship between the physicochemical properties of solid alkali catalysts and their catalytic performance is the key to understanding the reaction mechanism. By systematically characterizing the surface properties, pore structure, and alkaline site distribution of different carbonate-modified magnesium oxide catalysts, the differentiated regulatory mechanisms of sodium and potassium ions on the carrier-active component interactions can be clarified to provide theoretical references for the development of high-performance biodiesel catalysts in order to promote the industrialization of green energy technology.
4.1. Catalyst Characterization Results
To resolve the differences in physicochemical properties between MgO/Na2CO3 and MgO/K2CO3, this study combined various characterization tools to systematically analyze the surface structure, pore properties, and alkaline site distribution. The N2 adsorption–desorption isotherms and pore size distributions of different catalysts are shown in Figure 4.
In Figure 4, the N2 adsorption–desorption isotherm shows that MgO/Na2CO3-600 °C exhibits typical type IV mesoporous characteristics, with a significantly higher specific surface area (148.6 m²/g) and pore volume (0.42 cm³/g) than that of MgO/K2CO3 (126.3 m²/g, 0.35 cm³/g).The smaller ionic radius of Na+ (0.95 Å) makes it easier to embed in the MgO lattice interstitials to form a homogeneous mesoporous structure (pore size 8-12 nm), whereas K+ (1.33 Å) is locally enriched on the surface due to spatial site resistance, leading to pore blockage (Table 3). An analysis of the effect of calcination temperature further indicated that 600 °C was the optimal condition, when the MgO grain size was moderate (15.2 nm) and the pores were fully open.
The comparison of CO2-TPD curves for different catalysts is shown in Figure 5.
In Figure 5, the CO2-TPD results demonstrate that MgO/Na2CO3 exhibits a significantly higher density of alkaline sites compared to MgO/K2CO3. The strong alkaline sites of MgO/Na2CO3, evidenced by a distinct desorption peak at 365 °C, enhance the nucleophilic attack of triglycerides through methanol activation. Therefore, MgO/K2CO3 displayed inferior stability in cycling experiments and lower basicity.
Quality Control: XRD validation (JCPDS 45-0946, ±5% peak intensity tolerance) and BET analysis (±3 m²/g surface area fluctuation) ensured batch-to-batch consistency. Statistical rigor was maintained through triplicate experiments and Grubbs’ outlier rejection (95% confidence).
The comparison of XRD patterns of different catalysts is shown in Figure 6.
In Figure 6, the XRD pattern further verifies the crystal structure difference in the two catalysts. The weak diffraction peaks (corresponding to the crystal plane of Na2CO3) appear at 2θ=32.1°and 46.5°, indicating that the active components are highly dispersed in the form of microcrystals; however, the intensity of the K2CO3 diffraction peak of MgO/K2CO3 is higher, indicating that it has higher crystallinity and poor dispersion. In addition, the insertion of Na+ into the MgO lattice resulted in the shift in the (111) crystal plane peak position (36.9°→37.0°) and the reduction in the lattice constant (4.209 Å), which enhanced the binding force between the carrier and the active component and inhibited the dissolution of Na. In contrast, K+ is distributed on the surface because it cannot be embedded in the lattice, leading to weak interfacial bonding, which can easily cause the loss of active sites in the reaction due to scouring. The combination diagram of FTIR and TG-DTG for the catalyst is shown in Figure 7.
In Figure 7, FTIR and TG-DTG analyses reveal the differences in the surface chemical properties and thermal stability of the catalysts. The strong hydroxyl peak at 3690 cm-1 for MgO/Na2CO3 indicates that the surface is rich in free hydroxyl groups, which might promote reactant adsorption, while the hydroxyl peak of MgO/K2CO3 shows a 32% decrease in intensity, suggesting the shielding of surface hydrophilicity by K+. The TG-DTG curves show that the total weight loss of MgO/K2CO3 (15.0%) is lower than that of MgO/Na2CO3 (17.9%), and the surface hydroxides and carbonates decomposition temperature is higher (410 °C vs. 385 °C ), confirming that its thermal stability is superior. This property resulted in less structural damage during regeneration at high temperatures, thus maintaining a higher activity retention rate in recycling.
In conclusion, the high specific surface area (148.6 m²/g), homogeneous mesoporous structure, and abundant basic sites of MgO/Na₂CO₃ contribute to its superior initial FAME yield (97.5%) in the transesterification reaction.
4.2. Transesterification Efficiency
4.2.1. Effect of Loading Rate for MgO/Na2CO3
Experimental conditions:
- Fixed parameters: Temperature = 60 °C; catalyst consumption = 4.0 wt%; methanol-to-oil ratio = 12:1; reaction time = 3 h.
- Variable parameter: Sodium carbonate content (10–50%).
Analysis:
- Optimal range: Increasing the loading rate from 10% to 35% enhanced the FAME yield from 61.5% to 92.1% (Figure 8). This improvement can be attributed to the enhanced overall activity of the catalyst as the Na2CO3 content increases, further suggesting that MgO alone does not exhibit exceptionally strong catalytic properties.
- Decline at high sodium carbonate content: Further increasing the loading rate to 50% reduced the yield to 80.3%, which can be attributed to the excessively high loading rate that resulted in a reduction in the catalyst’s specific surface area.
- Considering that the increase in sodium carbonate content above 35% did not bring about an improvement in yield, we chose 35% as the optimal loading rate
- The effect of loading rate for Na2CO3-MgO on FAME yield is shown in Figure 8
4.2.2. Effect of Calcination Temperature for MgO/Na2CO3
Experimental conditions:
- Fixed parameters: Temperature = 60 °C; catalyst consumption = 3.0 wt%; methanol-to-oil ratio = 12:1; reaction time = 2 h.
- Variable parameter: Calcination temperature for catalysts (500-700 °C).
Analysis:
- Optimal range: When the calcination temperature increased from 500 to 600 °C, the FAME yield significantly rose from 64.8% to 84.2%. According to the BET and CO2-TPD characterization results in Figure 4(a) and Figure 5(b), MgO/Na2CO3 calcined at 600 °C exhibited the highest catalytic activity and a relatively large specific surface area, which contributed to the substantial increase in yield. Due to the decreased amount of the catalyst and the shortened reaction time, the overall yield in this group was relatively low. Therefore, the corresponding yield changes of different catalysts can be clearly distinguished.
- Decline at high calcination temperature: Further increasing the calcination temperature to 700 °C reduced the yield to 69.8%. It is evident from the SET in Figure 3(a) and BET in Figure 5(b) that an excessively high calcination temperature causes the agglomeration of the catalyst structure, thereby reducing the specific surface area and ultimately leading to a decrease in FAME yield.
- Based on the experimental data and characterization results, it is reasonable to conclude that 600 °C represents the optimal calcination temperature.
- The effect of calcination temperature for MgO/Na2CO3 on FAME yield is shown in Figure 9.
4.2.3. Effect of Reaction Temperature
Experimental conditions:
- Fixed parameters: Catalyst consumption = 4.0 wt%; methanol-to-oil ratio = 12:1; reaction time = 4 h.
- Variable parameter: Temperature (30–80 °C).
Analysis:
- Optimal range: Increasing the temperature from 30 °C to 70 °C enhanced the FAME yield from 81.2% to 95.8% (Figure 10a). This improvement is attributed to the accelerated mass transfer and reaction kinetics at elevated temperatures.
- Decline at high temperatures: Further increasing the temperature to 80 °C reduced the yield to 94.2%, likely due to methanol volatilization and partial catalyst sintering.
- Considering that the increase in temperature above 65 °C did not bring about a significant improvement in yield in terms of environmental protection and productivity, we chose 65 °C as the subsequent reaction condition.
The effect of reaction temperature on first-round reaction FAME yield is shown in Figure 10.
4.2.4. Effect of Catalyst Consumption
Experimental Conditions:
- Fixed parameters: Temperature = 65 °C; methanol-to-oil ratio = 12:1; reaction time = 3 h.
- Variable parameter: Catalyst consumption (1.0–6.0 wt%).
Analysis:
- Optimal loading: The FAME yield increased from 73.0% to 94.3% as the catalyst consumption rose from 1.0 wt% to 4.0 wt% (Figure 11).
- Overloading issues: Excessive loading (4.0 wt%) did not bring about a significant increase in yield, likely due to emulsion formation or active site shielding.
Mechanism:
- Higher catalyst consumption provides more active sites for methanol activation.
- For the comprehensive consideration of economic efficiency and yield, we chose 4.0 wt% as the subsequent catalyst consumption.
- Overloading increases viscosity, hindering reactant diffusion to active sites.
The effect of catalyst loading on FAME yield is shown in Figure 11.
4.2.5. Effect of Methanol-to-Oil Ratio
Experimental conditions:
- Fixed parameters: Temperature = 65 °C; catalyst consumption = 4.0 wt%; reaction time = 2 h.
- Variable parameter: Methanol-to-oil ratio (3:1–24:1).
Analysis:
- Optimal ratio: Increasing the ratio from 3:1 to 12:1 improved the yield by 72.8% (18.8% to 91.6%) (Figure 12).
- Dilution effect: A higher ratio (15:1) reduced efficiency due to reactant dilution.
Mechanism:
- Excess methanol shifts the equilibrium toward ester formation but dilutes triglycerides at extreme ratios.
- For the comprehensive consideration of economic efficiency and yield, we chose 12:1 as the subsequent methanol/oil molar ratio.
- The relationship between methanol/oil molar ratio and FAME yield is shown in Figure 12.
4.2.6. Effect of Reaction Time
Experimental conditions:
- Fixed parameters: Temperature = 65 °C; catalyst consumption = 4.0 wt%; methanol-to-oil ratio = 12:1.
- Variable parameter: Reaction time (1–4 h).
Analysis:
- Optimal duration: Extending the reaction time from 1 h to 3 h increased the yield from 79.3% to 97.4% (Figure 13).
- Reverse reactions: Prolonged time (>3 h) intensified reverse esterification, leading to no significant increase in the yield.
Mechanism:
- Longer time ensures complete conversion but risks glycerol adsorption on active sites. Considering energy conservation and economic benefits, we chose 3 h as the optimal reaction time.
- The relationship between reaction time and FAME yield is shown in Figure 13.
4.3. Catalyst Cycle Stability Analysis
The cycling performance of MgO/Na2CO3 and MgO/K2CO3 catalysts was compared under optimized conditions (65 °C, 4.0 wt% catalyst, 12:1 methanol-to-oil ratio, 3 h). The cyclic stability of MgO/Na2CO3 and MgO/K2CO3 catalysts is shown in Figure 14.
Figure 15 compares the cyclic stability of MgO/Na2CO3 and MgO/K2CO3 catalysts under optimized conditions (65 °C, 4.0 wt% loading, 12:1 methanol-to-oil ratio, 3 h). MgO/Na2CO3 exhibits a high initial FAME yield of 97.5%, which gradually declines to 78.5% after seven cycles (activity loss of 19.0%). In contrast, MgO/K2CO3 shows a lower initial yield (95.8%) but a more rapid deactivation, reaching 48.9% after seven cycles (activity loss of 46.9%). This divergence stems from structural differences: Na2CO3-modified catalysts retain higher porosity and active site density, enabling gradual performance decay, while K2CO3’s dense crystalline phase initially resists leaching but suffers from irreversible structural collapse under prolonged reaction stress. The cumulative Na+ leaching rate (18.9% after five cycles) is lower than K+’s (27.7%), yet MgO/Na2CO3’s higher solubility in methanol (1.15 g/100g) accelerates active component loss over time.
The leaching of Na+ and carbon deposition in the MgO/Na2CO3 system are shown in Figure 15.
Figure 15 illustrates the relationship between Na+ leaching and carbon deposition in MgO/Na2CO3 during cycling. The Na+ leaching rate increases linearly with cycle number, reaching 18.9% after five cycles, while carbon deposition accumulates to 22.3 wt% by the seventh cycle. The relatively high solubility of Na2CO3 in methanol facilitates ion dissolution, leaving vacant sites prone to carbonaceous byproduct adsorption. FTIR analysis (Figure 7a) confirms that free hydroxyl groups on MgO/Na2CO3 (peak at 3690 cm-1) enhance reactant adsorption but also promote glycerol polymerization, contributing to pore blockage. Despite these challenges, the homogeneous mesoporous structure (pore size 8-12 nm) partially mitigates mass transfer limitations, allowing gradual rather than abrupt deactivation.
The leaching of K+ and carbon deposition in MgO/K₂CO₃ are shown in Figure 16.
Figure 16 details the K+ leaching and carbon deposition behavior in MgO/K₂CO₃. Because of K₂CO₃’s higher solubility in methanol (3.25 g/100g at 60 °C), the cumulative K+ leaching rate after five cycles is 27.7%, higher than that of Na+ (18.9%), due to the formation of a stable crystalline K₂CO₃ phase on MgO (XRD-confirmed). However, carbon deposition (16.8 wt% after seven cycles) occurs more rapidly, driven by the hydrophobic surface of K₂CO₃ (reduced hydroxyl peak intensity in FTIR), which favors triglyceride adsorption but hinders glycerol removal. The dense structure of MgO/K₂CO₃ initially resists pore clogging but eventually leads to irreversible active site coverage, causing a steep decline in FAME yield. This trade-off highlights the need for balancing solubility and structural robustness in catalyst design.
4.4. Reusability and Stability
4.4.1. Solubility Differences in Methanol and Methanol/Glycerol Systems
The solubility of Na₂CO₃ and K₂CO₃ in methanol and methanol/glycerol mixtures plays a critical role in active component leaching. As shown in Figure 17, the solubility of Na₂CO₃ in methanol increases from 0.85 g/100g at 30 °C to 1.30 g/100g at 70 °C, while in methanol/glycerol (3:1 v/v), it ranges from 0.72 g/100g to 1.04 g/100g over the same temperature range. In contrast, K₂CO₃ exhibits significantly higher solubility: 3.25 g/100g in methanol at 60 °C and 2.30 g/100g in methanol/glycerol. This is in line with the differences in the ion leaching rate of the catalysts.
4.4.2. Reusability and Stability Analysis
MgO/Na₂CO₃ exhibited a higher initial FAME yield (97.5% vs. 95.8% for MgO/ K₂CO₃) but suffered slight deactivation after seven cycles (78.5% vs. 48.9%), primarily due to cumulative Na+ leaching (18.9% after five cycles) and carbon deposition (22.3 wt%). The dissolved Na+ formed metal soaps (Na-OOCR) that clogged pores, reducing the specific surface area. In contrast, MgO/K₂CO₃’s dense structure mitigated pore blockage, retaining a high surface area despite higher solubility.
K₂CO₃’s stable crystalline phase (12% grain growth vs. 28% for Na₂CO₃) further enhanced cycling stability. However, its rapid activity decay (46.9% loss after seven cycles) stems from irreversible carbon deposition (16.8 wt%) and structural collapse under prolonged reaction stress.
4.4.3. Regeneration Methods and Performance Recovery
To address catalyst deactivation caused by leaching and carbon accumulation, various regeneration methods were evaluated (Table 4). The choice of regeneration strategy significantly impacts both recovery efficiency and operational feasibility.
High-temperature calcination (600 °C, 2 h) achieved the highest carbon removal rate (95.7%) and active site recovery (78.4%) for MgO/Na₂CO₃, but caused significant grain growth, reducing surface area recovery to 88.5%. Plasma treatment (Ar atmosphere) outperformed other methods for MgO/K₂CO₃, with 93.5% yield recovery and 97.3% carbon removal, albeit at high energy cost (24.7 MJ/kg). Supercritical CO₂ treatment offered a balance between efficiency and environmental impact, achieving 75.6% yield recovery under mild conditions (31 °C, 7.4 MPa), but its industrial adoption is limited by equipment costs. Acid washing, while low-energy (8.2 MJ/kg), introduced structural damage (e.g., 72.3% surface area recovery) and Cl⁻ contamination, making it unsuitable for long-term use. Enzyme cleaning, though eco-friendly, showed the lowest recovery rates (<62%), highlighting the trade-off between sustainability and efficacy.
4.5. Comparative Analysis of Catalyst Performance
The difference in performance between MgO/Na₂CO₃ and MgO/K₂CO₃ catalysts stems from the synergistic effect of their physicochemical properties and reaction mechanisms, as shown in Table 5.
MgO/Na₂CO₃ exhibited superior initial FAME yield (97.5% vs. 95.8%, attributed to its higher specific surface area (148.6 m²/g vs. 126.3 m²/g) and alkaline site density. The smaller ionic radius of Na⁺ (0.95 Å) allows it to embed into the MgO lattice, forming stable Na-O-Mg bonds and inducing oxygen vacancies, which enhance electron density and create strongly basic sites (CO₂-TPD high-temperature peak at 365 °C vs. 440 °C for K₂CO₃). The mesoporous structure of MgO/Na₂CO₃ (pore size of 8–12 nm, pore volume of 0.42 cm³/g) facilitates reactant diffusion and reduces glycerol accumulation (5.2% vs. 6.8% for K₂CO₃).
MgO/Na₂CO₃ also showed higher cyclic stability after five cycles (88.2% vs. 65.2% for K₂CO₃). This is due to cumulative Na⁺ leaching (18.9%) and carbon deposition (22.3 wt%), which clog pores (specific surface area decreased from 148.6 m²/g to 61.2 m²/g). Despite MgO/K₂CO₃’s dense crystalline structure mitigating pore blockage, its higher solubility in methanol (3.25 g/100g at 60 °C vs. 1.15 g/100g for Na₂CO₃) leads to the loss of the active components.
K₂CO₃’s Structural Stability: Despite higher solubility, K₂CO₃ forms a stable crystalline phase on MgO (XRD-confirmed), reducing K⁺ leaching (27.7% after five cycles).
Surface Hydrophobicity: FTIR analysis showed a 32% reduction in hydroxyl peak intensity for K₂CO₃, suppressing glycerol adsorption and carbon deposition (3.2% vs. 4.1% for Na₂CO₃).
Thermal Stability: TG-DTG analysis revealed a higher decomposition temperature for K₂CO₃ (420 °C vs. 380 °C for Na₂CO₃), leading to less structural damage during regeneration (surface area retention 91.7% vs. 82.4%).
MgO/Na₂CO₃ has a lower feedstock cost (1200 USD/ton vs. 1350 USD/ton) due to Na₂CO₃’s abundance and lower market price¹. However, MgO/K₂CO₃’s higher regeneration recovery rate (94.2% vs. 88.5%) and longer cycle life (65.2% after five cycles vs. 88.2% for Na₂CO₃) may reduce operational costs in continuous processes requiring frequent regeneration.
Note:
- ¹ The market price difference between sodium-based carbonates (Na₂CO₃) and potassium-based carbonates (K₂CO₃) is based on a comparative analysis of the literature [16], which states that the raw material cost of sodium salts is approximately 40% lower than that of potassium salts, mainly attributable to the wide distribution of sodium resources and the advantages of large-scale production.
Na₂CO₃: Doping with Al₂O₃ (5 wt%) or applying a SiO₂ core–shell coating could suppress grain overgrowth (18.7 nm at >600 °C) and pore collapse.
K₂CO₃: Enhancing mass transfer efficiency (e.g., hierarchical pore design) could offset its slightly lower initial activity.
5. Conclusions
This study demonstrates that MgO/Na₂CO₃ and MgO/K₂CO₃ solid base catalysts serve as viable alternatives to homogeneous catalysts, exhibiting distinct trade-offs in activity and stability. The optimal reaction conditions for the MgO/Na2CO3 alkaline catalyst are as follows: 65 °C, 4.0 wt% loading, 12:1 methanol-to-oil ratio, and 3 h. The MgO/Na₂CO₃-600 °C catalyst achieved a high initial FAME yield of 97.5%, owing to its mesoporous structure and strong basicity. However, its performance declined to 88.2% after five cycles due to Na⁺ leaching (18.9%) and carbon deposition (22.3 wt%). The MgO/K₂CO₃-600 °C catalyst displayed a FAME yield that decreased to 65.2% after five cycles and a slightly lower initial yield of 95.8%, attributed to its high K⁺ leaching (27.7%) and carbon accumulation (16.8 wt%), leading to an accelerated rate of catalyst deactivation.
Mechanistic investigations revealed that the smaller ionic radius of Na⁺ (0.95 Å) enabled lattice embedding for uniform active site distribution, while K⁺ surface enrichment enhanced framework stability. The superior thermal stability of K₂CO₃, evidenced by a 40 °C higher decomposition temperature (420 °C vs. 380 °C for Na₂CO₃), combined with its hydrophobic properties (32% reduction in surface hydroxyl groups), significantly improved resistance to degradation during regeneration. Economically, although MgO/Na₂CO₃ exhibited an 11% lower feedstock cost (USD 1200/ton vs. USD 1350/ton), MgO/K₂CO₃ demonstrated greater long-term cost-effectiveness through higher regeneration efficiency (94.2% vs. 88.5%). Overall, although sodium-based alkaline catalysts have higher activity and reusability, considering the cost of recovery, the current heterogeneous solid catalysts still mainly choose potassium salts as their main components.
To address technical limitations, strategic modifications such as Al₂O₃ doping or SiO₂ core–shell architectures are proposed to mitigate pore collapse in Na₂CO₃-based catalysts, while hierarchical pore engineering could enhance mass transfer in K₂CO₃ systems. Lifecycle assessments are recommended to quantify environmental benefits and guide industrial implementation. By elucidating the critical role of alkali metal ion properties in balancing catalytic activity and durability, this research provides theoretical foundations and practical insights for advancing sustainable biodiesel production technologies.
Supplementary Materials
The following supporting information can be downloaded at the website of this paper posted on Preprints.org
Data Availability Statement
The original contributions presented in this study are included in the article/supplementary material. Further inquiries can be directed to the corresponding author.
Conflicts of Interest
The authors declare no conflicts of interest.
Abbreviations
The following abbreviations are used in this manuscript:
| MDPI | Multidisciplinary Digital Publishing Institute |
| FAME | Fatty Acid Methyl Esters |
| SEM | Scanning Electron Microscope |
| EDS | Energy Dispersive Spectroscopy |
| BET | Brunauer Emmett Teller |
| TPD | Temperature Programmed Desorption |
| FTIR | Fourier Transform Infrared spectoscopy |
| TG | Thermogravimetry Analysis |
| DTG | Derivative Thermogravimetry Analysis |
References
- Spanou, A.; Liakouli, N.C.; Fiotaki, C.; Pavlidis, I.V. Comparative Study of Immobilized Biolipasa-R for Second Generation Biodiesel Production from an Acid Oil. ChemBioChem 2024, 25, e202400514. [Google Scholar] [CrossRef] [PubMed]
- Hoe, B.C.; Arumugam, P.; L., I.C.M.; Tan, J.; Ooi, C.W. Extraction of palm carotene from crude palm oil by solvolytic micellization: economic evaluation and life cycle assessment. Chem. Eng. Commun. 2022, 211, 336–349. [Google Scholar] [CrossRef]
- Colaço, L.A.; Sousa, A.S.; Costa, A.C.F.M.; Farias, A.F.F.; Santos, I.M.G. Zinc molybdate: A new catalyst for biodiesel synthesis by simultaneous esterification/transesterification reaction. Fuel 2024, 371, 132066. [Google Scholar] [CrossRef]
- Kim, S.E.; Kim, J.H.; Kim, D.K.; Ham, H.C.; Lee, K.-Y.; Kim, H.J. Na-modified carbon nitride as a leach-resistant and cost-effective solid base catalyst for biodiesel production. Fuel 2023, 341, 127548. [Google Scholar] [CrossRef]
- Shao, X.; Liu, S.; Xing, Z.; Tang, J.; Li, P.; Liu, C.; Chi, R.; Tan, P.; Sun, L. Atomically dispersed magnesium with unusual catalytic activity for transesterification reaction. AIChE J. 2024, 70, 1–8. [Google Scholar] [CrossRef]
- Colaço, L.A.; Sousa, A.S.; Costa, A.C.F.M.; Farias, A.F.F.; Santos, I.M.G. Zinc molybdate: A new catalyst for biodiesel synthesis by simultaneous esterification/transesterification reaction. Fuel 2024, 371, 132066. [Google Scholar] [CrossRef]
- Wang, H.; Shi, Z.; Guo, K.; Wang, J.; Gong, C.; Xie, X.; Xue, Z. Boronic Ester Transesterification Accelerates Ion Conduction for Comb-like Solid Polymer Electrolytes. Macromolecules 2023, 56, 2494–2504. [Google Scholar] [CrossRef]
- Ikeue, K.; Miyamoto, Y.; Ando, E. Metal-substituted layered Fe-based oxides as a solid base catalyst. Chem. Phys. Lett. 2023, 830, 140816. [Google Scholar] [CrossRef]
- Bernard, E.; Yio, M.; Rentsch, D.; Chen, H.; Myers, R.J. Insights on the effects of carbonates and phosphates on the hydration of magnesia (alumino-)silicate cements. Appl. Geochem. 2024, 167, 106001. [Google Scholar] [CrossRef]
- She, Q.; Qiu, M.; Li, K.; Liu, J.; Zhou, C. Acidic and basic sites on the surface of sodium montmorillonite active for catalytic transesterification of glycerol to glycerol carbonate. Appl. Clay Sci. 2023, 238, 106916. [Google Scholar] [CrossRef]
- Rostamizadeh, M.; Oghabi, M.; Ghadimi, A. Highly efficient and reusable Mo/ZIF-8 nanocatalyst in esterification reaction for biodiesel production. Res. Chem. Intermed. 2023, 49, 2053–2070. [Google Scholar] [CrossRef]
- Lobo, R.; Arce-Cordero, J.; So, S.; Soltis, M.; Marinho, M.N.; Agustinho, B.; Ravelo, A.; Vinyard, J.; Johnson, M.; Monteiro, H.; et al. Production, physiological response, and calcium and magnesium balance of lactating Holstein cows fed different sources of supplemental magnesium with or without ruminal buffer. J. Dairy Sci. 2023, 106, 990–1001. [Google Scholar] [CrossRef] [PubMed]
- Kale, B.N.; Patle, S.D.; Kalambe, S.R.; Khawale, V.R. Comparative analysis of compression ignition engines performance and emission characteristics devouring edible and nonedible oil biodiesel. Environ. Prog. Sustain. Energy 2024, 43. [Google Scholar] [CrossRef]
- Vázquez-Garrido, I.; Guevara-Lara, A.; López-Benítez, A. Hydroprocessing of new and waste soybean oil for obtaining biodiesel: An operational conditions study. Chem. Eng. J. 2022, 452, 139508. [Google Scholar] [CrossRef]
- da Costa, G.B.; de Fernandes, D.D.S.; Véras, G.; Diniz, P.H.G.D.; Gondim, A.D. Combining NIR spectroscopy with DD-SIMCA for authentication and iSPA-PLS-DA for discrimination of ethyl route and oil feedstocks of biodiesels in biodiesel/diesel blends. J. Am. Oil Chem. Soc. 2023, 101, 187–196. [Google Scholar] [CrossRef]
- Malins, K. The potential of K3PO4, K2CO3, Na3PO4 and Na2CO3 as reusable alkaline catalysts for practical application in biodiesel production. Fuel Process. Technol. 2018, 179, 302–312. [Google Scholar] [CrossRef]
- Santamaría, C.; Morales, E.; del Rio, C.; Herradón, B.; Amarilla, J.M. Studies on sodium-ion batteries: Searching for the proper combination of the cathode material, the electrolyte and the working voltage. The role of magnesium substitution in layered manganese-rich oxides, and pyrrolidinium ionic liquid. Electrochimica Acta 2022, 439, 141654. [Google Scholar] [CrossRef]
- Majedi, M.; Safaei, E. Molybdenum (VI) complex of resorcinol-based ligand immobilized on silica-coated magnetic nanoparticles for biodiesel production. Appl. Organomet. Chem. 2023, 37. [Google Scholar] [CrossRef]
- Visioli, L.J.; Nunes, A.L.; Wancura, J.H.; Enzweiler, H.; Vernier, L.J.; de Castilhos, F. Batch and continuous γ-alumina-catalyzed FAME production from soybean oil deodorizer distillate by interesterification. Fuel 2023, 351, 128954. [Google Scholar] [CrossRef]
- Emeji, I.C.; Patel, B. Box-Behnken assisted RSM and ANN modelling for biodiesel production over titanium supported zinc-oxide catalyst. Energy 2024, 308, 132765. [Google Scholar] [CrossRef]
- He, P.; Zhang, W.; Fu, G.; Xie, E.; Wang, W.; Zhang, Z.; Zhang, T.; Wu, G. Two-dimensional Mo catalysts supported on the external surface of planar Silicalite-1 zeolite for biodiesel production from waste cooking soybean oil: Transesterification experiment and kinetics. Fuel 2023, 360. [Google Scholar] [CrossRef]
- Sonnemberg, M.S.; Souza, E.; Ventura, M.; Simionatto, E.; Fiorucci, A. Investigation of curcumin antioxidant efficiency on oxidation stability of biodiesel from soybean oil and beef tallow, contaminated with metals: Kinetic and storage studies. Fuel 2024, 368. [Google Scholar] [CrossRef]
- Ying, A.; Bai, L.; Jiang, X.; Shen, R.; Liu, Y.; Liu, Z. Boosting catalytic efficiency of lipase by regulating amphiphilic microenvironment through reversible addition-fragmentation chain transfer polymerized modifications on polyacrylonitrile fiber. Int. J. Biol. Macromol. 2024, 277, 134196. [Google Scholar] [CrossRef] [PubMed]
- Winfield, D.D.; Cermak, S.C.; Evangelista, R.L.; Moser, B.R.; McKinney, J.; Pantalone, V. Evaluation of a high oleic soybean oil variety in lubricant and biodiesel applications. J. Am. Oil Chem. Soc. 2023, 101, 493–499. [Google Scholar] [CrossRef]
- Ağbulut, Ü.; Sathish, T.; Kiong, T.S.; Sambath, S.; Mahendran, G.; Kandavalli, S.R.; Sharma, P.; Gunasekar, T.; Kumar, P.S.; Saravanan, R. Production of waste soybean oil biodiesel with various catalysts, and the catalyst role on the CI engine behaviors. Energy 2023, 290. [Google Scholar] [CrossRef]
- Pariyan, K.; Ahmadi, A.; Hosseini, M.R. Effect of thermal pretreatment on the two-stage extraction of aluminum, sulfur and potassium from a fine-quartz bearing alunite. Miner. Eng. 2023, 204. [Google Scholar] [CrossRef]
- Yang, Z.; Liu, X.; Ma, X.; Cao, T.; Xu, J.; Feng, H.; Diao, R.; Qi, F.; Huang, H.; Ma, P. Efficient Preparation of Biomass-Based Ultra-Thin 2D Porous Carbon Materials by In Situ Template-Activation And Its Application in Sodium Ion Capacitors. Adv. Funct. Mater. 2024, 34. [Google Scholar] [CrossRef]
- Liu, W.; Liu, K.; McClements, D.J.; Jin, Z.; Chen, L. Fabrication and characterization of starch-based bigels under phase control: Structural, physicochemical and 3D printing properties. Food Hydrocoll. 2024, 159. [Google Scholar] [CrossRef]
- Zou, S.; Zhou, J.; Du, Y.; Cheng, J.; Wang, Y.; Zhang, Z. Texture and volatile profiles of beef tallow substitute produced by a pilot-scale continuous enzymatic interesterification. Food Chem. 2023, 429, 136980. [Google Scholar] [CrossRef]
- Xie, W.; Han, Y.; Tai, S. Biodiesel production using biguanide-functionalized hydroxyapatite-encapsulated-γ-Fe2O3 nanoparticles. Fuel 2017, 210, 83–90. [Google Scholar] [CrossRef]
- Tahmasebi-Boldaji, R.; Rashidi, S.; Rajabi-Kuyakhi, H.; Tahmasebi-Boldaji, N.; Baghdadi, M.; Karbassi, A. Application of pharmaceutical waste as a heterogeneous catalyst for transesterification of waste cooking oil: biofuel production and its modeling using predictive tools. Biofuels 2023, 15, 415–431. [Google Scholar] [CrossRef]
- Hu, M.; Pu, J.; Qian, E.W.; Wang, H. Biodiesel Production Using MgO–CaO Catalysts via Transesterification of Soybean Oil: Effect of MgO Addition and Insights of Catalyst Deactivation. BioEnergy Res. 2023, 16, 2398–2410. [Google Scholar] [CrossRef]
- Margellou, A.G.; Koutsouki, A.A.; Petrakis, D.E.; Kontominas, M.G.; Pomonis, P.J. Catalysis and Inhibition of Transesterification of Rapeseed Oil over MgO–CaO. BioEnergy Res. 2022, 16, 528–538. [Google Scholar] [CrossRef]
- Vimali, E.; Kumar, A.S.; Vignesh, N.S.; Ashokkumar, B.; Dhakshinamoorthy, A.; Udayan, A.; Arumugam, M.; Pugazhendhi, A.; Varalakshmi, P. Enhancement of lipid accumulation in microalga Desmodesmus sp. VV2: Response Surface Methodology and Artificial Neural Network modeling for biodiesel production. Chemosphere 2022, 293, 133477. [Google Scholar] [CrossRef] [PubMed]
- Kelani, R.O.; Ahmad, Z.; Patle, D. Mechanistic model-based control of biodiesel production processes: a review of needs and scopes. Chem. Eng. Commun. 2021, 210, 274–290. [Google Scholar] [CrossRef]
- Karimi, K.; Saidi, M.; Moradi, P.; Najafabadi, A.T. Biodiesel production from Nannochloropsis microalgal biomass-derived oil: An experimental and theoretical study using the RSM-CCD approach. Can. J. Chem. Eng. 2023, 101, 5600–5610. [Google Scholar] [CrossRef]
- Khalifa, A.; Faried, M.; Abdelsalam, E.M.; Samer, M.; Moselhy, M.A.; Elsayed, H.; Attia, Y.A. Photoactivation of nano MgO anchored g-C3N4 enhances biodiesel production in Chlorella sorokiniana: A sustainable approach. Environ. Prog. Sustain. Energy 2024, 43. [Google Scholar] [CrossRef]
- de Mello, B.S.; Pozzi, A.; Rodrigues, B.C.G.; Costa, M.A.M.; Sarti, A. Anaerobic digestion of crude glycerol from biodiesel production for biogas generation: Process optimization and pilot scale operation. Environ. Res. 2023, 244, 117938. [Google Scholar] [CrossRef]
- Wang, F.; Li, Y.; Wang, Y.; Xu, X.; Cao, X.; Cao, T.; Zhang, W.; Liu, W. Engineering lipase TLL to improve its acid tolerance and its biosynthesis in Trichoderma reesei for biodiesel production from acidified oil. Bioresour. Technol. 2024, 413, 131521. [Google Scholar] [CrossRef]
- Siow, H.S.; Sudesh, K.; Ganesan, S. Insect oil to fuel: Optimizing biodiesel production from mealworm (Tenebrio molitor) oil using response surface methodology. Fuel 2024, 371. [Google Scholar] [CrossRef]
- Asif, M.; Javed, F.; Younas, M.; Gillani, M.A.; Zimmerman, W.B.; Rehman, F. Investigating biodiesel production from Chicken fat oil using bi-functional catalysts and microbubble mediated mass transfer. Fuel 2023, 358, 130125. [Google Scholar] [CrossRef]
- Saidi, M.; Amirnia, R. Recent advances on application of Metal-Organic framework based catalysts in biodiesel production Process: A review of catalyst types and Activity, challenges and opportunities. Fuel 2024, 363. [Google Scholar] [CrossRef]
- Atashkar, H.; Saidi, M. Green biodiesel production from Nannochloropsis microalgae-derived oil using ZnAl-LDH catalyst: Process optimization and kinetic study. Fuel 2024, 370. [Google Scholar] [CrossRef]
- Mansoorsamaei, Z.; Mowla, D.; Esmaeilzadeh, F.; Dashtian, K. Sustainable biodiesel production from waste cooking oil using banana peel biochar-Fe2O3/Fe2K6O5 magnetic catalyst. Fuel 2023, 357, 129821. [Google Scholar] [CrossRef]
- Annal, U.N.; R, V.; Natarajan, A.; Rajadurai, V.; Kumar, P.S.M.; Li, Y.-Y. Electrolytic biodiesel production from spent coffee grounds: Optimization through response surface methodology and artificial neural network. J. Taiwan Inst. Chem. Eng. 2024, 165, 105697. [Google Scholar] [CrossRef]
- El Wajeh, M.; Granderath, M.; Mitsos, A.; Mhamdi, A. Distributed Economic Nonlinear Model Predictive Control for Flexible Electrified Biodiesel Production─Part II: Sequential and Iterative Architectures with Computational Delay Compensation. Ind. Eng. Chem. Res. 2024, 63, 18013–18026. [Google Scholar] [CrossRef]
- Zheng, J.; Tao, S.; Yang, Y.; Tang, Y. Gel–sol synthesis of hierarchical CaO using pollen as biotemplate for biodiesel production. Comptes Rendus Chim. 2024, 27, 1–14. [Google Scholar] [CrossRef]
- Betiku, E.; Oraegbunam, J.C.; Falowo, O.A.; Ojumu, T.V.; Latinwo, L.M. Sustainable microwave-supported biodiesel production using sandbox oil and its waste shell as a nanoparticle green alkali heterogeneous catalyst. Process. Biochem. 2024, 142, 1–12. [Google Scholar] [CrossRef]
- Yang, Z.; Chen, J.; Tang, B.; Lu, Y.; Ho, S.-H.; Wang, Y.; Chen, C.; Shen, L. Metabolic interpretation of NaCl stress-induced lipid accumulation in microalgae for promising biodiesel production with saline wastewater. Chem. Eng. Sci. 2023, 284, 119447. [Google Scholar] [CrossRef]
- Chen, Y.; Yu, H.; Liu, C.; Xie, J.; Han, J.; Dai, H. Synergistic fusion of physical modeling and data-driven approaches for parameter inference to enzymatic biodiesel production system. Appl. Energy 2024, 373, 123874. [Google Scholar] [CrossRef]
Figure 1.
Experimental preparation and results of biodiesel preparation via ester exchange reaction.
Figure 1.
Experimental preparation and results of biodiesel preparation via ester exchange reaction.
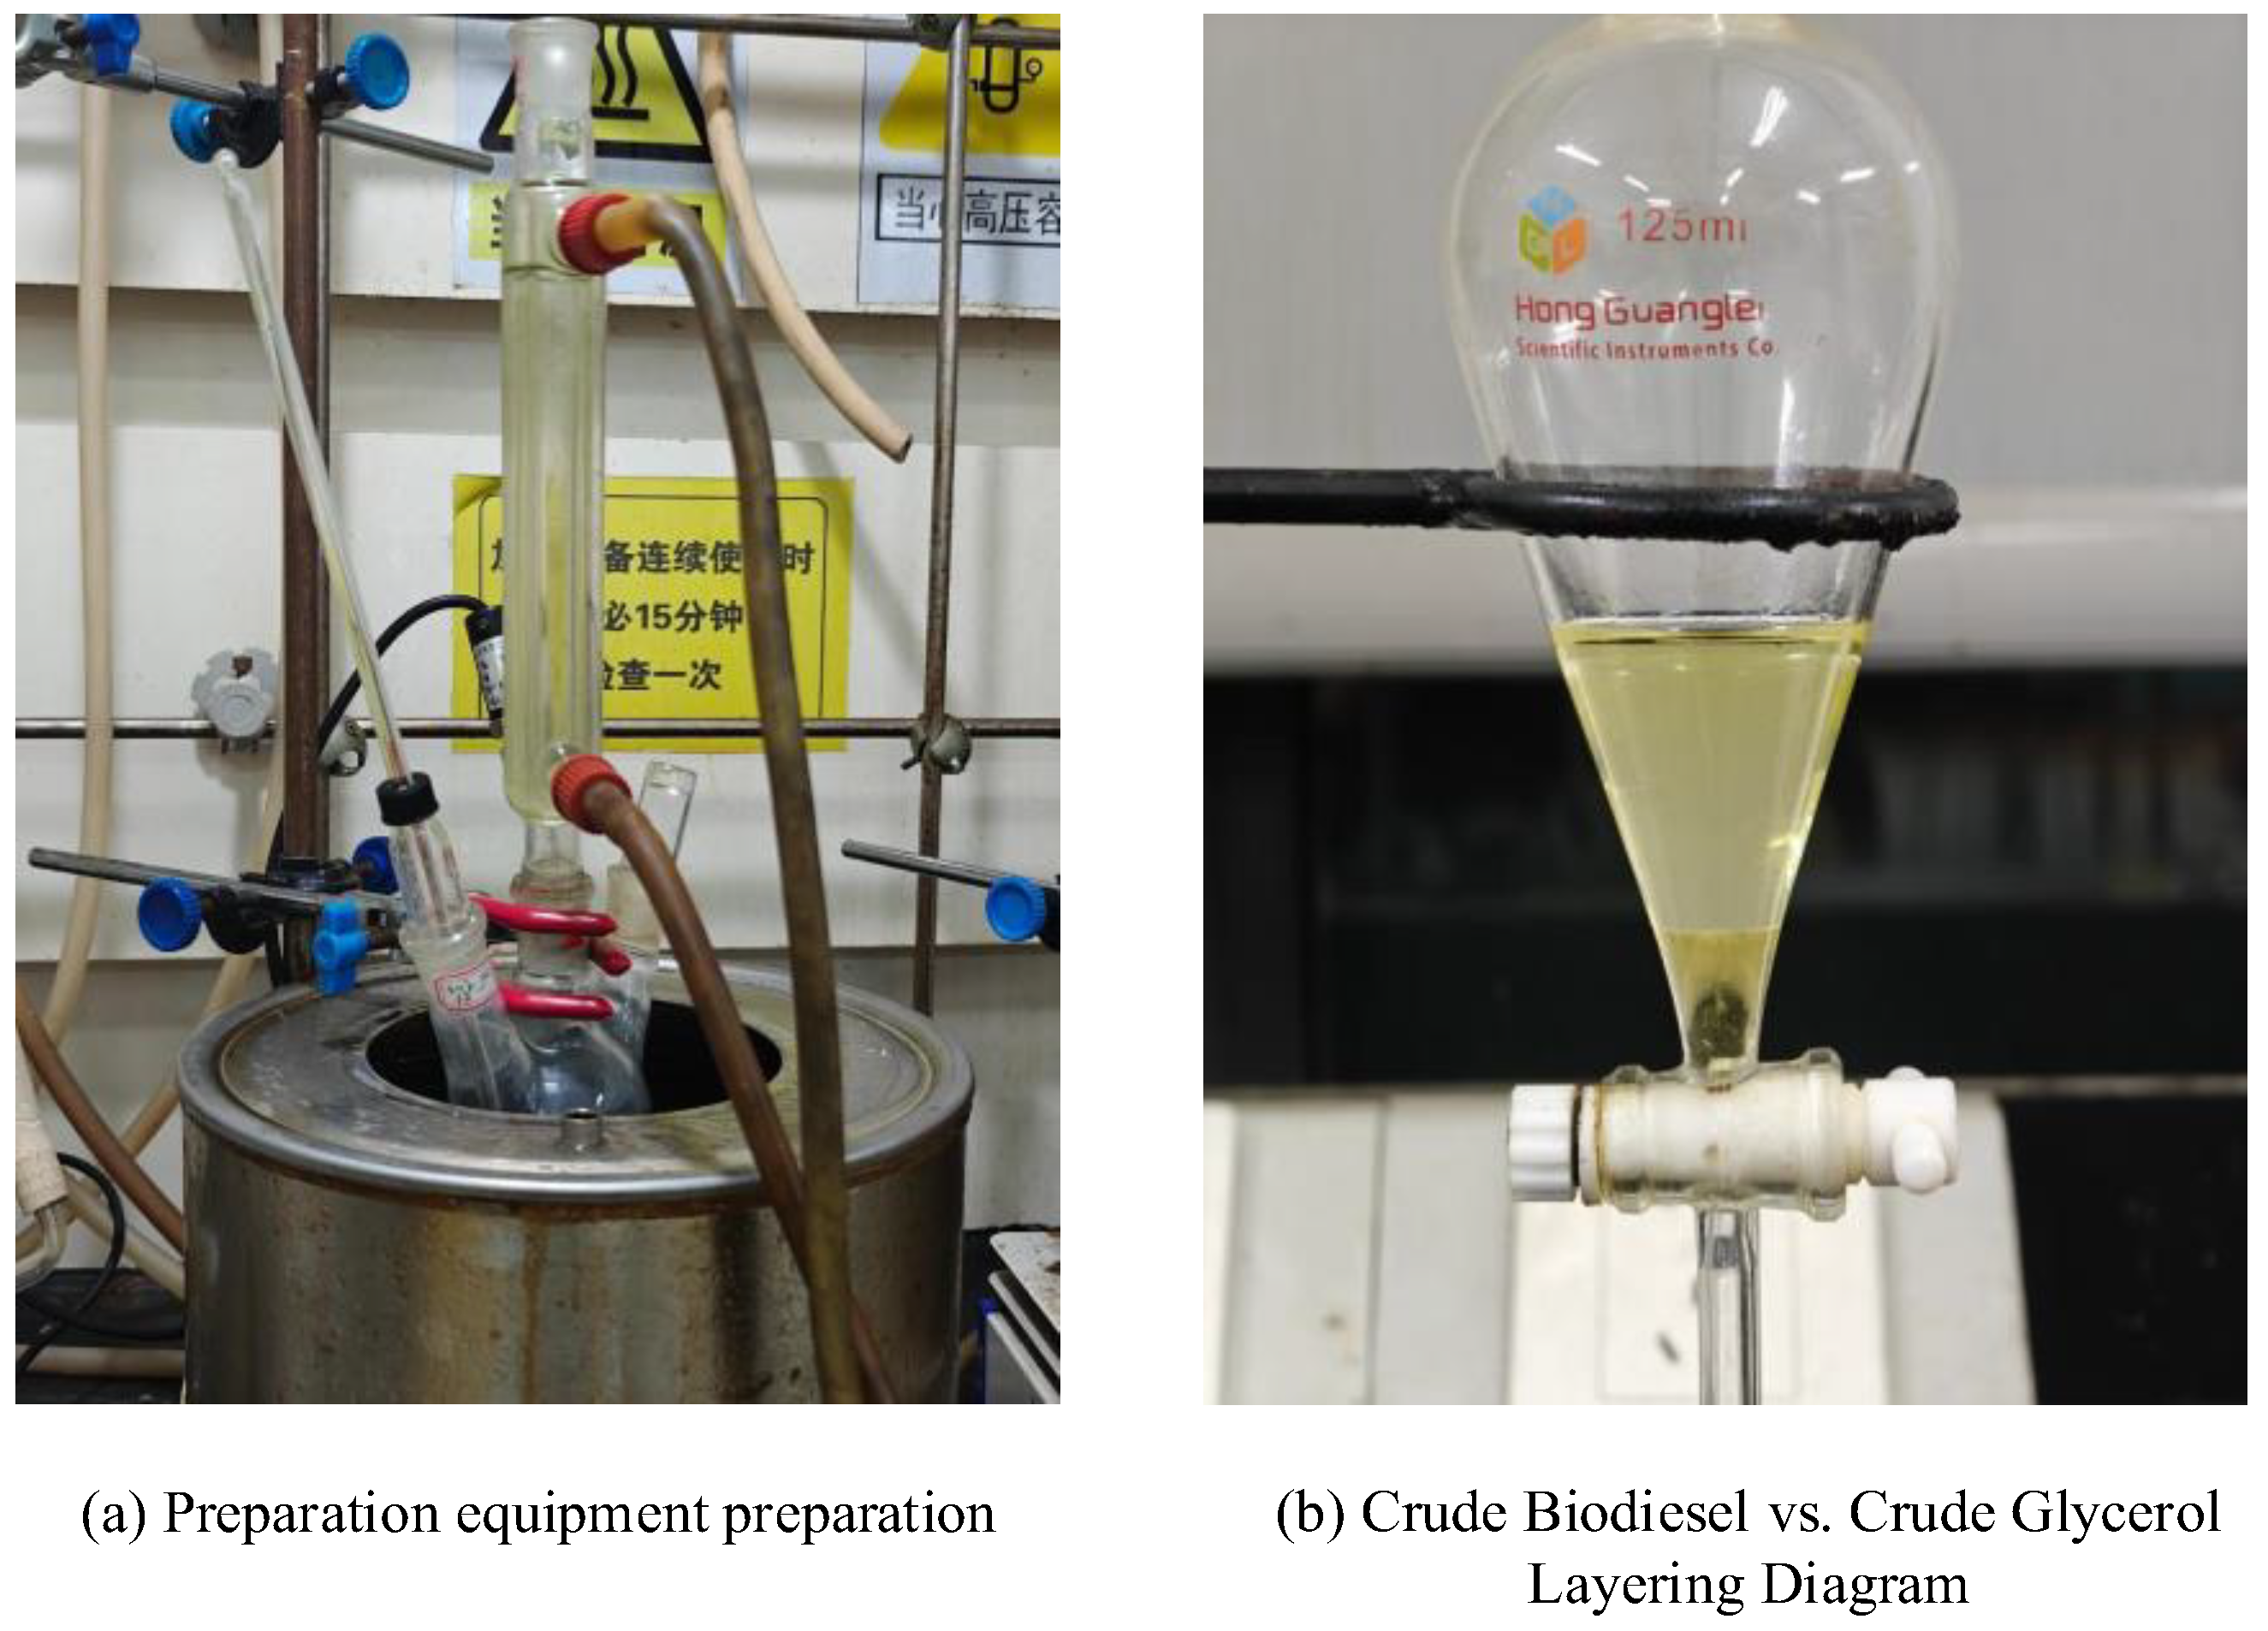
Figure 2.
EDS mapping-related images.
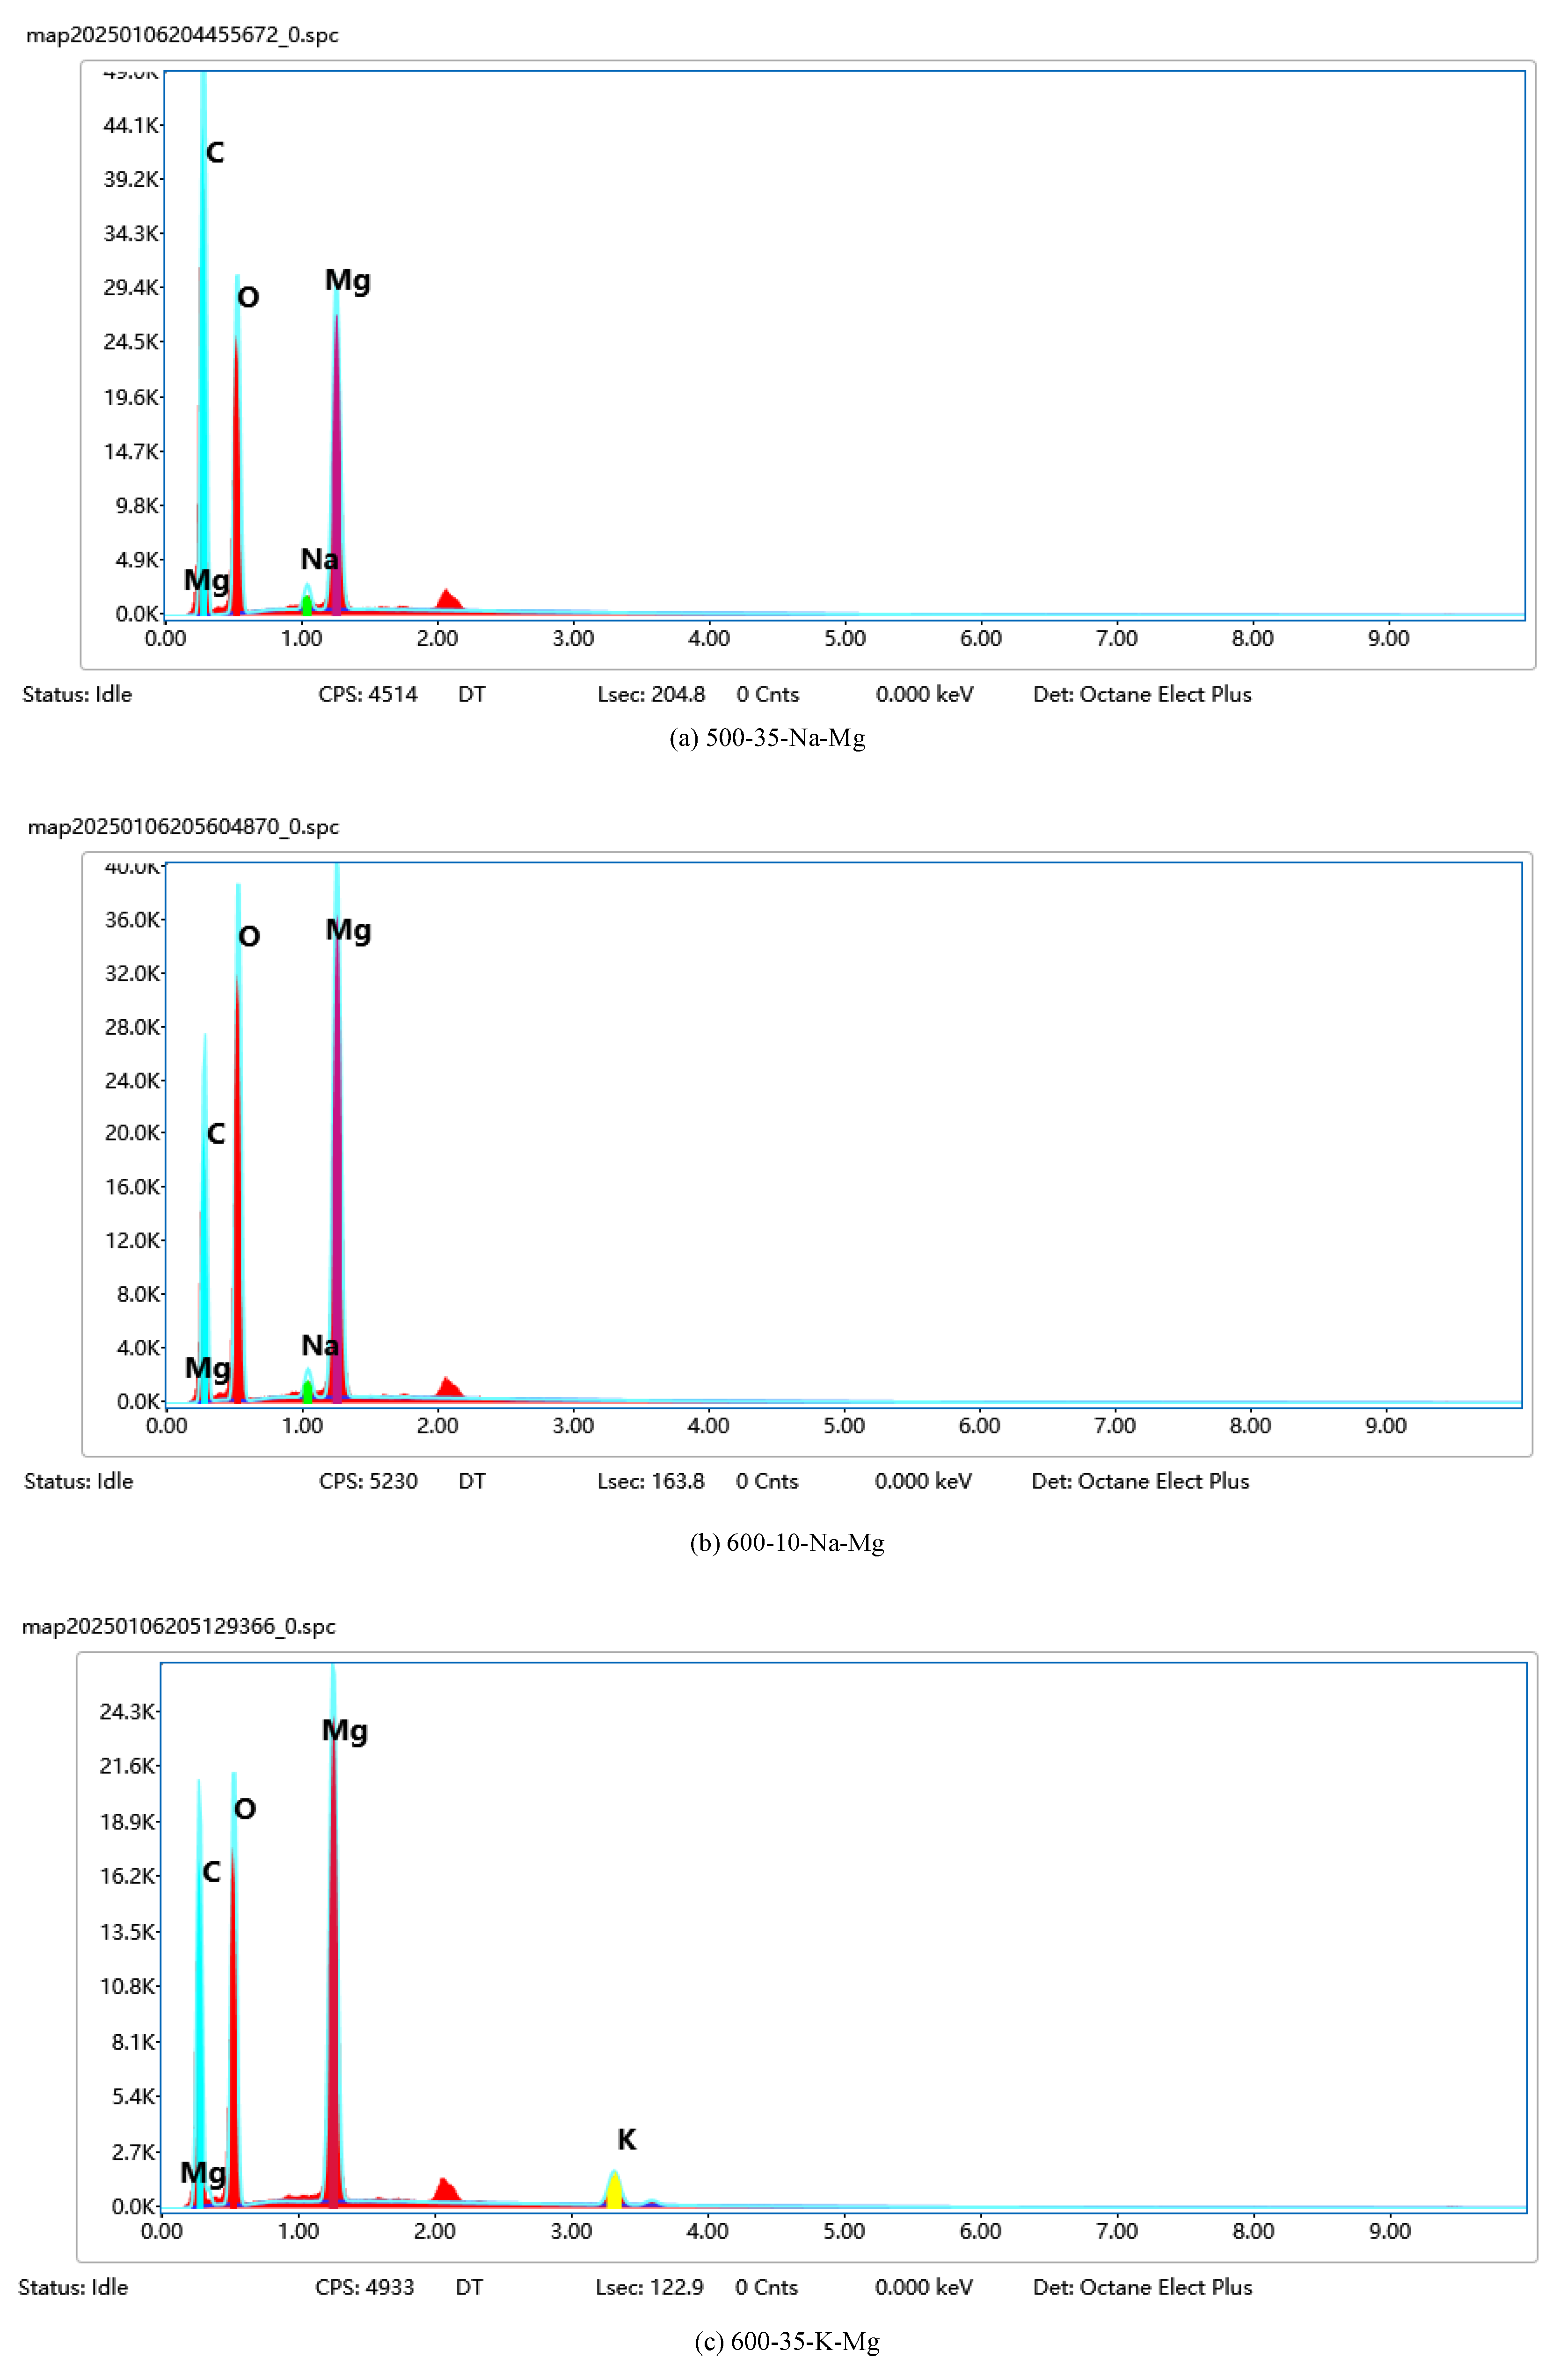
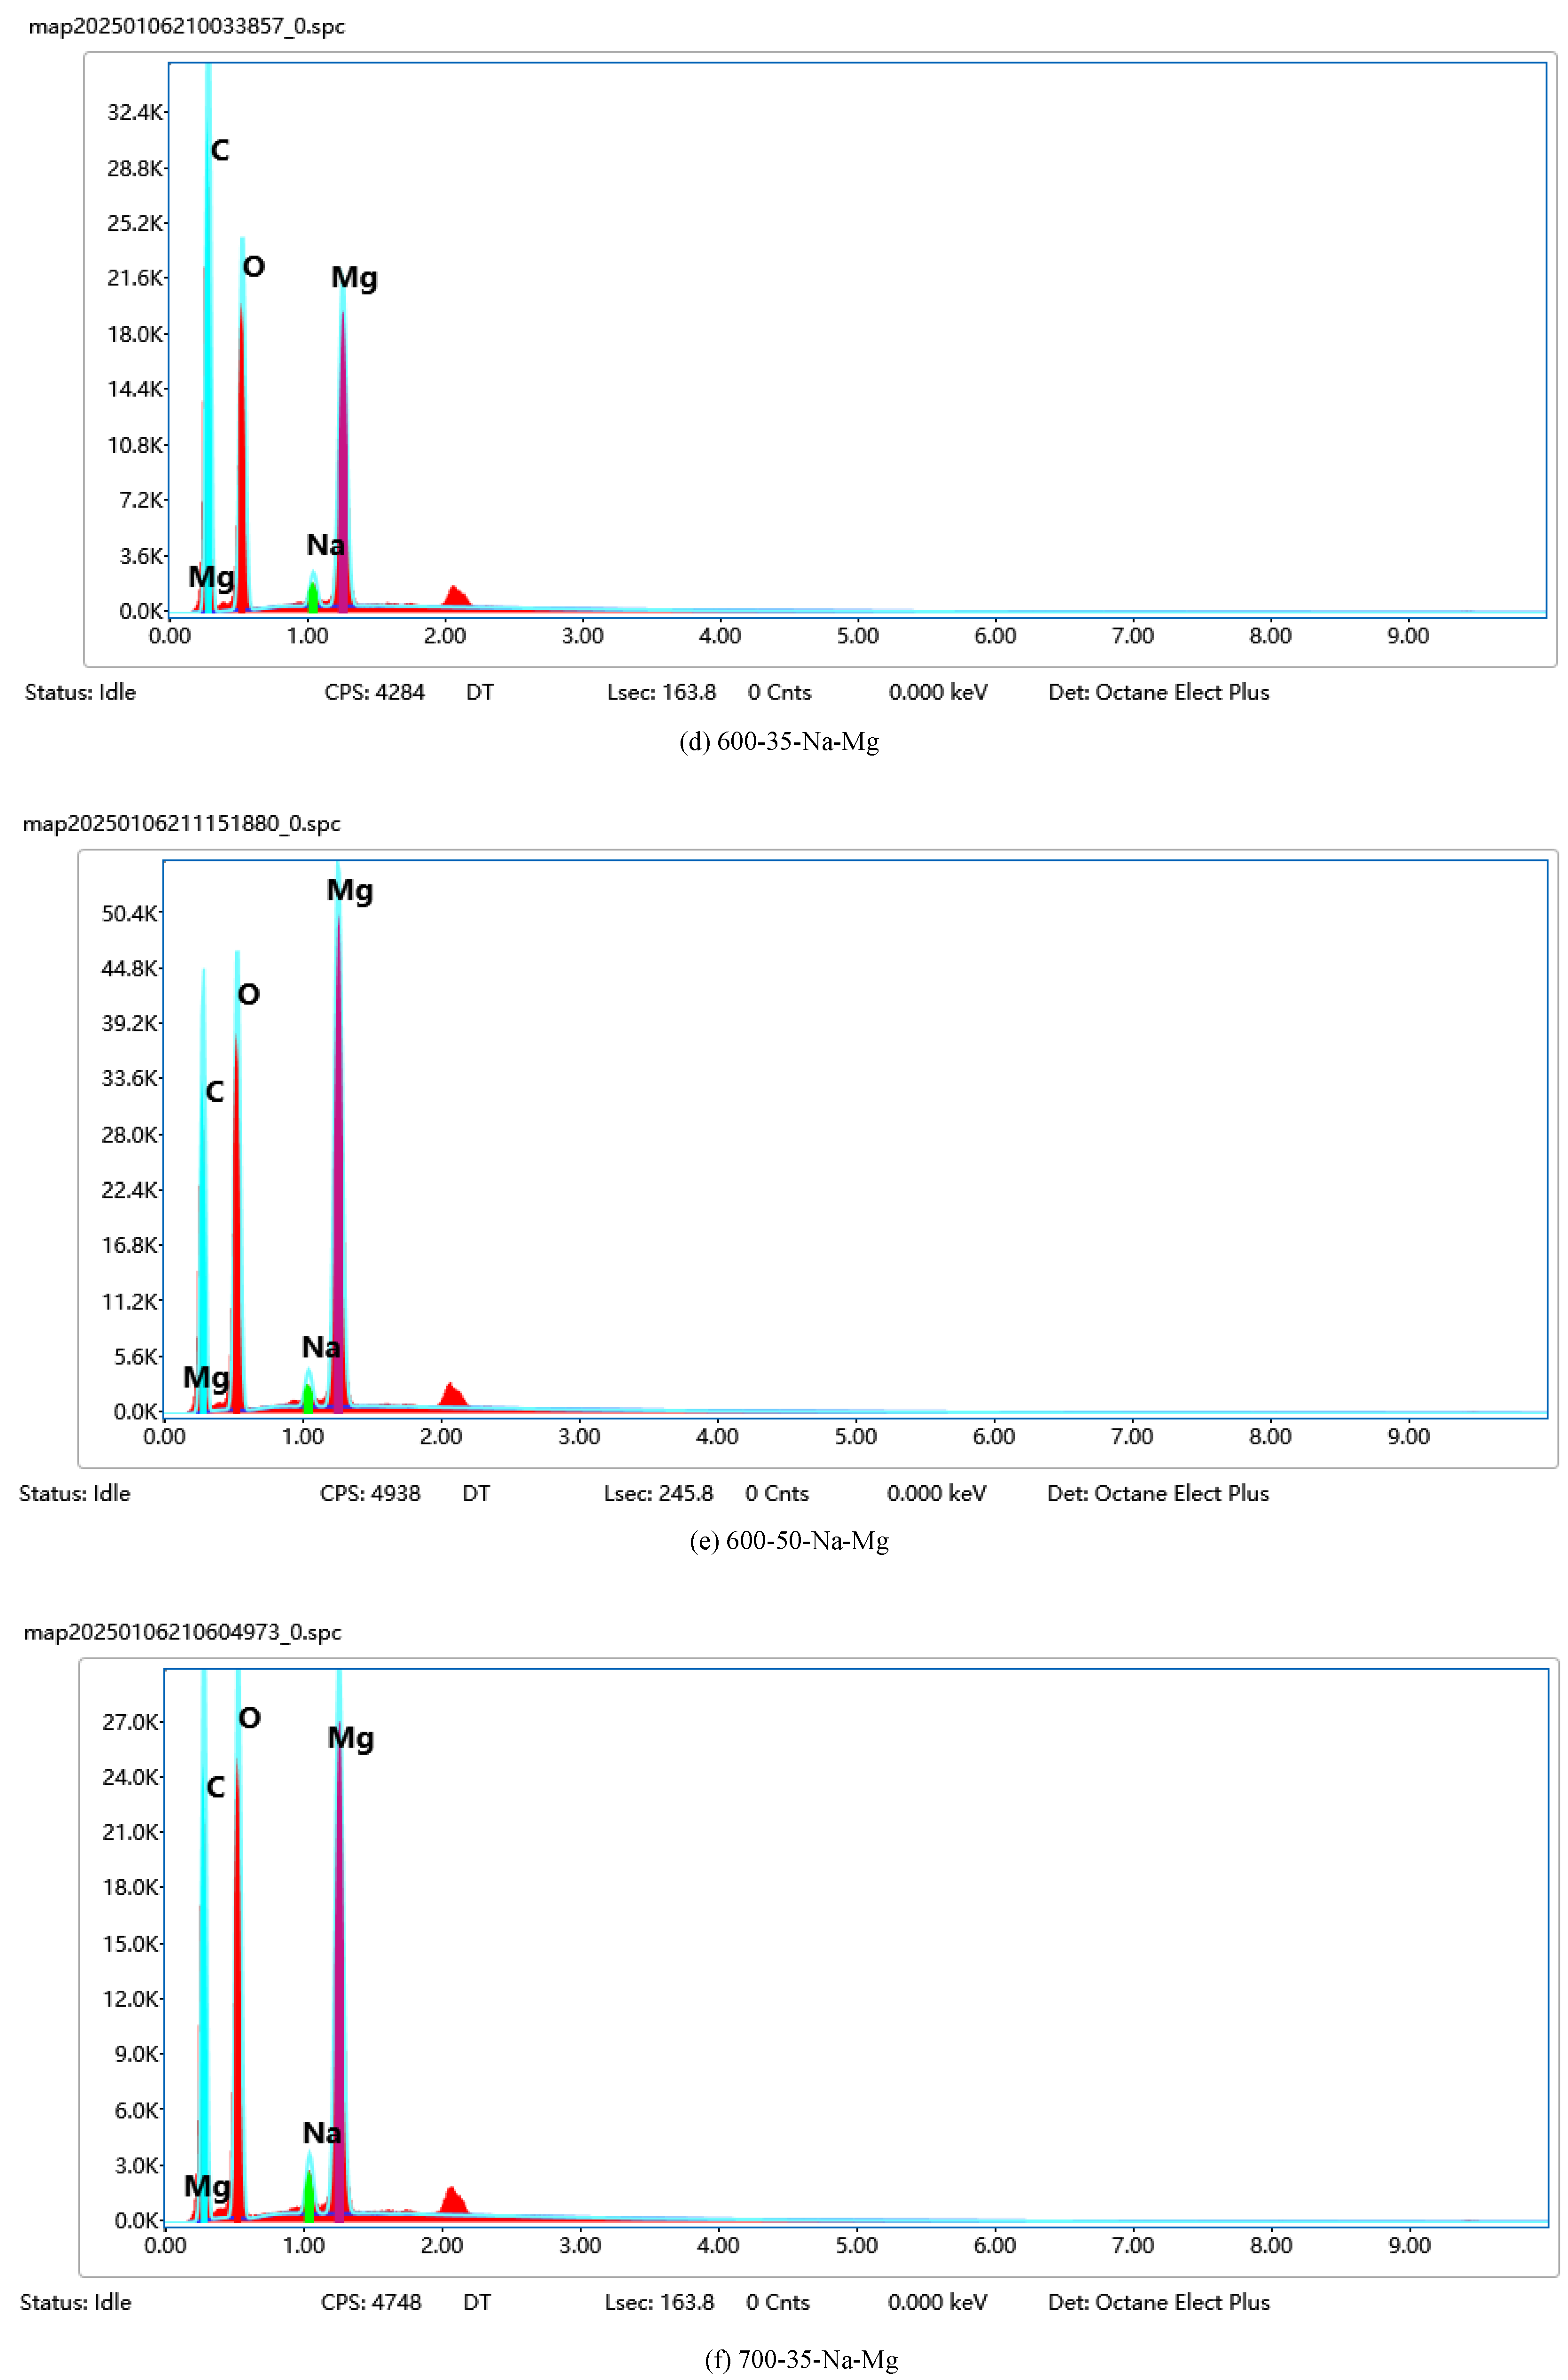
Figure 3.
SEM images. Note: (a) 100k-600-35-Na-Mg; (b) 50k-600-35-Na-Mg; (c) 20k-700-35-Na-Mg; (d) 20k-MgO; (e) 20k-Na2CO3; (f) 5k-600-50-Na-Mg.
Figure 3.
SEM images. Note: (a) 100k-600-35-Na-Mg; (b) 50k-600-35-Na-Mg; (c) 20k-700-35-Na-Mg; (d) 20k-MgO; (e) 20k-Na2CO3; (f) 5k-600-50-Na-Mg.
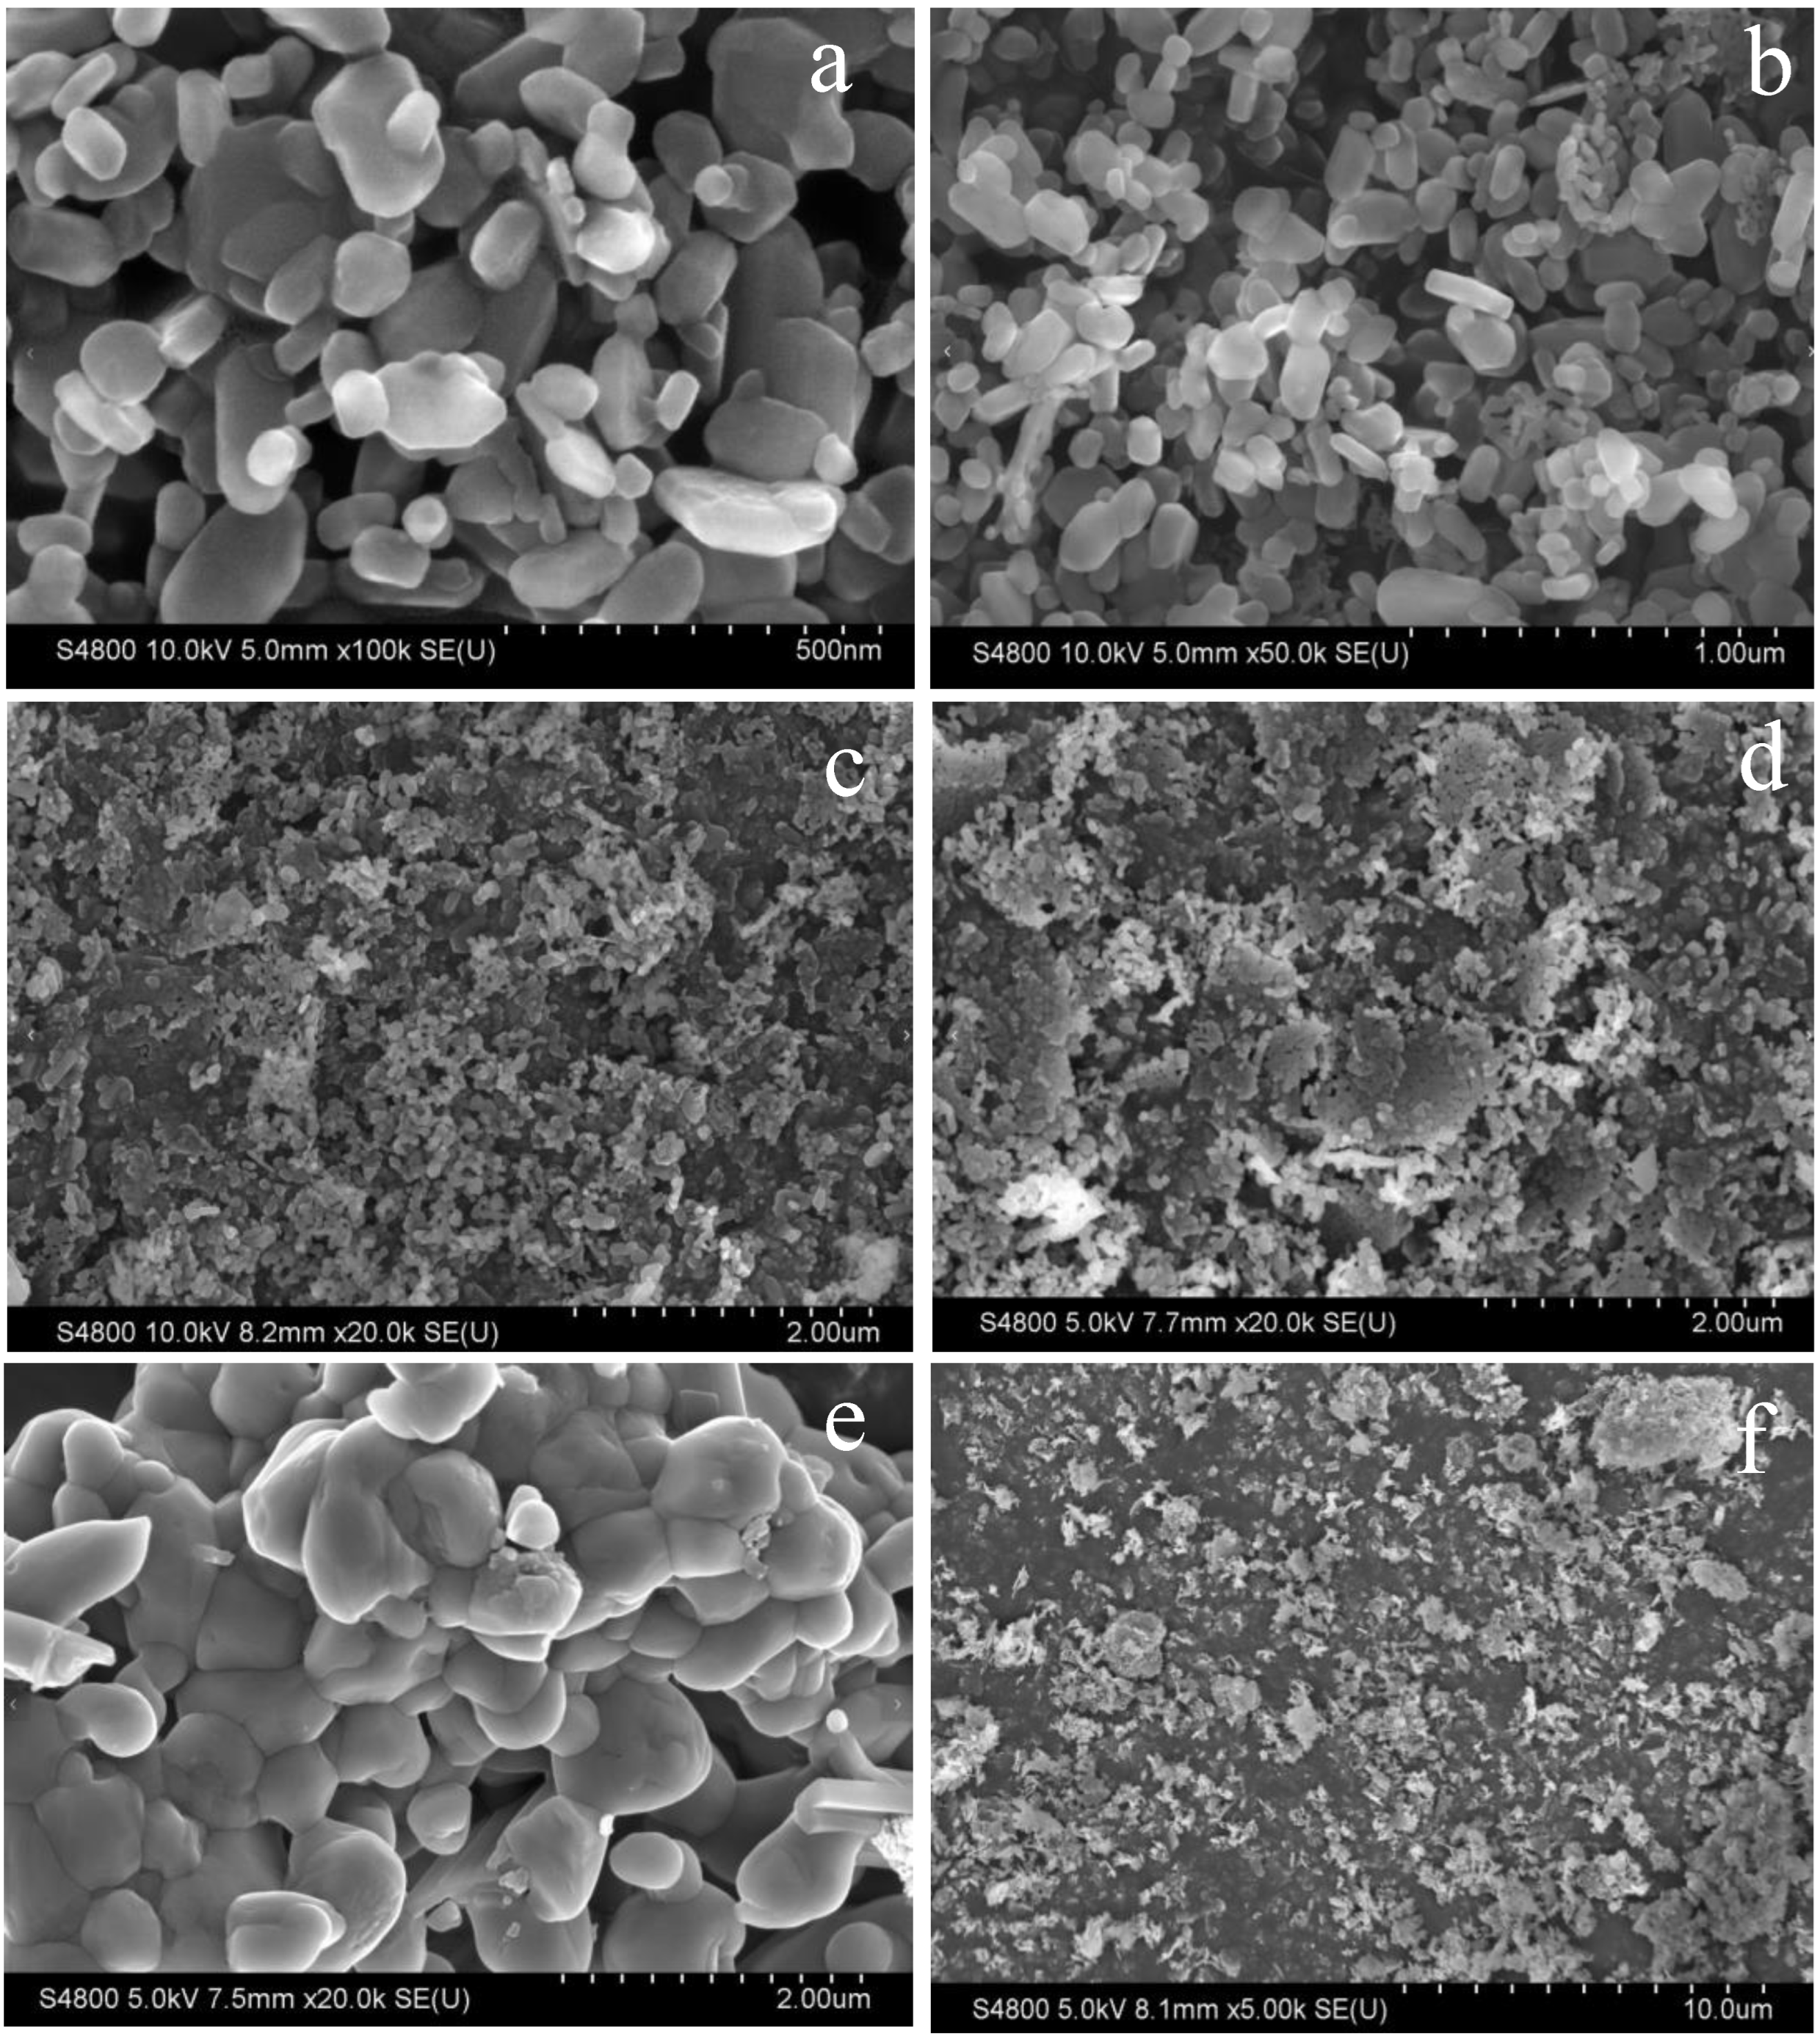
Figure 4.
N2 adsorption–desorption isotherms and pore size distribution of different catalysts.
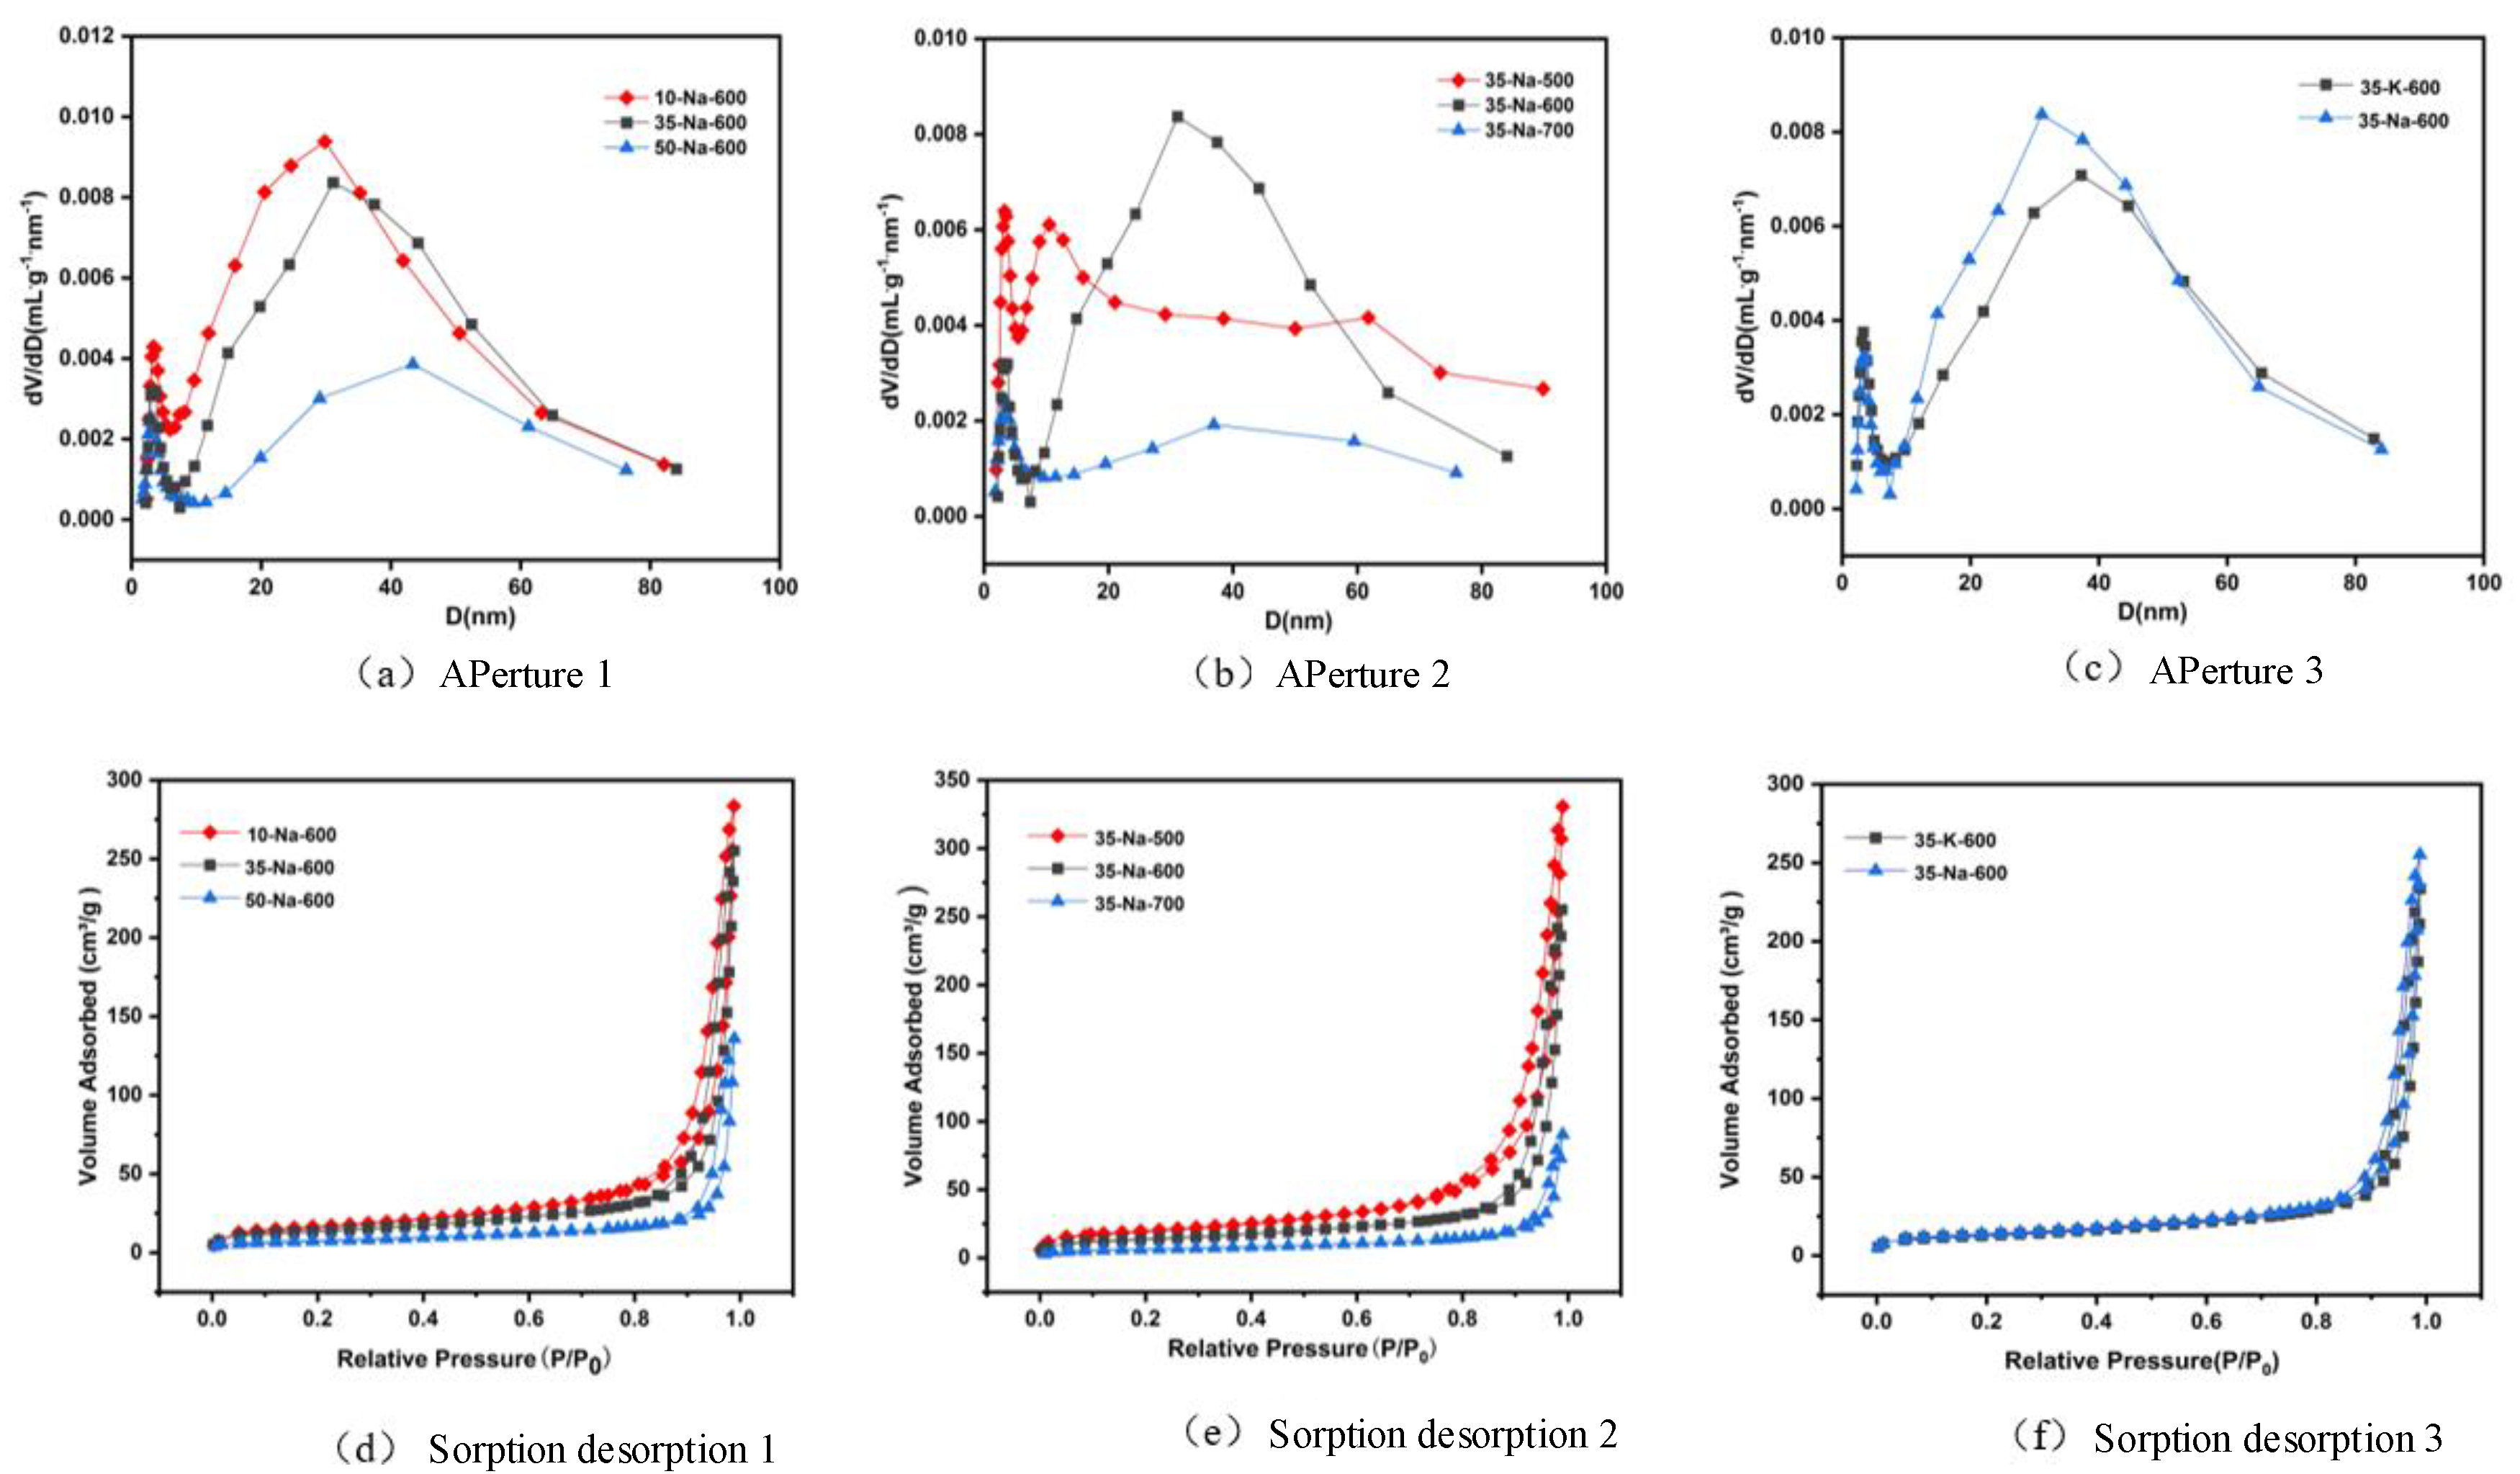
Figure 5.
(a) CO2 desorption curves of 35%-Na2CO3/MgO at different calcination temperatures. (b) Difference in desorption peaks between Na2CO3- and K2Co3-supported catalysts calcined at 600 °C.
Figure 5.
(a) CO2 desorption curves of 35%-Na2CO3/MgO at different calcination temperatures. (b) Difference in desorption peaks between Na2CO3- and K2Co3-supported catalysts calcined at 600 °C.
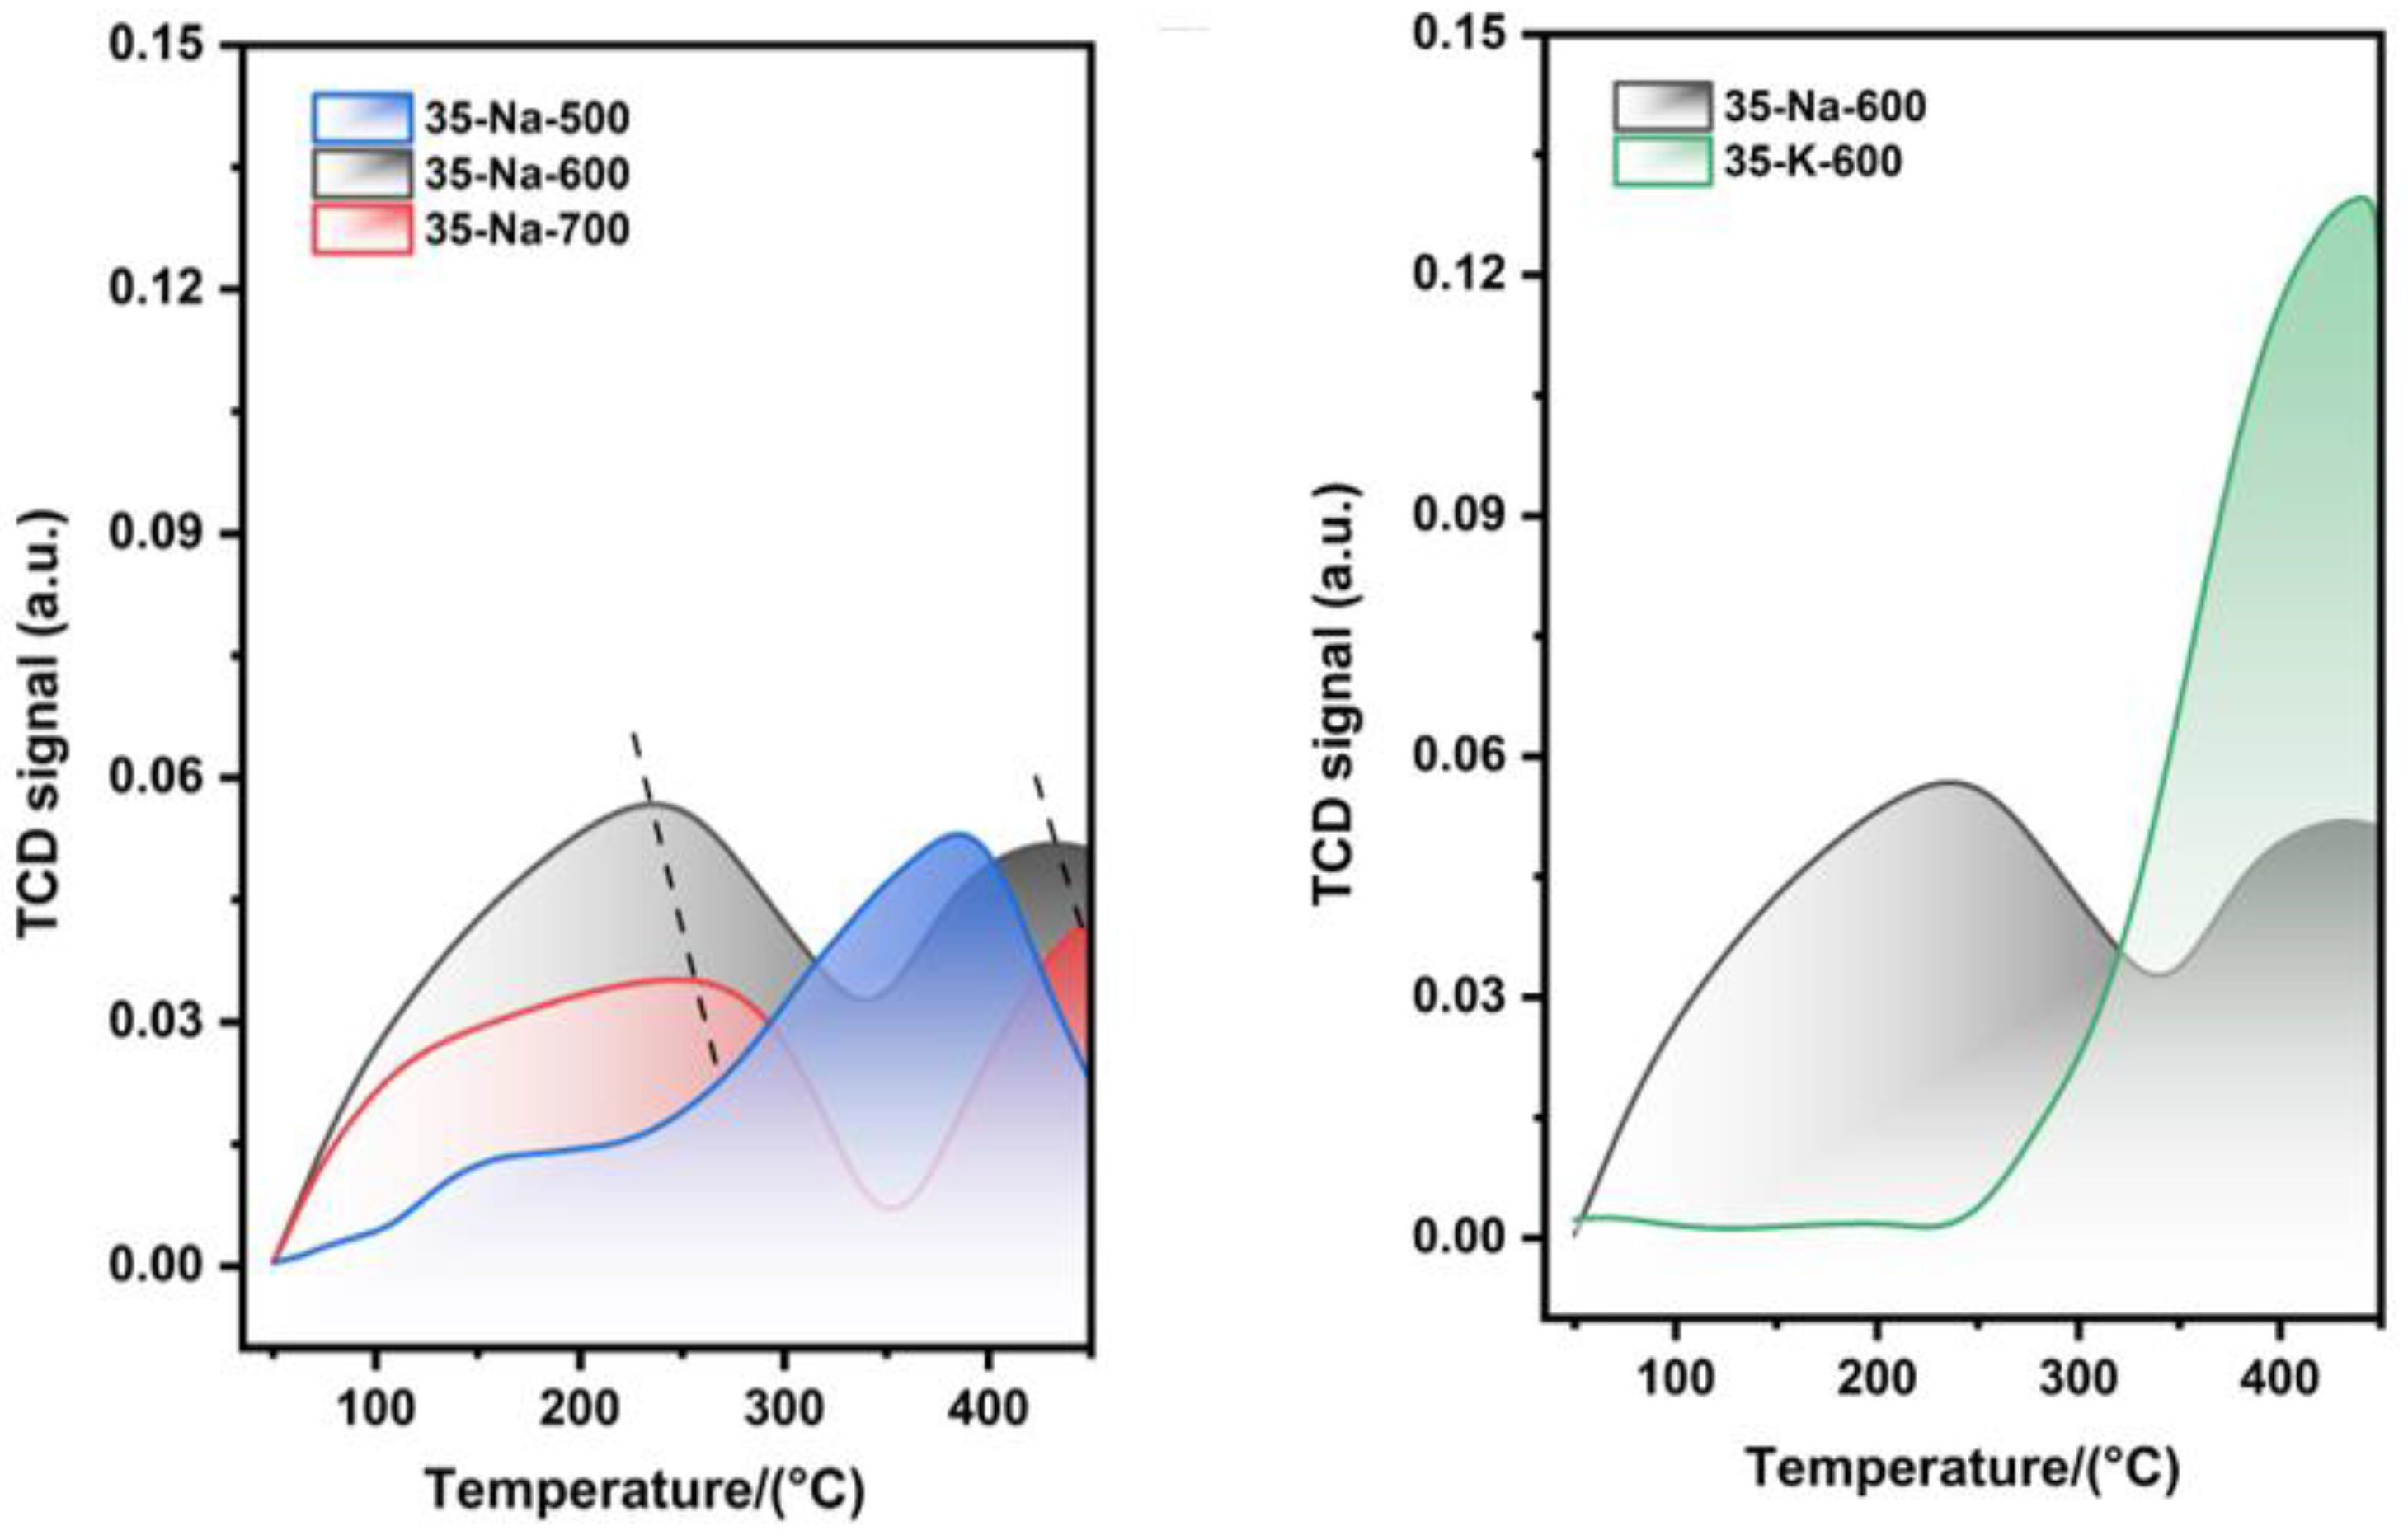
Figure 6.
(a) XRD patterns of 35%-Na2CO3/MgO at different calcination temperatures. (b) XRD peak position differences of Na2CO3 and K2CO3 catalysts calcined at 600 °C.
Figure 6.
(a) XRD patterns of 35%-Na2CO3/MgO at different calcination temperatures. (b) XRD peak position differences of Na2CO3 and K2CO3 catalysts calcined at 600 °C.
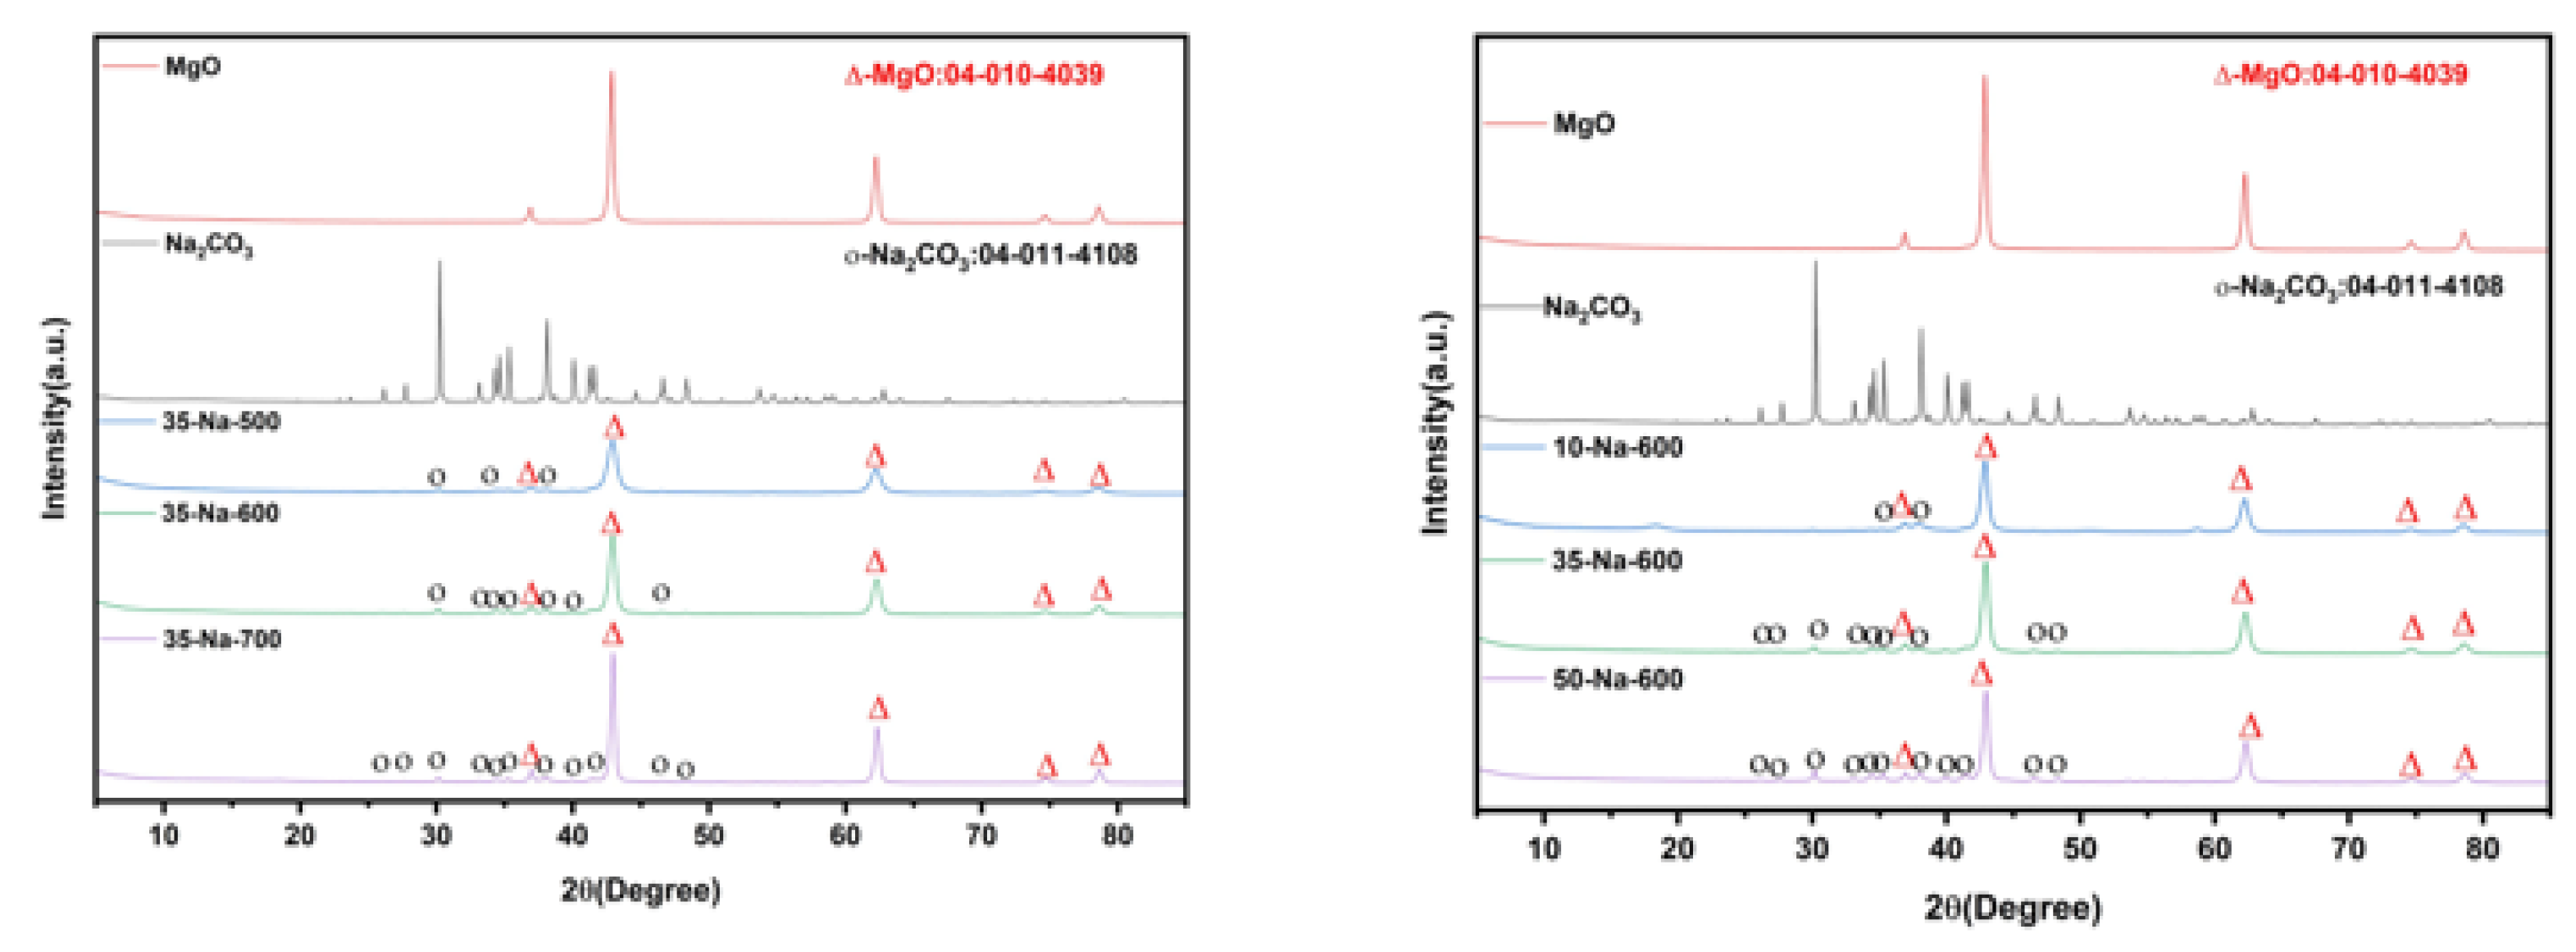
Figure 7.
(a) FTIR spectra. (b) TG-DTG weight curve of Na2CO3/K2CO3. (c) TG-DTG weight loss curve of Na2CO3/K2CO3.
Figure 7.
(a) FTIR spectra. (b) TG-DTG weight curve of Na2CO3/K2CO3. (c) TG-DTG weight loss curve of Na2CO3/K2CO3.
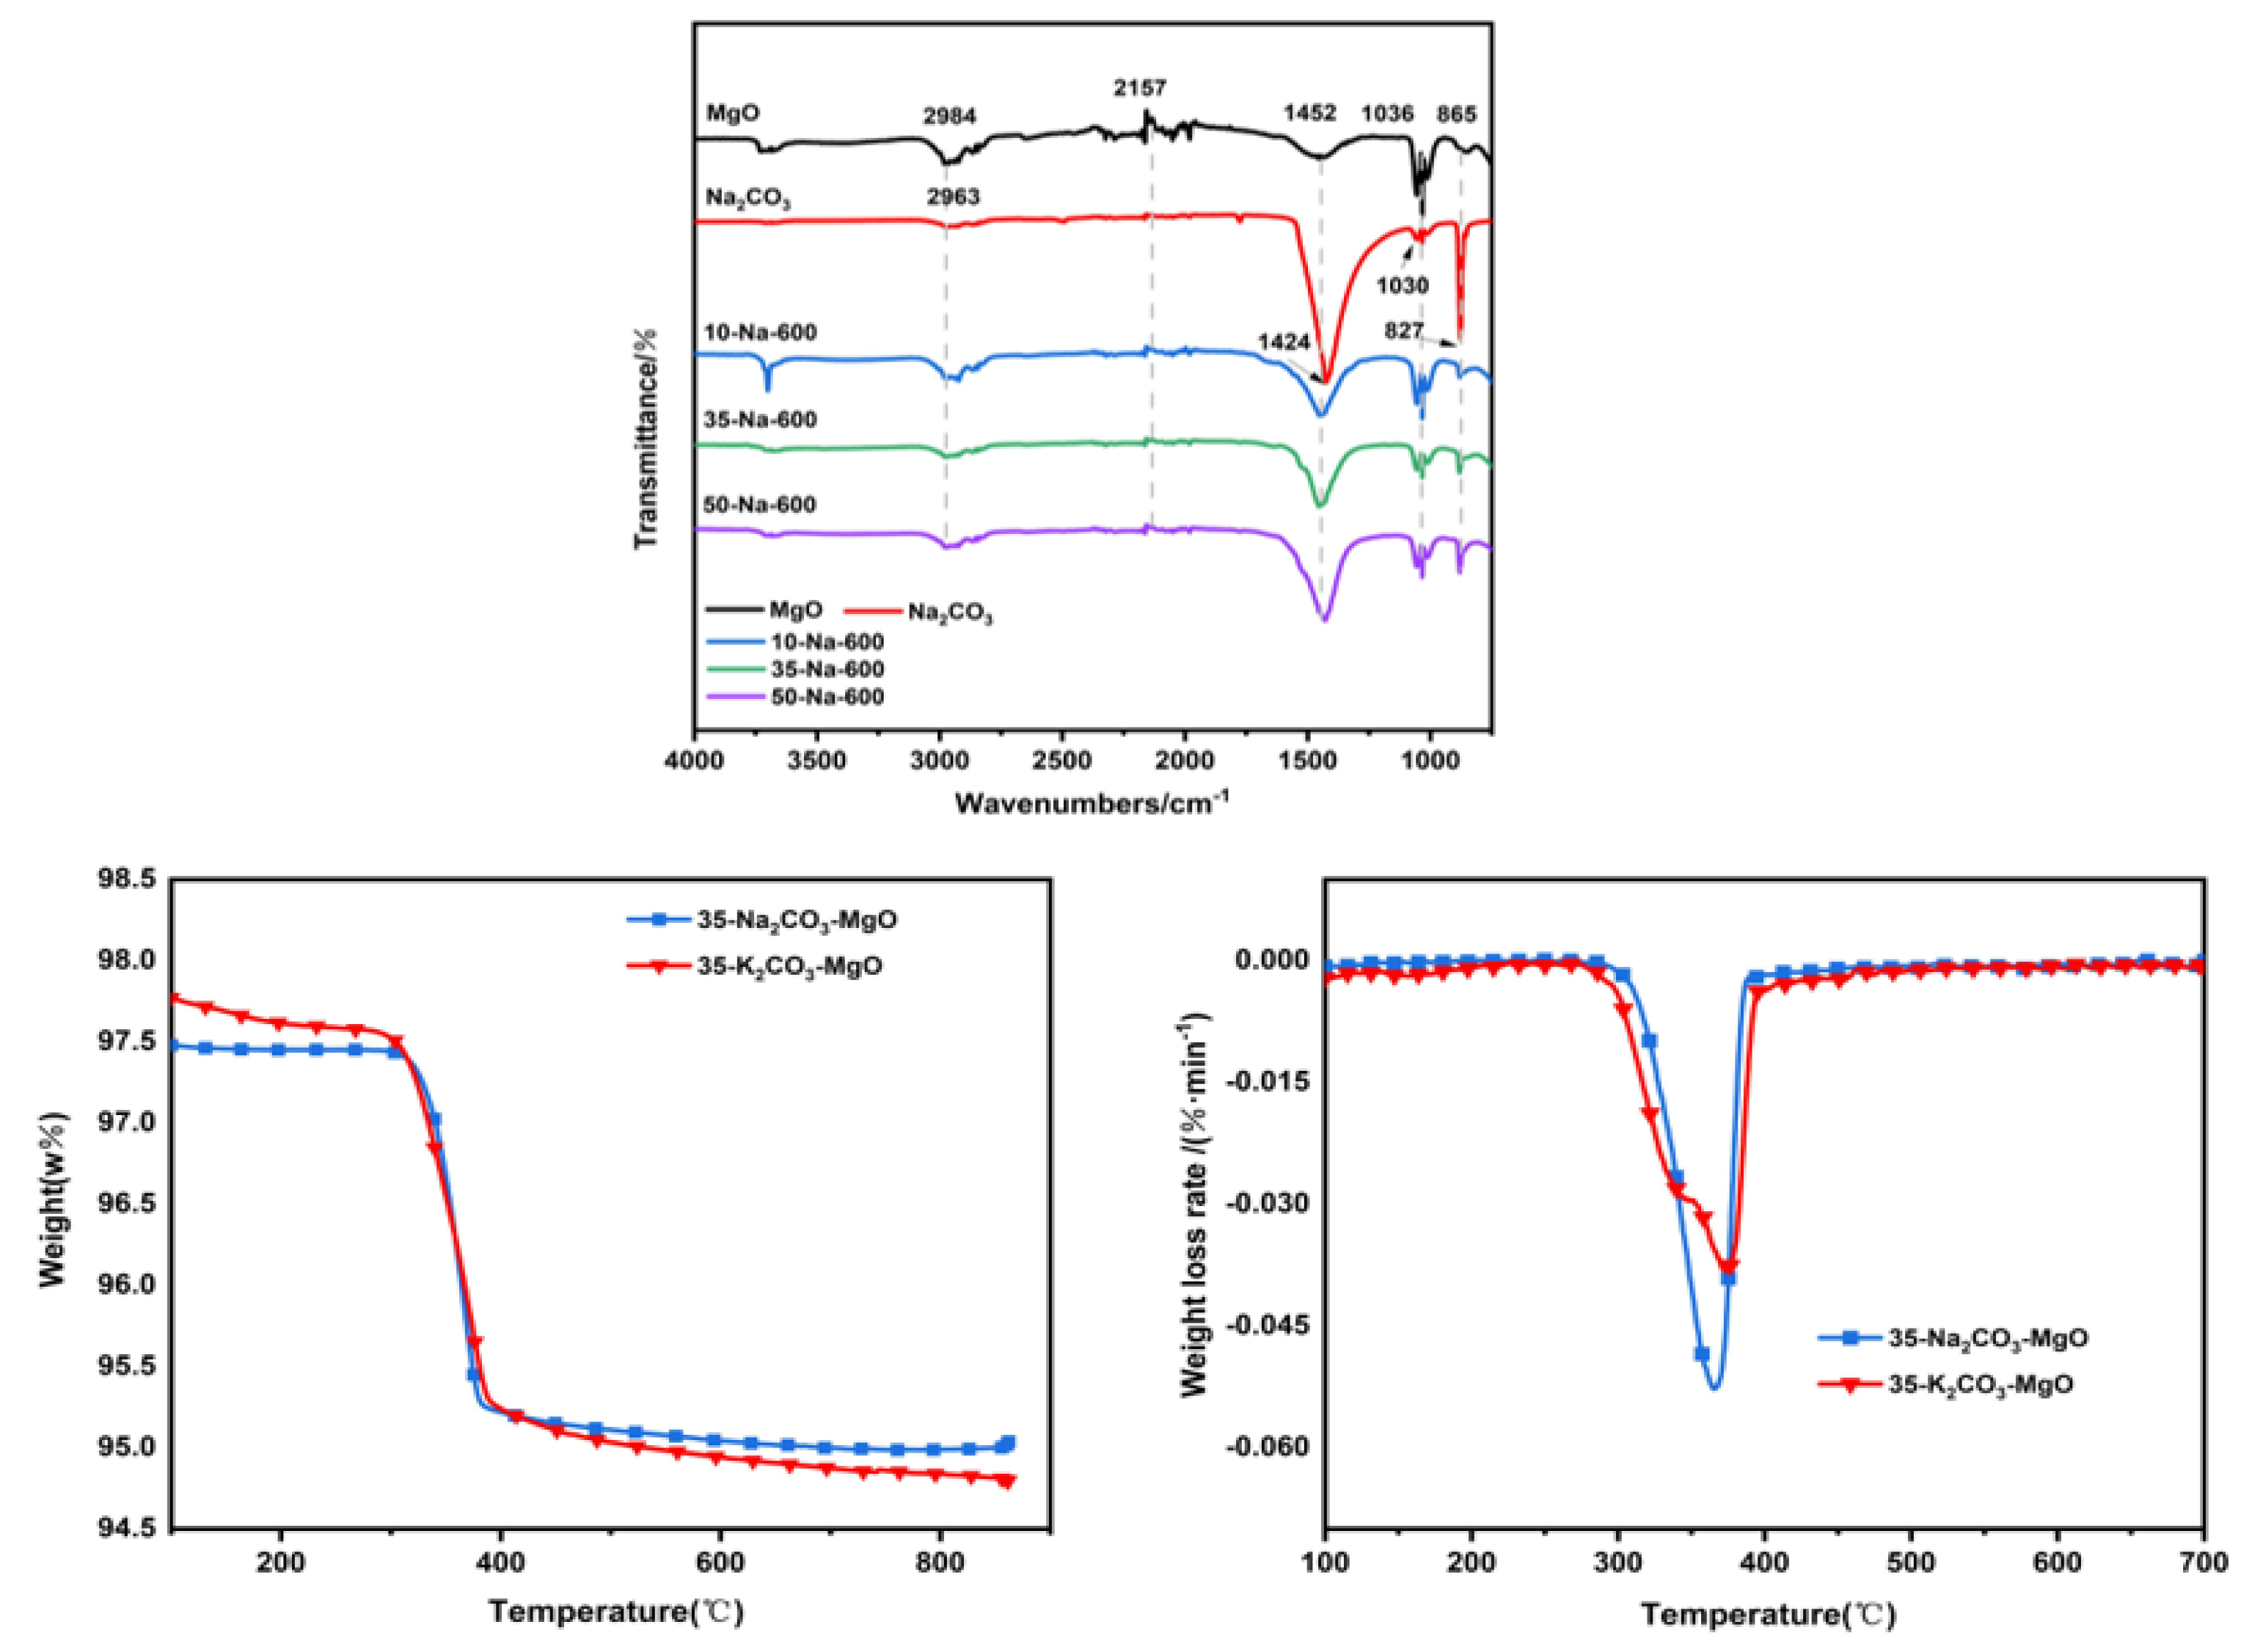
Figure 8.
Relationship between loading rate for Na2CO3-MgO and FAME yield.
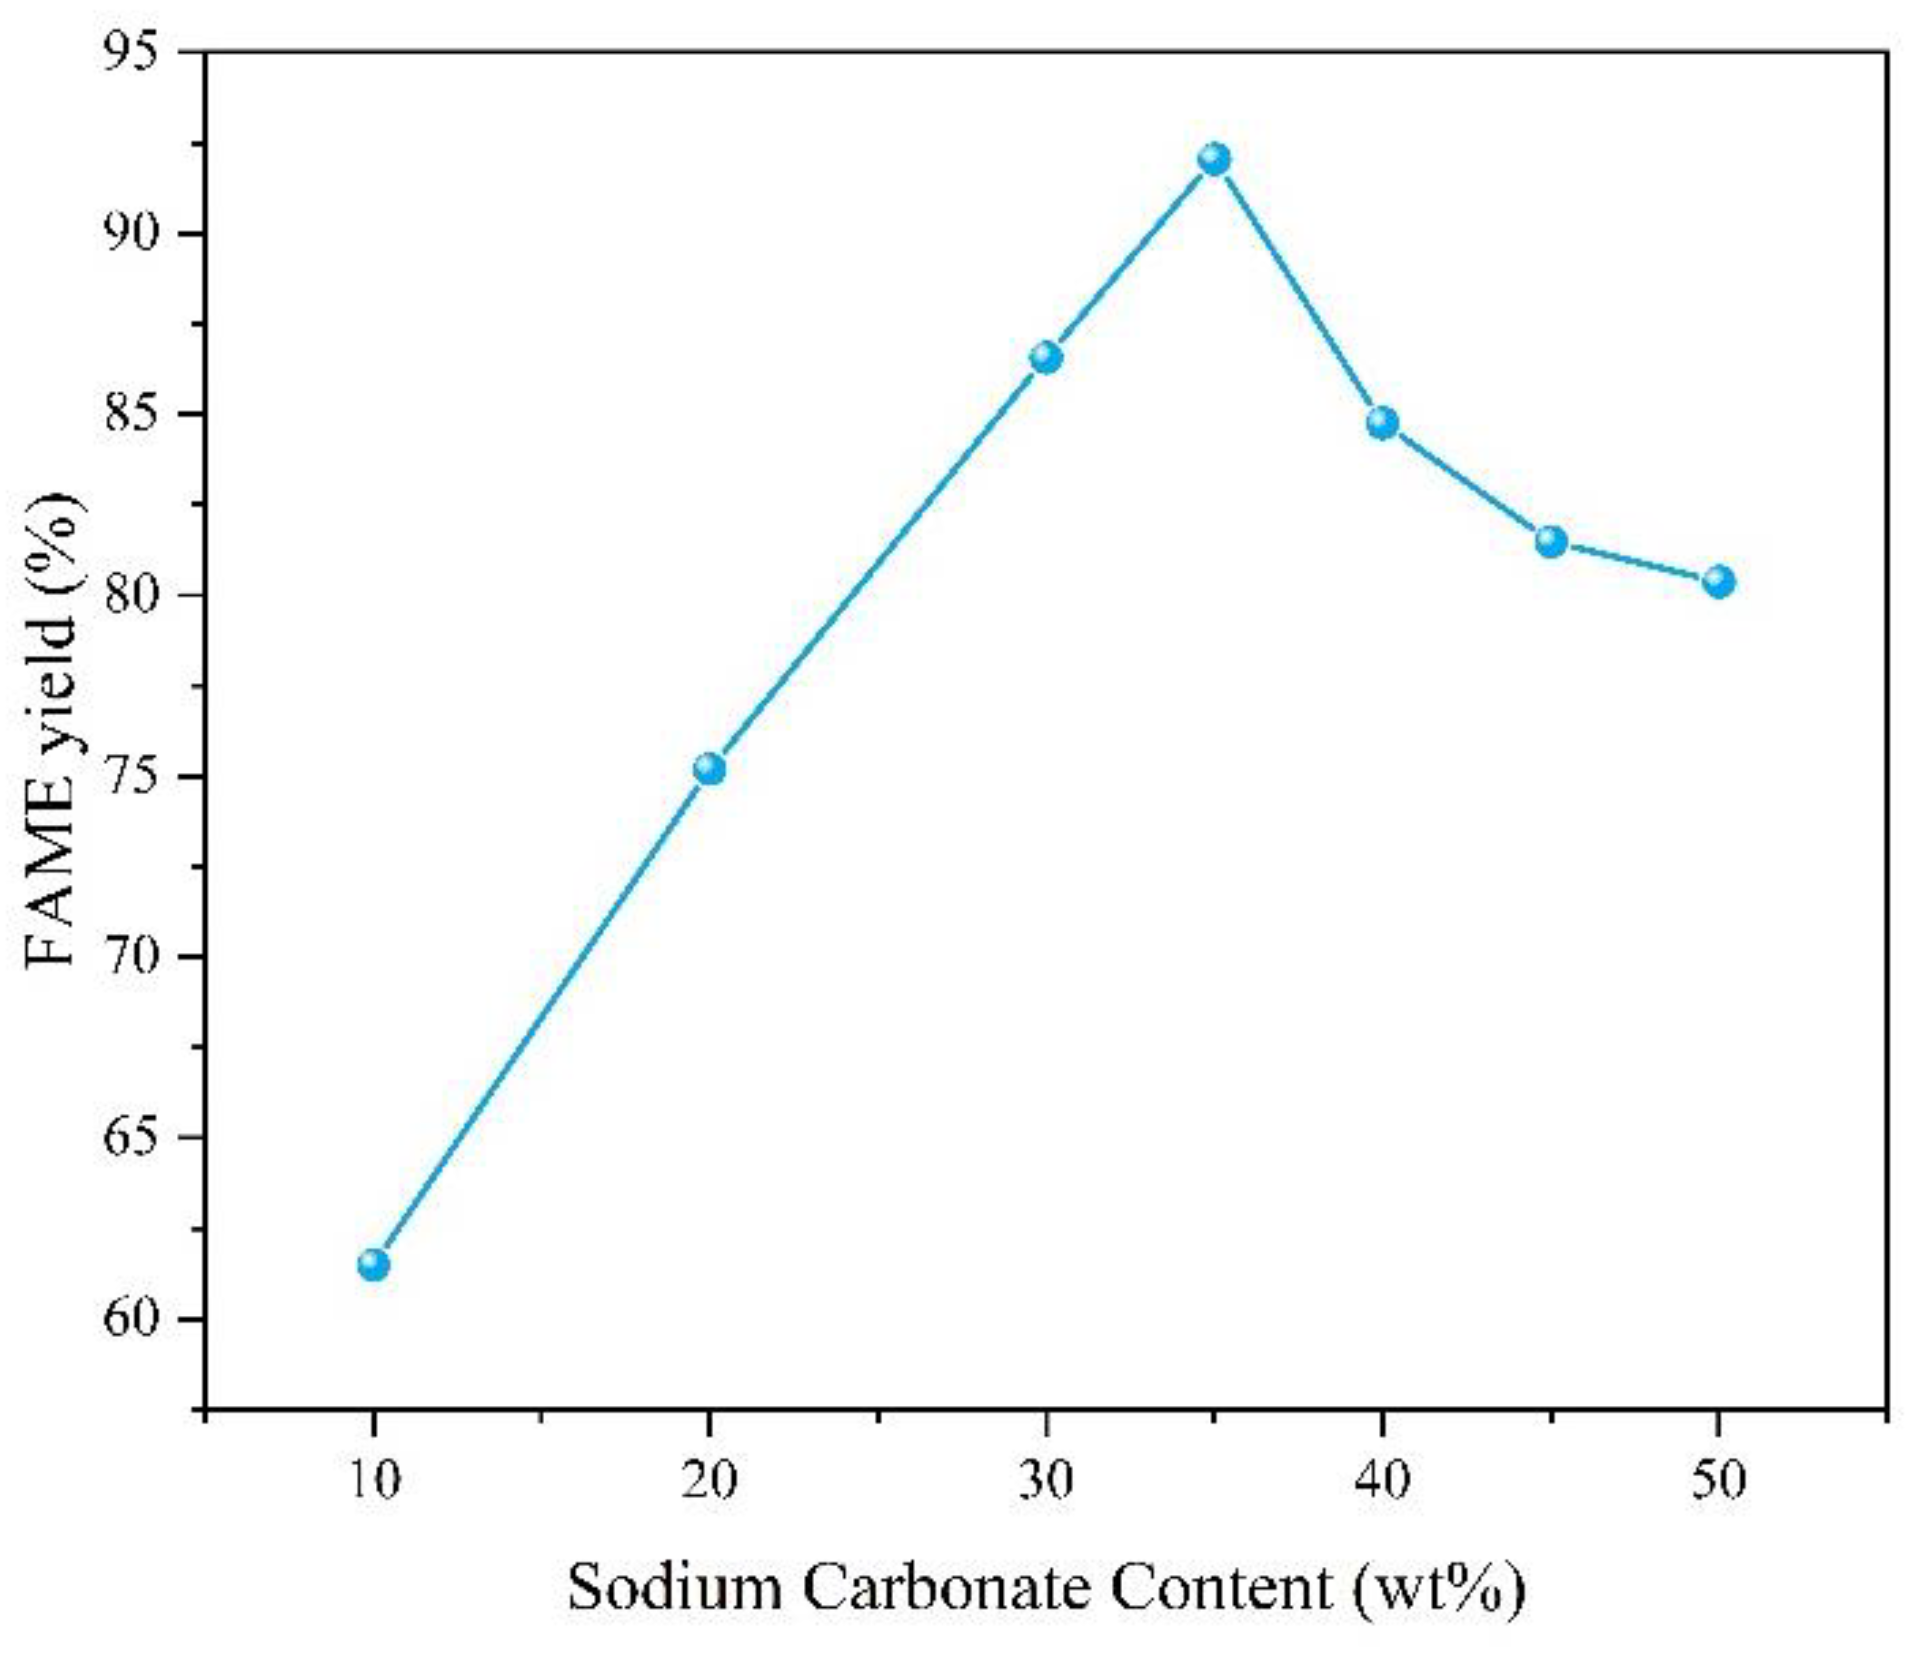
Figure 9.
Relationship between calcination temperature for MgO/Na2CO3 and FAME yield (error bars: ±SD, n = 3).
Figure 9.
Relationship between calcination temperature for MgO/Na2CO3 and FAME yield (error bars: ±SD, n = 3).
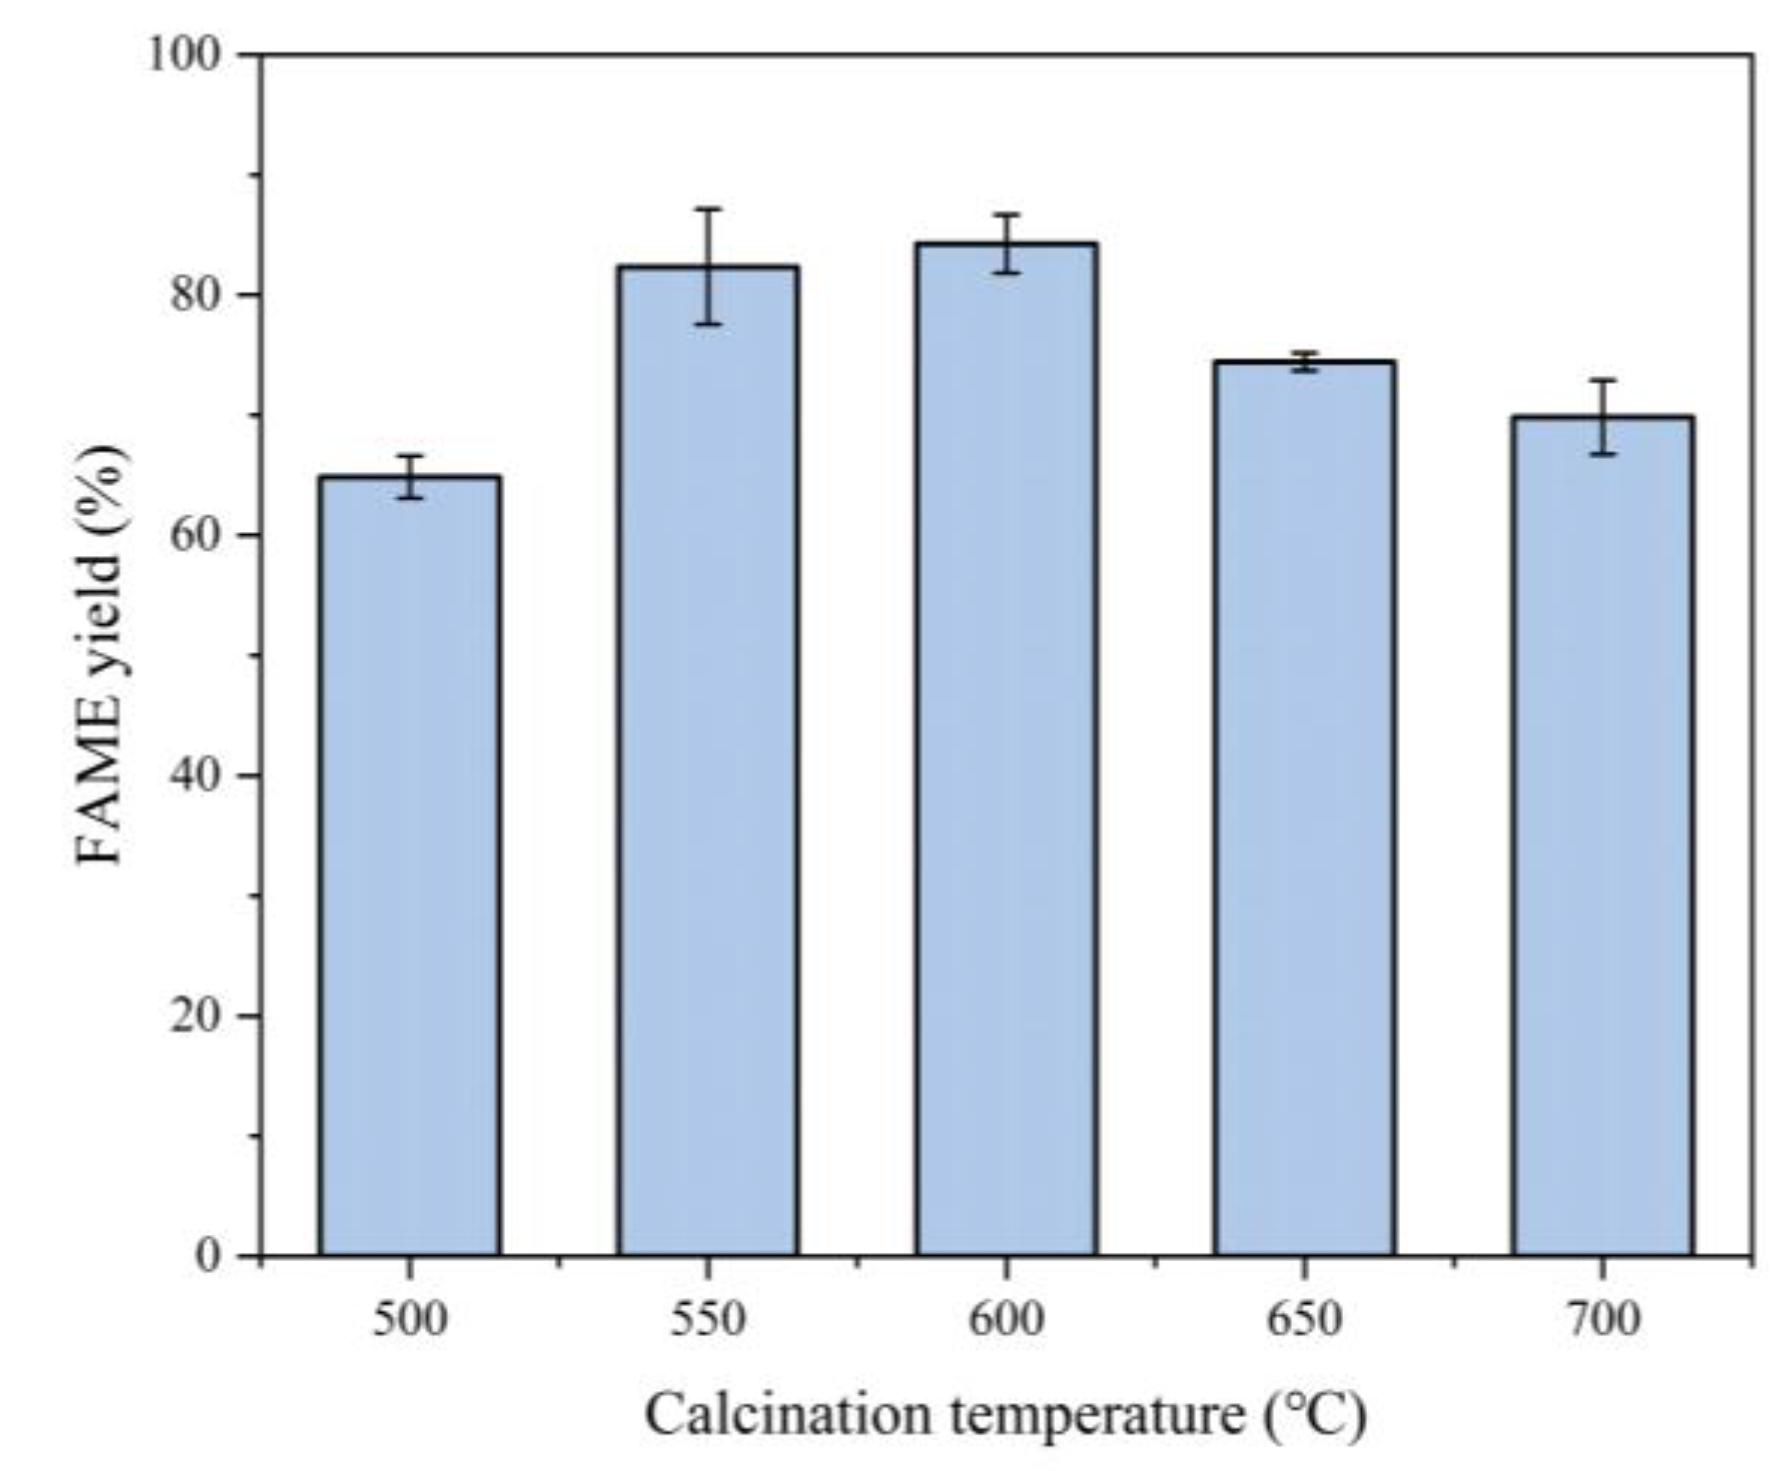
Figure 10.
Relationship between reaction temperature and FAME yield (n = 3).
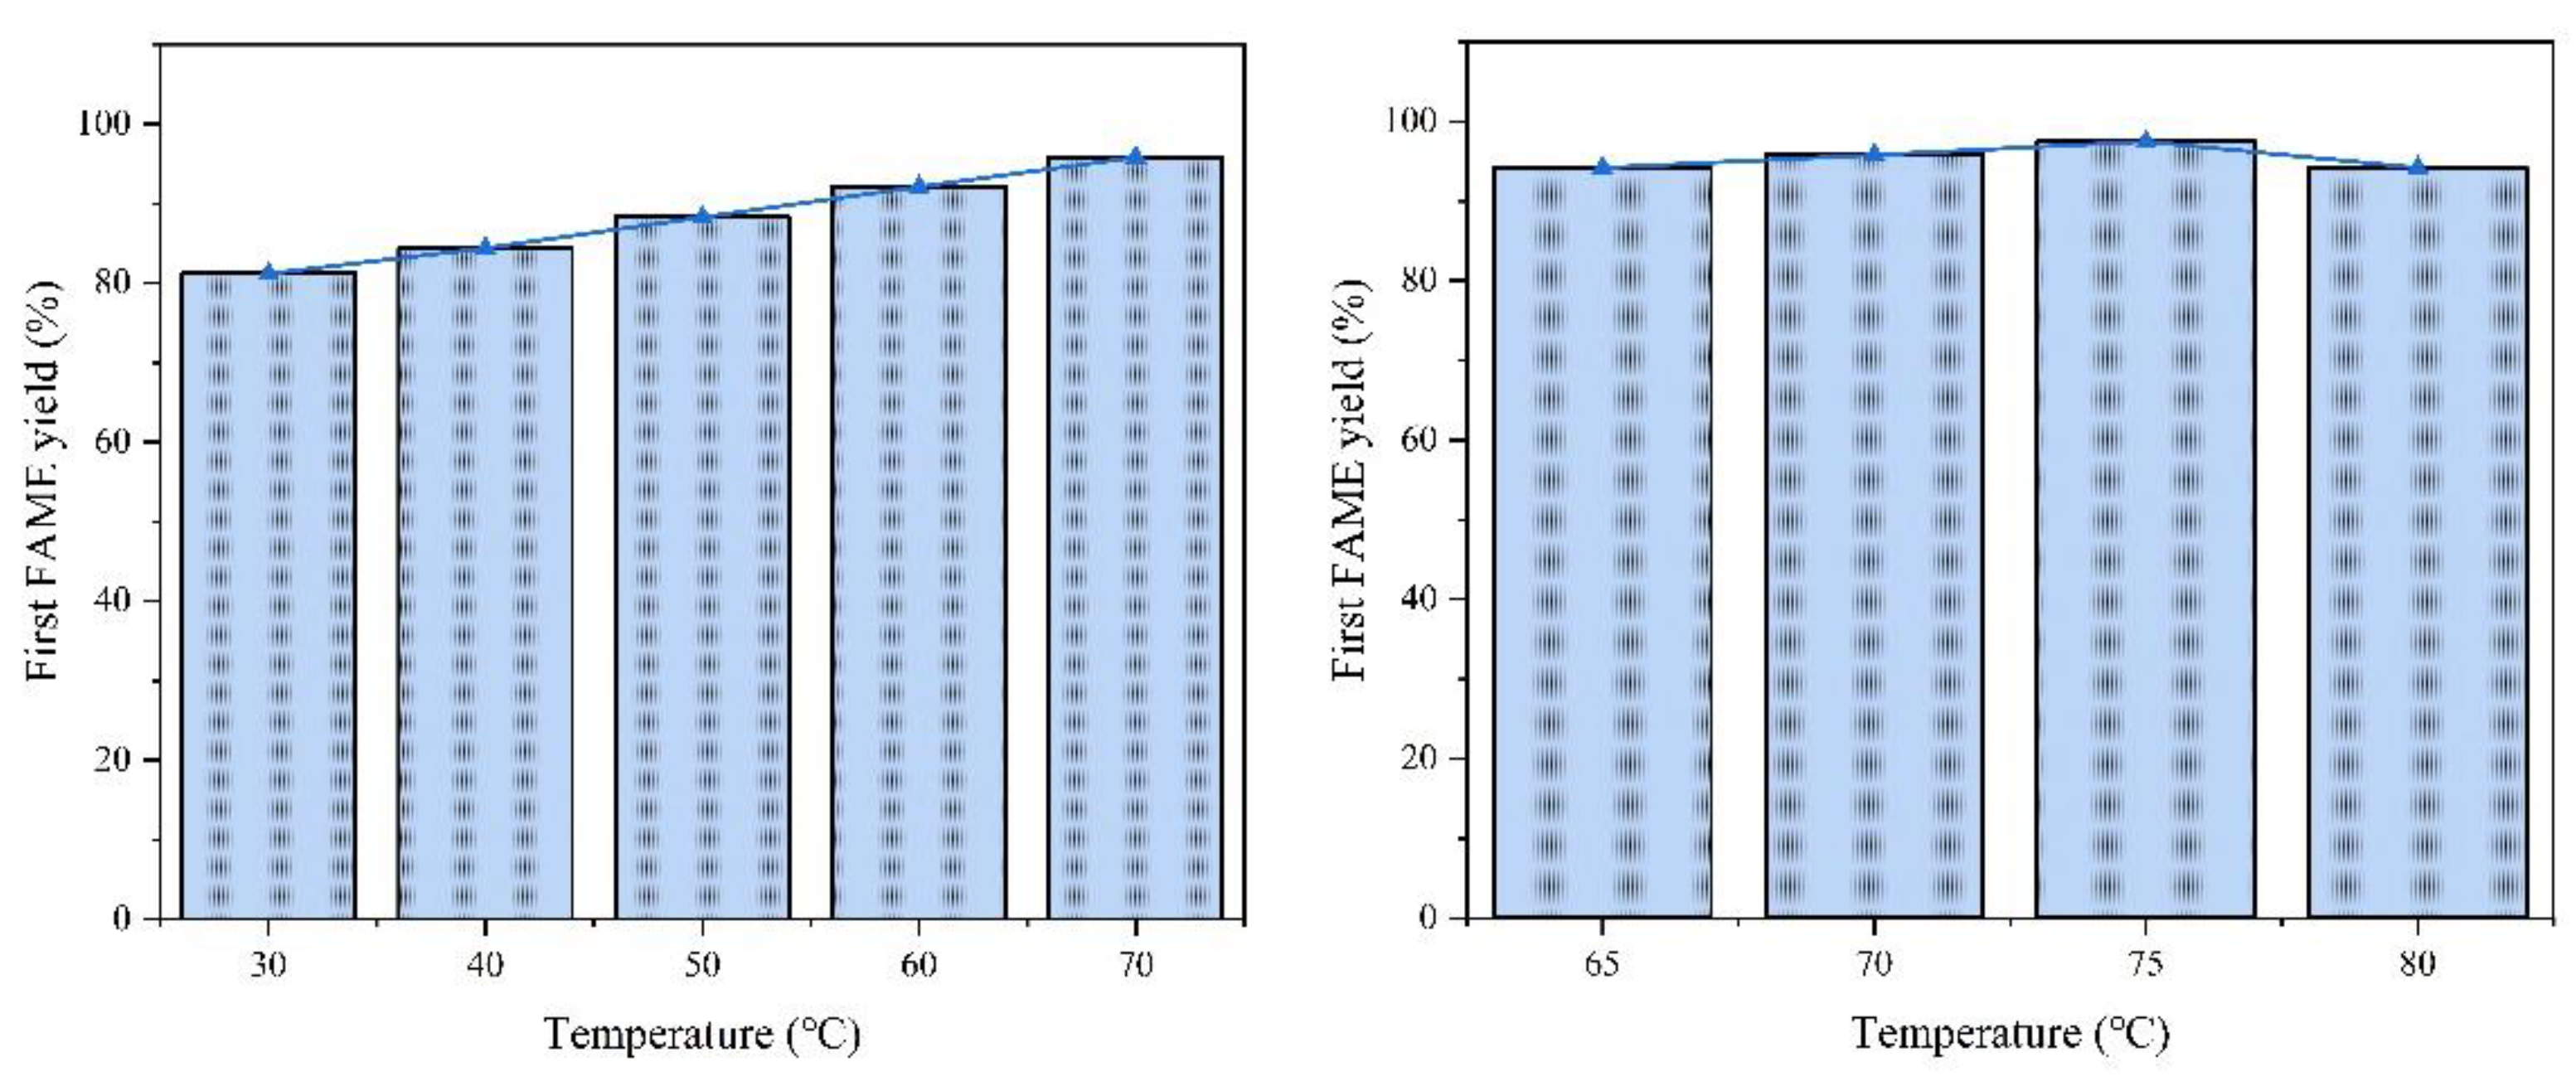
Figure 11.
Relationship between catalyst dosage and FAME yield (error bar: ±SD, n = 3).
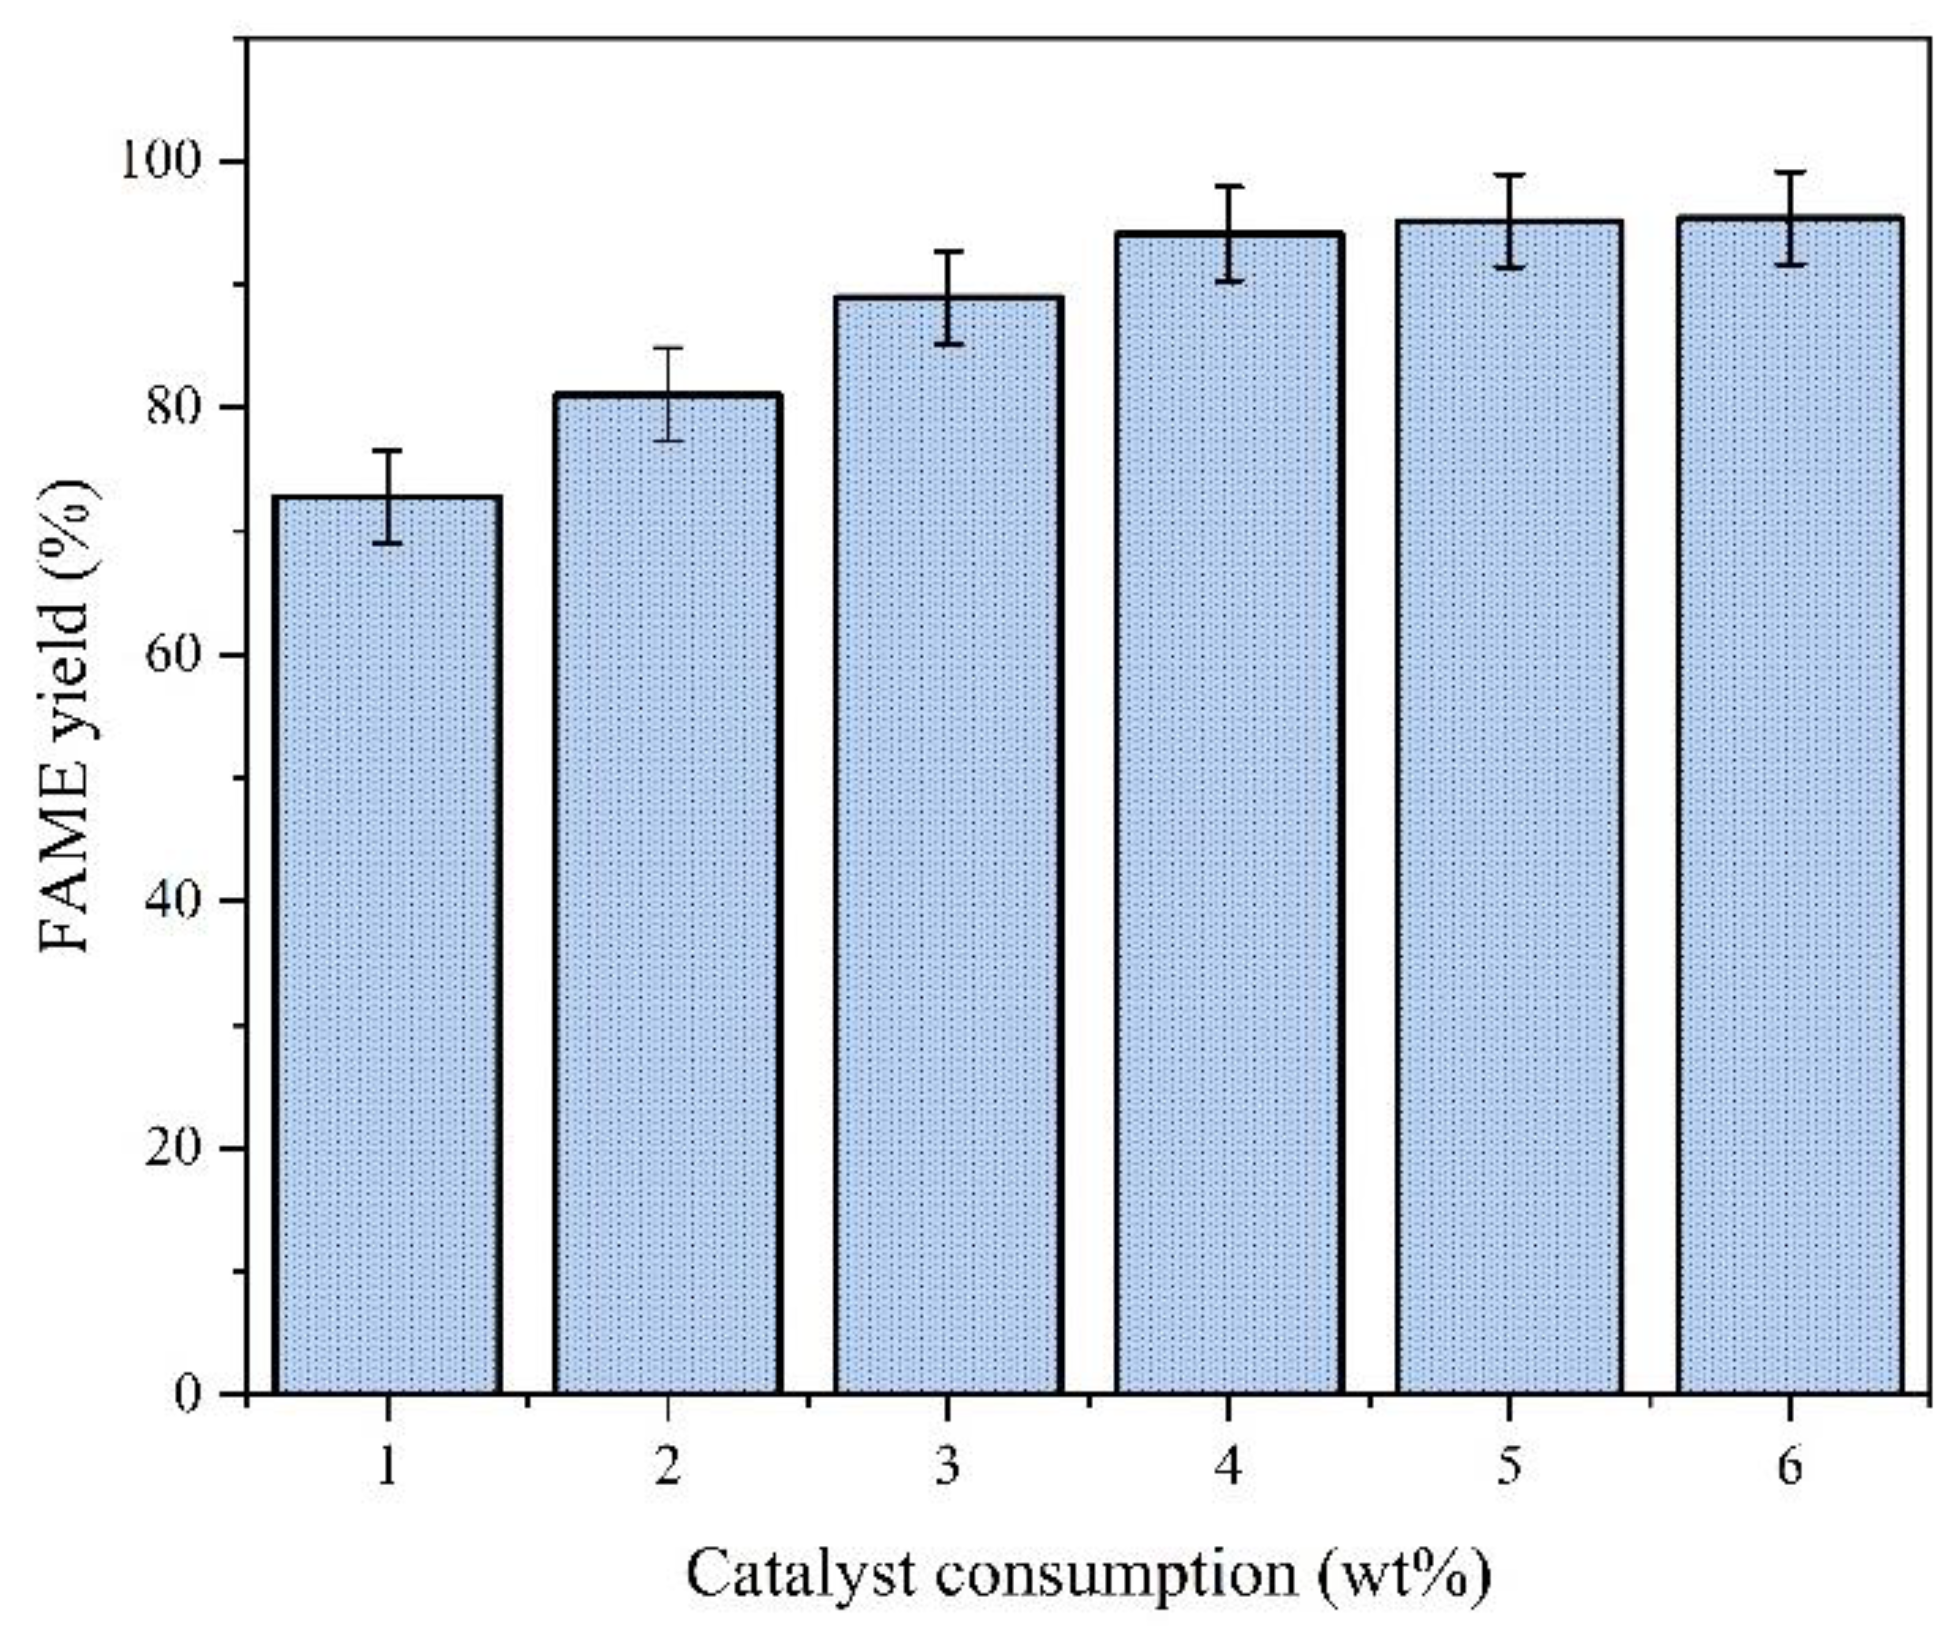
Figure 12.
Methanol-to-oil ratio effects on FAME yield (error bars: ±SD, n = 3).
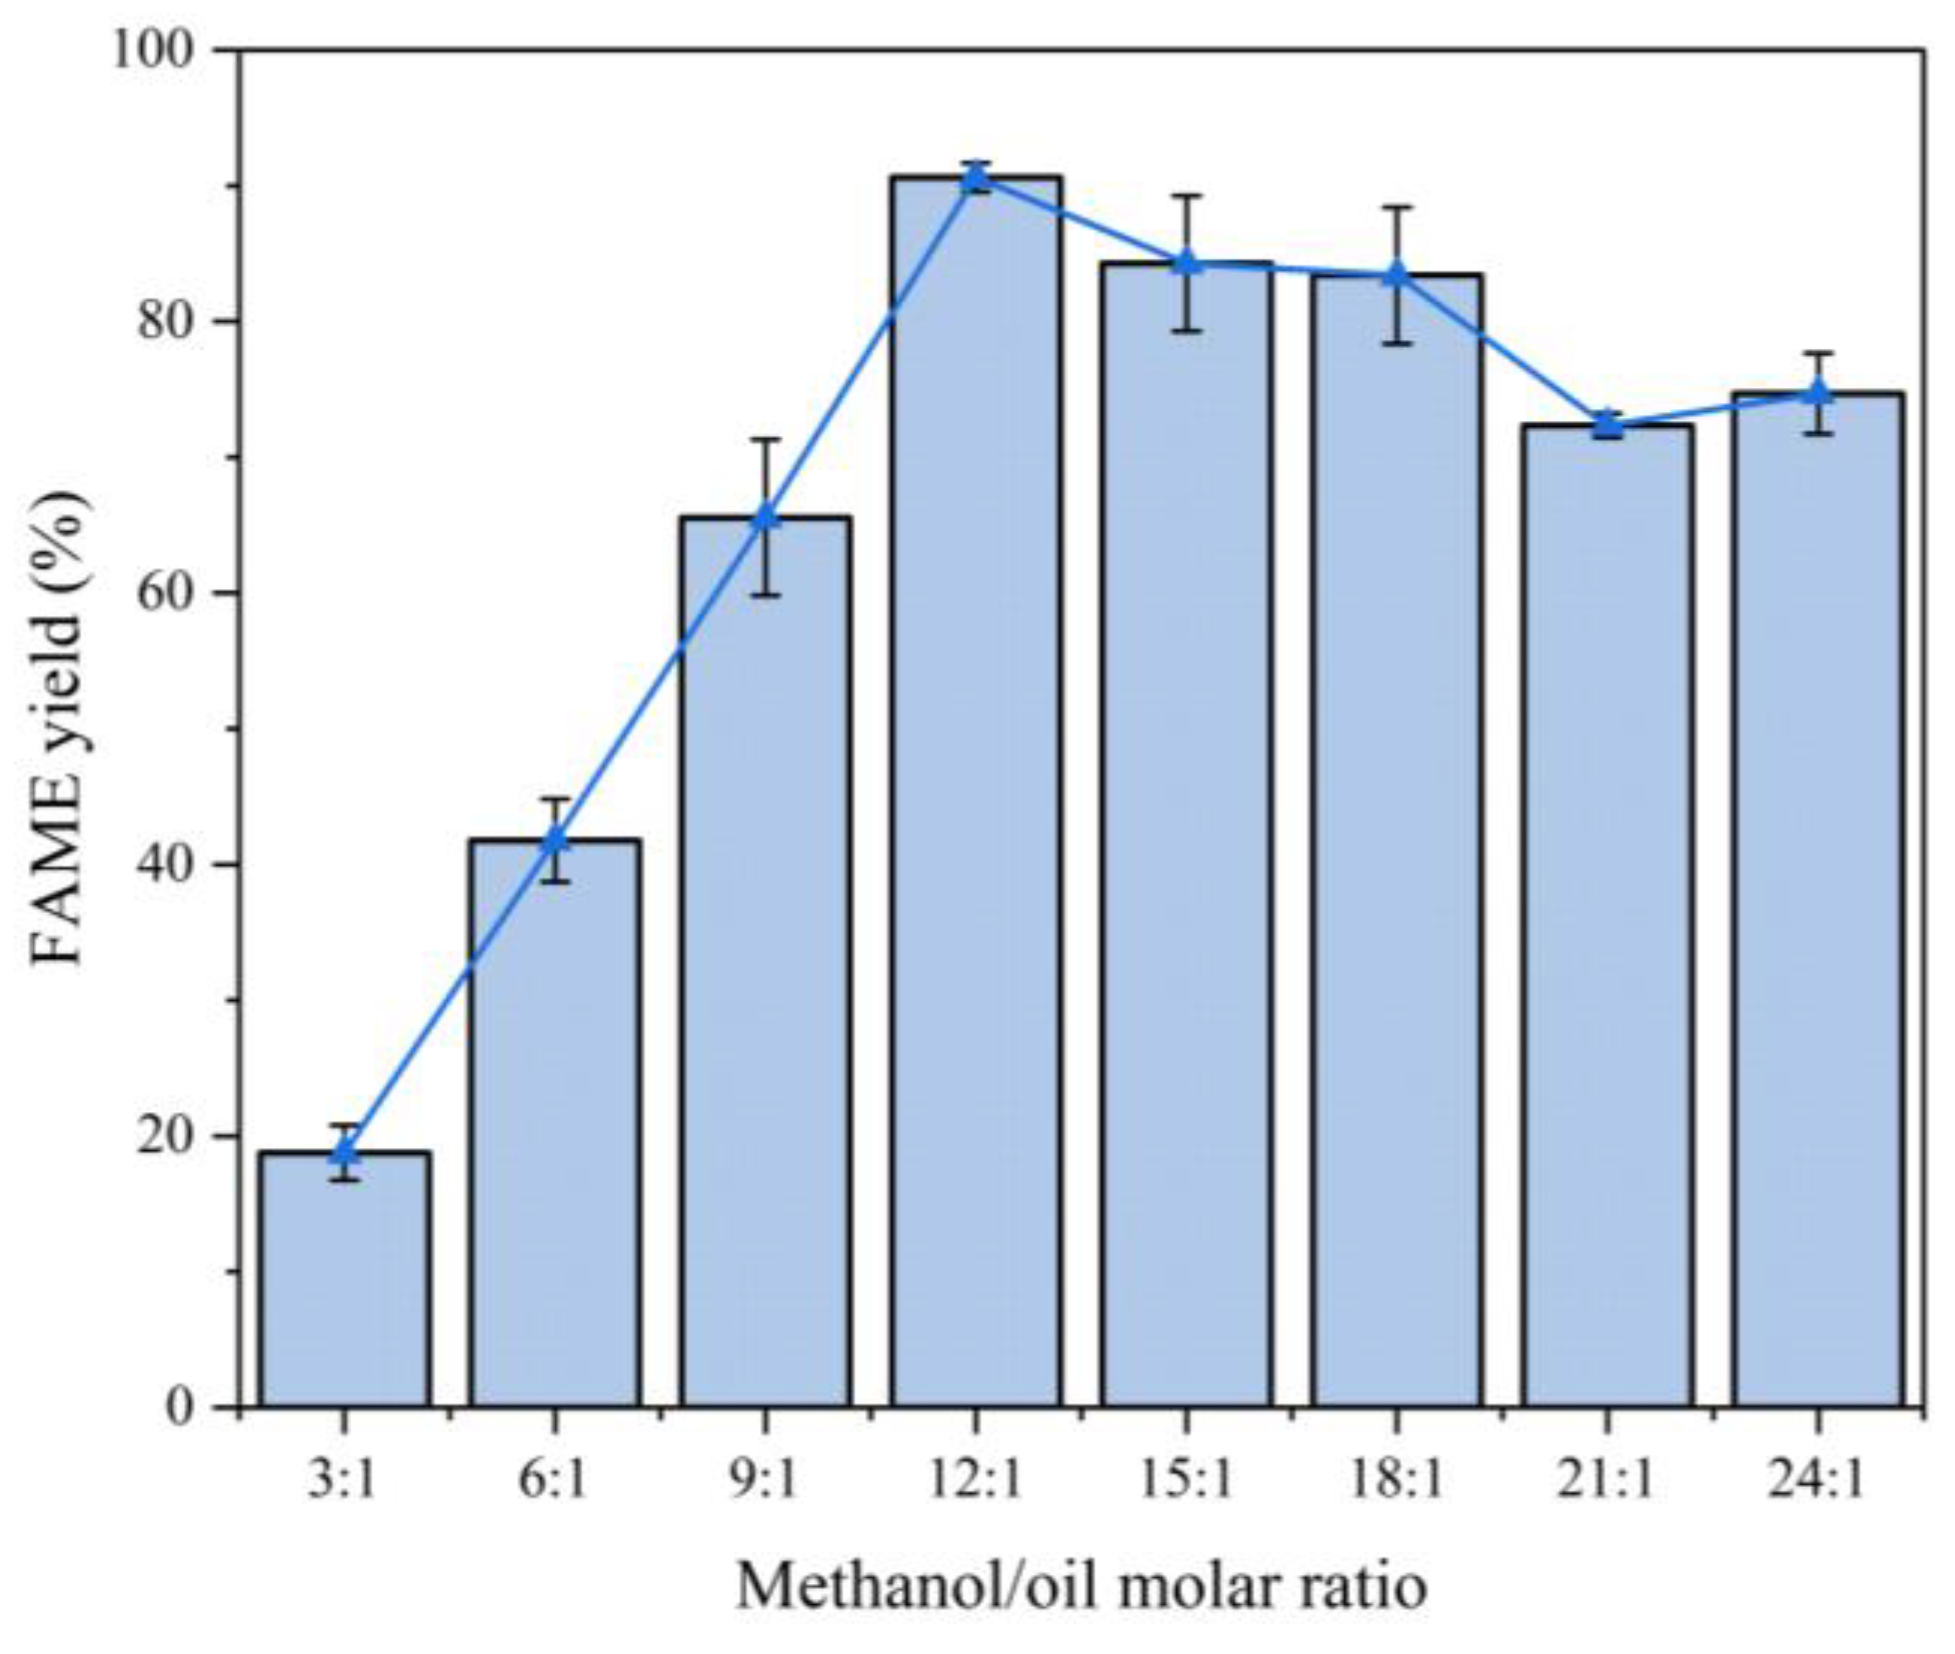
Figure 13.
Reaction time effects on FAME yield. (n = 3).
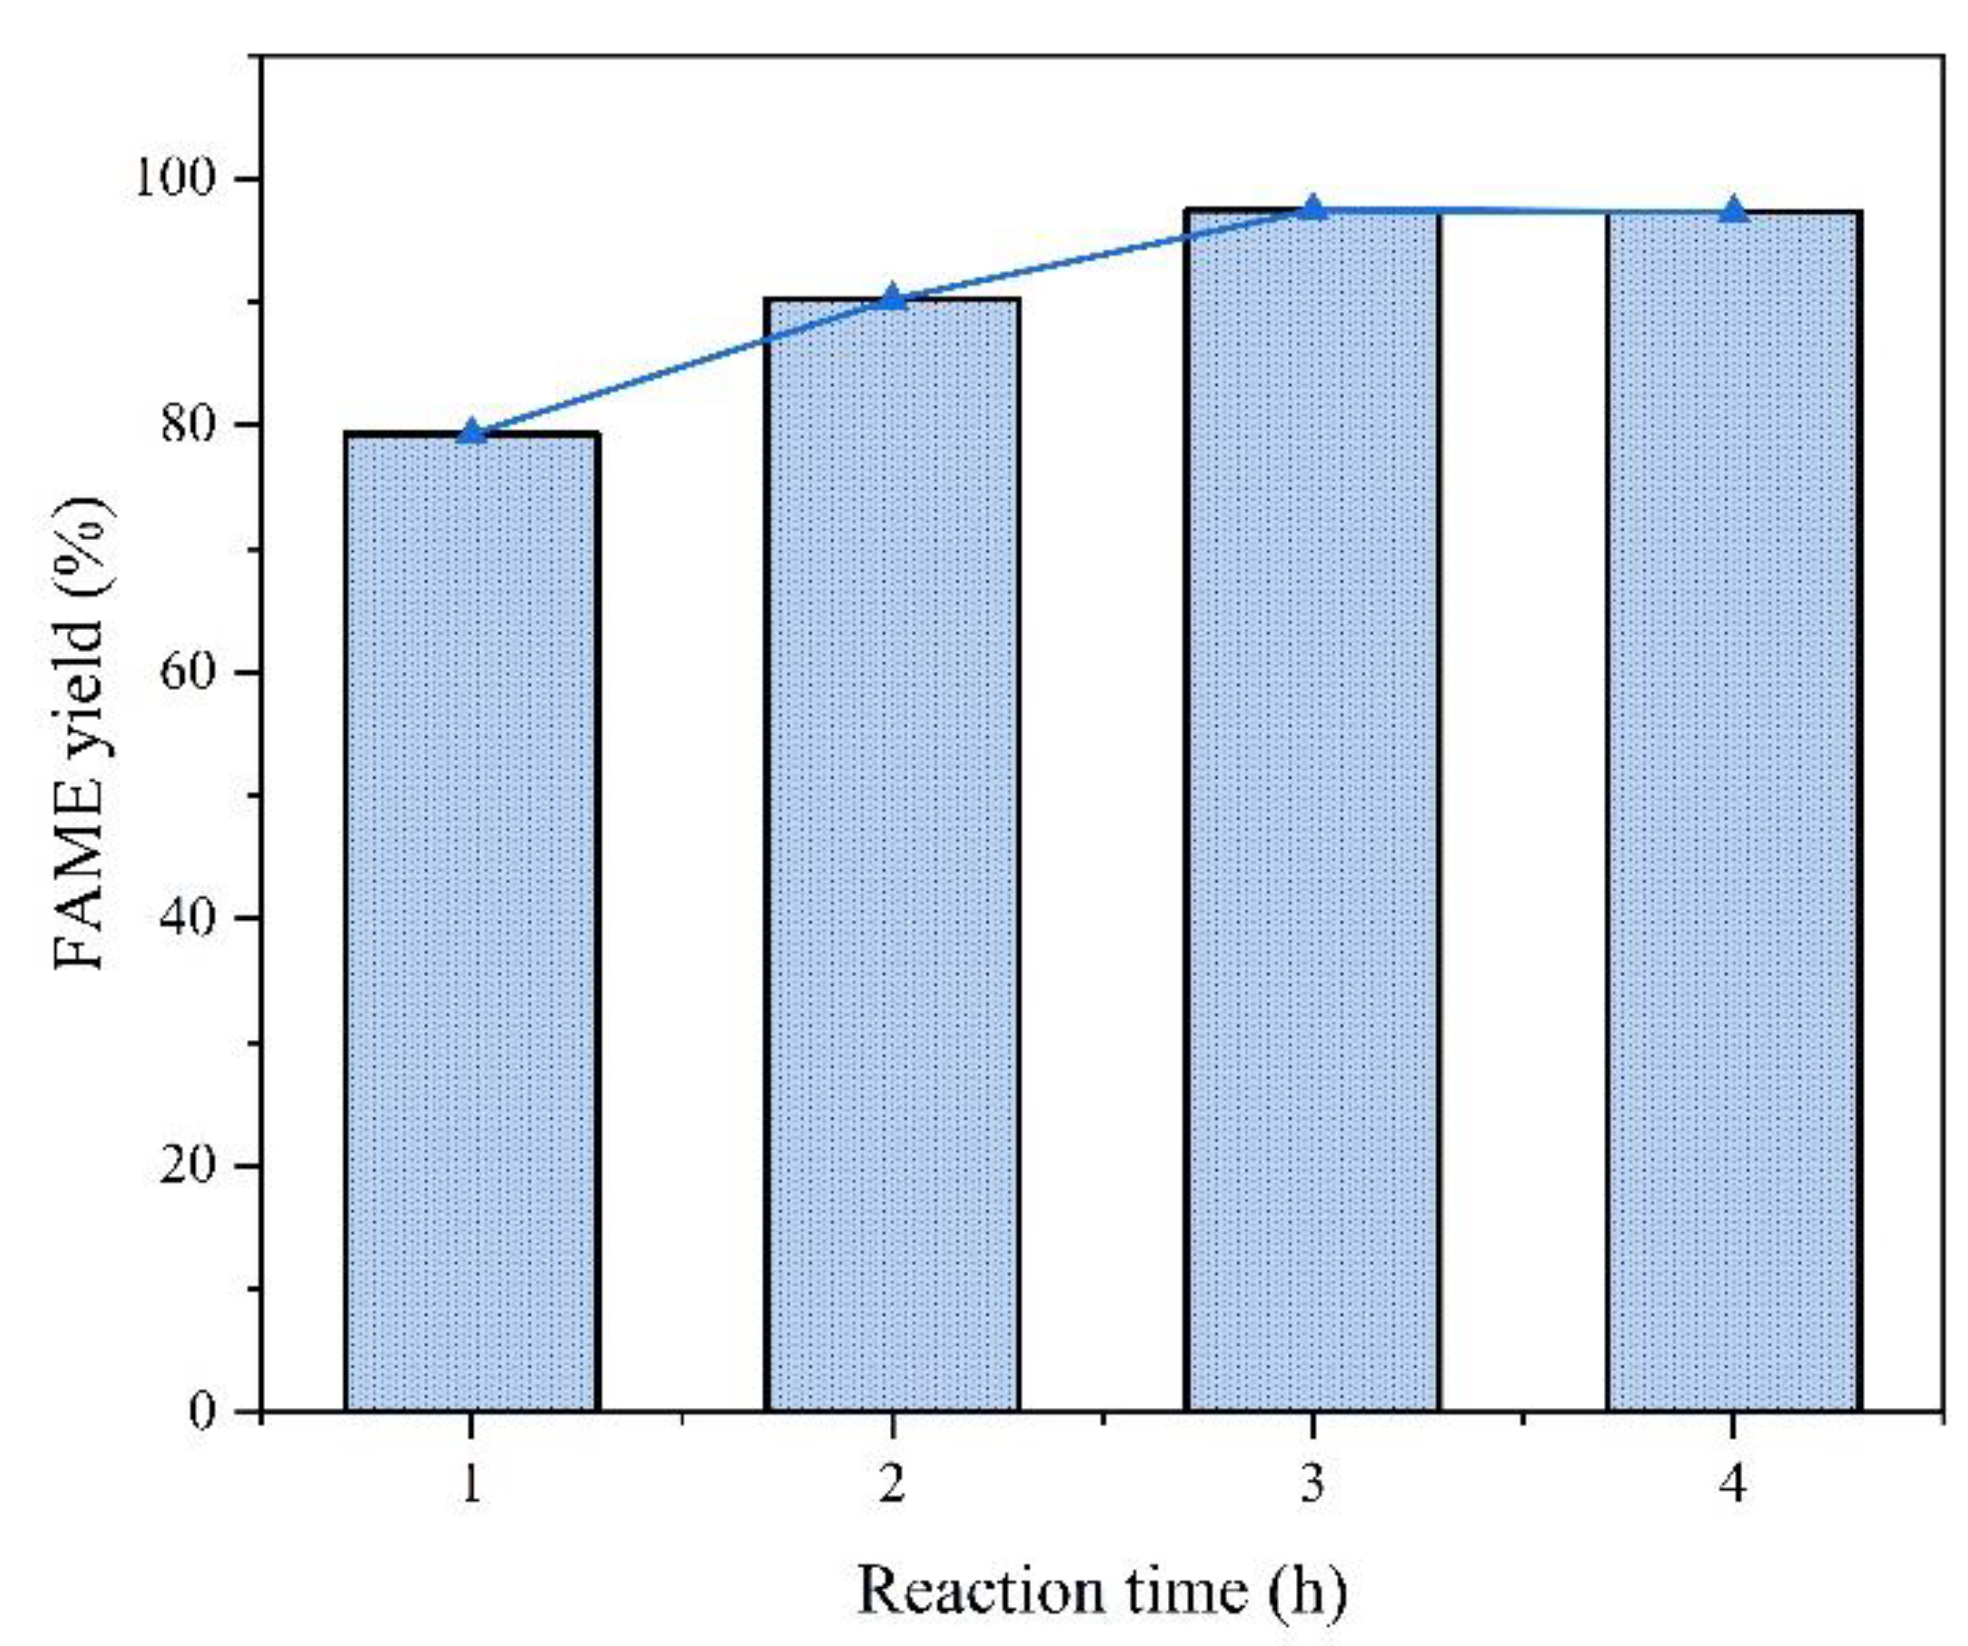
Figure 14.
Cyclic stability of MgO/Na₂CO₃ and MgO/K₂CO₃ catalysts.
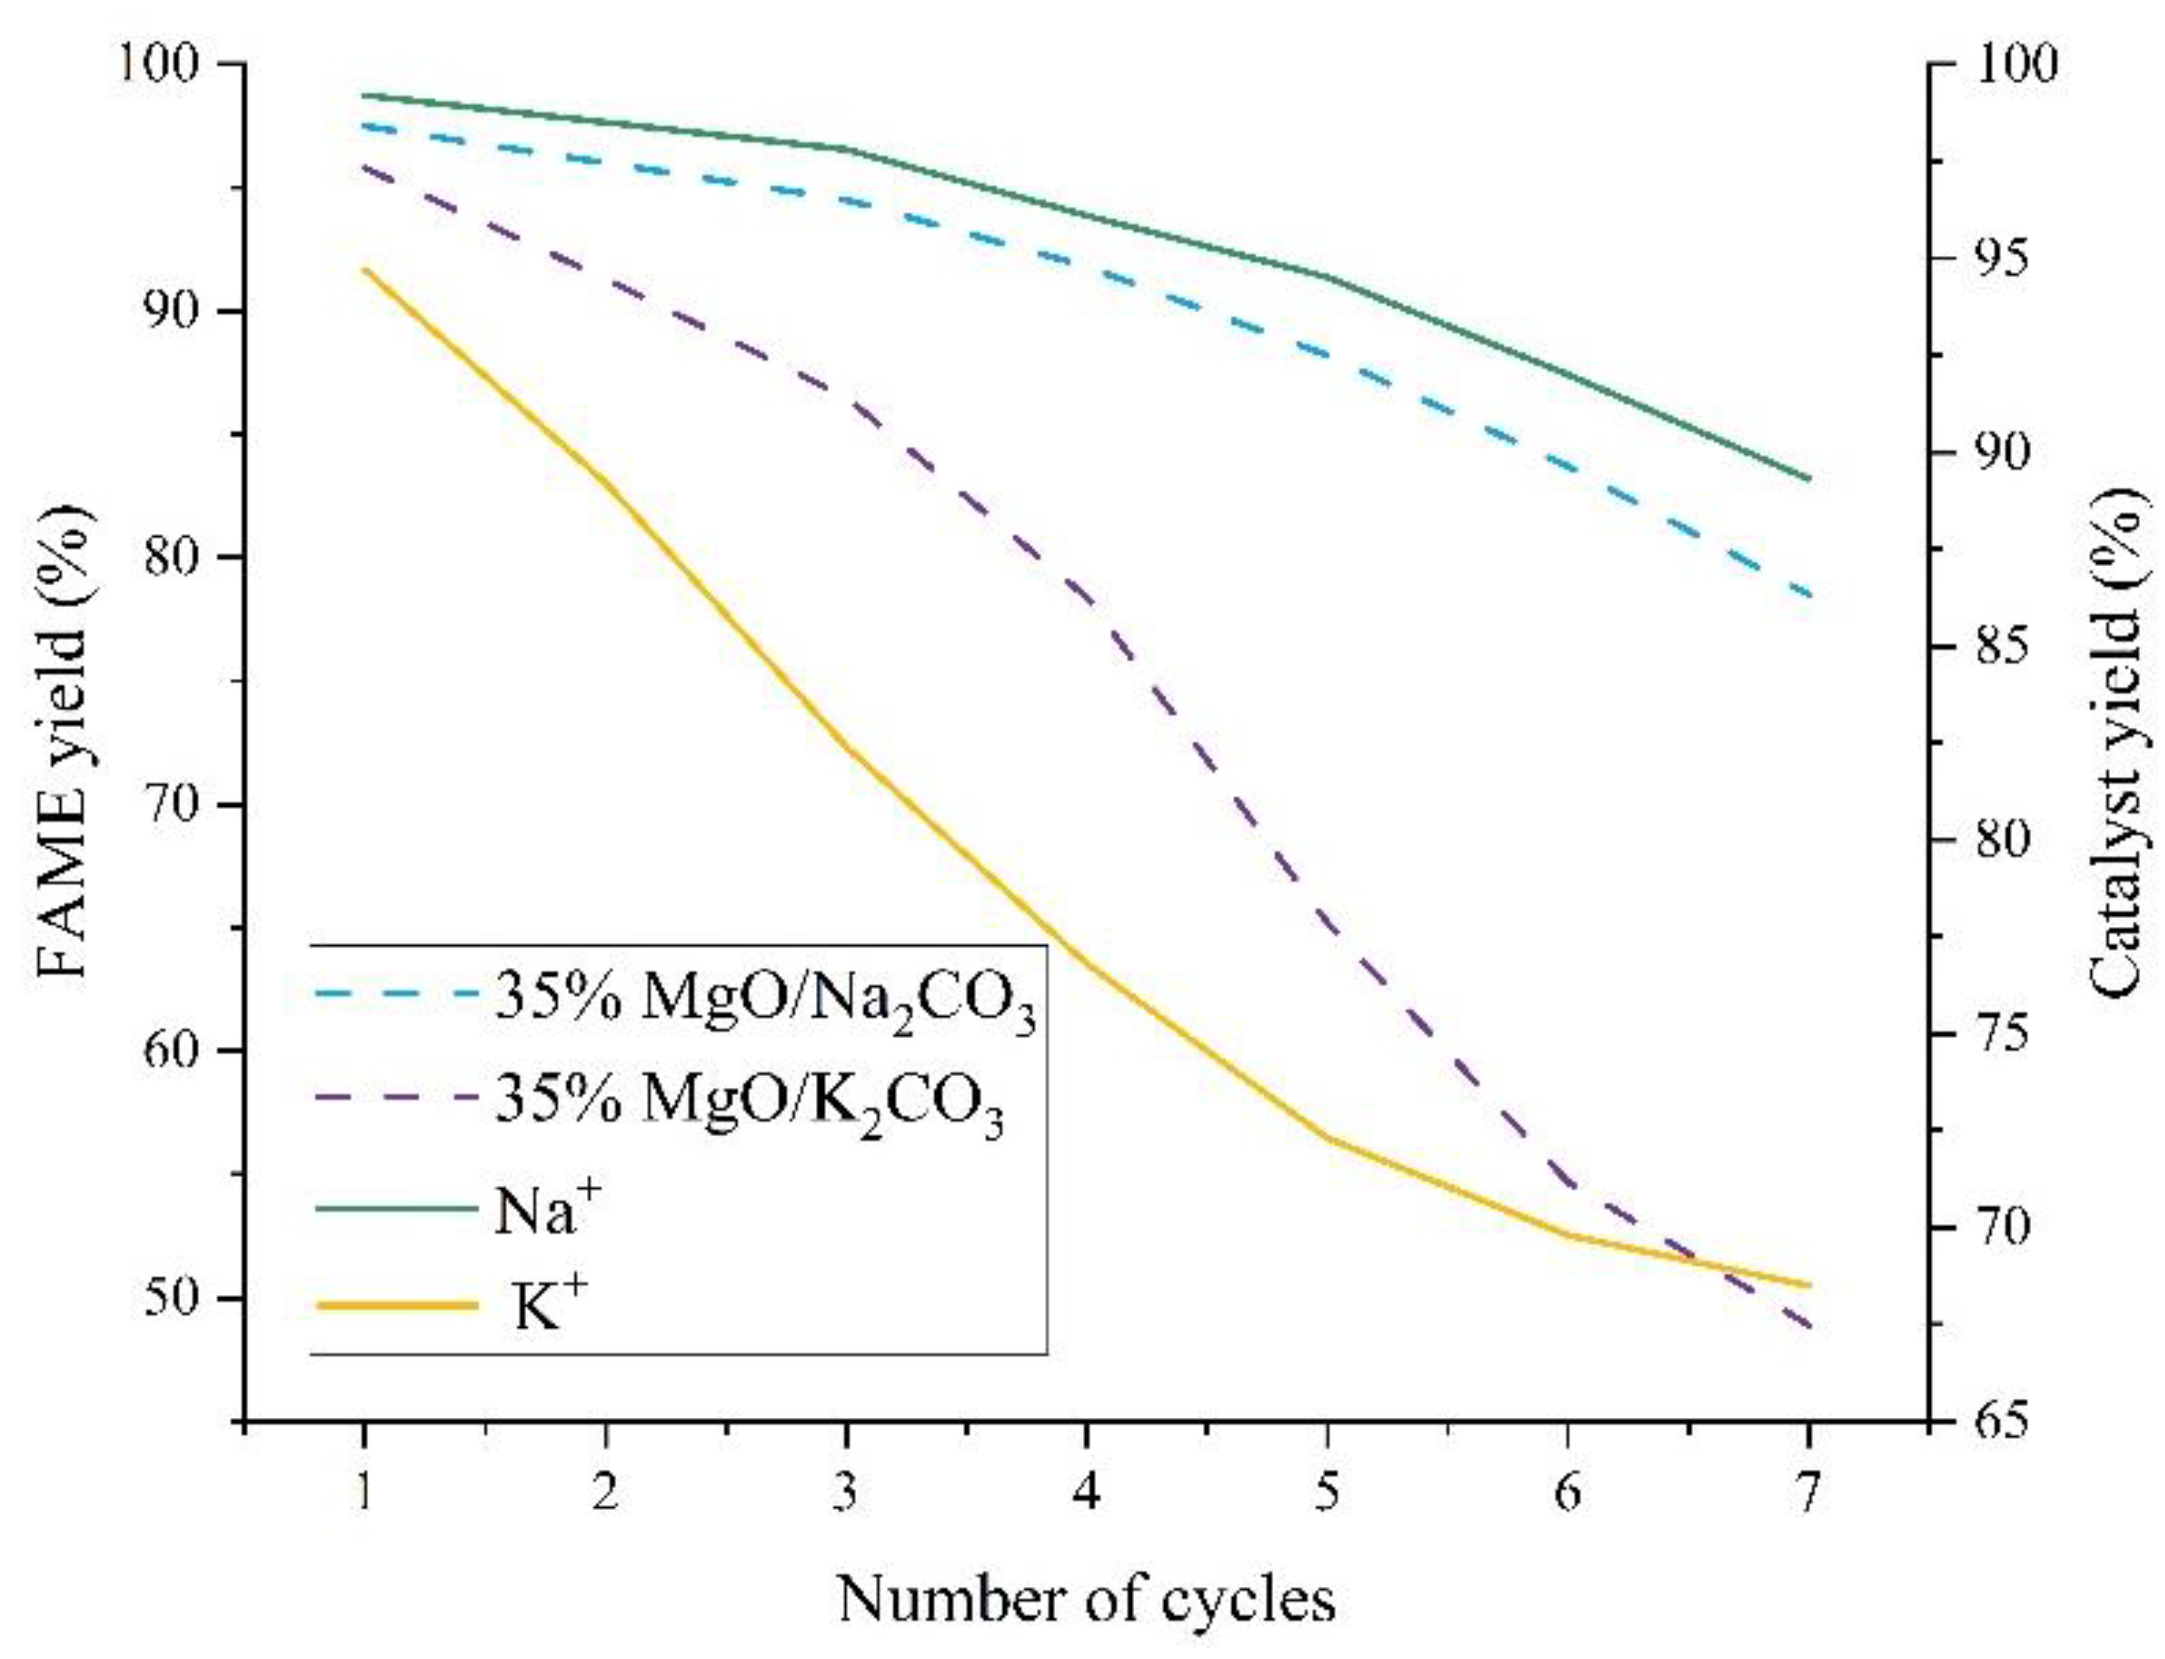
Figure 15.
Na+ leaching and carbon deposition in MgO/Na₂CO₃.
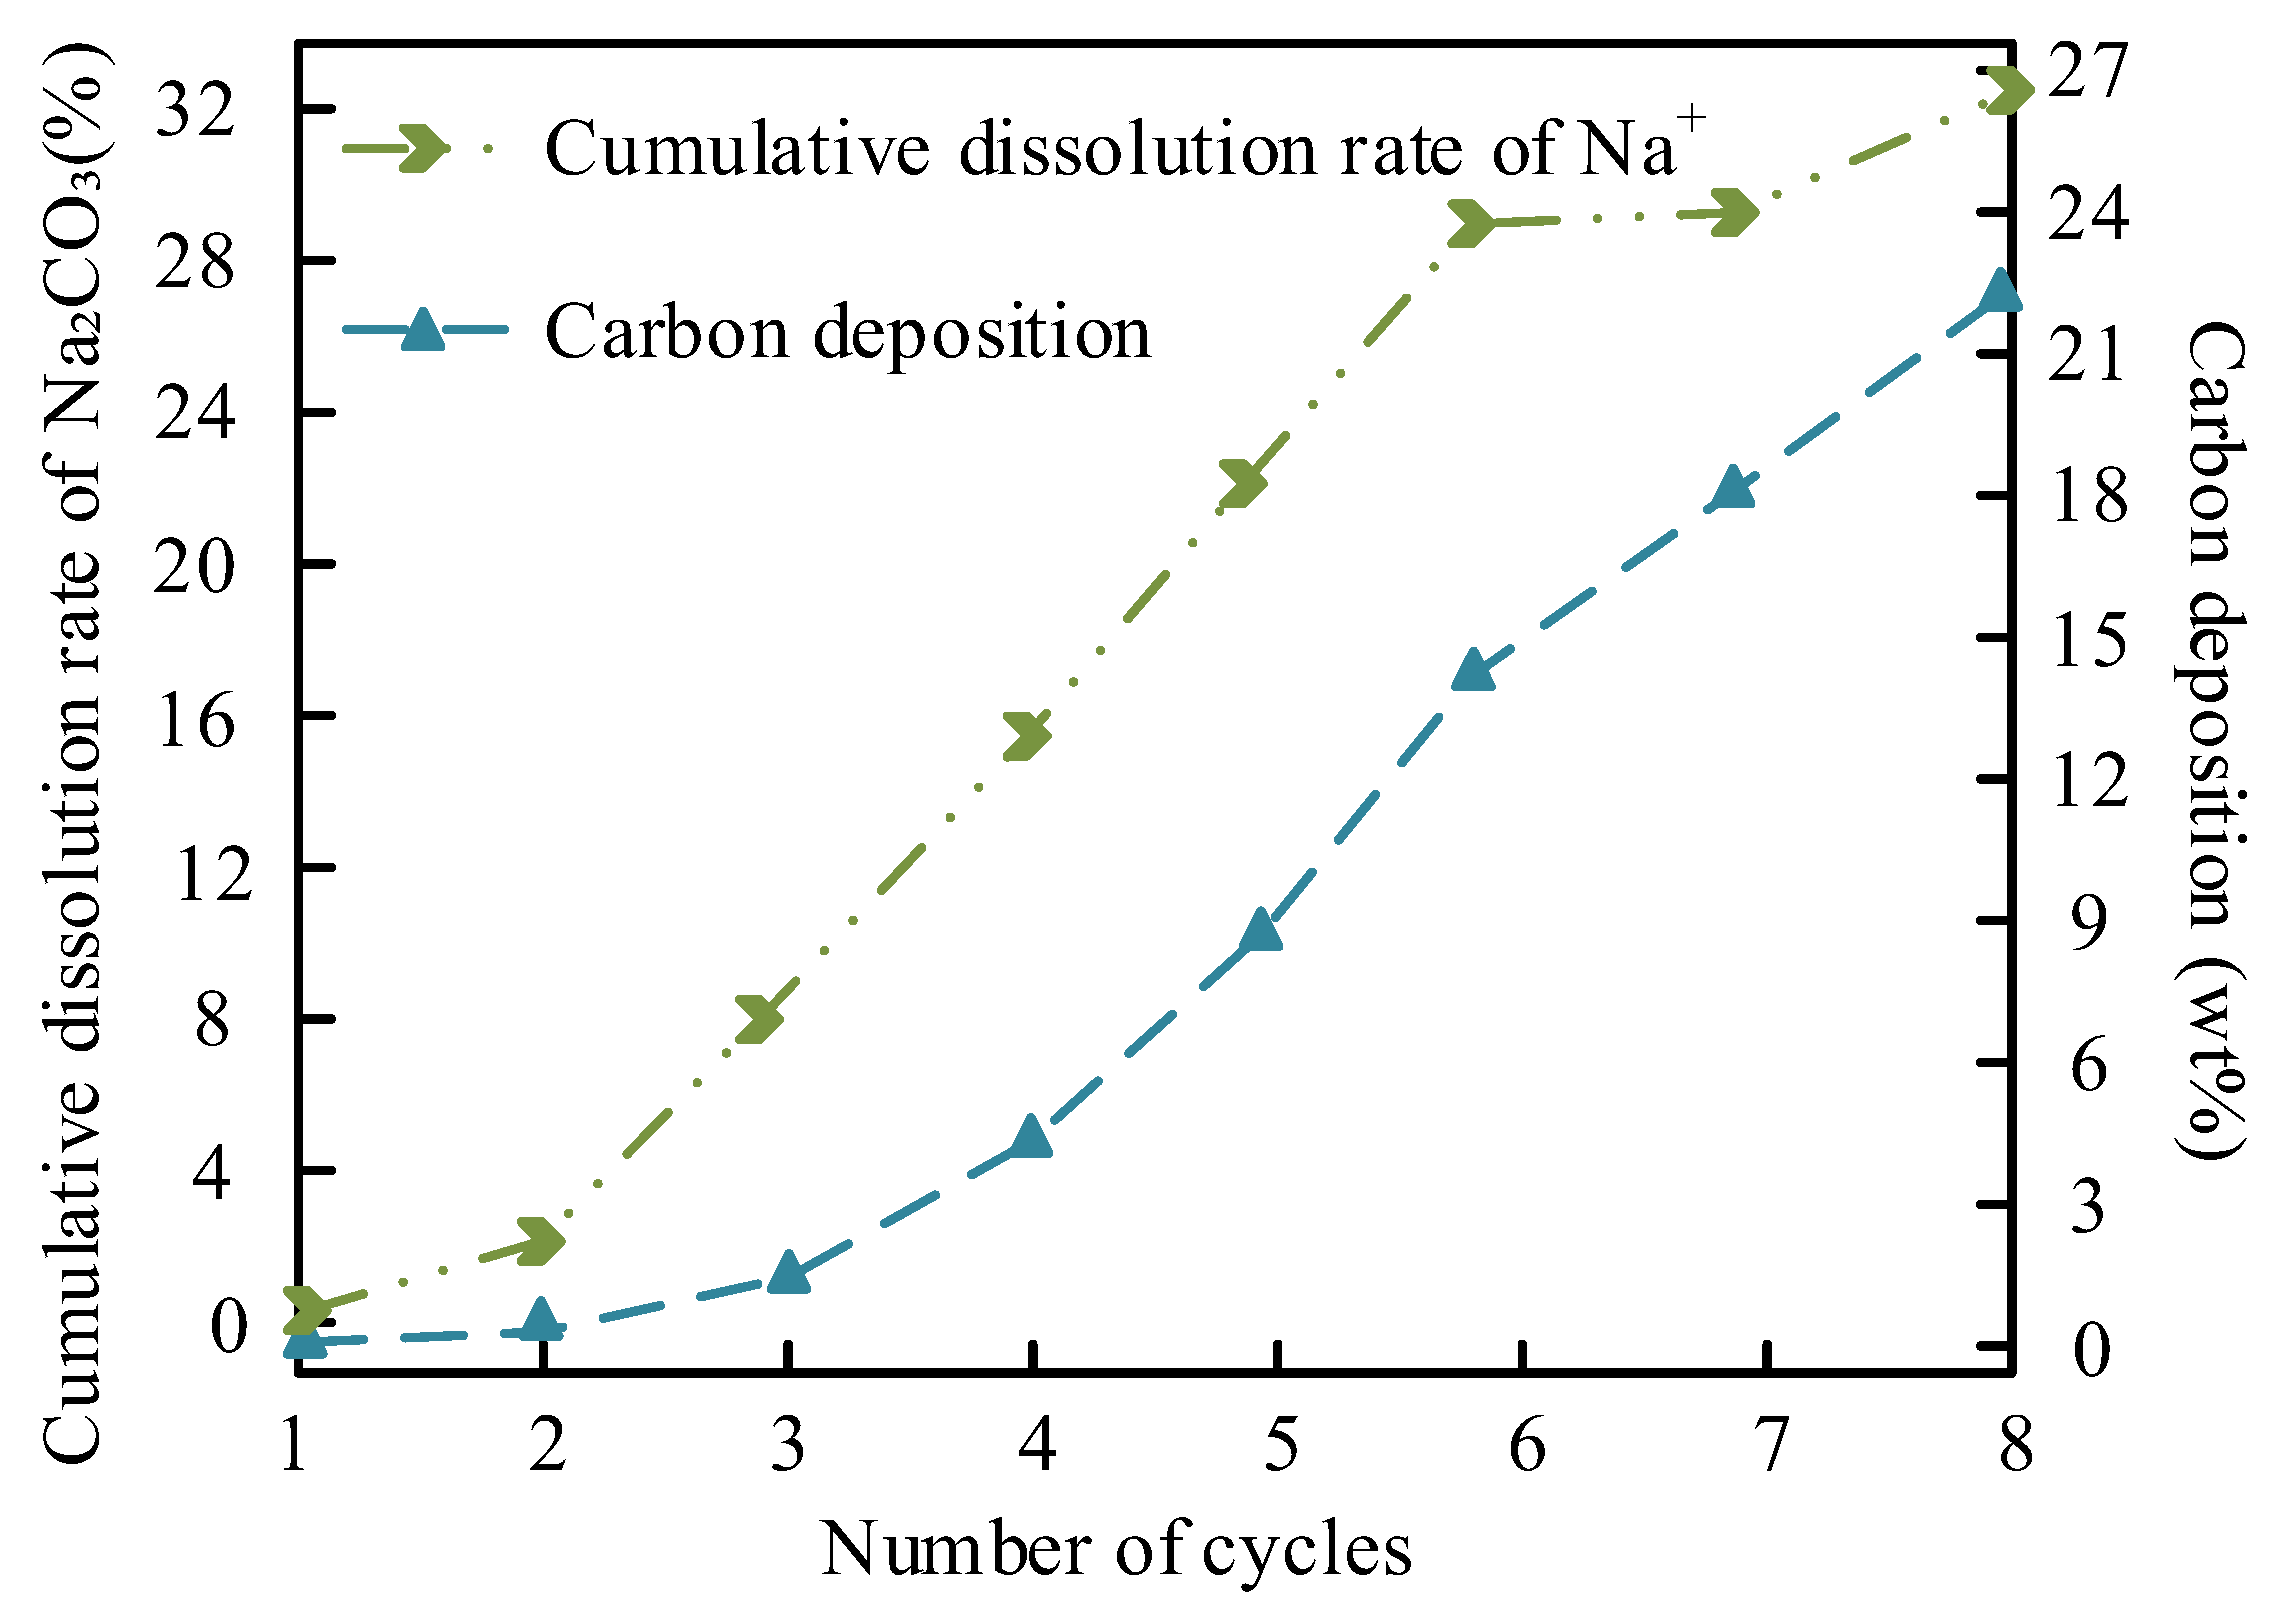
Figure 16.
K+ leaching and carbon deposition in MgO/K₂CO₃.
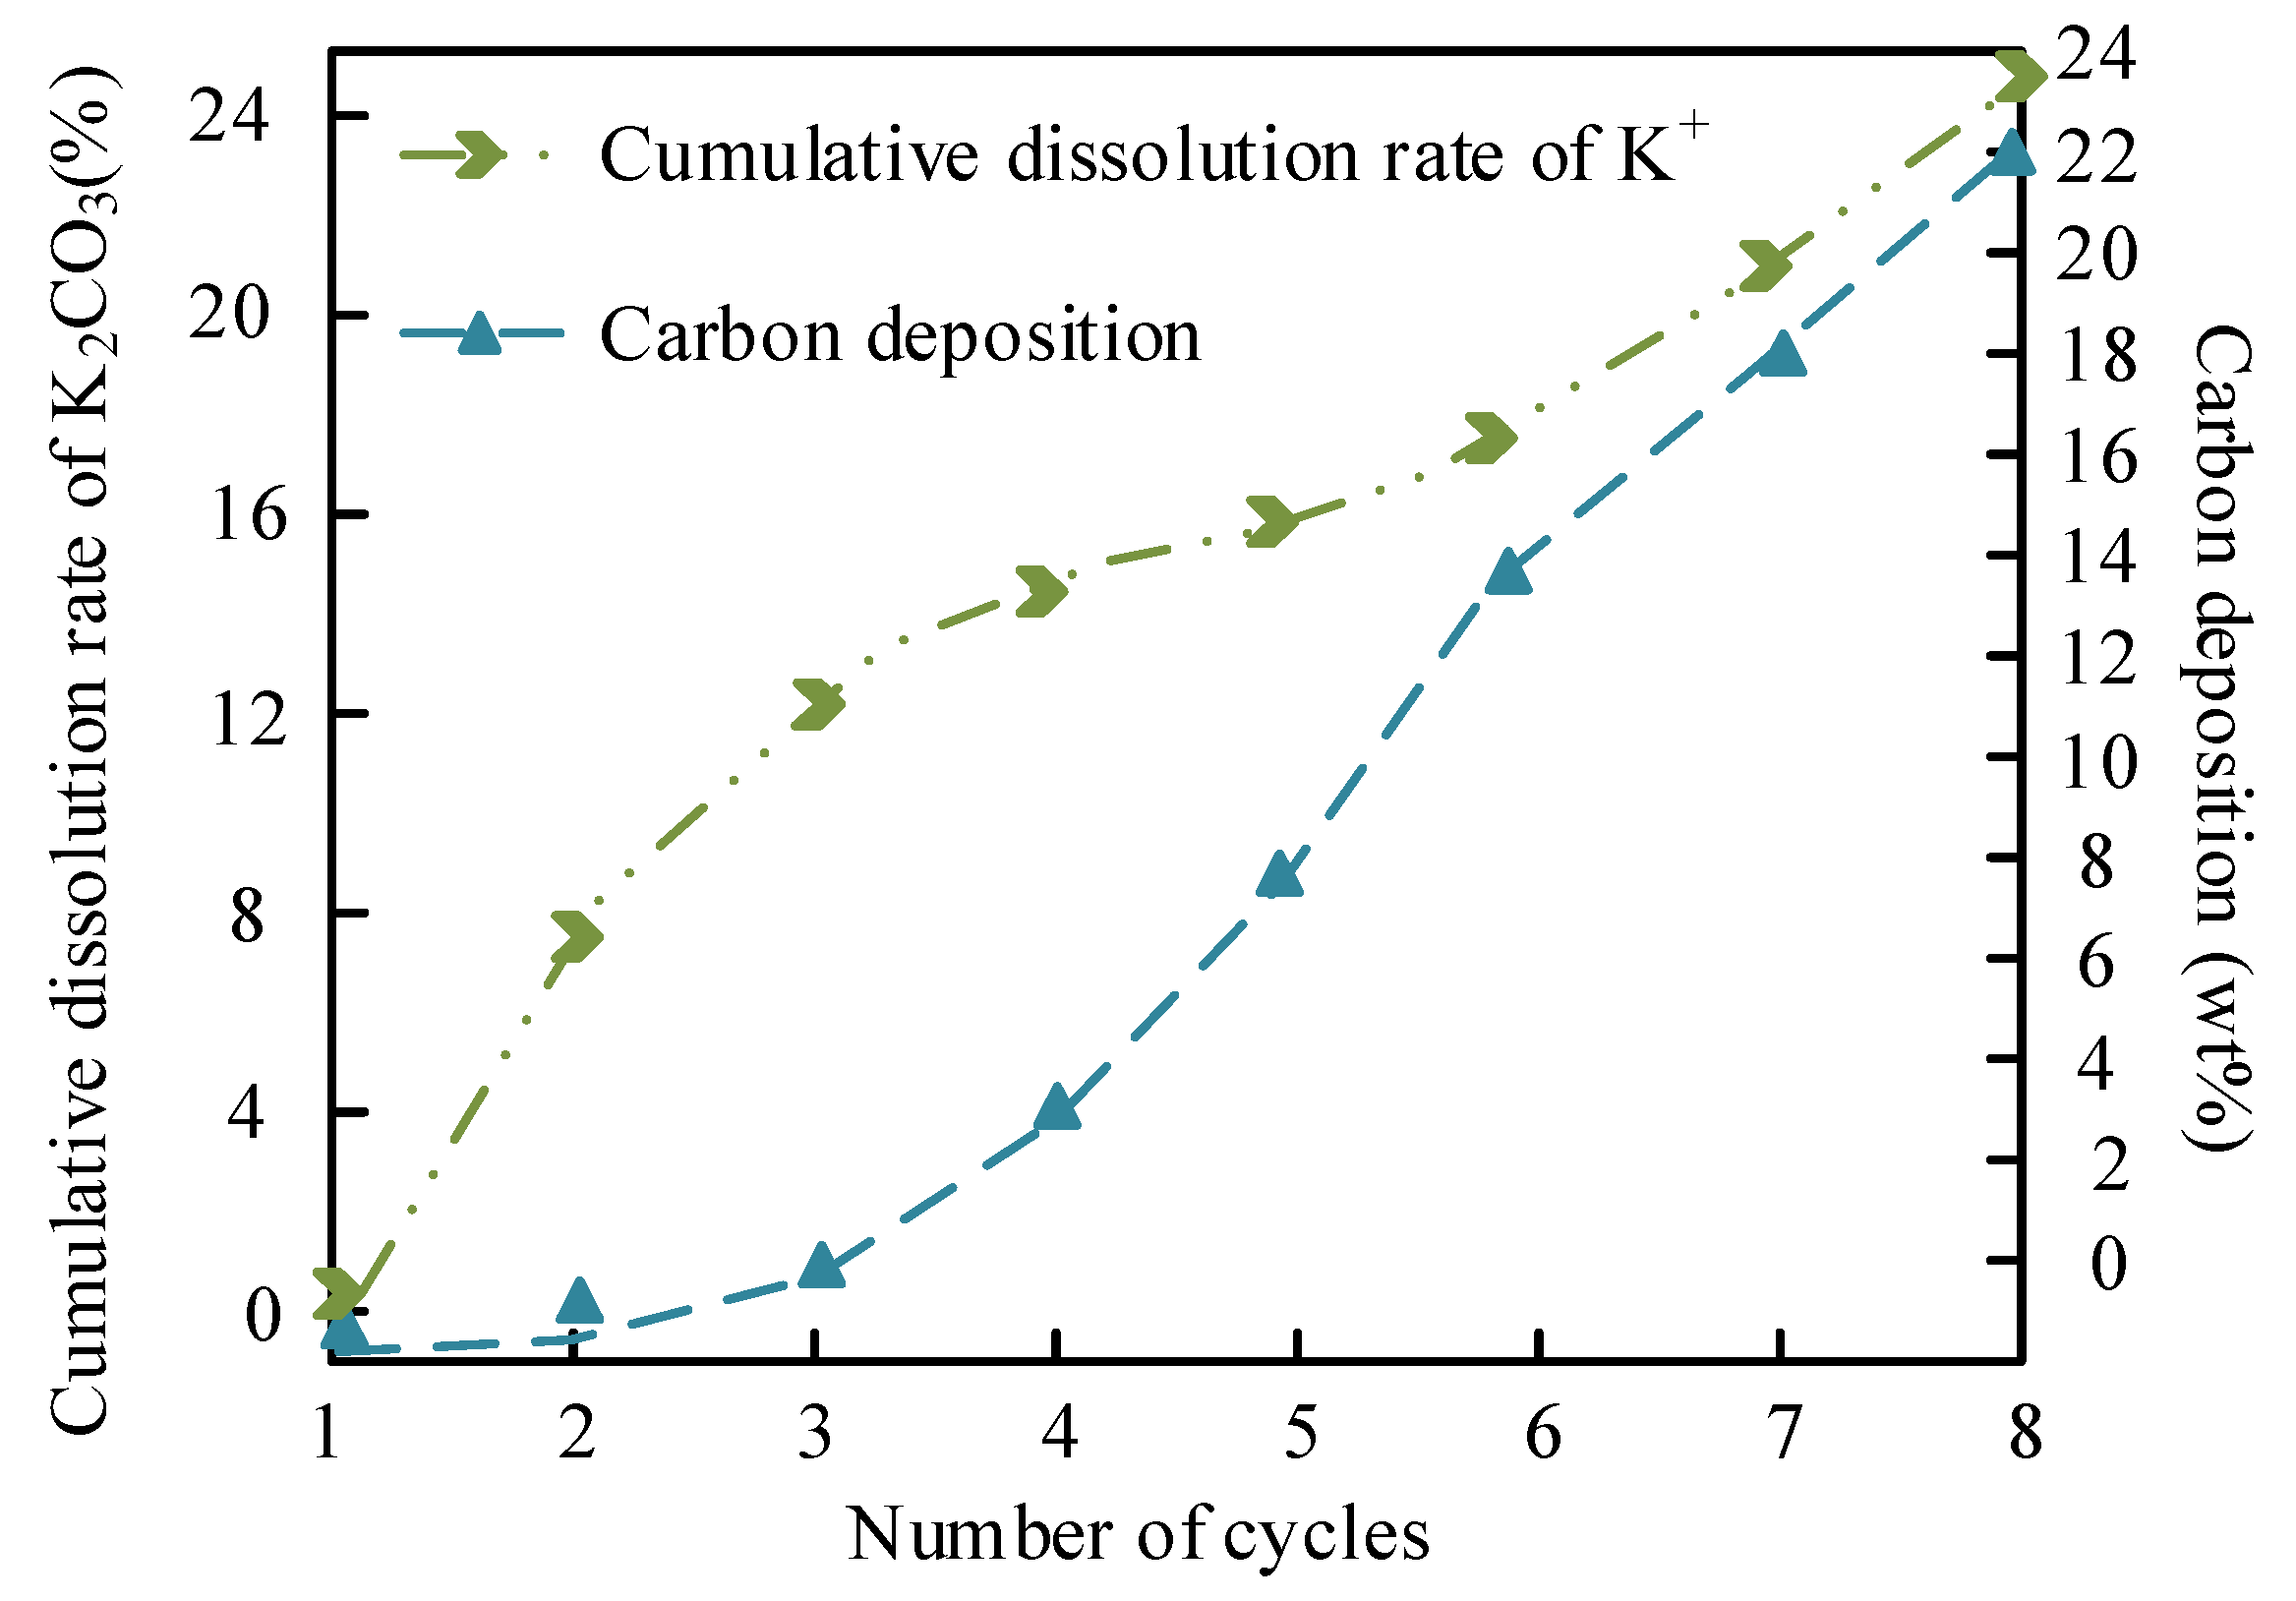
Figure 17.
Temperature-dependent solubility of Na₂CO₃ and K₂CO₃ in methanol and methanol/glycerol (3:1 v/v).
Figure 17.
Temperature-dependent solubility of Na₂CO₃ and K₂CO₃ in methanol and methanol/glycerol (3:1 v/v).
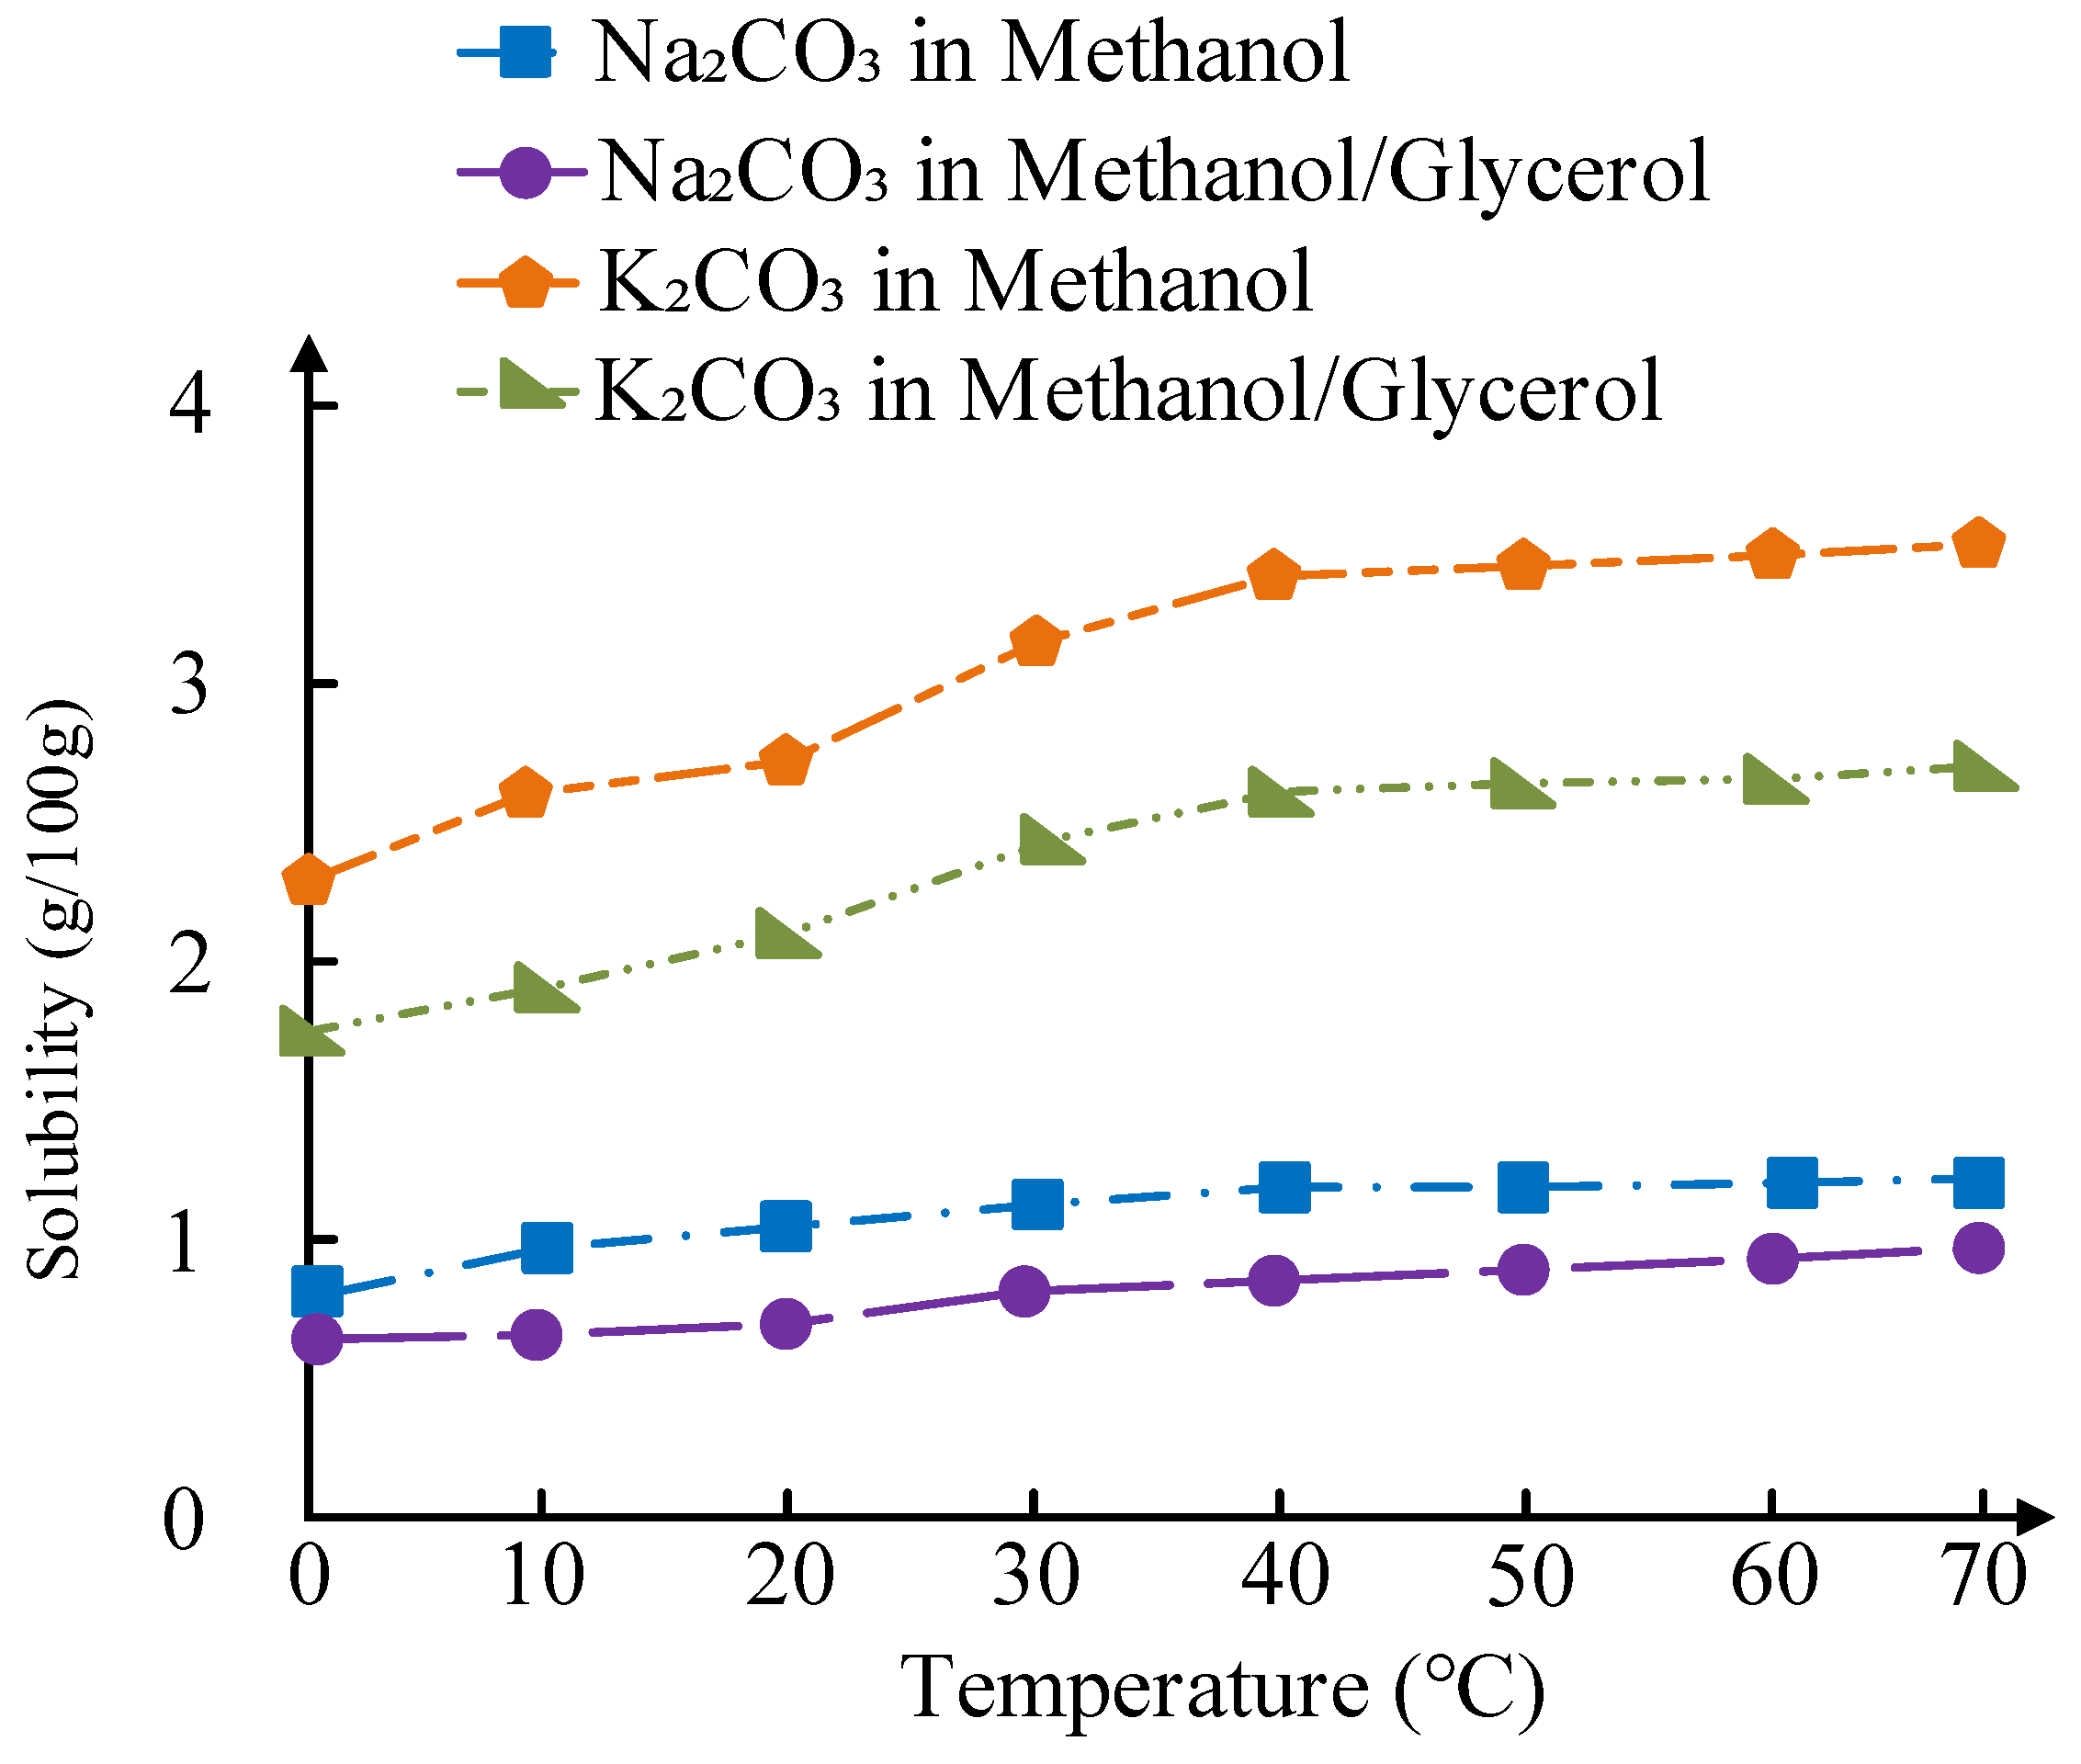
Figure 18.
Correlation between solubility and cumulative ion leaching rates (Na+ vs. K+) after 5 cycles.
Figure 18.
Correlation between solubility and cumulative ion leaching rates (Na+ vs. K+) after 5 cycles.
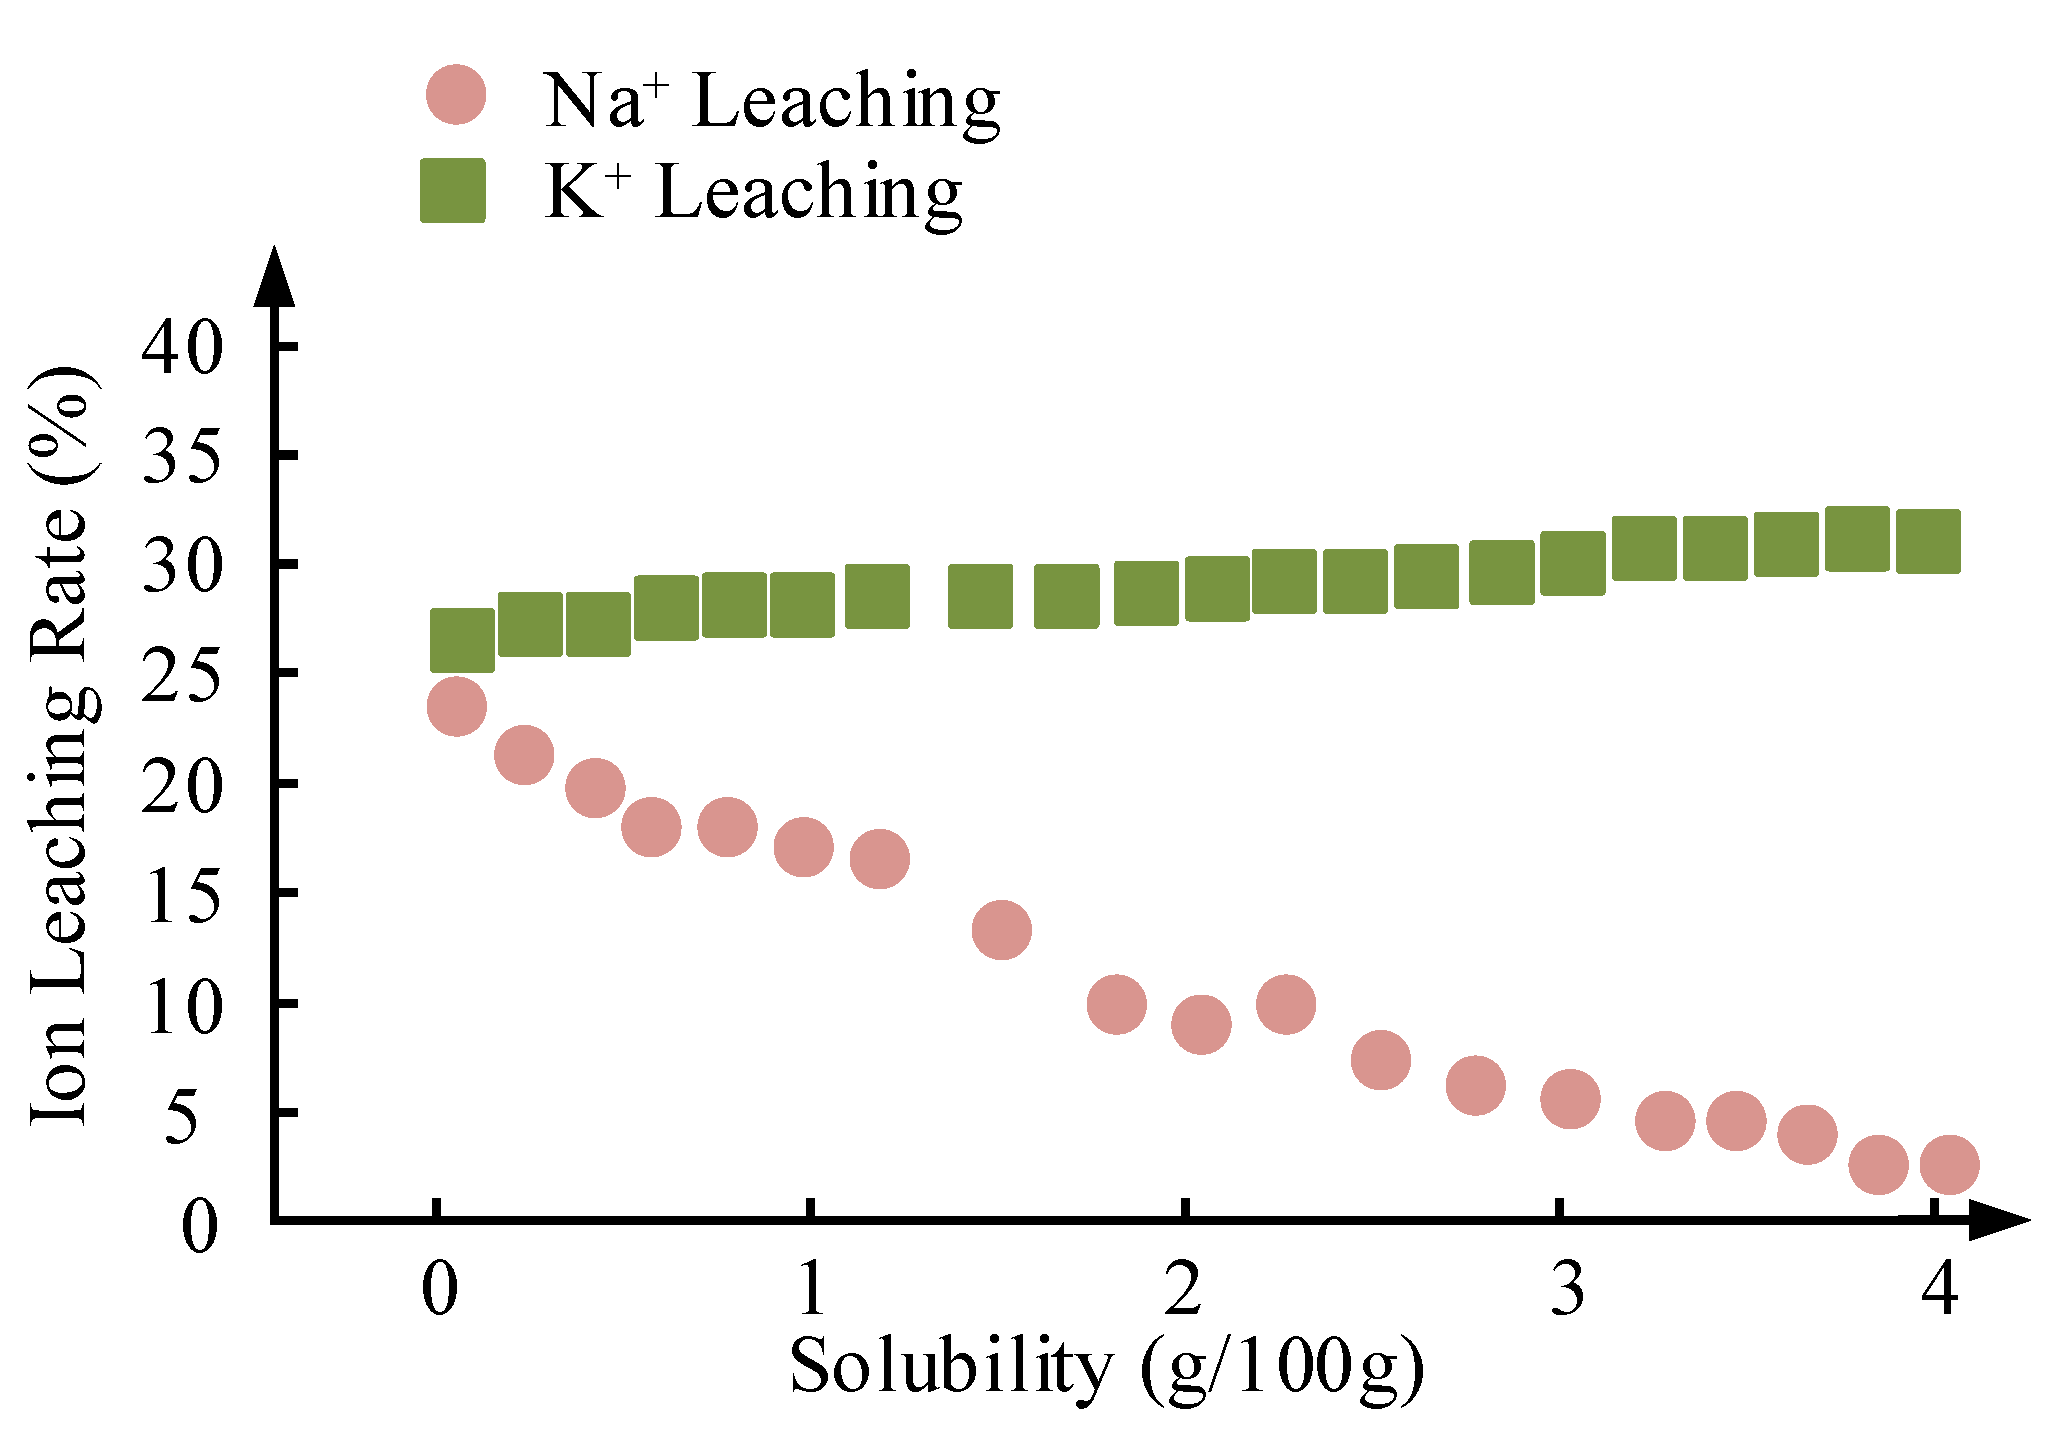
Table 2.
List of experimental reagents.
| Reagent Name | Manufacturer | CAS Number | Concentration/Purity |
|---|---|---|---|
| Light Magnesium Oxide | Sinopharm Chemical Reagent Co., Ltd. | 1309-48-4 | Analytical Grade/AR |
| Anhydrous Sodium Carbonate | Sinopharm Chemical Reagent Co., Ltd. | 497-19-8 | Analytical Grade/AR |
| Anhydrous Potassium Carbonate | Sinopharm Chemical Reagent Co., Ltd. | 584-08-7 | Analytical Grade/AR |
| Glycerol | Sinopharm Chemical Reagent Co., Ltd. | 56-81-5 | Analytical Grade/AR |
| Anhydrous Methanol | Sinopharm Chemical Reagent Co., Ltd. | 67-56-1 | Analytical Grade/AR |
| Soybean Oil | Nisshin Seifun Group, Inc. | N/A | First-Grade Edible Soybean Oil |
Table 3.
BET surface area, pore volume, and average pore diameter of catalysts.
| Catalyst | Surface Area (m²/g) | Total Pore Volume (cm³/g) | Average Pore Diameter (nm) |
|---|---|---|---|
| 35%-Na₂CO₃/MgO-600 °C | 148.6±3.2 | 0.42±0.02 | 8.7±0.3 |
| 35%-K₂CO₃/MgO-600 °C | 126.3±2.8 | 0.35±0.01 | 9.2±0.4 |
| 35%-Na₂CO₃/MgO-500 °C | 112.4±2.5 | 0.28±0.01 | 7.9±0.2 |
| 35%-Na₂CO₃/MgO-700 °C | 98.5±1.9 | 0.21±0.01 | 6.5±0.3 |
Table 4.
Recovery effects of different regeneration methods on catalyst performance.
| Regeneration Method | MgO/Na₂CO₃ Yield Recovery (%) | MgO/K₂CO₃ Yield Recovery (%) | Surface Area Recovery (%) | Carbon Removal Rate (%) | Active Site Density Recovery (%) | Energy Consumption (MJ/kg) | Operational Complexity (1–5) |
|---|---|---|---|---|---|---|---|
| Calcination (600 °C, 2 h) | 82.3±1.5 | 91.2±1.2 | 88.5±2.0 | 95.7±1.8 | 78.4±2.5 | 12.4±0.8 | 2 |
| Acid Washing (HCl, 0.1 M) | 65.7±2.0 | 73.8±1.8 | 72.3±2.5 | 85.2±2.3 | 61.2±3.0 | 8.2±0.5 | 4 |
| Ultrasonic Cleaning (40 kHz) | 58.9±2.5 | 67.5±2.1 | 65.8±3.0 | 76.4±2.8 | 53.4±3.5 | 5.6±0.3 | 3 |
| Supercritical CO₂ Treatment | 75.6±1.8 | 84.3±1.5 | 80.1±2.3 | 90.1±1.9 | 70.8±2.8 | 18.9±1.2 | 5 |
| Plasma Treatment (Ar) | 88.9±1.2 | 93.5±1.0 | 92.7±1.5 | 97.3±0.9 | 85.3±2.0 | 24.7±1.5 | 5 |
| Chemical Reduction (H₂, 400 °C) | 71.2±1.8 | 79.6±1.6 | 76.3±2.1 | 88.5±2.0 | 68.9±2.5 | 15.3±1.0 | 4 |
| Enzyme Cleaning | 53.4±3.0 | 62.1±2.5 | 60.2±3.2 | 70.3±3.5 | 49.7±3.8 | 3.8±0.2 | 3 |
Table 5.
Comparison of comprehensive performance of MgO/Na₂CO₃ and MgO/K₂CO₃ catalysts.
| Parameter | 35%-Na₂CO₃/MgO-600 °C | 35%-K₂CO₃/MgO-600 °C |
|---|---|---|
| Initial Yield (%) | 97.5 ± 0.1 | 95.8 ± 0.2 |
| Yield after 5th Cycle (%) | 88.2 ± 0.5 | 65.2 ± 0.8 |
| Specific Surface Area (m²/g) | 148.6 ± 3.2 | 126.3 ± 2.8 |
| Na⁺/K⁺ Leaching Rate (%) | 18.9 ± 0.1 | 27.7 ± 0.1 |
| Yield Recovery after Regeneration (%) | 88.5 ± 1.5 | 94.2 ± 1.3 |
| Economic Cost (USD/ton) | 1200 | 1350 |
Disclaimer/Publisher’s Note: The statements, opinions and data contained in all publications are solely those of the individual author(s) and contributor(s) and not of MDPI and/or the editor(s). MDPI and/or the editor(s) disclaim responsibility for any injury to people or property resulting from any ideas, methods, instructions or products referred to in the content. |
© 2025 by the authors. Licensee MDPI, Basel, Switzerland. This article is an open access article distributed under the terms and conditions of the Creative Commons Attribution (CC BY) license (http://creativecommons.org/licenses/by/4.0/).
Copyright: This open access article is published under a Creative Commons CC BY 4.0 license, which permit the free download, distribution, and reuse, provided that the author and preprint are cited in any reuse.


