
Submitted:
27 February 2025
Posted:
28 February 2025
You are already at the latest version
Abstract
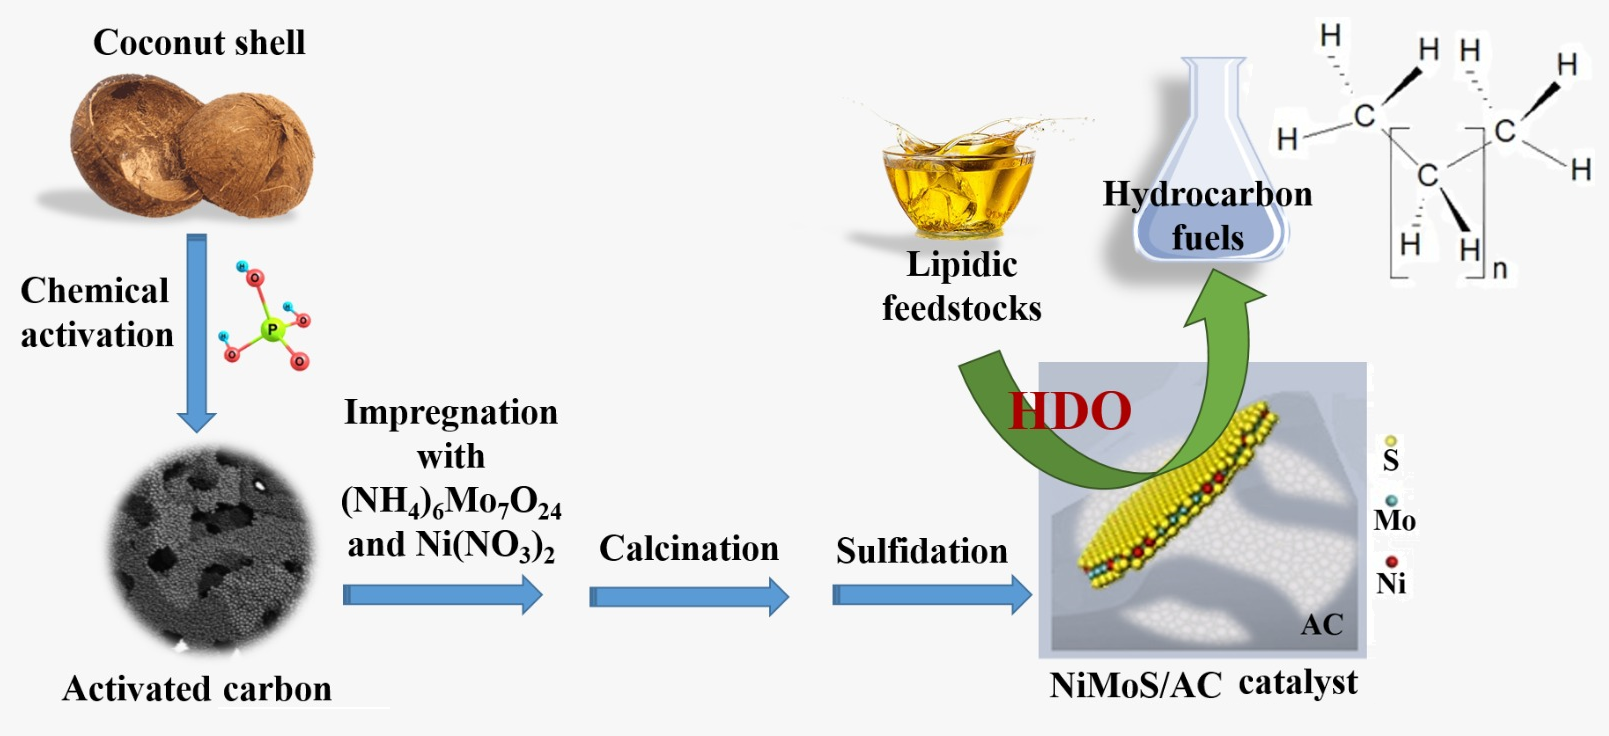
The production of hydrocarbon-based biofuels has been the target of intense research worldwide. In this context, the core goal of the present work was to investigate the use of mesopore-rich activated carbons (ACs) as support for sulfided Mo-based catalysts intended for the hydroprocessing of lipidic feedstocks. Key issues of the work were that: unlike traditional inorganic supports, ACs are highly resistant to hydrolysis, which is a very important aspect in the hydroprocessing of lipidic feedstocks because water is abundantly produced during the process; the porosity of ACs can be tailored to give rise to a high mesopore content, which are important for improving the access of bulky triglyceride molecules to metallic active sites located inside the pores network. A systematic study on the effects of the preparation conditions on the properties and performance of the obtained catalysts was carried out. The highest hydrodeoxygenation (HDO) activity was verified for the catalyst prepared through sequential deposition of Mo and Ni by wet impregnation. The prepared catalyst presented better performance for coconut oil HDO than an industrial sulfided NiMo/Al2O3 catalyst. Furthermore, the prepared catalysts presented good stability, provided the sulfidation degree was kept high. The obtained results evidenced that ACs have great potential to replace inorganic supports in sulfided Mo-based catalysts.
Keywords:
HEFA
; hydroprocessing
; hydrodeoxygenation
; Mo-based catalysts
; activated carbon
; catalyst support
1. Introduction
The production and use of biofuels have two main goals: (i) to provide alternative resources to attend to the growing demand for fuels, especially in the transport sector; (ii) to make available fuels that are less harmful to the environment. Currently, bioethanol and biodiesel (fatty acid esters) are by far the most worldwide employed biofuels. Despite its lower energy density compared to gasoline, bioethanol has satisfactorily met the needs of internal combustion engines. In turn, biodiesel has been largely employed in diesel cycle engines. Nevertheless, biodiesel have features that impair some fuel properties. In addition to reducing energy density, ester groups increase hydrophilicity and intermolecular forces. High hydrophilicity is undesirable because water promotes biological growth in storage tanks, leading to the formation of sludge and slime, which can block filters and lines [1]. Furthermore, the hydrolysis of esters results in free fatty acids that increase fuel corrosivity. In turn, increased intermolecular forces increase viscosity and impart fuel cold flow properties. In this respect, the presence of unsaturations reduces viscosity and improves fuel cold flow properties [2]. However, unsaturations (especially conjugated polyunsaturations) markedly reduce oxidative stability, which can cause acidity and formation of insoluble gums and sediments [3].
In the scenario depicted above, the production of hydrocarbon biofuels has received increasing attention because they can exhibit properties and performance close to those of petrofuels, can be used without engine modification, can utilize current supply infrastructure (tanks, pumps, pipelines, etc.) and can be blended with conventional fuel in any ratio, therefore attending the “drop-in” concept. These issues are especially relevant in aviation due to the inherent risks involved in this sector [4]. Therefore, the obtention of hydrocarbon biofuels has been intensely investigated, as reported by numerous reviews covering several existing routes [4,5,6,7,8,9,10,11].
Nowadays, HEFA (hydroprocessing of esters and fatty acids) is the most mature and commercially viable technology available to produce hydrocarbon biofuels. The main reason is that HEFA can be easily integrated into oil refineries, reducing capital costs. The route has been widely employed to produce biofuels for jet turbines (so-called HEFA-SPK (synthetic paraffinic kerosene) or SAF (sustainable aviation fuel)) and diesel engines (so-called renewable diesel, green diesel or HVO (hydrotreated vegetable oil)) from lipidic feedstocks (vegetable, animal and algal oils and fats) [4,5,6,7,8,9,10,11,12,13,14,15,16,17,18,19,20,21,22,23,24,25,26,27,28,29].
The key-step in HEFA is the deoxygenation of the fatty chains resulting from the cleavage of acylglycerides that constituting the lipidic feedstocks. It is achieved by a process akin to the hydroprocessing of petroleum and its derivatives: thermal treatment at medium temperature (~300–400 °C) under high H2 pressure (most usually in the range of 20–100 bar) in the presence of heterogeneous catalysts. It is well known that deoxygenation of fatty acids can take place via three different pathways: decarboxylation, (hydro)decarbonylation, and hydrogenation/dehydration (Equations 1, 2 and 3 in Figure 1, respectively) [4,12,13,14,15,16,17,18,19,20,21,22,23,24,25,26,27,28,29].
The thermal treatment of biomass derivatives in the presence of H2 aiming to remove oxygen is usually called HDO (hydrodeoxygenation). However, it should be noted that some authors have used the term HDO to refer to the specific deoxygenation pathway represented by Equation 3 in Figure 1 (see, for example examples, references [12,26,27,28]). In this work, in order to avoid misunderstanding, the term HDO is used to refer exclusively to the hydroprocessing stage as a whole, while the specific pathway corresponding to Equation 3 in Figure 1 is referred as hydrogenation/dehydration.
HDO (not only of lipidic feedstocks, but also of lignocellulose derived bio-oils [4,29,30,31,32] or other O-rich mixtures [4]) is most usually performed in the presence of the same catalysts employed in the hydroprocessing of petroleum and derivatives: sulfides of group 6 transition metals (Mo or W), promoted by transition metals with higher number of electrons d (Ni or Co), deposited over oxide supports [12,13,14,15,16,17,18,19,20,21,22,23,24,25,26,27,28,33,34,35,36,37,38,39,40]. These catalysts consist mainly of monolayer slabs or clusters of slabs of MoS2 or WS2 dispersed on the support surface. Sulfur anion vacancies (so-called unsaturated sites) located at the edges of the slabs are believed to act as Lewis acid sites in the promotion of deoxygenation reactions. Ding et al. [17], Bara et al. [41], and Tpsøe et al. [42,43] published relevant works on the structure of such catalysts.
γ-Al2O3 (alumina) is the most employed support in petroleum hydroprocessing catalysts mainly because it is reasonably inexpensive and is stable in this kind of application. However, γ-Al2O3 is unstable in the HDO of O-rich feedstocks such as biomass derivatives because it can be hydrolised to boehmite by the water abundantly formed in the process [44]. In addition, the high acidity of γ-Al2O3 favors coke deposition, with consequent catalyst loss of activity and even deactivation [26,27,45,46,47,48,49,50,51,52]. Therefore, there is great interest in the employment of new supports in catalysts aimed at HDO.
In this context, activated carbons (ACs) can be pointed out as an interesting support option, mainly because they are highly resistant to chemical attack in both acidic and basic media (which includes hydrolysis). Furthermore, ACs: have lower acidity than Al2O3, which contributes to reduce hydrocracking and coking [26,27,46,47,48,49,50]; present higher surfaces areas than Al2O3; have pore size distribution and surface chemistry that can be tailored according to the application they are intended for [50,53,54,55]; are thermally stable; can be obtained from cheap and abundant precursors (i.g. biomass residues and coals).
Despite the potential benefits, scarce works are currently available on the use of AC-supported sulfided Mo-based catalysts in the hydroprocessing of lipidic feedstocks. There are some works reporting the use of this kind of catalyst in the hydroprocessing of petroleum and derivatives [56,57,58,59,60,61]. Remarkably, Van Veen et al [56] and Topsøe et al. [57] compared different supports and concluded that ACs generate weaker interactions with the metal sulfides, resulting in a more active phase for HDS (hydrodesulfurization). There are also some works about the use of such catalysts in the HDO of bio-oils derived from lignocellulosic feedstocks or related model compounds [50,62,63]. Nevertheless, to the best of our knowledge, there are currently only two articles reporting the use of AC-supported sulfided Mo-based catalysts in the hydroprocessing of lipidic feedstocks or related model molecules: the papers of Tapia et al. [64] and Couman and Hensen [49]. The former reported a good activity of an AC-supported sulfided NiMo catalyst in the HDO of Jatropha oil. In turn, Couman and Hensen compared the performance of sulfided NiMo catalyst deposited on different supports (AC, mesoporous alumina, and amorphous silica-alumina) in the HDO of methyl oleate. The authors reported that the AC-supported catalyst presented the highest active phase dispersion due to the weak interaction between the support and the metals sulfides, so that it was twice as active for HDO as those having oxides as support and remained active over a more prolonged reaction time. In addition, it is worth mentioning that Ferreira et al. [65] prepared a sulfided NiMo catalyst supported on carbon nanotube (CNT), which presented similar activity in palmitic acid HDO as a commercial sulfided NiMo/Al2O3 catalyst.
Within this above-described scenario, the goal of the present work was to investigate the preparation of AC-supported sulfided Mo-based catalysts aimed at the hydroprocessing of lipidic feedstocks. The support was produced from chemical activation of coconut shell (an abundant and inexpensive agrowaste) with H3PO4. This activation protocol was chosen because it has proven to permit the synthesis of ACs with high mesopore content [66], which is important to reduce diffusional restrictions and improve the access of bulky substrates (as it is the case of triglyceride molecules that constitute lipidic feedstocks) to the metallic active sites located inside the pores network.
The effects of preparation conditions on the properties and HDO activity of the resulting catalysts were systematically investigated. More specifically, we investigated the effects of: incorporating Ni as a promoter; the impregnation methodology (incipient wetness impregnation vs wet impregnation; co-impregnation vs sequential impregnation of Mo and Ni); and calcination temperature (400 or 500 °C).
Coconut oil was the employed feedstock, which is constituted mainly by medium-length fatty chains (primarily C12 chains) [26]. However, since the split of lipids renders a complex mixture of fatty chains, the preliminary tests aiming to establish the conditions that would render the catalyst with the highest HDO activity were carried out using dodecanoic acid (so-called lauric acid) as a model compound.
2. Results and Discussion
2.1. AC Characterization
Figure 2 shows the N2 adsorption-desorption isotherm of the bare AC P54 and some selected oxo-catalysts. The isotherm of P54 can be considered a hybrid of type I (b) and type IV according to the IUPAC classification [67], which are typical of microporous and mesoporous adsorbents, respectively. The amount of adsorbed N2 was high even for much low equilibrium pressures, which reveals a pronounced presence of narrow micropores. Furthermore, the adsorption continued increasing up to near the saturation pressure, which indicates the existence of larger pores (wide micropores and mesopores). The occurrence of a prominent hysteresis loop confirms the presence of mesopores. These findings are confirmed by the textural characterization data (Table 1). The volumes of micro and mesopores of P54 were 0.72 and 0.55 cm3 g–1, respectively, which resulted in a high SSA (specific surface area) of 1643 m2 g–1.
The XPS (X-ray photoelectron spectroscopy) analysis of P54 (Figure 3, Table 2) indicates the presence of carbon, oxygen, silicon, and phosphorus in proportions of 85.9, 11.9, 0.4 and 1.9 wt%, respectively. Phosphorus was incorporated during the process of activation with H3PO4, while the other elements remained from the biomass precursor.
The high resolution (HR) XPS C 1s core level spectrum of P54 (Figure 4a) was deconvoluted into four components, which were assigned mainly to: unfunctionalizated carbons (CI peak; 284.8 eV); C–O (CII; 286.2 eV); C=O (CIII; 287.4 eV); COO (CIV; 288.8 eV) [68]. In turn, the HR-XPS O 1s core level spectrum was deconvoluted into two peaks (Figure 4b) assigned mainly to: O double bounded to C (OI; 531.7 eV); O single bounded to C (OII; 533.4 eV) (pertinent discussion about this assignment was presented elsewhere [55]). The relative contributions of each peak are reported in Table 3.
In accordance with its relatively high O content, P54 gave rise to relatively intense CO2 and CO emissions during TPD (temperature-programmed desorption) analysis. The deconvolution of the CO2-TPD profile (Figure 5a) resulted in five main peaks centered at around 260, 363, 500, 606 and 794 °C (CO2-I–CO2-V peaks), which, according to the literature [69,70], were attributed to stronger carboxylic acids, weaker carboxylic acids, anhydrides and lactones (the last two), respectively. In turn, the TPD-CO profile was deconvoluted into five main components, as displayed in Figure 5b, which were assigned to: anhydrides, which release CO2 and CO simultaneously (CO-I; 500 °C); phenol/ether (CO-II and CO-III; 650 and 780 °C); ketones/quinones (CO-IV and CO-V; 886 and 930 °C) (see pertinent discussion about the assignment of CO-TPD peaks in reference [55]).
In accordance with the TPD analysis, Boehm titration (Table 4) disclosed relatively high contents of strong (0.55 mmol g‒1) and weak (1.21 mmol g–1) acidic groups, besides a low content of medium acids (0.07 mmol g–1). As it will be depicted in Subsection 3.4, it has been assumed that strong acids encompass carboxylic acids and anhydrides, while weak and medium strength acids correspond mainly to phenols and lactones, respectively. At this point, it is valid to mention that no basic groups were detected. Therefore, it is possible to conclude that the carbonylic groups detected by TPD at high temperatures (above around 800 °C) are neutral or have too weak basic character to be detected by the employed titration protocol.
The chemical composition of P54 was also investigated through elemental analysis (EA; Table 2). The results show that P54 has C, H and N contents of 84.2, 1.4 and 0.3 wt%, with a H/C atomic ratio of 0.20 . The sum of C, H, N, and ash contents amounted to only 85.8 wt%, which, in accordance with the XPS data, evidences a relatively high O content.
2.2. Catalysts Characterization
The ICP/OES (inductively coupled plasma/optical emission spectrometry) analyses showed that Mo and Ni were effectively deposited on the surface of P54 (Table 5). The Mo content varied in the range from 12.9 to 20.46 wt%; in turn, when Ni was employed, its content was found to be in the range from 0.70 to 1.02 wt%. The Ni/Mo atomic ratio varied in the range from 0.07 to 1.12.
TEM/EDX (transmission electron microscopy/energy-dispersive X-ray) elemental mapping shows clusters of Mo and Ni with dimensions of a few nanometers uniformly distributed over the support surface, as illustrated for some selected catalysts in Figure 6.
As expected, the deposition of an elevated amount of metals (mostly Mo) on the surface of P54 caused pronounced reduction of porosity and SSA (Table 1). Besides reducing the pores volume, the deposited phase can also cause pore filling or blocking.
Figure 7 presents the XPS (X-ray photoelectron spectroscopy) survey spectra of the catalyst oxo-Ni,Mo/P54-w,4 and its sulfided counterpart sulf-Ni,Mo/P54-w,4. For the oxo catalyst, the main difference in comparison to the spectrum of the bare P54 support (Figure 3) is the presence of peaks referent to molybdenum. In the case of the sulfided catalyst, there are also intense peaks referent to sulfur. Furthermore, all prepared catalysts presented weak peaks due to nitrogen in the range of ~398–402 eV, which overlapped with the Mo3p3/2 peak of molybdenum species. This nitrogen was inserted due to the reaction of the support surface with the NH3 released by the decomposition of (NH4)6Mo7O24 during catalysts calcination. Concerning nickel, slight peaks could be clearly identified only by means of the HR spectra.
The contents of each element identified by XPS are reported for some selected catalysts in Table 2. However, it is valid to highlight that XPS provides an estimation of the chemical composition of the few uppermost layers of the external surface, so that these results must be considered with much care.
The HR-XPS Mo 3d core level spectra of the oxo-catalysts displayed two main peaks at around 233 and 236 eV (Figure 8a–c), which roughly correspond to the BE (binding energy) of the Mo 3d5/2 and Mo 3d3/2 spin orbit core levels of Mo6+ [33,41,62,71,72,73,74]. On the other hand, no significant peak was identified for the oxo-catalysts in the region corresponding to the Mo 3d5/2 core level of Mo4+, around 229 eV [33,41,62,71,72,73,74,75]. Furthermore, the O 1s core level spectra of the oxo-catalysts (Figure 8e–g) presented, besides the OI and OII peaks typical of the AC support (Subsection 2.1), an additional intense peak assigned to MoO3 [71,72] at 531 eV (it is valid to mention here that, for MoO2, the O 1s peak is usually verified at lower BE, around 530 eV [73]). All these findings evidence that, in the oxo-catalysts, Mo is overwhelmingly present as MoO3.
The same way as observed for the oxo-catalysts, the HR-XPS Mo 3d core level spectra of the sulf-catalysts also presented two intense peaks due to Mo 3d5/2 and Mo 3d3/2 spin orbit core levels; however, in this case, the peaks were centered at lower BE, 229.5 and 232.5 eV, respectively (Figure 8d), which are typical of Mo4+ [33,41,49,62,73,74,75]. In turn, the S 2p spectra of the sulf-catalysts displayed two intense peaks at 162.4 and 163.6 eV (Figure 9), which can be assigned to the S 2p3/2 and S 2p1/2 spin orbit core levels of MoS2, respectively [49,62,73,74,75]. In addition, there are two shallower peaks at 169.1 and 170.2 eV, which are assigned to oxidized sulfur species such as sulfonyls, sulfonates, sulfites and sulfates [73,76,77]. Supposedly, the oxygen in these species (S=O) would explain the increased intensity of the OII peak [76] in Figure 8h.
The above-presented findings show that the MoO3 (which was predominant in oxo-catalysts) was converted into sulfur-containing species of Mo4+, mostly MoS2, during the sulfidation step. Accordingly, only a slight peak was verified at ~531 eV in the O 1s spectra of the sulf-catalysts (as illustrated in Figure 8h), and no peak was observed at ~530 eV (BEs are characteristics of O in MoO3 and MoO2 species, respectively).
Figure 10 presents the HR-XPS Ni 2p core level spectra of some selected catalysts, which are quite shallow due to the low metal content. In general terms, two peaks can be identified, at ~856 and ~874 eV, which were assigned to the 2p3/2 and 2p1/2 spin orbit core levelsof Ni2+ species, respectively [47,49].
The synthesized catalysts were examined by XRD (X-ray diffraction). Figure 11 displays the diffractogram of the oxo-Mo/P54-i,4 catalyst (prepared by depositing only Mo over P54) and, for the sake of comparison, the XRD standard pattern of some common Mo oxides: the hexagonal, orthorhombic and monoclinic forms of MoO3 (h-MoO3, α-MoO3, and β-MoO3), besides that of monoclinic MoO2. The spectrum of oxo-Mo/P54-i,4 presents intense sharp peaks, which is indicative of well-developed crystalline phases. The diffraction peaks at 2θ = 10.6, 18.4, 21.3, 26.0, 30.3, and 35.7° fit relatively well with those indexed to the (100), (110), (200), (210), (300) and (310) crystal phases of h-MoO3.
Figure 12 displays the XRD profiles of all the prepared Mo-based oxo-catalysts, which presented all similar profiles. At this point, it is worth highlighting that several authors (e.g. Silva et al. [78] and Medeiros et al. [79]) have reported that, during the decomposition of (NH4)6Mo7O24 in the range of 300–400 °C, the conversion of h-MoO3 into the corresponding orthorhombic phase (α-MoO3) takes place. Since this conversion did not significantly occur in the present work even after calcination at 500 °C, we believe that the interaction with the carbon surface stabilized the h-MoO3 phase.
It is interesting to highlight also that the incorporation of Ni into the catalysts did not induce perceptible changes in the XRD profiles. This reveals that there was a good Ni dispersion, so that Ni crystals with dimensions larger than the coherence length of the X-ray beam were not formed.
Figure 13 displays the XRD pattern of the catalyst sulf-Ni,Mo/P54-w,4 and, for the sake of comparison, the XRD standard pattern of MoS2. The Figure shows that, after sulfidation, the peaks characteristic of oxidic Mo compounds vanished, giving place to peaks characteristic of MoS2. Nevertheless, these peaks were quite large. Remarkably, the peaks indexed as (100), (101), (102), (103) and (105) in MoS2 were so large that they ended up overlapping to form a kind of envelope that extends from ~31° to ~55°, with two salient maxima at 34.0 and 39.0°. Furthermore, the peaks indexed as (106), (110) and (008) overlapped to give rise to a unique band with a maximum at 59.0°. At this point, it is valid to mention that this DRX profile is commonly observed in synthesized MoS2 (even in unsupported MoS2) [62,75] and the peaks broadening can be attributed to the presence of chemical heterogeneities and/or crystallite smallness.
Additional specific issues related to the XRD analyses will be addressed along with the text when pertinent.
2.3. Searching for the Best Conditions to Prepare the Catalysts
Initially, a thorough study was carried out in the search for the conditions that would result in the AC-supported Mo-based catalyst with the highest activity for HDO. As already mentioned in the Introduction Section, this search was carried out using lauric acid as model compound. The acidic index (AI) of the obtained liquid mixtures was taken as the key parameter to evaluate the catalysts activity for HDO. It is worth highlighting that the lower the AI, the higher the feedstock conversion and, therefore, the highest the catalyst activity. In the case of tests with coconut oil, the triglycerides molecules are firstly converted into the respective fatty acids [35], so that the AI can also be employed as a parameter to evaluate catalyst HDO activity.
2.3.1. Blank Test
A 3 h blank test with lauric acid was carried out using the bare support P54. The resulting product presented a high AI of 264.4 (Table 6, Entry 1), which was only a little lower than the value for lauric acid (280). This result reveals that the support, by itself, has a quite low HDO activity (if any).
2.3.2. Catalysts Containing Mo as the Only Active Phase
Two catalysts containing Mo as the only metal in the active phase (in other words, without the addition of Ni) were prepared. Mo was deposited by incipient wetting impregnation (sometimes also called dry impregnation) and the impregnated material was calcined at 400 or 500 °C. The results of the 3 h tests for lauric acid HDO show that the catalysts presented relatively high and similar HDO activity, with the resulting products presenting AIs of 8.1 and 7.0 in the cases of the use of Mo/P54-i,4 and Mo/P54-i,5, respectively (Table 6, Entries 2 and 3) (remember, the AI of lauric acid is 280).
2.3.3. Effects of Ni Incorporation
In the sequence of the work, the effect of incorporating Ni into the Mo-based catalysts was evaluated. Different procedures for metals deposition were investigated, as depicted in the sequence.
2.3.3.1. Co-Impregnation of Mo and Ni
Firstly, we tried to deposit Mo and Ni simultaneously, that is to say, from a unique solution (co-impregnation approach). For that, Ni(NO3)2 and (NH4)6Mo7O24 solutions were mixed. However, at this time, a suspension of Ni3Mo7O24 was formed. Since the atomic Ni/Mo ratio in the mixture was nearly 0.07 (see subsection 3.1), which is much inferior than the ratio in Ni3Mo7O24, thus it is possible to infer that the mixture was composed by nanoparticles of Ni3Mo7O24 suspended in a solution containing mostly Mo7O246‒ ions. This suspension was then used in the co-impregnation tests, which were carried out through incipient wetting impregnation or wet impregnation, as depicted in the sequence.
2.3.3.1.1. Incipient Wetting Co-Impregnation of Mo and Ni
The co-impregnation of Mo and Ni was first carried out employing the incipient wetting methodology. The obtained sulf-NiMo/P54-i,4 and sulf-NiMo/P54-i,5 catalysts were evaluated for lauric acid HDO. After 3 h, the obtained products presented AIs of 8.6 and 7.2, respectively (Table 6, Entries 4 and 5), which were similar to those verified for the Ni-free catalysts (Table 6, Entries 2 and 3). This finding is in accordance with the idea that Ni was incorporated in the form of Ni3Mo7O24 nanoparticles, which would have simply rested on the support surface, while most of the Mo active phase was dispersed throughout the support surface.
Some findings seem to corroborate this hypothesis. For example, the samples oxo-NiMo/P54-i,4 and oxo-NiMo/P54-i,5 presented the highest SSA and porosity among all the prepared catalysts (Table 1). This behavior can be attributed to that, due to dimensional constraints, the Ni3Mo7O24 nanoparticles would have deposited only on the external surface and inside larger pores, so that less metal remained to be deposited inside smaller pores (which are the main responsible by the surface area). Another interesting finding is that the oxo-catalysts prepared by co-impregnation and calcined at 500 °C (not only oxo-NiMo/P54-I,5, but also oxo-NiMo/P54-w,5) were the only ones whose DRX profiles presented salient peaks at around 2θ 36.9 and 53.5° (labeled with asterisks in Figure 12), which correspond to the (020) and (220) crystal phases of MoO2 (Figure 11e). Supposedly, the Mo6+ located in the interior of Ni3Mo7O24 nanoparticles found conditions to be reduced to Mo4+ between 400 and 500 °C during calcination.
2.3.3.1.2. Wet co-Impregnation of Mo and Ni
In the sequence of the work, the wet co-impregnation of Mo and Ni was carried out. Despite the much higher volume of the impregnating solution (~10x) employed in this procedure if compared to that employed in incipient wetness co-impregnation, the formation of a suspension of Ni3Mo7O24 nanoparticles took place even so.
The resulting catalysts presented SSA and porosity (Table 1) that were intermediate between the values verified for the samples prepared by incipient wetting co-impregnation (oxo-NiMo/P54-i,4 and oxo-NiMo/P54-i,5) and all the other prepared oxo-catalysts. Furthermore, the DRX profile of the oxo-NiMo/P54-w,5 catalyst presented the peaks typical of MoO2 at around 2θ 36.9 and 53.5° (labeled with asterisk in Figure 12), but in much lower intensity than in the case oxo-NiMo/P54-i,5. These findings evidence that there was the deposition of Ni3Mo7O24 nanoparticles over the support surface during wet co-impregnation, but it was less pronounced than in the case of the incipient wet co-impregnation. Supposedly, the prolonged impregnation time employed in wet co-impregnation (24 h) permitted, through an equilibrium displacement mechanism, a gradual dissolution of most (but not all) of the initially formed Ni3Mo7O24 nanoparticles into the abundant impregnating solution (Equation 1) and posterior adsorption of the resulting ions on the support surface (Equation 2).
Ni3Mo7O24 (s) ⇌ 3Ni2+ (aq) + Mo7O246‒ (aq)
AC (s) + Mo7O246‒ (aq) + 3Ni2+ (aq) ⇌ adsorbed ions
A comparison of the TEM/EDX elemental mapping of the oxo-NiMo/P54-i,4 and oxo-NiMo/P54-w,4 catalysts (Figure 6a and 6b, respectively) makes clear that the wet co-impregnation led to a better dispersion of smaller metals clusters over the support surface. Thanks to that, the catalysts prepared through wet co-impregnation of Mo and Ni presented considerably higher HDO activity than their counterpart catalysts prepared using incipient wetting co-impregnation. When the sulf-NiMo/P54-w,4 and sulf-NiMo/P54-w,5 catalysts were employed, the products obtained after 3 h in the lauric acid HDO tests presented AIs of only 0.8 and 1.1, respectively (Table 3, Entries 6 and 7).
2.3.3.2. Sequential Impregnation of Mo and Ni
In order to avoid the formation of Ni3Mo7O24 nanoparticles, catalysts were prepared employing a sequential impregnation of Mo and Ni using separate solutions. The same way as occurred with the procedures involving co-impregnation, both incipient wetting impregnation and wet impregnation methodologies were employed.
Indeed, the DRX profiles of the resulting oxo-catalysts (oxo-Ni,Mo/P54-i,4, oxo-Ni,Mo/P54-i,5, oxo-Ni,Mo/P54-w,4, and oxo-Ni,Mo/P54-w,5) did not present the peaks characteristic of MoO2 at 2θ 36.9 and 53.5° (Figure 12). Furthermore, the catalysts prepared using sequential impregnation presented lower SSA and porosity than their counterparts prepared by co-impregnation. According to the reasonings presented in Subsection 2.3.3.1.1, all these findings can be interpreted as evidence of the non-formation of Ni3Mo7O24 nanoparticles during catalysts preparation through sequential impregnation.
The resulting catalysts were tested for lauric acid HDO and all of them presented high activity. After 3 h tests, the catalysts prepared by sequential incipient wetting impregnation (Ni,Mo/P54-i,4 and Ni,Mo/P54-i,5) rendered products with AIs of 2.0 and 0.8 (Table 6; Entries 8 and 9), respectively, which were much lower than those verified in the case of the counterpart catalysts prepared by co-impregnation (Table 6; Entries 4 and 5). These results evidence that the incorporated Ni effectively acted as a promoter to increase catalysts activity. According to Byskov et al. [80] and Romero et al. [81], Ni (as well Co) weakens the Mo-S bond at the edges of MoS2, thereby favoring the formation of vacant sites, which are believed to be the active sites for many hydrotreating reactions.
In the cases of the catalysts prepared by wet impregnation (Ni,Mo/P54-w,4 and Ni,Mo/P54-w,5), products with AIs of 0.5 and 0.8 were obtained after the 3 h lauric acid HDO tests (Table 6; Entries 10 and 11). Since these values were very similar to those verified for Ni,Mo/P54-i,5 and close to zero, new HDO tests with sulf-Ni,Mo/P54-i,5 and sulf-Ni,Mo/P54-w,4 were carried out using a shorter reaction time (2 h). The AIs of the resulting products (13.7 and 1.9, respectively; Table 3; Entries 9’ and 10’) confirmed that the catalyst with the highest activity for HDO was sulf-Ni,Mo/P54-w,4, prepared by wet impregnation. Supposedly, the long impregnation time employed in this methodology permits a better metal dispersion throughout the support surface, leading to a better dispersion and, therefore, to a higher number of available active sites. Indeed, the elemental mapping of oxo-Ni,Mo/P54-w,4 (Figure 6c) confirms the occurrence of well dispersed nanoclusters of Mo and Ni.
Figure 14 shows the GC/FID (gas chromatography/flame ion detector) chromatogram of the product obtained after the 3 h test of lauric acid HDO with the sulf-Ni,Mo/P54-w,4 catalyst. The chromatogram has only two peaks assigned to n-undecane (n-C11) and n-dodecane (n-C12). The former resulted from decarboxylation and decarbonylation reactions (Equations 1 and 2 in Figure 1), while the latter resulted from hydrogenation/dehydration reactions (Equation 3 in Figure 1). These results show that cracking and isomerization reactions were not relevant, which is in accordance with the low acidity of the employed support (see pertinent discussion in the Introduction Section). Therefore, it is possible to infer that these catalysts are more interesting to be used in the production of diesel-like fuels, because long and linear chains have higher cetane number [82]. In turn, if the aim is to produce SAF, an additional isomerization step has to be added to the process or the obtained product has to me mixed with a fuel fraction with appropriate content of branched alkanes and aromatics/cycloalkanes because: branched chains enable the fuel to meet the cold properties required for aviation fuels [4,82]; aromatics/cycloalkanes swells the rubber seals used in high pressure fuel system, thus preventing fuel leaks [4,83]).
2.3.4. Effect of Calcination Temperature
At this point, it is worth making some brief comments about the effect of calcination temperatures on the structure and activity of the resulting catalysts. Figure 12 shows that basically the same peaks were present in the XRD profiles of the oxo-catalysts prepared at both 400 and 500 °C, except for the catalysts prepared through co-impregnation because, as already reported in Subsection 3.2.3.1, in these cases some reduction of Mo6+ to Mo4+ took place between 400 and 500 °C. Therefore, the influence of the calcination temperature on the HDO activity of the resulting catalysts was rather limited.
2.3.5. The Effect of Sulfiding the Catalyst
In order to evaluate the need and usefulness of performing the sulfidation of the AC-supported Mo-based catalysts, a lauric acid HDO test was carried out using the catalyst oxo-Ni,Mo/P54-w,4, that is to say, without proceeding with the sulfidation step. During the test, the reactional mixture became gradually black and ended by solidifying, which evidences that pronounced coking took place and highlights the need of performing the sulfidation step. Indeed, Mukundan et al. [62] reported that Mo oxides can trigger the formation of carbon precursors on the catalyst surface, while Ojagh et al [84] stated that sulfur phases are less prone to deactivation by coke deposition.
2.4. HDO Tests with Coconut Oil
The catalyst sulf-Ni,Mo/P54-w,4 (the one that presented the highest HDO activity in the tests with lauric acid) was used in the HDO tests of coconut oil. The 3 h test resulted in a product with an AI of 1.1 (Table 6, Entry 12), which was somewhat higher than that verified for the product of the test with lauric acid under identical conditions (0.5; Table 3, Entry 10). This result can be attributed to that the triacylglyceride molecules that compose the oil have to be firstly split into propane and the corresponding fatty chains before the latter are deoxygenated, which slows the conversion into alkanes [35].
In turn, a reaction time of 5 h rendered a product with an AI 0.0 (Table 4, Entry 12’). Accordingly, the GC/FID chromatogram of the obtained product (Figure 15a) presents only peaks corresponding to alkanes (practically only n-alkanes). These alkanes cover a large chain length range, mostly from C7 to C18, with emphasis to n-undecane. This profile is in accordance with the occurrence of decarboxylation, decarbonilation and hydrogenation/dehydration reactions of the fatty chains that compose coconut oil [26].
In accordance with the measured AI (zero) and the respective chromatogram, the FTIR (Fourier transform infrared spectroscopy) spectrum of the obtained product (Figure 15c) presents only absorptions characteristics of alkanes: (i) C-H stretch at 2970–2825 cm‒1; (ii) C-H bending of CH2 and CH3 at ~1460 and ~1370 cm‒1, respectively; (iii) long-chain band at ~720 cm‒1. Outstandingly, the bands characteristic of oxygenated groups present in the spectrum of coconut oil (Figure 15b) all vanished: (i) C=O stretch around ~1740 cm‒1; and (ii) C─O stretch at ~1150 cm‒1. In addition, there is no evidence of presence of O─H stretch band in the range of 3500–3200 cm‒1 (which would appear if there was free fatty acids in the mixture) or any other absorption characteristic of oxygenated functional groups.
2.5. Catalyst reusability
The reusability of the catalyst sulf-Ni,Mo/P54-w,4 was investigated by using the same catalyst sample in four consecutive cycles of coconut oil HDO. At the end of each cycle, the spent catalyst was recovered from the liquid product by filtration and dried overnight at 100 °C. The employed reaction time was 5 h.
In a first set of cycles, the step of in situ catalyst sulfidation was carried out only before the first cycle. In this condition, there was a small but gradual increase in the AI of the products obtained from successive cycles: the values were 0.0, 0.2, 1.1 and 2.0 from the first to the fourth cycles. In a second set of cycles, the catalyst in situ sulfidation step was repeated before each new cycle. In this way, the AI of the obtained products remained zero even after the fourth cycle. These results disclose that a slight loss of catalyst activity gradually takes place due to the partial replacement of sulfur by oxygen in the active phase, which is potentialized by the abundant presence of oxygenated molecules in the reactional medium. However, this undesirable effect can be avoided by ensuring that the sulfidation degree of the catalyst is kept high.
At this point, it is valid to mention that activity loss due to the partial oxidation by H2O has also been reported for sulfided Mo-based catalysts deposited on Al2O3. For example, Bykova et al. [85] showed that the addition of water to a gasoil fraction caused a strong deactivation of a sulfided CoMo/Al2O3 catalyst face to hydrotreating reactions. Gong et al. [86] observed a fast catalyst deactivation above 120 h during the hydroprocessing of jatropha oil over a sulfided NiMoP/Al2O3 catalyst and concluded that it was caused by the partial sulfide catalyst conversion to oxide catalyst due to the action of the formed H2O. In this sense, some authors have proceeded with the co-feeding of S-containing compounds (dimethyl disulfide (DMDS), H2S, CS2) to avoid catalyst deactivation during the hydroprocessing of biomass-derived feedstocks over sulfided Mo-based catalysts [38,39,87,88]. Remarkably, Kubička and Horáček [87] reported that the O elimination dropped from 95% to 75% after 144 h in the hydroprocessing of rapeseed oil with CoMo/Al2O3, but it was wept above 95% if DMDS was continuously fed with the feedstock, that is to say, the presence of sulfur-containing DMDS in the rapeseed oil continuously reactivated the catalyst by maintaining it in sulfided form. In turn, Şenol [39] investigated the effect of water on the activity of sulfided NiMo/Al2O3 and CoMo/Al2O3 catalysts in HDO of aliphatic esters. They verified that the ester conversion decreased with increasing amount of water, while the addition of H2S to the feed compensated the inhibition by water.
2.6. Comparison with a Reference Sulfided NiMo/Al2O3 Catalyst
In order to have a reference to evaluate the performance of the AC-supported catalysts prepared in the present work, some HDO tests were carried out under similar conditions but employing an industrial sulfided NiMo/Al2O3 catalyst supplied by Petrobras Oil Company (Brazil). This Al2O3-supported catalyst was characterized elsewhere [35]. After a 3 h test with lauric acid, this catalyst rendered a product with AI 0.3, a result similar to that achieved with the sulf-Ni,Mo/P54-w,4 catalyst prepared in the present work (which rendered a product with AI 0.5; Table 3, Entry 10). On the other hand, after a 3 h test with coconut oil, the reference catalyst rendered a product with AI 6.3, while sulf-Ni,Mo/P54-w,4 led to a product with AI 1.1. Two important conclusions can be taken from these results: firstly, that AC-supported sulfided NiMo catalysts can be prepared with a capacity to promote HDO reactions as high as that of well consolidated industrial catalysts having Al2O3 as support; secondly, that in comparison to Al2O3, the AC employed as support favored the initial step of triglycerides split to render the respective fatty acids, so that a higher activity face to coconut oil HDO was observed for the prepared AC-supported catalyst. Supposedly, the mesopores in the P54 AC provided better access of the bulky triglycerides molecules to the active sites inside the pore network, therefore favoring the initial step of hydrogenolysis [19,89]. For these reasons, the P54-supported catalyst and the Al2O3-supported catalysts presented similar performance in the HDO of lauric acid (a linear molecule with relatively small hydrodynamic dimension), while the former presented much better performance for the HDO of bulky molecules such as those that constitute lipidic feedstocks.
3. Materials and Methods
3.1. Catalysts Preparation
A dried endocarp of coconut shell (Cocos nucifera) original from the region of Federal District, Brazil, was crushed and sieved. The fraction in the range of 40–80 mesh (0.177–0.400 mm) was submitted to chemical activation with H3PO4 (85%, Vetec) following procedure described in previous papers [66]. Shortly, the shell was impregnated with an aqueous solution containing the desired amount of H3PO4 and carbonized up to 450 °C under inert atmosphere (N2). Then, the carbonized material was washed with deionized water to remove the chemical, leaving behind a porous structure, and dried overnight at 110 °C. The higher the proportion of impregnated H3PO4, the larger the developed porosity and the higher the pore dimensions. Thus, aiming to obtain a mesoporous rich AC, a relatively high phosphorous/shell ratio was used in the present work: 0.54 (for this reason, the obtained sample was termed P54).
During catalysts preparation, Mo and Ni were deposited from aqueous solutions of (NH4)6Mo7O24·4H2O (99%; Vetec) and Ni(NO3)2·6H2O (99%; Vetec), respectively, over the surface of the P54 AC. The solutions were always prepared with concentrations that corresponded to Mo and Ni proportions of 42 and 1.8 wt% relative to the support, respectively. As shown in Table 5, this procedure resulted in maximum Mo and Ni contents of about 20 and 1.0 wt% in the prepared catalysts (ICP/OES measurements).
The metals depositions were carried out by incipient wetness impregnation or wet impregnation. In the former, a volume of impregnating solution was added drop wise over the support, so that solution penetrated the pores by capillarity. The solution volume (determined through preliminary test on aliquot samples) corresponded to that beyond which the catalyst outside began to look wet. Then, the material was dried overnight in an oven at 110 °C. In turn, in the wet technology, an excess solution was used (13 mL per gram of AC). The system was closed and kept under stirring for 48 h at 50 °C. After that, the excess of water and volatiles were permitted to evaporate by opening the system. Finally, the material was dried overnight in an oven at 110 °C.
For preparing the catalyst containing both Mo and Ni, two different approaches were evaluated: the metals were co-impregnated from a single solution; the metals were sequentially impregnated with separate solutions (first Mo, then Ni).
The impregnated materials were calcined up to 400 or 500 °C (2 h, 5 °C min‒1) in inert atmosphere (N2, 100 mL min‒1).
The calcined materials were sulfided in situ as described in Subsection 3.4.
3.2. Catalysts Labels
The catalysts were systematically labelled accordingly to the procedure employed for their preparation as follows.
a) The prefixes “oxo” or “sulf” were used to indicate the non-sulfided and sulfided forms, respectively (“oxo” is used because oxides are the predominant form of the metals after calcination and before sulfidation, as depicted in Subsection 3.2).
b) The deposited metals were indicated in the sequence. If Mo and Ni were co-impregnated, their elemental symbols were listed together (NiMo). If they were sequentially impregnated, the elemental symbols were separated by a comma. Repair that, despite Mo being impregnated by first in the sequential protocol, even so the Ni symbol has been listed before Mo in the catalysts labels because this is the more usual format verified in the literature.
c) In the sequence, the employed support (P54) is indicated after a slash.
d) Then, separated by a hyphen, “w” or “i” indicate if wet impregnation or incipient wetting impregnation was used, respectively.
e) Finally, separated by a comma, the calcination temperature is indicated: 4 and 5 represent 400 °C and 500 °C, respectively.
Thus, just as an example, oxo-Ni,Mo/P54-w,4 refers to the non-sulfided form of the catalyst that was prepared with sequential deposition of Mo and Ni over the P54 support by wet impregnation, with a calcination temperature of 400 °C.
3.3. Characterization of P54 and Catalysts
The pore morphology was evaluated from the excess adsorption/desorption isotherms of N2 (–196 °C) recorded up to 1 bar on a volumetric automatic system Quantachrome NovaWin 2200e (Boynton Beach, Florida, USA, USA). SSA and Vmic were determined from the adsorption isotherms by applying the Brunauer–Emmett–Teller (BET) and Dubinin–Radushkevich (DR) equations, respectively. The volume of liquid N2 adsorbed at p/p0 0.95 was termed V0.95 and was the sum of Vmic and the Vmes. Therefore, Vmes was calculated as the difference between V0.95 and Vmic.
P54 had its content of C, H and N determined by EA performed on a Parkin Elmer CHN Elemental Analyzer model EA 2400 Series II equipped with an AD6 ultra-microbalance (Waltham, Massachusetts, USA). The ash content was determined on a dry basis by heating the material at 600 °C for 6 h in a furnace oven open to the atmospheric air. The bulk content of Mo and Ni were determined by ICP/OES in an Agilent 5100 equipment (Santa Clara, California, USA).
TPD/MS analyses were performed on an automated reaction system model AMI-90R coupled to a Dymaxion quadrupole mass spectrometer (Altamira Instruments, Pittsburgh, Pennsylvania, USA). The sample (ca. 100.0 mg) was placed in a U-tube of quartz under an Ar flow of 10 cm3 min‒1 at atmospheric pressure. The system was first heated up to 110 °C (10 °C min‒1) and maintained at this temperature for 30 minutes to release physisorbed small molecules. Thereafter, the temperature was raised up to 950 °C (10 °C min‒1). The evolving gases were monitored with the mass spectrometer. CO and CO2-profiles were fitted according to Gaussian distribution. Peak areas were correlated to the amount of gas through a daily routine calibration that consisted of the injection of a given volume of pure gas using a calibrated loop [90].
XPS measurements were performed on a Physical Electronics 5700 spectrometer using the Mg-Kα line (1253.6 eV) from a PHI model 04-548 Dual Anode X-rays Source (Chanhassen, Minnesota, USA). The X-rays source was run at a power of 300 W (10 keV and 30 mA). The pressure inside the vacuum chamber was 5 × 10‒7 Pa. A Perkin Elmer 10-360 hemispherical analyzer (Eden Prairie, Minnesota, USA) with a multi-channel detector was employed. The samples were analyzed at an angle of 45° to the surface plane. BEs were referred to the C 1s line of adventitious carbon at 284.8 eV and determined with the resolution of ±0.1 eV. The spectra were fitted assuming a Gaussian-Lorentzian distribution for each peak.
HRTEM (high-resolution transmission electron microscopy) was carried out with a TALOS F200x instrument operating in STEM (scanning transmission electron microscopy) mode, equipped with a high-angle annular dark-field (HAADF) detector, at 200 kV and 200 nA (Thermo Fisher Scientific, Waltham, Massachusetts, EUA). The elemental mapping was carried out on an EDX Super-X system provided with 4 X-ray detectors and an X-FEG (field emission gun) beam (Thermo Fisher Scientific, Waltham, Massachusetts, EUA).
XRD diffractograms were obtained using a Ni-filtered Cu-Kα radiation (λ = 0.15406 nm). The analyses were usually carried out on a Rigaku instrument model Miniflex 300 (Akishima-shi, Tokyo, Japan).
The contents of acidic and basic groups of P54 were determined through a procedure adapted from the Boehm titration methodology [91]. To determine the basic groups, ~0.5 g of AC was added to an Erlenmeyer flask containing 50 mL of a standard HCl solution (∼0.100 mol L‒1). After stirring for 24 h at room temperature (~25 °C), the solid was filtered and aliquots of 10 mL of the filtrate were titrated against a standard NaOH solution (~0.100 mol L‒1). In turn, the contents of acidic groups were determined by backtitration: about 0.50 g of AC was added to an Erlenmeyer flask containing 50 mL of a standard solution of NaOH, NaHCO3 or Na2CO3 (∼0.100 mol L‒1). After magnetic stirring for 24 h and filtration, 10 mL aliquots of the filtrate were added to 15 mL of the standard HCl solution. Finally, the excess acid was titrated against the standard NaOH solution. Blank tests were performed following the same procedure, but without the contact with P54. Thus, the contents of acidic or basic groups were determined by considering the difference between the volumes of NaOH solution spent to reach the endpoint in the titrations of the sample and the blank. Measurements were taken in triplicate.
To interpret the data, it was assumed that: NaOH solution neutralizes all the acidic groups on the AC surface; Na2CO3 solution neutralizes strong and medium strength acidic groups; NaHCO3 solution neutralizes only strong acids. Therefore, (i) the amount of HCl consumed in the test with NaHCO3 corresponded to the content of strong acids. Furthermore, the difference between the amount of HCl consumed in the tests with: (ii) Na2CO3 and NaHCO3 corresponded to the content of medium strength acidic groups; (iii) NaOH and Na2CO3 corresponded to the content of weak acids.
It is usually assumed in the literature that strong, medium and weak acids correspond to carboxylic acids, lactones and phenols, respectively (see, just as few examples, references [92,93]). However, as stressed by Schönherr et al. [94], pKa values of acidic groups strongly depend on their chemical environment, so that a strict allocation of acidic functional groups to the reaction with specific bases can lead to misunderstandings. Therefore, in the present work, we opted to report the titration results in terms of the more general terms strong, medium strength and weak acidic groups, without making attributions to specific groups.
Another aspect that deserves to be highlighted is that anhydrides are usually neglected by the authors that employ titration to characterize the surface of ACs. Nevertheless, Schönherr et al. [94] reported that, in basic aqueous solution, anhydrides are hydrolyzed to render two carboxylic acids. Therefore, we infer that, besides carboxylic acids themselves, the content of strong acids reported in Table 4 also encompass two carboxylic acids that result from each anhydride group.
The total content of basic groups was determined through a similar procedure as above described for acidic groups, with some obvious modifications: the AC was put in contact with an acidic solution (HCl ∼0.100 mol L‒1); after filtration, the aliquots were titrated against a standard basic solution (NaOH ∼0.100 mol L‒1). It was assumed that HCl neutralizes all the AC surface basic groups. Therefore, the difference between the amount of NaOH spent in the titration of the blank acidic solution and the acidic solution remaining after the soaking with P54 corresponded to the total amount of basic groups on the AC surface.
3.4. HDO Tests
The feedstocks employed in the HDO tests were lauric acid (99.0%, Sigma Aldrich) and an extra virgin coconut oil (98%) (dr. Orgânico, Brazil). They were used without further purification. The tests were carried out in a cylindrical stainless-steel reactor with an internal volume of ~100 cm3. A scheme of the reactor was presented elsewhere [35]. Prior to the tests, the catalysts in the oxo form (0.500 g) were sulfided in situ with 0.500 mL of CS2 (PA, Vetec) at 400 °C (1 h) in H2 atmosphere (initial pressure of 30 bar). After sulfidation, the system was cooled and purged with N2. Then, 10.0 mL of feedstock were charged, the reactor was pressurized with H2 at 30 bar and heated to 340 °C. The heating from room temperature up to 340 °C took nearly 45 min. The time the temperature reached 340 °C was considered as the initial reaction time. After the target reaction time, the system was cooled to room temperature, which took around 60 min. Then, the liquid product was dried with Na2SO4 and separated by centrifugation.
3.5. Characterization of the Liquid Reaction Products
The liquid reaction products were qualitatively analyzed by GC/MS (gas chromatography/mass spectrometry) using a GC-17a chromatograph interfaced with a QP5050A spectrometer (Shimadzu, Kyoto, Japan). For quantitative analyses, GC/FID chromatograms were acquired on a GC-2010 equipment (Shimadzu, Kyoto, Japan). A Rtx-5MS polydimethylsiloxane column (30 m, 25 mm) was used in both GC/MS and GC/FID analyses. The AI determined according to the AOCS method Cd-3d-63-O. FTIR (Fourier transform infrared spectroscopy) spectra were acquired on an IR Prestige-21 spectrometer using a diamond ATR (attenuated total reflection) accessory and a DLATGS detector (Shimadzu, Kyoto, Japan).
4. Conclusions
In the present work, an AC produced from chemical activation of coconut shell with H3PO4 was employed as support of sulfided Mo-based catalysts aimed at the hydroprocessing of lipidic feedstocks. The effects of the catalyst preparation conditions on the properties and HDO activity of the resulting catalysts were systematically investigated.
Catalysts with high HDO activity were achieved. They presented good stability, permitting the accomplishment of several reaction cycles without significant loss of activity, since provided that the sulfidation degree was kept high. Ni acted as a promoter, increasing the catalyst HDO activity. Sulfidation proved to be an essential step to prevent cocking.
The catalyst with the highest activity was that one prepared through sequential deposition of Mo and Ni by wet impregnation. It presented activity for lauric acid HDO similar to that of an industrial sulfided NiMo/Al2O3 catalyst. However, in the case of the tests with coconut oil, the AC-supported catalyst was even more efficient than the Al2O3-supported one because the presence of mesopores in the prepared AC provided better access of bulky triglyceride molecules to the metallic active sites inside the pores network, thus favoring the initial step of hydrogenolysis to render the respective fatty acids.
Due to the low acidity of ACs, low degrees of cracking and isomerization were observed in the hydroprocessing tests with the AC-supported catalysts, so that the resulting products were mainly constituted by long-chain n-alkanes. Therefore, it is possible to infer that these catalysts are more interesting to be used in the production of diesel-like fuels. In turn, if the aim is to produce SAF, an additional step of cracking/isomerization has to be added to the process, or the obtained product has to me mixed with another fuel fraction with appropriate content of branched and aromatic alkanes.
Author Contributions
Conceptualization and methodology, M.J.P. and E.R.-C.; funding acquisition, M.J.P. and E.R.-C.; supervision, M.J.P; Formal analysis, M.J.P., A.M.D.F.J., R.D.B, M.S.T., W.D.N.M., D.B.-P and E.R.-C.; Investigation, A.M.D.F.J., R.D.B, M.S.T., W.D.N.M. and D.B.-P; writing—original draft preparation, M.J.P.; Writing - review & editing, A.M.D.F.J., R.D.B, W.D.N.M., E.R.-C. and D.B.-P.
Funding
D.B.-P and E.R.-C. thank to Spanish Ministry of Science and Innovation, project PID2021-126235OB-C32 funded by MCIN/ AEI/10.13039/501100011033/ and FEDER funds, and project TED2021-130756B-C31 funded by MCIN/AEI/10.13039/501100011033 and by “ERDF A way of making Europe” by the European Union Next Generation EU/PRTR. All authors thank CAPES (Brazilian Federal Agency for Support and Evaluation of Graduate Education, Brazil; Finance Code 001) for the financial support to this research.
Conflicts of Interest
The authors declare no conflicts of interest.
Abbreviations
The following abbreviations are used in this manuscript:
| AC | Activated carbon |
| ATR | Attenuated total reflection |
| BE | Binding energy |
| BET | Brunauer, Emmett e Teller |
| DR | Dubinin-Radushkevitch |
| EDX | Energy-dispersive X-ray |
| FEG | Field emission gun |
| FID | Flame ionization detector |
| FTIR | Fourier transform infrared spectroscopy |
| GC | Gas chromatography |
| GC | Gas chromatography |
| HAADF | High-angle annular dark-field |
| HDO | Hydrodeoxygenation |
| HEFA | Hydroprocessing of esters and fatty acids |
| HR | High-resolution |
| HRTEM | High-resolution transmission electron microscopy |
| HVO | Hydrotreated vegetable oil |
| ICP | Inductively coupled plasma |
| IUPAC | International Union of Pure and Applied Chemistry |
| JCPDS | Joint Committee on Powder Diffraction Standards |
| MS | Mass spectrometry |
| OES | Optical emission spectrometry |
| SAF | Sustainable aviation fuel |
| SPK | Synthetic paraffinic kerosene |
| SSA | Specific surface area |
| STEM | Scanning transmission electron microscopy |
| TEM | Transmission electron microscopy |
| TPD | Temperature-programmed desorption |
| Vmic | Micropores volume |
| Vmes | Mesopores volume |
| XPS | X-ray photoelectron spectroscopy |
| XRD | X-ray diffraction |
References
- Fregolente, P.B.L.; Maciel, M.R.W.; Oliveira, L.S. Removal of water content from biodiesel and diesel fuel using hydrogel adsorbents. Braz J Chem Eng 2015, 32, 895–901. [Google Scholar] [CrossRef]
- Fregolente, P. B. L.; Wolf Maciel, W. M.; Oliveira, L. S. Removal of Water Content From Biodiesel and Diesel Fuel Using Hydrogel Adsorbents. Braz. J. Chem. Eng. 2015, 32, 895–901. [Google Scholar] [CrossRef]
- Dwivedi, G.; Sharma, M. Cold Flow Behaviour of Biodiesel-A Review. Int. J. Ren. Energy Res. 2013, 3, 827–836. [Google Scholar]
- Ferrari, R. Ap.; Oliveira, V. da S.; Scabio, A. Oxidative Stability of Biodiesel from Soybean Oil Fatty Acid Ethyl Esters. Sci. Agric. 2005, 62, 291–295. [Google Scholar] [CrossRef]
- J. Prauchner, M.; D. Brandão, R.; M. de Freitas Júnior, A.; da C. Oliveira, S. Alternative Hydrocarbon Fuels, with Emphasis on Sustainable Jet Fuels. Revista Virtual de Química 2023, 15, 498–518. [Google Scholar] [CrossRef]
- Wei, H.; Liu, W.; Chen, X.; Yang, Q.; Li, J.; Chen, H. Renewable Bio-Jet Fuel Production for Aviation: A Review. Fuel 2019, 254, 115599. [Google Scholar] [CrossRef]
- Yang, J.; Xin, Z.; He, Q. (Sophia); Corscadden, K.; Niu, H. An Overview on Performance Characteristics of Bio-Jet Fuels. Fuel 2019, 237, 916–936. [Google Scholar] [CrossRef]
- Watson, M. J.; Machado, P. G.; da Silva, A. V.; Saltar, Y.; Ribeiro, C. O.; Nascimento, C. A. O.; Dowling, A. W. Sustainable Aviation Fuel Technologies, Costs, Emissions, Policies, and Markets: A Critical Review. J. Clean. Prod. 2024, 449, 141472. [Google Scholar] [CrossRef]
- Ribeiro, L. S.; Pereira, M. F. R. Sustainable Aviation Fuel Production through Catalytic Processing of Lignocellulosic Biomass Residues: A Perspective. Sustainability 2024, 16, 3038. [Google Scholar] [CrossRef]
- Díaz-Pérez, M. A.; Serrano-Ruiz, J. C. Catalytic Production of Jet Fuels from Biomass. Molecules 2020, 25, 802. [Google Scholar] [CrossRef]
- Peters, M. A.; Alves, C. T.; Onwudili, J. A. A Review of Current and Emerging Production Technologies for Biomass-Derived Sustainable Aviation Fuels. Energies (Basel) 2023, 16, 6100. [Google Scholar] [CrossRef]
- Amhamed, A. I.; Assaf, A. H. Al; Le Page, L. M.; Alrebei, O. F. Alternative Sustainable Aviation Fuel and Energy (SAFE)- A Review with Selected Simulation Cases of Study. Energy Reports 2024, 11, 3317–3344. [Google Scholar] [CrossRef]
- Song, M.; Zhang, X.; Chen, Y.; Zhang, Q.; Chen, L.; Liu, J.; Ma, L. Hydroprocessing of Lipids: An Effective Production Process for Sustainable Aviation Fuel. Energy 2023, 283, 129107. [Google Scholar] [CrossRef]
- Monteiro, R. R. C.; dos Santos, I. A.; Arcanjo, M. R. A.; Cavalcante, C. L.; de Luna, F. M. T.; Fernandez-Lafuente, R.; Vieira, R. S. Production of Jet Biofuels by Catalytic Hydroprocessing of Esters and Fatty Acids: A Review. Catalysts 2022, 12, 237. [Google Scholar] [CrossRef]
- Kim, S. K.; Han, J. Y.; Lee, H.; Yum, T.; Kim, Y.; Kim, J. Production of Renewable Diesel via Catalytic Deoxygenation of Natural Triglycerides: Comprehensive Understanding of Reaction Intermediates and Hydrocarbons. Appl Energy 2014, 116, 199–205. [Google Scholar] [CrossRef]
- Lam, J. E.; Mohamed, A. R.; Kay Lup, A. N.; Koh, M. K. Palm Fatty Acid Distillate Derived Biofuels via Deoxygenation: Properties, Catalysts and Processes. Fuel Proc. Techn. 2022, 236, 107394. [Google Scholar] [CrossRef]
- Mohammad, M.; Kandaramath Hari, T.; Yaakob, Z.; Chandra Sharma, Y.; Sopian, K. Overview on the Production of Paraffin Based-Biofuels via Catalytic Hydrodeoxygenation. Ren. Sust. Energy Reviews 2013, 22, 121–132. [Google Scholar] [CrossRef]
- Ding, S.; Parlett, C. M. A.; Fan, X. Recent Developments in Multifunctional Catalysts for Fatty Acid Hydrodeoxygenation as a Route towards Biofuels. Molecular Catalysis 2022, 523, 111492. [Google Scholar] [CrossRef]
- Rahmawati, Z.; Santoso, L.; McCue, A.; Azua Jamari, N. L.; Ninglasari, S. Y.; Gunawan, T.; Fansuri, H. Selectivity of Reaction Pathways for Green Diesel Production towards Biojet Fuel Applications. RSC Adv 2023, 13, 13698–13714. [Google Scholar] [CrossRef]
- Khan, S.; Kay Lup, A. N.; Qureshi, K. M.; Abnisa, F.; Wan Daud, W. M. A.; Patah, M. F. A. A Review on Deoxygenation of Triglycerides for Jet Fuel Range Hydrocarbons. J. Anal. Appl. Pyrolysis 2019, 140, 1–24. [Google Scholar] [CrossRef]
- Chen, S.; Zhou, G.; Miao, C. Green and Renewable Bio-Diesel Produce from Oil Hydrodeoxygenation: Strategies for Catalyst Development and Mechanism. Ren. Sust. Energy Reviews 2019, 101, 568–589. [Google Scholar] [CrossRef]
- Mahdi, H. I.; Bazargan, A.; McKay, G.; Azelee, N. I. W.; Meili, L. Catalytic Deoxygenation of Palm Oil and Its Residue in Green Diesel Production: A Current Technological Review. Chem. Eng. Res. Design 2021, 174, 158–187. [Google Scholar] [CrossRef]
- Mussa, N.-S.; Toshtay, K.; Capron, M. Catalytic Applications in the Production of Hydrotreated Vegetable Oil (HVO) as a Renewable Fuel: A Review. Catalysts 2024, 14, 452. [Google Scholar] [CrossRef]
- Pattanaik, B. P.; Misra, R. D. Effect of Reaction Pathway and Operating Parameters on the Deoxygenation of Vegetable Oils to Produce Diesel Range Hydrocarbon Fuels: A Review. Ren. Sust. Energy Reviews 2017, 73, 545–557. [Google Scholar] [CrossRef]
- Arun, N.; Sharma, R. V.; Dalai, A. K. Green Diesel Synthesis by Hydrodeoxygenation of Bio-Based Feedstocks: Strategies for Catalyst Design and Development. Ren. Sust. Energy Reviews 2015, 48, 240–255. [Google Scholar] [CrossRef]
- Mäki-Arvela, P.; Martínez-Klimov, M.; Murzin, D. Yu. Hydroconversion of Fatty Acids and Vegetable Oils for Production of Jet Fuels. Fuel 2021, 306, 121673. [Google Scholar] [CrossRef]
- Cheah, K. W.; Yusup, S.; Loy, A. C. M.; How, B. S.; Skoulou, V.; Taylor, M. J. Recent Advances in the Catalytic Deoxygenation of Plant Oils and Prototypical Fatty Acid Models Compounds: Catalysis, Process, and Kinetics. Molecular Catalysis 2022, 523, 111469. [Google Scholar] [CrossRef]
- Zhao, X.; Wei, L.; Cheng, S.; Julson, J. Review of Heterogeneous Catalysts for Catalytically Upgrading Vegetable Oils into Hydrocarbon Biofuels. Catalysts 2017, 7, 83. [Google Scholar] [CrossRef]
- Gosselink, R. W.; Hollak, S. A. W.; Chang, S.; van Haveren, J.; de Jong, K. P.; Bitter, J. H.; van Es, D. S. Reaction Pathways for the Deoxygenation of Vegetable Oils and Related Model Compounds. ChemSusChem 2013, 6, 1576–1594. [Google Scholar] [CrossRef]
- Ooi, X. Y.; Gao, W.; Ong, H. C.; Lee, H. V.; Juan, J. C.; Chen, W. H.; Lee, K. T. Overview on Catalytic Deoxygenation for Biofuel Synthesis Using Metal Oxide Supported Catalysts. Ren. Sust. Energy Reviews 2019, 112, 834–852. [Google Scholar] [CrossRef]
- Mishra, R. K.; Jaya Prasanna Kumar, D.; Sankannavar, R.; Binnal, P.; Mohanty, K. Hydro-Deoxygenation of Pyrolytic Oil Derived from Pyrolysis of Lignocellulosic Biomass: A Review. Fuel 2024, 360, 130473. [Google Scholar] [CrossRef]
- Yücel, S. B.; Donar, Y. O.; Ergenekon, S.; Özoylumlu, B.; Sinağ, A. Green Catalyst for Clean Fuel Production via Hydrodeoxygenation. Turk. J. Chem. 2023, 47, 968–990. [Google Scholar] [CrossRef] [PubMed]
- Sharma, V.; Getahun, T.; Verma, M.; Villa, A.; Gupta, N. Carbon Based Catalysts for the Hydrodeoxygenation of Lignin and Related Molecules: A Powerful Tool for the Generation of Non-Petroleum Chemical Products Including Hydrocarbons. Ren. Sust. Energy Reviews 2020, 133, 110280. [Google Scholar] [CrossRef]
- Itthibenchapong, V.; Srifa, A.; Kaewmeesri, R.; Kidkhunthod, P.; Faungnawakij, K. Deoxygenation of Palm Kernel Oil to Jet Fuel-like Hydrocarbons Using Ni-MoS 2 / γ -Al 2 O 3 Catalysts. Energy Conv. Manag. 2017, 134, 188–196. [Google Scholar] [CrossRef]
- Wang, H.; Rogers, K.; Zhang, H.; Li, G.; Pu, J.; Zheng, H.; Lin, H.; Zheng, Y.; Ng, S. The Effects of Catalyst Support and Temperature on the Hydrotreating of Waste Cooking Oil (WCO) over CoMo Sulfided Catalysts. Catalysts 2019, 9, 689. [Google Scholar] [CrossRef]
- Brandão, R. D.; de Freitas Júnior, A. M.; Oliveira, S. C.; Suarez, P. A. Z.; Prauchner, M. J. The Conversion of Coconut Oil into Hydrocarbons within the Chain Length Range of Jet Fuel. Biomass Conv. Bioref. 2021, 11, 837–847. [Google Scholar] [CrossRef]
- Seo, D.-J.; Lee, J. B.; Kim, Y.-J.; Cho, H.-R.; Kim, S.-Y.; Kim, G.-E.; Park, Y.-D.; Kim, G.-H.; An, J.-C.; Oh, K.; Park, J.-I. The Characteristics of Hydrodeoxygenation of Biomass Pyrolysis Oil over Alumina-Supported NiMo Catalysts. Catalysts 2024, 15, 6. [Google Scholar] [CrossRef]
- Eller, Z.; Varga, Z.; Hancsók, J. Renewable Jet Fuel from Kerosene/Coconut Oil Mixtures with Catalytic Hydrogenation. Energy & Fuels 2019, 33, 6444–6453. [Google Scholar]
- Verma, V.; Mishra, A.; Anand, M.; Farooqui, S. A.; Sinha, A. K. Catalytic Hydroprocessing of Waste Cooking Oil for the Production of Drop-in Aviation Fuel and Optimization for Improving Jet Biofuel Quality in a Fixed Bed Reactor. Fuel 2023, 333, 126348. [Google Scholar] [CrossRef]
- Şenol, O. İ.; Viljava, T.-R.; Krause, A. O. I. Hydrodeoxygenation of Aliphatic Esters on Sulphided NiMo/γ-Al2O3 and CoMo/γ-Al2O3 Catalyst: The Effect of Water. Catalysis Today 2005, 106, 186–189. [Google Scholar] [CrossRef]
- Kaluža, L.; Soukup, K.; Koštejn, M.; Karban, J.; Palcheva, R.; Laube, M.; Gulková, D. On Stability of High-Surface-Area Al2O3, TiO2, SiO2-Al2O3, and Activated Carbon Supports during Preparation of NiMo Sulfide Catalysts for Parallel Deoxygenation of Octanoic Acid and Hydrodesulfurization of 1-Benzothiophene. Catalysts 2022, 12, 1559. [Google Scholar] [CrossRef]
- Bara, C.; Lamic-Humblot, A.-F.; Fonda, E.; Gay, A.-S.; Taleb, A.-L.; Devers, E.; Digne, M.; Pirngruber, G. D.; Carrier, X. Surface-Dependent Sulfidation and Orientation of MoS2 Slabs on Alumina-Supported Model Hydrodesulfurization Catalysts. J. Catal. 2016, 344, 591–605. [Google Scholar] [CrossRef]
- Topsøe, H. The Role of Co–Mo–S Type Structures in Hydrotreating Catalysts. Appl. Catal. A Gen 2007, 322, 3–8. [Google Scholar] [CrossRef]
- Tuxen, A.; Gøbel, H.; Hinnemann, B.; Li, Z.; Knudsen, K. G.; Topsøe, H.; Lauritsen, J. V.; Besenbacher, F. An Atomic-Scale Investigation of Carbon in MoS2 Hydrotreating Catalysts Sulfided by Organosulfur Compounds. J. Catal. 2011, 281, 345–351. [Google Scholar] [CrossRef]
- Laurent, E.; Delmon, B. Influence of Water in the Deactivation of a Sulfided Catalyst during Hydrodeoxygenation. J. Catal. 1994, 146, 281–291. [Google Scholar] [CrossRef]
- Cheng, S.; Wei, L.; Zhao, X.; Julson, J. Application, Deactivation, and Regeneration of Heterogeneous Catalysts in Bio-Oil Upgrading. Catalysts 2016, 6, 195. [Google Scholar] [CrossRef]
- He, Z.; Wang, X. Hydrodeoxygenation of Model Compounds and Catalytic Systems for Pyrolysis Bio-Oils Upgrading. Catal. Sust. Energy 2012, 1. [Google Scholar] [CrossRef]
- Kordouli, E.; Kordulis, Ch.; Lycourghiotis, A.; Cole, R.; Vasudevan, P. T.; Pawelec, B.; Fierro, J. L. G. HDO Activity of Carbon-Supported Rh, Ni and Mo-Ni Catalysts. Molecular Catalysis 2017, 441, 209–220. [Google Scholar] [CrossRef]
- Mahene, W. L.; Kivevele, T.; Machunda, R. The Role of Textural Properties and Surface Chemistry of Activated Carbon Support in Catalytic Deoxygenation of Triglycerides into Renewable Diesel. Catal. Commun. 2023, 181, 106737. [Google Scholar] [CrossRef]
- Coumans, A. E.; Hensen, E. J. M. A Real Support Effect on the Hydrodeoxygenation of Methyl Oleate by Sulfided NiMo Catalysts. Catal. Today 2017, 298, 181–189. [Google Scholar] [CrossRef]
- de la Puente, G.; Gil, A.; Pis, J. J.; Grange, P. Effects of Support Surface Chemistry in Hydrodeoxygenation Reactions over CoMo/Activated Carbon Sulfided Catalysts. Langmuir 1999, 15, 5800–5806. [Google Scholar] [CrossRef]
- He, W.; Hu, A.; Qiu, L.; Wang, W.; Xiang, Y.; Han, W.; Xu, G.; Zhang, L.; Zheng, A. Insight into the Microstructure and Deactivation Effects on Commercial NiMo/γ-Al2O3 Catalyst through Aberration-Corrected Scanning Transmission Electron Microscopy. Catalysts 2019, 9, 810. [Google Scholar] [CrossRef]
- Busca, G. Acid Catalysts in Industrial Hydrocarbon Chemistry. Chem. Rev. 2007, 107, 5366–5410. [Google Scholar] [CrossRef]
- Prauchner, M. J.; Sapag, K.; Rodríguez-Reinoso, F. Tailoring Biomass-Based Activated Carbon for CH4 Storage by Combining Chemical Activation with H3PO4 or ZnCl2 and Physical Activation with CO2. Carbon N Y 2016, 110, 138–147. [Google Scholar] [CrossRef]
- Prauchner, M. J.; Oliveira, S. da C.; Rodríguez-Reinoso, F. Tailoring Low-Cost Granular Activated Carbons Intended for CO2 Adsorption. Front Chem 2020, 8. [Google Scholar] [CrossRef] [PubMed]
- Oliveira, S. C.; Dutra, R. C.; León, J. J. L.; Martins, G. A. V.; Silva, A. M. A.; Azevedo, D. C. S.; Santiago, R. G.; Ballesteros Plata, D.; Rodríguez-Castellón, E.; Prauchner, M. J. Activated Carbon Ammonization: Effects of the Chemical Composition of the Starting Material and the Treatment Temperature. C 2025, 11, 15. [Google Scholar] [CrossRef]
- van Veen, J. A. R.; Gerkema, E.; van der Kraan, A. M.; Knoester, A. A Real Support Effect on the Activity of Fully Sulphided CoMoS for the Hydrodesulphurization of Thiophene. J. Chem. Soc. Chem. Commun. 1987, 22, 1684. [Google Scholar] [CrossRef]
- Topsøe, H.; Clausen, B. S. Active Sites and Support Effects in Hydrodesulfurization Catalysts. Appl. Catal. 1986, 25, 273–293. [Google Scholar] [CrossRef]
- Dugulan, A. I.; van Veen, J. A. R.; Hensen, E. J. M. On the Structure and Hydrotreating Performance of Carbon-Supported CoMo- and NiMo-Sulfides. Appl. Catal. B 2013, 142–143, 178–186. [Google Scholar] [CrossRef]
- TAN, Z.; XIAO, H.; ZHANG, R.; ZHANG, Z.-S.; Kaliaguine, S. Potential to Use Mesoporous Carbon as Catalyst Support for Hydrodesulfurization. New Carbon Materials 2009, 24, 333–343. [Google Scholar] [CrossRef]
- Rambabu, N.; Badoga, S.; Soni, K. K.; Dalai, A. K.; Adjaye, J. Hydrotreating of Light Gas Oil Using a NiMo Catalyst Supported on Activated Carbon Produced from Fluid Petroleum Coke. Front. Chem. Sci. Eng. 2014, 8, 161–170. [Google Scholar] [CrossRef]
- Kouzu, M.; Kuriki, Y.; Hamdy, F.; Sakanishi, K.; Sugimoto, Y.; Saito, I. Catalytic Potential of Carbon-Supported NiMo-Sulfide for Ultra-Deep Hydrodesulfurization of Diesel Fuel. Appl. Catal. A. 2004, 265, 61–67. [Google Scholar] [CrossRef]
- Mukundan, S.; Konarova, M.; Atanda, L.; Ma, Q.; Beltramini, J. Guaiacol Hydrodeoxygenation Reaction Catalyzed by Highly Dispersed, Single Layered MoS2/C. Catal. Sci. Technol. 2015, 5, 4422–4432. [Google Scholar] [CrossRef]
- Ospina, V.; Buitrago, R.; Lopez, D. P. HDO Del Guaiacol Mediante El Uso de Catalizadores NiMo Soportados Sobre Carbón Activado Obtenido a Partir de La Torta de Higuerilla. Ingeniería e Investigación 2015, 35, 49–55. [Google Scholar] [CrossRef]
- Tapia, J.; Acelas, N. Y.; López, D.; Moreno, A. NiMo-Sulfide Supported on Activated Carbon to Produce Renewable Diesel. Univ. Sci. 2017, 22, 71. [Google Scholar] [CrossRef]
- Ferreira, K. K.; Ribeiro, L. S.; Pereira, M. F. R. Analysis of Reaction Conditions in Palmitic Acid Deoxygenation for Fuel Production. Catalysts 2024, 14, 853. [Google Scholar] [CrossRef]
- Prauchner, M. J.; Rodríguez-Reinoso, F. Chemical versus Physical Activation of Coconut Shell: A Comparative Study. Microp. Mesop. Mat. 2012, 152, 163–171. [Google Scholar] [CrossRef]
- Thommes, M.; Kaneko, K.; Neimark, A. V.; Olivier, J. P.; Rodriguez-Reinoso, F.; Rouquerol, J.; Sing, K. S. W. Physisorption of Gases, with Special Reference to the Evaluation of Surface Area and Pore Size Distribution (IUPAC Technical Report). Pure and Applied Chemistry 2015, 87, 1051–1069. [Google Scholar] [CrossRef]
- Biesinger, M. C. Accessing the Robustness of Adventitious Carbon for Charge Referencing (Correction) Purposes in XPS Analysis: Insights from a Multi-User Facility Data Review. Appl. Surf. Sci. 2022, 597, 153681. [Google Scholar] [CrossRef]
- Ishii, T.; Ozaki, J. Understanding the Chemical Structure of Carbon Edge Sites by Using Deuterium-Labeled Temperature-Programmed Desorption Technique. Carbon N Y 2020, 161, 343–349. [Google Scholar] [CrossRef]
- Düngen, P.; Schlögl, R.; Heumann, S. Non-Linear Thermogravimetric Mass Spectrometry of Carbon Materials Providing Direct Speciation Separation of Oxygen Functional Groups. Carbon N Y 2018, 130, 614–622. [Google Scholar] [CrossRef]
- Rathnasamy, R.; Thangamuthu, R.; Alagan, V. Sheet-like Orthorhombic MoO3 Nanostructures Prepared via Hydrothermal Approach for Visible-Light-Driven Photocatalytic Application. Res. Chem. Interm. 2018, 44, 1647–1660. [Google Scholar] [CrossRef]
- Alam, U.; Kumar, S.; Bahnemann, D.; Koch, J.; Tegenkamp, C.; Muneer, M. Harvesting Visible Light with MoO3 Nanorods Modified by Fe(iii) Nanoclusters for Effective Photocatalytic Degradation of Organic Pollutants. Physical Chemistry Chemical Physics 2018, 20, 4538–4545. [Google Scholar] [CrossRef]
- Liu, H.; Hu, H.; Wang, J.; Niehoff, P.; He, X.; Paillard, E.; Eder, D.; Winter, M.; Li, J. Hierarchical Ternary MoO2/MoS2/Heteroatom-Doped Carbon Hybrid Materials for High-Performance Lithium-Ion Storage. ChemElectroChem 2016, 3, 922–932. [Google Scholar] [CrossRef]
- Samaniego-Benitez, J. E.; Mendoza-Cruz, R.; Bazán-Díaz, L.; Garcia-Garcia, A.; Arellano-Jimenez, M. J.; Perez-Robles, J. F.; Plascencia-Villa, G.; Velázquez-Salazar, J. J.; Ortega, E.; Favela-Camacho, S. E.; José-Yacamán, M. Synthesis and Structural Characterization of MoS2 Micropyramids. J. Mater. Sci. 2020, 55, 12203–12213. [Google Scholar] [CrossRef]
- Zhang, X.; Ke, Y.; Wang, T.; Cai, J.; Huang, Q.; Lin, S. Green Synthesis of Flowerball-like MoS2/VC Nanocomposite and Its Efficient Catalytic Performance for Oxygen Reduction Either in Alkaline or Acid Media. Catalysts 2022, 12, 259. [Google Scholar] [CrossRef]
- 76 Basha, I. K.; Abd El-Monaem, E. M.; Khalifa, R. E.; Omer, A. M.; Eltaweil, A. S. Sulfonated Graphene Oxide Impregnated Cellulose Acetate Floated Beads for Adsorption of Methylene Blue Dye: Optimization Using Response Surface Methodology. Sci. Rep. 2022, 12, 9339. [Google Scholar] [CrossRef] [PubMed]
- Cant, D. J. H.; Syres, K. L.; Lunt, P. J. B.; Radtke, H.; Treacy, J.; Thomas, P. J.; Lewis, E. A.; Haigh, S. J.; O’Brien, P.; Schulte, K.; Bondino, F.; Magnano, E.; Flavell, W. R. Surface Properties of Nanocrystalline PbS Films Deposited at the Water–Oil Interface: A Study of Atmospheric Aging. Langmuir 2015, 31, 1445–1453. [Google Scholar] [CrossRef] [PubMed]
- Silva, C. A. A.; Silva, C. F.; Matos, J. M. E. Síntese, Caracterização e Aplicação Do Trióxido de Molibdênio Na Fotocatálise de Efluente Têxtil Sintético. Cerâmica 2018, 64, 454–465. [Google Scholar] [CrossRef]
- Alves Silva Lucena de Medeiros, S.; Flávia Félix Farias, A.; Maria Garcia dos Santos, I. Synthesis of Molybdenum Trioxide with Different Structures and Microstructures by the Modified Pechini Method: A New Methodological Approach. Revista Virtual de Química 2021, 13, 494–508. [Google Scholar] [CrossRef]
- Byskov, L. S.; Hammer, B.; Nørskov, J. K.; Clausen, B. S.; Topsøe, H. Sulfur Bonding in MoS2 and Co-Mo-S Structures. Catal. Letters 1997, 47, 177–182. [Google Scholar] [CrossRef]
- Romero, Y.; Richard, F.; Brunet, S. Hydrodeoxygenation of 2-Ethylphenol as a Model Compound of Bio-Crude over Sulfided Mo-Based Catalysts: Promoting Effect and Reaction Mechanism. Appl. Catal. B 2010, 98, 213–223. [Google Scholar] [CrossRef]
- Marcos, J. Prauchner, Ruana D. Brandão, Antônio M. de Freitas Júnior, Silvia da C. Oliveira. Combustíveis Derivados do Petróleo: Obtenção, Propriedades e Usos. Revista Virtual de Química. 2023, 15, 43–60 [CrossRef]. [Google Scholar]
- Lokesh, K.; Sethi, V.; Nikolaidis, T.; Goodger, E.; Nalianda, D. Life Cycle Greenhouse Gas Analysis of Biojet Fuels with a Technical Investigation into Their Impact on Jet Engine Performance. Biomass Bioenergy 2015, 77, 26–44. [Google Scholar] [CrossRef]
- Ojagh, H.; Creaser, D.; Tamm, S.; Arora, P.; Nyström, S.; Lind Grennfelt, E.; Olsson, L. Effect of Dimethyl Disulfide on Activity of NiMo Based Catalysts Used in Hydrodeoxygenation of Oleic Acid. Ind. Eng. Chem. Res. 2017, 56, 5547–5557. [Google Scholar] [CrossRef]
- Bykova, E. S.; Nadeina, K. A.; Vatutina, Y. V.; Chesalov, Y. A.; Pakharukova, V. P.; Larina, T. V.; Prosvirin, I. P.; Gerasimov, E. Y.; Klimov, O. V.; Noskov, A. S. The Impact of the Water Phase in the Gasoil Fraction on the CoMo Hydrotreating Catalyst’s Performance. Fuel 2024, 365, 131229. [Google Scholar] [CrossRef]
- Gong, S.; Shinozaki, A.; Shi, M.; Qian, E. W. Hydrotreating of Jatropha Oil over Alumina Based Catalysts. Energy & Fuels 2012, 26, 2394–2399. [Google Scholar]
- Kubička, D.; Horáček, J. Deactivation of HDS Catalysts in Deoxygenation of Vegetable Oils. Appl. Catal. A 2011, 394, 9–17. [Google Scholar] [CrossRef]
- Bezergianni, S.; Dimitriadis, A.; Kalogianni, A.; Pilavachi, P. A. Hydrotreating of Waste Cooking Oil for Biodiesel Production. Part I: Effect of Temperature on Product Yields and Heteroatom Removal. Bior. Tech. 2010, 101, 6651–6656. [Google Scholar] [CrossRef]
- Žula, M.; Grilc, M.; Likozar, B. Hydrocracking, Hydrogenation and Hydro-Deoxygenation of Fatty Acids, Esters and Glycerides: Mechanisms, Kinetics and Transport Phenomena. Chem. Eng. J. 2022, 444, 136564. [Google Scholar] [CrossRef]
- Rocha, R. P.; Pereira, M. F. R.; Figueiredo, J. L. Characterisation of the Surface Chemistry of Carbon Materials by Temperature-Programmed Desorption: An Assessment. Catalysis Today 2023, 418, 114136. [Google Scholar] [CrossRef]
- Boehm, H. P. Surface Oxides on Carbon and Their Analysis: A Critical Assessment. Carbon N Y 2002, 40, 145–149. [Google Scholar] [CrossRef]
- Wu, H.; Lu, W.; Chen, Y.; Zhang, P.; Cheng, X. Application of Boehm Titration for the Quantitative Measurement of Soot Oxygen Functional Groups. Energy & Fuels 2020, 34, 7363–7372. [Google Scholar]
- Juan, Z.; Kaixuan, F.; Pingping, W.; Yue, Z.; Yongke, Z. Enhancement of the Adsorption of Bilirubin on Activated Carbon via Modification. Results in Materials 2021, 9, 100172. [Google Scholar] [CrossRef]
- Schönherr, J.; Buchheim, J. R.; Scholz, P.; Adelhelm, P. Boehm Titration Revisited (Part II): A Comparison of Boehm Titration with Other Analytical Techniques on the Quantification of Oxygen-Containing Surface Groups for a Variety of Carbon Materials. C 2018, 4, 22. [Google Scholar] [CrossRef]
Figure 1.
Main reactions taking place in the hydroprocessing of fatty acids (R represents a saturated or unsaturated hydrocarbon chain).
Figure 1.
Main reactions taking place in the hydroprocessing of fatty acids (R represents a saturated or unsaturated hydrocarbon chain).
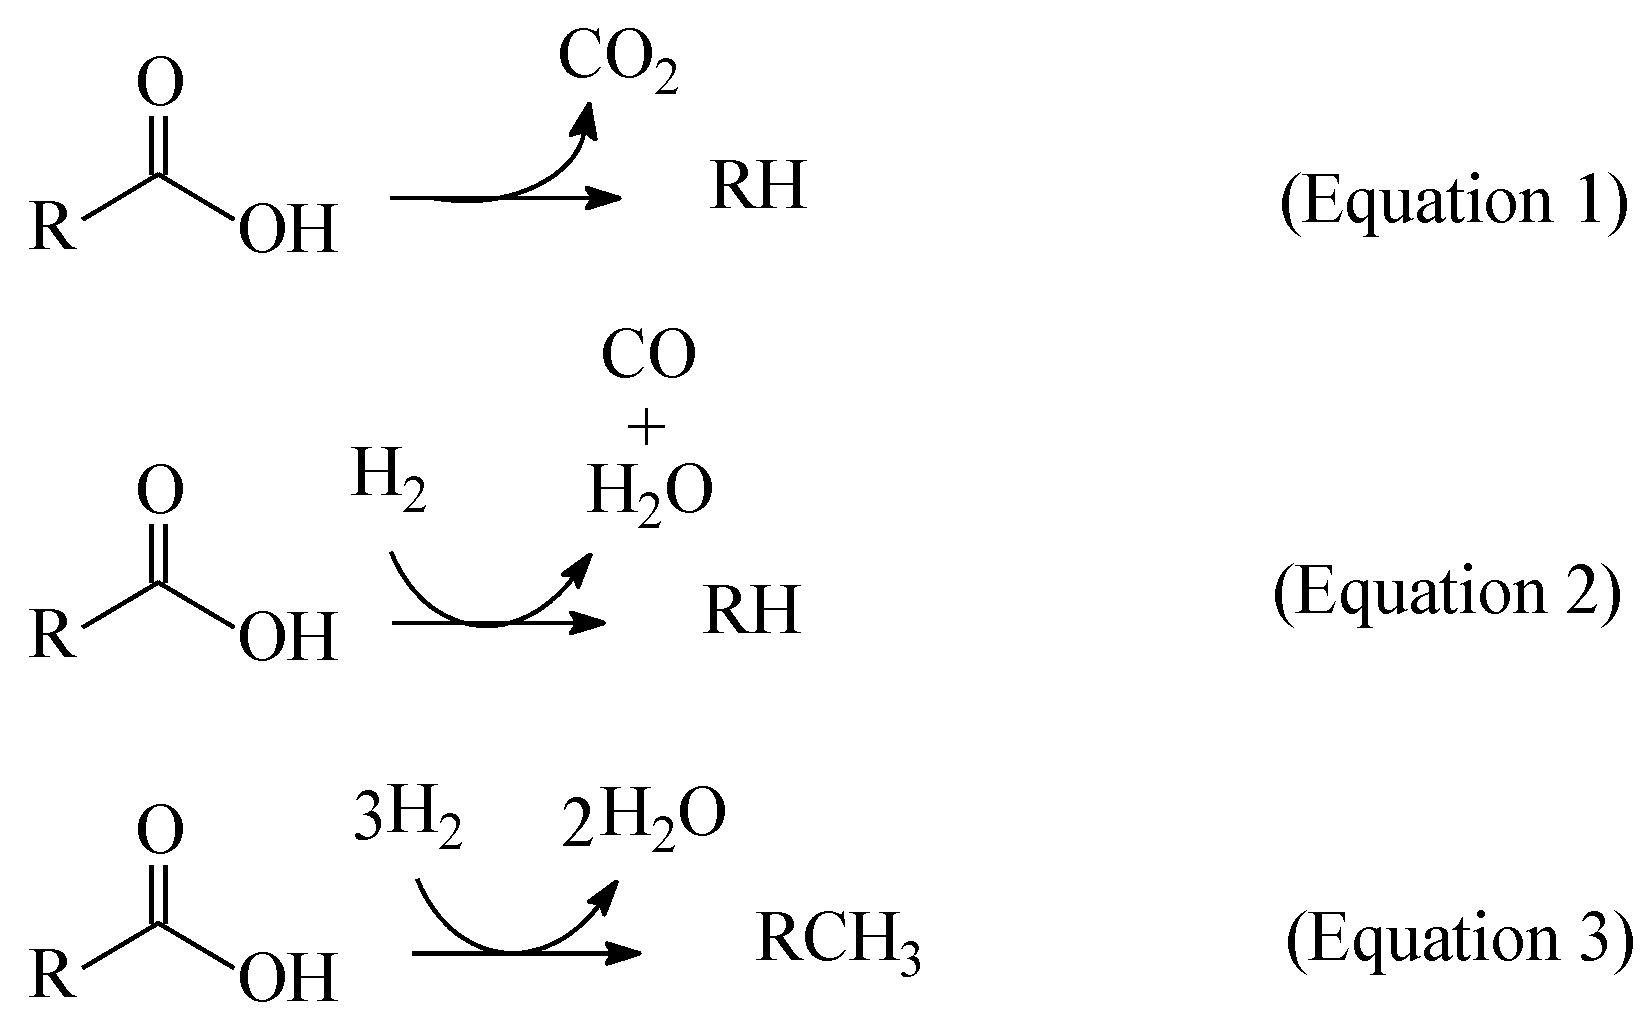
Figure 2.
N2 adsorption-desorption isotherms of P54 and some selected oxo-catalysts. (Closed and open symbols correspond to the adsorption and desorption branches, respectively)
Figure 2.
N2 adsorption-desorption isotherms of P54 and some selected oxo-catalysts. (Closed and open symbols correspond to the adsorption and desorption branches, respectively)
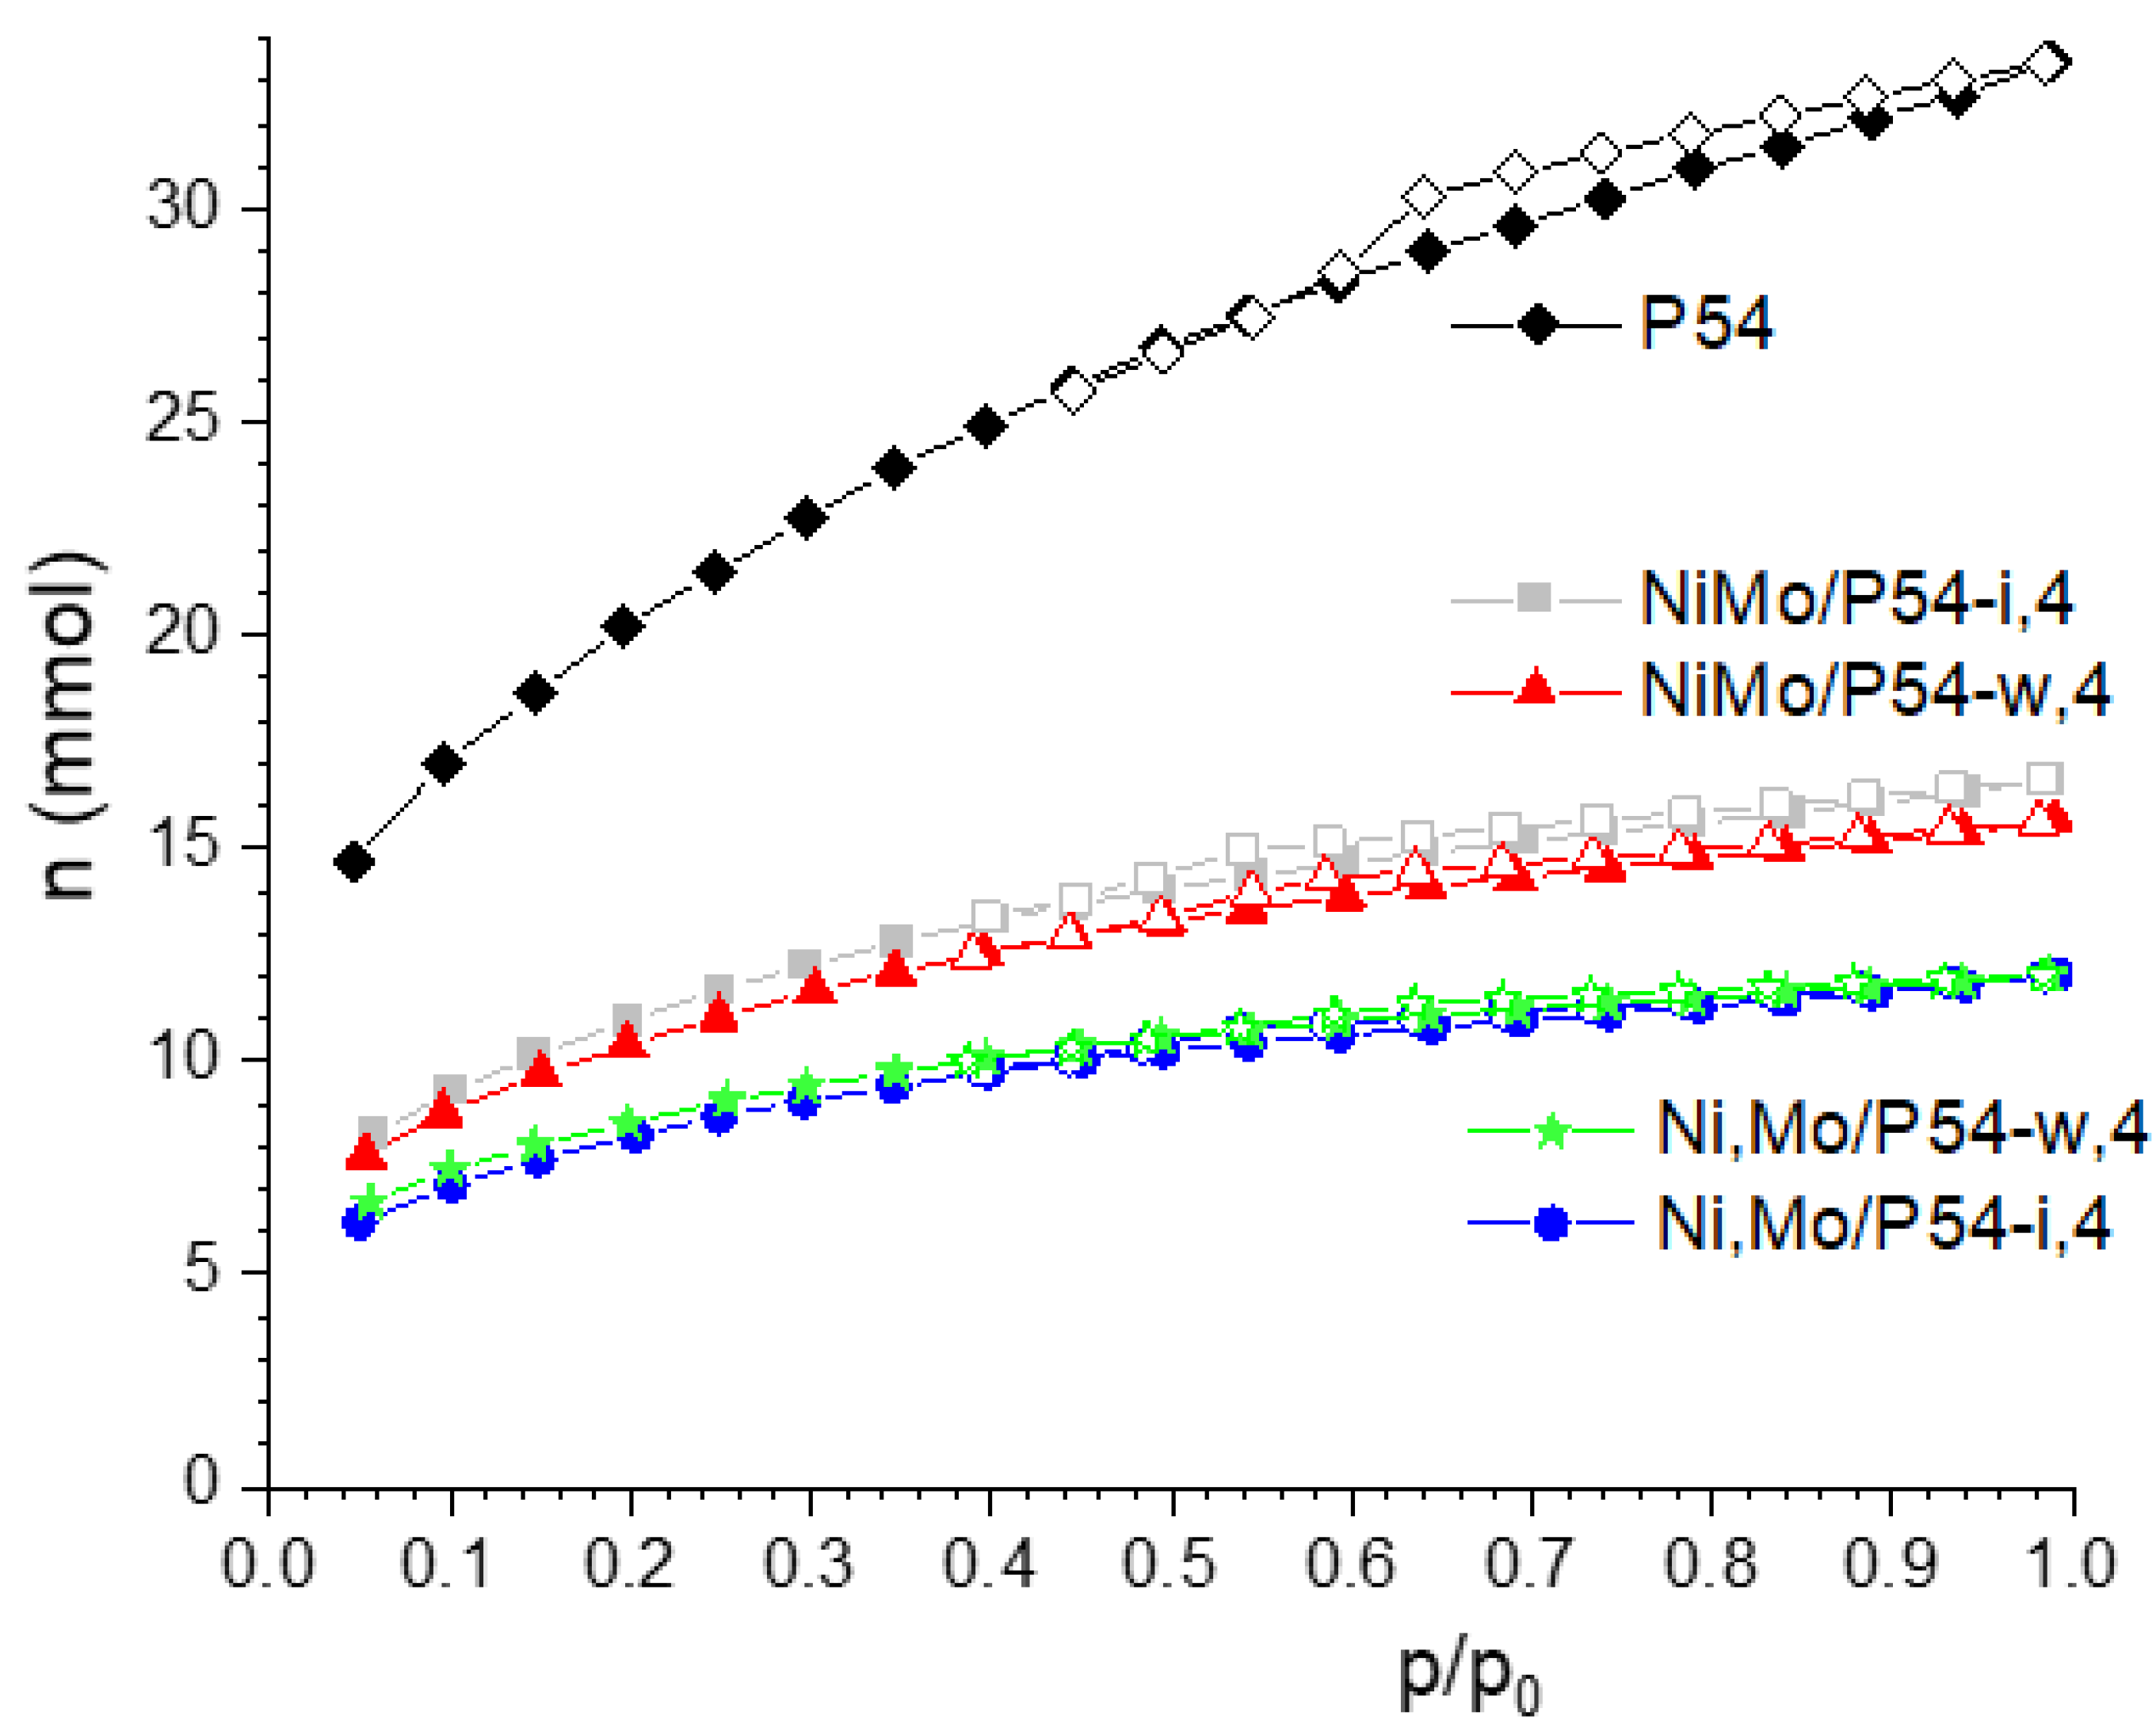
Figure 3.
XPS survey spectra of P54.
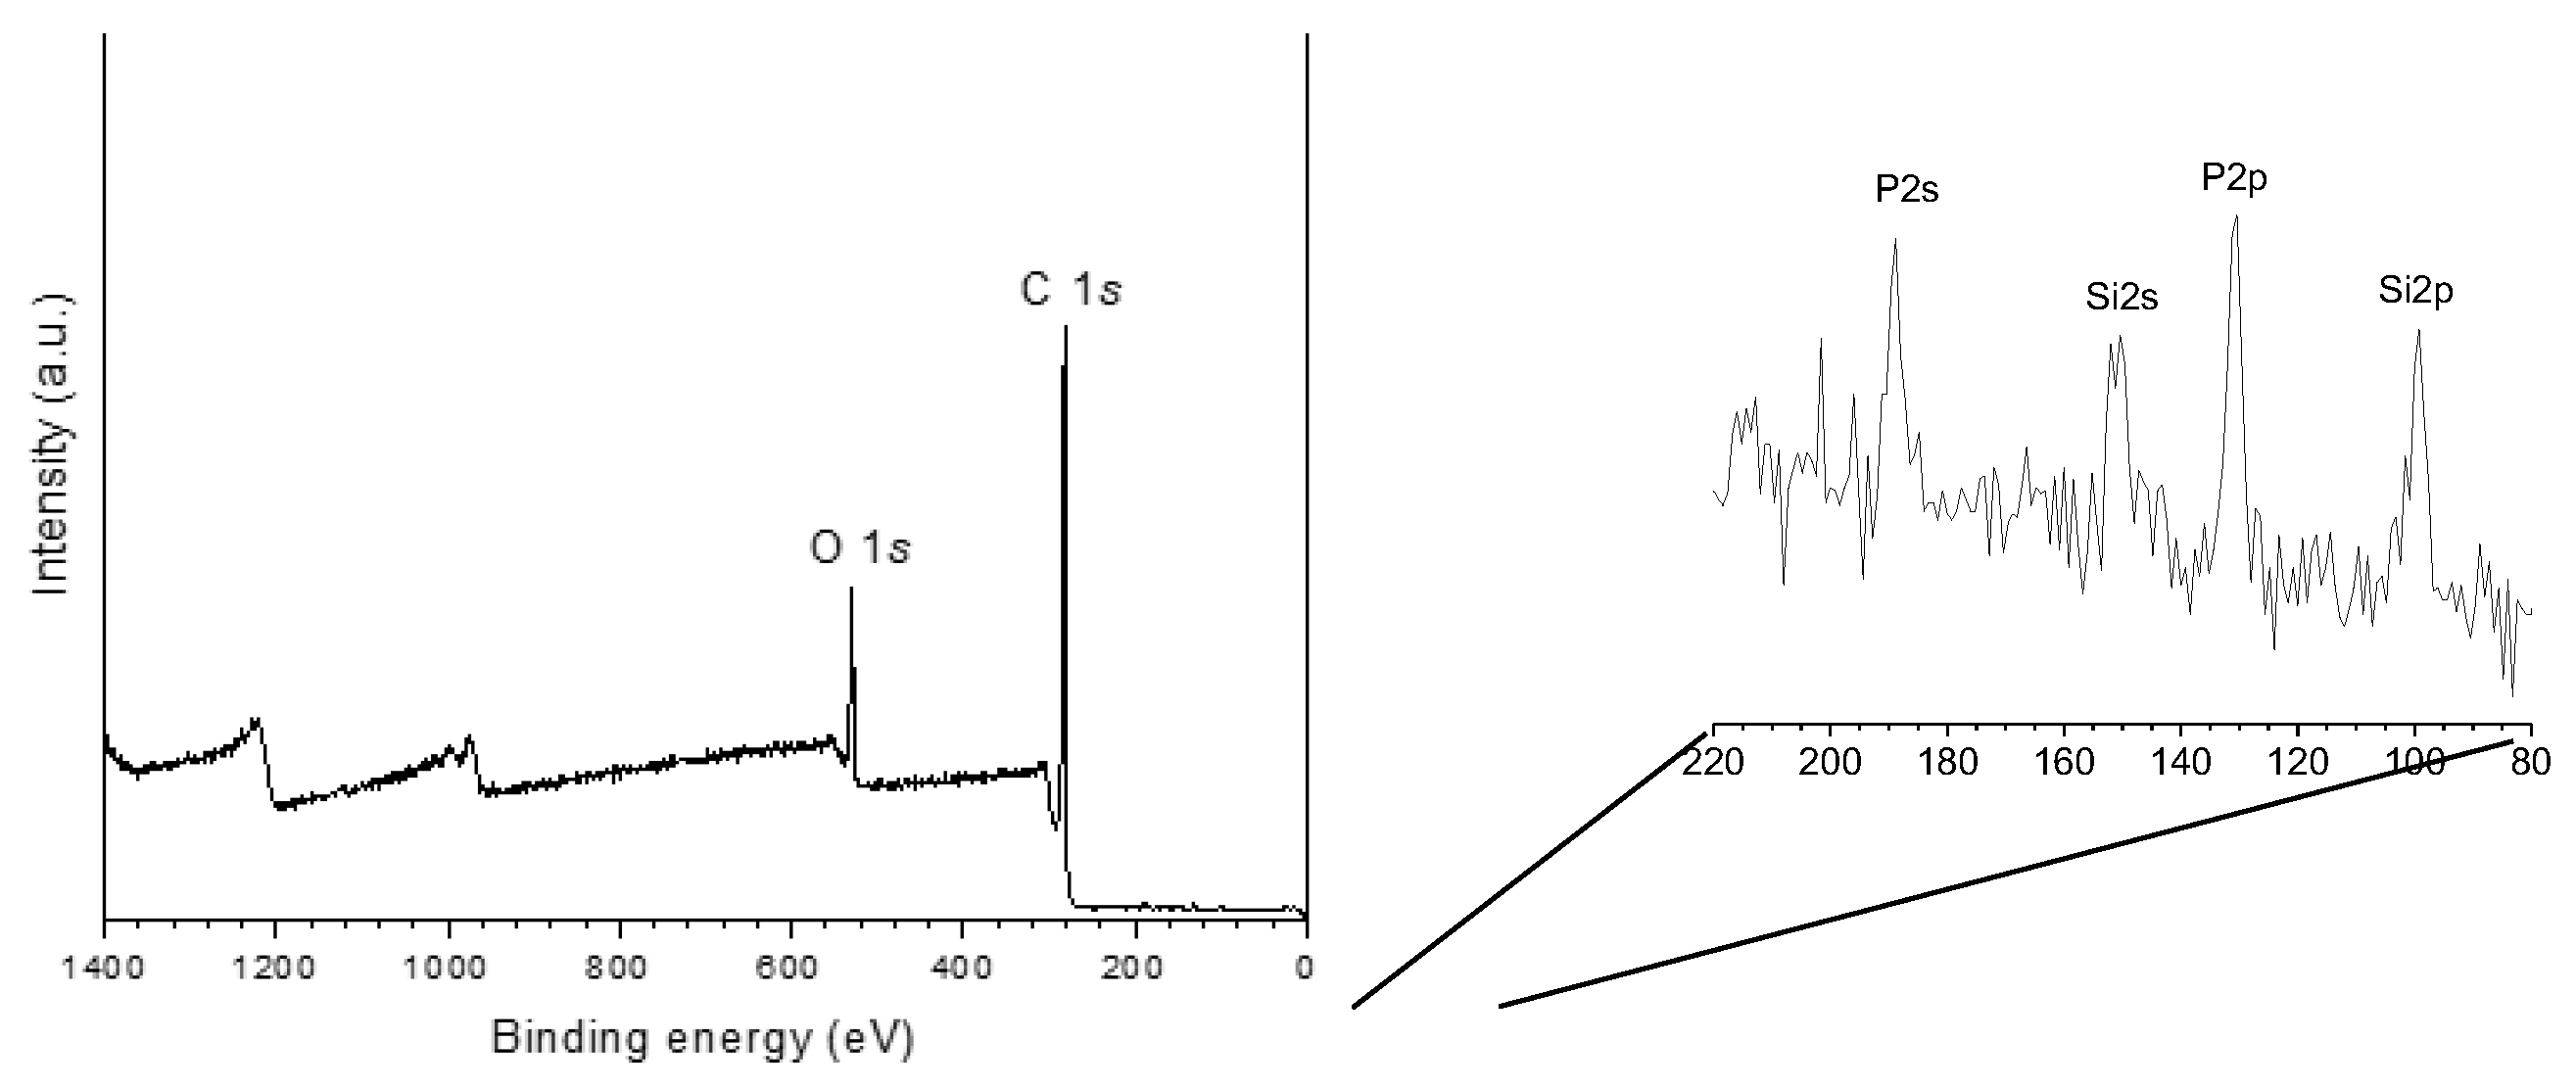
Figure 4.
HR-XPS (a) C 1s and (b) O 1s core level spectra of P54 with respective deconvoluted peaks.
Figure 4.
HR-XPS (a) C 1s and (b) O 1s core level spectra of P54 with respective deconvoluted peaks.
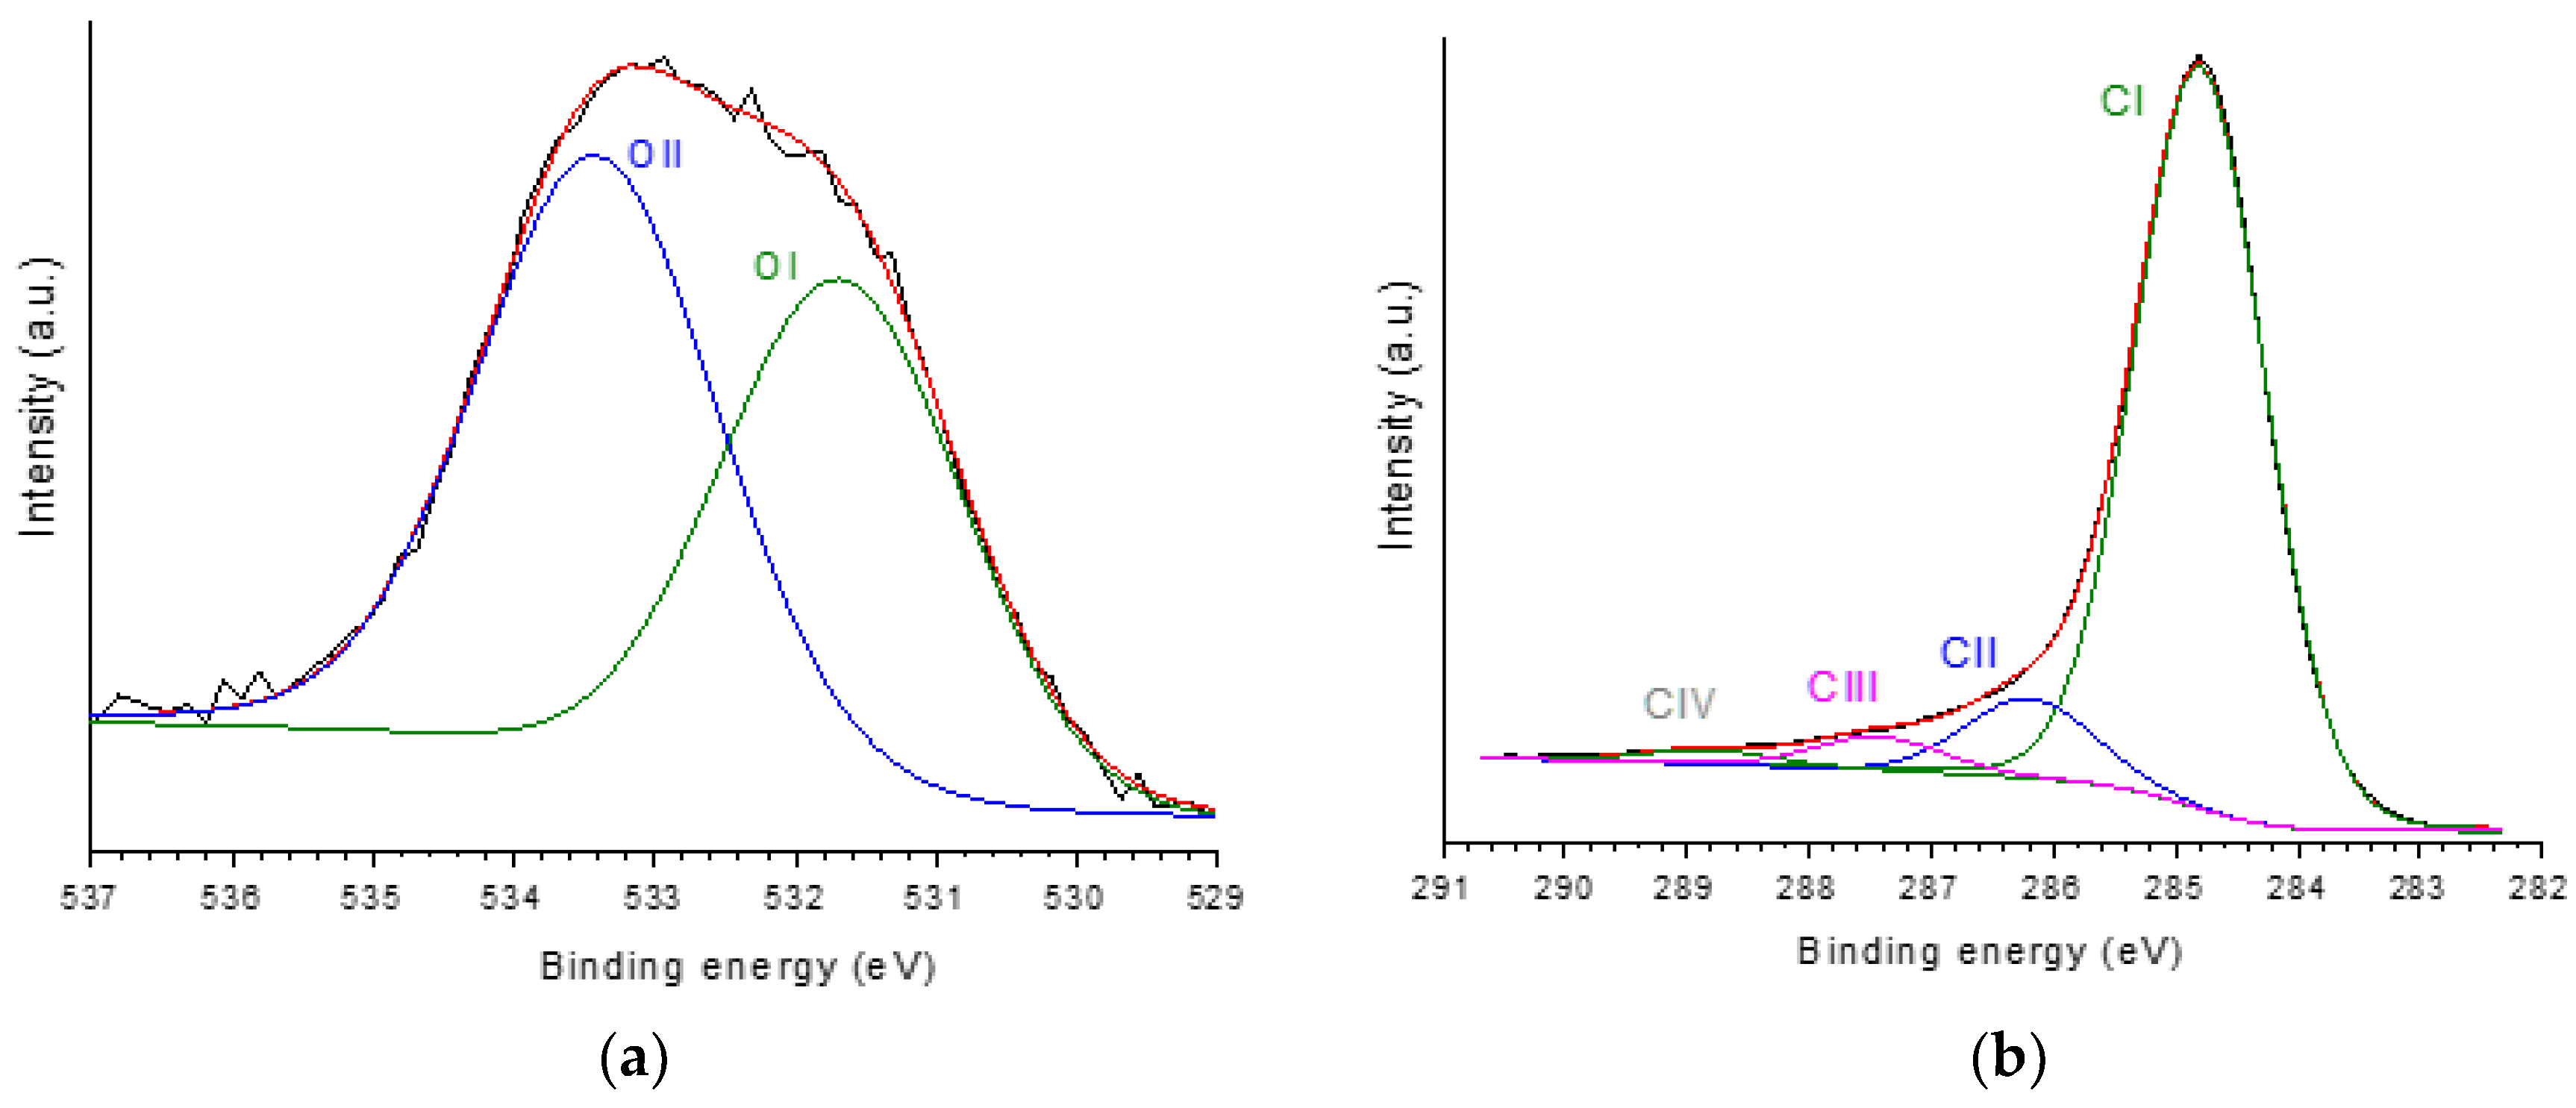
Figure 5.
(a) CO2 and (b) CO-TPD profiles of P54 with respective deconvoluted peaks.
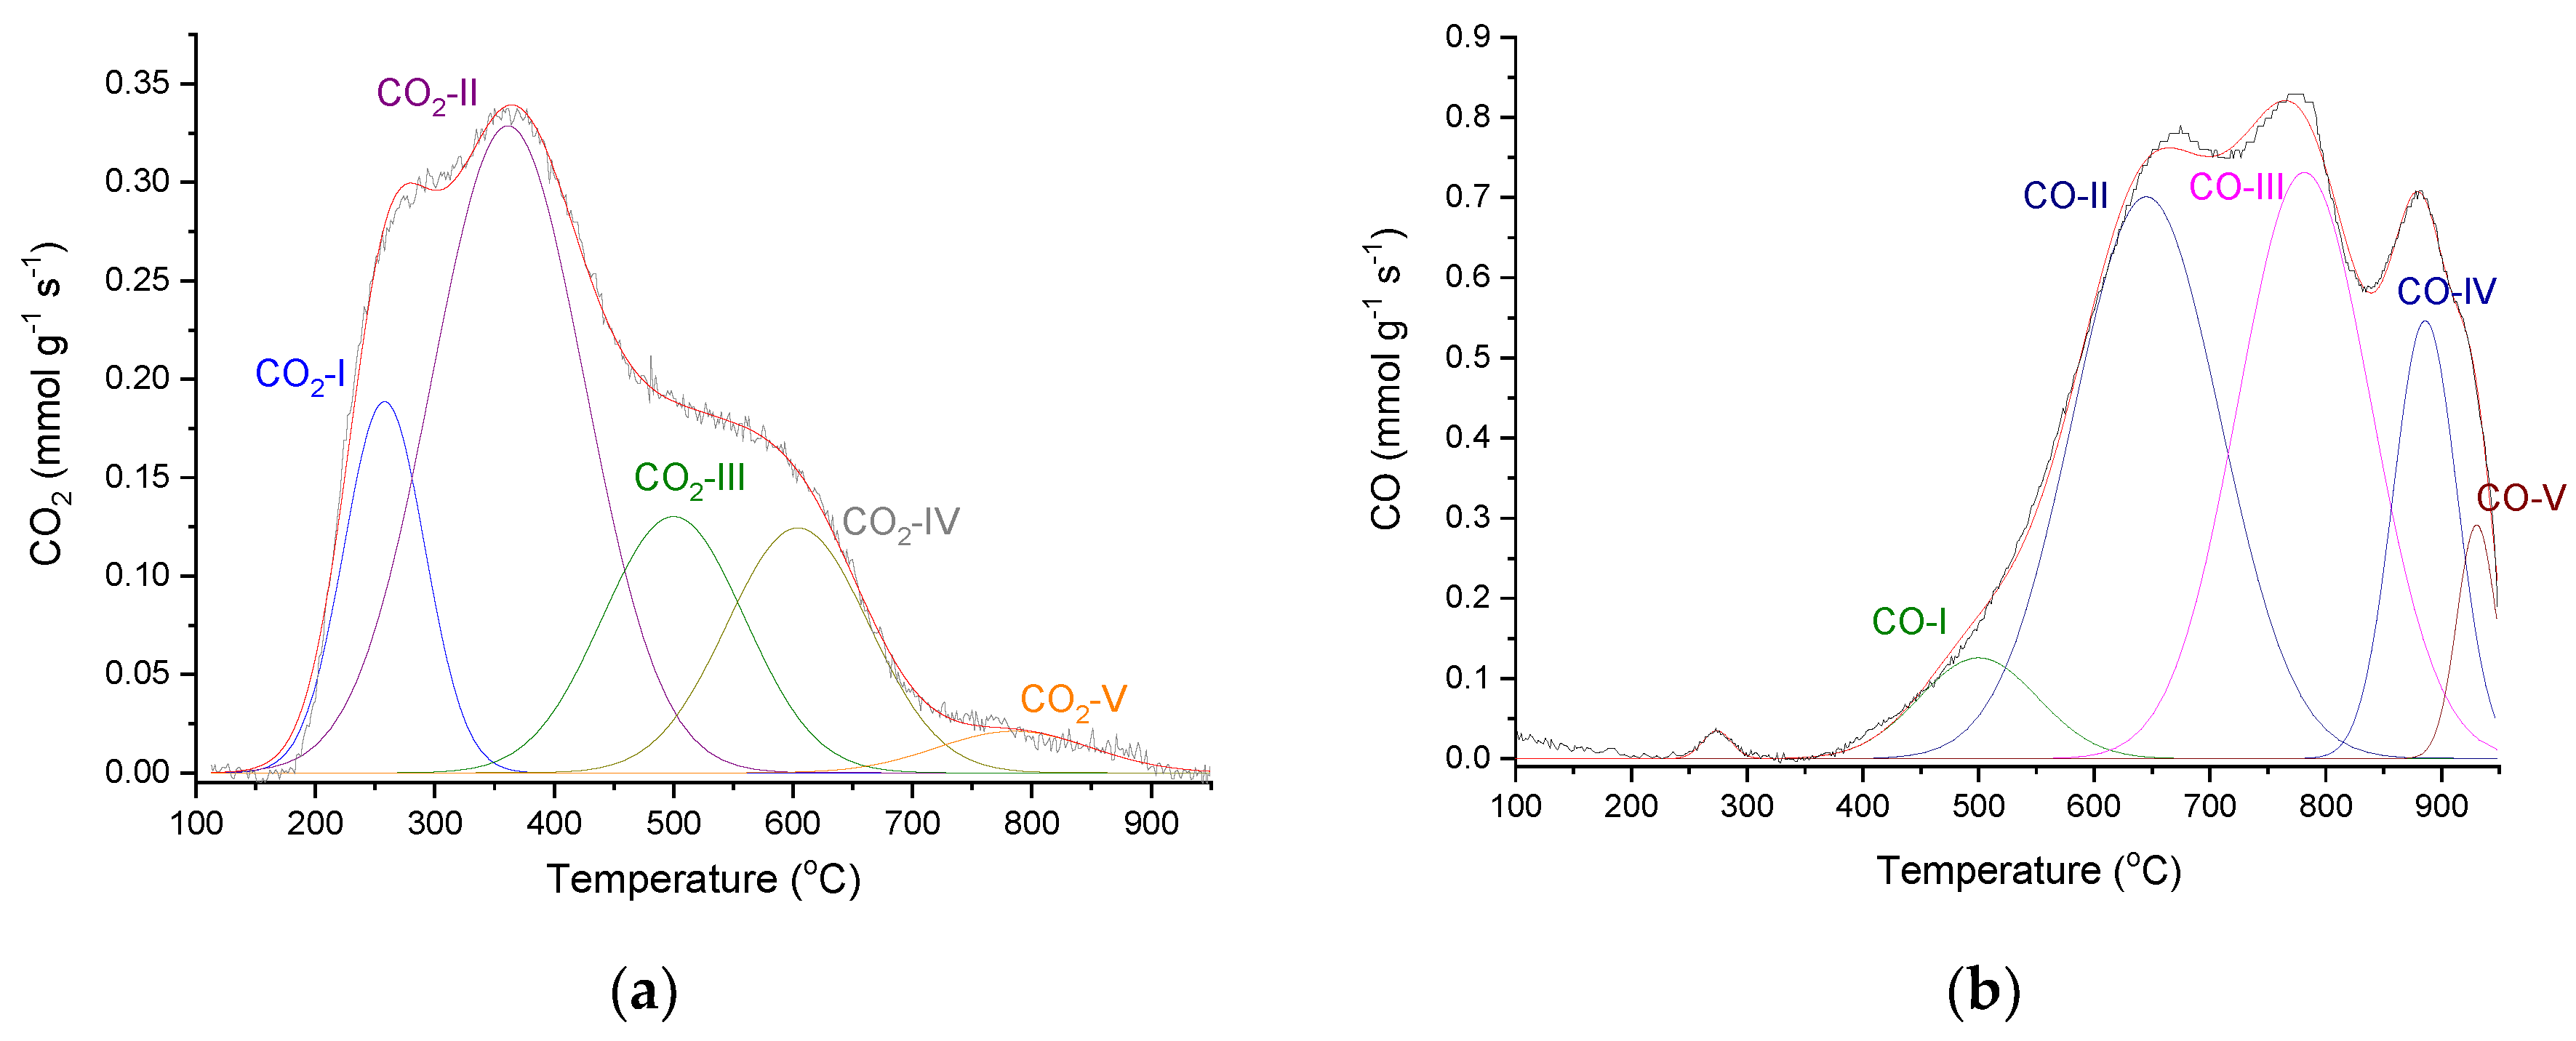
Figure 6.
TEM/EDX elemental mapping of (a) oxo-NiMo/P54-i,4, (b) oxo-NiMo/P54-w,4, and (c) oxo-Ni,Mo/P54-w,4.
Figure 6.
TEM/EDX elemental mapping of (a) oxo-NiMo/P54-i,4, (b) oxo-NiMo/P54-w,4, and (c) oxo-Ni,Mo/P54-w,4.
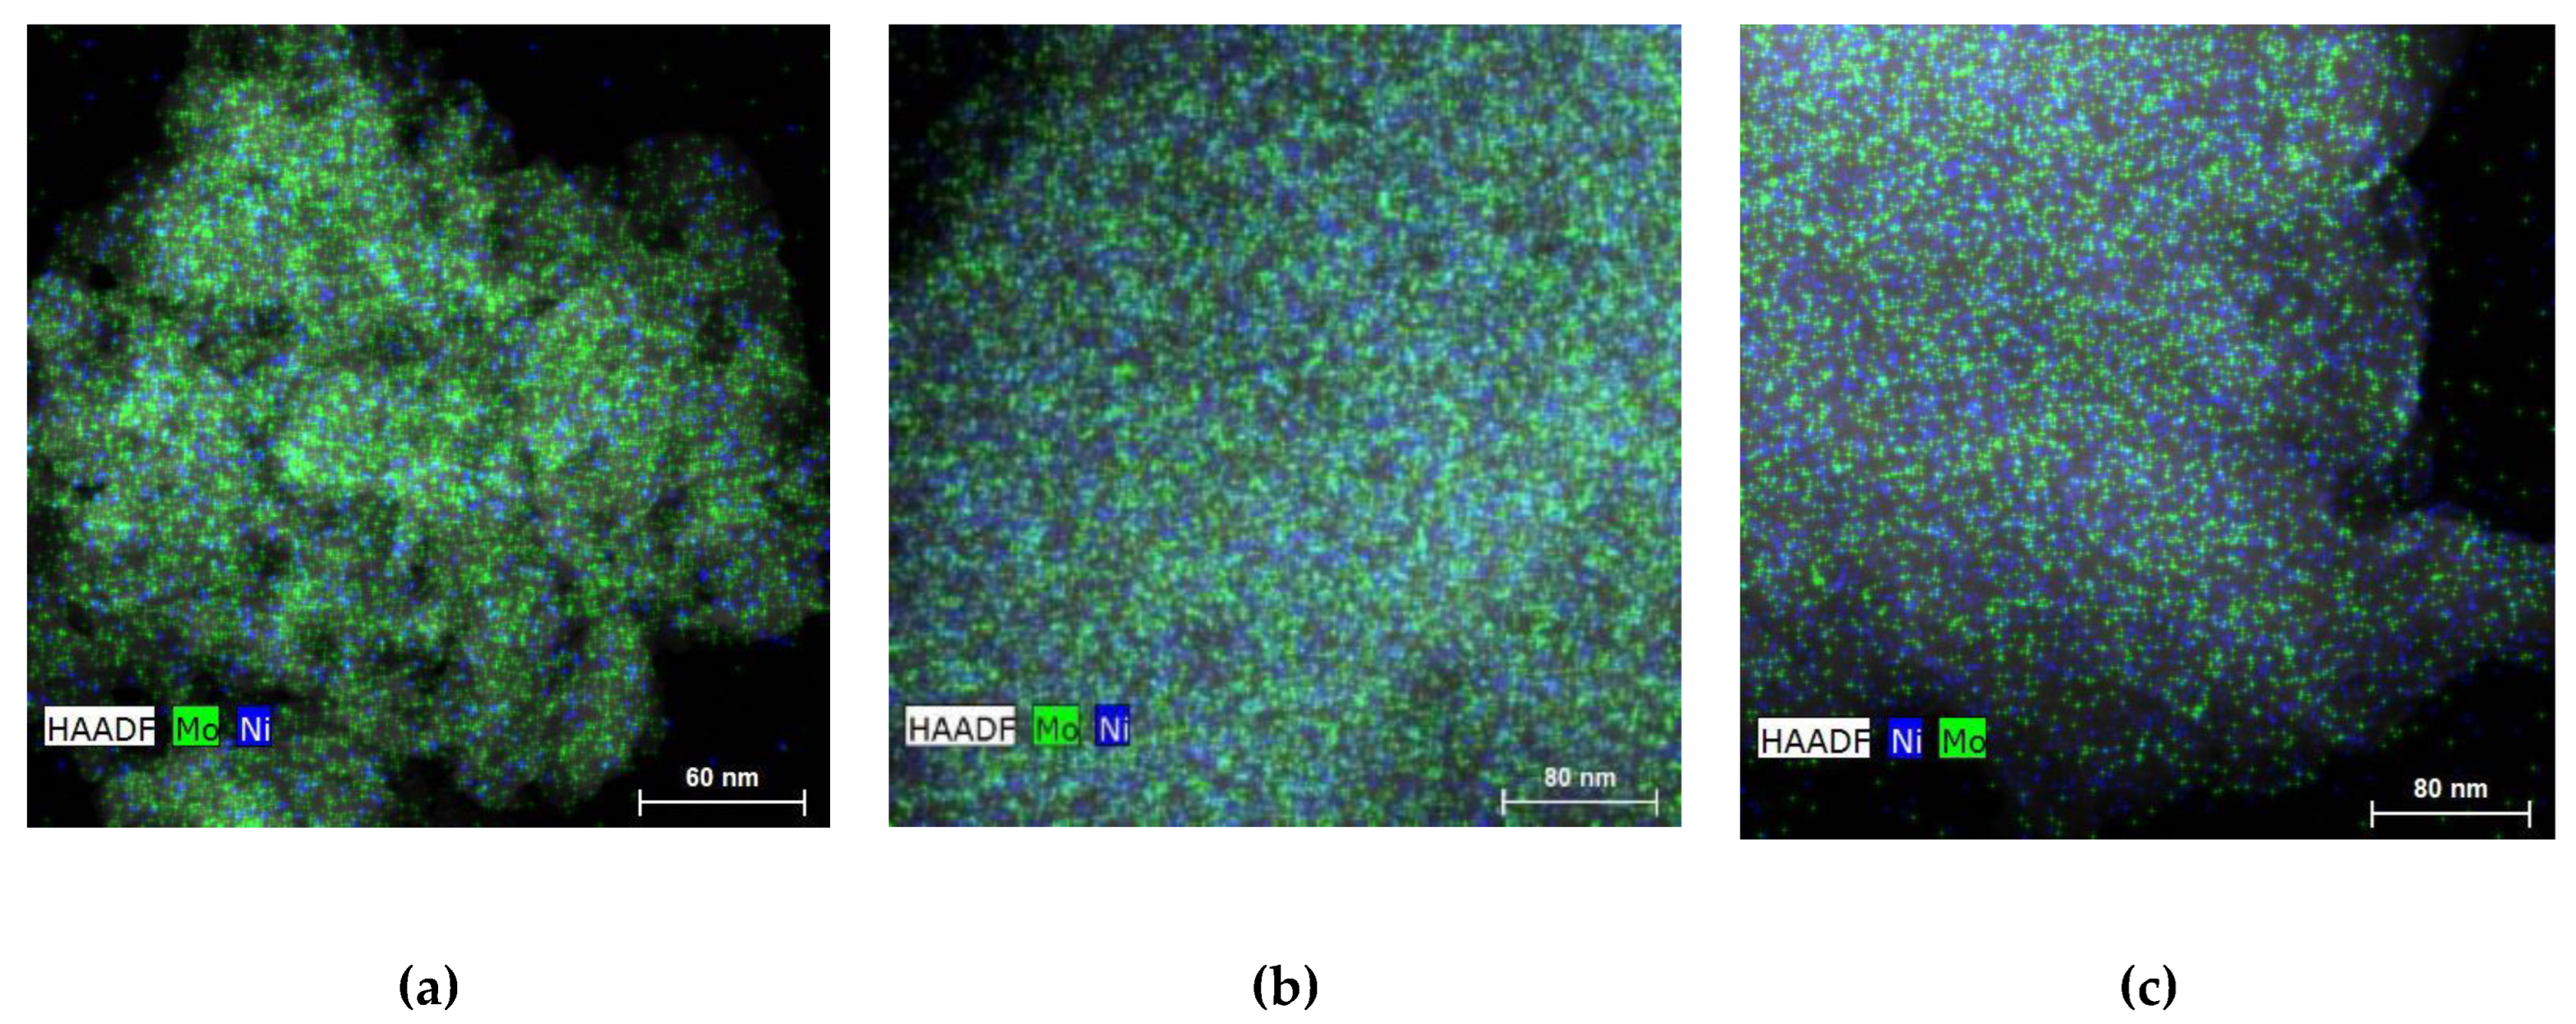
Figure 7.
XPS survey spectra of (a) oxo-Ni,Mo/P54-w,4 and (b) sulf-Ni,Mo/P54-w,4.
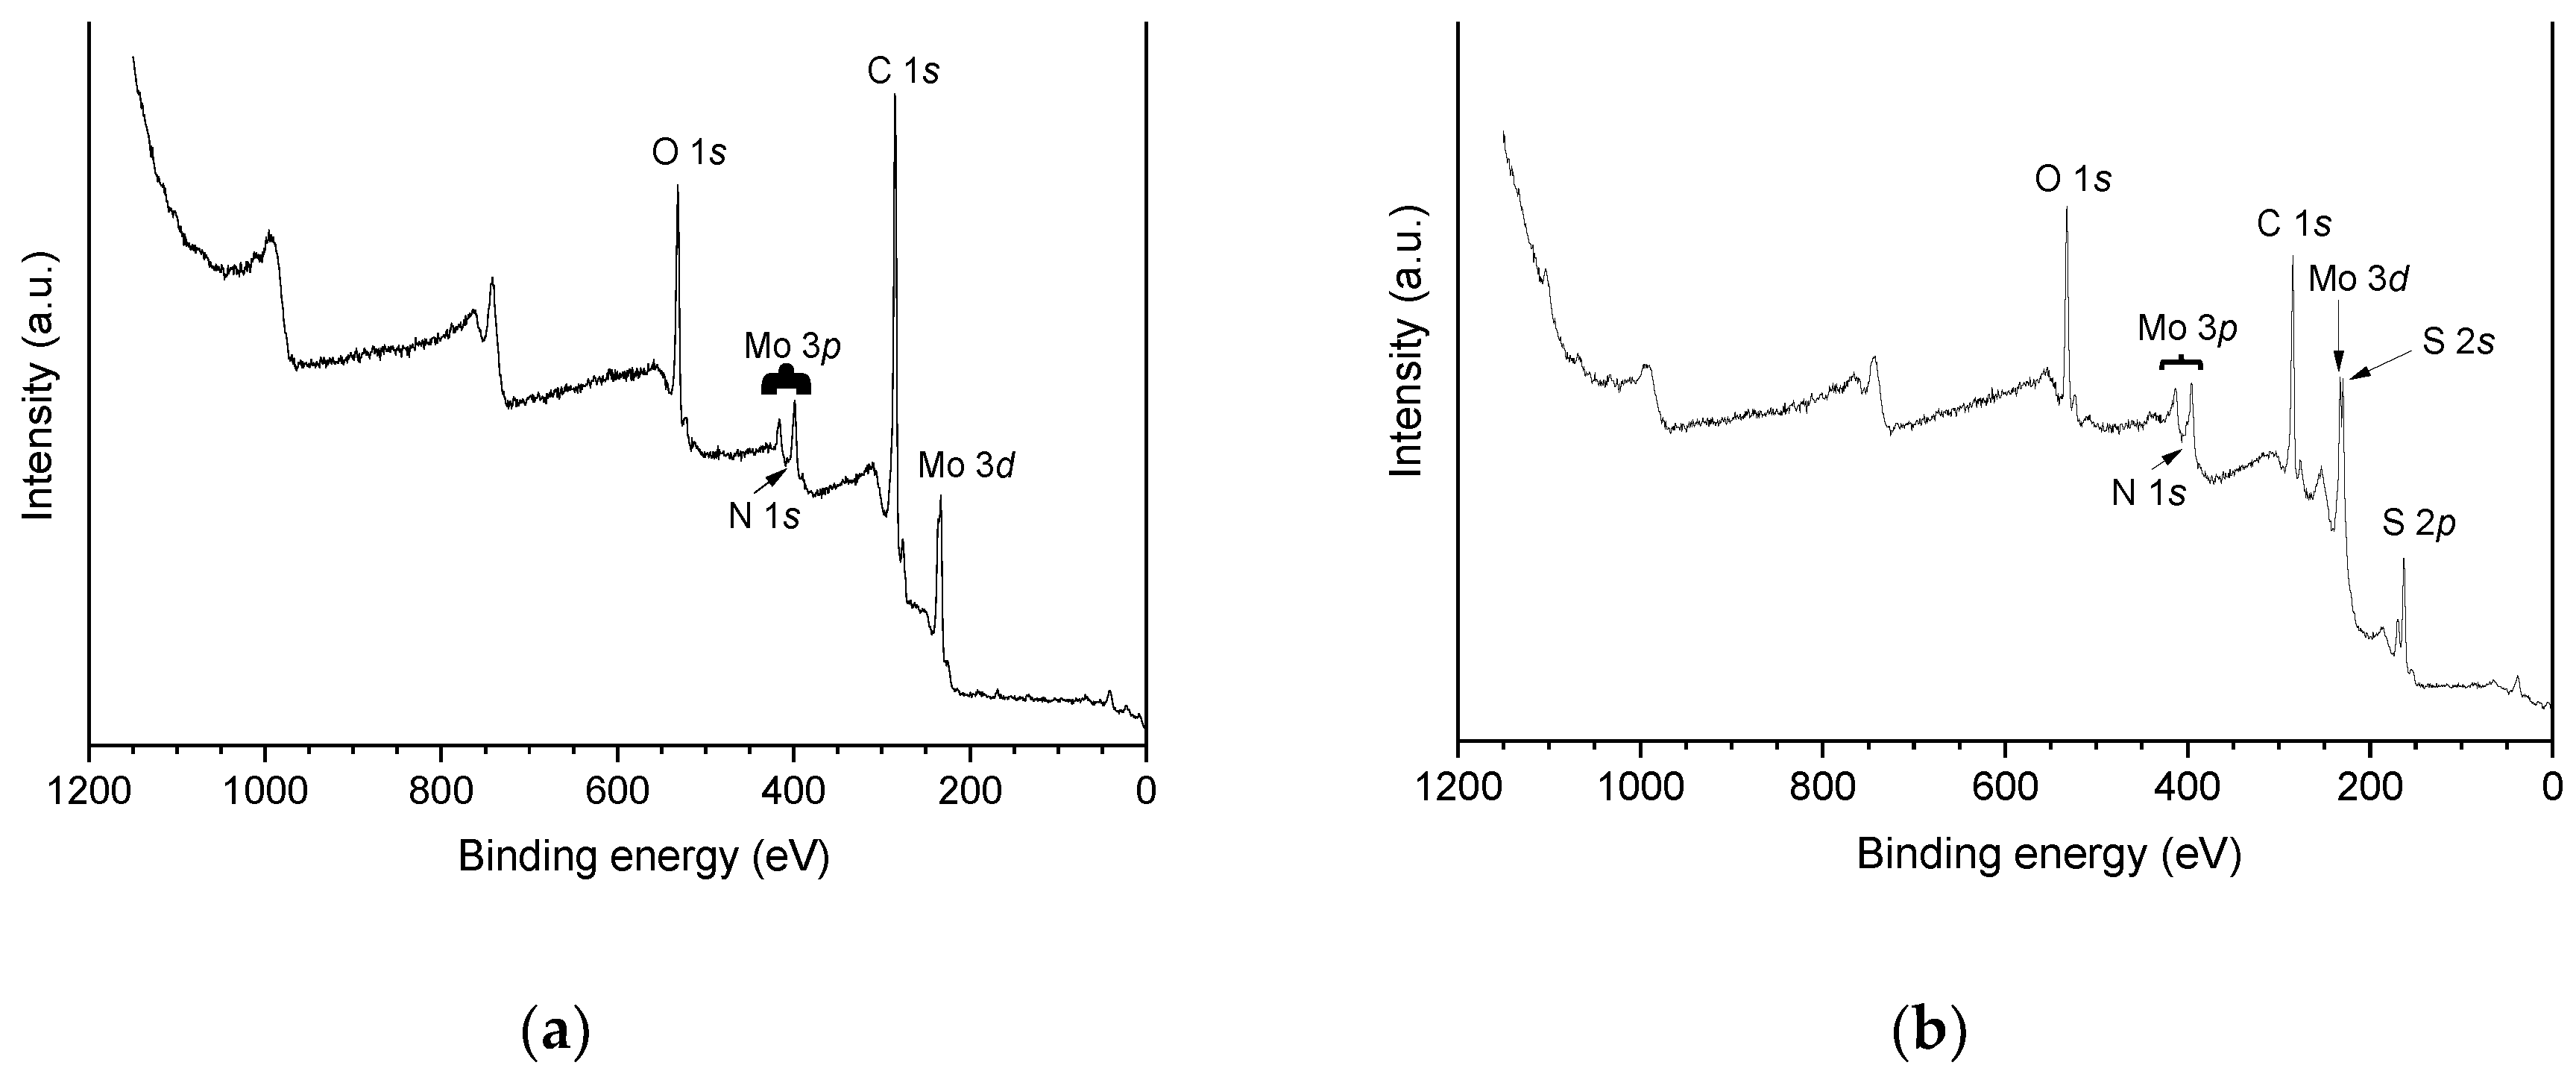
Figure 8.
HR-XPS (a)–(d) Mo 3d and (e)–(h) O 1s core level spectra of some selected catalysts.
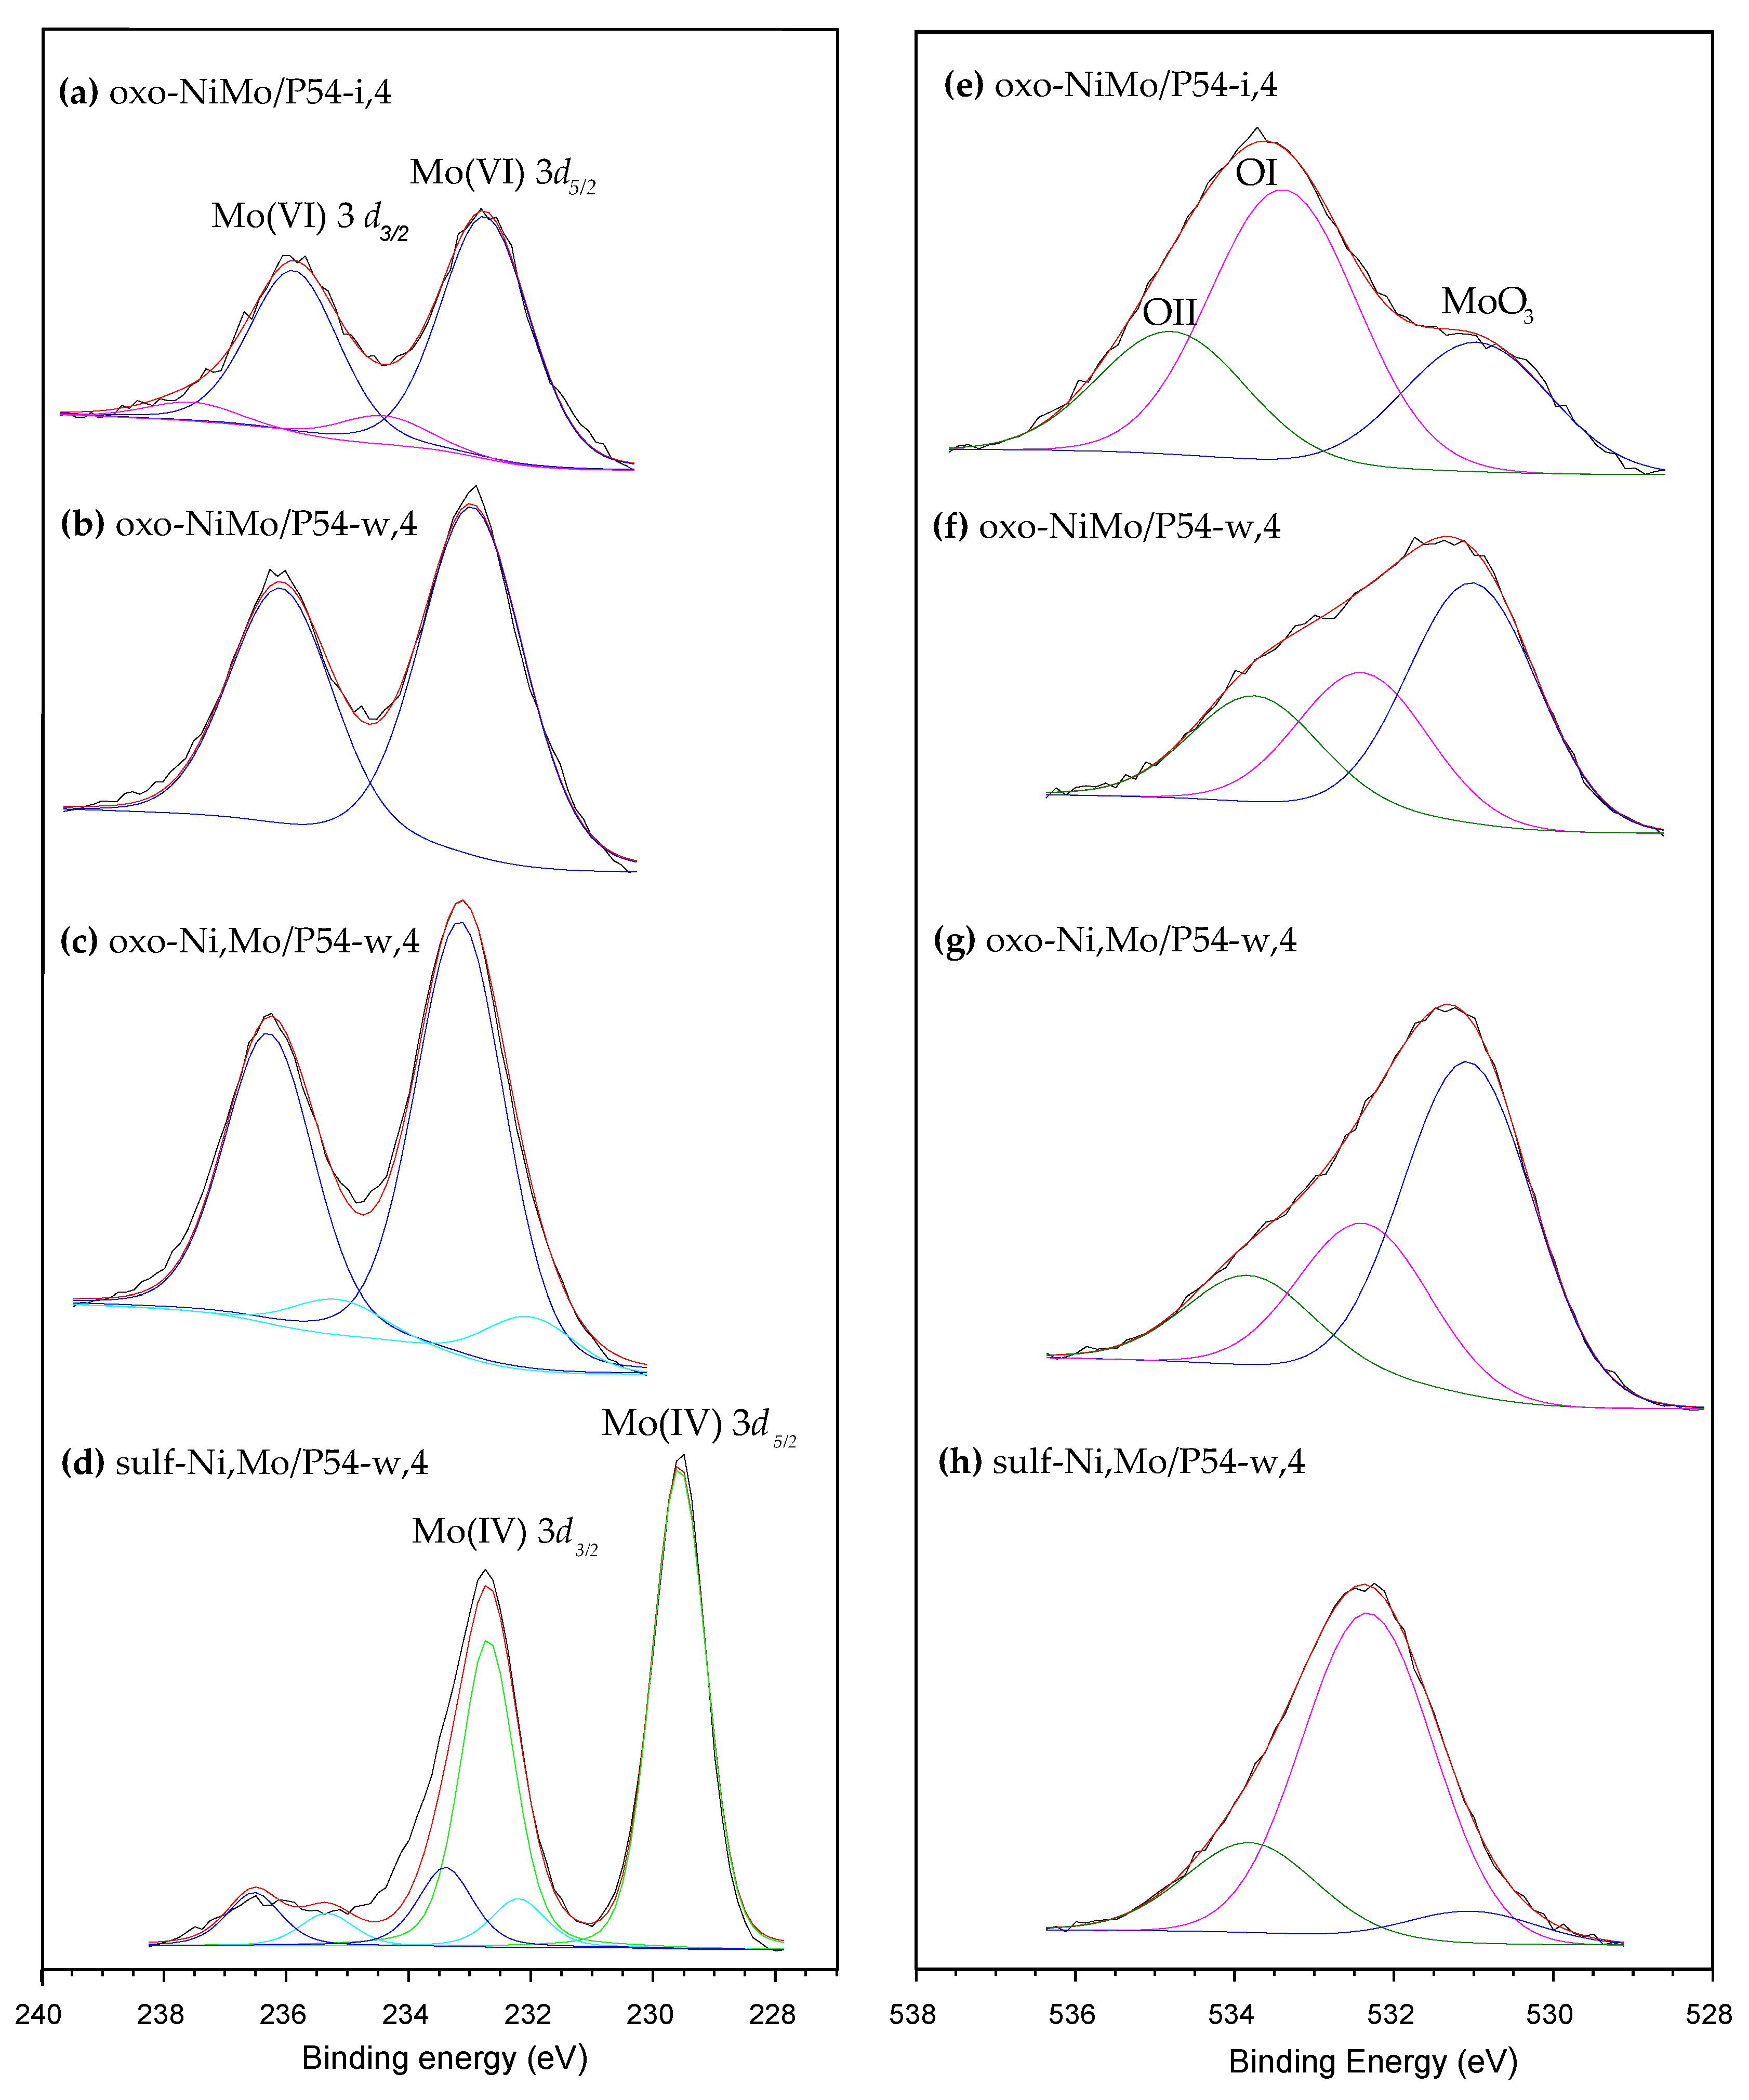
Figure 9.
HR-XPS S 2p core level spectra of sulf-Ni,Mo/P54-w,4.
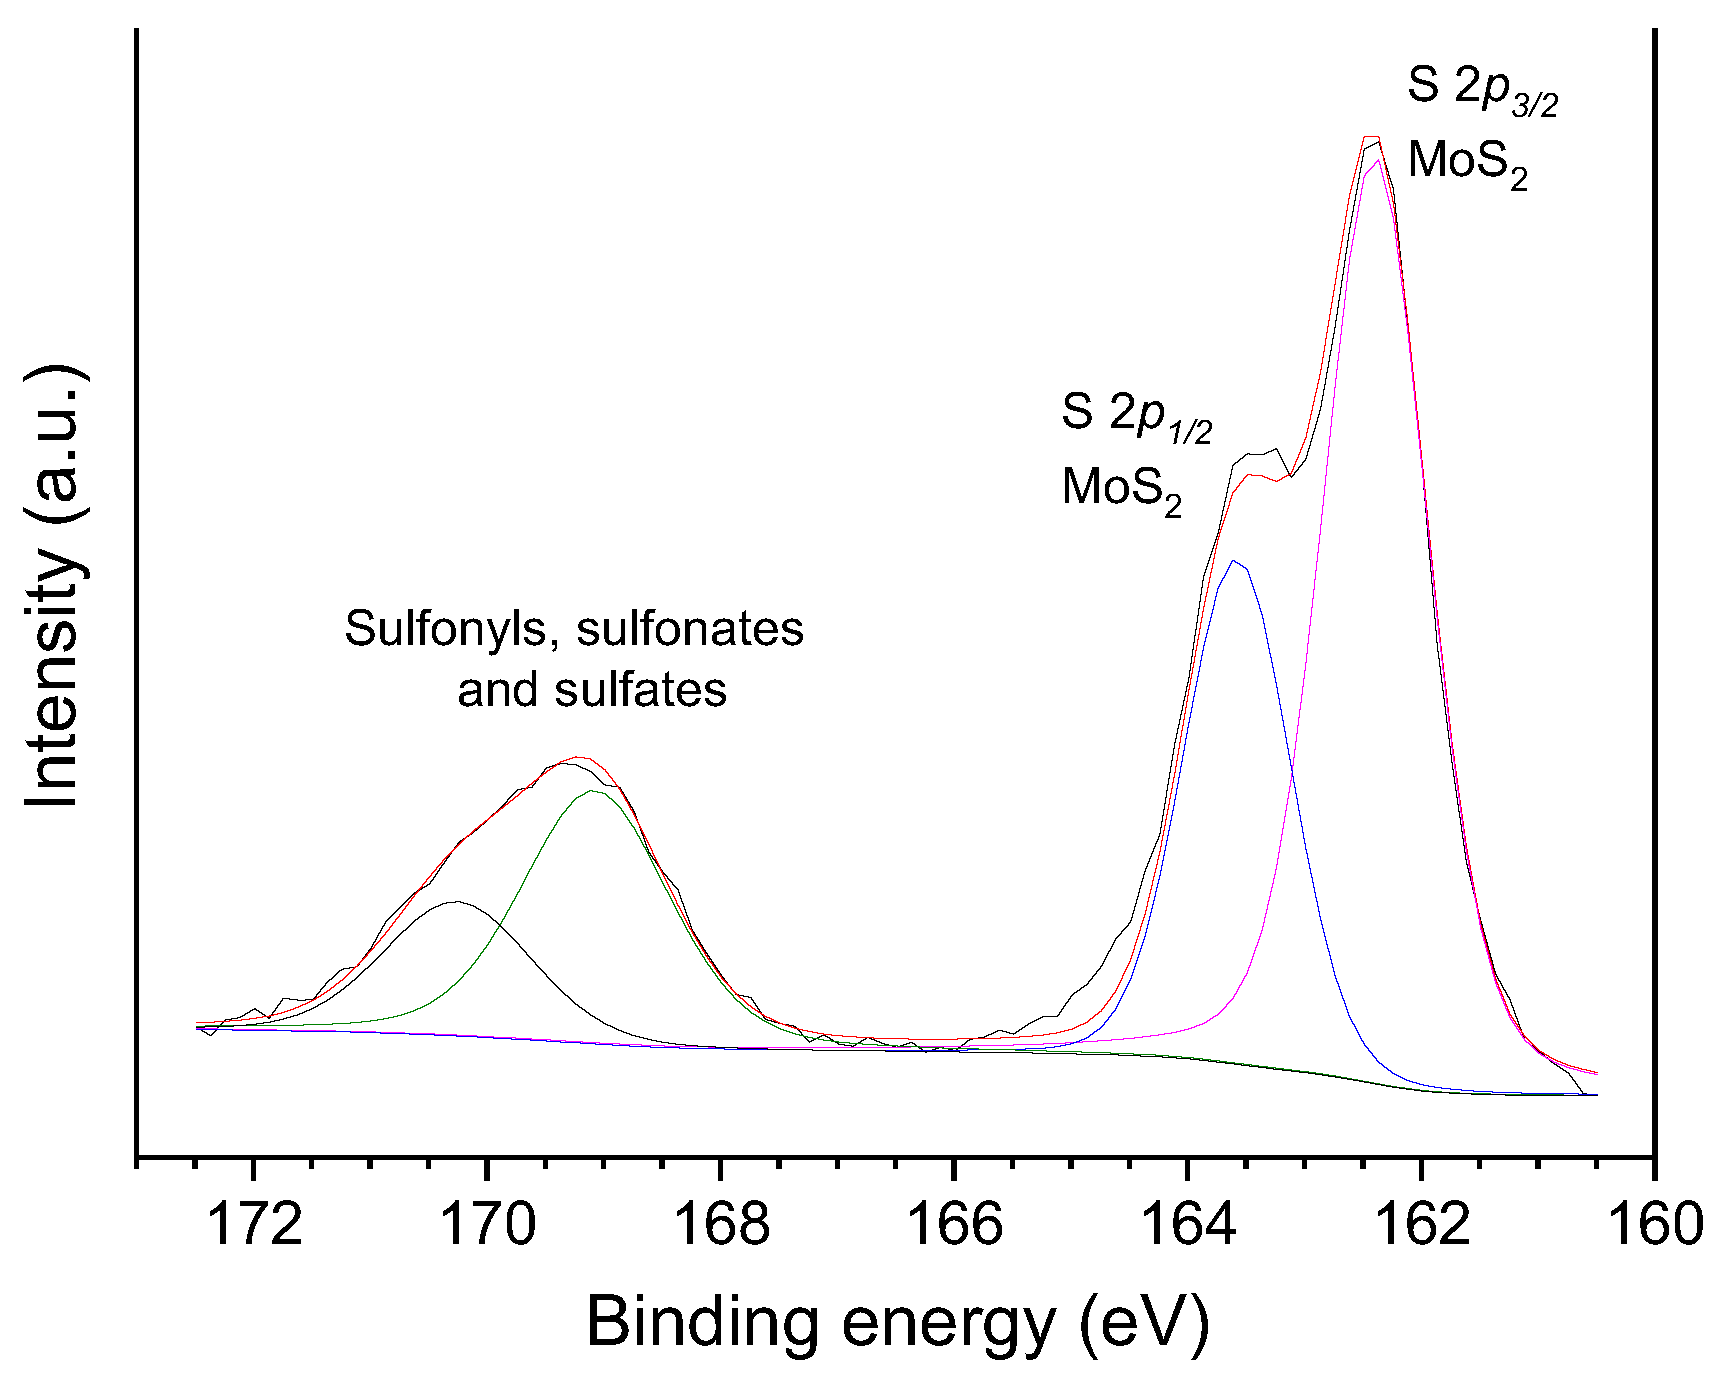
Figure 10.
HR-XPS Ni 2p core level spectra of (a) oxo-NiMo/P54-w,4, (b) oxo-Ni,Mo/P54-w,4, and (c) sulf-Ni,Mo/P54-w,4.
Figure 10.
HR-XPS Ni 2p core level spectra of (a) oxo-NiMo/P54-w,4, (b) oxo-Ni,Mo/P54-w,4, and (c) sulf-Ni,Mo/P54-w,4.
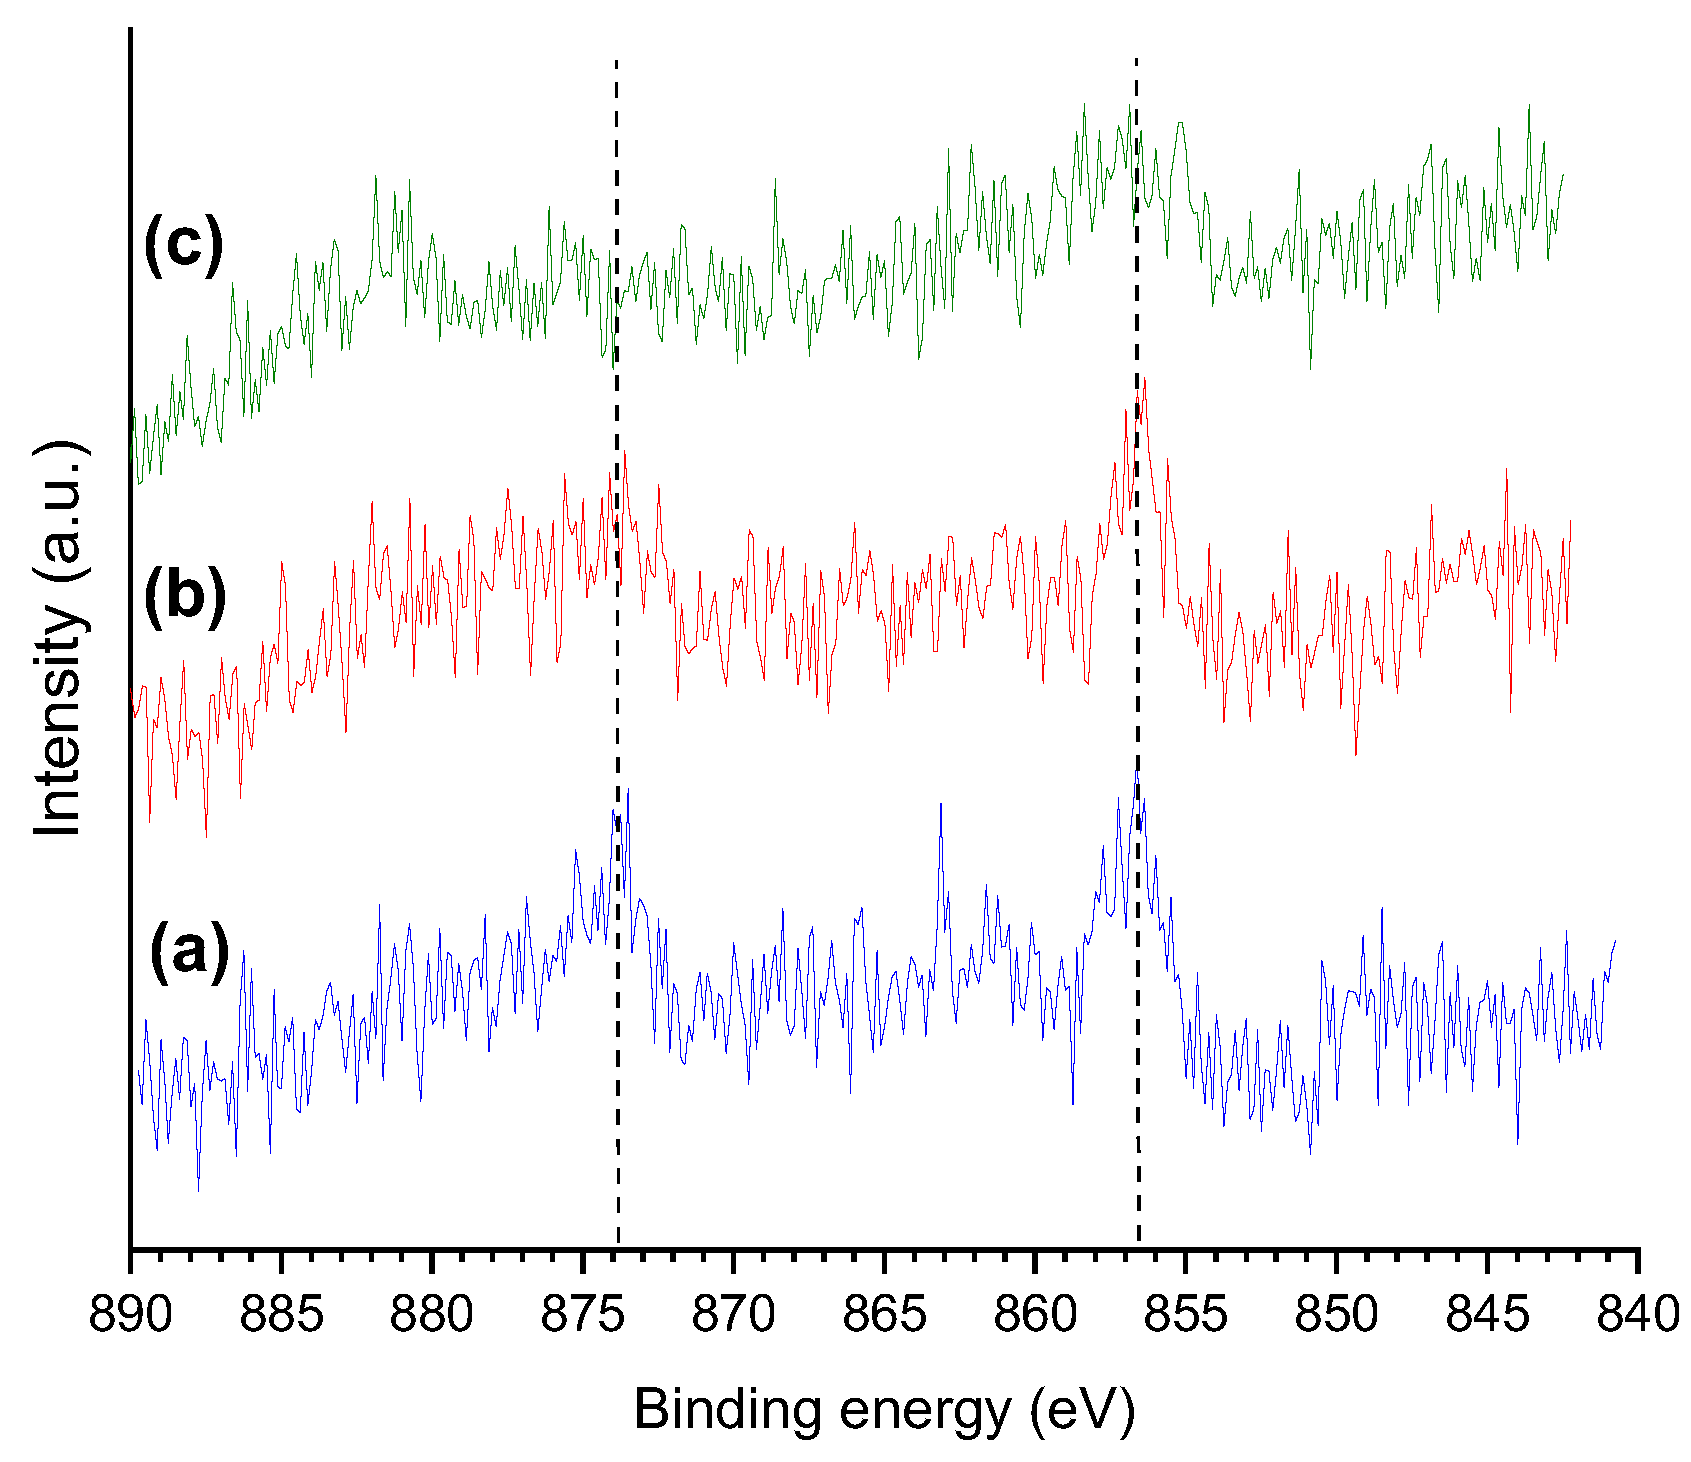
Figure 11.
(a) X-ray diffratogram of oxo-Mo/P54-i,4 catalyst and XRD standard patterns of some common Mo oxides: (b) h-MoO3 (JCPDS 21-0569); (c) α-MoO3 (JCPDS 05-0508); (d) β-MoO3 (JCPDS 47-1320); (e) monoclinic MoO2 (JCPDS 78-1070).
Figure 11.
(a) X-ray diffratogram of oxo-Mo/P54-i,4 catalyst and XRD standard patterns of some common Mo oxides: (b) h-MoO3 (JCPDS 21-0569); (c) α-MoO3 (JCPDS 05-0508); (d) β-MoO3 (JCPDS 47-1320); (e) monoclinic MoO2 (JCPDS 78-1070).
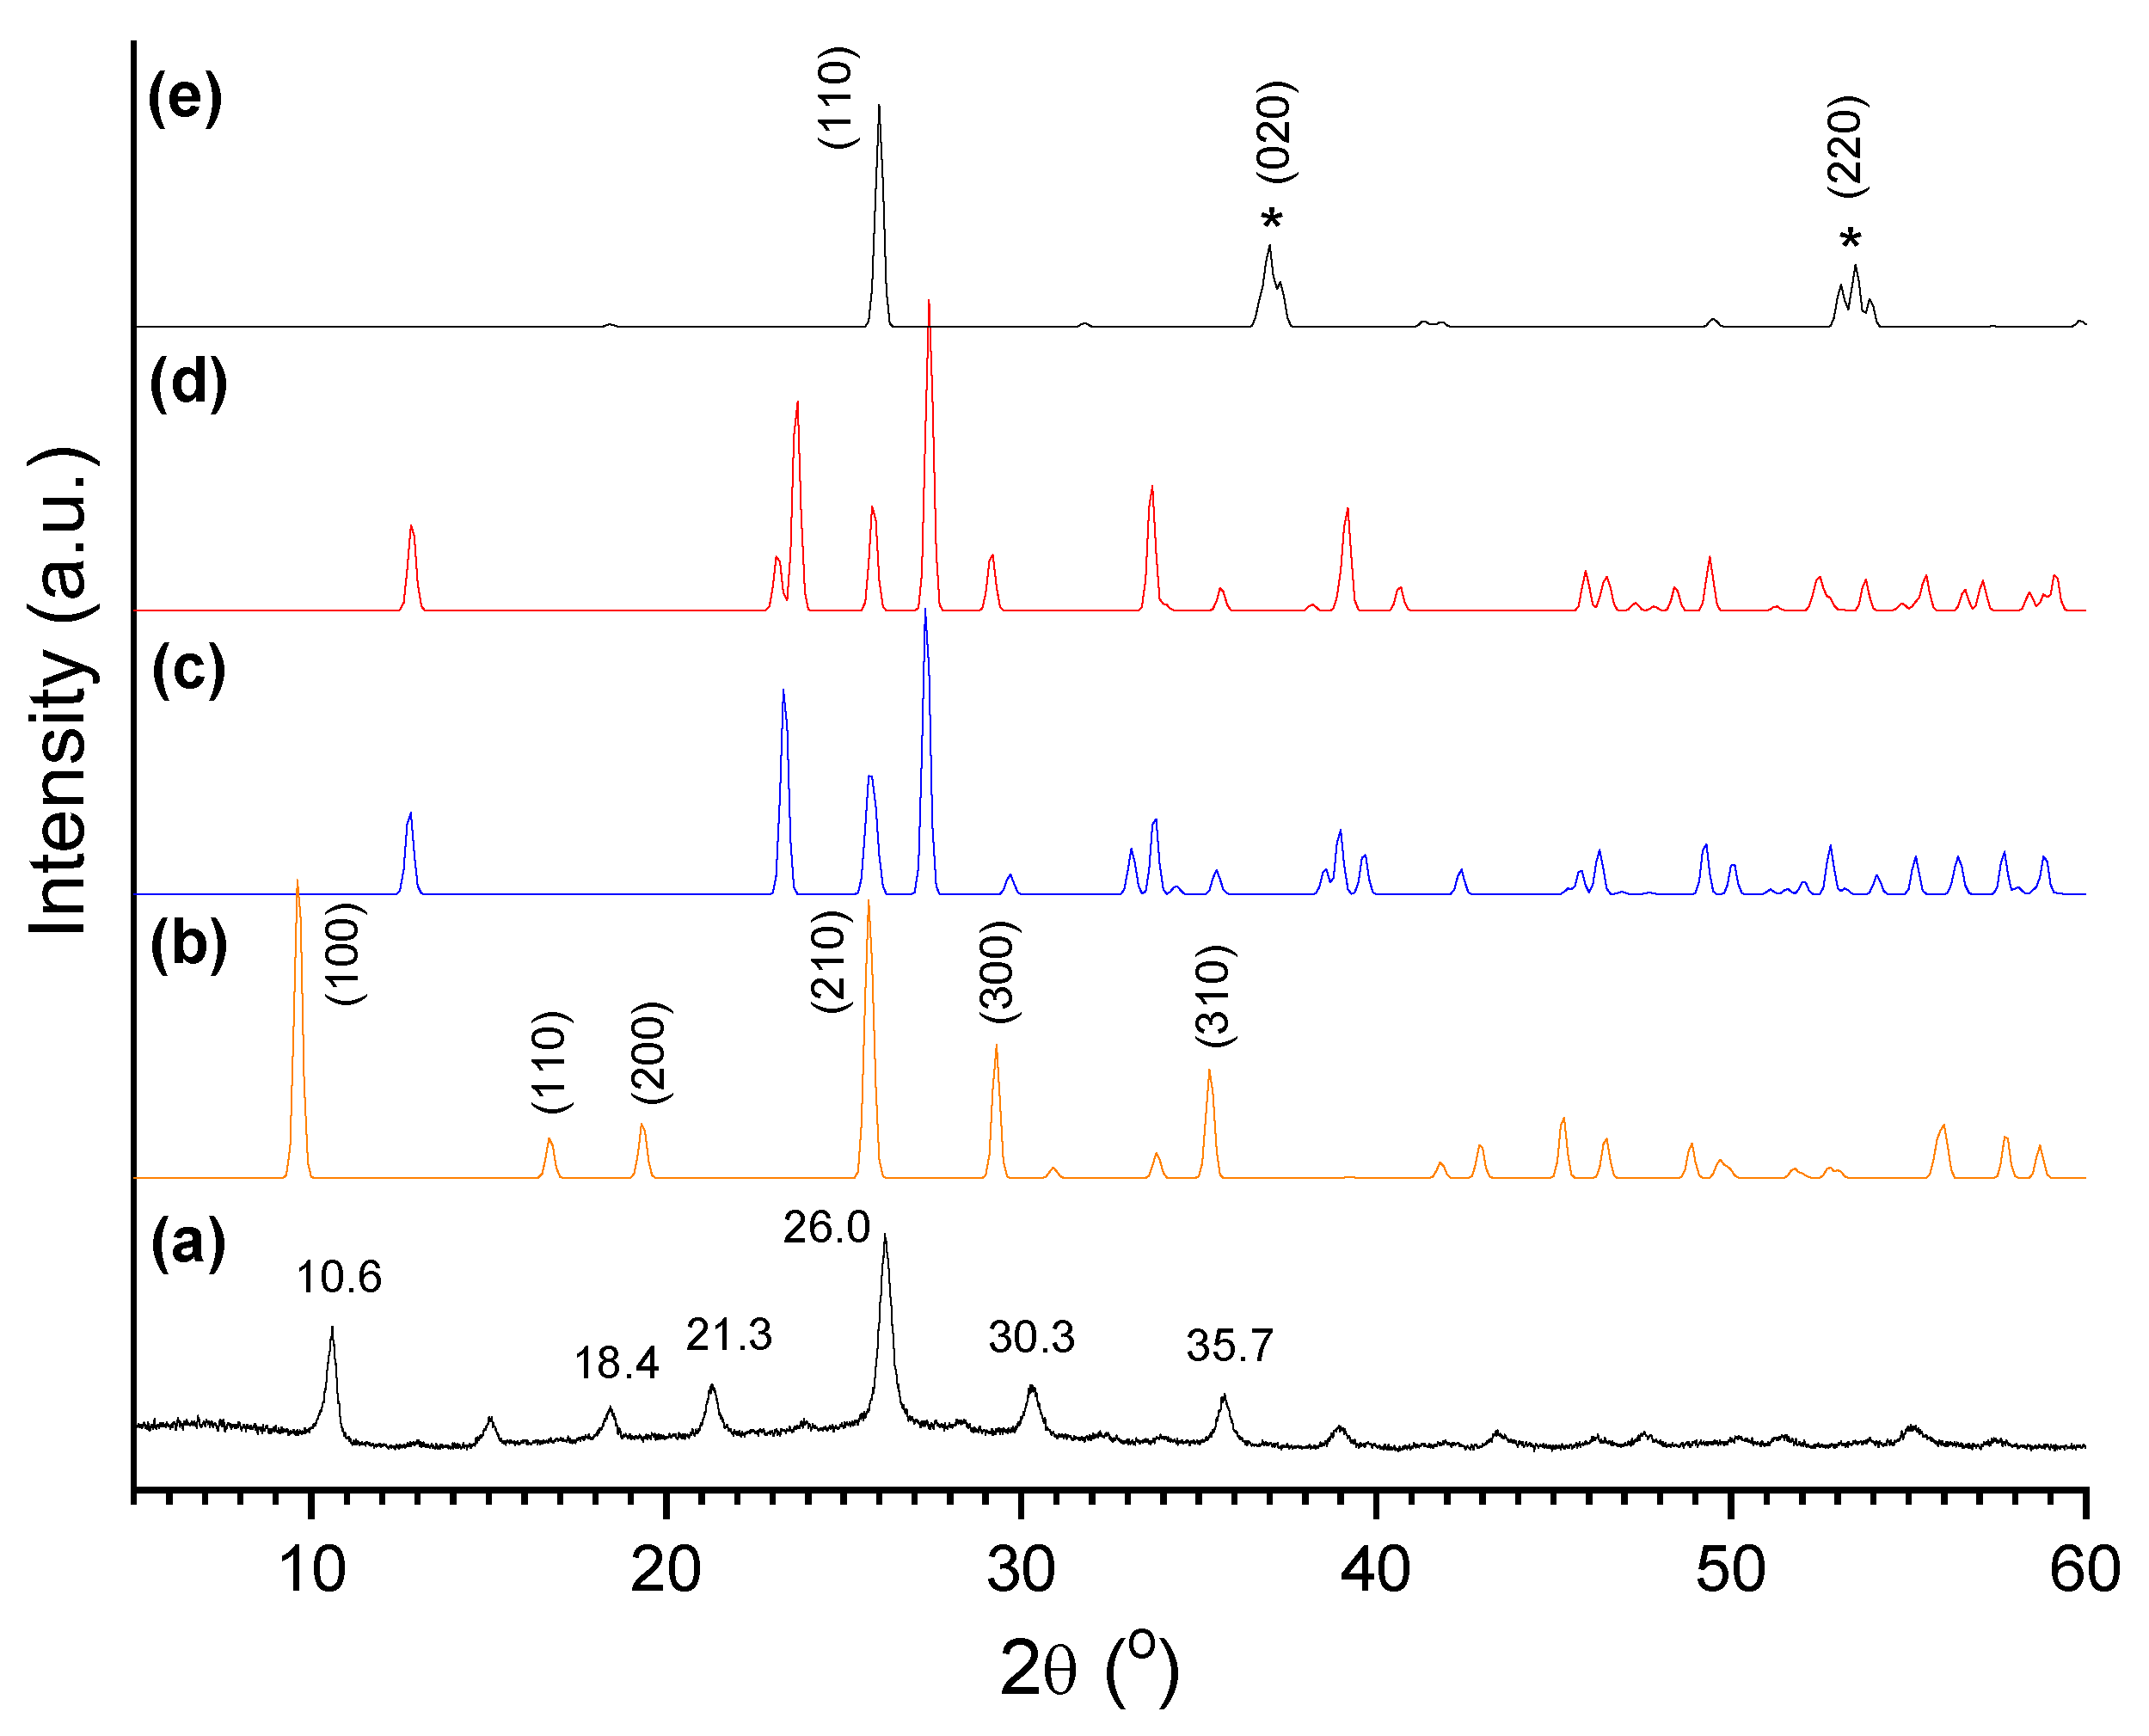
Figure 12.
X-ray diffratogram of all prepared oxo-catalysts.
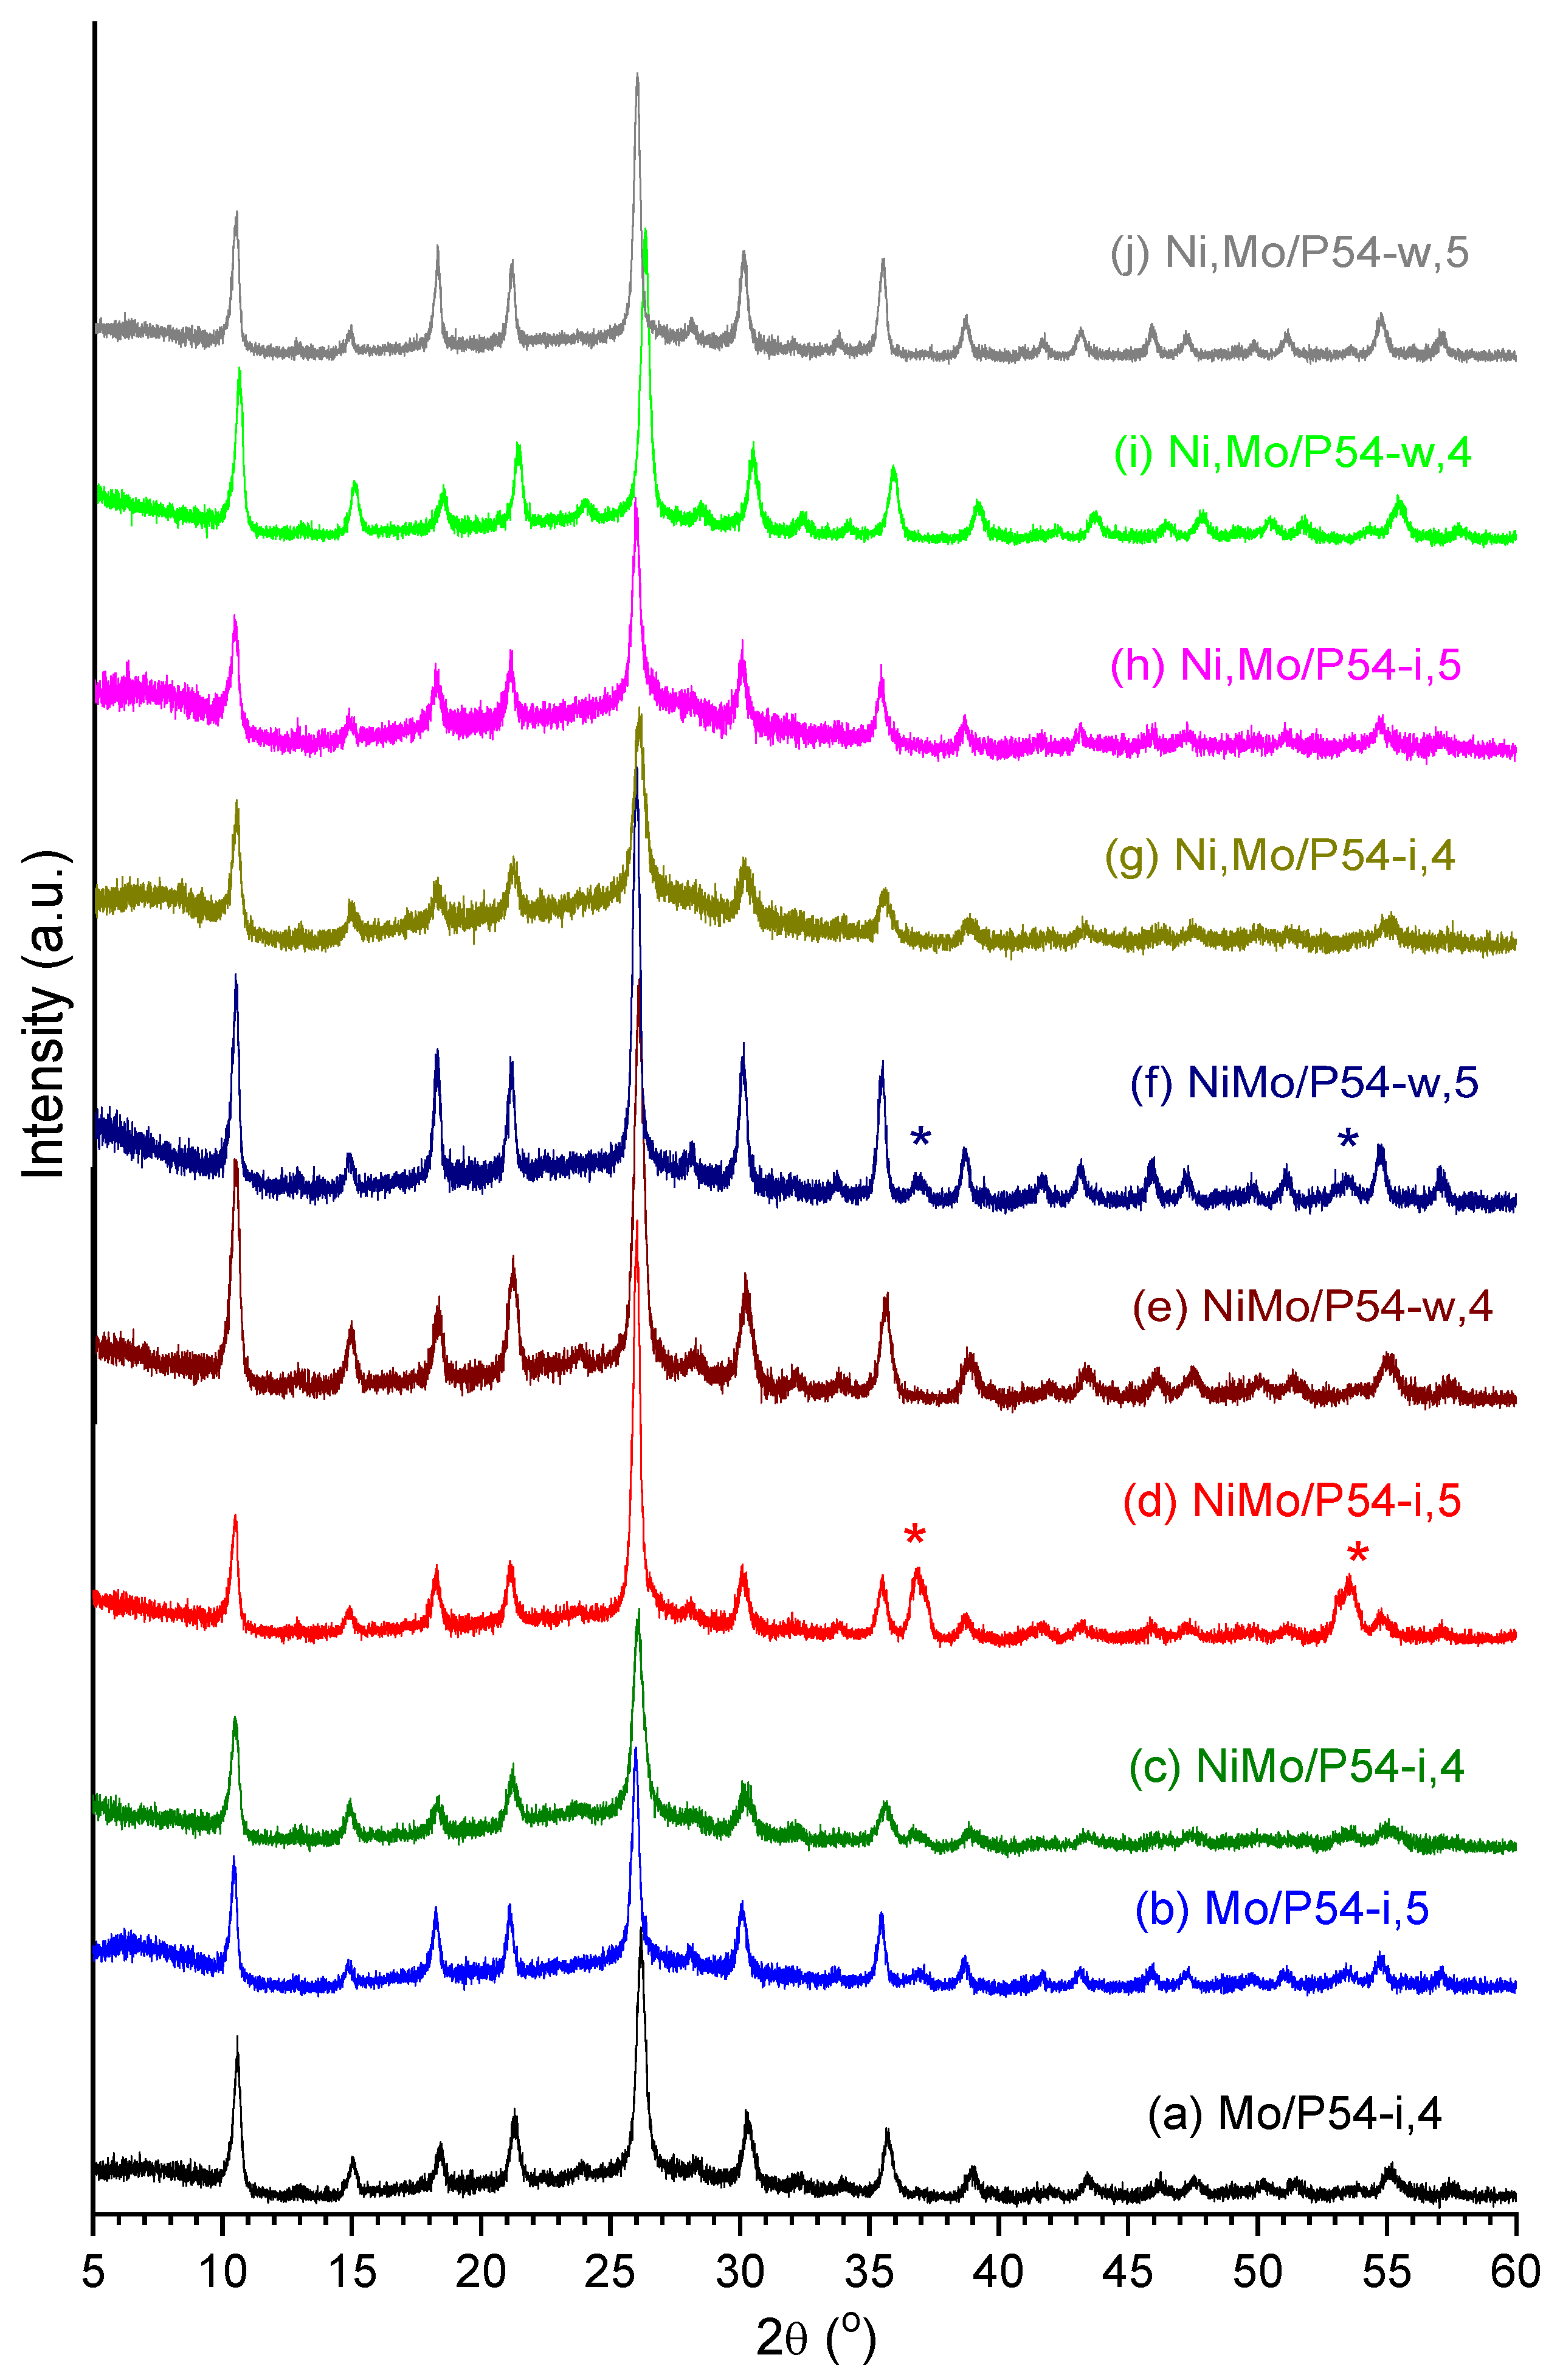
Figure 13.
(a) X-ray diffratogram of the oxo-Mo/P54-i,4 catalyst and (b) XRD standard profile of MoS2 (JCPDS 37-1492).
Figure 13.
(a) X-ray diffratogram of the oxo-Mo/P54-i,4 catalyst and (b) XRD standard profile of MoS2 (JCPDS 37-1492).
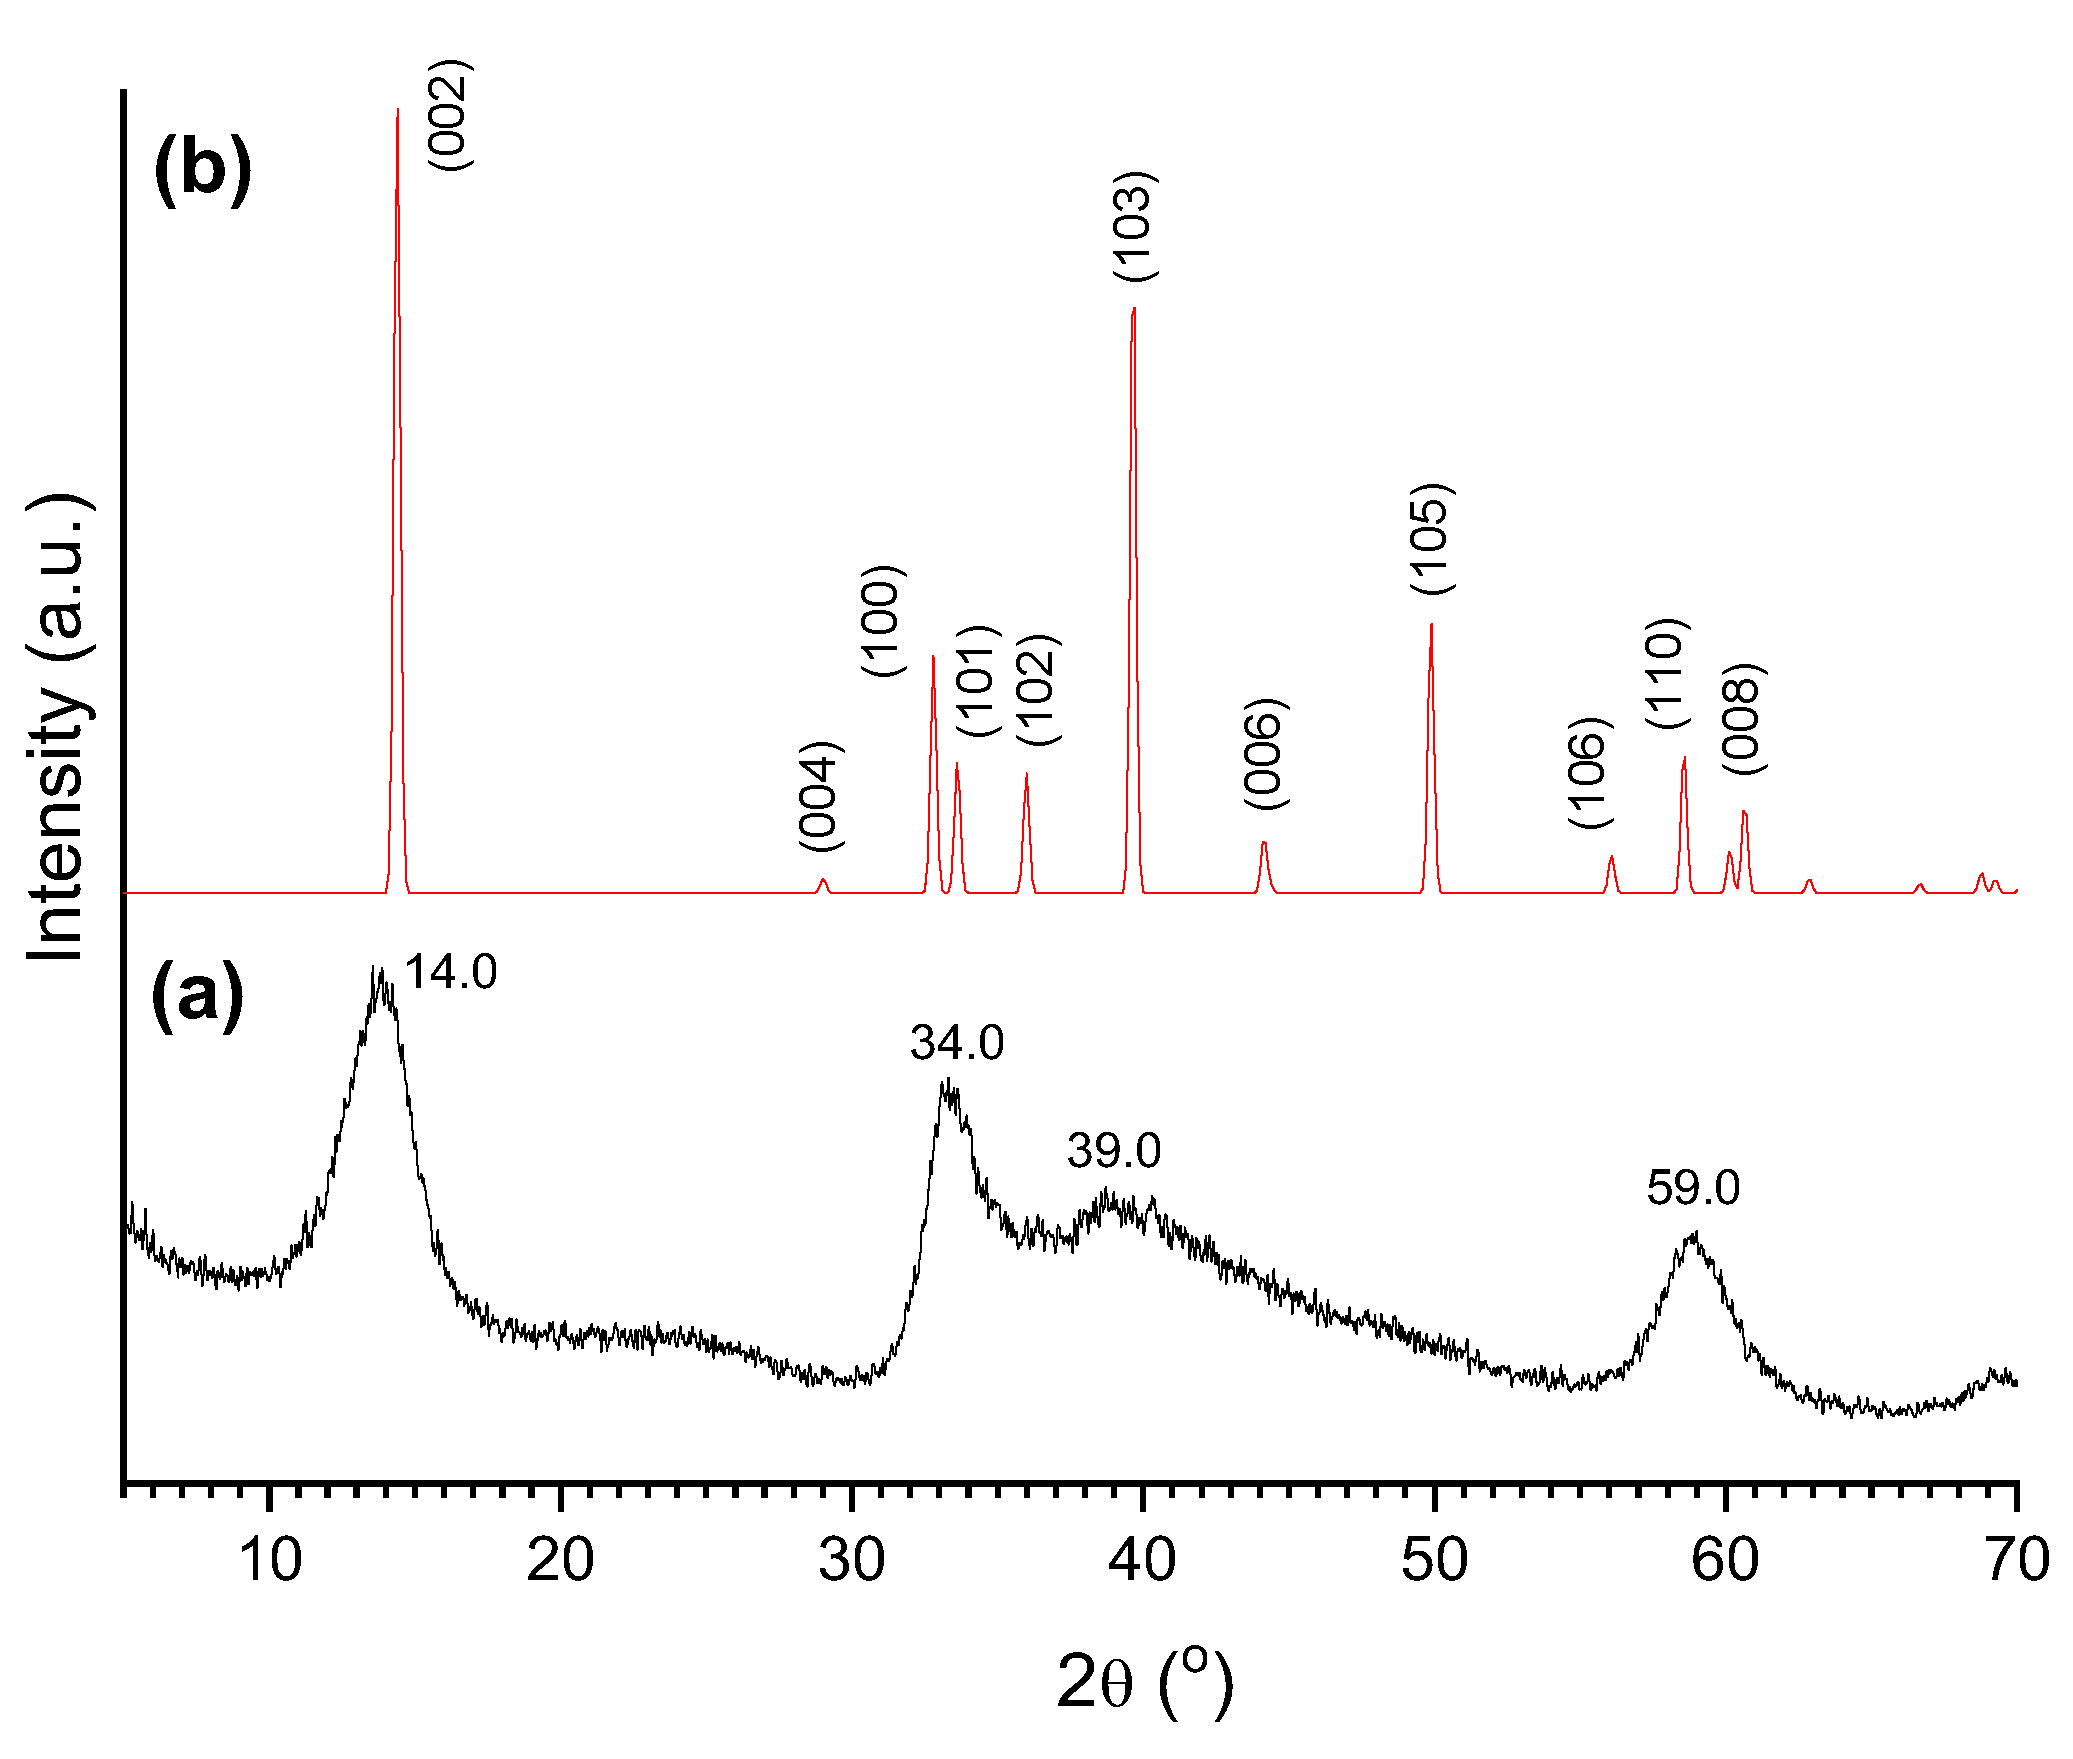
Figure 14.
GC/FID chromatogram of the product obtained after the 3 h test of lauric acid HDO with the sulf-Ni,Mo/P54-w,4 catalyst.
Figure 14.
GC/FID chromatogram of the product obtained after the 3 h test of lauric acid HDO with the sulf-Ni,Mo/P54-w,4 catalyst.
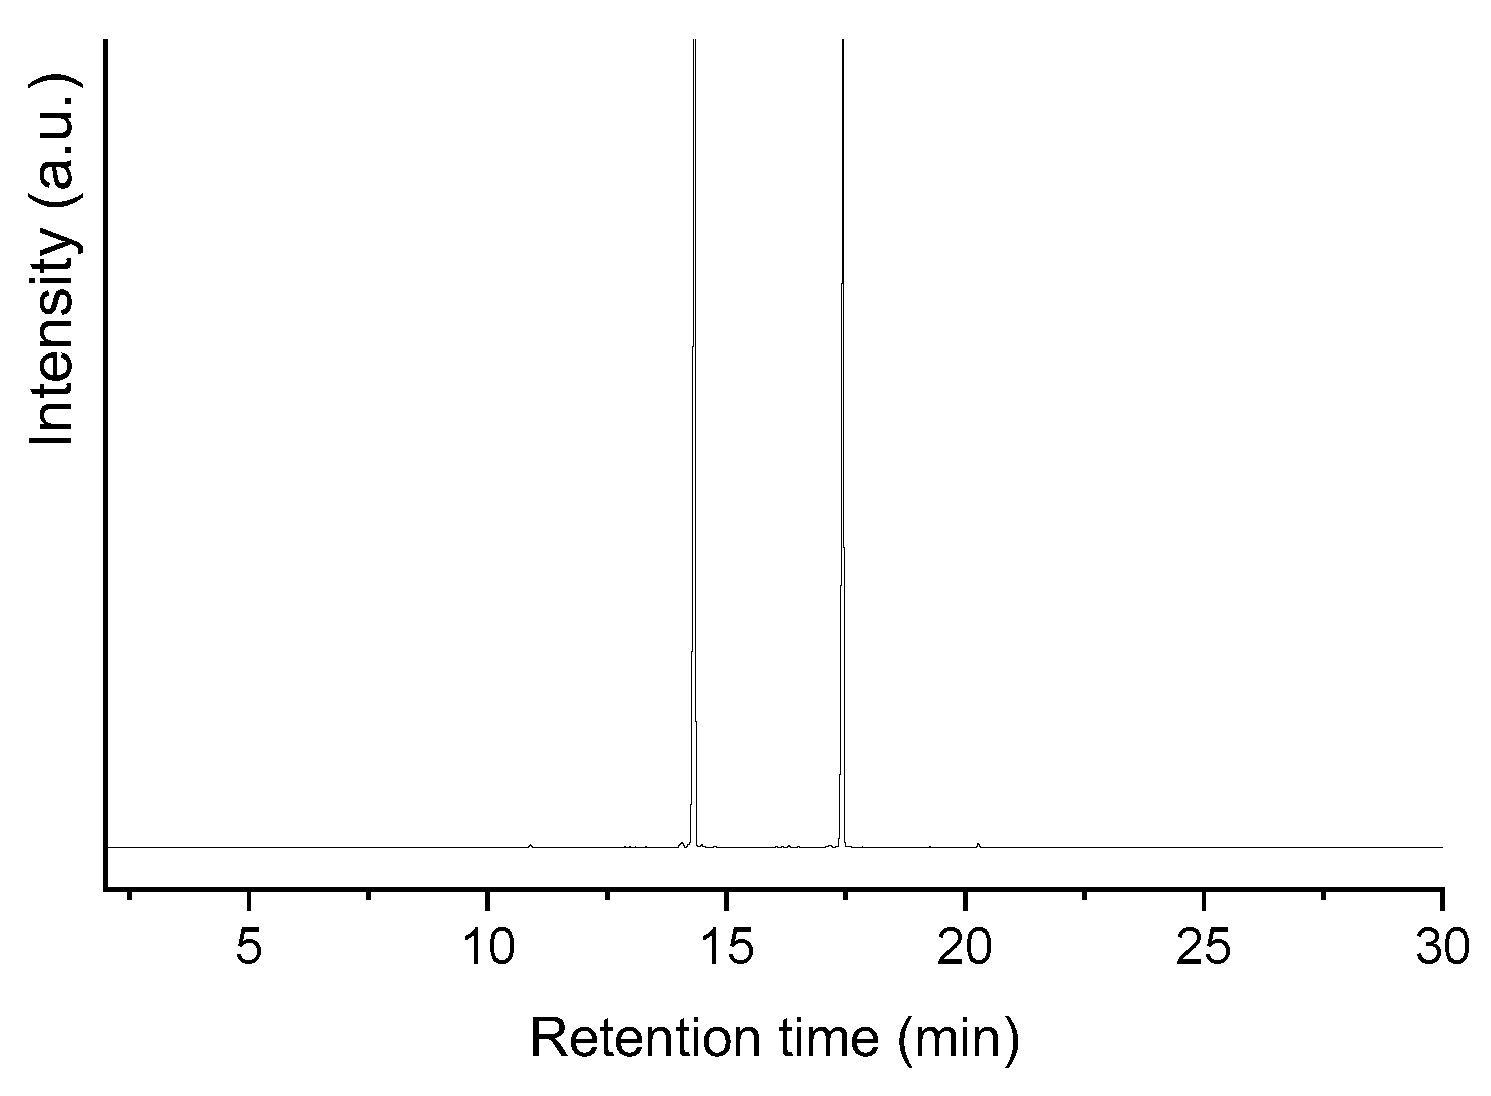
Figure 15.
(a) GC/FID chromatogram and FTIR spectra of (b) coconut oil and (c) the product of coconut oil HDO for 5 h using the sulf-Ni,Mo/P54-w,4 catalyst.
Figure 15.
(a) GC/FID chromatogram and FTIR spectra of (b) coconut oil and (c) the product of coconut oil HDO for 5 h using the sulf-Ni,Mo/P54-w,4 catalyst.
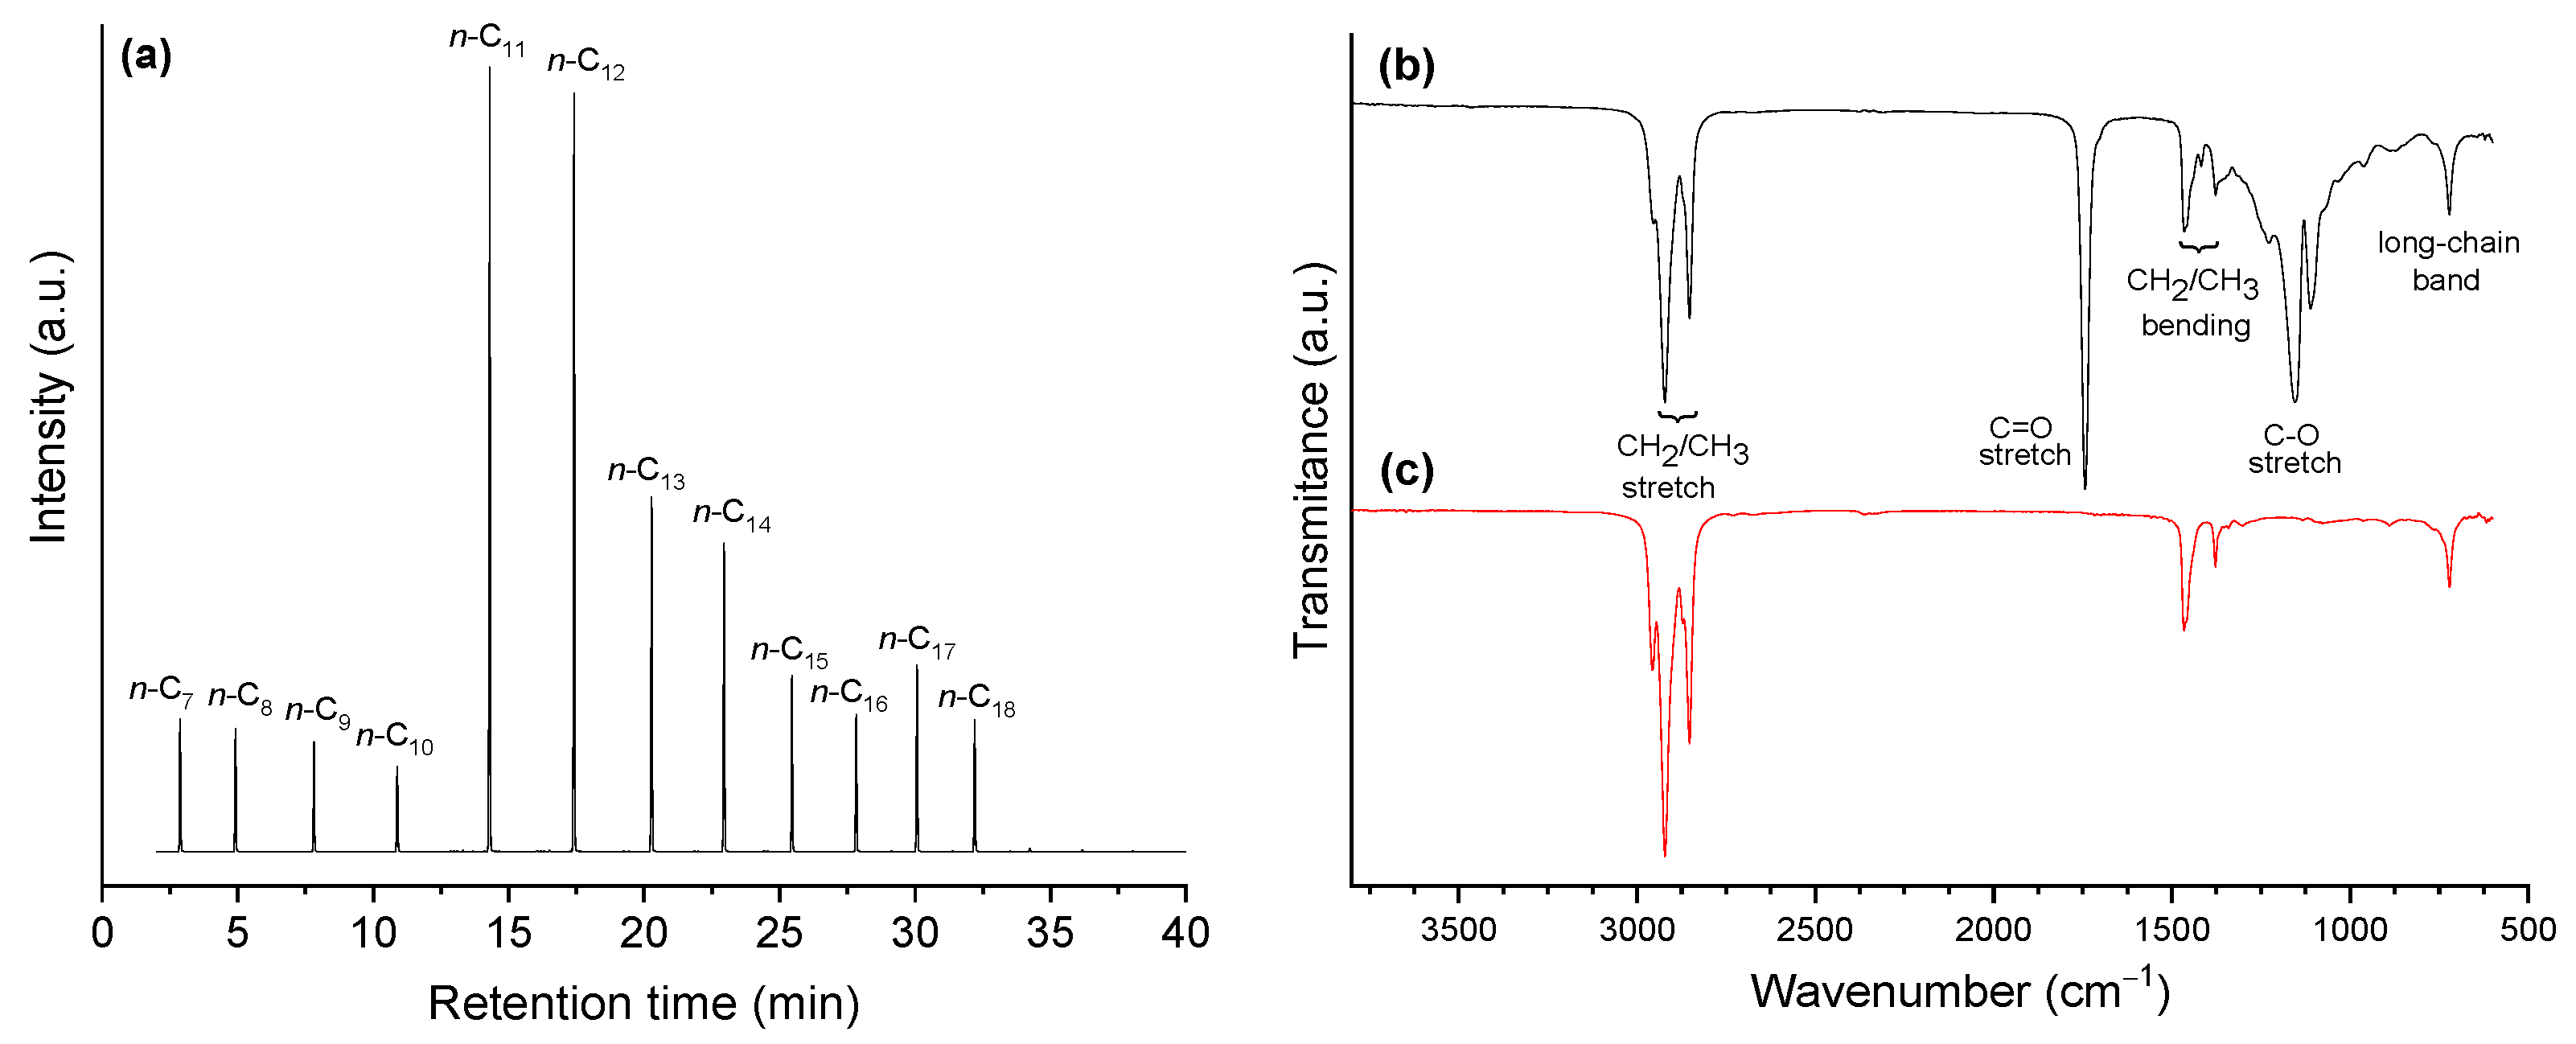

Table 1.
Textural characterization of P54 oxo-catalysts.
| Sample | SBET (m2 g–1) | Vmic (cm3 g–1) | Vmes (cm3 g–1) | V0.95 (cm3 g–1) |
|---|---|---|---|---|
| P54 | 1643 | 0.72 | 0.55 | 1.17 |
| oxo-Mo/P54-i,4 | 516 | 0.22 | 0.11 | 0.33 |
| oxo-Mo/P54-i,5 | 562 | 0.23 | 0.14 | 0.37 |
| oxo-NiMo/P54-i,4 | 862 | 0.34 | 0.24 | 0.58 |
| oxo-NiMo/P54-i,5 | 830 | 0.32 | 0.23 | 0.55 |
| oxo-NiMo/P54-w,4 | 812 | 0.32 | 0.22 | 0.54 |
| oxo-NiMo/P54-w,5 | 725 | 0.29 | 0.19 | 0.48 |
| oxo-Ni,Mo/P54-i,4 | 636 | 0.26 | 0.15 | 0.41 |
| oxo-Ni,Mo/P54-i,5 | 535 | 0.22 | 0.13 | 0.35 |
| oxo-Ni,Mo/P54-w,4 | 655 | 0.27 | 0.15 | 0.42 |
| oxo-Ni,Mo/P54-w,5 | 573 | 0.24 | 0.12 | 0.36 |
Table 2.
XPS elemental composition of P45 and some selected catalysts.
| Sample | Content (wt%) | ||||||||
|---|---|---|---|---|---|---|---|---|---|
| C | O | N | P | S | Si | Mo | Ni | ||
| P54 | 85.9 | 11.9 | - | 1.9 | - | 0.4 | - | - | |
| oxo-NiMo/P54-i,4 | 71.3 | 19.9 | 0.5 | 0.4 | 1.7 | 5.6 | 0.7 | ||
| oxo-NiMo/P54-w,4 | 70.2 | 14.2 | 0.8 | 0.8 | 0.7 | 12.4 | 1.0 | ||
| oxo-Ni,Mo/P54-w,4 | 56.3 | 18.3 | 1.2 | 0.9 | 0.7 | 21.7 | 1.0 | ||
| sulf-Ni,Mo/P54-w,4 | 29.1 | 17.3 | 0.5 | 0.5 | 24.0 | 27.7 | 1.0 | ||
Table 3.
Relative contributions of C 1s and O 1s peaks for P54 (data obtained from the HR-XPS core level spectra considering each element separately and, between brackets, all identified elements).
Table 3.
Relative contributions of C 1s and O 1s peaks for P54 (data obtained from the HR-XPS core level spectra considering each element separately and, between brackets, all identified elements).
| Relative contributions (wt%) | |||||
|---|---|---|---|---|---|
| CI | CII | CIII | CIV | OI | OII |
| 85.1 (73.1) | 9.0 (7.7) | 4.0 (3.5) | 1.9 (1.6) | 44.8 (5.3) | 55.19 (6.6) |
Table 4.
Data corresponding to the ash content, elemental analysis and Boehm titration of P54.
| Ash Content (wt%) |
Elemental Analysis | Titration (mmol g–1) | |||||||
|---|---|---|---|---|---|---|---|---|---|
| Acidity | Basicity | ||||||||
| C (wt%) | H (wt%) | N (wt%) | 1H/C | Strong | Medium | Weak | Total | Total | |
| 1.2 | 84.2 | 1.4 | 0.3 | 0.20 | 0.55 | 0.07 | 1.21 | 1.83 | 0.00 |
1Atomic ratio.
Table 5.
Mo and Ni contents determined by ICP/OES for the oxo-catalysts.
| Catalyst | Mo (wt%) | Ni (wt%) | 1 Ni/Mo |
|---|---|---|---|
| oxo-Mo/P54-i,4 | 15.1 | - | - |
| oxo-Mo/P54-i,5 | 18.3 | - | - |
| oxo-NiMo/P54-i,4 | 20.4 | 0.91 | 0.07 |
| oxo-NiMo/P54-i,5 | 17.5 | 1.02 | 0.10 |
| oxo-NiMo/P54-w,4 | 20.5 | 0.89 | 0.07 |
| oxo-NiMo/P54-w,5 | 15.9 | 0.91 | 0.09 |
| oxo-Ni,Mo/P54-i,4 | 16.9 | 0.70 | 0.07 |
| oxo-Ni,Mo/P54-i,5 | 15.6 | 1.00 | 0.10 |
| oxo-Ni,Mo/P54-w,4 | 19.5 | 0.88 | 0.07 |
| oxo-Ni,Mo/P54-w,5 | 12.6 | 0.93 | 0.12 |
1 Atomic ratio.
Table 6.
AIs of the liquid products obtained from the tests for lauric acid HDO.
| Entry | Catalyst | Feedostock | Reaction time (h) |
AI |
|---|---|---|---|---|
| 1 | P54 | Lauric acid | 3 | 264.4 |
| 2 | sulf-Mo/P54-i,4 | Lauric acid | 3 | 8.1 |
| 3 | Sulf-Mo/P54-i,5 | Lauric acid | 3 | 7.0 |
| 4 | sulf-NiMo/P54-i,4 | Lauric acid | 3 | 8.6 |
| 5 | sulf-NiMo/P54-i,5 | Lauric acid | 3 | 7.2 |
| 6 | sulf-NiMo/P54-w,4 | Lauric acid | 3 | 0.8 |
| 7 | sulf-NiMo/P54-w,5 | Lauric acid | 3 | 1.1 |
| 8 | sulf-Ni,Mo/P54-i,4 | Lauric acid | 3 | 2.0 |
| 9 | sulf-Ni,Mo/P54-i,5 | Lauric acid | 3 | 0.8 |
| 9’ | sulf-Ni,Mo/P54-i,5 | Lauric acid | 2 | 13.7 |
| 10 | sulf-Ni,Mo/P54-w,4 | Lauric acid | 3 | 0.5 |
| 10’ | sulf-Ni,Mo/P54-w,4 | Lauric acid | 2 | 1.9 |
| 11 | sulf-Ni,Mo/P54-w,5 | Lauric acid | 3 | 0.8 |
| 12 | sulf-Ni,Mo/P54-w,4 | Coconut oil | 3 | 1.1 |
| 12’ | sulf-Ni,Mo/P54-w,4 | Coconut oil | 5 | 0.0 |
Disclaimer/Publisher’s Note: The statements, opinions and data contained in all publications are solely those of the individual author(s) and contributor(s) and not of MDPI and/or the editor(s). MDPI and/or the editor(s) disclaim responsibility for any injury to people or property resulting from any ideas, methods, instructions or products referred to in the content. |
© 2025 by the authors. Licensee MDPI, Basel, Switzerland. This article is an open access article distributed under the terms and conditions of the Creative Commons Attribution (CC BY) license (http://creativecommons.org/licenses/by/4.0/).
Copyright: This open access article is published under a Creative Commons CC BY 4.0 license, which permit the free download, distribution, and reuse, provided that the author and preprint are cited in any reuse.


