
Submitted:
03 June 2025
Posted:
04 June 2025
You are already at the latest version
Abstract
Extreme precipitation events have become a central focus of the scientific community due to their increased occurrence in recent years. This study aims to analyze the variability and trends of aspects associated with the rainy seasons in the South American Monsoon System (SAMS) area from 1979 to 2022. The Onset and Demise of the Rainy Season (ONR and DER, respectively) dates were determined using antisymmetric Outgoing Longwave Radiation (OLR) data relative to the equator (AOLR) for the clustered regions defined in a previous work. Based on these dates, the duration of the rainy seasons and the total precipitation for each rainy season were also calculated. The main advantage of this study is the analysis of trends within homogeneous regions derived from cluster analysis, which enables a more reliable assessment of precipitation patterns across the spatially heterogeneous SAMS domain. The non-parametric Mann-Kendall test and Sen’s slope estimator were applied to the ONR, DER, rainy season length, and total precipitation time series for each group over the 1979–2022 period. Quartile analysis was performed on the total precipitation time series to identify the most and least intense rainy seasons in the SAMS´s regions. These analyses revealed a trend of shortening of the SAMS rainy season over the 44 years of analysis, with a positive trend in the ONR dates and a negative trend in the DER dates, which is further confirmed by the decreasing trends in rainy season length and accumulated precipitation in most analyzed regions. The most (above the third quartile) and least (below the first quartile) intense rainy seasons were found to be concentrated at the beginning and end of the study period, respectively for all monsoon regions. When the linear trend was removed, the distribution of events became more homogeneous over time, but the main drought events after 2010 remained. The results of this study contribute to a better understanding of the precipitation characteristics in the SAMS area and these findings may assist climate forecasting and monitoring centers in improving regional precipitation assessments.
Keywords:
extreme rainy seasons
; Mann-Kendall trend test
; South American monsoon system
; onset and demise dates
1. Introduction
Analysis of precipitation trends and aspects associated with the rainy season of the South American Monsoon System (SAMS) is extremely relevant, especially considering the significant increase in extreme events observed in recent years. Some extreme events, in the Amazon region, for example, are the droughts of 2005, 2010 and 2015-2016 [1,2,3,4,5] and the most recent in 2023 [6], while the floods of 2008-2009, 2012, 2014 [7,8,9,10] and the most recent in 2021 [11] were also observed. Concerning Southeastern Brazil, the severe drought in 2014/2015 [12] and the intense flood in 2021 [13] can be cited.
Thus, analyzing trends of precipitation allows for a better understanding of climate change and its consequences, aiding in the prediction and mitigation of negative impacts of climate extremes such as floods and prolonged droughts. Additionally, this understanding is crucial for developing public policies and strategies for managing water resources, agriculture, and infrastructure, enhancing community resilience to climate variations, and contributing to the safety and well-being of the population.
Most of the summer precipitation in tropical South America is associated with SAMS [14,15], with the onset of the rainy season (ONR) in the extreme northwest of the region occurring in mid-spring, followed by southeastward precipitation spreading and reaching peak precipitation in the austral summer (December, January and February; DJF); rainfall gradually decreases and goes into contraction, with the demise of the rainy season (DER) associated with SAMS being observed in mid-autumn [14,15,16,17,18,19,20,21,22,23,24,25].
Several studies have shown the presence of trends in hydrometeorological variables in South America and, mainly, in the SAMS area, as well as the increase trend of extreme events [26,27,28,29]. Consistent with the decrease in the precipitation values observed since 2000 in the Amazon region [1,2], Shimizu et al. [27] found a negative (positive) trend of wet (dry) extreme events in this region for the 1979-2014 period. More recently, Cerón et al. [29] obtained the spatial patterns of the trends of daily extreme precipitation indices for the 1981-2021 period. They found spatially and seasonally varying trends of the precipitation extremes over the Amazon Basin. They found for the frequency of precipitation extremes increases over Peruvian Amazon and northeast Brazilian Amazon and decreases in the central Amazon Basin, mainly during austral summer and autumn; and for the rainfall intensity indices decreases in Colombia and Bolivian Amazon and increases in northern and southern Peru during austral winter and spring. Analyzing some indices of extreme precipitation in the Metropolitan Region of the Paraiba Valley and North Coast of São Paulo for the period 1981-2022, Da Silva et al. [30] found an increase in the frequency and intensity of these indicators, mainly in the coastal region of São Paulo. In this context, Cerón et al. [31] analyzed 10 extreme daily rainfall indices in the La Plata Basin, which was divided in three homogeneous regions: northern, central and southern. Regarding the trend analysis of the annual total wet-day precipitation, they found increases in southern La Plata Basin and negative trend in northern La Plata Basin during the 1981-2018 period.
It is important to highlight that the occurrence of extreme precipitation events may be associated with anomalies found in oceanic regions, in atmospheric or sea surface temperature fields, which modify atmospheric circulations and through teleconnections generate an increase or decrease in rainfall on the continent [27,32,33,34,35].
With respect to the presence of trends in the ONR and DER dates, as well as the duration and total precipitation, Jones and Carvalho [36] found significant trends in precipitation data in the period 1979-2010, indicating early onset, late demise and longer durations. They used a combined index of precipitation, wind, specific humidity, and temperature in low levels for the entire area of the SAMS. Contrasting, Arias et al. [37] found delayed onsets since 1978 in the southern Amazon and earlier retreat of the North America Monsoon system (NAMS), which results in a shorter duration of the SAMS, consistent with Correa et al. [38] who found delayed SAMS onset during the period 1979-2018.
Since the SAMS encompasses a large area, this study aims to analyze long-term trends in precipitation, ONR and DER dates and duration, as well as identify the most and least intense rainy seasons in the study period considering separately homogenous regions within the SAMS. These regions were determined in a previous work [25]. As most studies analyze extreme events that occur on a scale of days, it is assumed that they can reflect on the accumulated monthly precipitation, resulting in a more intense or less intense rainy season [39,40]. Data and methodology are described in Section 2, the results and discussion can be found in Section 3, and the conclusions are presented in Section 4.
2. Materials and Methods
Daily OLR () available at the National Oceanic and Atmospheric Administration/Cooperative Institute for Research in Environment Science (NOAA-CIRES) Climate Diagnostics Center (CDC), Boulder, Colorado [41] and daily precipitation (mm) data obtained from the Climate Prediction Center (CPC) Global Unified Gauge-Based Analysis of Daily Precipitation [42,43] were used here. The horizontal resolution is 2.5° (0.5°) for OLR (precipitation) data and both were obtained from 1 January 1979 to 31 December 2022, in the area limited at 40°S, 40°N, 130°W and 30°W.
The OLR data were obtained from polar orbiting satellites, being the daily averages of the day and night measurements, which reduce the daily cycle [44] and the differences among satellites caused by the different equator crossing times [45]. The missing data were completed by Liebmann and Smith [46] who used a spatial and temporal interpolation method.
The regions found by Rodrigues et al. [25] through the Ward hierarchical clustering method (S1, S2, S3, S4 and S6) within the SAMS and their respective antisymmetric areas in northern Tropical America (NTA; N2 and N5) were used here. The SAMS’s regions are shown in Figure 1. It is worth noting that area S5 was not used for them and will not be used here either. For comparison purposes, the names of the regions will be maintained. Concerning the SAMS, S1 (S2) is in the central and western (northeastern) regions of the Amazon Basin; S3 extends from the southern Amazon Basin to western central Brazil (WCB), while S4 is in the northeastern La Plata Basin; and, finally, S6 is the east part of the SAMS area. As regards the NTA, N2 region extends from southern Mexico to Nicaragua, sub-regions that are owned to NAMS [47], while N5 (northern Venezuela and northern Guiana) is in northern South America. It is worth highlighting that N2 (N5) is the antisymmetric area to S1, S2 and S3 (S4 and S6), according to Rodrigues et al. [25].
The AOLR values were calculated between the SAMS’s and NTA’s regions above mentioned (Equation (1)):
Positive (negative) values of AOLR from Equation (1) indicate absence (presence) of convective activity in the SAMS’s regions. After, a 5-pentad running mean filter was applied to the AOLR time series and the ONR e DER pentads were defined when the filtered AOLR changes from positive to negative (negative to positive) in each region. The rainy season length (number of pentads from ONR to DER) and total precipitation (accumulated precipitation values from ONR to DER) are also calculated as in Rodrigues et al. [25].
The next step was to apply the non-parametric Mann-Kendall test and the Sen’s slope estimator in the ONR, DER, rainy season length and total precipitation time series for each group in the 1979-2022 period. These techniques have been used in several works to analyze the trend of hydrometeorological time series [27,48,49,50]. The non-parametric Mann-Kendall test indicates whether there is an increasing or decreasing trend for the analyzed variable or whether there is no trend, while the Sen’s slope estimator shows the trend magnitude.
In the Mann-Kendall test, the value of S is calculated as follows [51,52]:
where n is the number of points in the time series, and are the values in the time series, and the sign function is defined as:
Thus, the variance of S is calculated by the formula:
where is the amount of data with equal values in certain group and is the number of groups that contain equal values in the time series. Therefore, the Mann-Kendall test is given by Equation (5):
Hence, positive (negative) values of indicate the increasing (decreasing) trend of the analyzed variable. Using the 5% significance level, the null hypothesis ( = there is no trend) is rejected when (the value of is obtained from the standard normal distribution) and, because of this, there is a significant trend in the time series.
The Sen’s slope estimator is a method that estimates the inclination of the trend assuming a linear association. The slopes of the combined data pairs are calculated by Equation (6):
where and are the data values in the times and . Then, these slopes are ordered from smallest to largest to determine the median value, which is Sen’s slope estimator , calculated by if n is odd or by if n is even. The magnitudes of indicates the rate of increase or decrease of the variable in the analyzed period.
The quartile analysis was also applied to precipitation time series to identify the most intense and weakest rainy seasons in the SAMS’s regions. This technique is widely used in works of extreme precipitation events in South America [26,27,33,50,53,54,55]. Thus, the accumulated precipitation during the rainy season was ordered and the first (Q1) and third (Q3) quartiles were found for each region. After that, the most intense and weakest rainy seasons were found. As these time series have linear trends, it was removed, and the quartile analysis was performed again for comparison purposes.
3. Results and Discussion
3.1. ONR, DER and Length of Rainy Seasons
Figure 2 illustrates the time series of ONR and DER pentads, the length (in pentads) and the total precipitation in each rainy season (accumulated precipitation values from the ONR pentad to the DER pentad, in mm) for each region referring to the SAMS of rainy seasons from 1979-1980 to 2021-2022. The values of the Mann-Kendall trend and the Sen’s slope estimator for these time series in the SAMS’s regions are in Table 1.
Concerning ONR pentads, a positive trend can be observed for all regions, except the S4, which showed a negative trend. A positive trend in ONR dates indicates a tendency for these dates to occur later in the period of study. The positive trend was significant only for S3 region (Figure 2a), with a delay in the ONR of 0.0588 pentads per year, totaling 2.53 pentads of postponement throughout the analysis period (Table 1), what is coherent with Arias et al. [37] and Correa et al. [38].
Regarding the DER, except for region S2 with a positive trend, all other regions exhibited a negative trend in dates (DER occurring earlier from the beginning to the end of the study period), with a significant trend only in S1 (Figure 2b and Table 1). Although the DER trend was significant in region S1, consistent with Jones and Carvalho [36], the Sen’s slope value was very close to zero.
Another aspect that can be noted in Figure 2 is a trend of decreasing rainy season length in this period, indicated by a negative trend in this index in all regions except in S4 (Figure 2c and Table 1). As for ONR, a significant trend value was observed for region S3, with a decrease of 0.0833 pentads per year, totaling 3.58 fewer pentads in the rainy season duration from the beginning to the end of the analysis period (Table 1; Jones and Carvalho, [36]).
3.2. Accumulated Precipitation of the Rainy Seasons
The behavior of the last index analyzed was common to all five regions, showing a negative trend in accumulated precipitation in the rainy seasons. In other words, all the monsoon regions analyzed exhibit a trend of reduced precipitation during the rainy season in the period from 1979 to 2022; the S2 region was the only one that did not show a significant trend (Figure 2d and Table 1). The rates of reduction are 6.3498 mm/year for S6; 7.1430 mm/year for S4; 10.5465 mm/year for S1; and the highest rate of 12.8134 mm/year for S3, which total reductions of 273 mm for S6, 307.15 mm for S4, 453.5 mm for S1, and 563 mm for S3 throughout the entire period (Table 1). These series will be analyzed in more detail in Figure 3.
Thus, it becomes important to highlight that there is a trend of rainy season shortening associated with the SAMS over the 44 years of analysis, as observed mainly for regions S1, S3, and S6 (central and western of the Amazon Basin; southern Amazon Basin to WCB; and the east part of the SAMS, respectively). The positive (negative) trend in ONR (DER) dates, confirmed by the also negative trend in the length of the rainy seasons and accumulated precipitation, results in shorter rainy seasons over the years and, therefore, lower precipitation values, consistent with previous studies [37,38,56]. Concerning S4 region, Cerón et al. [31] also found a negative trend in the extreme precipitation and total precipitation indices and a positive trend in the number of consecutive dry days for this region, consistent with the results of Zandonadi et al. [57] and Rafee et al. [58] using meteorological stations and Avila-Diaz et al. [59] who used Earth System Models.
Figure 3 illustrates the accumulated precipitation series during the rainy season in each of the five monsoon areas, with the respective first (bottom line) and third (top line) quartiles of each series (Q1 and Q3, respectively). The column on the left refers to the series with trend (as already shown in Figure 2), whose Mann-Kendall trend and Sen’s slope estimator values can be seen in Table 1, while the figures on the right show the series with the linear trend removed (Figure 3).
As already discussed in Figure 2, all areas show a negative trend in the accumulated precipitation series during the rainy season, being non-significant only in the S2 region. Thus, for regions S1, S3, S4 and S6, most years with accumulated precipitation greater than Q3 (most intense rainy seasons) are found in the beginning of the study period, while the years with precipitation accumulated lower than Q1 (weakest rainy seasons) are found in the most recent years (Figure 3a–e).
In fact, the accumulated precipitation values in area S1 (extreme northwest of Amazonia) vary from 1317 to 1970 mm, presenting a clear negative trend in the period of study, as shown earlier (Figure 3a). Figure 4 complements this analysis as it shows the years with the most intense rainy seasons (total precipitation above Q3; olive green bars) and the years with the weakest rainy seasons (total precipitation below Q1; terracotta bars). It is interesting to note that, for S1, the last rainy season with precipitation above Q3 was 1996-1997. In this area, 8 of 11 rainy seasons with precipitation below Q1 were observed between 2004 and 2021, while the 11 rainy seasons with precipitation above Q3 occurred between 1981 and 1996.
Similarly, area S3 (region that extends from southern Amazon Basin to WCB) showed minimum (maximum) accumulated precipitation value of 1040 (1834) mm, being the 1996-1997 as the penultimate rainy season with precipitation above Q3, while the last one was 2003-2004 (Figure 3c). Therefore, 10 of 11 precipitation events below Q1 are observed after 2005 (Figure 4). Coherently, as expected, the droughts of 2005, 2010 and 2015-2016 [1,2,3,4,5] were found in the quartile analysis, as the cases with precipitation below Q1 for S1 and S3 regions. Thus, these results are consistent with those found in the literature regarding the tendency of drier events to increase in the Amazon region in most recent years [1,2,27].
The region S2 (northeastern of the Amazon Basin) presents the greatest variations between minimum and maximum values, ranging from 1075 to 2214 mm (Figure 3b). As shown previously, this area did not present significant value of trend, despite being negative, as in other areas. Because of this, the events are better distributed compared with the other areas (Figure 4). In fact, although 6 out of 11 events below Q1 were observed from 2004 onwards, the last event was in 2015-2016, a different behavior from the other monsoon regions analyzed. Concerning events with accumulated precipitation above Q3, it can be noted that 8 out of 11 events were observed until 1999.
Regarding region S4 (northeastern La Plata Basin), the lowest value found in the series is close to 460 mm and the highest is above 1375 mm, being the decrease in accumulated precipitation values very remarkable from 2011 onwards (Figure 3d). In this region, it is important to highlight that the lowest accumulated precipitation value was in 2011-2012, followed by the rainy season of 2019-2020. When Figure 4 is analyzed, it is worth noting that the rainy season 2014-2015 appears as one of the weakest rainy seasons observed in this region, being the water deficit due to anomalous high-pressure systems, configuring one of the most intense droughts in the state of São Paulo [12,60].
The region S6 (eastern portion of the SAMS area) has the lowest accumulated precipitation values compared to the previous regions, with the variation between maximum and minimum values being approximately 259 mm to 913 mm (Figure 3e). Precipitation events below Q1 (above Q3) are distributed more irregularly (regularly) throughout the period (Figure 4). As the region covers the states of Minas Gerais, Bahia, Piauí and Maranhão (with greater precipitation variation in the meridional direction), the intense events in the rainy seasons of 2013-2014 and 2014-2015 may have been influenced by the anomalous high-pressure system formed over Southeast Brazil that includes Minas Gerais [60] as identified in region S4. The seven years (2011 to 2017) of water deficit in region S6 may be related to the severe drought period that occurred in Northeast Brazil that generated serious environmental, social and economic impacts in the region [61,62,63].
3.3. Accumulated Precipitation with No Linear Trend
The linear trend helps identifying significant and persistent changes in the data over a prolonged period, which may indicate global warming or cooling, changes in precipitation patterns, or other long-term climate alterations. Removing the linear trend helps isolate and analyze the intrinsic climatic variability, offering a clearer view of patterns and behaviors that are inherent to the climate system.
The column on the right in Figure 3 refers to the series of accumulated precipitation for all regions of study with the linear trend removed. When removing the trend, the maximum and minimum accumulated precipitation events are more evenly distributed over the years (Figure 3f–j). As in Figure 4, Figure 5 shows the years with the most intense rainy seasons (total precipitation above Q3; olive green bars) and the years with the weakest rainy seasons (total precipitation below Q1; terracotta bars) of the series without linear trend.
Regarding region S1, located in the central and western part of the Amazon Basin, it is noted that, for the weakest rainy seasons (accumulated precipitation below Q1), 8 of 11 were observed in the series with trend and continue to be observed in the series with no trend (Figure 4 and Figure 5). Among them, it is worth highlighting the important drought events already recorded in the literature in the years 2005, 2010 and 2015-2016 [1,2,3,4,5]. Analyzing the most intense rainy seasons (accumulated precipitation above Q3), the agreement is for only 6 of 11 rainy seasons, being observed until the year 1997 (Figure 4 and Figure 5).
As the northeastern region of the Amazon Basin (region S2) was the only one that did not present a significant trend in the accumulated precipitation series, it can be noted that there is an agreement in all eleven weakest rainy season events in the two series. Regarding the most intense rainy seasons, only one was not consistent between the series with and without trend (Figure 4 and Figure 5).
Region S3 showed the greatest tendency for reduction in accumulated precipitation values during the study period, with the highest rate of 12.8134 mm/year, as previously discussed (Table 1 and Figure 3). Therefore, it was expected that the events of most intense and weakest rainy seasons would not overlap in the series with and without trend. In fact, only 6 of 11 events were the same in both series, and they belonged to the first (last) years of the period in the cases of most intense (weakest) rainy seasons (Figure 4 and Figure 5).
The last two areas, S4 (northeastern La Plata Basin) and S6 (east part of the SAMS area) presented very similar trend negative values (7.1430 and 6.3498 mm/year, respectively), which caused the behavior in the separation of events to be similar as well. For S4, 9 of 11 (8 of 11) were the rainy seasons that remained in the selection of cases with accumulated precipitation below Q1 (above Q3), while these values for region S6 were 8 of 11 for both cases.
4. Conclusions
In this study, aspects related to the variability and trends of precipitation in the South American Monsoon System (SAMS) region were analyzed for the period from 1979 to 2022. The SAMS’s regions identified by Rodrigues et al. [25] through the clustering method of Outgoing Longwave Radiation (OLR) data, as well as the method for detecting the Onset and Demise of Rainy Season (ONR and DER, respectively) using antisymmetric OLR (AOLR), were employed.
The SAMS’s regions identified by Rodrigues et al. [25] using the Ward hierarchical clustering method (S1, S2, S3, S4, and S6), along with their respective antisymmetric counterparts in Northern Tropical America (NTA; N2 and N5), were used in this study. In the SAMS domain, S1 and S2 are in the central-western and northeastern Amazon Basin, respectively; S3 spans from the southern Amazon Basin to western Central Brazil (WCB); S4 covers the northeastern portion of the La Plata Basin; and S6 lies in the eastern part of the SAMS area. In the NTA, N2 stretches from southern Mexico to Nicaragua - areas associated with the North American Monsoon System (NAMS), as defined by Vera et al. [47], while N5 encompasses northern Venezuela and northern Guiana in northern South America. It is important to note that, as established by Rodrigues et al. [25], N2 is the antisymmetric counterpart of S1, S2, and S3, while N5 corresponds to S4 and S6.
One of the key strengths of this study lies in analyzing precipitation trends within these homogeneous regions identified by cluster analysis, which allows for a more spatially consistent and robust evaluation across the highly heterogeneous SAMS domain. Thus, a 5-pentad running mean filter was applied to the AOLR time series for each region and the AOLR changes from positive to negative (negative to positive) indicates the ONR (DER) dates. The rainy season length (number of pentads from ONR to DER) and total precipitation (accumulated precipitation values from ONR to DER) are also analyzed.
In addition, the non-parametric Mann-Kendall test and Sen’s slope estimator were applied to these time series over the 1979–2022 period. Overall, a significant negative trend in precipitation was observed in all regions during the study period, along with a positive trend in ONR dates, a negative trend in DER dates, and a negative trend in season length, already implying a shortening of the rainy seasons. These results may be associated with the increasing trend of consecutive dry days reported in the Amazon, WCB and southeastern South America [27,37,38,56]. Regarding northern La Plata Basin, the results here are consistent with the negative trend in annual total wet-day precipitation during the 1981-2018 period previously documented by Cerón et al. [31].
Next, the quartile technique was applied to the total precipitation time series of the rainy seasons in each SAMS region to identify the most intense (above the third quartile) and least intense (below the first quartile) seasons. Consistently, the most intense (least intense) events, defined as the 25% highest (lowest) total precipitation values, were concentrated at the beginning (end) of the study period. When the linear trend was removed from the precipitation series, the events were more evenly distributed over the entire period. It is worth highlighting the major drought events of 2005, 2010, and 2015–2016 [1,2,3,4,5], which continue to be observed in the series without a trend in region S1. Similarly, four precipitation events below the first quartile continue to be observed in region S6, highlighting the severity of the drought that affected the Northeast region from 2011 to 2017 [61,62,63].
Therefore, this study analyzed the trends of precipitation-related variables in the SAMS rainy seasons, confirming a tendency toward decreasing rainfall—especially from 2010 onward—as well as shorter rainy seasons. These changes can directly affect sectors such as agriculture and energy production. Thus, this work is expected to contribute to the scientific community and society at large by improving the understanding of rainy season characteristics in the tropical region of South America.
Author Contributions
Conceptualization, S.R.G. and M.A.M.R.; methodology, S.R.G., M.A.M.R., M.T.K. and A.J.P.C.; investigation, S.R.G. and M.A.M.R.; data curation, M.A.M.R.; writing—original draft preparation, S.R.G. and M.A.M.R.; writing—review and editing, S.R.G., M.A.M.R., M.T.K. and A.J.P.C.; visualization, M.A.M.R.; supervision, S.R.G. All authors have read and agreed to the published version of the manuscript.
Funding
This research was funded by Conselho Nacional de Desenvolvimento Científico e Tecnológico (CNPq) of Brazil, grant number 133154/2019-0 and 444205/2024-1.
Data Availability Statement
The NOAA Interpolated Outgoing Longwave Radiation (OLR) and the Global Unified Gauge-Based Analysis of Daily Precipitation data used in this study are available in https://psl.noaa.gov/data/gridded/data.olrcdr.interp.html and https://psl.noaa.gov/data/gridded/data.cpc.globalprecip.html, respectively (both accessed on 16 April 2023).
Acknowledgments
We thank NOAA’s Climate Diagnostics Center and NOAA’s Climate Prediction Center for providing access to the data used in this study.
Conflicts of Interest
The authors declare no conflicts of interest.
Abbreviations
- The following abbreviations are used in this manuscript:
| AOLR | Antisymmetric Outgoing Longwave Radiation |
| DER | Demise of the Rainy Season |
| DJF | December, January and February |
| NAMS | North American Monsoon System |
| NTA | Northern Tropical America |
| OLR | Outgoing Longwave Radiation |
| ONR | Onset of the Rainy Season |
| SAMS | South American Monsoon System |
| WCB | Western Central Brazil |
References
- Marengo, J.A.; Nobre, C.A.; Tomasella, J.; Oyama, M.; Sampaio, G.; Camargo, H.; Alves, L.; Oliveira, R. The drought of Amazonia in 2005. J. Clim. 2008, 21, 495–516. [Google Scholar] [CrossRef]
- Lewis, S.L.; Brando, P.M.; Phillips, O.L.; van der Heijden, G.M.; Nepstad, D. The 2010 Amazon drought. Science 2011, 331(6017), 554. [CrossRef]
- Coelho, C.A.S.; Cavalcanti, I.A.F.; Costa, S.M.S.; Freitas, S.R.; Ito, E.R.; Luz, G.; Santos, A.F.; Nobre, C.A.; Marengo, J.A.; Pezza, A.B. Climate diagnostics of three major drought events in the Amazon and illustrations of their seasonal precipitation predictions. Meteorol. Appl. 2012, 19, 237–255. [Google Scholar] [CrossRef]
- Marengo, J.A.; Espinoza, J.C. Extreme seasonal droughts and floods in Amazonia: causes, trends and impacts. Int. J. Climatol. 2016, 36, 1033–1050. [Google Scholar] [CrossRef]
- Papastefanou, P.; Zang, C.S.; Angelov, Z.; Castro, A.A.; Jimenez, J.C.; Rezende, L.F.C.; Ruscica, R.C.; Sakschewski, B.; Sörensson, A.A.; Thonicke, K.; Vera, C.; Viovy, N.; Randow, C.V.; Rammig, A. Recent extreme drought events in the Amazon rainforest: Assessment of different precipitation and evapotranspiration datasets and drought indicators. Biogeosciences 2022, 19, 3843–3861. [Google Scholar] [CrossRef]
- Espinoza, J.C.; Jimenez, J.C.; Marengo, J.A.; Schöngart, J.; Ronchail, J.; Lavado-Casimiro, W.; Ribeiro, J.V.M. The new record of drought and warmth in the Amazon in 2023 related to regional and global climatic features. Sci. Rep. 2024, 14, 8107. [Google Scholar] [CrossRef]
- Marengo, J.A.; Tomasella, J.; Soares, W.R.; Alves, L.M.; Nobre, C.A. Extreme climatic events in the Amazon basin: Climatological and hydrological context of recent floods. Theor. Appl. Climatol. 2012, 107, 73–85. [Google Scholar] [CrossRef]
- Marengo, J.A.; Alves, L.M.; Soares, W.R.; Rodriguez, D.A. Two Contrasting Severe Seasonal Extremes in Tropical South America in 2012: Flood in Amazonia and Drought in Northeast Brazil. J. Clim. 2013, 26, 9137–9154. [Google Scholar] [CrossRef]
- Espinoza, J.C.; Ronchail, J.; Frappart, F.; Lavado, W.; Santini, W.; Guyot, J.L. The major floods in the Amazonas River and tributaries (Western Amazon Basin) during the 1970–2012 period: A focus on the 2012 flood. J. Hydrometeorol. 2013, 14, 1000–1008. [Google Scholar] [CrossRef]
- Espinoza, J.C.; Marengo, J.A.; Ronchail, J.; Carpio, J.M.; Flores, L.N.; Guyot, J.L. The extreme 2014 flood in south-western Amazon basin: the role of tropical-subtropical South Atlantic SST gradient. Environ. Res. Lett. 2014, 9, 124007 (9 pp). [CrossRef]
- Espinoza, J.C.; Marengo, J.A.; Schöngart, J.; Jimenez, J.C. The new historical flood of 2021 in the Amazon River compared to major floods of the 21st century: atmospheric features in the context of the intensification of floods. Weather Clim. Extremes 2022, 35, 100406. [Google Scholar] [CrossRef]
- Coelho, C.A.S.; Oliveira, C.P.; Ambrizzi, T.; Reboita, M.S.; Carpenedo, C.B.; Campos, J.L.P.S.; Tomaziello, A.C.N.; Pampuch, L.A.; Custódio, M.S.; Dutra, L.M.M.; Rocha, R.P.; Rehbein, A. The 2014 southeast Brazil austral summer drought: regional scale mechanisms and teleconnections. Clim. Dyn. 2016, 46, 3737–3752. [Google Scholar] [CrossRef]
- Marengo, J.A.; Seluchi, M.E.; Cunha, A.P.; Cuartas, L.A.; Gonçalves, D.; Sperling, V.B.; Ramos, A.M.; Dolif, G.; Saito, S.; Bender, F.; Lopes, T.R.; Alvalá, R.C.; Moraes, O.L. Heavy rainfall associated with floods in southeastern Brazil in November–December 2021. Nat. Hazards 2023, 116, 3617–3644. [Google Scholar] [CrossRef]
- Rao, V.B.; Cavalcanti, I.F.A.; Hada, K. Annual variation of rainfall over Brazil and water vapor characteristics over South America. J. Geophys. Res. Atmos. 1996, 101, 26539–26551. [Google Scholar] [CrossRef]
- Zhou, J.Y.; Lau, K.M. Does a monsoon climate exist over South America? J. Clim. 1998, 11, 1020–1040. [Google Scholar] [CrossRef]
- Marengo, J.; Liebmann, B.; Kousky, V.E.; Filizola, N.; Wainer, I. On the onset and end of the rainy season in the Brazilian Amazon Basin. J. Clim. 2001, 14, 833–852. [Google Scholar] [CrossRef]
- Gan, M.A.; Kousky, V.E.; Ropelewski, C.F. The South America monsoon circulation and its relationship to rainfall over West-Central Brazil. J. Clim. 2004, 17, 47–66. [Google Scholar] [CrossRef]
- Liebmann, B.; Camargo, S.J.; Seth, A.; Marengo, J.; Carvalho, L.M.V.; Allured, D.; Fu, R.; Vera, C.S. Onset and end of the rainy season in South America in Observations and the ECHAM 4.5 Atmospheric General Circulation Model. J. Clim. 2007, 20, 2037–2050. [Google Scholar] [CrossRef]
- Garcia, S.R.; Kayano, M.T. Determination of the onset dates of the rainy season in central Amazon with equatorially antisymmetric outgoing longwave radiation. Theor. Appl. Climatol. 2009, 97, 361–372. [Google Scholar] [CrossRef]
- Garcia, S.R.; Kayano, M.T. Moisture and heat budgets associated with the South American monsoon system and the Atlantic ITCZ. Int. J. Climatol. 2011, 31, 2154–2167. [Google Scholar] [CrossRef]
- Garcia, S.R.; Kayano, M.T. Some considerations on onset dates of the rainy season in Western-Central Brazil with antisymmetric outgoing longwave radiation relative to the equator. Int. J. Climatol. 2013, 33, 188–198. [Google Scholar] [CrossRef]
- Garcia, S.R.; Kayano, M.T. Multidecadal variability of moisture and heat budgets of the South American monsoon system. Theor. Appl. Climatol. 2015, 121, 557–570. [Google Scholar] [CrossRef]
- Garcia, S.R.; Calheiros, A.J.P.; Kayano, M.T. Revised method to detect the onset and demise dates of the rainy season in the South American Monsoon areas. Theor. Appl. Climatol. 2016, 126, 481–491. [Google Scholar] [CrossRef]
- Garcia, S.R.; Kayano, M.T.; Calheiros, A.J.P.; Andreoli, R.V.; Souza, R.A.F. Moisture and heat budgets of the South American monsoon system: climatological aspects. Theor. Appl. Climatol. 2017, 130, 233–247. [Google Scholar] [CrossRef]
- Rodrigues, M.A.M.; Garcia, S.R.; Kayano, M.T.; Calheiros, A.J.P.; Andreoli, R.V. Onset and demise dates of the rainy season in the South American monsoon region: A cluster analysis result. Int. J. Climatol. 2022, 42, 1354–1368. [Google Scholar] [CrossRef]
- Natividade, U.A.; Garcia, S.R.; Torres, R.R. Tendência dos índices de extremos climáticos observados e projetados no Estado de Minas Gerais. Rev. Bras. Meteorol. 2017, 32, 600–614. [Google Scholar] [CrossRef]
- Shimizu, M.H.; Ambrizzi, T.; Liebmann, B. Extreme precipitation events and their relationship with ENSO and MJO phases over northern South America. Int. J. Climatol. 2017, 37, 2977–2989. [Google Scholar] [CrossRef]
- Pascale, S.; Carvalho, L.M.V.; Adams, D.K.; Castro, C.L.; Cavalcanti, I.F.A. Current and Future Variations of the Monsoons of the Americas in a Warming Climate. Curr. Clim. Change Rep. 2019, 5, 125–144. [Google Scholar] [CrossRef]
- Céron, W.L.; Kayano, M.T.; Andreoli, R.V.; Canchala, T.; Avila-Diaz, A.; Ribeiro, I.O.; Rojas, J.D.; Escobar-Carbonari, D.; Tapasco, J. New insights into trends of rainfall extremes in the Amazon basin through trend-empirical orthogonal function (1981–2021). Int. J. Climatol. 2024, 44, 3955–3975. [Google Scholar] [CrossRef]
- Da Silva, R.C.; Marengo, J.A.; Lemes, M.R. Analysis of extreme rainfall and landslides in the metropolitan region of the Paraiba do Sul River Valley and North Coast of Sao Paulo, Brazil. Theor. Appl. Climatol. 2024, 155, 3927–3949. [Google Scholar] [CrossRef]
- Cerón, W.L.; Kayano, M.T.; Andreoli, R.V.; Avila-Diaz, A.; Ayes, I.; Freitas, E.D.; Martins, J.A.; Souza, R.A.F. Recent intensification of extreme precipitation events in the La Plata Basin in Southern South America (1981–2018). Atmos. Res. 2021, 249, 105299. [Google Scholar] [CrossRef]
- Zhou, J.Y.; Lau, K.M. Principal modes of interannual and decadal variability of summer rainfall over South America. Int. J. Climatol. 2001, 21, 1623–1644. [Google Scholar] [CrossRef]
- Grimm, A.M.; Laureanti, N.C.; Rodakoviski, R.B.; Gama, C.B. Interdecadal variability and extreme precipitation events in South America during the monsoon season. Clim. Res. 2016, 68, 277–294. [Google Scholar] [CrossRef]
- Kayano, M.T.; Andreoli, R.V.; Souza, R.A.F. El Niño–Southern Oscillation related teleconnections over South America under distinct Atlantic Multidecadal Oscillation and Pacific Interdecadal Oscillation backgrounds: La Niña. Int. J. Climatol. 2019, 39, 1359–1372. [Google Scholar] [CrossRef]
- Kayano, M.T.; Andreoli, R.V.; Souza, R.A.F. Pacific and Atlantic multidecadal variability relations to the El Niño events and their effects on the South American rainfall. Int. J. Climatol. 2020, 40, 2183–2200. [Google Scholar] [CrossRef]
- Jones, C.; Carvalho, L.M.V. Climate Change in the South American Monsoon System: Present Climate and CMIP5 Projections. J. Clim. 2013, 26, 6660–6678. [Google Scholar] [CrossRef]
- Arias, P.; Fu, R.; Vera, C.; Rojas, M. A correlated shortening of the North and South American monsoon seasons in the past few decades. Clim. Dyn. 2015, 45, 3183–3203. [Google Scholar] [CrossRef]
- Correa, I.C.; Arias, P.A.; Rojas, M. Evaluation of multiple indices of the South American monsoon. Int. J. Climatol. 2021, 41, E2801–E2819. [Google Scholar] [CrossRef]
- Grimm, A.M.; Tedeschi, R.G. ENSO and extreme rainfall events in South America. J. Clim. 2009, 22, 1589–1609. [Google Scholar] [CrossRef]
- Hirata, F.E.; Grimm, A.M. The role of synoptic and intraseasonal anomalies in the life cycle of summer rainfall extremes over South America. Clim. Dyn. 2016, 46, 3041–3055. [Google Scholar] [CrossRef]
- NOAA/CIRES (National Oceanic and Atmospheric Administration/Cooperative Institute for Research in Environmental Sciences) OLR data. Available online: https://psl.noaa.gov/data/gridded/data.olrcdr.interp.html (accessed on 16 April 2023).
- Xie, P.; Chen, M.; Yang, S.; Yatagai, A.; Hayasaka, T.; Fukushima, Y.; Liu, C. A gauge-based analysis of daily precipitation over East Asia. J. Hydrometeorol. 2007, 8, 607–626. [Google Scholar] [CrossRef]
- Chen, M.; Shi, W.; Xie, P.; Silva, V.B.S.; Kousky, V.E.; Higgins, R.W.; Janowiak, J.E. Assessing objective techniques for gauge-based analyses of global daily precipitation. J. Geophys. Res. Atmos. 2008, 113, D04110. [Google Scholar] [CrossRef]
- Schmetz, J.; Liu, Q. Outgoing longwave radiation and its diurnal variation at regional scales derived from Meteosat. J. Geophys. Res. 1988, 93, 11192–11204. [Google Scholar] [CrossRef]
- Kousky, V.E. Pentad outgoing longwave radiation climatology for the South American sector. Rev. Bras. Meteorol. 1988, 3, 217–231. [Google Scholar]
- Liebmann, B.; Smith, C.A. Description of complete (interpolated) outgoing longwave radiation data set. Bull. Am. Meteorol. Soc. 1996, 77, 1275–1277. [Google Scholar]
- Vera, C.; Higgins, W.; Amador, J.; Ambrizzi, T.; Garreaud, R.; Gochis, D.; Gutzler, D.; Lettenmaier, D.; Marengo, J.; Mechoso, C.R.; Nogues-Paegle, J.; Dias, P.L.S.; Zhang, C. Toward a unified view of the American Monsoon Systems. J. Clim. 2006, 19, 4977–5000. [Google Scholar] [CrossRef]
- Douglas, E.M.; Vogel, R.M.; Kroll, C.N. Trends in floods and low flows in the United States: impact of spatial correlation. J. Hydrol. 2000, 240, 90–105. [Google Scholar] [CrossRef]
- Yue, S.; Pilon, P.; Phinney, B.; Cavadias, G. The influence of autocorrelation on the ability to detect trend in hydrological series. Hydrol. Process. 2002, 16, 1807–1829. [Google Scholar] [CrossRef]
- Zilli, M.T.; Carvalho, L.M.V.; Liebmann, B.; Silva Dias, M.A. A comprehensive analysis of trends in extreme precipitation over southeastern coast of Brazil. Int. J. Climatol. 2017, 37, 2269–2279. [Google Scholar] [CrossRef]
- Mann, H.B. Non-parametric test against trend. Econometrika 1945, 13, 245–259. [Google Scholar] [CrossRef]
- Kendall, M.G. Rank Correlation Methods, 4th ed.; Charles Griffin: London, UK, 1975; p. 196. [Google Scholar]
- Tedeschi, R.G.; Grimm, A.M.; Cavalcanti, I.F.A. Influence of Central and East ENSO on extreme events of precipitation in South America during austral spring and summer. Int. J. Climatol. 2015, 35, 2045–2064. [Google Scholar] [CrossRef]
- Boers, N.; Bookhagen, B.; Marengo, J.A.; Marwan, N.; von Storch, J.S.; Kurths, J. Extreme rainfall of the South American Monsoon system: A dataset comparison using complex networks. J. Clim. 2015, 28, 1031–1056. [Google Scholar] [CrossRef]
- Boers, N.; Bookhagen, B.; Marwan, N.; Kurths, J. Spatiotemporal characteristics and synchronization of extreme rainfall in South America with focus on the Andes Mountain range. Clim. Dyn. 2016, 46, 601–617. [Google Scholar] [CrossRef]
- Agudelo, J.; Arias, P.; Vieira, S.; Martínez, J. Influence of longer dry seasons in the Southern Amazon on patterns of water vapor transport over northern South America and the Caribbean. Clim. Dyn. 2019, 52, 2647–2665. [Google Scholar] [CrossRef]
- Zandonadi, L.; Acquaotta, F.; Fratianni, S.; Zavattini, J.A. Changes in precipitation extremes in Brazil (Paraná River Basin). Theor. Appl. Climatol. 2016, 123, 741–756. [Google Scholar] [CrossRef]
- Rafee, S.A.A.; Freitas, E.D.; Martins, J.A.; Martins, L.D.; Domingues, L.M.; Nascimento, J.M.P.; Machado, C.B.; Santos, E.B.; Rudke, A.P.; Fujita, T.; Souza, R.A.F.; Hallak, R.; Uvo, C.B. Spatial Trends of Extreme Precipitation Events in the Paraná River Basin. J. Appl. Meteorol. Climatol. 2020, 59, 443–454. [Google Scholar] [CrossRef]
- Avila-Diaz, A.; Abrahão, G.; Justino, F.; Torres, R.; Wilson, A. Extreme climate indices in Brazil: evaluation of downscaled earth system models at high horizontal resolution. Clim. Dyn. 2020, 54, 5065–5088. [Google Scholar] [CrossRef]
- Nobre, C.A.; Marengo, J.A.; Seluchi, M.E.; Cuartas, L.A.; Alves, L.M. Some characteristics and impacts of the drought and water crisis in Southeastern Brazil during 2014 and 2015. J. Water Resour. Prot. 2016, 8, 252–262. [Google Scholar] [CrossRef]
- Marengo, J.A.; Alves, L.M.; Alvalá, R.C.S.; Cunha, A.P.; Brito, S.; Moraes, O.L.L. Climatic characteristics of the 2010–2016 drought in the semiarid Northeast Brazil region. An. Acad. Bras. Ciênc. 2018, 90, 1973–1985. [Google Scholar] [CrossRef] [PubMed]
- Jong, P.; Tanajura, C.A.S.; Sánchez, A.S.; Dargaville, R.; Kiperstok, A.; Torres, E.A. Hydroelectric production from Brazil’s São Francisco River could cease due to climate change and inter-annual variability. Sci. Total Environ. 2018, 634, 1540–1553. [Google Scholar] [CrossRef]
- Mariano, D.A.; Dos Santos, C.A.C.; Wardlow, B.D.; Anderson, M.C.; Schiltmeyer, A.V.; Tadesse, T.; Svoboda, M.D. Use of remote sensing indicators to assess effects of drought and human-induced land degradation on ecosystem health in Northeastern Brazil. Remote Sens. Environ. 2018, 213, 129–143. [Google Scholar] [CrossRef]
Figure 1.
Spatial distribution of groups selected by the cluster analysis performed by Rodrigues et al. [25] for the SAMS area with OLR data.
Figure 1.
Spatial distribution of groups selected by the cluster analysis performed by Rodrigues et al. [25] for the SAMS area with OLR data.
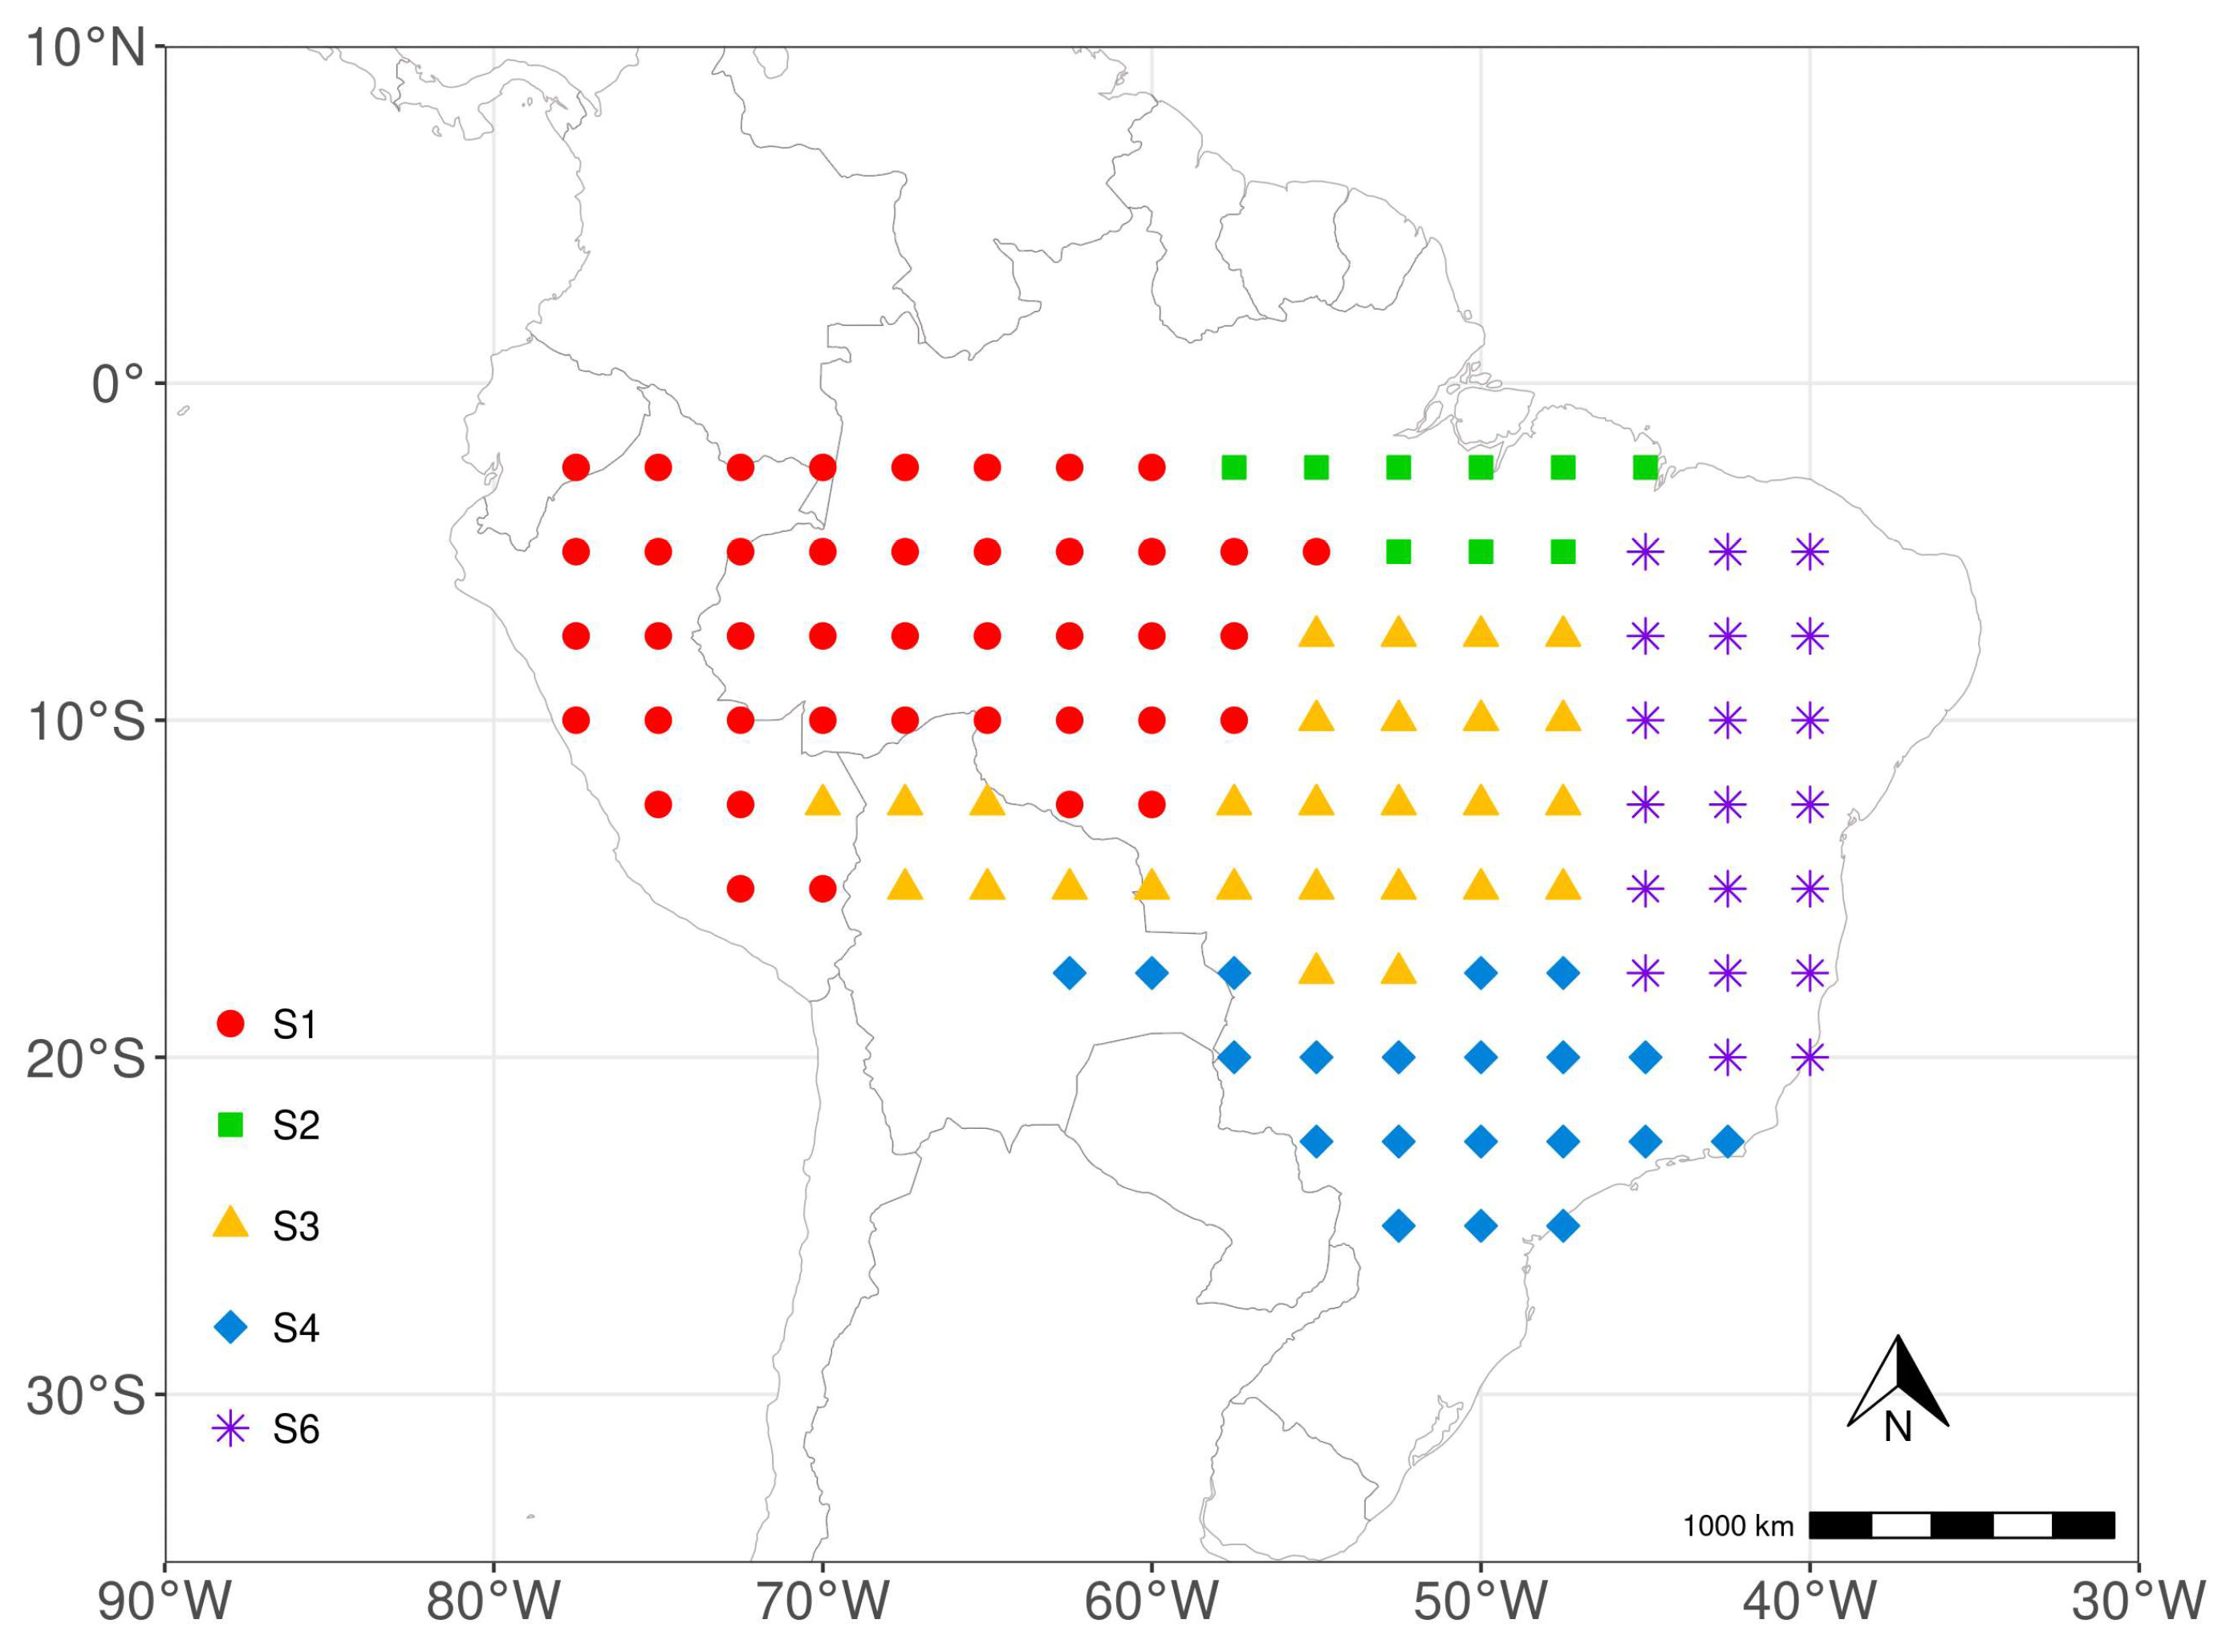
Figure 2.
Time series of (a) ONR, (b) DER, (c) rainy season length, and (d) total precipitation during the rainy seasons from 1979 to 2022, determined using the method of Rodrigues et al. [25], for each of the regions indicated. ONR, DER and length data are expressed in pentads, while total precipitation is given in millimeters (mm).
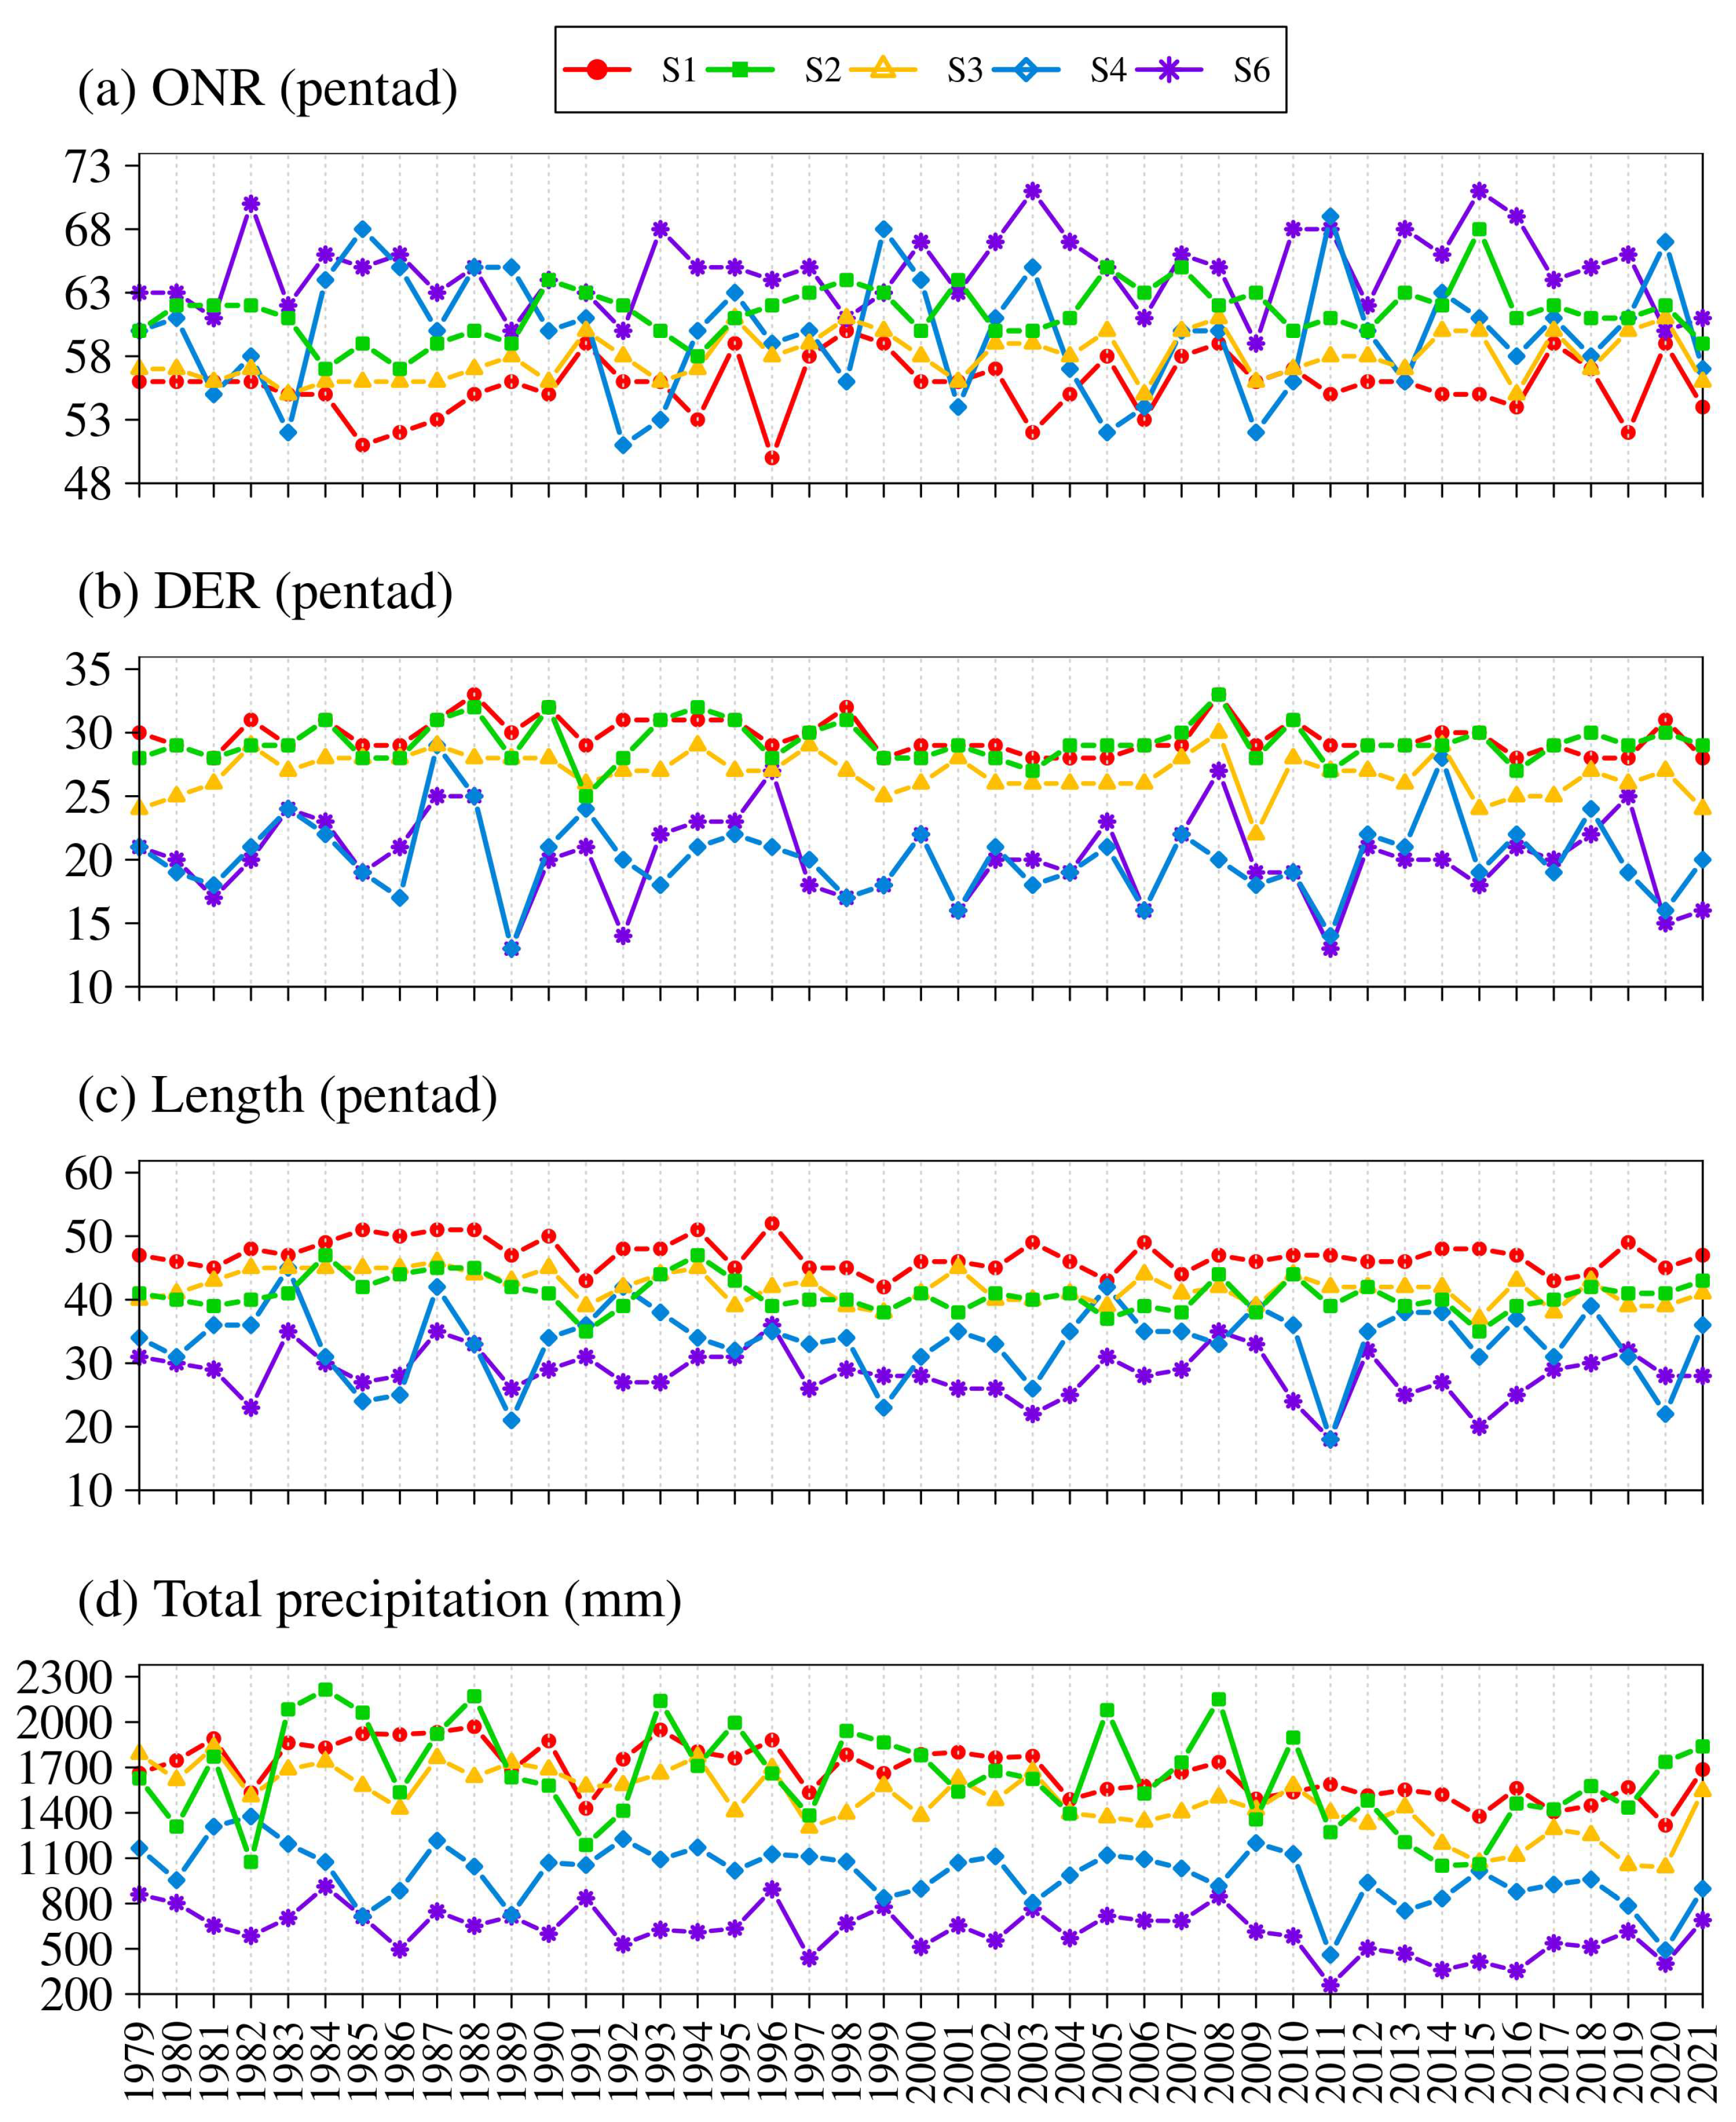
Figure 3.
Time series of total precipitation during the rainy season from the ONR of year x to the DER of year x+1, for each of the SAMS regions. Upper (lower) horizontal lines represent the third (first) quartile. Series on the left (a-e) show trends, while series on the right (f-j) are detrended.
Figure 3.
Time series of total precipitation during the rainy season from the ONR of year x to the DER of year x+1, for each of the SAMS regions. Upper (lower) horizontal lines represent the third (first) quartile. Series on the left (a-e) show trends, while series on the right (f-j) are detrended.
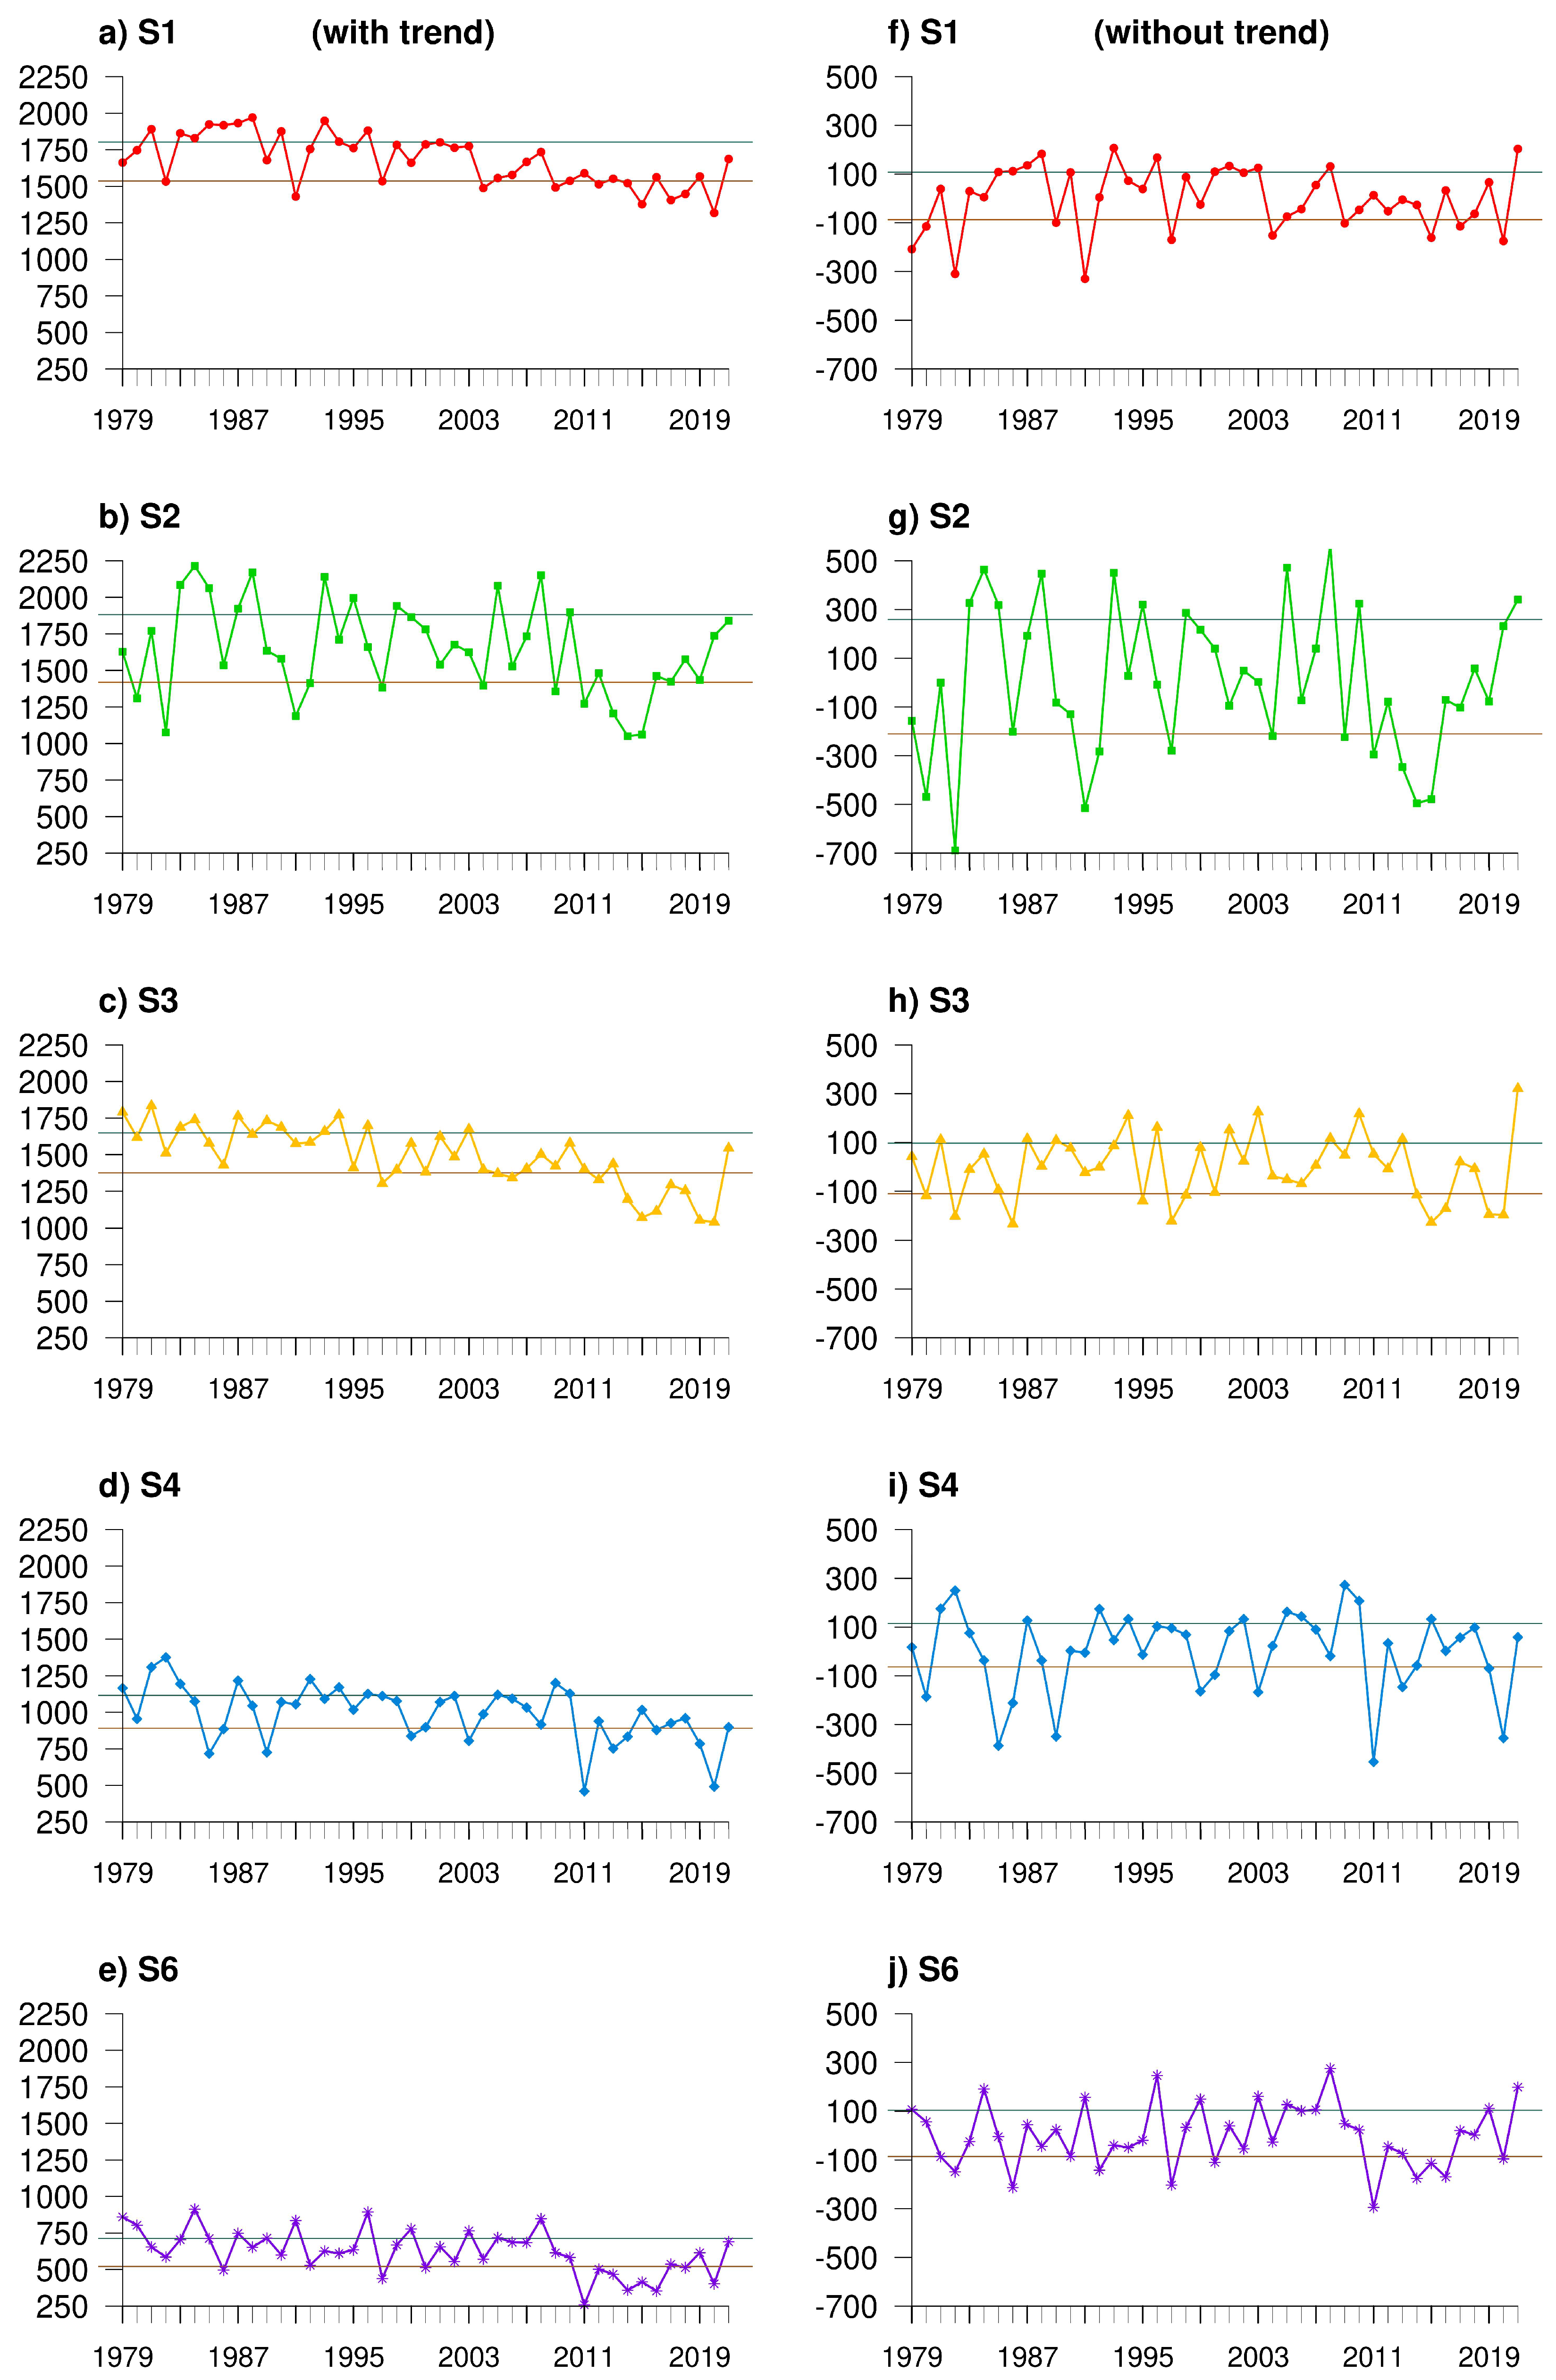
Figure 4.
Timeline showing the most and least intense rainy seasons in each region for the series with trends. Olive green represents the most intense rainy seasons (total precipitation greater than the third quartile), and terracotta represents the least intense rainy seasons (total precipitation less than the first quartile).
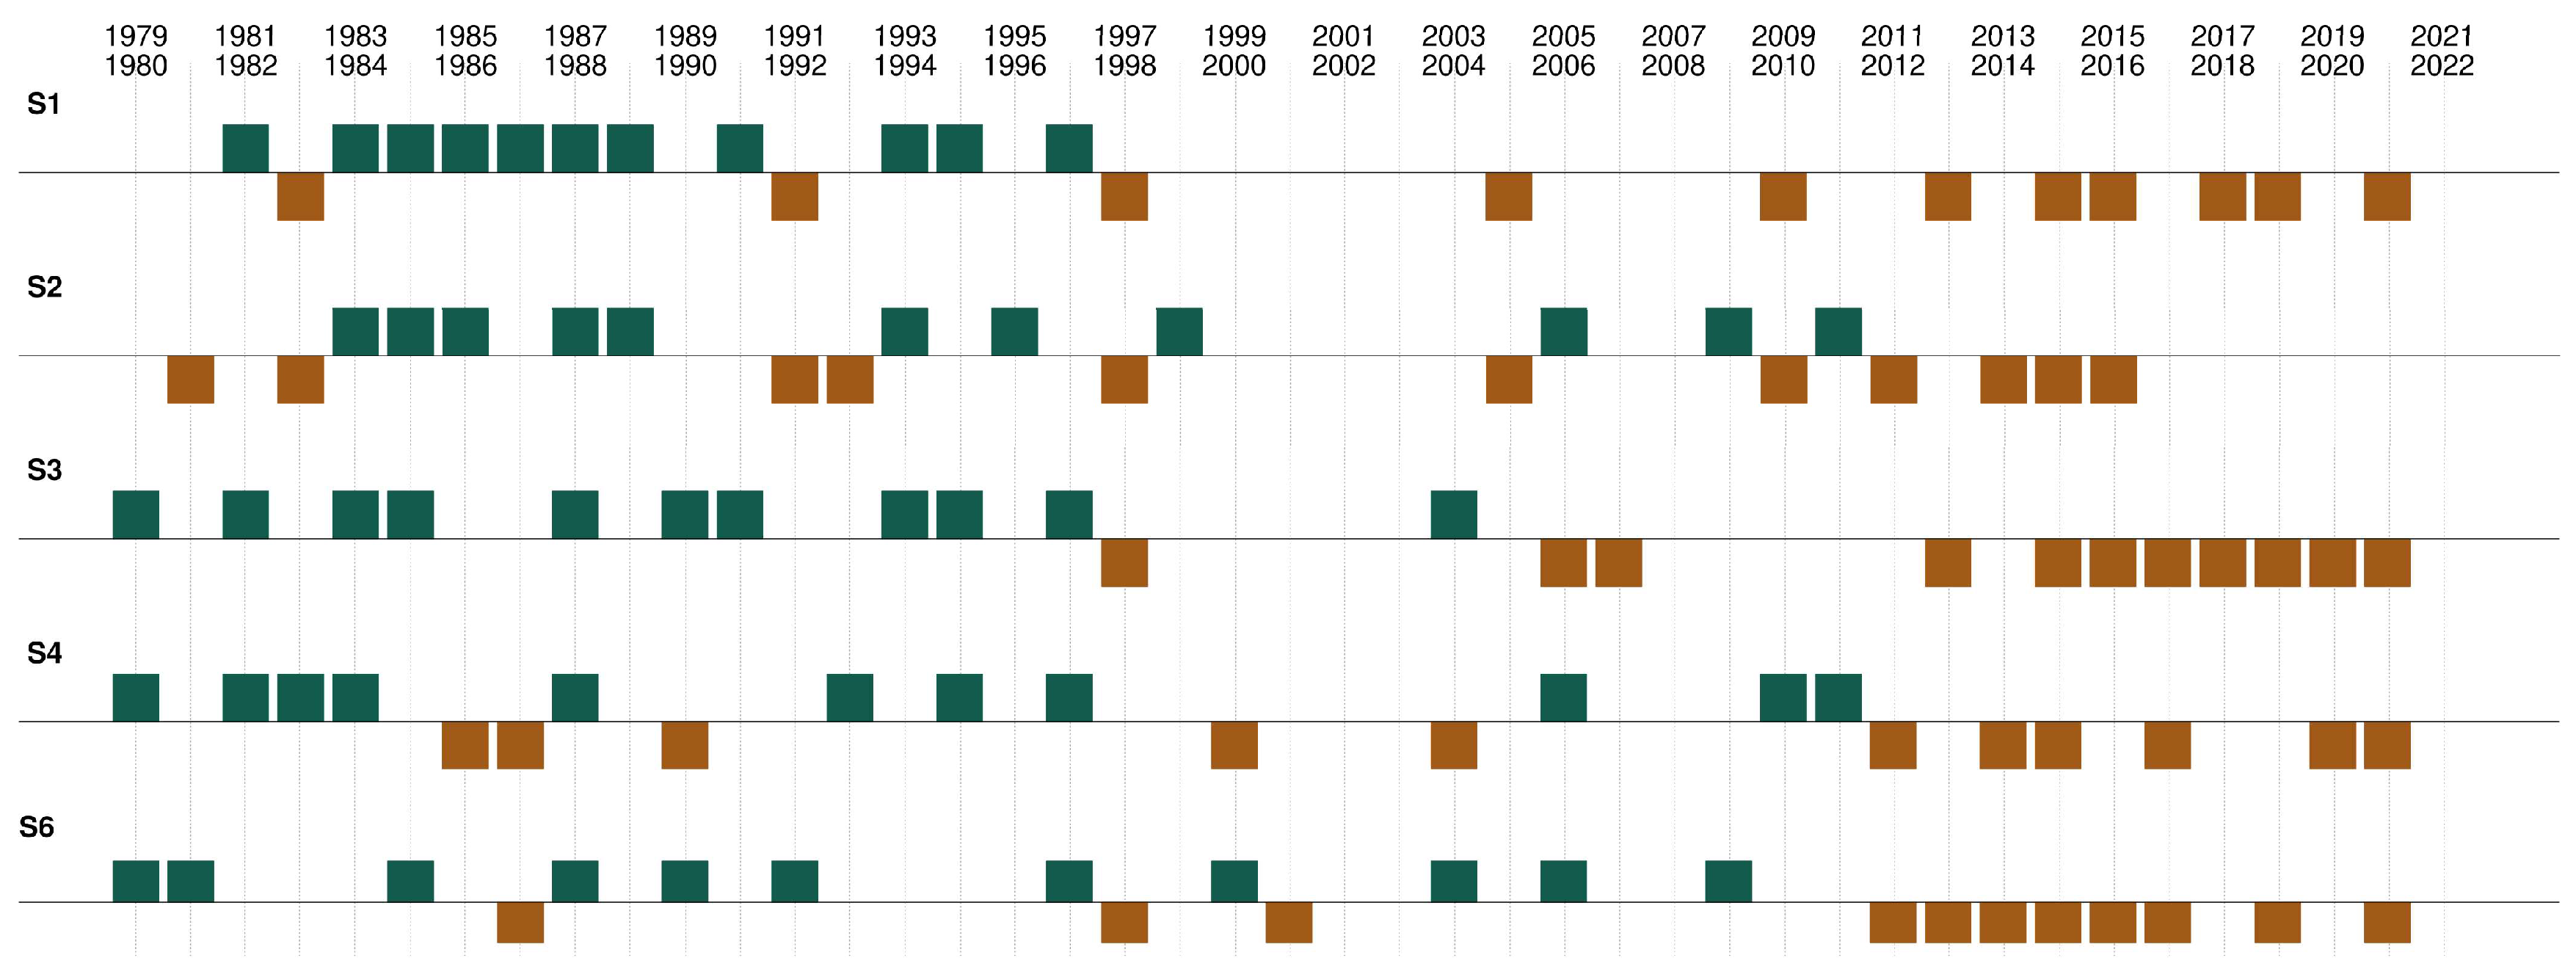
Figure 5.
As in Figure 4, but for no trend series.
Figure 5.
As in Figure 4, but for no trend series.
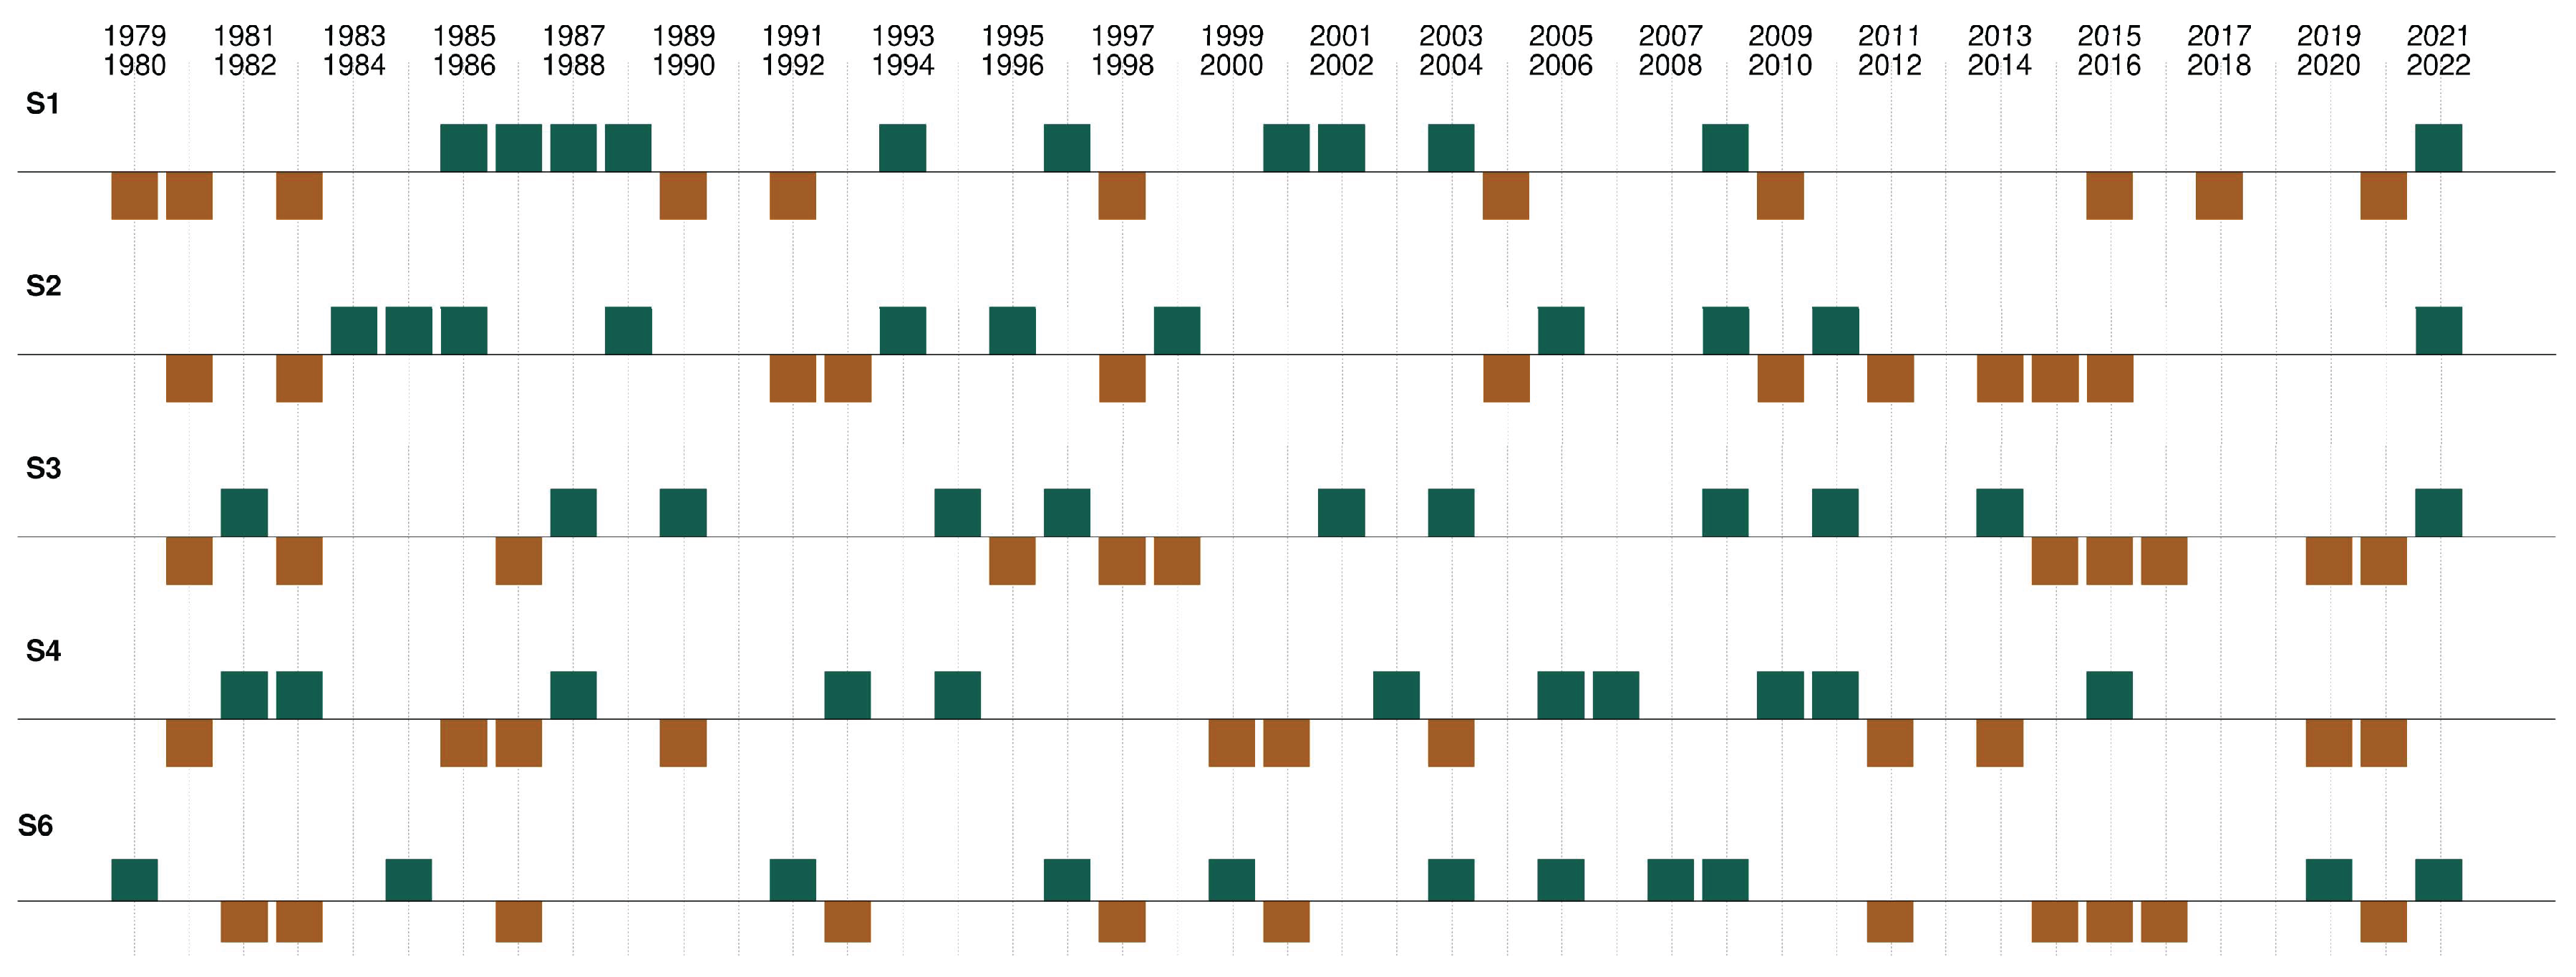

Table 1.
Mann-Kendall and Sen’s slope trend analysis in the series of ONR, DER, Length, and Total Precipitation (TP) of the rainy seasons between 1979-1980 and 2021-2022 in each region. Values in bold are statistically significant at a 5% significance level.
Table 1.
Mann-Kendall and Sen’s slope trend analysis in the series of ONR, DER, Length, and Total Precipitation (TP) of the rainy seasons between 1979-1980 and 2021-2022 in each region. Values in bold are statistically significant at a 5% significance level.
| S | Z | p-value | Sen’s slope | ||
|---|---|---|---|---|---|
| S1 | ONR | 59 | 0.6180 | 0.5366 | 0.0000 |
| DER | -185 | -2.0035 | 0.0451 | 0.0000 | |
| Length | -140 | -1.4691 | 0.1418 | -0.0435 | |
| TP | -407 | -4.2490 | 0.0000 | -10.5465 | |
| S2 | ONR | 142 | 1.4958 | 0.1347 | 0.0370 |
| DER | 25 | 0.2581 | 0.7963 | 0.0000 | |
| Length | -113 | -1.1841 | 0.2364 | -0.0323 | |
| TP | -173 | -1.8001 | 0.0719 | -7.4769 | |
| S3 | ONR | 223 | 2.3646 | 0.0180 | 0.0588 |
| DER | -176 | -1.8698 | 0.0615 | -0.0333 | |
| Length | -265 | -2.7937 | 0.0052 | -0.0833 | |
| TP | -505 | -5.2746 | 0.0000 | -12.8134 | |
| S4 | ONR | -22 | -0.2212 | 0.8249 | 0.0000 |
| DER | -62 | -0.6445 | 0.5193 | 0.0000 | |
| Length | 26 | 0.2631 | 0.7925 | 0.0000 | |
| TP | -291 | -3.0350 | 0.0024 | -7.1430 | |
| S6 | ONR | 113 | 1.1813 | 0.2375 | 0.0455 |
| DER | -85 | -0.8850 | 0.3761 | -0.0345 | |
| Length | -139 | -1.4516 | 0.1466 | -0.0714 | |
| TP | -305 | -3.1815 | 0.0015 | -6.3498 |
Disclaimer/Publisher’s Note: The statements, opinions and data contained in all publications are solely those of the individual author(s) and contributor(s) and not of MDPI and/or the editor(s). MDPI and/or the editor(s) disclaim responsibility for any injury to people or property resulting from any ideas, methods, instructions or products referred to in the content. |
© 2025 by the authors. Licensee MDPI, Basel, Switzerland. This article is an open access article distributed under the terms and conditions of the Creative Commons Attribution (CC BY) license (http://creativecommons.org/licenses/by/4.0/).
Copyright: This open access article is published under a Creative Commons CC BY 4.0 license, which permit the free download, distribution, and reuse, provided that the author and preprint are cited in any reuse.


