
Submitted:
16 October 2023
Posted:
18 October 2023
You are already at the latest version
Abstract
This study analyzed the changes and trends in twelve extreme precipitation-based climate indices obtained using daily data from 10 synoptic stations in the Chungcheong region of South Korea during the 1973-2020 period. The climate indices were used to assess the trends in the extreme precipitation characteristics of duration, frequency, and intensity using the innovative trend analysis (ITA) method. The results of the ITA were further compared with two other non-parametric test methods such as Mann-Kendall (MK) and Spearman’s rho (SR). The results showed that the most stations exhibited significant increasing trends in all the investigated climate indices at a 95% confidence level as indicated by the ITA method, with only a few stations indicating significant decreasing trends in R95p, R99p, Rx3day, and Rx5day. The sub-trend analysis further revealed the dominance of neutral behavior around the low-value cluster, especially for the extreme precipitation duration. At the same time, increasing trends dominate the high-value cluster in most stations. Meanwhile, only R10mm, R95p, and R99p exhibited monotonic trends in the Boeun, Seosan, and Boeun stations, respectively. Further, the ITA exhibited superior performance over the MK and SR methods by indicating the presence of more significant trends in the climate indices at most stations. The distribution of extreme precipitation indices for duration, frequency, and intensity indicate the pronounced risk of flood condition around the north-central and some parts of southern regions, while the western region indicate a potential drought risk, which could greatly impact the water resources and consequently agricultural activities in the study area. The results of this study provide essential information for addressing the climate-related problems of water resources management and agriculture in the study area and other related climatic regions.
Keywords:
Extreme climate indices
; trend analysis
; innovative trend analysis
; spatiotemporal variability
1. Introduction
Climate Climate change is a major factor affecting global water resources and agricultural production. In recent times, extreme climate change events such as floods and drought have become a global concern due to their frequency and intensity of occurrence [1]. The topic of extreme climate events is a critical discussion, not only in the academic forum but also among the policy makers due to its overarching impacts on human activities [2,3]. According to the World Meteorological Organization (WMO), out of the 22,326 recorded disasters, 11,072 are attributed to weather, climate, and water hazards [4], indicating the significance of climate related disasters. Similarly, climate change related extreme events are one of the major disasters confronting South Korea, with an estimated 95% of the total occurrence of natural disasters attributed to extreme precipitation events [5]. These events, mainly floods, reportedly caused huge economic damage of about 636.6 billion Korean won in 2012 [6].
However, understanding the changes and trends in climate variables could aid in monitoring climate change for early preparedness and mitigation of the probable impacts. Several studies have been conducted to specifically investigate the trends in climate variables in relation to the climate change impacts using different approaches, including parametric or non-parametric such as Mann-Kendall (MK) and Spearman’s rho (SR) tests, the Theil-Sen test, and linear regression method [7,8,9,10]. Although climate variables are important factors when it comes to climate change related studies, the use of extreme climate indices characterized by duration, frequency, and intensity, as recommended by the WMO, is gaining more attention due to their ability to serve as indicators of moderate to extreme climate events [1].
Recently, a new innovative trend analysis (ITA) was proposed by [11] and has been increasingly used to investigate the trends in climate related studies in different regions [10,12,13,14,15]. ITA is a non-parametric graphical method of trend analysis that is capable of detecting and visualizing not only the monotonic trend but also the identification of non-monotonic trends in a data series. [13] investigated the annual and seasonal variability of rainfall at five different selected stations in the regional state of Amhara in Ethiopia using the ITA method. The results obtained showed the capability of ITA to detect trends in rainfall time series data with the results presented in a graphical form, unlike MK and Sen’s slope, whose results are in a non-graphical format. In the Sudano-Sahelian region of Cameron, the ITA method was adopted to investigate the long-term changes in the mean and extreme precipitation events using the daily and monthly data from the fifteen climate stations from 1980 to 2018. The ITA method was used to analyze the trends in precipitation variability in the Lake Issyk-Kul Basin in Kyrgyzstan, and the results were compared with that of other popular trend analysis methods such as MK, Sen’s slope, linear regression, and Spearman’s rho [10]. The results showed that the superior capability of ITA over other methods in detecting significant trends where other tests failed.
In South Korea, [15] investigated the change in annual and seasonal climate variability based on UNEP and De Martonne climate indices in Chungcheong province of Korea using the ITA method, with the results also compared with MK and Modified MK tests. The results demonstrated the significant variability of climate conditions in the study area with increasing trends dominated in summer and autumn. Similarly, [16] investigated the variability of annual, seasonal, and extreme precipitation in the Han River Basin of Korea using the ITA method, with the results showing significant variability in summer precipitation with an indication of possible extreme floods during the summer and drought severity during the fall and winter. All these studies and many more identified superior performances of the ITA method over other popular and traditional trend analysis methods. However, limited studies have investigated the change and trends in extreme precipitation-based climate indices using the ITA method, especially in South Korea, despite the aforementioned advantages this approach offers.
This study, therefore, analyses the trends in twelve important extreme climate indices that characterize precipitation duration, frequency, and intensity to assess the changes in climatic conditions in the Chungcheong region of South Korea. Specifically, the trends in the selected extreme precipitation-based climate indices were assessed using the graphical ITA method, and the results were further compared with the MK and SR test results. The spatial variability of the extreme precipitation-based climate indices was also investigated using the inverse distance weighting (IDW) spatial interpolation method.
2. Materials and Methods
2.1. Study Area and Data Used
Chungcheong region is located in the west-central of South Korea and lies between 35°58′ - 36°00′ N and 127°38′ - 125°32′ E, with an elevation of up to 1420 m (Figure 1) [15]. The study area, covering an estimated total area of 16,642 km2, is bordered in the West by the Yellow Sea. The topographical conditions include mountainous terrain in the east and flat areas in the West, with about 66% of the total land area above sea level by 100 m [17]. The climatic conditions are characterized by continental and temperate monsoon climates with four distinct seasons: spring (March-May), summer (June - August), autumn (September - November), and winter (December - February). The annual average precipitation and temperature in the study area are 1239.7 mm and 11.7 °C, respectively, with the majority of the rainfall (56%) and the maximum temperature (31.9 °C) occurring during the summer. However, due to climate change, there has been recently observed changes in the durations of climate conditions in each of these seasons, indicating a climate shift [18]. Besides, climate variability has been reportedly responsible for the reoccurring hydrological disasters in terms of heavy rainstorms, floods, and drought severity [19].
2.2. Extreme Precipitation Based Climate Indices
The The 12 core extreme precipitation-based climate indices (http://etccdi.pacificclimate.org/indices_def.shtml), classified into the duration (CDD and CWD), intensity (PRCPTOT, R95p, R99p, Rx1day, Rx3day, Rx5day, and SDII), and frequency (R10mm, R20mm, and R30mm), as the major attributes of the climate extremes, were considered for the assessment of temporal and spatial changes in Chungcheong region (Table 1). These indices were computed from the daily precipitation data series using the ClimPACT2 software (version 3.1.3) [20], whichhas been operationally maintained by the Expert Team on Specific Climate Indices since 2018 (https://www.wcrp-climate.org/data-etccdi). Besides, these indices allow easy comparison of climate change results among studies from different regions and are also recommended by the World Meteorological Organization (WMO) and Expert Team on Climate Change Detection and Indices (ETCCDI) to enhance uniform monitoring, detection, and attribution of climate extremes relating to climate change assessment and water resources management [21,22]. Many studies in different regions, including South Korea, have continued to use these indices to understand the variability and changes in extreme precipitation events under changing climate conditions [1,23,24,25].
2.3. Extreme Precipitation Based Climate Indices
2.3.1. Bias Correction
The innovative trend analysis (ITA) method was applied to the extreme precipitation-based climate indices data series from 1973 to 2020. This method is a non-parametric graphical approach developed by [11,26], which has gained prominence due to its innovative visual properties and ability to evaluate the sub-trends and statistical significance in data series [15,27]. The data series for each precipitation-based climate extreme indices were divided into two equal halves and then rearranged each sub-series in ascending order. The first sub-series data was placed on the x-axis, while the second sub-series data was placed on the y-axis of the two-dimensional (Cartesian coordinate) system (Figure 2). The data points that fall above (below) the 45° trendless line (1:1) indicate an increasing (decreasing) trend, respectively. In contrast, the cluster data points on the 1:1 line signify no existence of significant trend. The ITA is able to distinctly separate the trends in data series into monotonic and non-monotonic under increasing and decreasing trends as regards the data points’ locations [28].
The ITA slope (s) and trend indicator (D) were also calculated using Equations 1 and 2.
where, is the ITA slope, is the number of data points, and are the mean values of the first sub-series and second sub-series, respectively.
where is the trend indicator, is the number of data in each sub-series, is the mean value of the first sub-series, and are observed data values in the first sub-series and second sub-series, respectively.
The trend indicator is multiplied by 10 to enable the comparison of the results of ITA with other trend analysis tests in this study [13,29,30]. The positive value of the trend indicator indicates an upward trend, while the negative value signifies a downward trend. The significance of the trend slope and indicator is estimated using the method proposed by Şen with the detailed description in [26]. In this study, a 95% confidence level is considered, and the ITA procedure was performed using the “trend change” package in the R environment, while the ITA plots were performed in Microsoft Excel 2013.
2.3.2. Mann-Kendall Trend Test
Mann-Kendall (MK) trend test is a ranked-based and one of the classical non-parametric tests that is regarded as a traditional method of trend analysis [31,32]. Unlike the ITA, the MK trend test is known for assessing only monotonic trends such that the standardized MK test statistic (ZMK) with positive (negative) values indicate increasing (decreasing) trends, respectively. The MK trend statistic test is estimated using Equations (3-6).
where n denotes the number of observed data in the time series, and are the time series values at times and , respectively, from a given time series with observations, represents the sign function with the values 1, 0, or -1, if , , or , respectively. represents the Kendall sum statistic, and is the variance.
The significance of the trend statistic test in this study is based on the 95% confidence level, which is regarded as high such that for ≥=, the null hypothesis (H0) is rejected and the trend is considered statistically significant.
2.3.3. Spearman’s Rho Trend Test
The Spearman’s rho (SR), just like MK trend test, is a rank-order non-parametric test for analysis of monotonic trend in the time series data of precipitation based climate extreme indices [33,34,35]. The null hypothesis (H0) states that the data in the time series are uniform and independent and thus indicate that there is no trend in the data. The trend for the SR is evaluated using correlation coefficient (rs) and associated test statistic (ZSR) following Equations (7) and (8).
where is the rank statistic which is determined by ranking the observations from lowest to highest or vice versa, i represents chronological order, n is the number of data points in the time series, positive (negative) values of standardized test statistic (ZSR) signify increasing (decreasing) trends, in the data time series, respectively.
The significance of the SR trend test in this study is based on the 95% confidence level, such that if >, the null hypothesis (H0) is rejected and the trend is considered statistically significant.
2.3.4. Spatial Analysis
The spatial changes and distribution of trends in extreme precipitation-based climate indices were conducted using the inverse distance weighting (IDW) interpolation method. The IDW is one of the most commonly used interpolation methods due to its accuracy and ease of use [15]. The process involves assigning a value to an unknown point using the weighting average values from a set of neighboring known points following the Equations (9) and (10).
where is the interpolated value at a position, N is the number of nearest observation points surrounding, is the weight of each observation point located at is the Euclidean distance between and , p is the degree of change in weight according to the Euclidean distance.
3. Results
3.1. Temporal Changes and Trends in Climate Indices
The temporal changes of 12 extreme precipitation-based climate indices inferred from the 10 synoptic gauging stations in the Chungcheong region during 1973-2020 are shown in Figure 3. The results show that all the indices indicate low to moderate increasing trends. For instance, the duration-based indices, CDD and CWD, indicate high temporal changes (increasing trend) of 2.26% and 2.33%, respectively, as compared to intensity-based indices: PRCPTOT, R95p, R99p, Rx1day, Rx3day, and Rx5day, which show moderately increasing change of 1.59, and 0.89, 0.95, 0.32, 0.25, and 0.38 units per year, respectively. However, only the SDII among the intensity-based indices indicates a low temporal increasing change of 0.02 units per year. Similarly, the frequency-based indices of R10mm, R20mm, and R30mm show low increasing changes of 0.05, 0.03, and 0.02 units per year, respectively.
The precipitation duration-based indices showed contrasting values such that the maximum value of CDD (51.20 days) was observed in 1977 and decreased gradually until 2019, when it spiked to 44.60 days. However, CWD showed an increasing trend, reaching a maximum value of 10.20 days in 2020 but with significant decreasing spikes of 3.50 and 3.60 days in 1994 and 2018, respectively. For the precipitation frequency-based indices, the temporal changes indicated increasing trends up to maximum values of 44.70 days, 27.00 days, 20.50 days in 2003, 2011, 2011 for R10mm, R30mm, and R30mm, respectively, after which the indices showed decreasing values with lowest spikes of 21.90 days, 10.30 days, 4.40 days in 2001, 2015, 2015 for R10mm, R30mm, and R30mm, respectively. Further, the precipitation intensity-based indices showed irregular changes among some of the seven indices. For instance, the changes in SDII showed alternate increasing and decreasing trends such that it increased to 15.96 mm in 1979, after which it decreased to 12.18 mm in 1992, before it spiked to a maximum value of 21.50 mm in 2011 and then decreased to a minimum value of 9.15 mm in 2015. Similarly, the changes in irregular patterns are observed in R95p, R99p, and Rx5day.
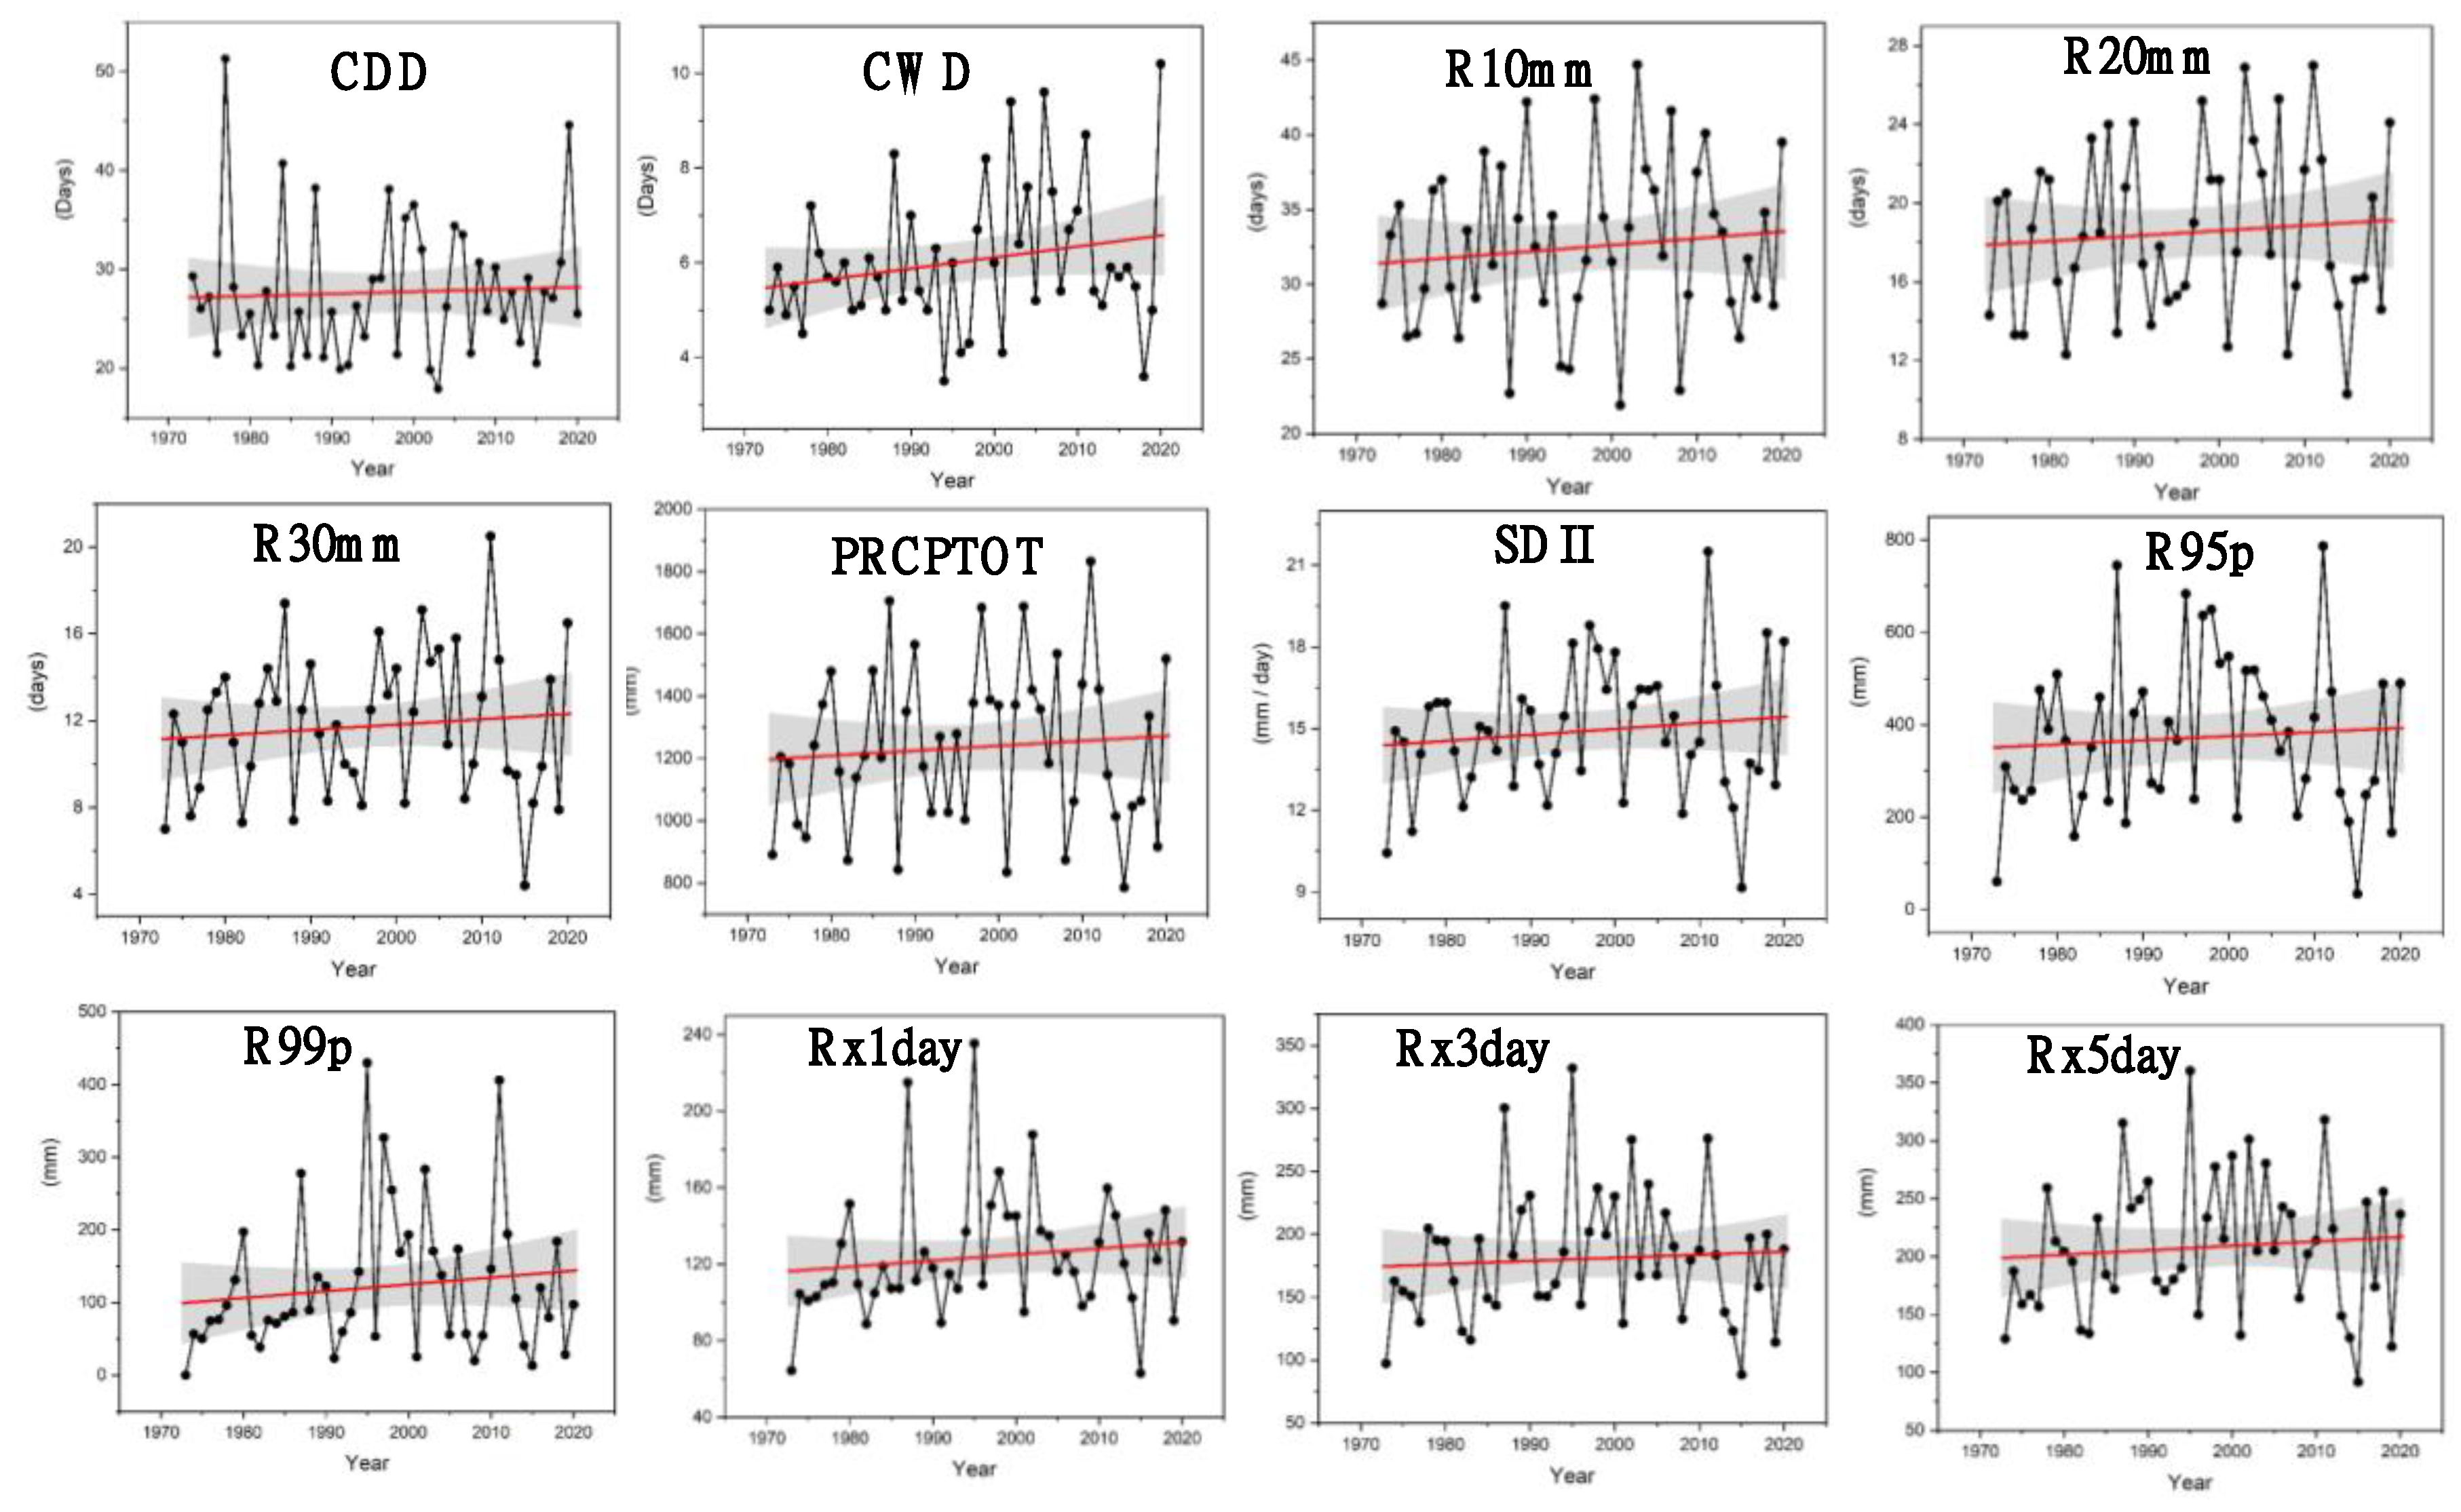
Figure 3.
Temporal variations of the spatially averaged extreme precipitation based climate indices during 1973-2020.
Figure 3.
Temporal variations of the spatially averaged extreme precipitation based climate indices during 1973-2020.
The results of temporal trends based on the ITA method across all the stations are shown in Figures 4–15. The ITA indicator for the duration-based indices show that 80% and 100% of the stations are statistically significant at a 95% confidence level for CDD and CWD, respectively (Figure 4 and Figure 5). On average, the rate of significantly increasing trends in CDD are 0.98, 0.79, 0.55, 0.60, 0.32, 0.92, 0.47, and 1.43 days/year for Chungju, Cheongju, Chupungryeong, Jecheon, Boeun, Cheonan, Boryeong, and Buyeo stations, respectively. In comparison, the rate of significantly increasing trends in CWD ranges from 0.83 to 2.10 days/year at all 10 stations. Meanwhile, for CDD, the non-significant increasing and decreasing trends occur in Geumsan and Seosan, respectively (Figure 4). The sub-trends in CDD and CWD, majorly at the medium-value cluster, reveal a neutral behavior at some stations such as Seosan, Boeun, and Boryeong, characterized by clustering data points on the trendless line. However, low-value clusters dominate in the majority of the stations, especially in the CDD. Further, while only Chungju, Boeun, and Buyeo stations show increasing trends in the high-value cluster of the sub-trend for CDD, all the stations in CWD reveal increasing trends in the high-value cluster.
For the frequency-based indices, the ITA indicators reveal different combinations of trends in the number of days of extreme precipitation-based climate indices (Figure 6, Figure 7 and Figure 8). In general, significant increasing trends dominate the three frequency-based indices, with 70%, 90%, and 90% of the stations exhibiting non-monotonic increasing trends in R10mm, R20mm, and R30mm, respectively. However, only the R10mm exhibits a monotonic increasing trend at 1.52 days/year in the Boeun station, while a non-significant decreasing trend at an average rate of -0.11 days/year occurs in R30mm at the Boryeong station. The rate of significantly increasing trends in R10mm, R20mm, and R30mm ranges from 0.15 to 1.52 days/year, 0.50 to 1.62 days/year, and 0.60 to 2.26 days/year, respectively. Regarding the distribution of sub-trends, the ITA reveals the dominance of high-value clusters in all three frequency-based indices, which indicate increasing trends at all the stations except Boryeong station for all three indices and Cheonan station for R10mm. However, the low-value cluster with decreasing trends occurs at Chungju and Cheongju stations for R10mm, at Cheongju, Jecheon, and Cheonan stations for R20 mm, and at Cheonan and Buyeo stations for R30mm. Meanwhile, the neutral trend behavior is exhibited in R10mm and R20 around the low-value and medium-value clusters at Seosan and Chupungryeong stations, respectively. In contrast, a similar neutral trend behavior is exhibited in R30mm around the low-value cluster at the Jecheon and Geumsan stations.
The results of the extreme precipitation intensity-based climate indices are shown in Figures 9–15. Similar to duration and frequency-based indices, the increasing trends dominate the seven investigated precipitation intensity-based climate indices. For PRCPTOT and SDII, the rates of increasing trends based on the ITA indicators ranged from 0.62 to 1.50 mm/year and 0.05 to 1.18 mm/day/year, respectively, with the increment more pronounced at Boeun station (1.50 mm/year) for PRCPTOT and Seosan and Boeun stations (> 1 mm/day/year) for the SDII (Figure 9 and Figure 10). The increasing trends in PRCPTOT and SDII were found to be statistically significant at a 95% confidence level at all the stations except in Boryeong station, where non-significant decreasing and increasing trends occurred, respectively. Both indices are found to exhibit non-monotonic increasing trends, each in 70% of the stations.
For the sub-trend clusters, the PRCPTOT exhibits neutral trend behavior around the low-value clusters in Chungju, Seosan, Cheongju, Jecheon, Boeun, and Buyeo; however, Boryeong shows neutral trend behavior around the medium-value cluster (Figure 9). Similarly, SDII demonstrates neutral trend behavior around the low-value cluster in Chungju, Cheongju, Chupungryeong, Boeun, Buyeo, and Geumsan stations. In contrast, the medium-value cluster reveals neutral trend behavior at the Boryeong and Geumsan stations (Figure 10).
The R95p and R99p indices show, on average, increasing trends with the existence of monotonic trends in the Seosan and Boeun stations (Figure 11 and Figure 12). In R95p, the statistically significant increasing trends occurred in Chungju, Seosan, Cheongju, Chupungryeong, Jecheon, Boeun, Buyeo, and Geumsan stations at the rate of 4.19, 2.31, 2.39, 0.33, 3.58, 1.21, and 1.58 mm/year, respectively. In comparison, non-significant decreasing trends are exhibited at the Cheonan (-0.06 mm/year) and Boryeong (-0.07 mm/year) stations. However, the statistically significant increasing trend rates in R99p ranged from 2.42 to 7.53 mm/year with the highest and lowest change occurring at Seosan and Chupungryeong stations. Further, non-significant increasing trends occur at Chungju and Cheonan stations at the rates of 0.85 and 1.09 mm/year, respectively. However, the statistically significant decreasing trend occurs at the Boryeong station at the rate of -1.28 mm/day. R95p and R99p are found to exhibit non-monotonic increasing trends each in 50% and 30% of the stations, respectively.
The sub-trend clusters in R95p reveal neutral trend behavior around the low-value cluster in Chupungryeong, Boryeong, and Buyeo stations and increasing trend behavior around the majority of the stations (60%). On the other hand, the sub-trend information in R99p indicates increasing trend behavior around the low-value and high-value clusters in the majority of the stations, with the exception of Chungju, Cheonan, and Geumsan stations, where neutral trend behavior was observed around the low-value cluster.
For the Rx1day, Rx3day, and Rx5day indices, the ITA indicator results show a combination of trends in the maximum days of extreme precipitation intensity-based climate indices (Figure 13, Figure 14 and Figure 15). In general, all three indices exhibit increasing trends in the majority of the stations, with Rx1day, Rx3day, and Rx5day showing statistically significant increasing trends at 60%, 60%, and 70% of the stations, respectively. Besides, the non-monotonic increasing trends are exhibited at 30%, 30%, and 50% of the stations for each Rx1day, Rx3day, and Rx5day indices, respectively. The significant increasing trends occurred in Seosan, Cheongju, Jecheon, Boeun, Cheonan, and Geumsan stations at the rate of 1.52, 1.73, 1.59, 1.04, 1.18, and 0.89 mm/year for Rx1day and 0.43, 1.22, 0.65, 1.43, 0.29, and 1.00 mm/year for Rx3day, respectively. At the same time, Rx5day exhibits significant increasing trend rates of 0.87, 1.26, 0.65, 0.77, 1.66, 0.31, and 1.31 mm/year in Seosan, Cheongju, Chupungryeong, Jecheon, Boeun, Cheonan, and Geumsan stations, respectively. Similarly, all three indices exhibit significant decreasing trends in Chungju station at the rate of -0.12, -0.43, and -0.60 mm/year, respectively.
The sub-trend information reveals neutral behavior in Rx1day around the low-value clusters at Chupungryeong, Boeun, Boryeong, Buyeo, and Geumsan stations, while increasing trends behavior is dominant around the middle-value cluster and high-value cluster, indicate combined trend behaviors. Similarly, in Rx3day, the neutral trend behavior dominates the low-value cluster, especially at Chungju, Seosan, Cheogju, Chupungryeong, Boeun, Boryeong, and Buyeo stations; however, middle and high cluster values exhibit a combination of trend behaviors. Further, Rx5day reveals neutral behavior around the low-value clusters at Chungju, Cheonan, Boryeong, and Buyeo stations, while middle and high cluster values exhibit a combination of trend behaviors.
3.2. Spatial Variability and Trends in Extreme Climate Indices
The spatial variations in the extreme climate indices, characterized by duration, frequency, and intensity indices, and their trends based on the ITA, MK, and SR from 1973 to 2020 are shown in Figure 16, Figure 17 and Figure 18, respectively. The computed extreme precipitation-based climate indices using the trend indicator for ITA (D), Z statistics for the MK test (ZMK), and test statistics for the SR test (ZSR) showed varying degrees of variabilities, especially in terms of statistical significance level across the study area. For instance, in the precipitation duration-based indices, the spatially averaged CDD increases from the west-end towards the central area with the highest value around the Buyeo and Cheonan regions and lowest value around the Seosan region, which are all significant except at two regions of Seosan and Geumsan (Figure 16). However, the CWD was very high in the southern area, around the Geumsan region. At the same time, it showed a low value in the central area around the Cheongju region, with all the regions showing statistically significant trends. MK and SR showed slightly similar trend variability in CDD with ITA, especially with high and low CDD around the Seosan and Cheonan regions, respectively (Figure 17 and Figure 18). However, MK and SR differ in the spatial variability of CWD with ITA, where the distribution of low-value CWD is more pronounced, unlike in the ITA. Similarly, the high CWD can be found around the Jecheon and Buyeo regions, while the lowest value is distributed around the Seosan and Boryeong regions. Further, while all the regions indicate similar increasing and decreasing trends with ITA, none of the regions indicate statistical significance, unlike in the ITA methods.
The precipitation frequency-based indices (R10mm, R20mm, and R30mm) show increasing trends from the western region to the eastern region of the study area based on the ITA indicator (Figure 16). These results are consistent with the pattern of trend distribution in both MK and SR. The high R10mm, R20mm, and R30mm occur around the Boeun, Chungju, and Jecheon regions, while the low values are distributed around the Seosan and Boryeong regions for all the trend analysis method (Figure 16, Figure 17 and Figure 18). However, while all three indices show significant trends in all the regions except the Boryeong region in R30mm, the MK and SR only indicated a significant trend around the Boeun region in R10mm (Figure 17 and Figure 18).
For the spatial distribution and trend in precipitation intensity-based indices: PRCPTOT, SDII, R95p, R99p, Rx1day, Rx3day, and Rx5day, the pattern of variability showed that the majority of the high precipitation intensity-based indices occur in the eastern region of the study area (Figure 16, Figure 17 and Figure 18). Specifically, it can be observed that the increasing trends with high values in PRCPTOT, SDII, R95p, R99p, Rx3day, and Rx5day indices up to 1.50 mm/decade, 1.18 mm/day/decade, 3.58 mm/decade, 7.38 mm/decade, 1.43 mm/decade, and 1.66 mm/decade, respectively, occurred around the Boeun region. In contrast, the high rate of decreasing trends in PRCPTOT, R95p, R99p, Rx1day, Rx3day, and Rx5day up to -0.09 mm/decade, -0.07 mm/decade, -1.28 mm/decade, -0.44 mm/decade, -0.57 mm/decade, and -0.07 mm/decade, respectively, are observed around Boryeong region as indicated by the ITA indicator. Similarly, trend test statistics of MK and SR showed similar distribution patterns in the regions of high and low values, especially for PRCPTOT, SDII, R95p, Rx1day, Rx3day, and Rx5day. However, the status of the statistical significant level varies between MK and SR test statistics ZMK and ZSR and ITA method statistic D test, with latter showing more statistically significant trends in many regions.
4. Discussion
The extreme precipitation-based climate indices in the Chungcheong region of South Korea during 1973 - 2020 generally showed increasing trends and variability of extreme indices among the sub-regions as indicated by the stations in the study area. The increasing CWD and decreasing CDD around the western region in the study area implies that the number of days with no rainfall is likely to decrease. In contrast, more days with heavy rainfall are likely to increase, which could translate to a flooding condition in this region. Similarly, a significant increase in the precipitation intensity based climate indices such as PRCPTOT, SDII, R95p, R99p, Rx1day, Rx3day, and Rx5day around the eastern region (Boeun, Chupungryeong, and Cheongju) and a significant increase in extreme precipitation frequency indices such as R10mm and R20mm, and R30mm could potentially cause increasing heavy flood around these regions. Besides, these results are consistent with related studies where significant increases in the trends in these indices were identified as extreme climate events such as floods [27,36].
The sub-regions around the study area have also been reported to be impacted by flooding and drought conditions [37,38]. The significant increase in CDD around the north-central and some parts of southern regions (Cheonan, Cheongju, Buyeo, and Boryeong), with decreases in R95p and R99p, and low Rx1day, Rx3day, and Rx5day around these regions could be a potential cause of drought around these regions. Considering the intensive agricultural activities in the Chungcheong region [39], the increase in dry climate extremes could create challenging impacts on the agricultural productivity and food security in the region and South Korea in general [15]. The vulnerability of sub-regions such as Jecheon and Geumsan in the Chungcheong region to flood and drought due to significantly increasing trends in climate extremes has been previously reported [23,40]. This result is consistent with the findings by [15], where heavy climatic conditions are identified in the summer and autumn seasons around the northeast region of Chungcheong province. Moreover, the influence of the orographic effect and local convection aided by the mountainous terrain in the study area could influence the extreme precipitation amount and intensity around the adjacent sub-regions [41].
The statistical relationship among the three trend analysis methods was further conducted using Pearson’s correlation analysis. The Pearson correlation results of the scatter matrix plot showed a moderate correlation between the ITA method and MK and SR tests, as indicated by the coefficient values of 0.42 and 0.43, respectively (Figure 19). Meanwhile, MK and SR clearly showed a very good correlation with a coefficient of 0.99. This can be explained by the lack of the two tests to determine some significant hidden sub-trends compared to the ITA test. Besides, the ITA test offers the possibility of presenting the trends graphically, which allows the detection of trends in extreme values.
Previous studies have also demonstrated and reported the superiority of the ITA test to the MK tests in detecting trends in time series data [15,29,30,42]. [29] attributed the low performance of the MK test in detecting the trends in time series data to the possible presence of significant serial correlation in the data series. Similarly, [15] ascribed the superior performance of the ITA to its ability to detect underlying and significant trends in climate-related data. Further, in the studies conducted by [10,42], where different statistical techniques were compared to ITA in evaluating variability and changes in climate conditions, the results showed that the ITA method was able to detect significant trends in some stations where other methods, such as MK, Modified MK, Bootstrapped MK, linear regression, Spearman’s rho, and Sen’s slope failed to detect such significant trends. These results are consistent with the findings of this present study.
5. Conclusions
This study analyzed the spatiotemporal variability and changes of 12 extreme precipitation-based climate indices in the Chungcheong region of South Korea based on the daily precipitation datasets from 10 synoptic stations during 1973-2020. The climate indices were used to assess the trends in the extreme precipitation duration, frequency, and intensity using the innovative trend analysis (ITA) method, which the results were further compared with two other non-parametric tests: Mann-Kendall (MK) and Spearman’s rho (SR).
Overall, the majority of the stations exhibited significant increasing trends at a 95% confidence level, as indicated by the ITA method in all the investigated indices, with only a few stations indicating significant decreasing trends in R95p, R99p, Rx3day, and Rx5day. The sub-trend analysis further revealed the dominance of neutral behavior around the low-value cluster, especially for the extreme precipitation duration, while increasing trends dominate the high-value cluster in most stations. Meanwhile, only R10mm, R95p, and R99p exhibited monotonic trends in the Boeun, Seosan, and Boeun stations, respectively. The risk of flood and drought conditions is pronounced in the study area, especially around the north-central and some parts of southern and western regions, respectively, which could greatly impact the water resources and agricultural activities. This can be attributed to the significant increasing trends in extreme precipitation intensity such as PRCPTOT, SDII, R95p, R99p, Rx1day, and Rx3day and extreme precipitation duration such as Rx1day, Rx3day, and Rx5days and also increasing trends in CWD and decreasing trends in CDD in those regions.
Further, the ITA method indicated superior performance and exhibited significant statistical trends in the investigated extreme precipitation indices at many stations than the MK and SR tests. However, Pearson’s correlation showed a moderate relationship between the ITA and the two tests. This study provides outcomes that could provide researchers and policymakers with essential information for addressing the climate-related problems of water resources management and agriculture in the study area and other related climatic regions. A future study is recommended to investigate the cause of the changes in the extreme precipitation indices in relation to the relative impacts on the water resources and agricultural production in the study area.
Author Contributions
Conceptualization, Bashir Adelodun and Hyungon Cho; methodology, Bashir Adelodun and Hyungon Cho; software, Bashir Adelodun, Hyungon Cho, and Hyo-Jeong Kim; validation, Bashir Adelodun, Hyungon Cho, Hyo-Jeong Kim and Gwangseob Kim; formal analysis, Bashir Adelodun and Hyungon Cho; investigation, Bashir Adelodun, Hyungon Cho, Hyo-Jeong Kim and Gwangseob Kim; resources, Gwangseob Kim; data curation, Bashir Adelodun and Hyungon Cho; writing—original draft preparation, Bashir Adelodun and Hyungon Cho; writing—review and editing, Bashir Adelodun, Hyungon Cho, Hyo-Jeong Kim, and Gwangseob Kim; visualiza-tion, Bashir Adelodun, Hyungon Cho, Hyo-Jeong Kim and Gwangseob Kim; supervision, Gwangseob Kim; project administration, Bashir Adelodun and Gwangseob Kim; funding acquisition, Gwangseob Kim. All authors have read and agreed to the published version of the manuscript.
Funding
This research was supported by a grant (RS-2022-ND634021(2022-MOIS61-002)) of Development Risk Prediction Technology of Storm and Flood for Climate Change based on Artificial Intelligence funded by Ministry of Interior and Safety (MOIS, Korea).
Institutional Review Board Statement
Not applicable.
Data Availability Statement
Not applicable.
Conflicts of Interest
The authors declare no conflict of interest.
References
- Adelodun, B.; Odey, G.; Lee, S.; Choi, K.S. Investigating the causal impacts relationship between economic flood damage and extreme precipitation indices based on ARDL-ECM framework: A case study of Chungcheong region in South Korea. Sustain. Cities Soc. 2023, 95, 104606. [Google Scholar] [CrossRef]
- Jiang, W.; Tan, Y. Overview on failures of urban underground infrastructures in complex geological conditions due to heavy rainfall in China during 1994–2018. Sustain. Cities Soc. 2022, 76. [Google Scholar] [CrossRef]
- Gimeno, L.; Algarra, I.; Gimeno-sotelo, L. Extreme precipitation events. 2022, 1–21. [CrossRef]
- Organization, W.M. WMO atlas of mortality and economic losses from weather, climate and water extremes; 2019; ISBN 9789263112675Organization, W.M. WMO atlas of mortality and economic losses from weather, climate and water extremes; 2019; ISBN 9789263112675.
- NEMA Annual Report on Disaster.; 2018.
- Kim, Y.; Sohn, H.-G. Disasters from 1948 to 2015 in Korea and Power-Law Distribution. In Disaster Risk Management in the Republic of Korea. Disaster Risk Reduction; 2018; pp. 77–97. ISBN 9789811047893.
- Ahmad, I.; Zhang, F.; Tayyab, M.; Anjum, M.N.; Zaman, M.; Liu, J.; Farid, H.U.; Saddique, Q. Spatiotemporal analysis of precipitation variability in annual, seasonal and extreme values over upper Indus River basin. Atmos. Res. 2018, 213, 346–360. [Google Scholar] [CrossRef]
- Umar, D.A.; Ramli, M.F.; Aris, A.Z.; Jamil, N.R.; Aderemi, A.A. Evidence of climate variability from rainfall and temperature fluctuations in semi-arid region of the tropics. Atmos. Res. 2019, 224, 52–64. [Google Scholar] [CrossRef]
- Gocic, M.; Trajkovic, S. Analysis of changes in meteorological variables using Mann-Kendall and Sen’s slope estimator statistical tests in Serbia. Glob. Planet. Change 2013, 100, 172–182. [Google Scholar] [CrossRef]
- Alifujiang, Y.; Abuduwaili, J.; Maihemuti, B.; Emin, B.; Groll, M. Innovative Trend Analysis of Precipitation in the Lake Issyk-Kul Basin, Kyrgyzstan. Atmosphere (Basel). 2020, 11, 332. [Google Scholar] [CrossRef]
- Şen, Z. Innovative Trend Analysis Methodology. J. Hydrol. Eng. 2012, 17, 1042–1046. [Google Scholar] [CrossRef]
- Caloiero, T.; Coscarelli, R.; Ferrari, E. Application of the Innovative Trend Analysis Method for the Trend Analysis of Rainfall Anomalies in Southern Italy. Water Resour. Manag. 2018, 32, 4971–4983. [Google Scholar] [CrossRef]
- Gedefaw, M.; Yan, D.; Wang, H.; Qin, T.; Girma, A.; Abiyu, A.; Batsuren, D. Innovative trend analysis of annual and seasonal rainfall variability in Amhara Regional State, Ethiopia. Atmosphere (Basel) 2018, 9. [Google Scholar] [CrossRef]
- Dong, Z.; Jia, W.; Sarukkalige, R.; Fu, G.; Meng, Q.; Wang, Q. Innovative trend analysis of air temperature and precipitation in the jinsha river basin, china. Water (Switzerland) 2020, 12. [Google Scholar] [CrossRef]
- Adelodun, B.; Odey, G.; Cho, H.; Lee, S.; Adeyemi, K.A.; Choi, K.S. Spatial-temporal variability of climate indices in Chungcheong provinces of Korea: Application of graphical innovative methods for trend analysis. Atmos. Res. 2022, 280, 106420. [Google Scholar] [CrossRef]
- Shah, S.A.; Jehanzaib, M.; Kim, M.J.; Kwak, D.-Y.; Kim, T.-W. Spatial and Temporal Variation of Annual and Categorized Precipitation in the Han River Basin, South Korea. KSCE J. Civ. Eng. 2022, 26, 1990–2001. [Google Scholar] [CrossRef]
- KOSIS Ministry of Land Infrastructure and Transport Statistics System. Available online: https://kosis.kr/index/index.do (accessed on 25 April 2022).
- Park, S.; Lim, J.; Lim, H.S. Past climate changes over South Korea during MIS3 and MIS1 and their links to regional and global climate changes. Quat. Int. 2019, 519, 74–81. [Google Scholar] [CrossRef]
- Kim, J.E.; Yu, J.; Ryu, J.H.; Lee, J.H.; Kim, T.W. Assessment of regional drought vulnerability and risk using principal component analysis and a Gaussian mixture model. Nat. Hazards 2021, 109, 707–724. [Google Scholar] [CrossRef]
- Alexander, L.; Herold, N. ClimPACT2 indices and software. 2016.
- WMO Guidelines on Analysis of extremes in a changing climate in support of informed decisions for adaptation; WCDMP-No 72. CH-1211. Geneva 2, Switzerland, 2009.
- Zhang, X.; Alexander, L.; Hegerl, G.C.; Jones, P.; Tank, A.K.; Peterson, T.C.; Trewin, B.; Zwiers, F.W. Indices for monitoring changes in extremes based on daily temperature and precipitation data. WIREs Clim. Chang. 2011, 2, 851–870. [Google Scholar] [CrossRef]
- Felix, M.L.; Kim, Y.; Choi, M.; Kim, J.-C.; Do, X.K.; Nguyen, T.H.; Jung, K. Detailed Trend Analysis of Extreme Climate Indices in the Upper Geum River Basin. Water 2021, 13, 3171. [Google Scholar] [CrossRef]
- Mei, C.; Liu, J.; Chen, M. Te; Wang, H.; Li, M.; Yu, Y. Multi-decadal spatial and temporal changes of extreme precipitation patterns in northern China (Jing-Jin-Ji district, 1960–2013). Quat. Int. 2018, 476, 1–13. [Google Scholar] [CrossRef]
- Mtewele, Z.F.; Xu, X.; Jia, G. Heterogeneous Trends of Precipitation Extremes in Recent Two Decades over East Africa. J. Meteorol. Res. 2021, 35, 1057–1073. [Google Scholar] [CrossRef]
- Şen, Z. Innovative trend significance test and applications. Theor. Appl. Climatol. 2017, 127, 939–947. [Google Scholar] [CrossRef]
- Njouenwet, I.; Tchotchou, L.A.D.; Ayugi, B.O.; Guenang, G.M.; Vondou, D.A.; Nouayou, R. Spatiotemporal Variability, Trends, and Potential Impacts of Extreme Rainfall Events in the Sudano-Sahelian Region of Cameroon. Atmosphere (Basel) 2022, 13, 1599. [Google Scholar] [CrossRef]
- Güçlü, Y.S. Multiple Şen-innovative trend analyses and partial Mann-Kendall test. J. Hydrol. 2018, 566, 685–704. [Google Scholar] [CrossRef]
- Mallick, J.; Talukdar, S.; Alsubih, M.; Salam, R.; Ahmed, M.; Kahla, N. Ben; Shamimuzzaman, M. Analysing the trend of rainfall in Asir region of Saudi Arabia using the family of Mann-Kendall tests, innovative trend analysis, and detrended fluctuation analysis. Theor. Appl. Climatol. 2021, 143, 823–841. [Google Scholar] [CrossRef]
- Wu, H.; Qian, H. Innovative trend analysis of annual and seasonal rainfall and extreme values in Shaanxi, China, since the 1950s. Int. J. Climatol. 2017, 37, 2582–2592. [Google Scholar] [CrossRef]
- Kendall, M.G. Rank Correlation Method; Charless Griffin: London, 1975.
- Mann, H.B. Nonparametric Tests Against Trend. Econometrica 1945, 13, 245–259. [Google Scholar] [CrossRef]
- Sneyers, R. On the statistical analysis of series of observations; 192; 1990.
- Spearman, C. The Proof and Measurement of Association between Two Things. Am. J. Psychol. 1987, 100, 441. [Google Scholar] [CrossRef]
- Lehmann, E.L.; D’Abrera, H.J. Nonparametrics: Statistical methods based on ranks; San Francisco, 1975.
- Wang, Y.; Xu, Y.; Tabari, H.; Wang, J.; Wang, Q.; Song, S.; Hu, Z. Innovative trend analysis of annual and seasonal rainfall in the Yangtze River Delta, eastern China. Atmos. Res. 2020, 231, 104673. [Google Scholar] [CrossRef]
- Maeng, S.J.; Azam, M.; Kim, H.S.; Hwang, J.H. Analysis of changes in spatio-temporal patterns of drought across South Korea. Water (Switzerland) 2017, 9, 1–20. [Google Scholar] [CrossRef]
- Boram, P. Heavy rain pummels central S. Korea, leaving 1 firefighter missing Available online:. Available online: https://en.yna.co.kr/view/AEN20200802000700315 (accessed on 21 May 2022).
- Adelodun, B.; Odey, G.; Lee, S.; Choi, K.S. Analysis of Spatial-temporal Variability and Trends of Extreme Precipitation Indices over Chungcheong Province, South Korea. J. Korean Soc. Agric. Eng. 2022, 64, 101–112. [Google Scholar] [CrossRef]
- Seo, L.; Kim, T.-W.; Kwon, H.-H. Investigation of trend variations in annual maximum rainfalls in South Korea. KSCE J. Civ. Eng. 2012, 16, 215–221. [Google Scholar] [CrossRef]
- Jung, I.-W.; Bae, D.-H.; Kim, G. Recent trends of mean and extreme precipitation in Korea. Int. J. Climatol. 2011, 31, 359–370. [Google Scholar] [CrossRef]
- Ahmed, I.A.; Salam, R.; Naikoo, M.W.; Rahman, A.; Praveen, B.; Hoai, P.N.; Pham, Q.B.; Anh, D.T.; Tri, D.Q.; Elkhrachy, I. Evaluating the variability in long-term rainfall over India with advanced statistical techniques. Acta Geophys. 2022, 70, 801–818. [Google Scholar] [CrossRef]
Figure 1.
Map of the study area and locations of the synoptic stations with elevation.
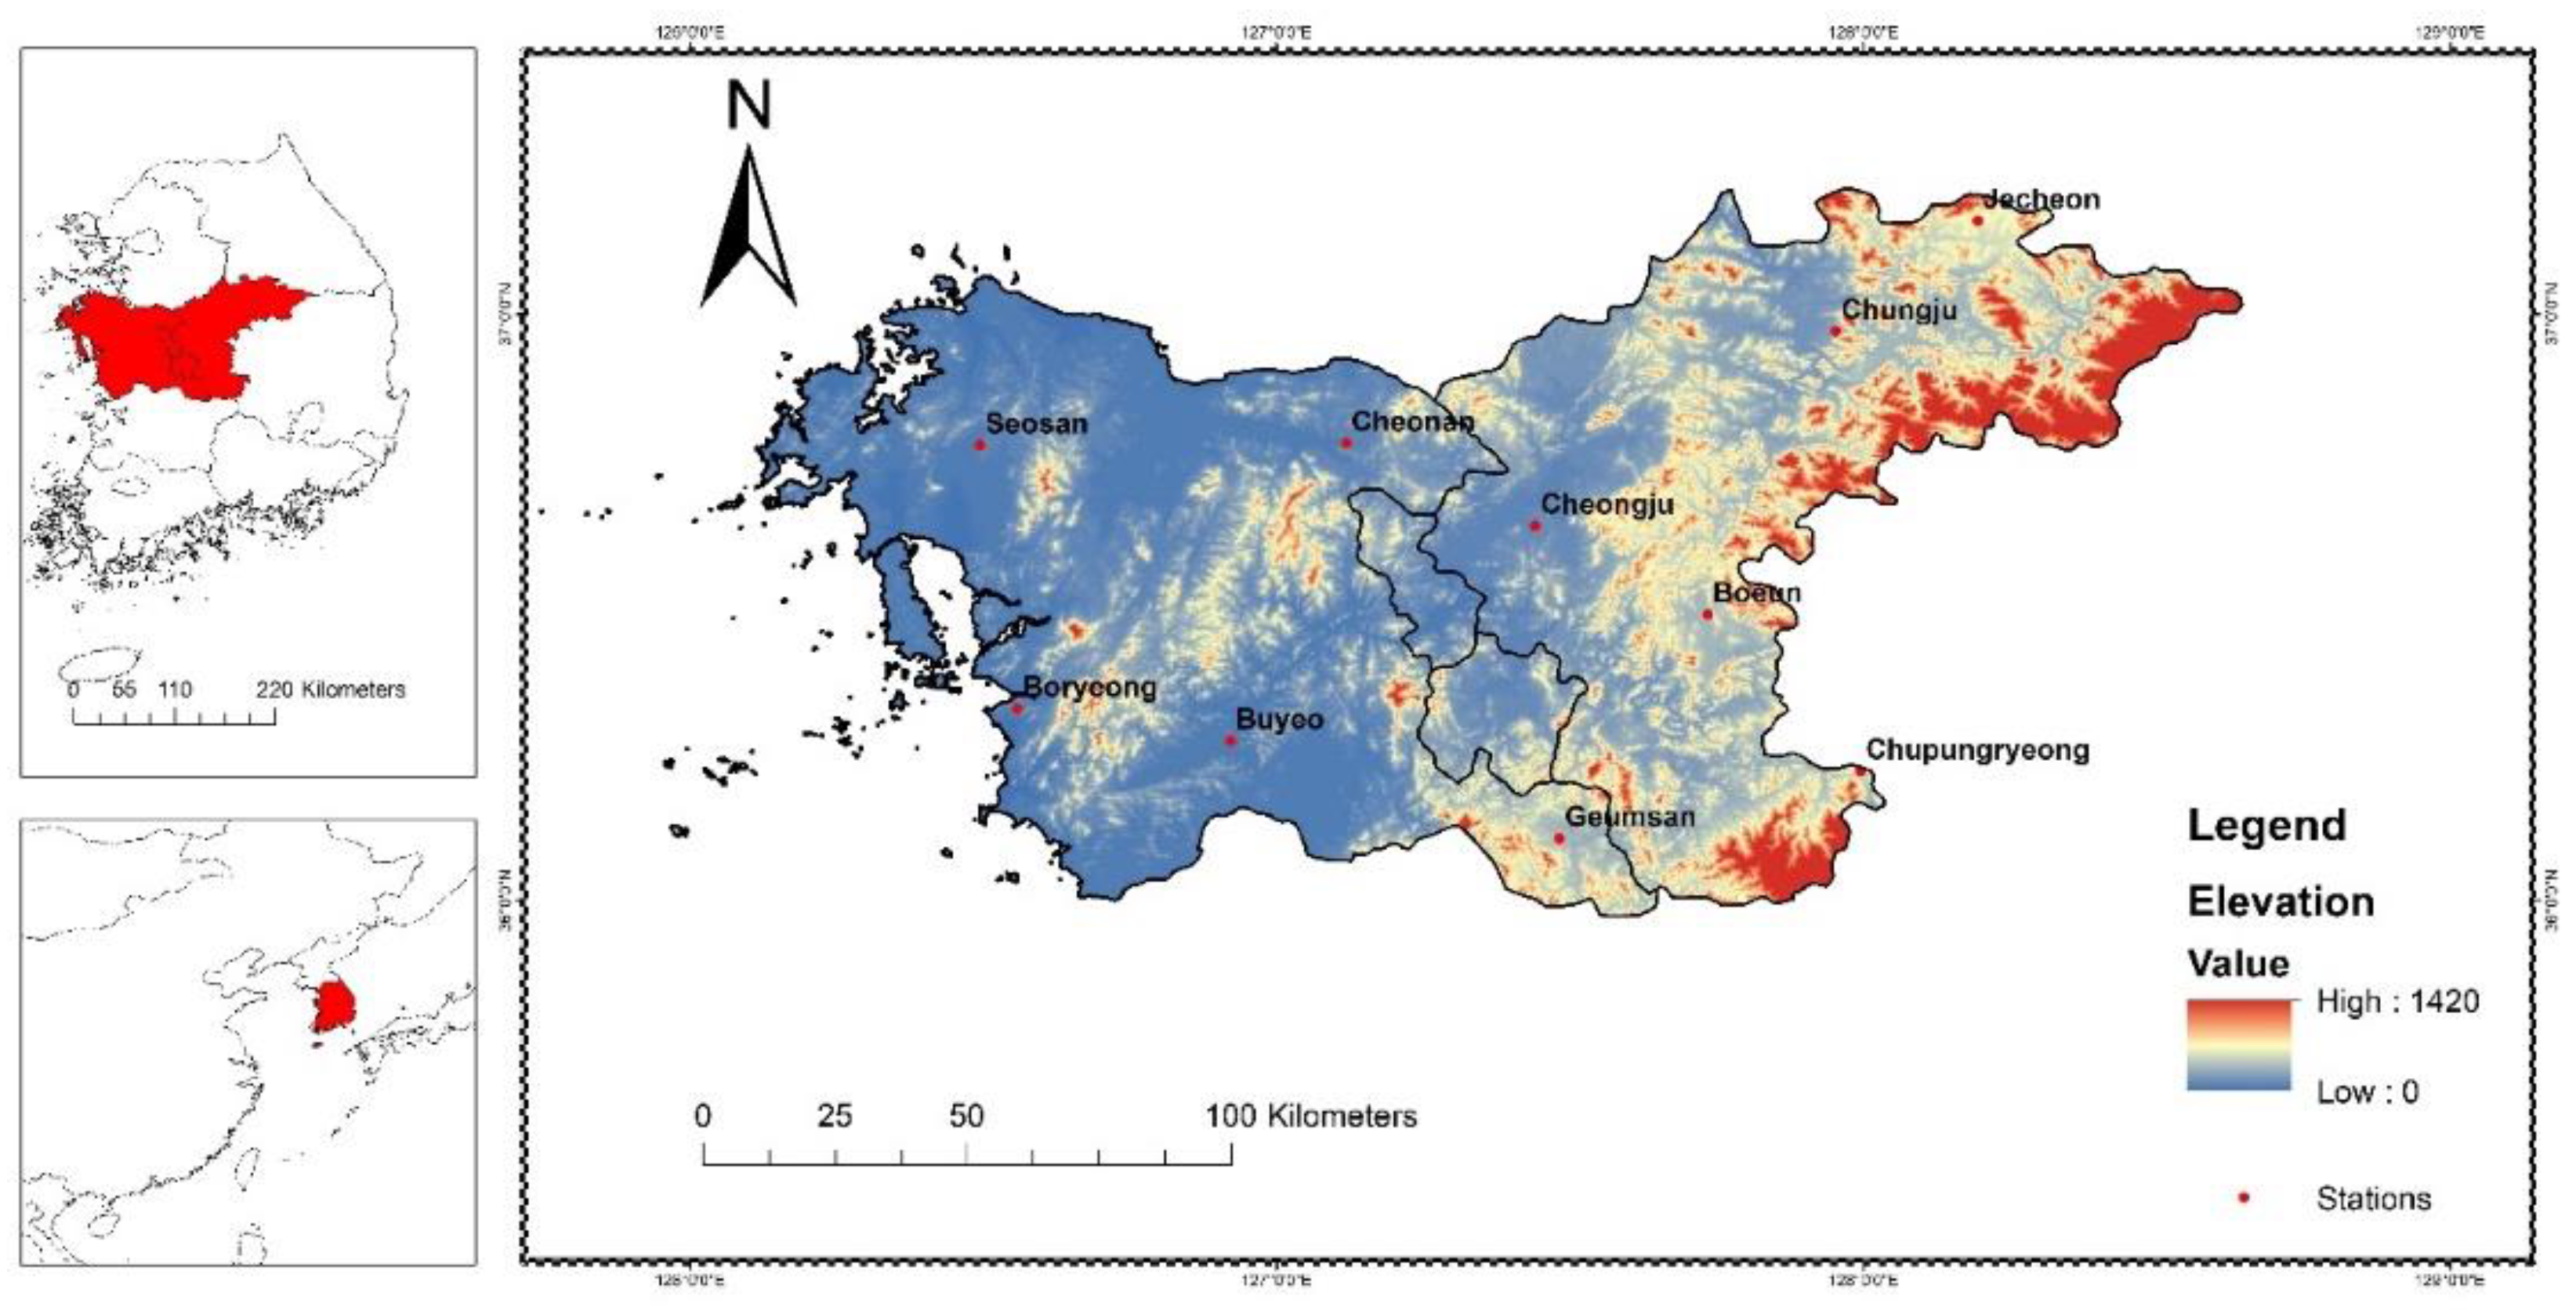
Figure 2.
The illustration of the graphical ITA method.
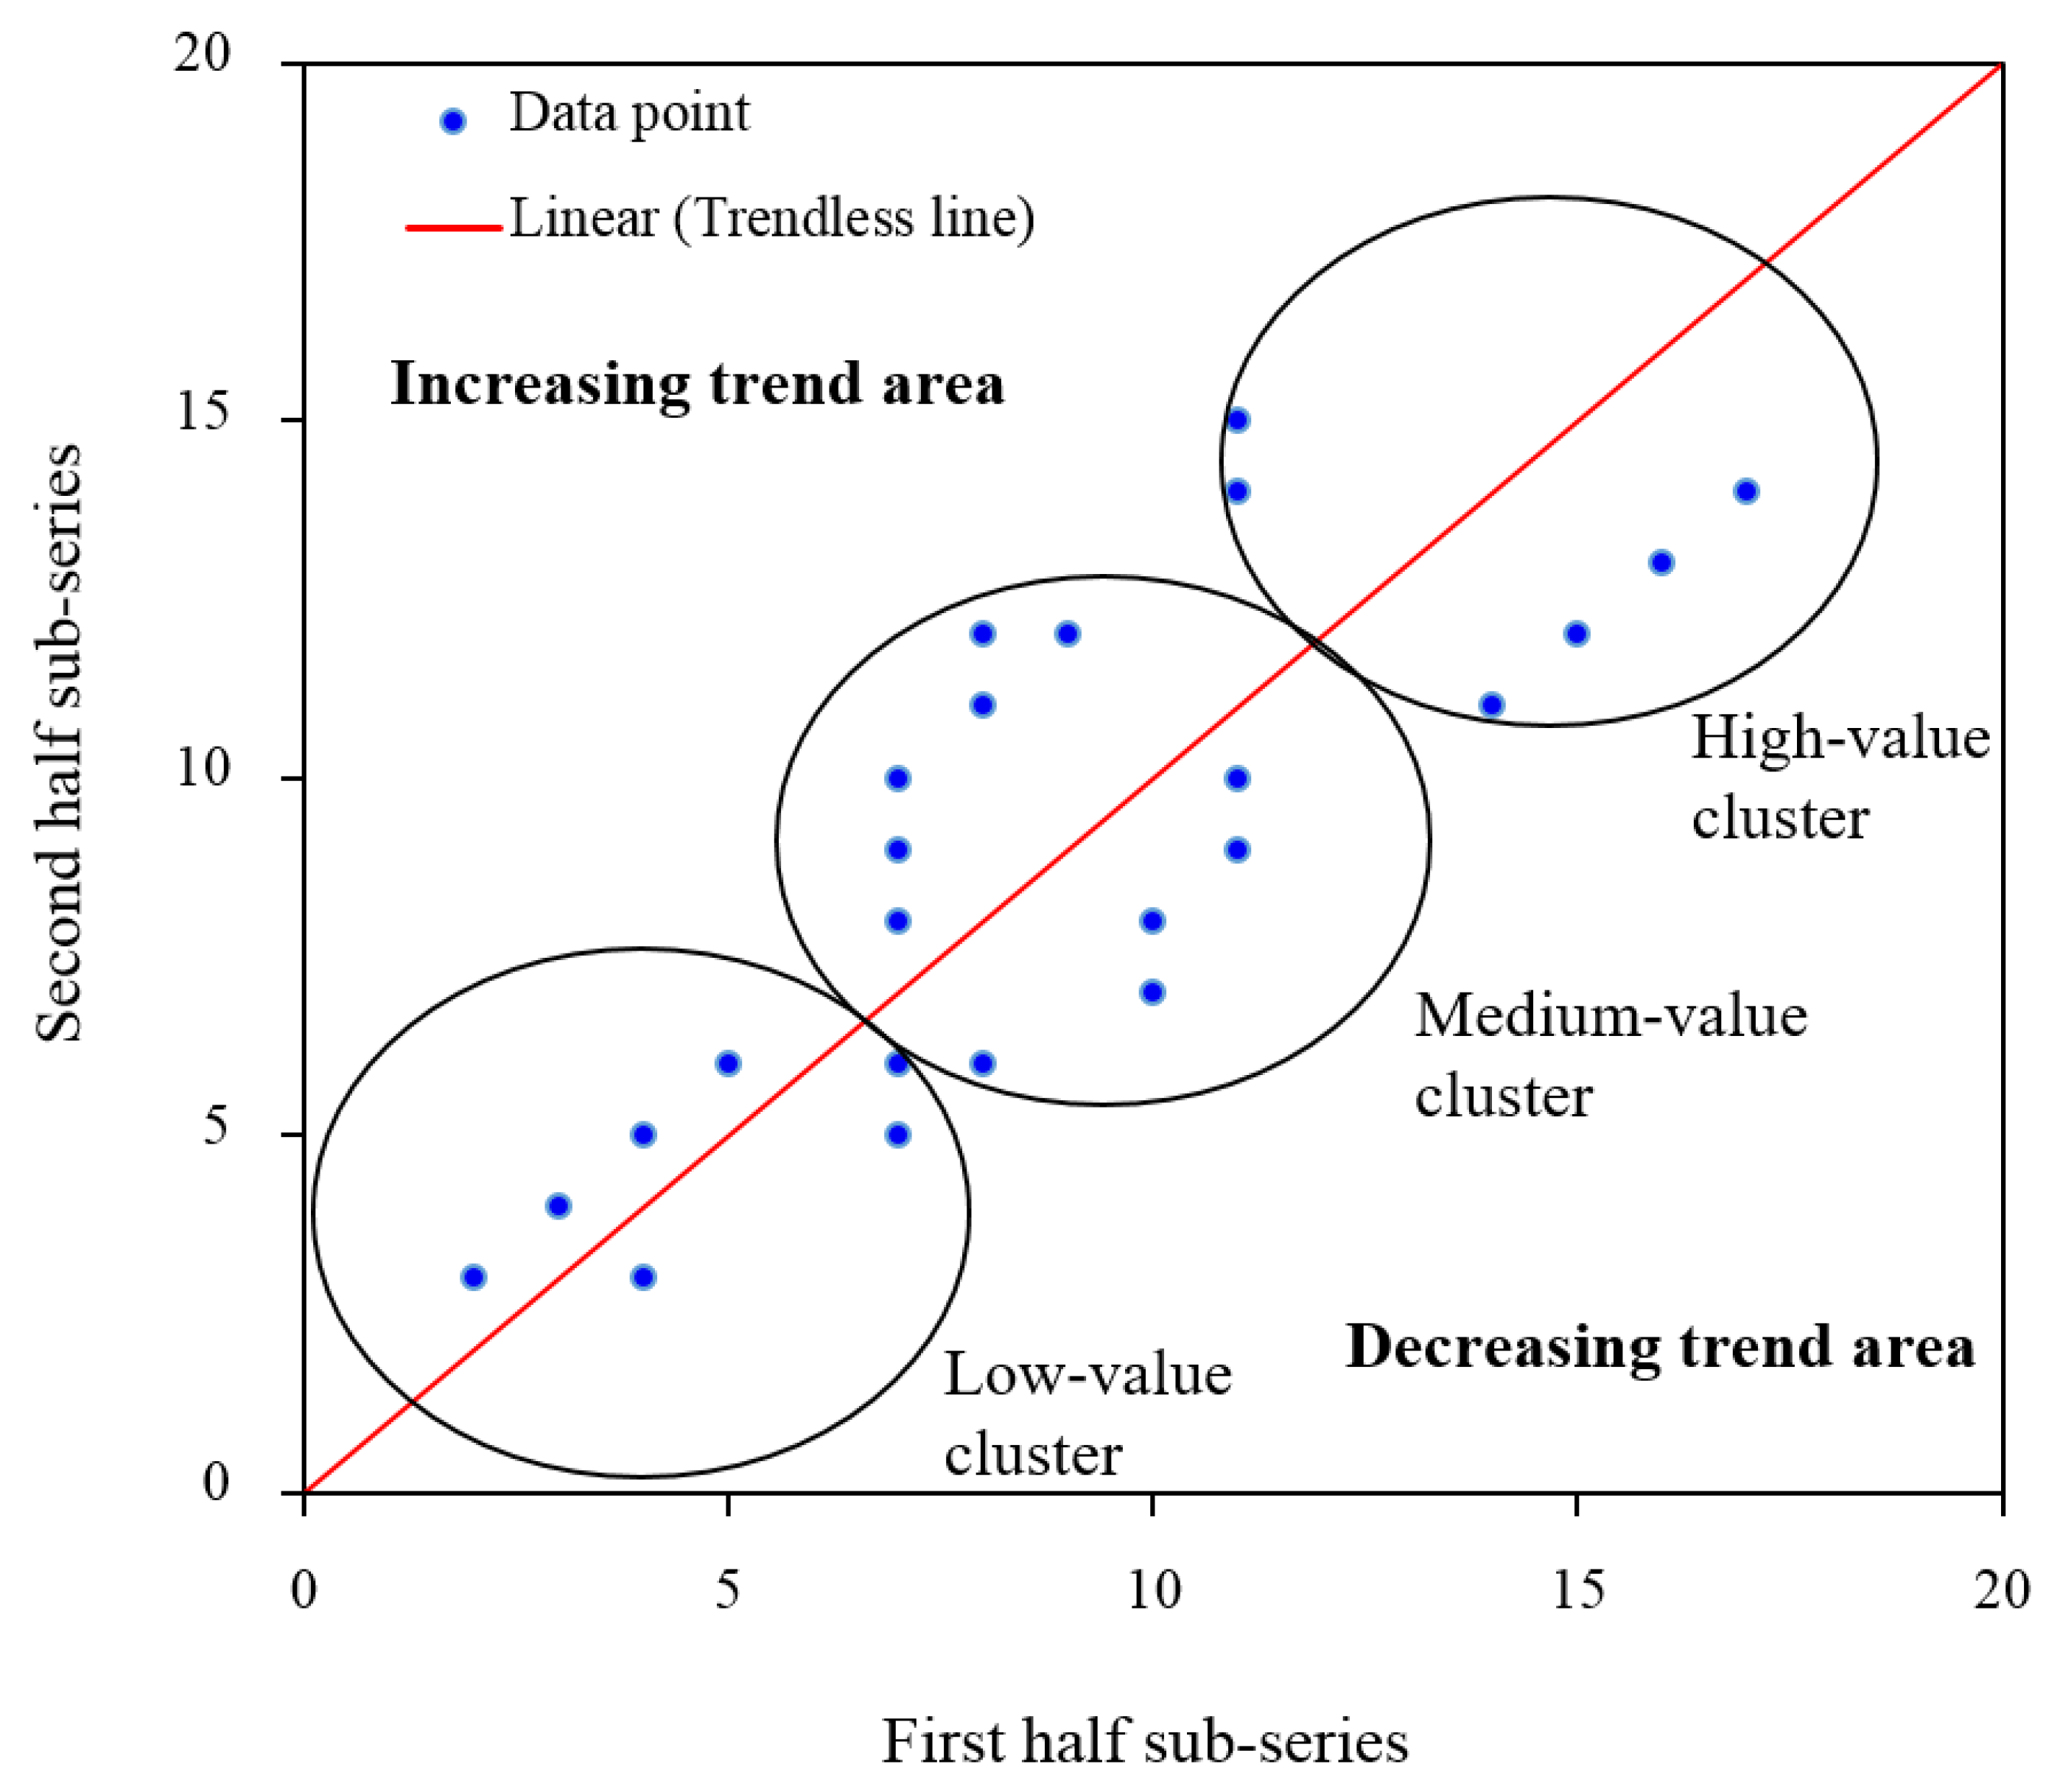
Figure 4.
Innovative trend analysis plots for CDD.
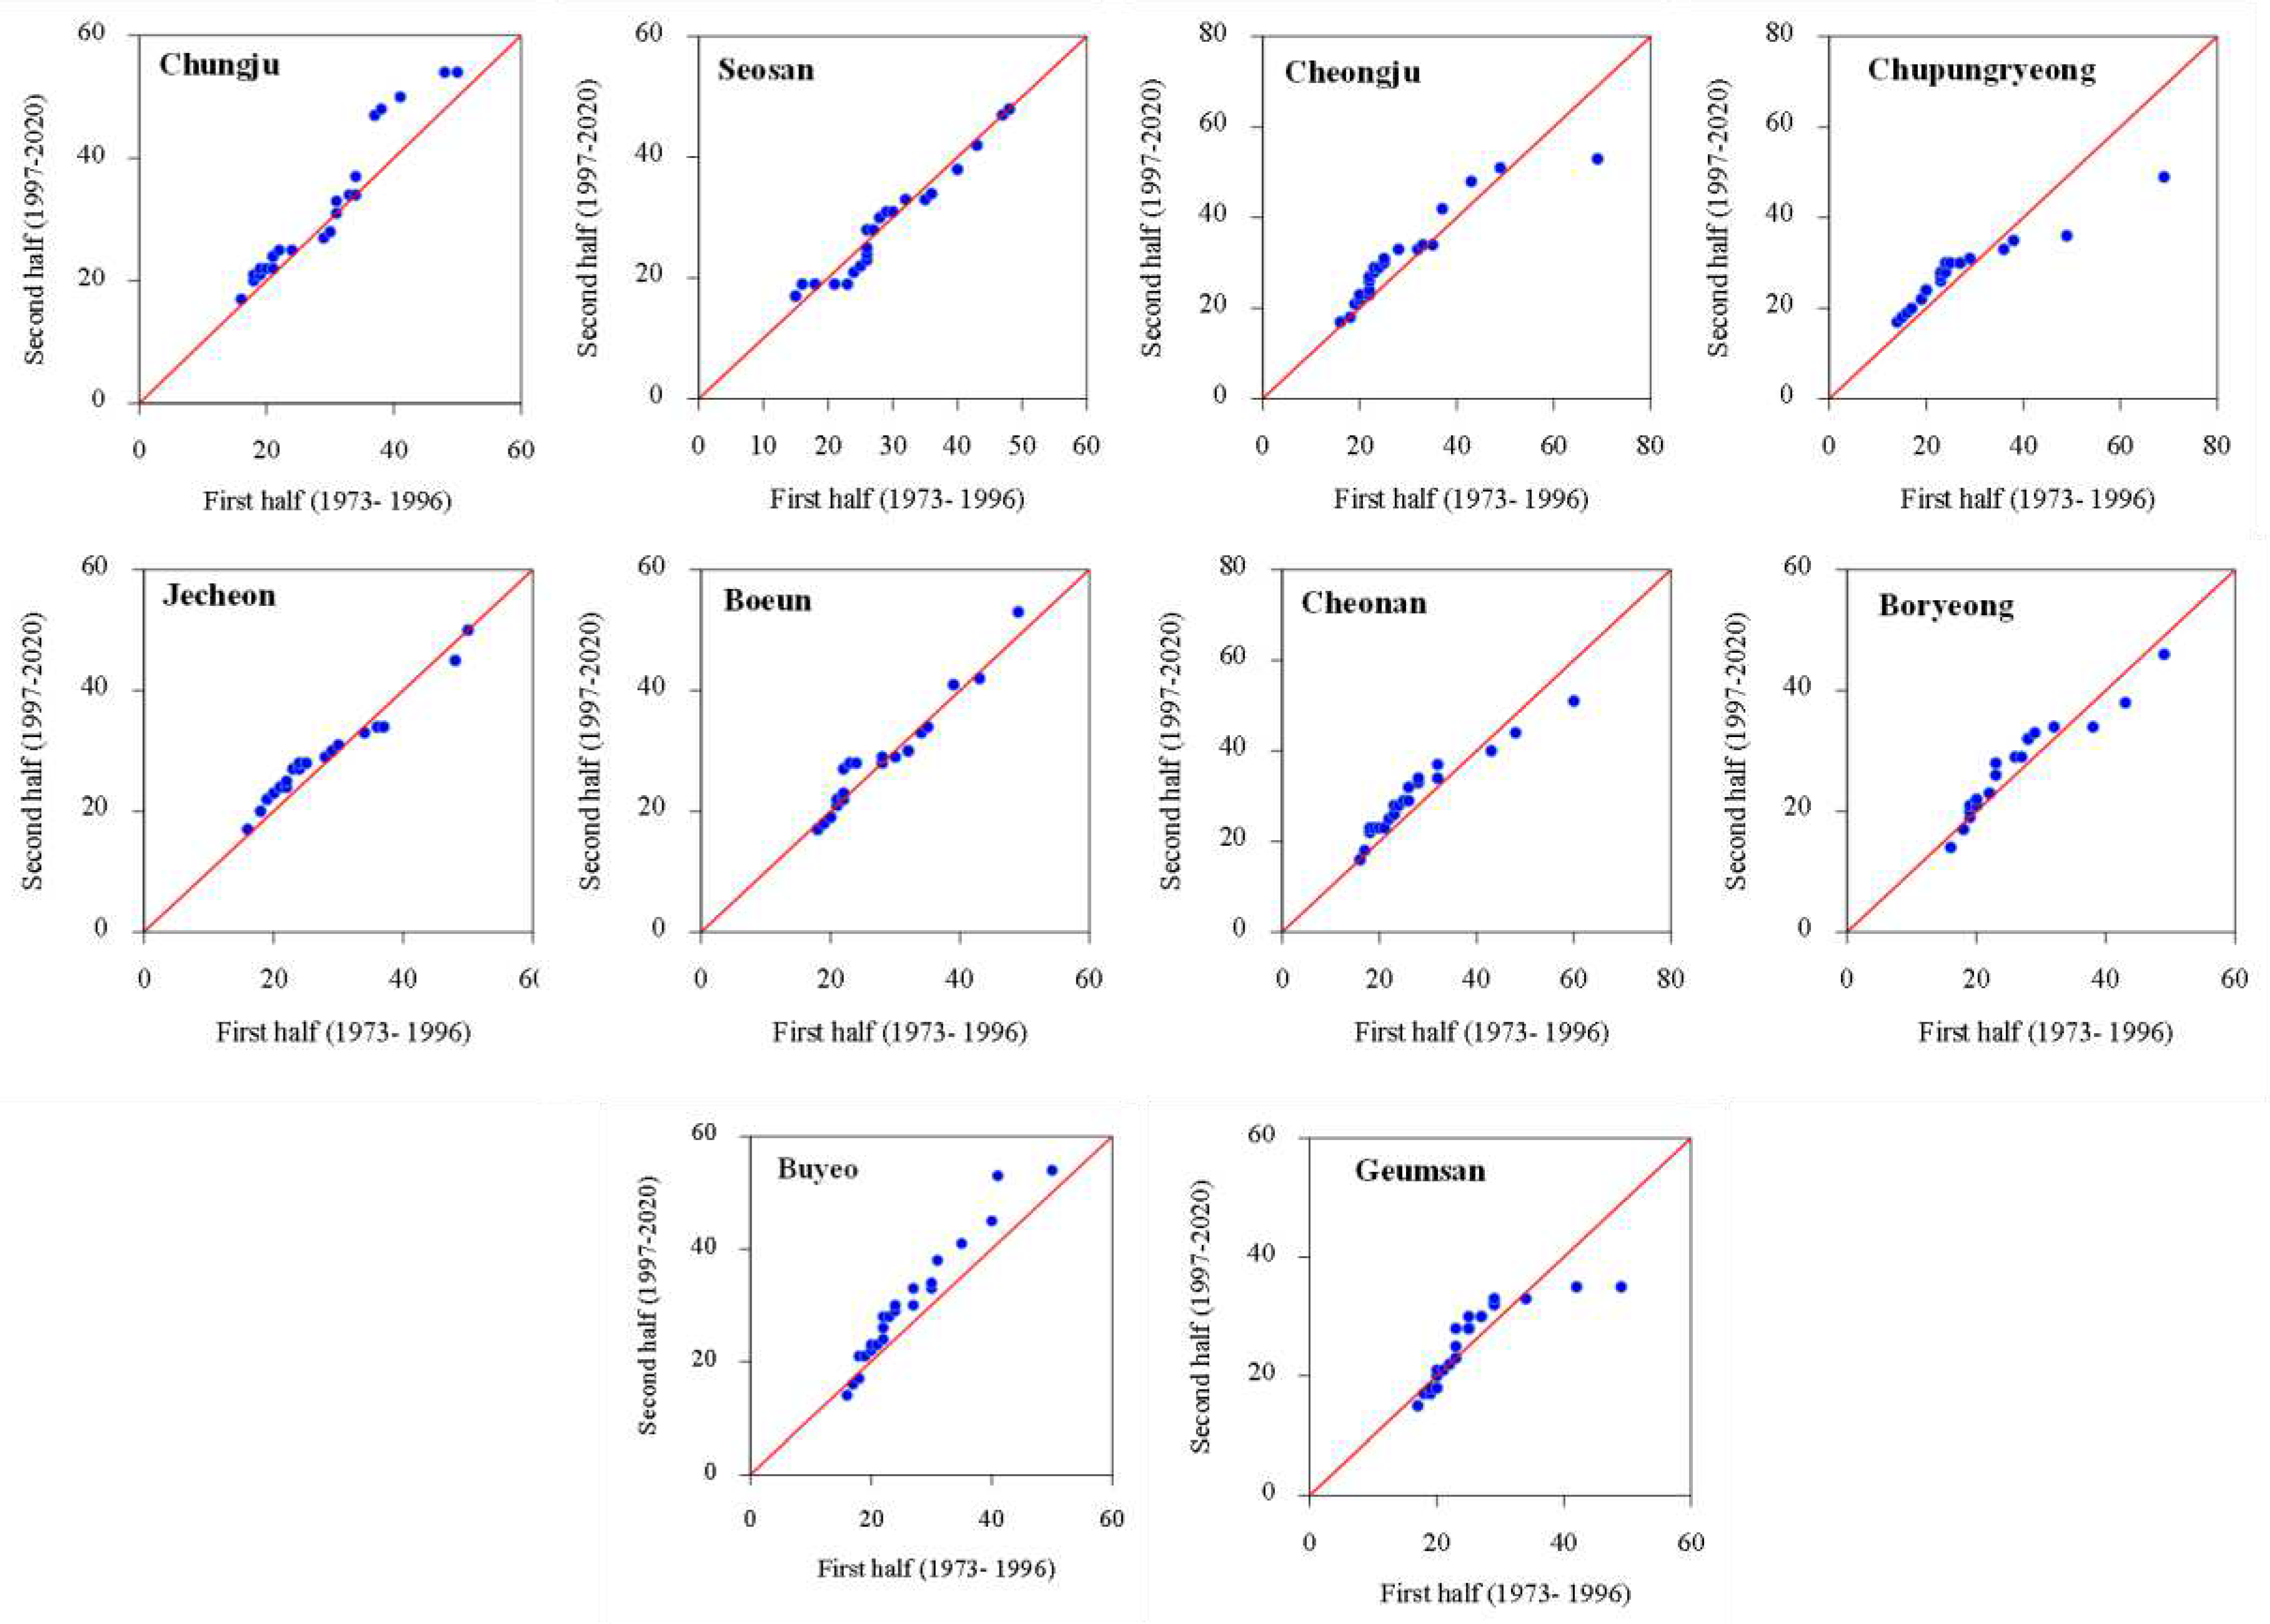
Figure 5.
Innovative trend analysis plots for CWD.
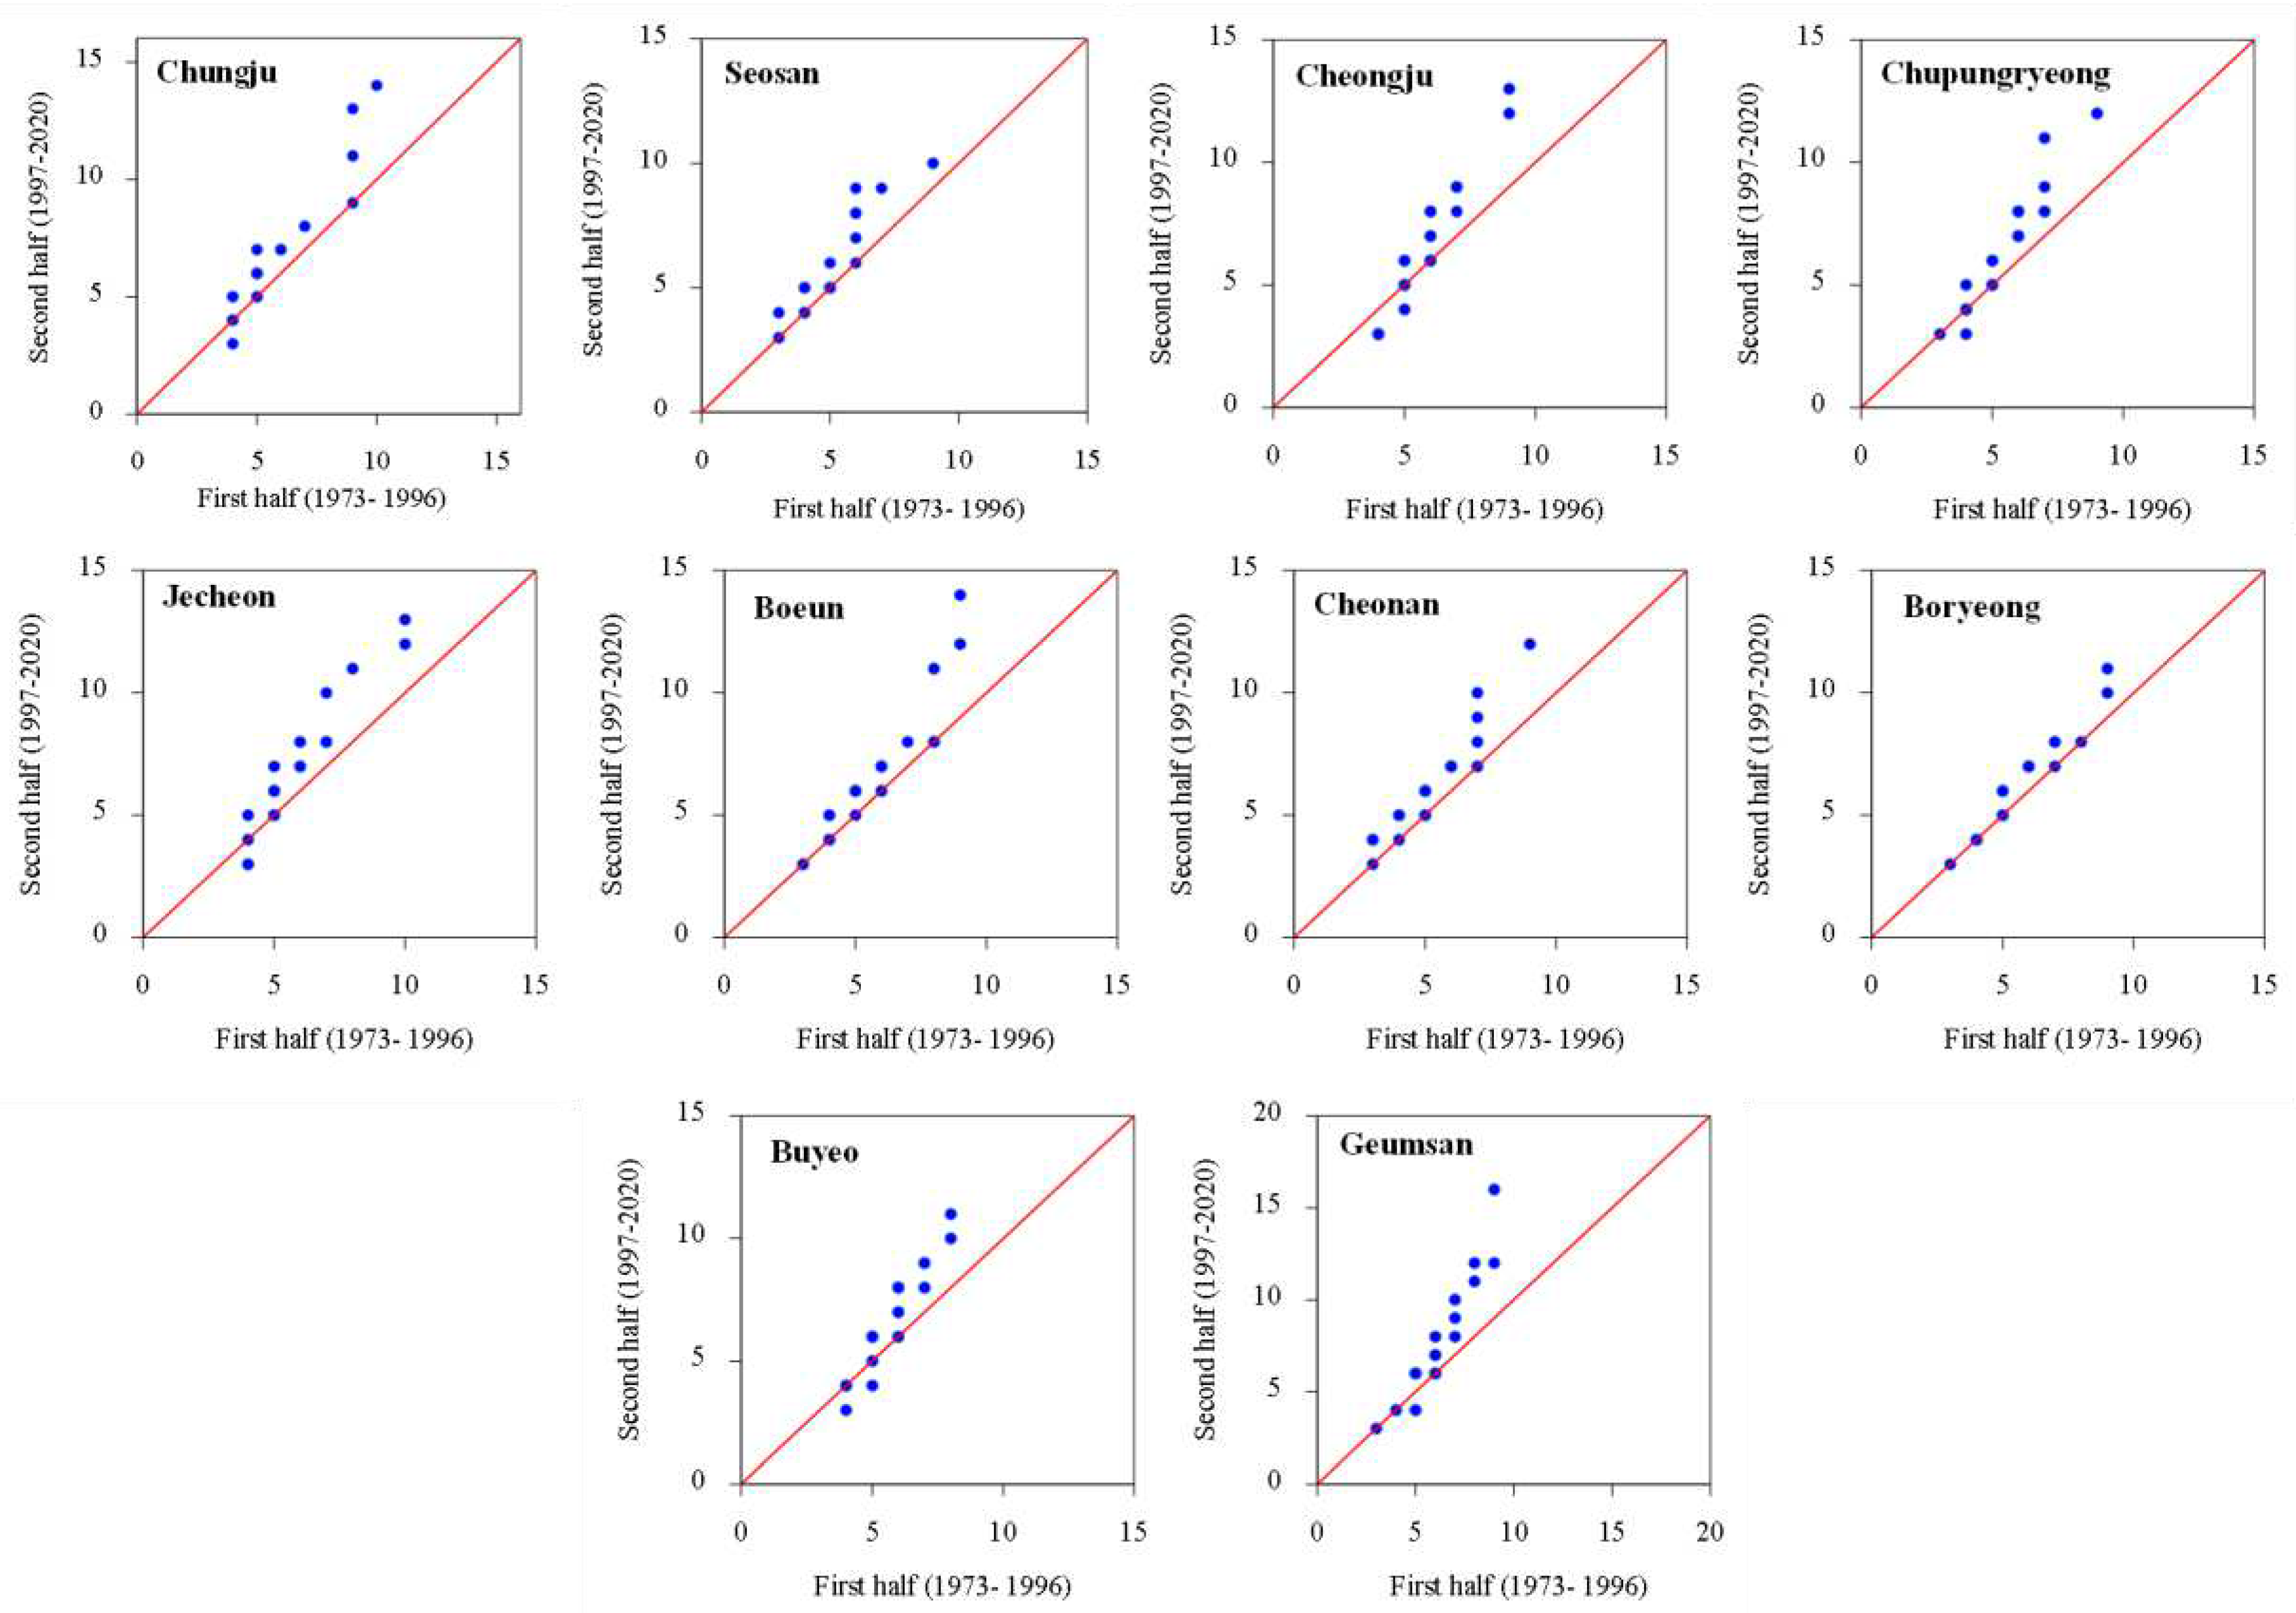
Figure 6.
Innovative trend analysis plots for R10mm.
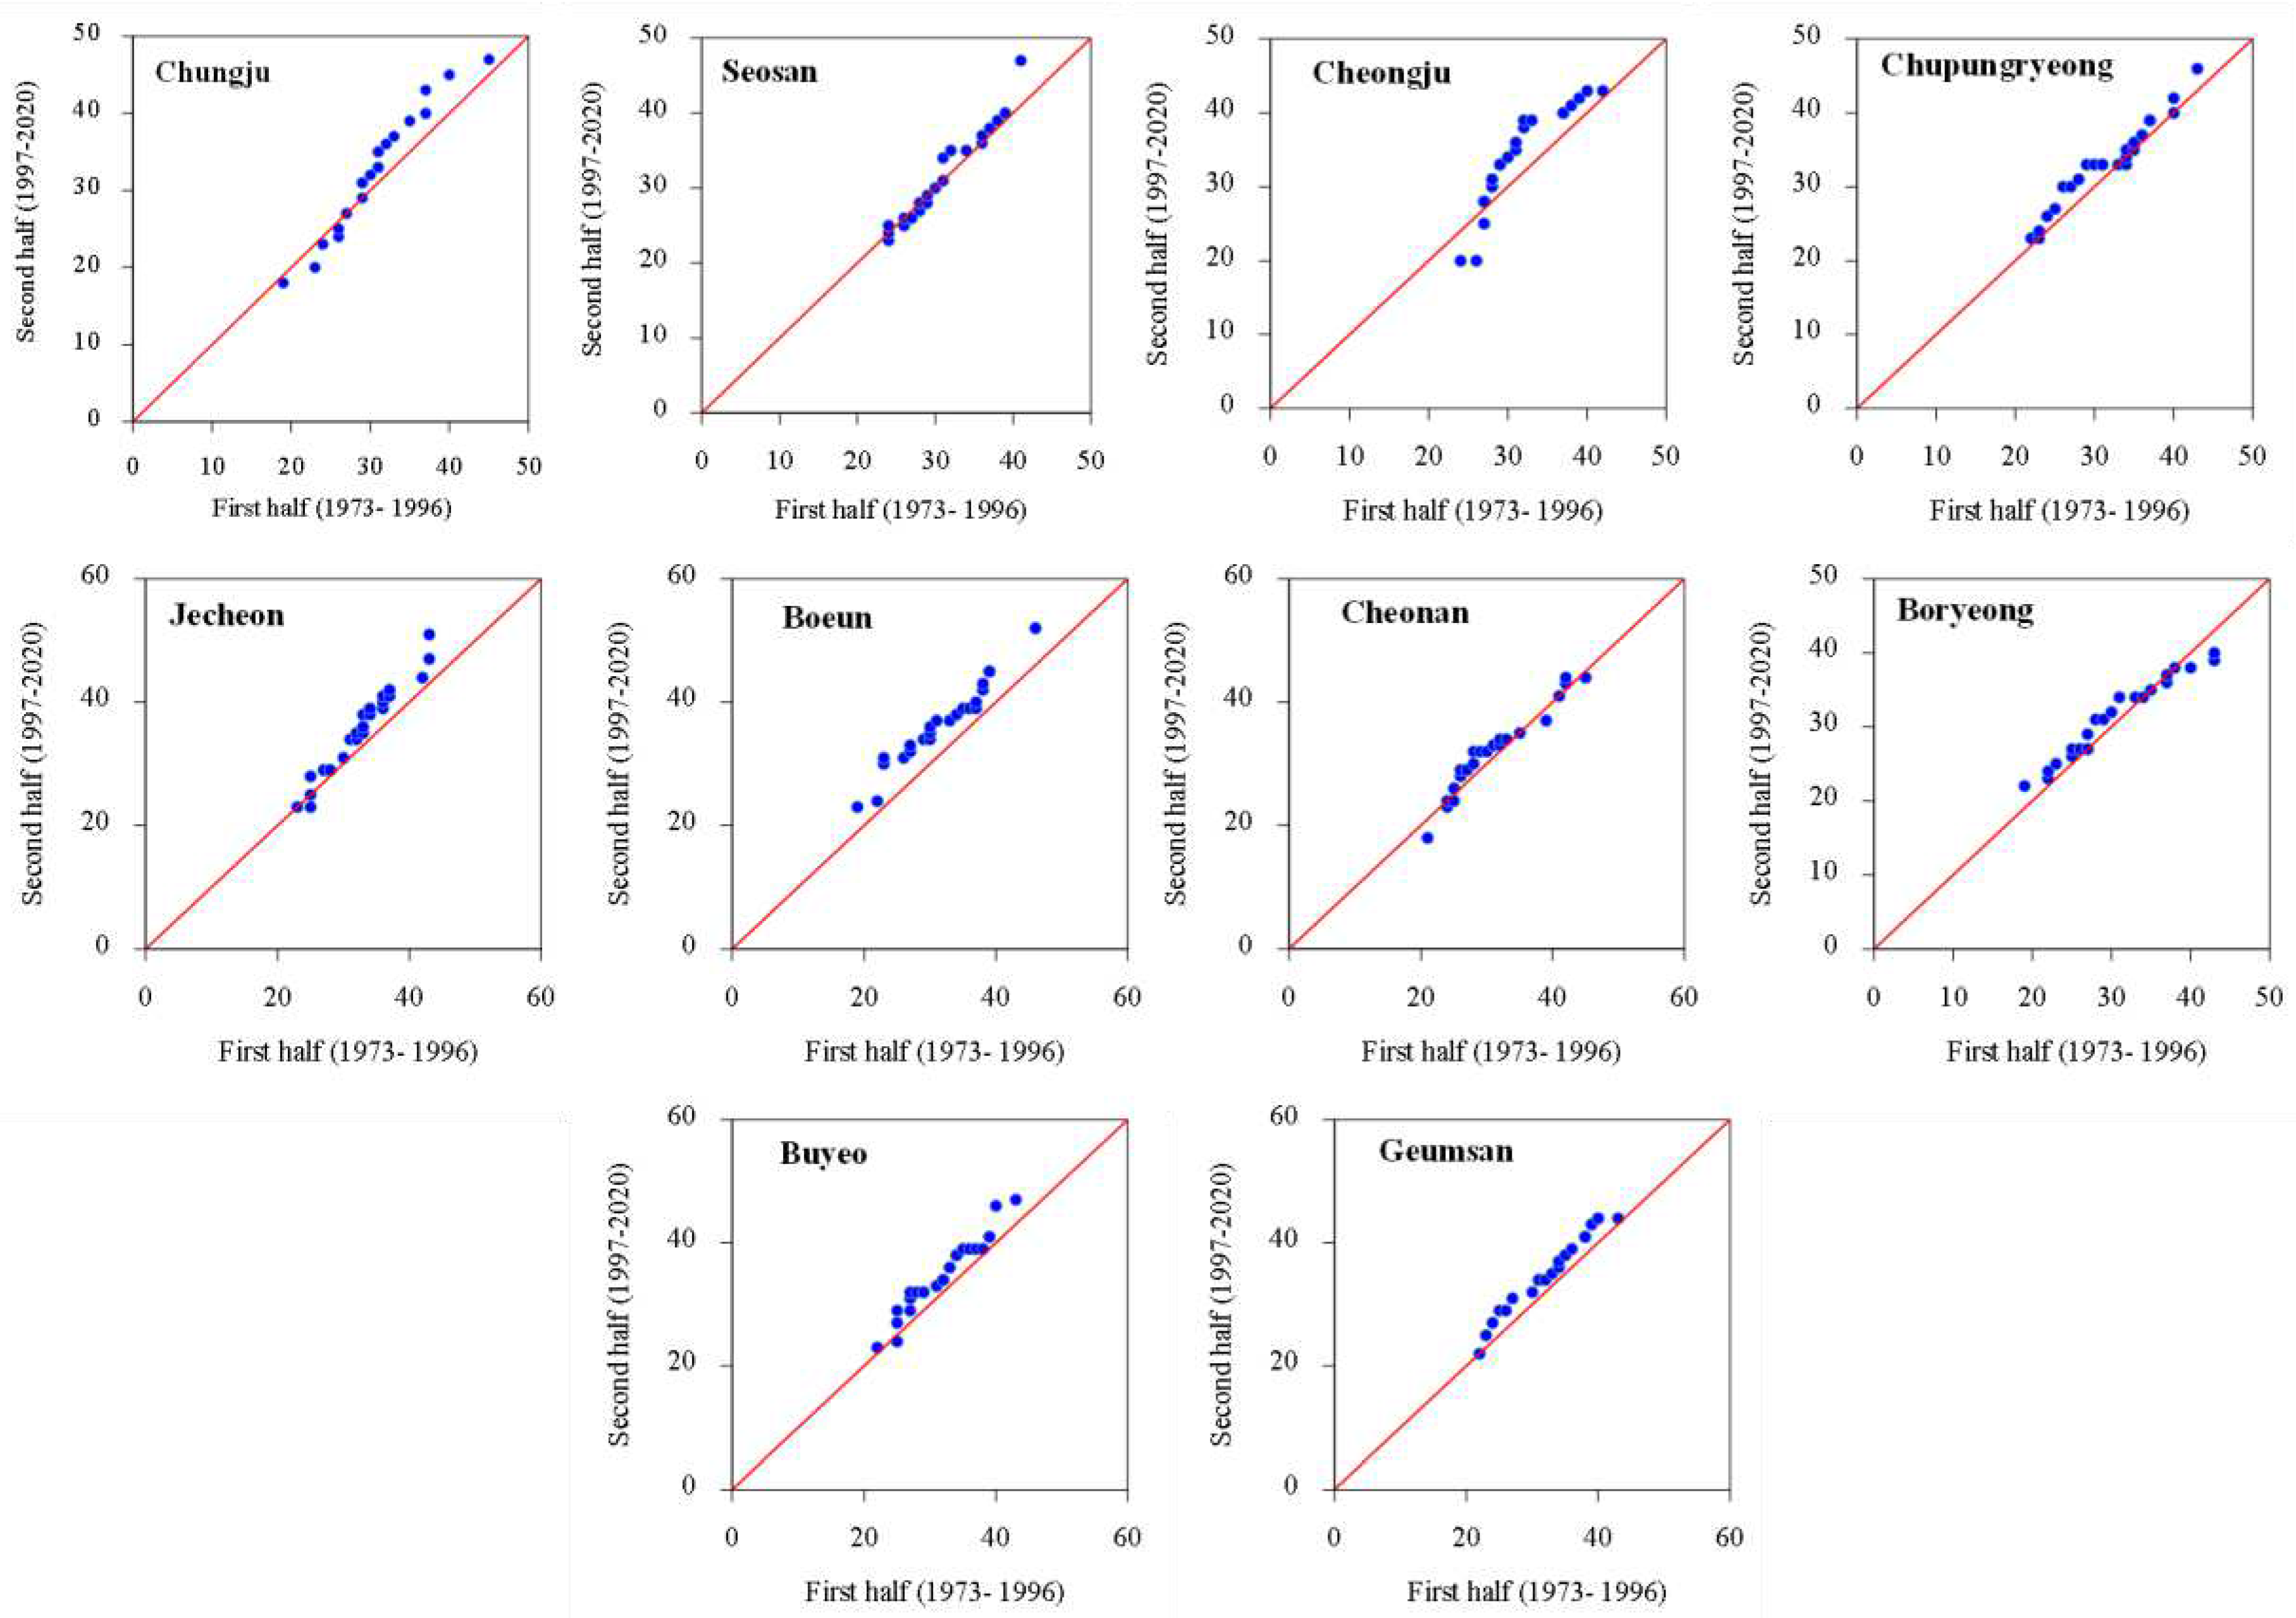
Figure 7.
Innovative trend analysis plots for R20mm.
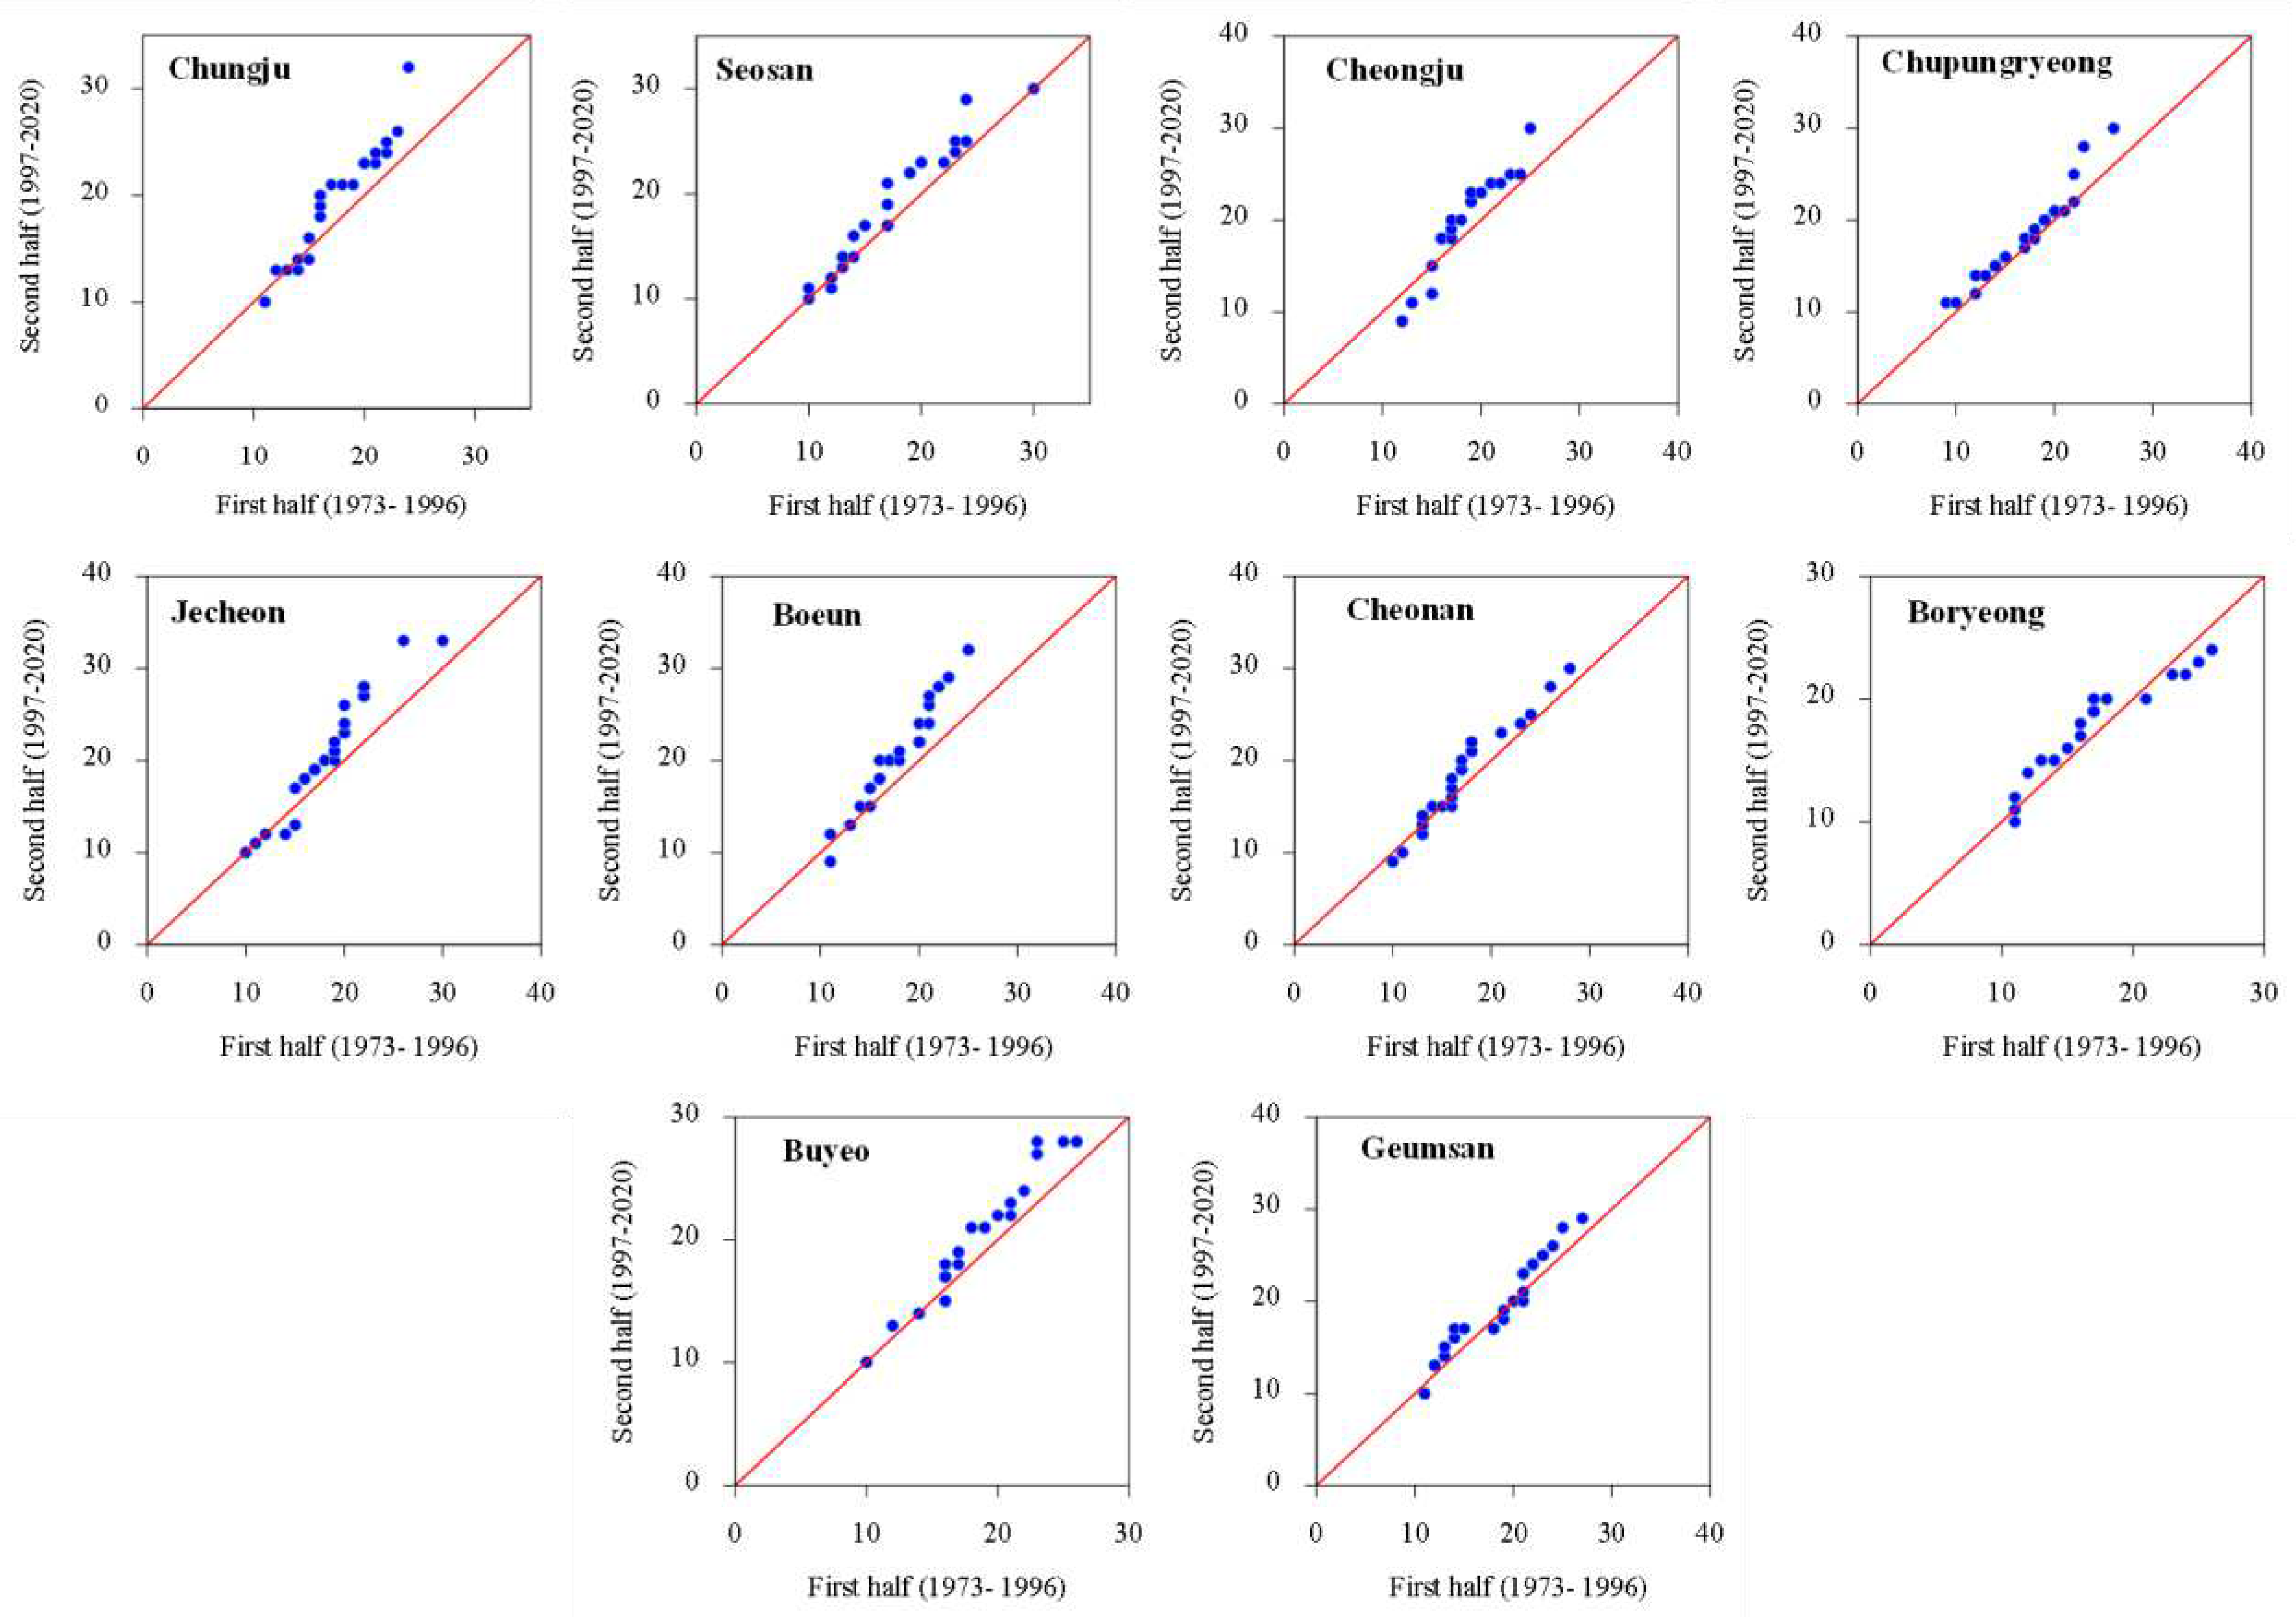
Figure 8.
Innovative trend analysis plots for R30mm.
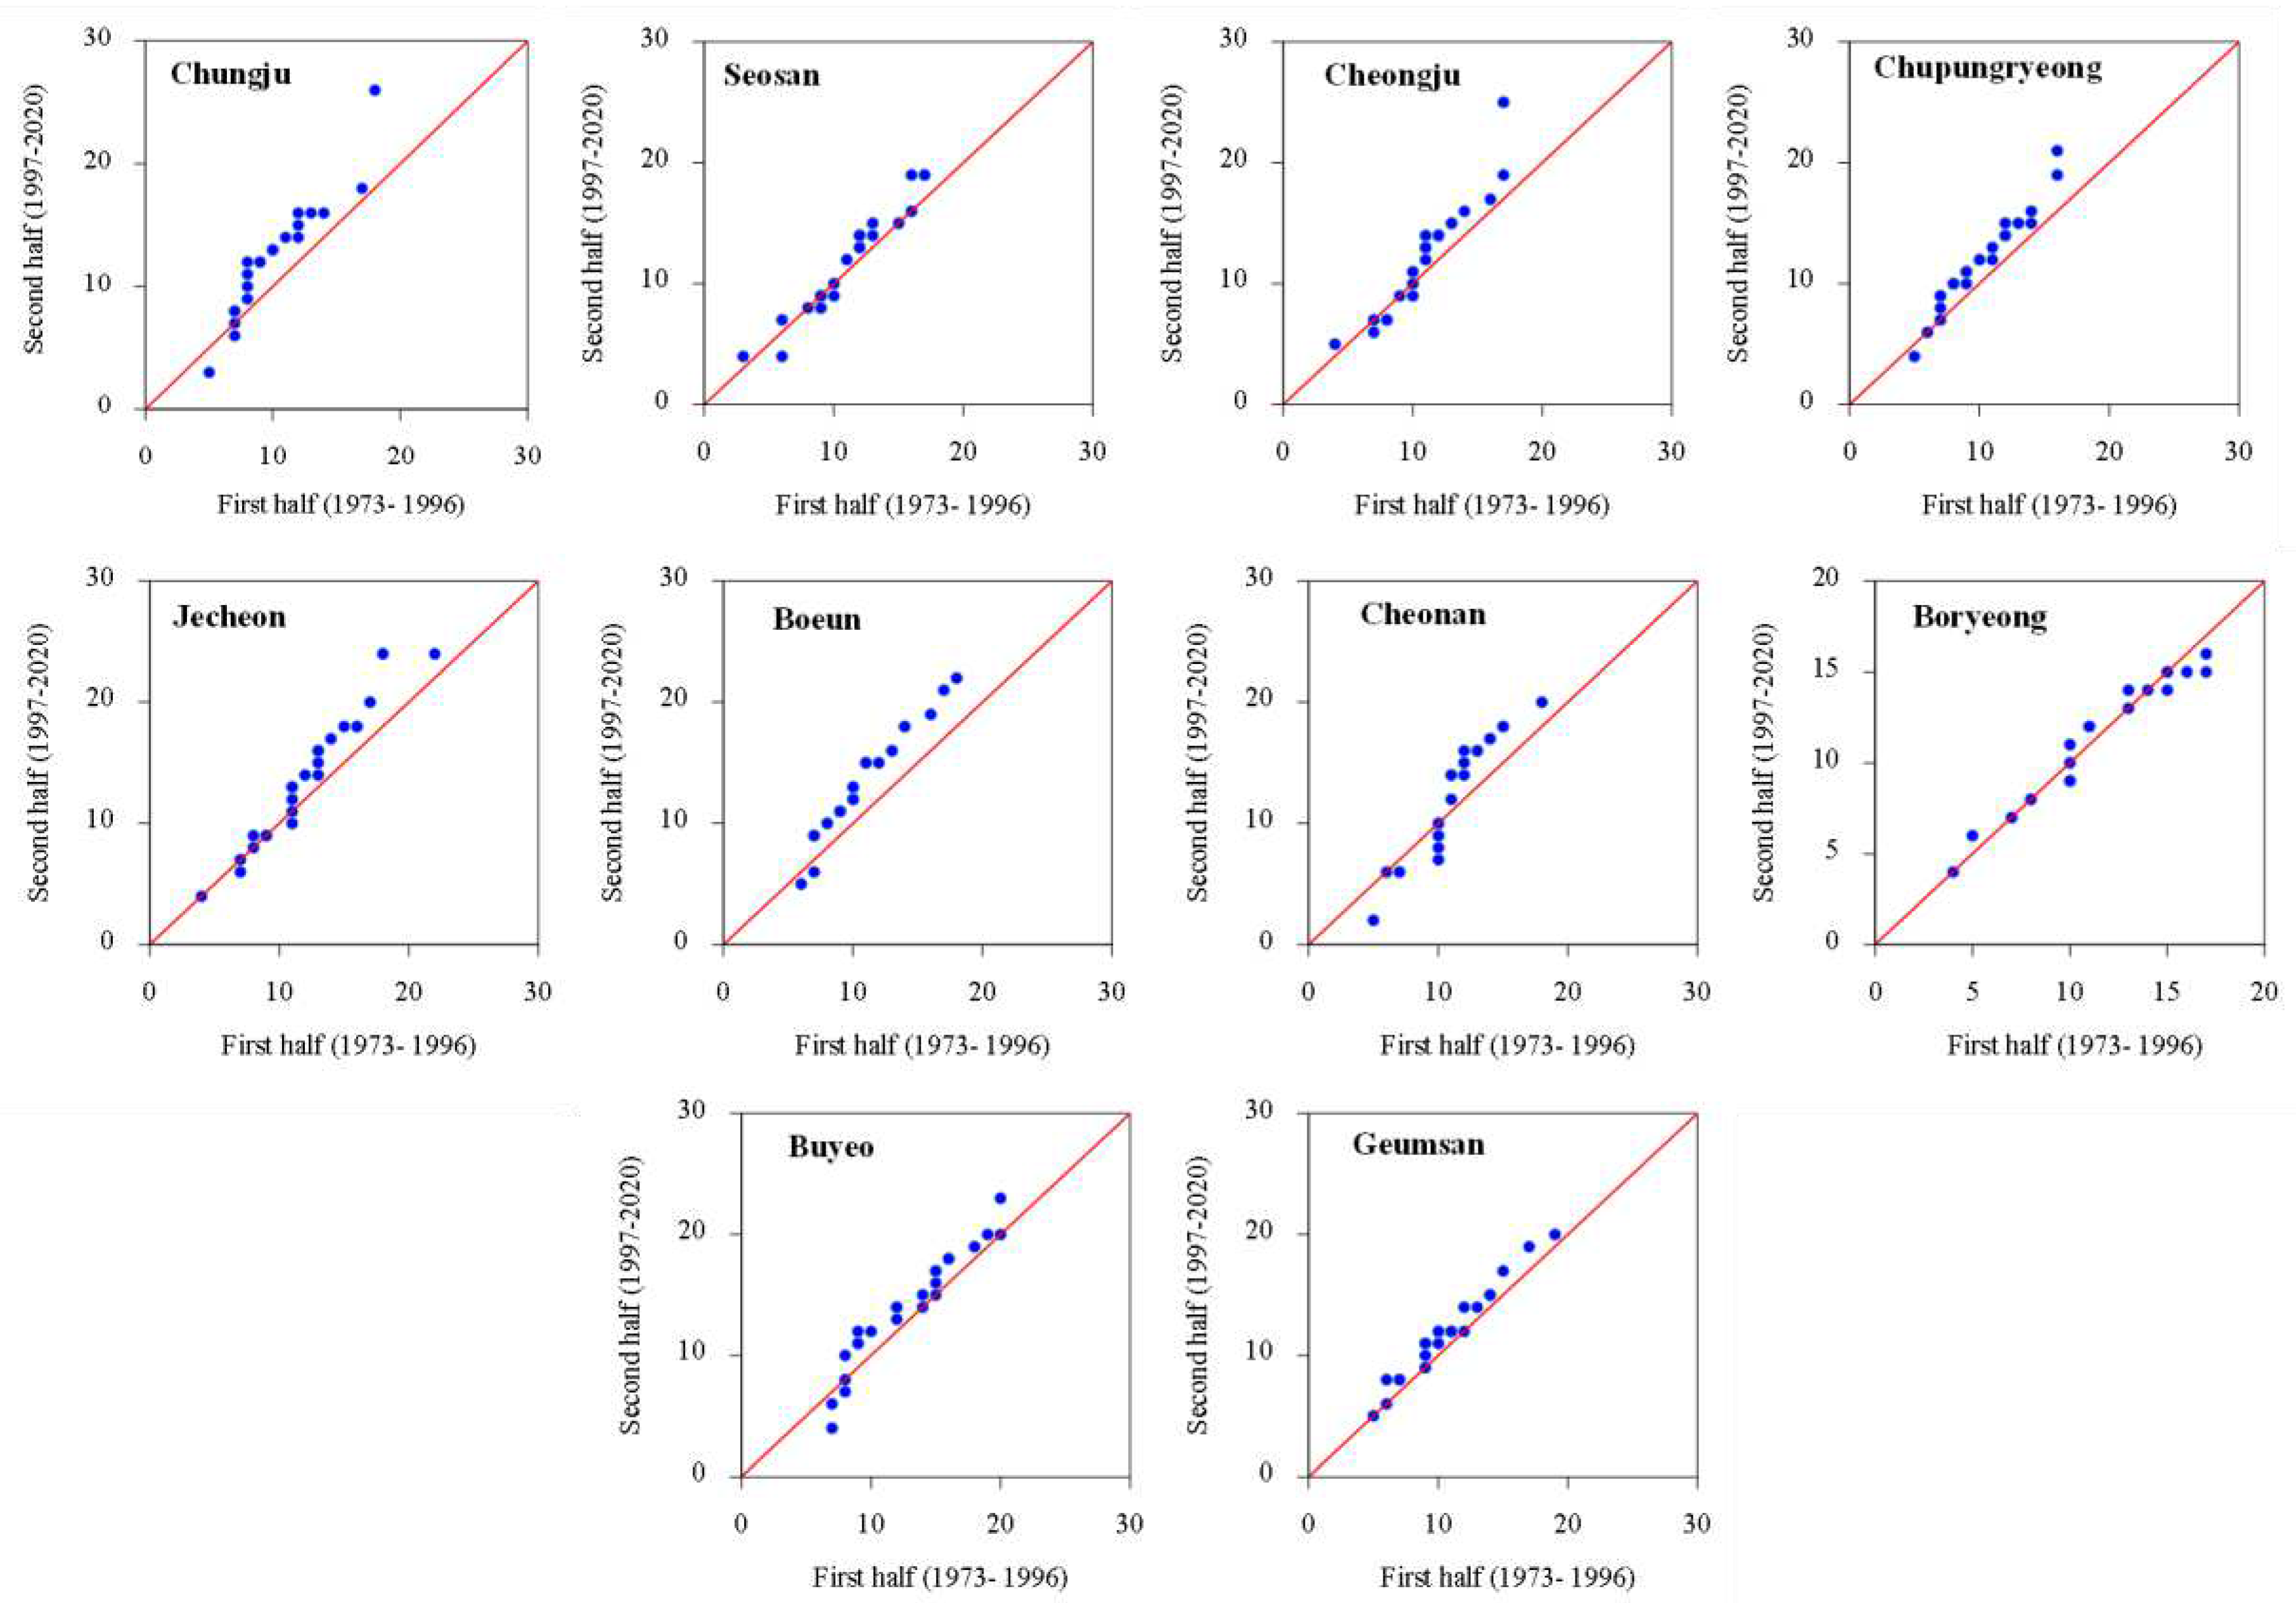
Figure 9.
Innovative trend analysis plots for PRCPTOT.
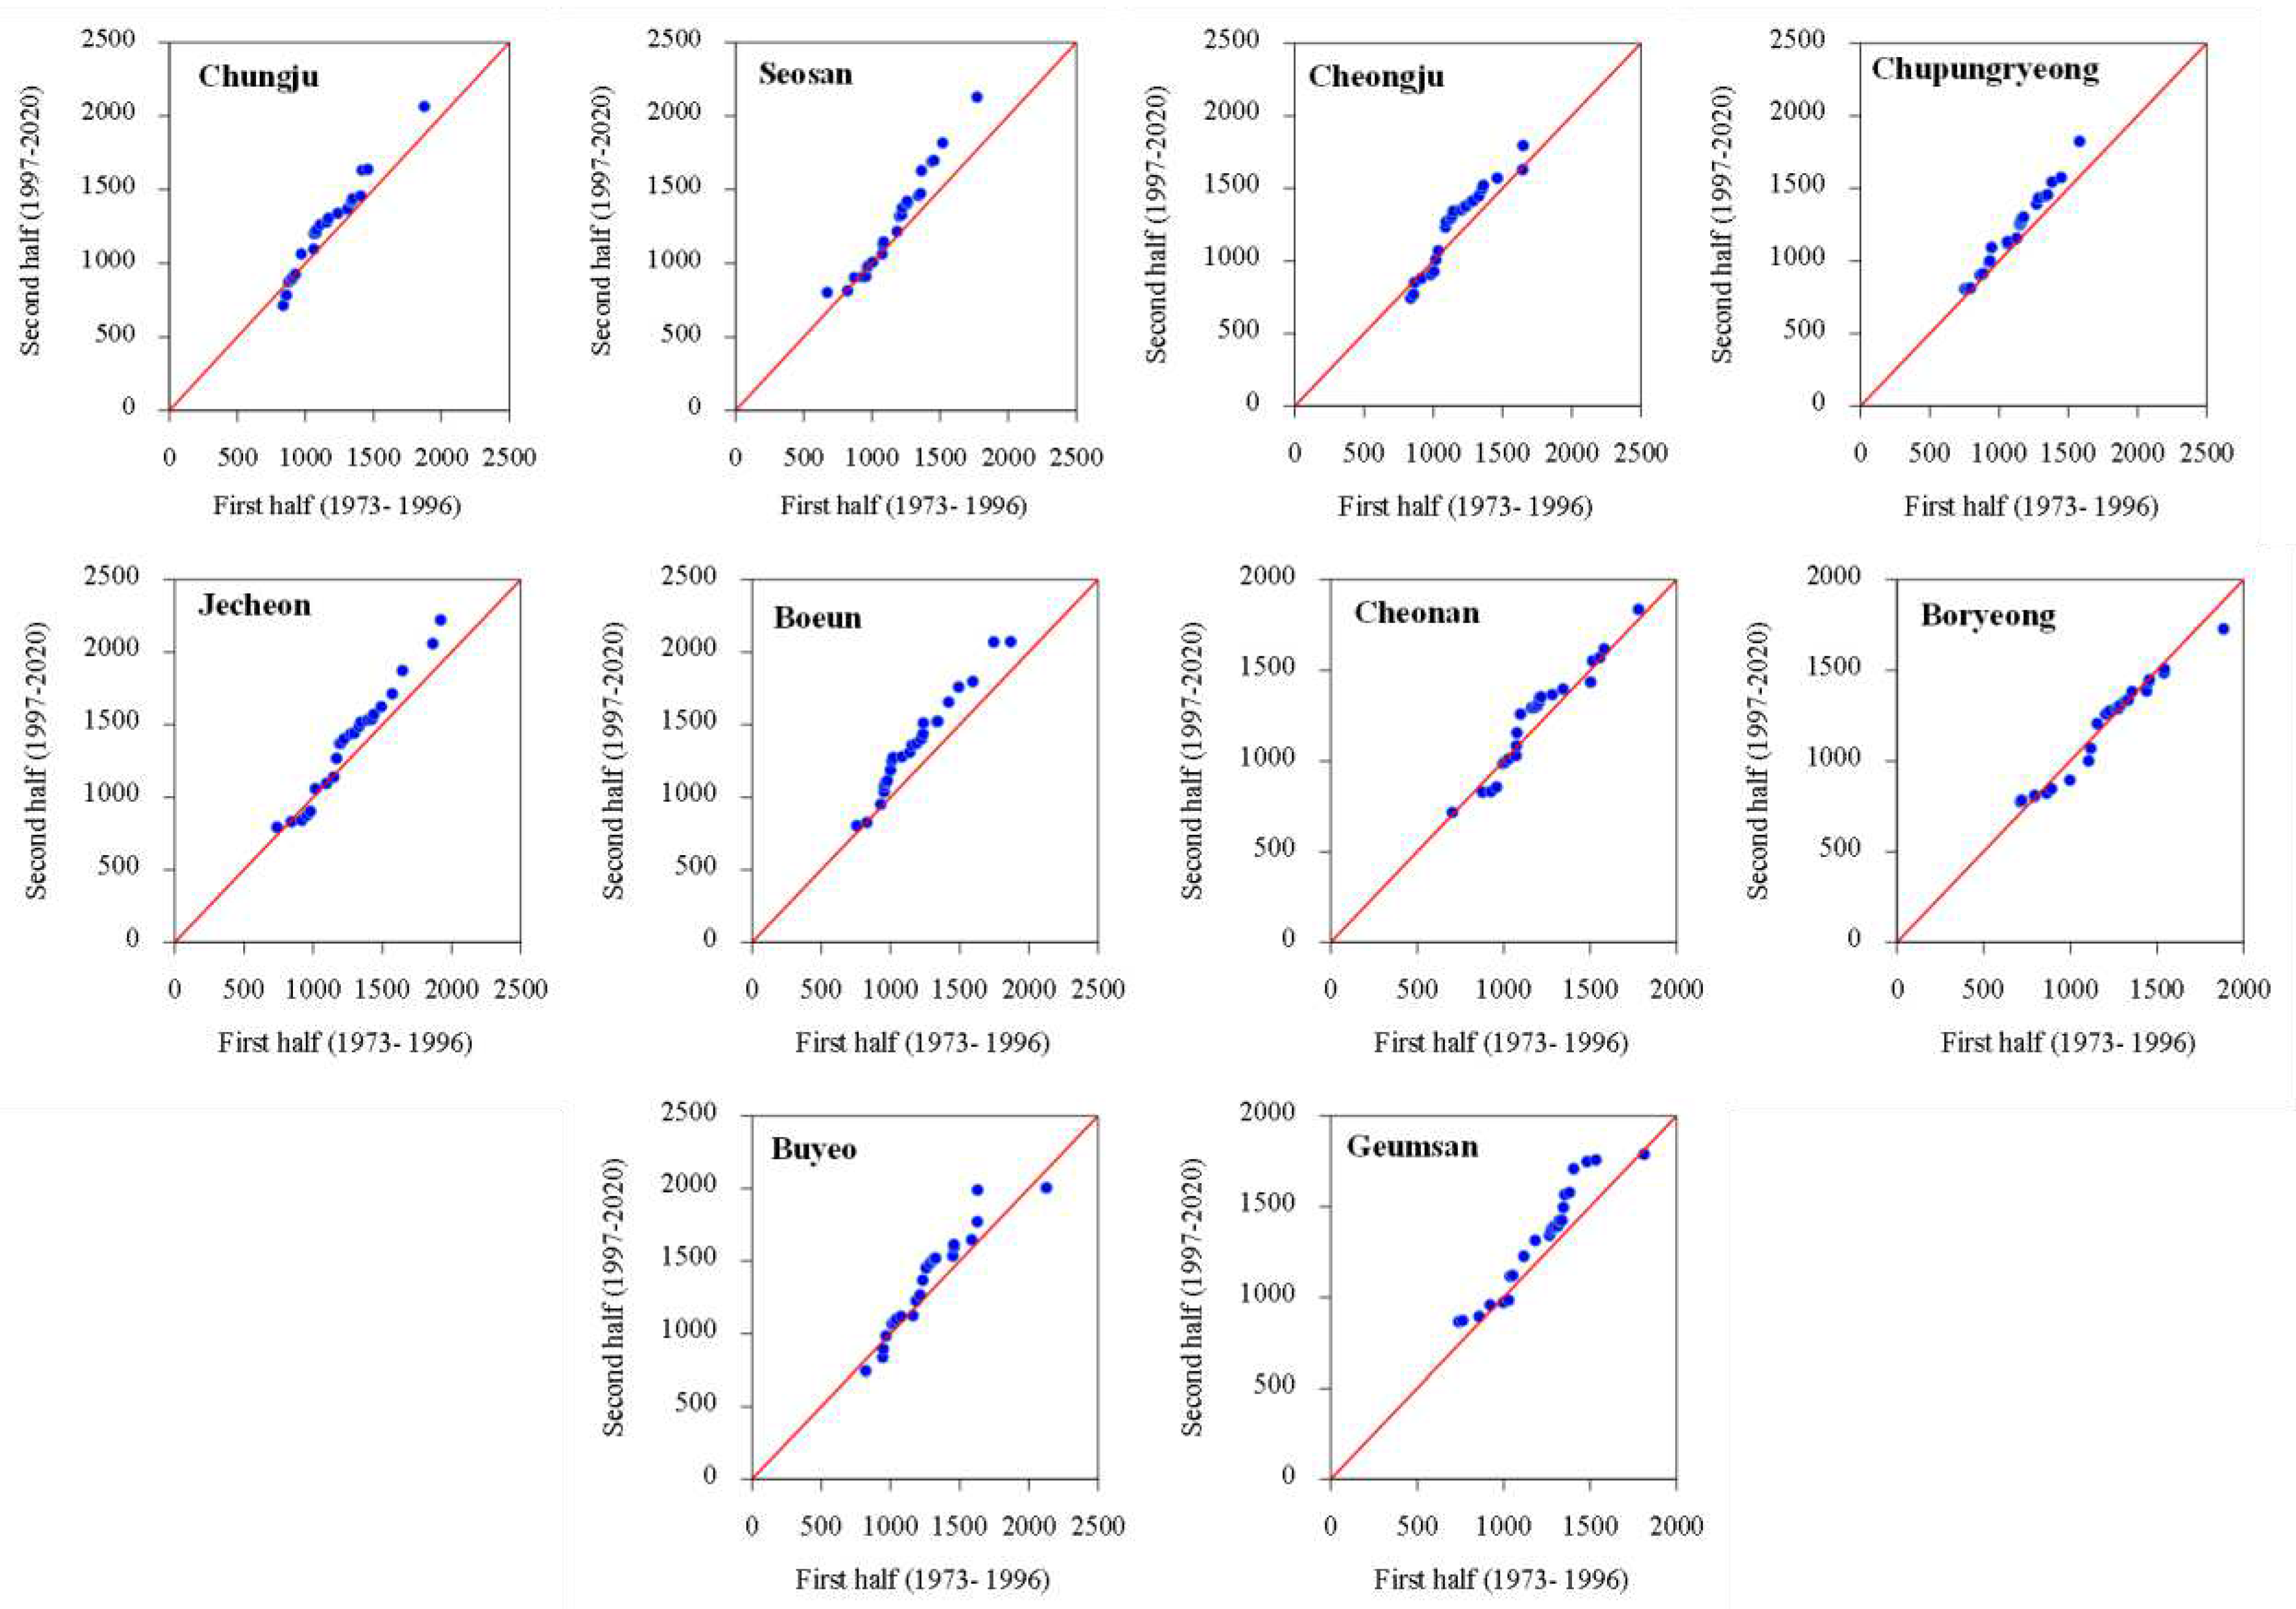
Figure 10.
Innovative trend analysis plots for SDII.
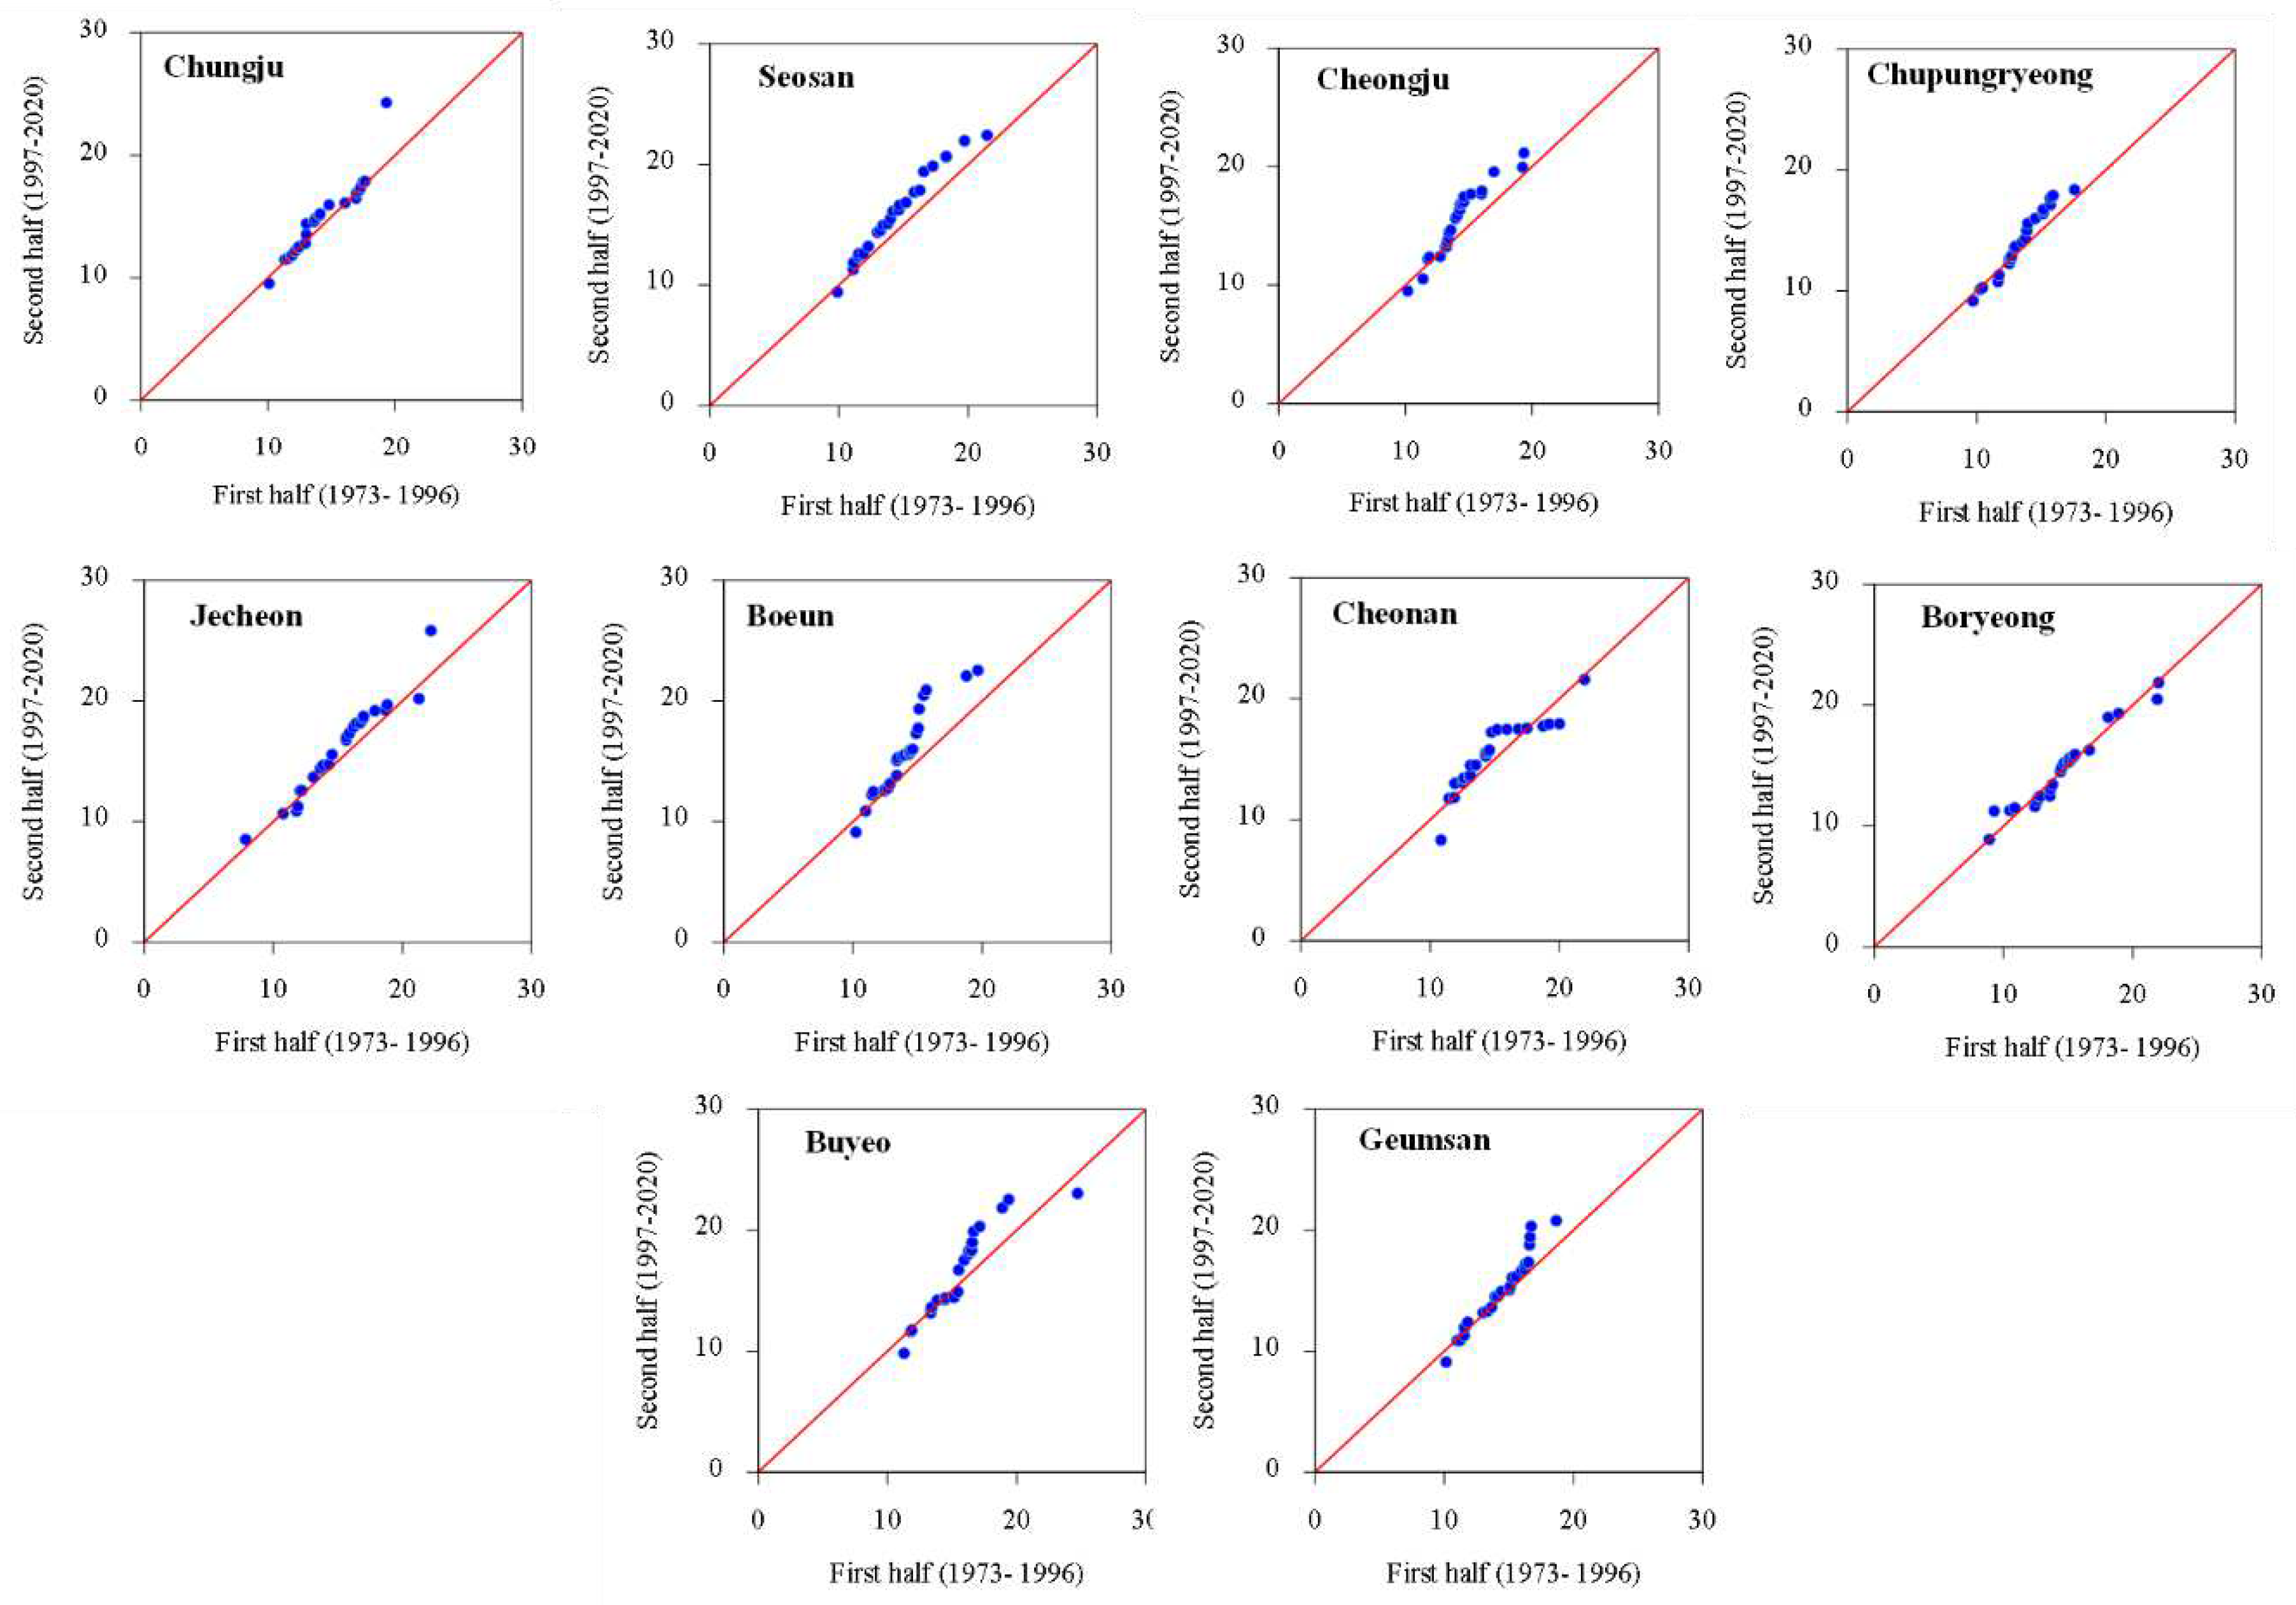
Figure 11.
Innovative trend analysis plots for R95p.
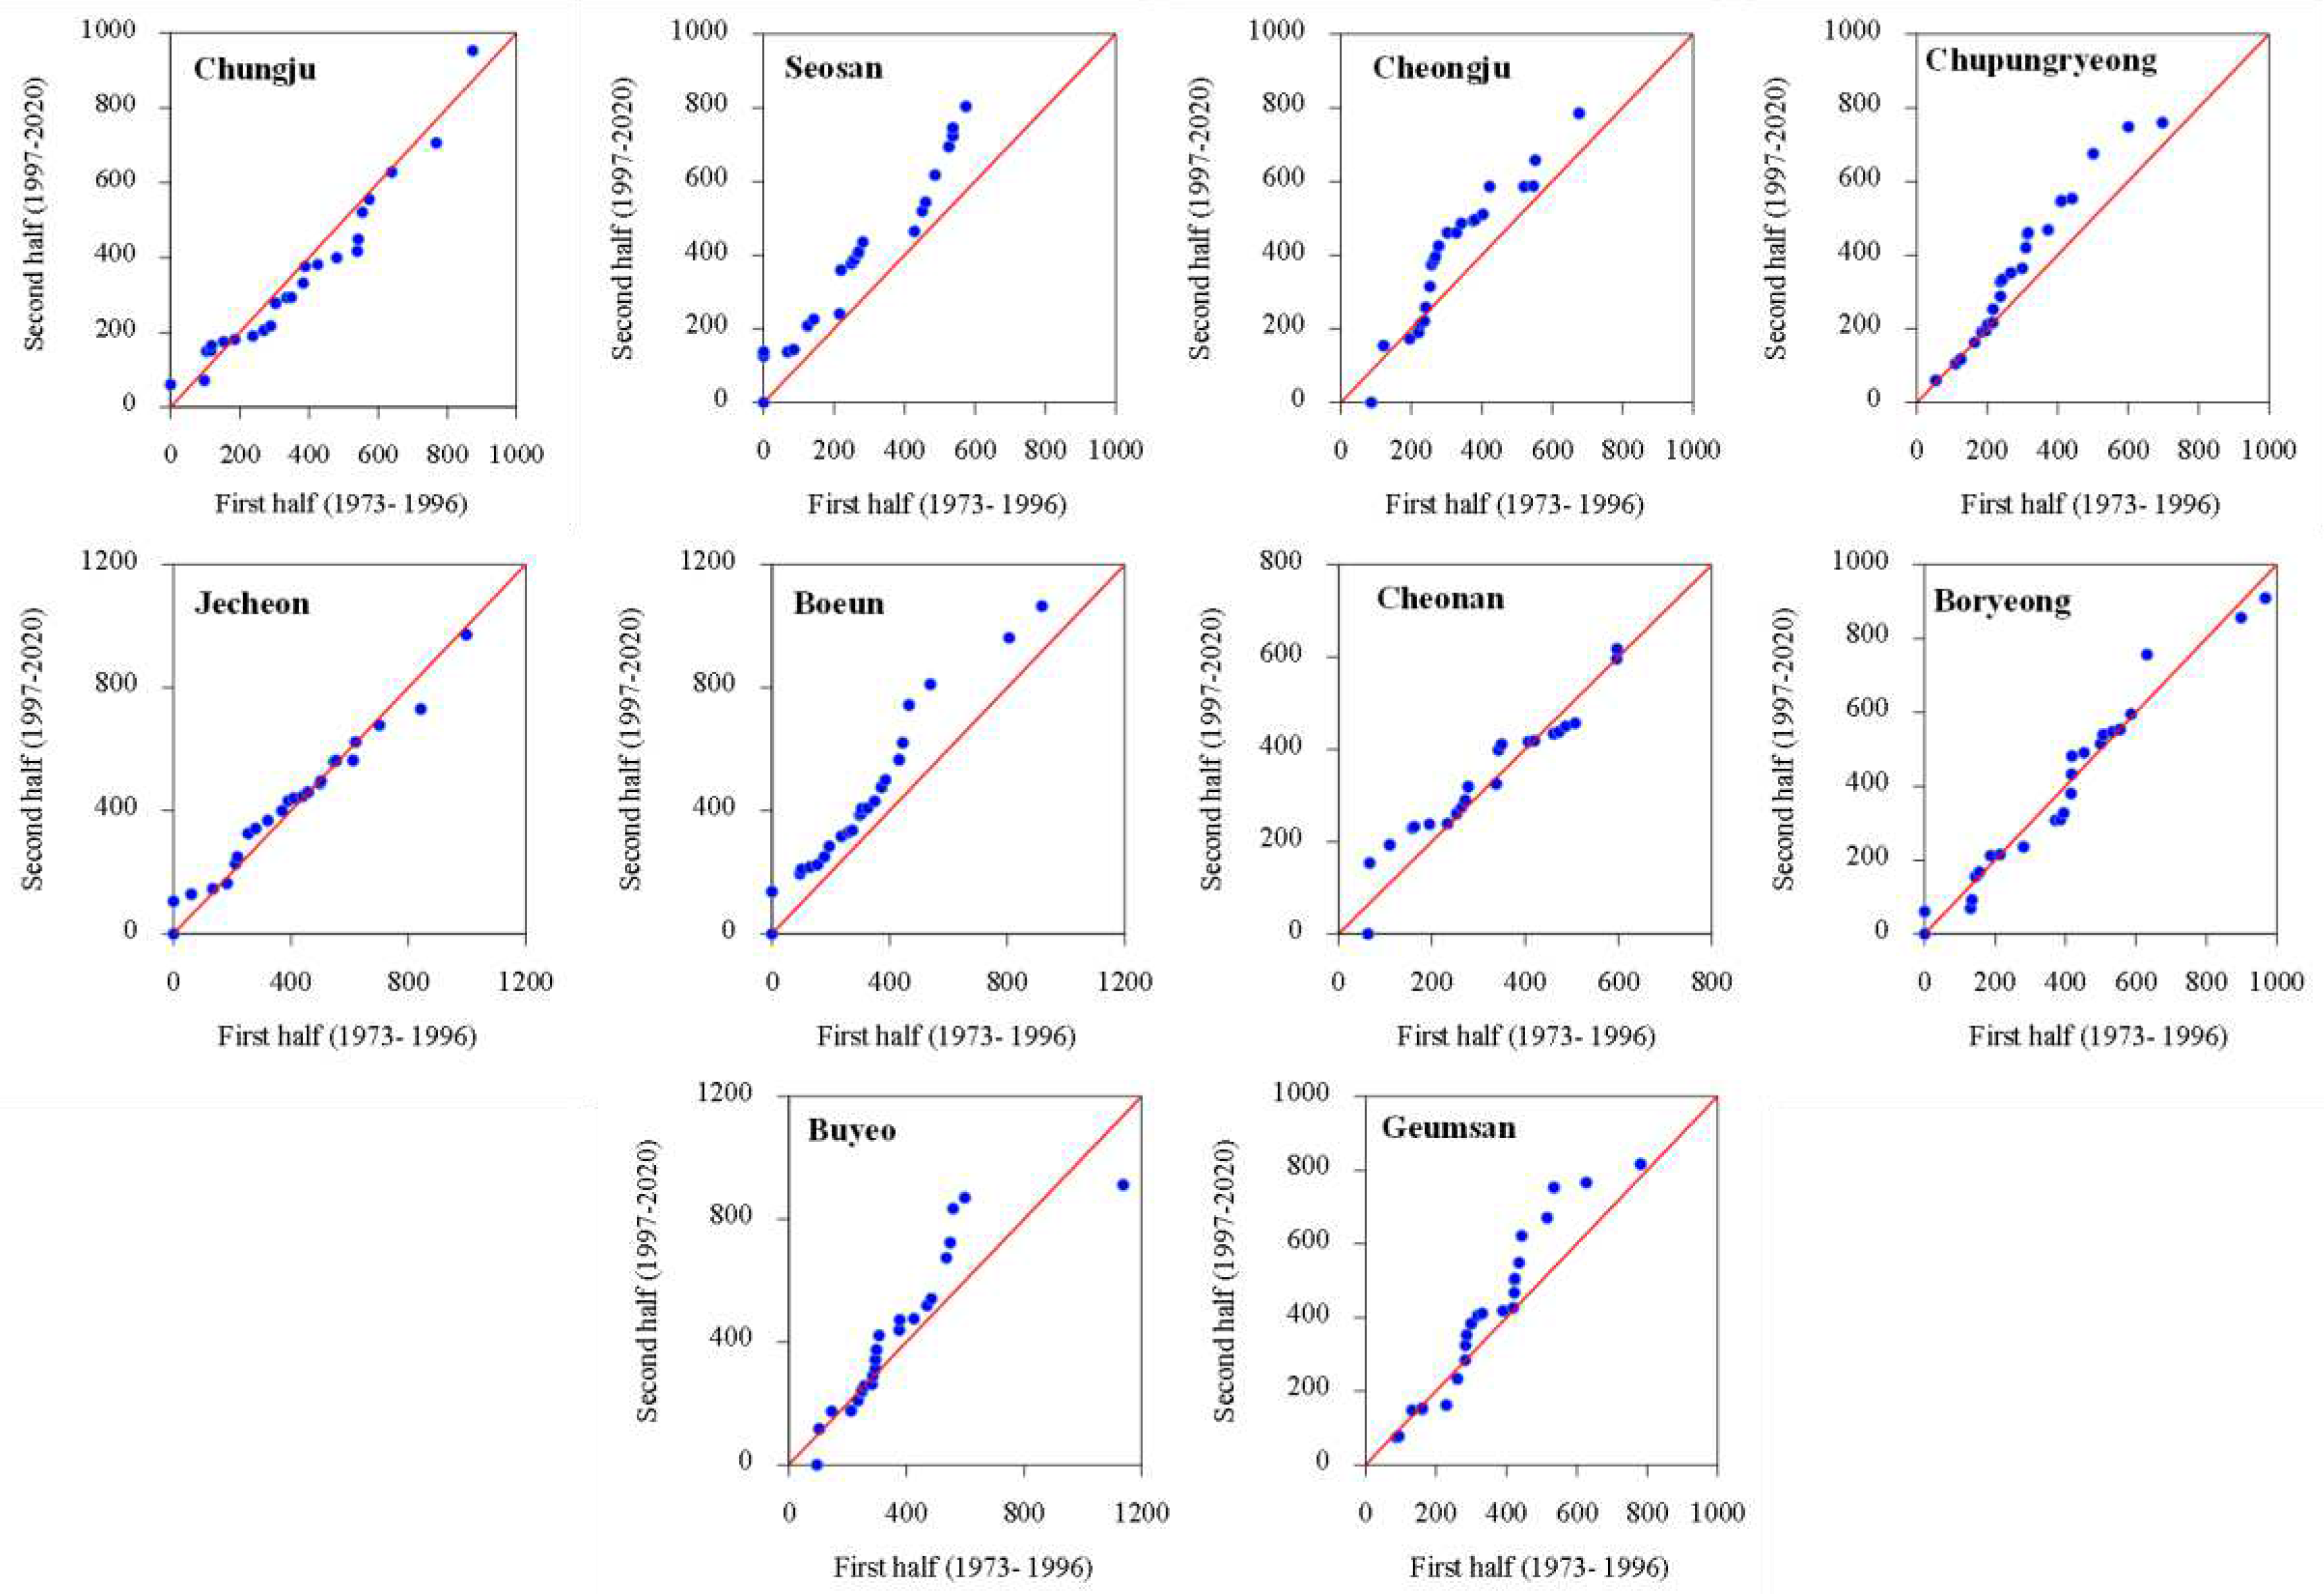
Figure 12.
Innovative trend analysis plots for R99p.
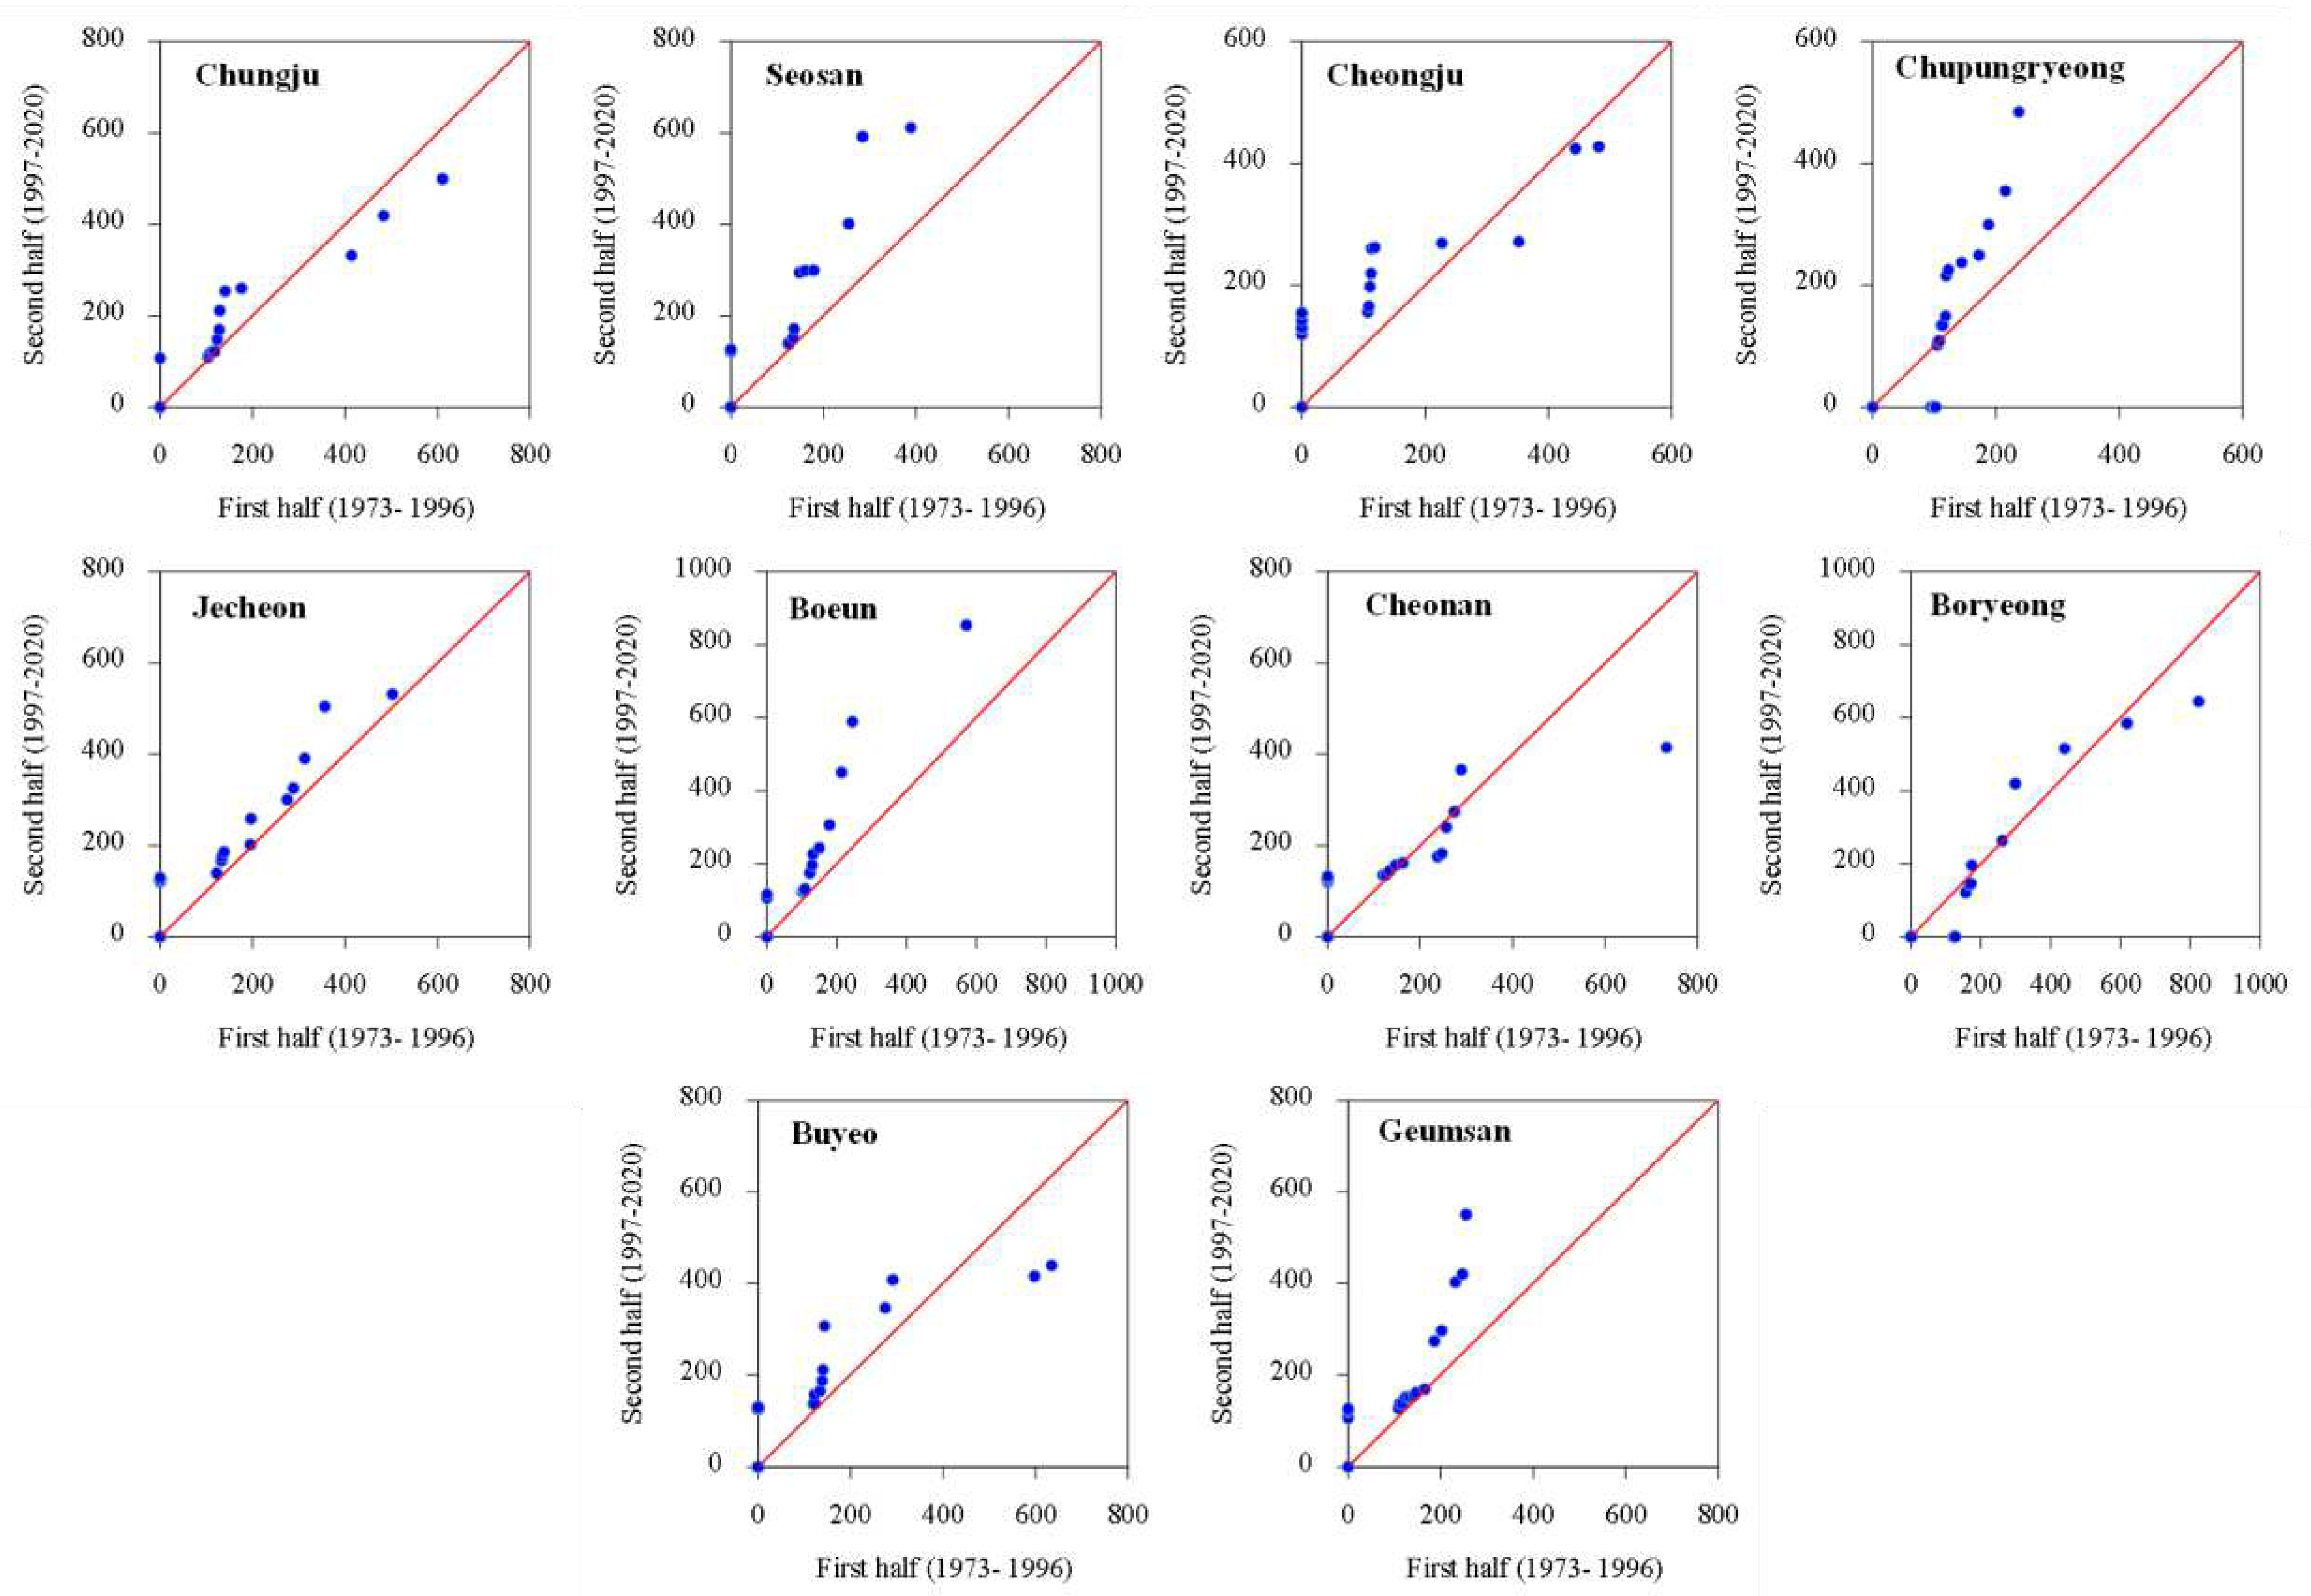
Figure 13.
Innovative trend analysis plots for Rx1day.
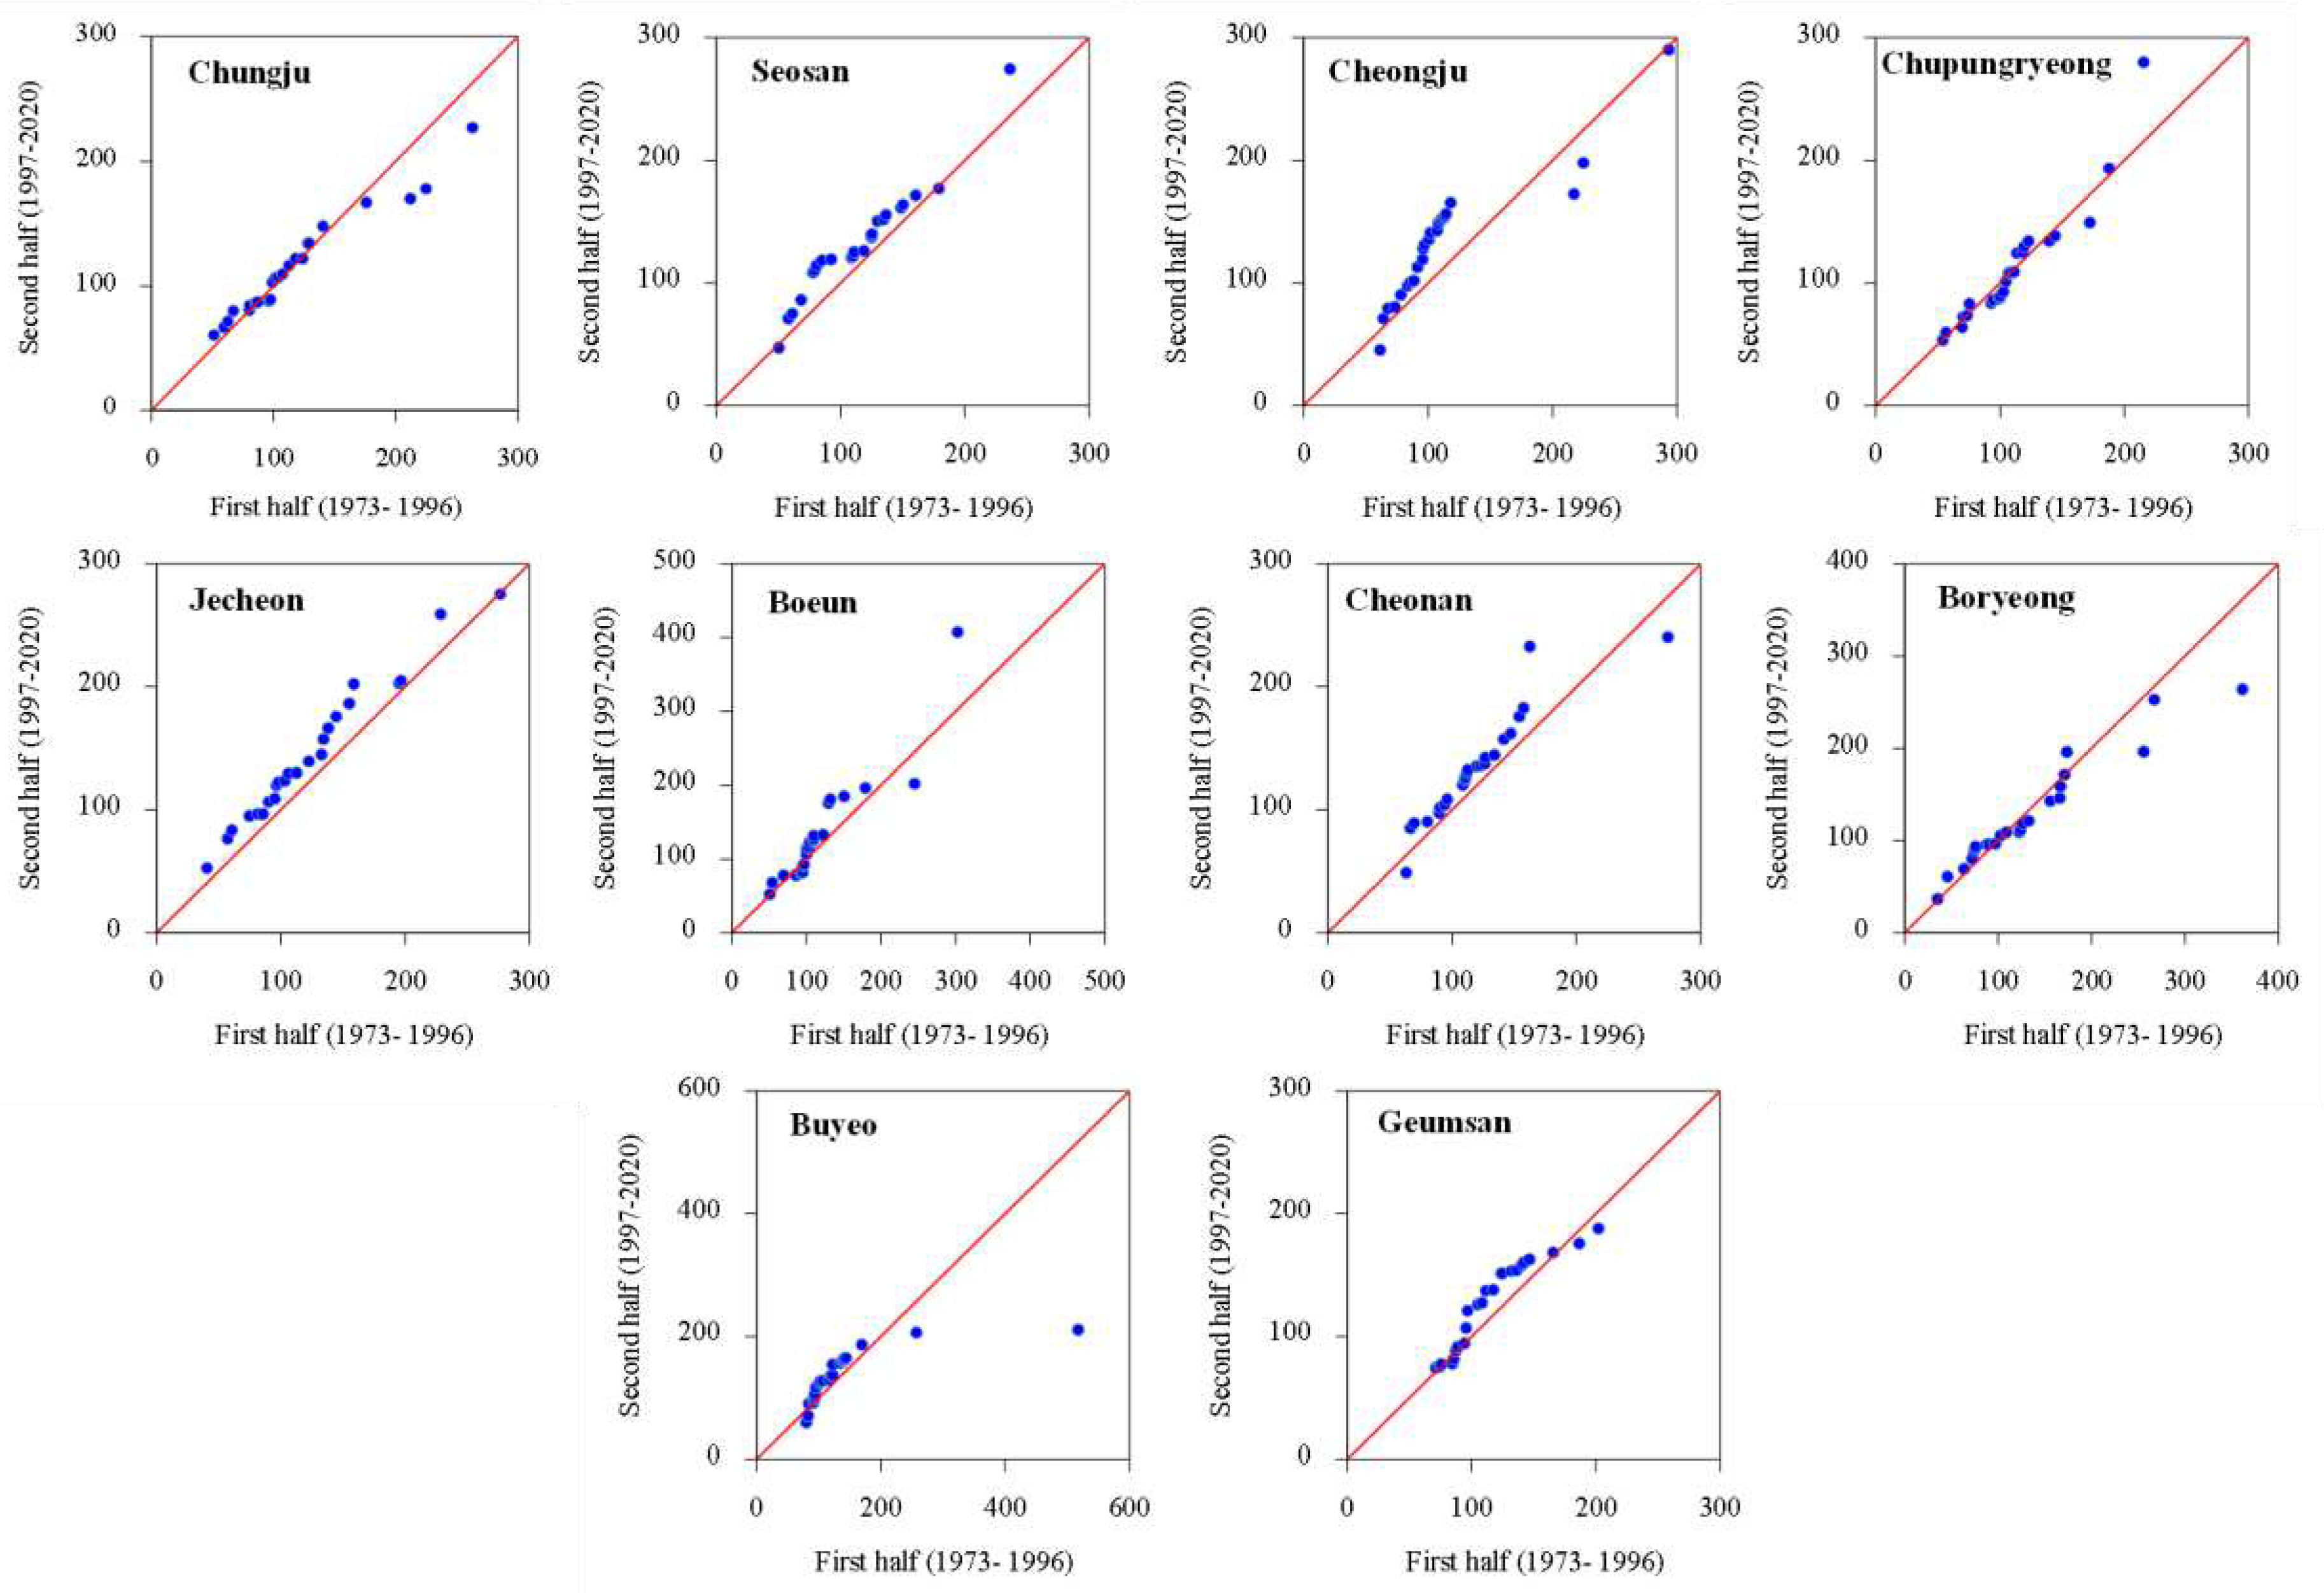
Figure 14.
Innovative trend analysis plots for R3day.
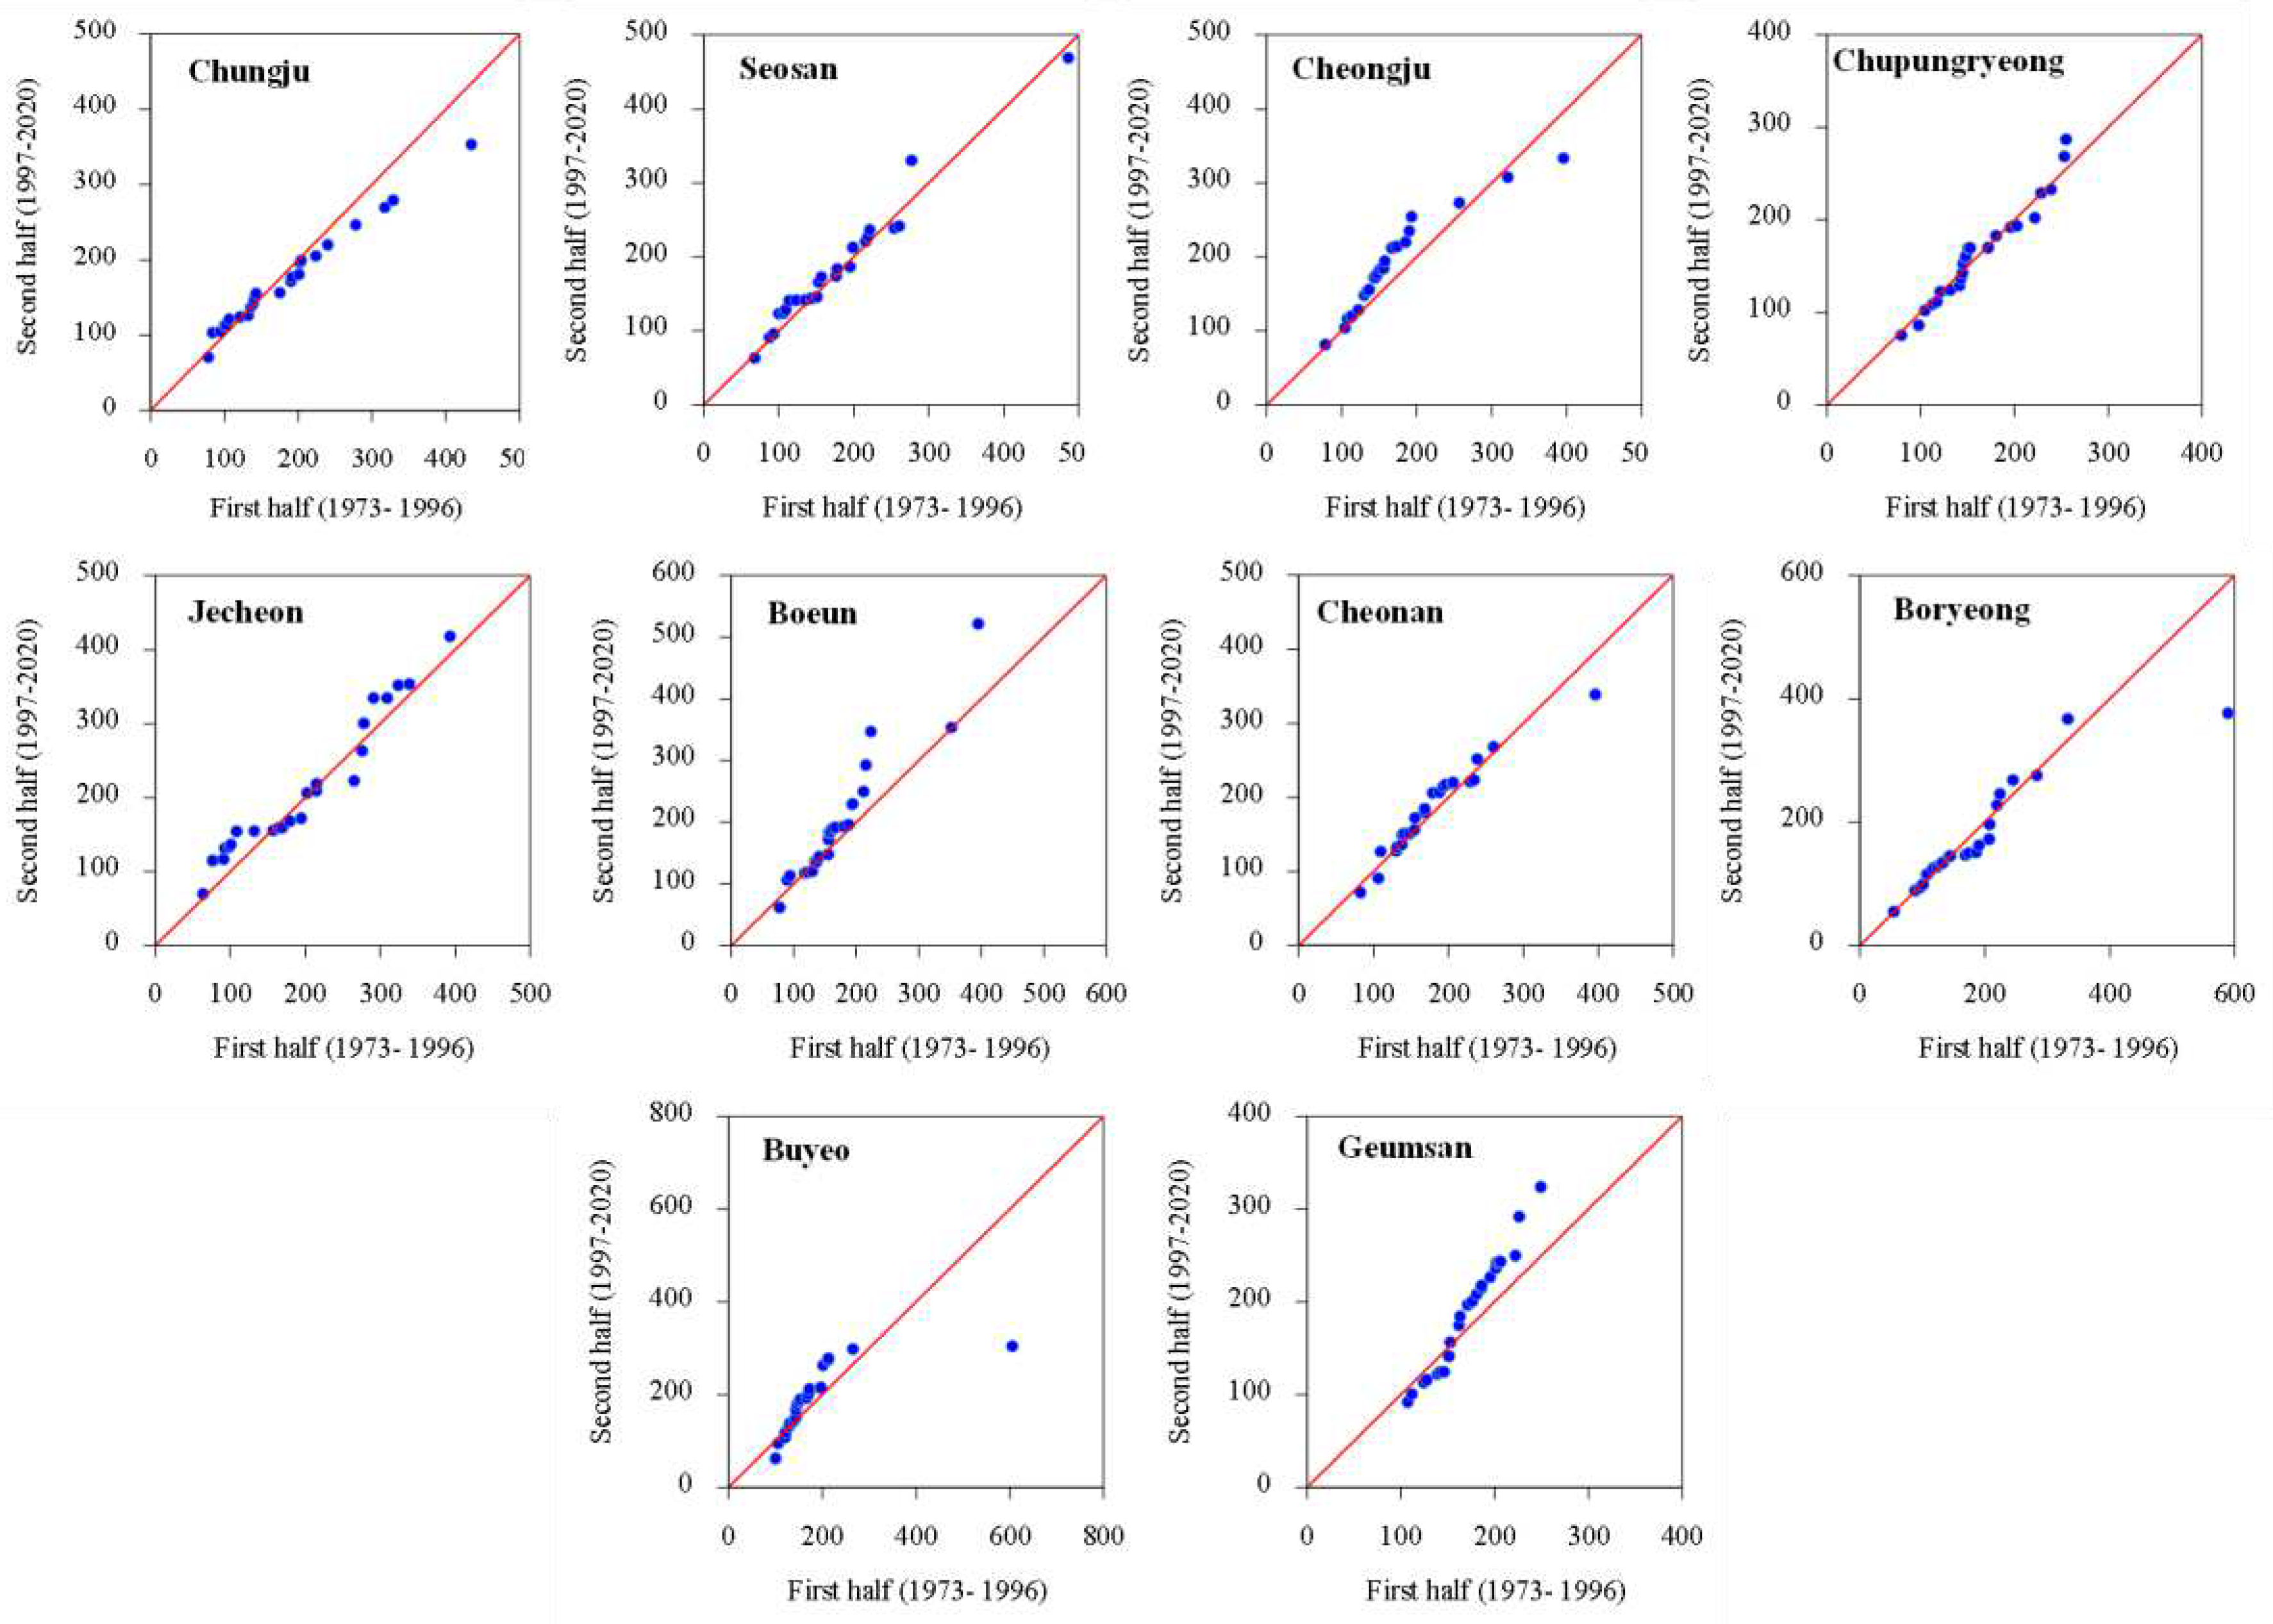
Figure 15.
Innovative trend analysis plots for Rx5day.
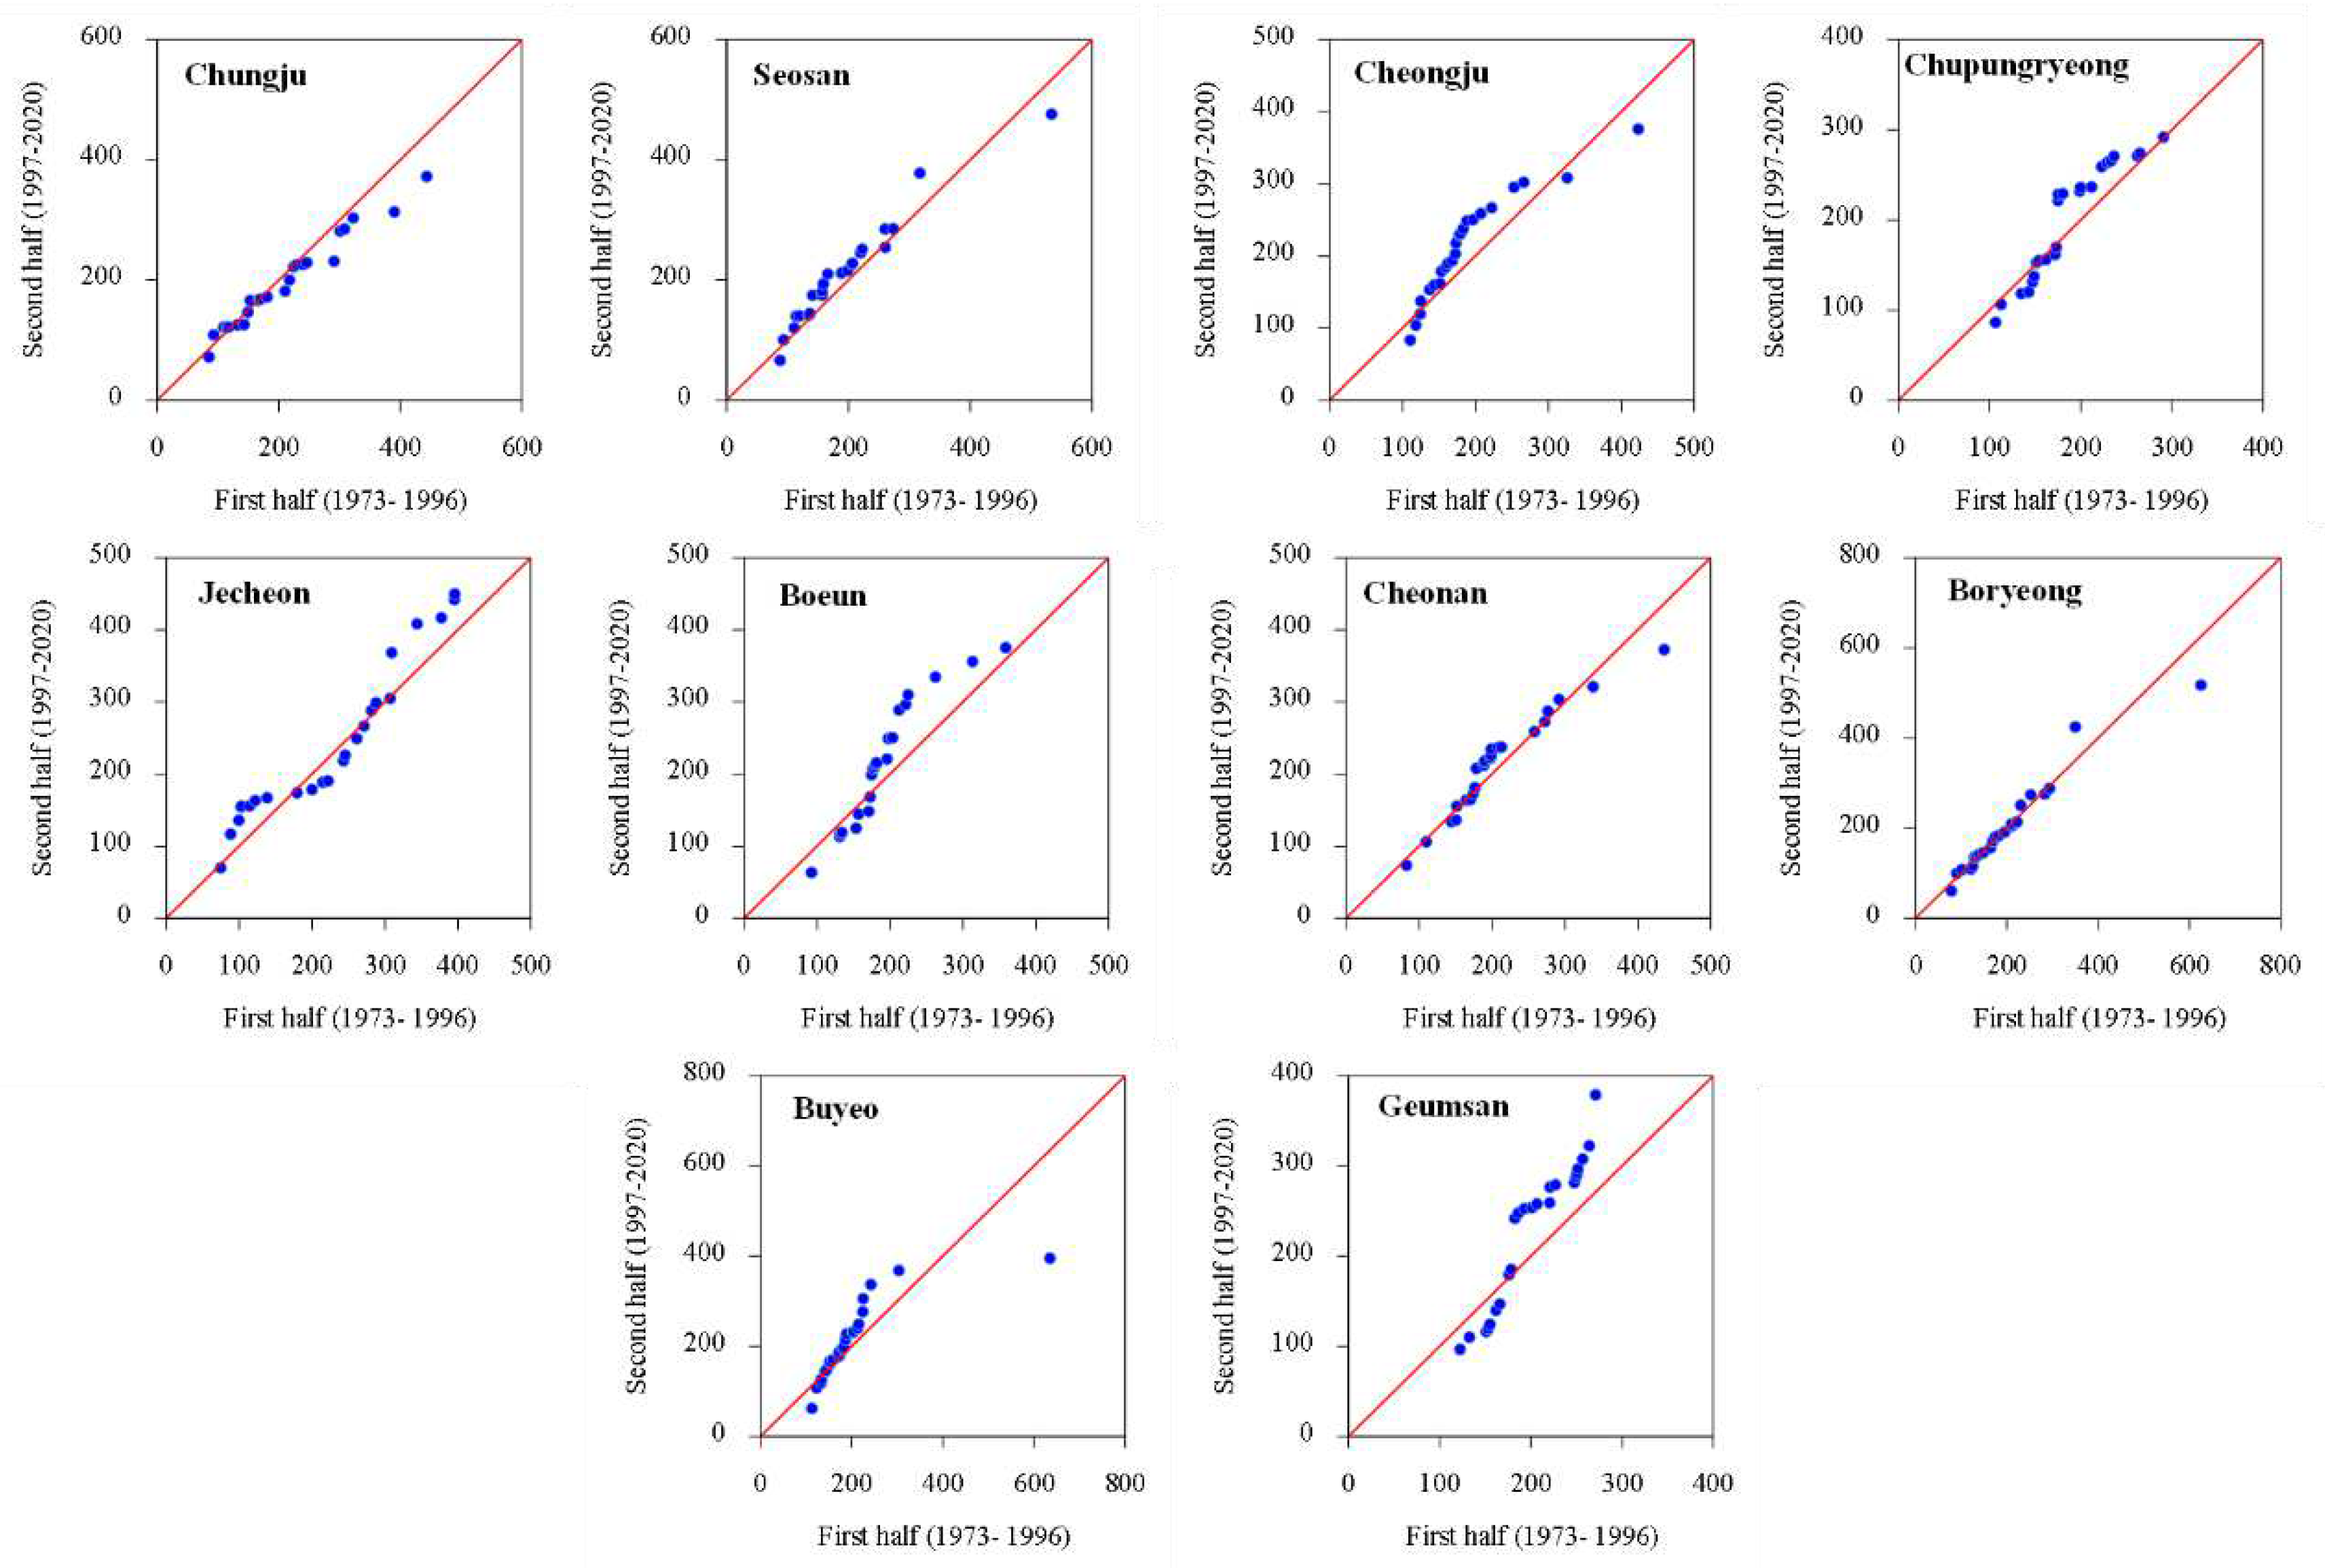
Figure 16.
Spatial distribution and trends in climate indices over the period 1973-2020 based on the ITA.
Figure 16.
Spatial distribution and trends in climate indices over the period 1973-2020 based on the ITA.
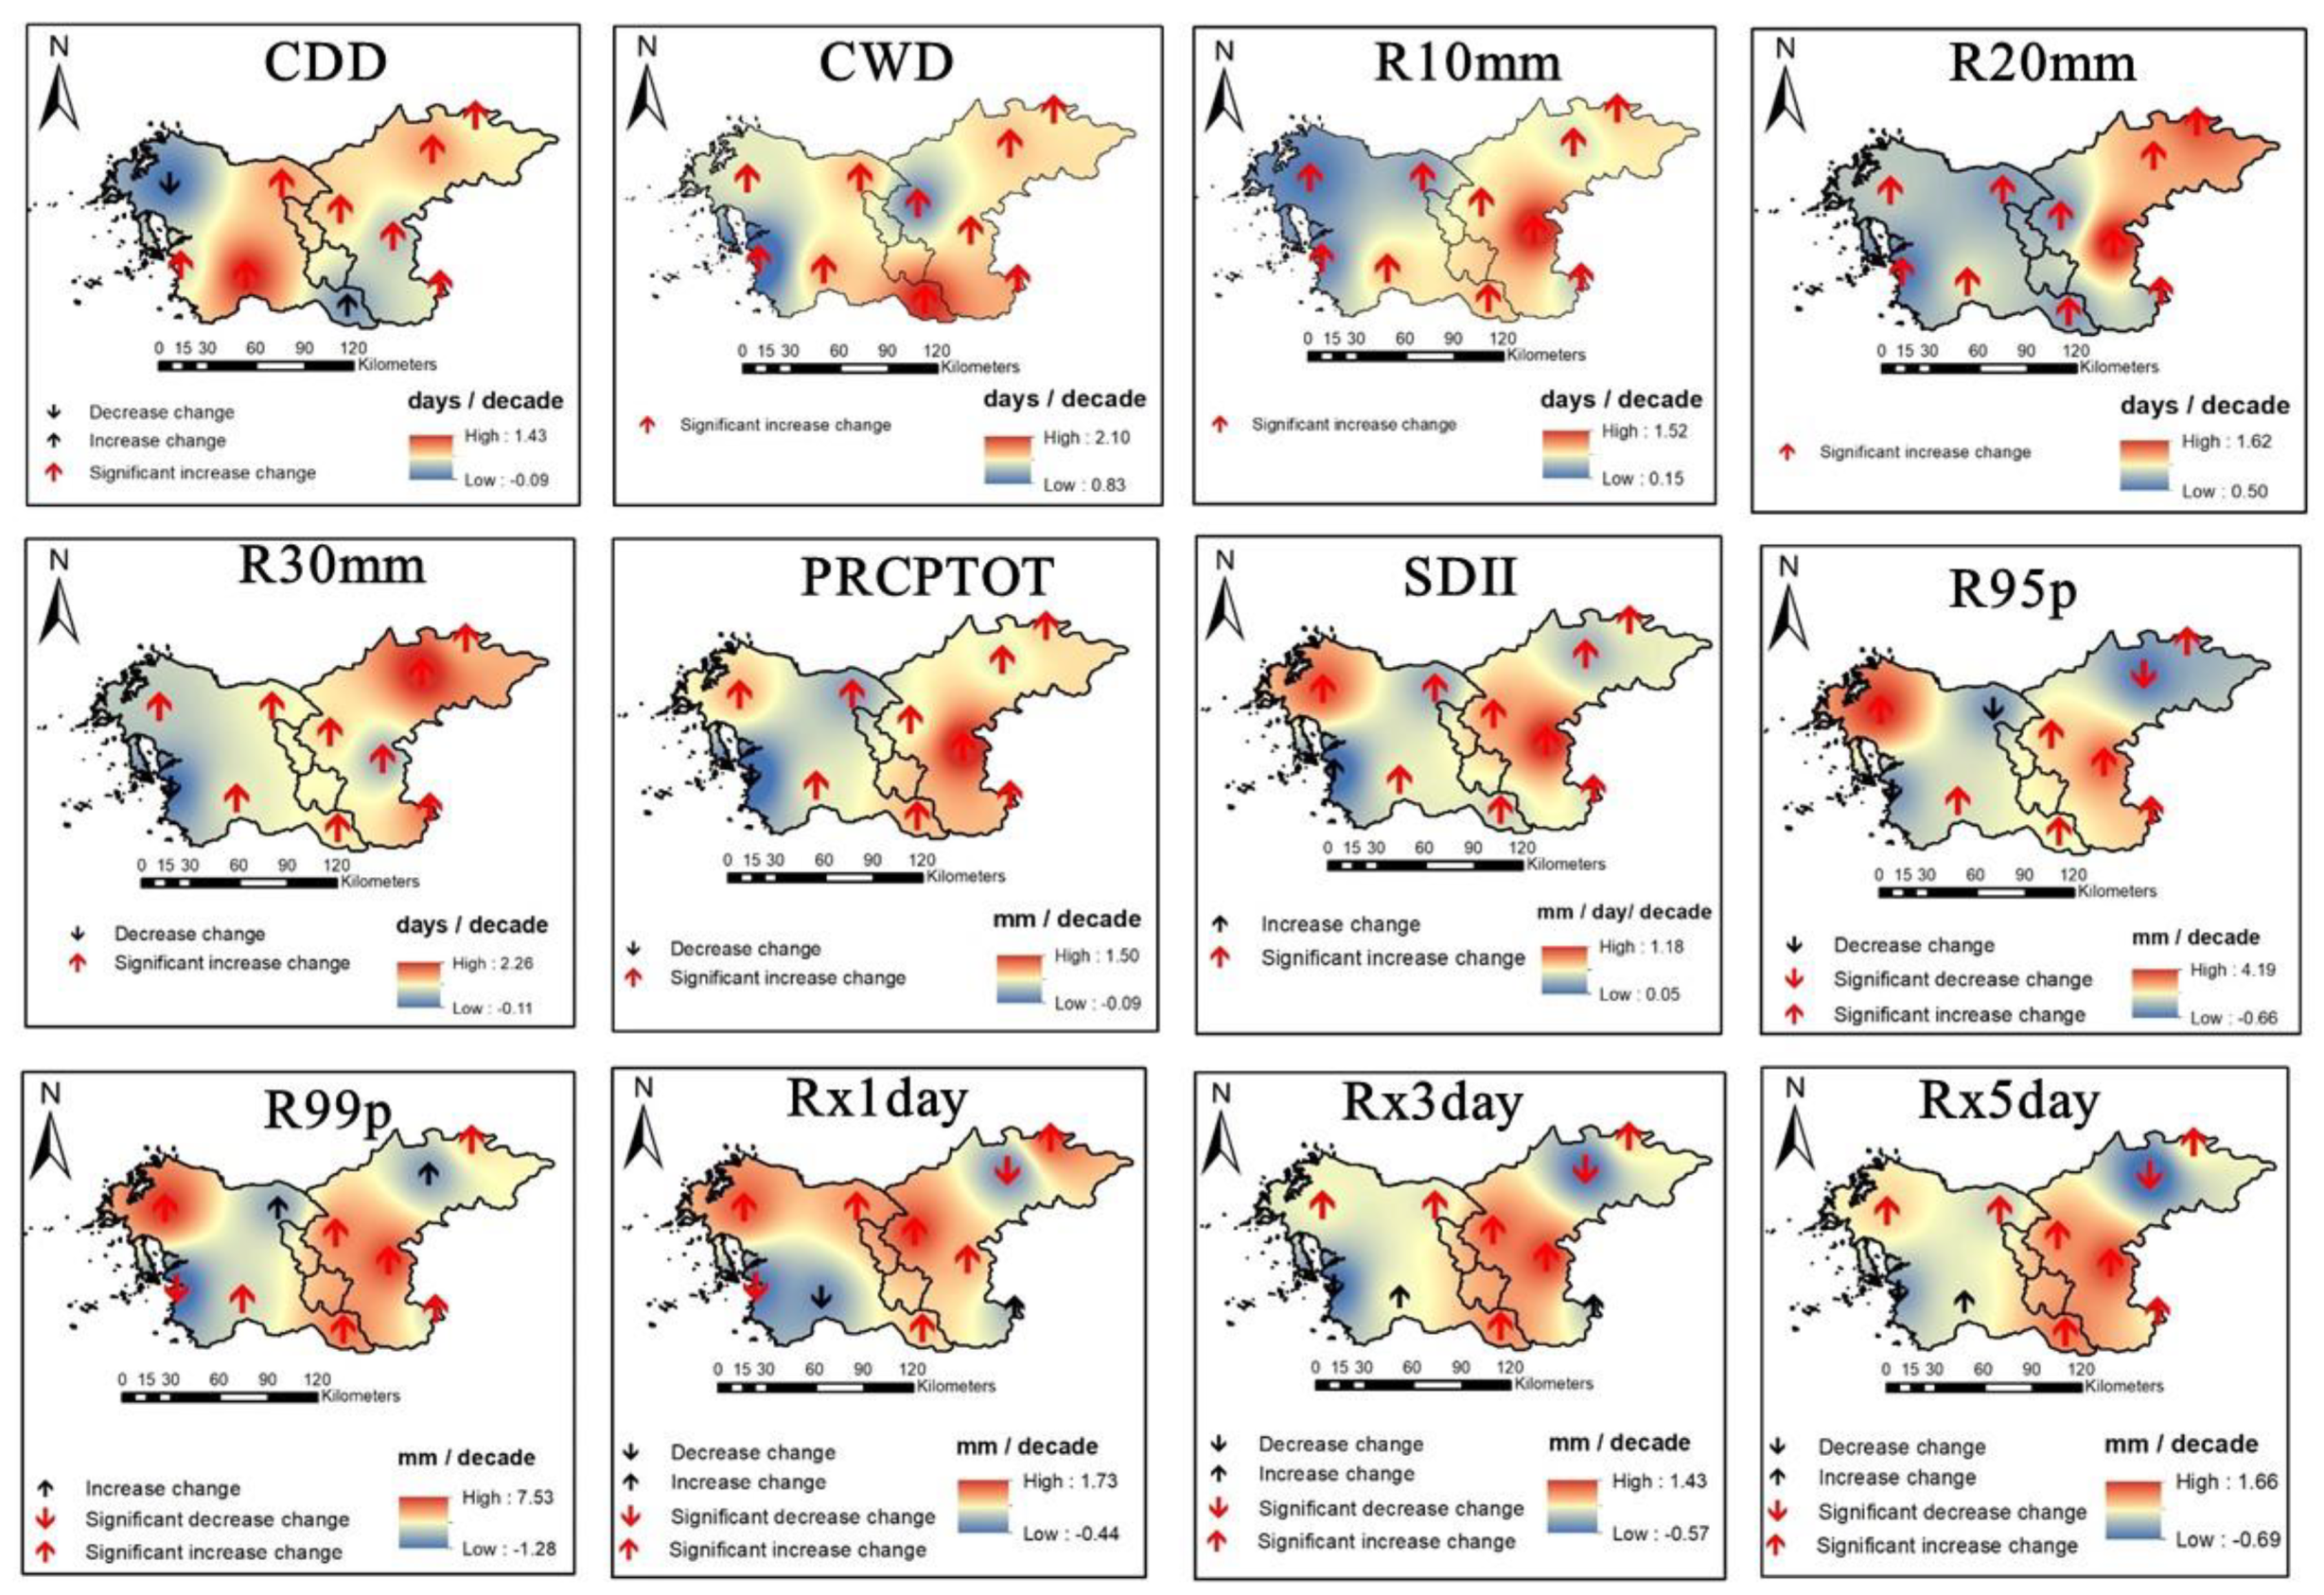
Figure 17.
Spatial distribution and trends in climate indices over the period 1973-2020 based on the MK.
Figure 17.
Spatial distribution and trends in climate indices over the period 1973-2020 based on the MK.
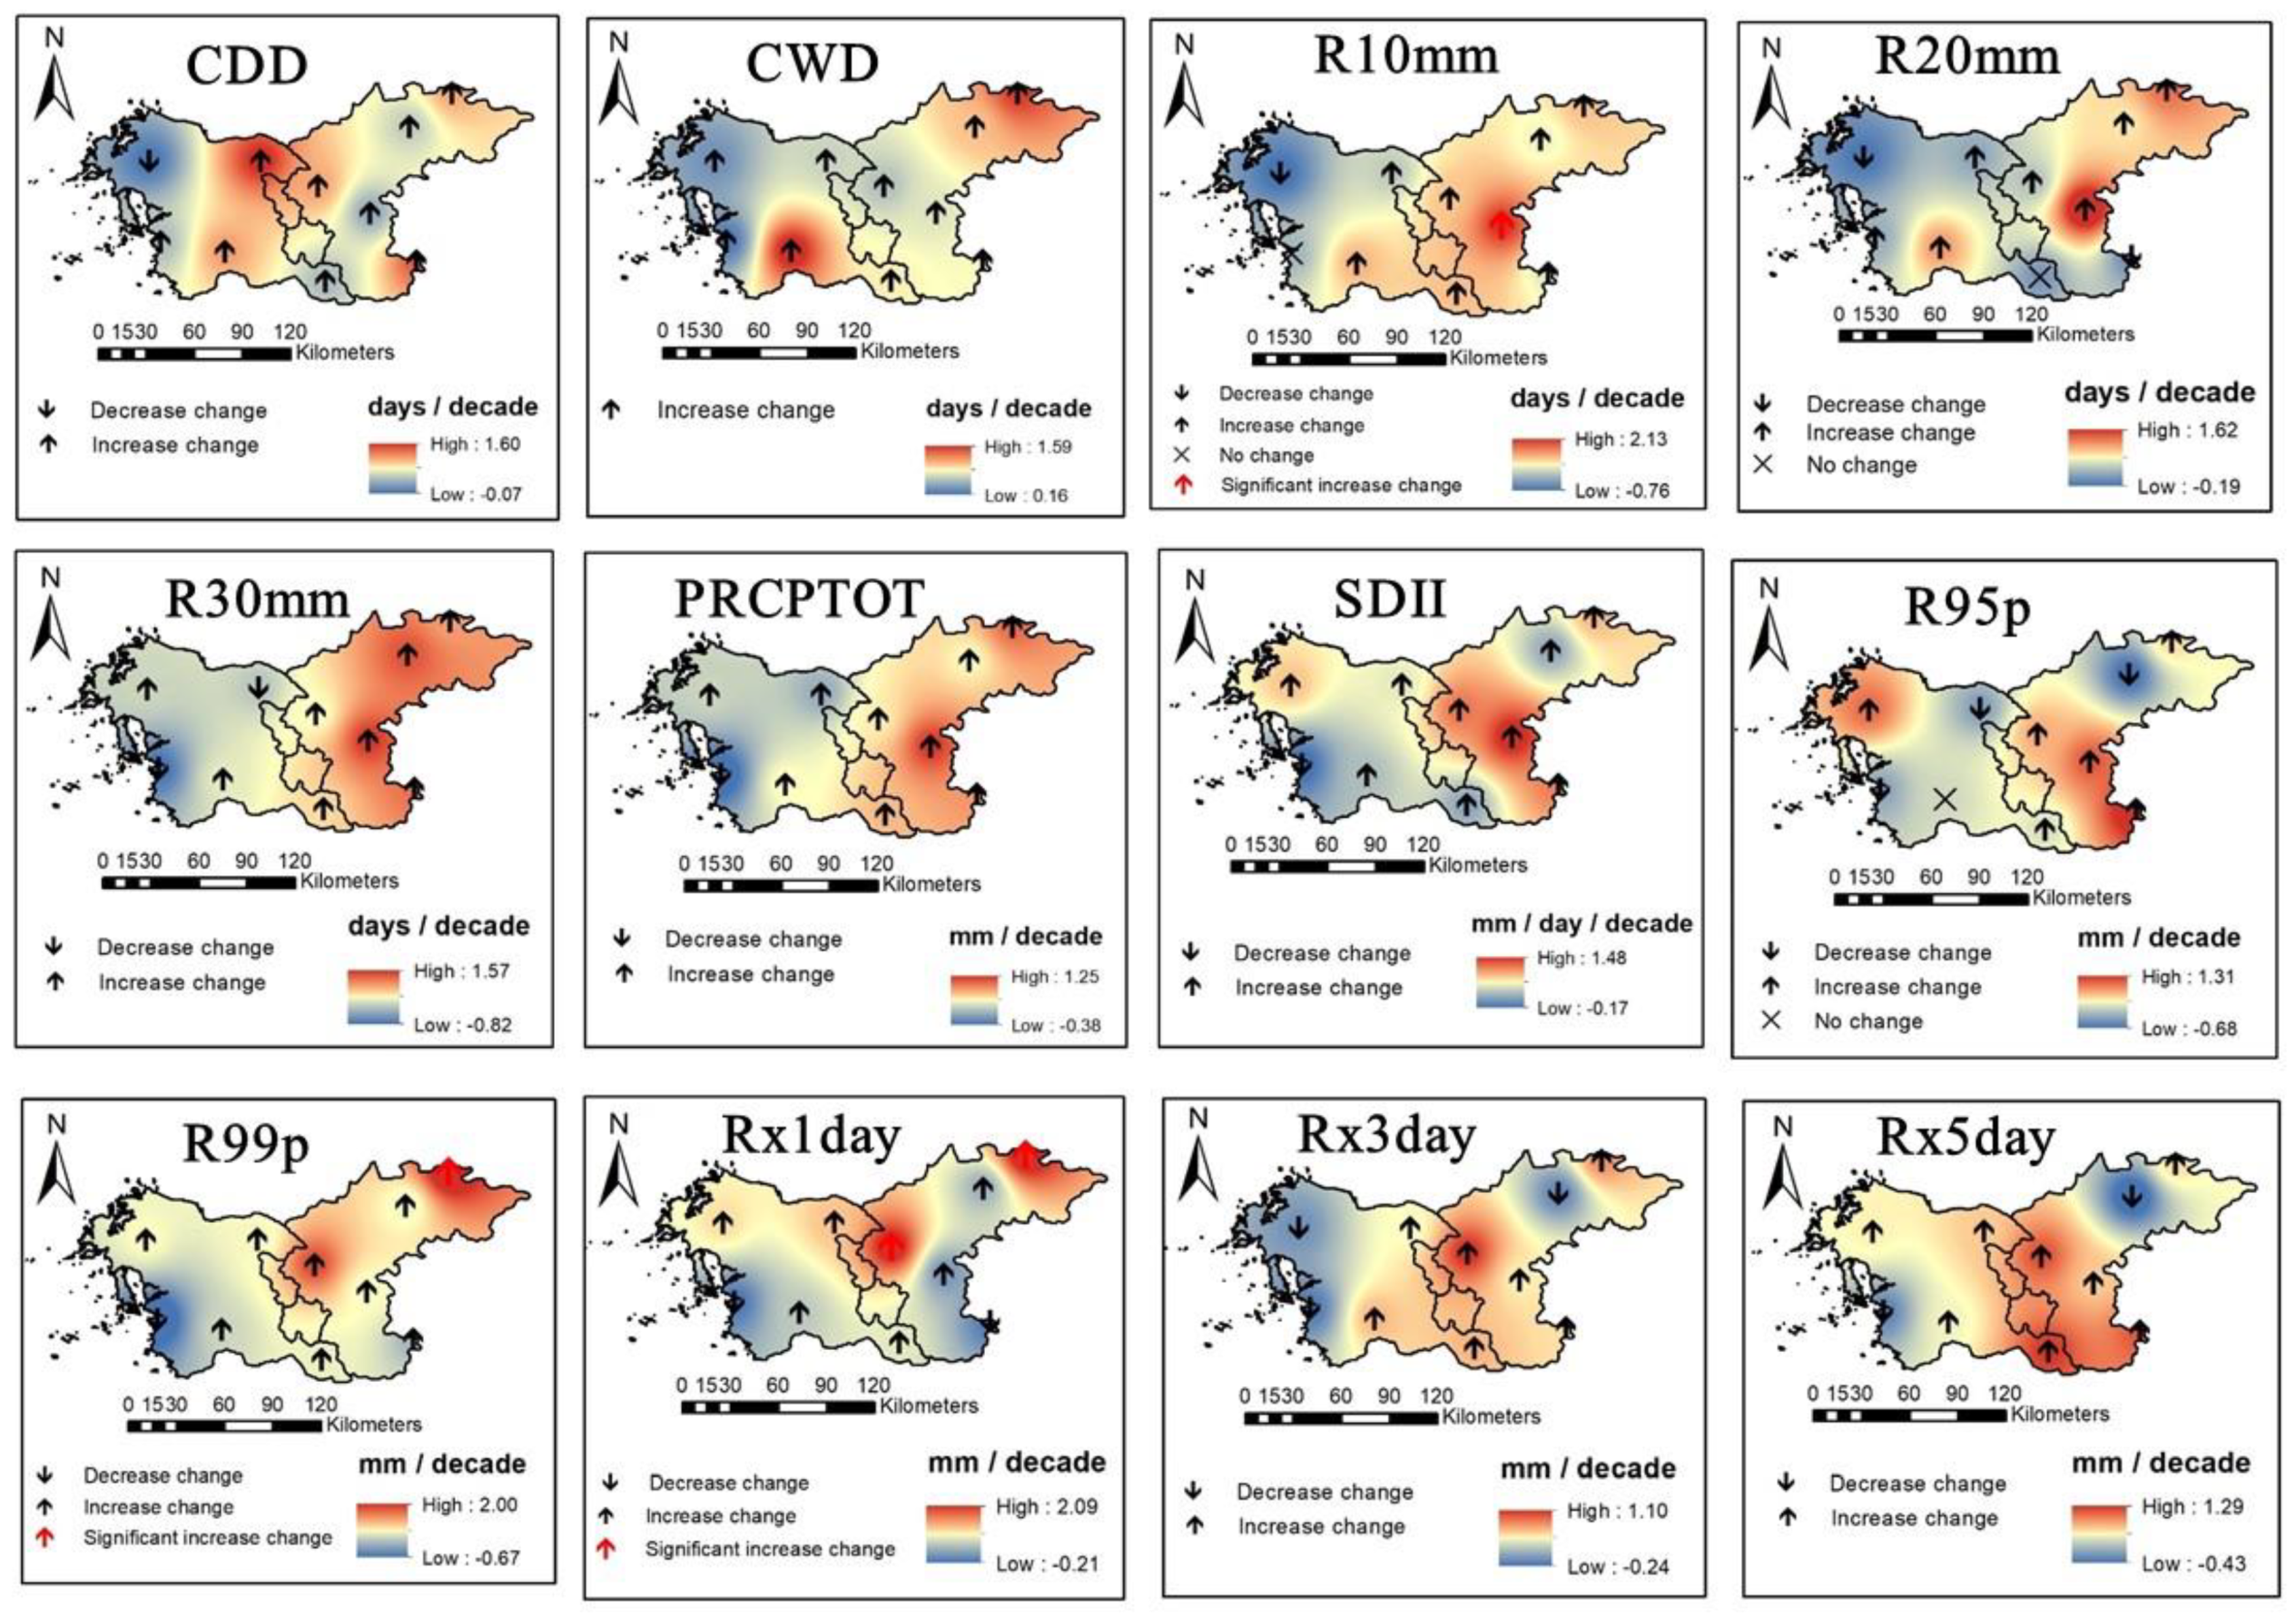
Figure 18.
Spatial distribution and trends in climate indices over the period 1973-2020 based on the Spearman’s Rho.
Figure 18.
Spatial distribution and trends in climate indices over the period 1973-2020 based on the Spearman’s Rho.
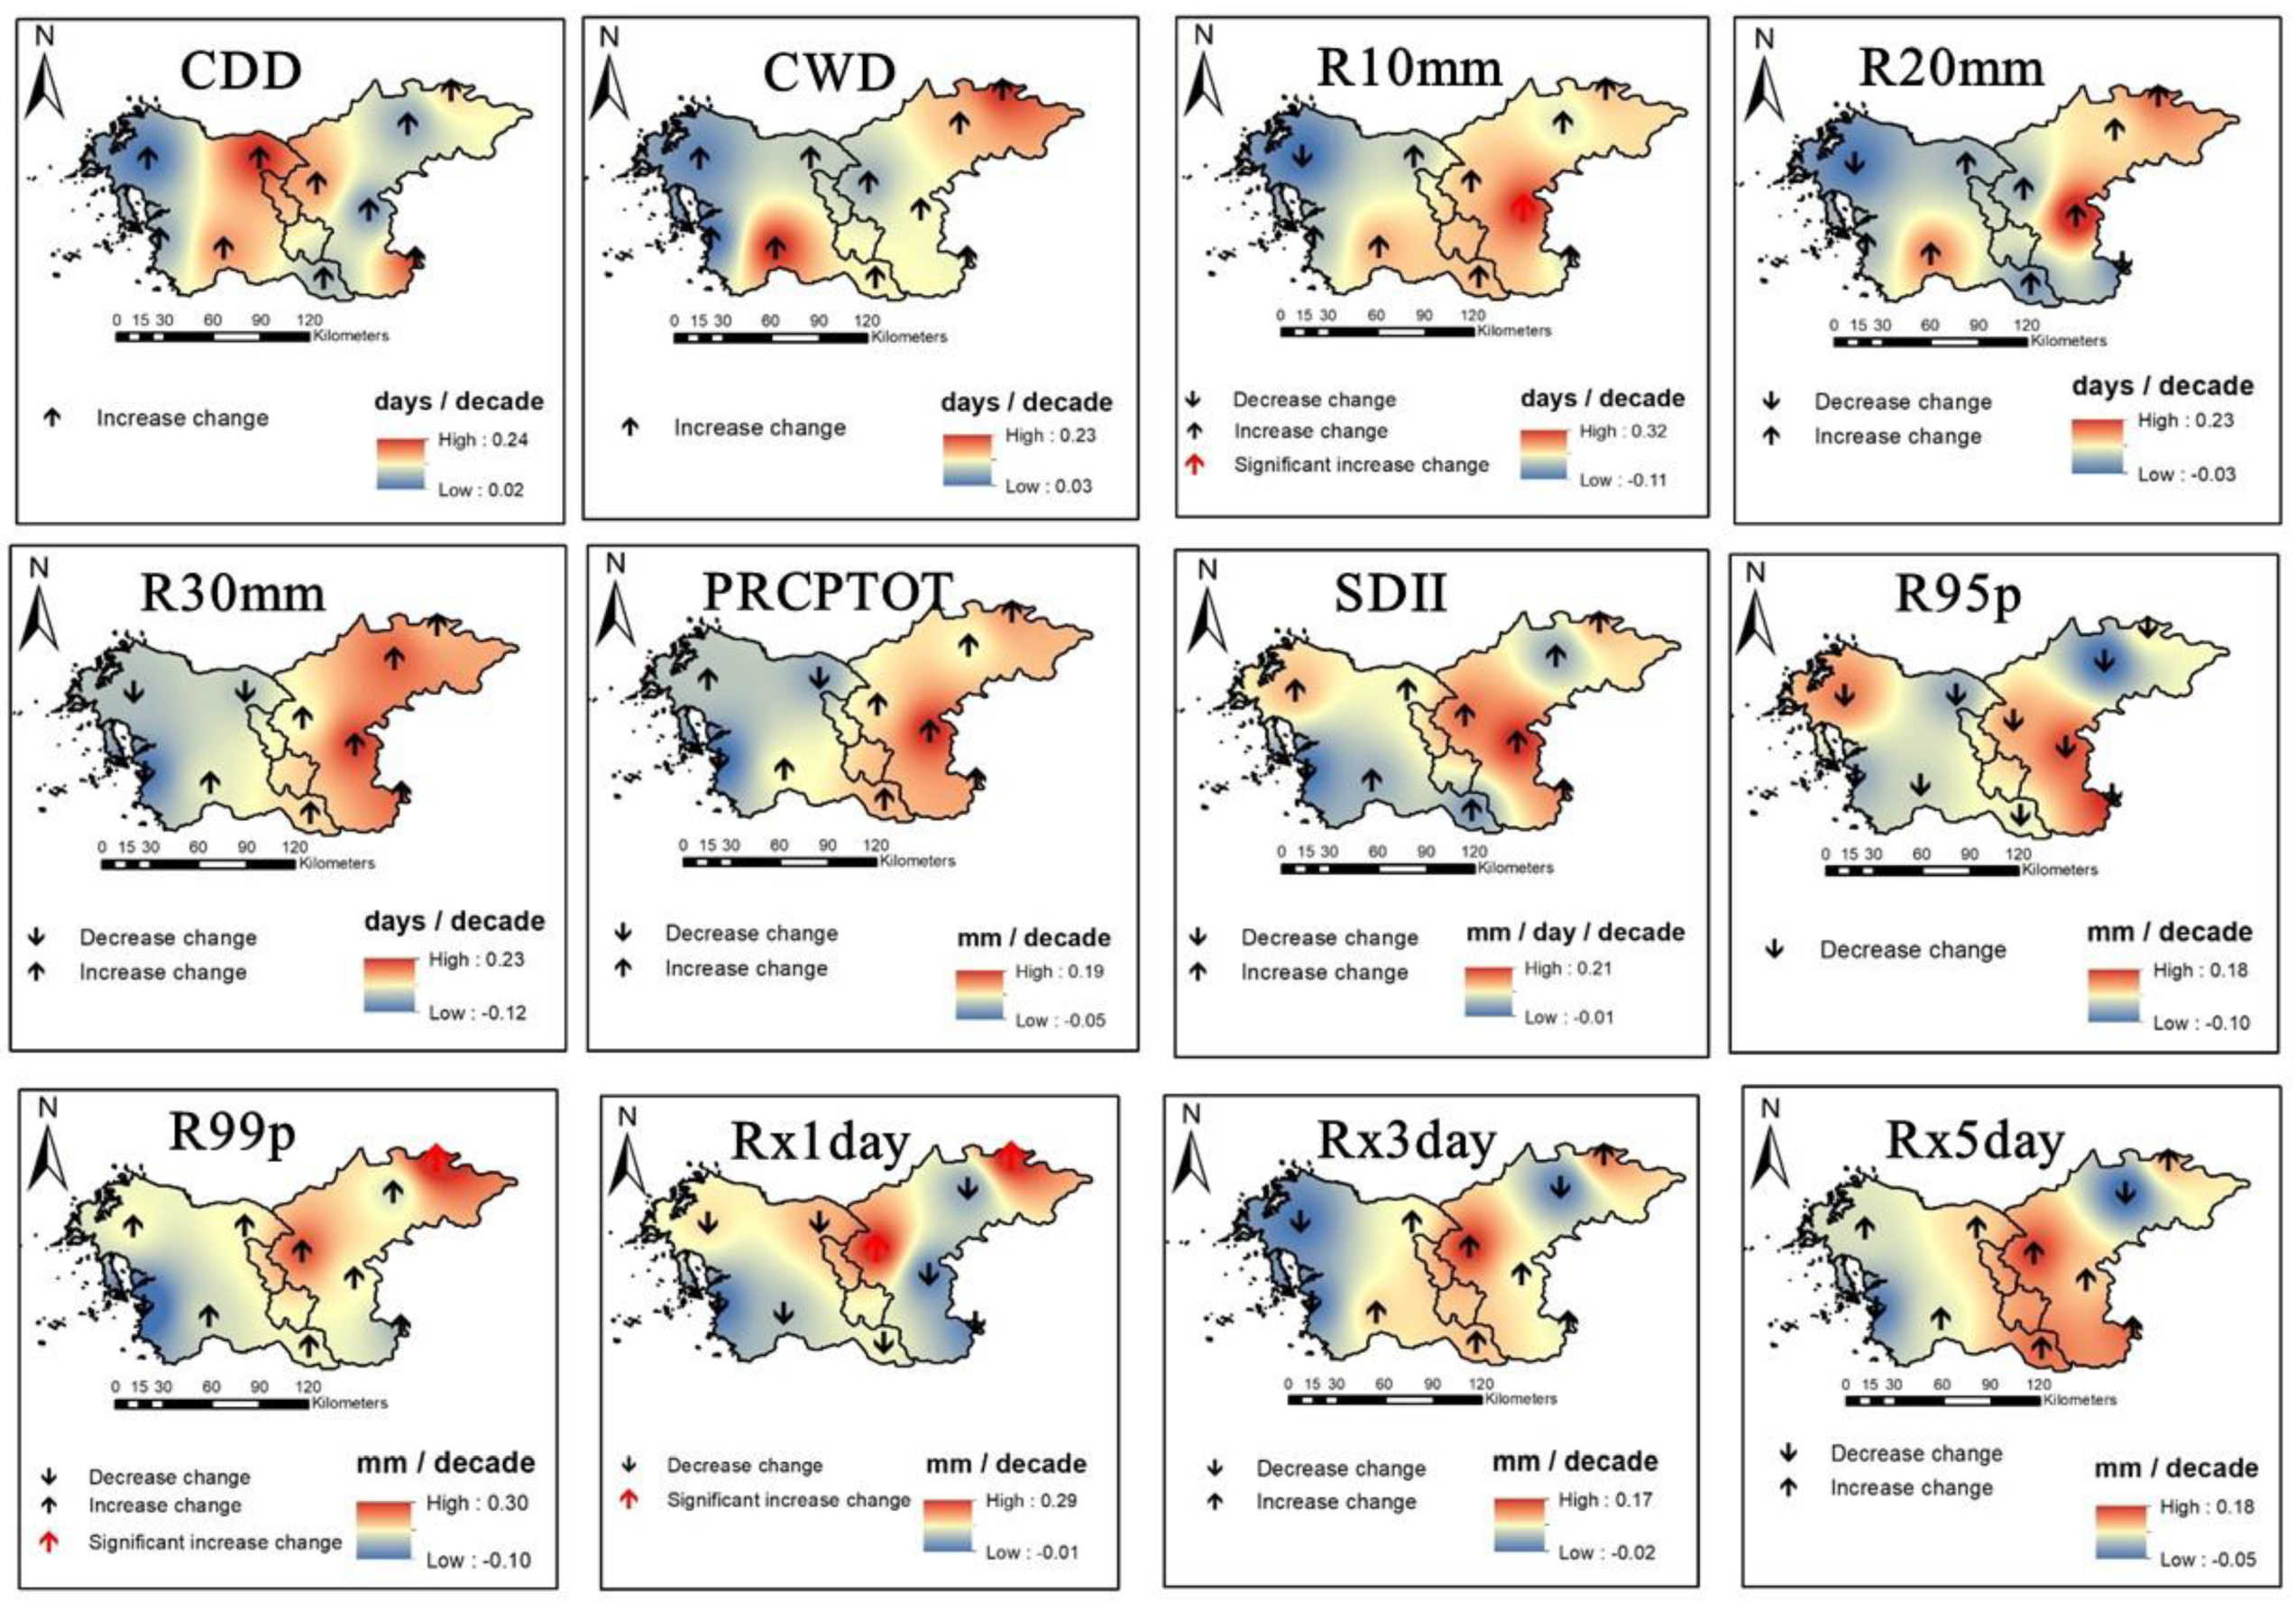
Figure 19.
Pearson’s correlation test among the three trend analysis methods.
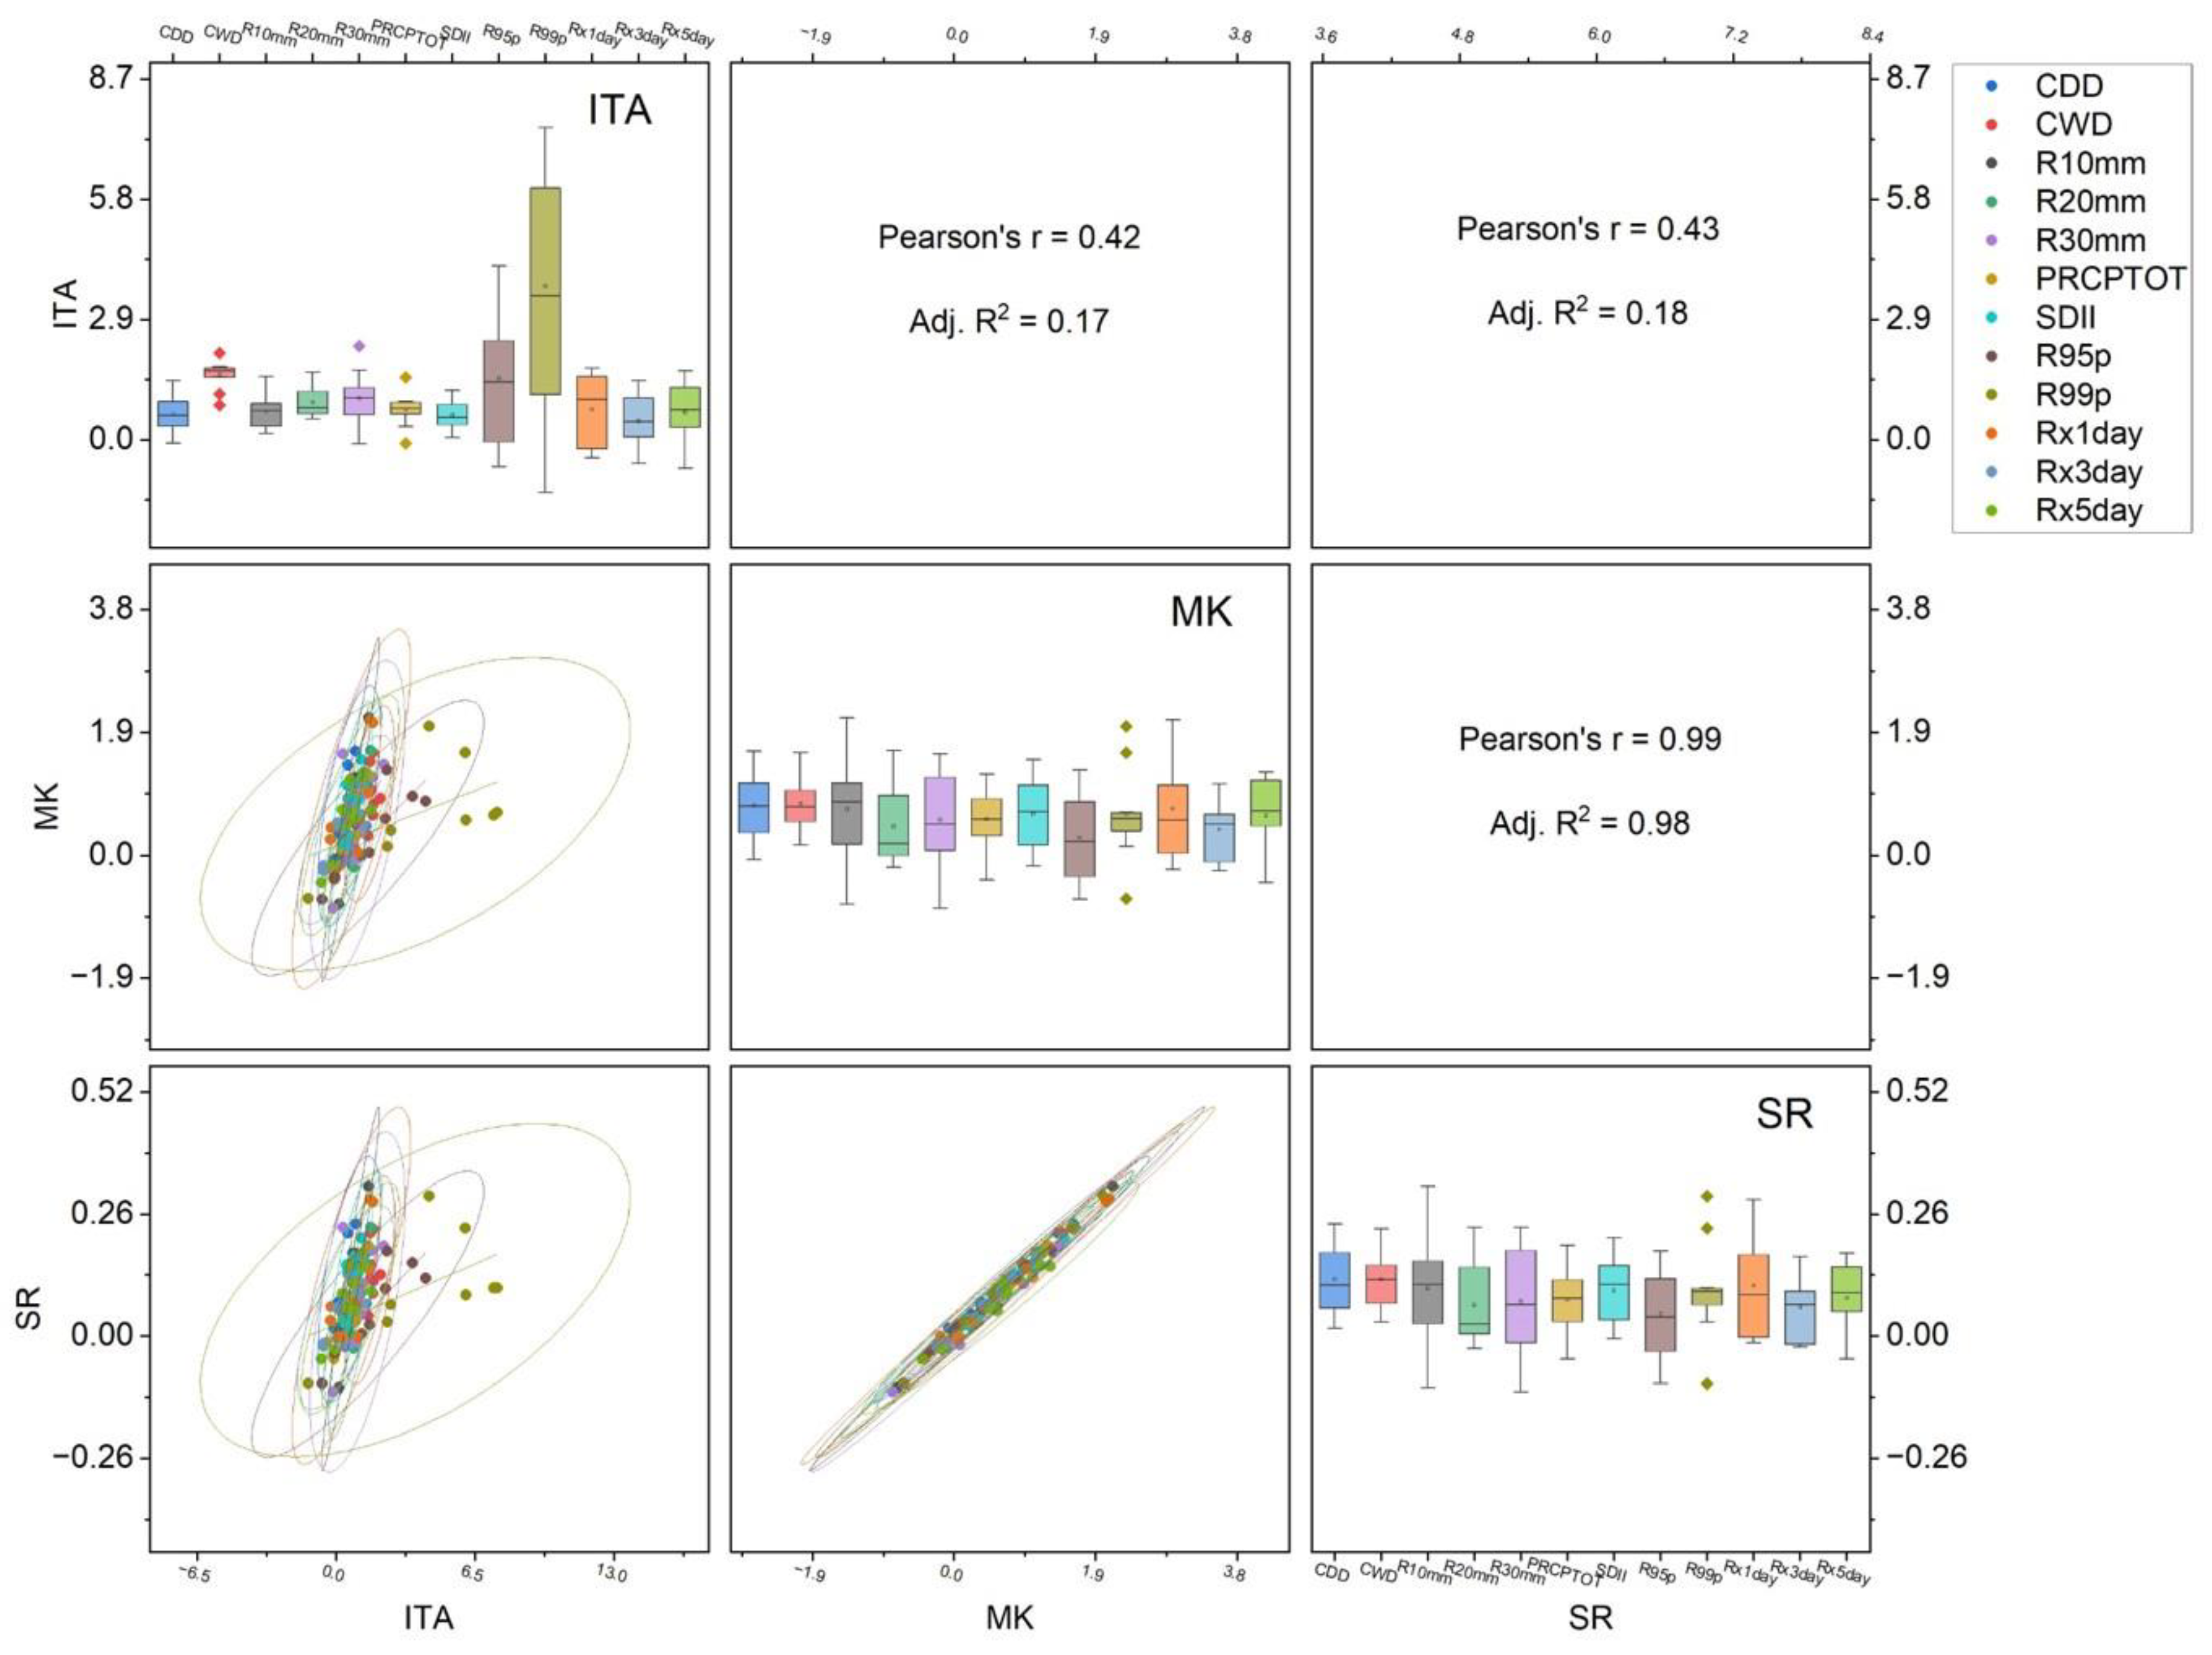

Table 1.
Definition of extreme climate indices considered for this study.
| Classification | Climate Index | Description | Definition | Units |
|---|---|---|---|---|
| Duration | CDD | Consecutive dry days | Maximum number of consecutive dry days | days |
| CWD | Consecutive wet days | Maximum number of consecutive wet days | days | |
| Frequency | R10mm | Number of heavy precipitation days | Annual count of days when RR ≥ 10 mm | days |
| R20mm | Number of very heavy precipitation days | Annual count of days when RR ≥ 20 mm | days | |
| R30mm | Number of very heavy precipitation days | Annual count of days when RR ≥ 30 mm | days | |
| Intensity | PRCPTOT | Annual precipitation | Annual total precipitation when RR ≥ 1 mm | mm |
| R95p | Very wet days | Annual precipitation when RR > 95th percentile | mm | |
| R99p | Extremely wet days | Annual precipitation when RR > 99th percentile | mm | |
| Rx1day | Maximum 1 day of precipitation | Annual highest daily precipitation | mm | |
| Rx3day | Maximum 3 day of precipitation | Annual highest 3 consecutive days of precipitation | mm | |
| Rx5day | Maximum 5 day of precipitation | Annual highest 5 consecutive days of precipitation | mm | |
| SDII | Simple daily intensity index | Annual precipitation divided by number of wet days | mm/day |
Disclaimer/Publisher’s Note: The statements, opinions and data contained in all publications are solely those of the individual author(s) and contributor(s) and not of MDPI and/or the editor(s). MDPI and/or the editor(s) disclaim responsibility for any injury to people or property resulting from any ideas, methods, instructions or products referred to in the content. |
© 2023 by the authors. Licensee MDPI, Basel, Switzerland. This article is an open access article distributed under the terms and conditions of the Creative Commons Attribution (CC BY) license (http://creativecommons.org/licenses/by/4.0/).
Copyright: This open access article is published under a Creative Commons CC BY 4.0 license, which permit the free download, distribution, and reuse, provided that the author and preprint are cited in any reuse.


