
Submitted:
03 June 2025
Posted:
04 June 2025
You are already at the latest version
Abstract
Management for pheasant shooting is a widespread land use in the UK, with potential implications for forest and hedgerow habitats. This study evaluates whether sites managed for pheasant shooting differ ecologically from similar sites not used for shooting. A systematic evidence evaluation of comparative studies was combined with a spatial analysis using remote sensing data (2010–2024). Remote sensing assessed forest structural and spectral diversity, intactness, and hedgerow density across 1131 pheasant-managed and 1131 matched control sites. Biodiversity data for birds, plants, and butterflies were sourced from GBIF records. Structural diversity and hedgerow density were significantly higher on pheasant-managed sites, while no significant differences were found in forest spectral diversity, intactness, or biodiversity indicators. The literature review identified only 32 studies meeting strict criteria for comparability, revealing inconsistent and often weak evidence, with few studies reporting detailed forest management or statistically robust outcomes. While some studies noted increased or decreased biodiversity associated with pheasant shooting, the evidence base was generally of low quality. Pheasant management may shape certain habitat features but has limited demonstrable effects on overall biodiversity. Further field-based, controlled studies are required to understand causal mechanisms and inform ecologically sustainable shooting practices.
Keywords:
Pheasant shooting
; Gamebirds
; Forest management
; Hedgerows
; Habitat fragmentation
; Remote sensing
; Systematic Review
; Biodiversity
1. Introduction
The management of land for recreational gamebird shooting, particularly pheasant (Phasianus colchicus) shooting, has potential ecological implications for forest/woodland and hedgerow habitats in the United Kingdom. Game management often encourages private landowners to retain and create forest areas and other supporting habitats, which can foster biodiversity and contribute to conservation [1]. However, certain practices associated with pheasant shooting, such as the use of release pens and high bird densities on certain sites, have raised concerns over habitat degradation, changes in vegetation structure, and declines in invertebrate and amphibian populations [2]. Although existing research has provided insights into these impacts, the findings are often fragmented, and few studies have analysed the effects at a landscape scale, where habitat composition, connectivity, and biodiversity dynamics are well understood. Nor have they taken an approach that allows forest managed for shooting to be compared in quality or structure with those not managed for shooting in similar areas.
Four recent reviews of literature on environmental effects of gamebirds (including, but not limited to, pheasants) and management for shooting in the United Kingdom have reported findings using a number of different framings.
Mason et al. [1] conducted a systematic literature search and addressed concerns over the environmental impacts of large-scale gamebird releases, such as effects on water, carbon, and biodiversity. The review was an update of an earlier review by Bicknell et al. [3]. Studies were assessed using a scoring system that assessed the direction of ecological effects on native wildlife, the importance of the ecological impact and the quality of the study. These were categorised into six primary and 19 secondary impact themes.
Sage et al. [2] conducted a review that utilised the same dataset from Madden & Sage [4], excluding information specific to mallard releases and the data on the scale and distribution of releases. A numerical synthesis was conducted, categorising 25 ecological effects as positive, negative, or neutral, together with. an examination of the spatial scale of these effects.
Madden and Sage [4] focused their review on sustainable gamebird management. Their review assigned evidence to one of 22 effects, and excluded studies that were wholly on socio-economic factors (including zoonotic diseases and human health) and moral, ethical or welfare considerations (for either the birds or humans).
Madden et al. [5] reviewed and evaluated new studies published since 2020 and incorporated these with findings from the three earlier reviews (above) using the framing of Madden and Sage [4]. Although the focus was on Wales, much of the evidence was relevant to the UK generally.
The reviews revealed a complex picture of ecological effects, with associated conservation implications, from direct effects of gamebirds (eating plants and animals thus competing with non-quarry species, providing a food source for generalist predators, transmitting disease, changing soil chemistry), to associated effects (primarily the management activities to support birds prior to and after release, including habitat creation and management, predator control, and supplementary feeding). While these previous studies have reviewed the environmental effects of multiple gamebird species on land managed for different uses and with various types of land cover, a focus on the implications specifically for forest and hedgerow management of pheasant shoots remains a knowledge gap.
This current study aimed to apply a repeatable, spatially and temporally explicit methodology using remote sensing technology to assess the extent, structural composition, and ecological diversity of forests managed for pheasant shooting, in comparison with matched control sites. A systematic evidence evaluation was conducted of the existing comparative literature (sites managed for pheasant shooting versus sites not managed for pheasant shooting) to synthesise current knowledge on the ecological impacts of forest and hedgerow management associated with pheasant shooting in the UK. Findings from the literature review helped shape the method of the remote sensing analysis, to provide a robust, landscape-scale assessment of the impacts of pheasant shooting management on forest and hedgerow habitats.
2. Materials and Methods
2.1. Systematic Evidence Evaluation
The systematic evidence evaluation of the literature built on elements identified in previous reviews [1,2,4,5], but with a specific focus on studies which compared sites managed for pheasant shooting and sites not managed for pheasant shooting, or compared different types of forest management within an estate. In this context estate is defined to be any land-holding where there is management control, for example a large landed estate, an owned family farm or a tenanted farm.
It is recognised that this strict insistence on studies using controlled experimental designs (near-adjacent, or closely matched, sites, one with shooting, one without, or, Before-After-Control-Intervention (BACI) studies, where shooting was introduced - or discontinued - on the same estate) severely limits the volume of literature available to be assessed. However it strongly increases the power of findings of a comparative nature.
Systematic methodology for reviewing and synthesising evidence has gained widespread adoption across various sectors where science plays a role in shaping decision-making. It has evolved into an established standard for evaluating, assessing, and consolidating scientific knowledge. The imperative for maintaining rigour, objectivity and transparency when drawing conclusions from a corpus of scientific information is currently utilised across a wide range of domains, including clinical medicine, social justice, and environmental management [6]. This approach ensures a more robust construction and analysis of the existing evidence base and reduces claims of biases [7], real or perceived, which have beset similar work on game shooting in the past (e.g. [1,4]). The limited number of comparable and suitable studies identified which provided sufficient information prevented a full systematic review with meta-analysis (the ‘gold-standard’ for analysing an evidence base). A systematic map process was therefore adopted [8], which is consistent with the Rapid Review standard often required by Defra to provide evidence for policy [9], which is driven by a Protocol and shares much of the rigour of a full systematic review.
By critically evaluating the methodologies, findings, and conclusions of previous studies, the current state of knowledge on forest quality and biodiversity was synthesised. Where the evidence allowed, areas of consensus and contention in respect of sites managed for pheasant shooting and its effects on forest quality were highlighted. The full methodology used to Search, Select, and Synthesise the literature can be found in Appendix A.
2.2. Spatial Analysis Approach
The overall approach was to select a large set of land holding sites on which pheasant shooting had taken place in approximately the period 2010 - 2024 and an equal number of comparison land holding sites on which pheasant shooting had not taken place in the same time period. Sites managed for pheasant shooting and comparison sites were propensity-score matched to ensure that pairs of sites being compared were similar in a set of measurable covariates. This approach was to ensure that any differences in habitat and biodiversity response variables could be attributed to the management contrast i.e. pheasant shooting, rather than background environmental differences.
Remote sensing and modelling methods vary in their directness. A combination of highly direct methods was used, including indexes of forest spectral diversity, structural diversity and intactness. These are highly reliable because there is a very tight relationship between the measurement made by satellite instruments and the habitat quality metric.
Methods for remote monitoring of landscape are continually being refined and new instruments and data products become available each year. For example there are rapidly developing methods that use thermal observations to measure ecosystem health\integrity [10]. Hyperspectral remote sensing is also becoming more mature, and offers powerful insights into the plant physiological basis of ecosystem functioning [11]. There are an increasing number of studies that explore synergies between the types of indicators used in this study, for example using hyperspectral observations to characterise plant beta-diversity [12].
Airborne lidar can be used to measure the vertical structural complexity of hedgerows and forests in the UK [13] and canopy height [14], although the temporal sampling of any data which exists in the public domain for the UK is limited. Space-borne lidar data in time-series exists (although there are some gaps) from instruments such as Icesat GLAS and GEDI, however these instruments sample a lattice of points, rather than synoptically across landscapes, so are unsuitable for this analysis. All analyses were calculated for Great Britain and also disaggregated by the Nations within Great Britain: England, Scotland and Wales.
2.3. Selection of Sites Managed for Pheasant Shooting and Comparison Sites
A total of 1131 polygons were selected of areas of land used for pheasant shooting by BASC members who have entered data into Green Shoots Mapping [15]. Each polygon was mapped onto an International Territorial Level 1 Region of Great Britain [16]. In the event that a polygon spanned more than one region, it was allocated to the region covered by the majority of the polygon.
Potential comparison sites were derived from cadastral data from the Land registry of England and Wales and Land Register of Scotland. Shapefiles of all cadastral polygons were downloaded from the UK government using land property data service [17] and land register of Scotland [18]. All cadastral polygons in urban areas were excluded using the OS built up areas product as a mask [19].
A 1km lattice of points covering Great Britain was created to select a very large regular sample of non-urban cadastral polygons (~400,000 polygons). These were the set of potential comparison polygons from which the comparison sites used in the analysis were selected.
In order to ensure geographical balance, a regional matching procedure was implemented. Within Scotland, Wales, and regions of England (except London), the sites managed for pheasant shooting were counted and an equal number of comparison sites were selected.
For each site managed for pheasant shooting and all potential comparison sites the zonal mean of proportion forest in 2010 was calculated, derived from Hansen et al. [20]; elevation was derived from SRTM [21] and area (ha) was derived from zonal geometry of the sites.
The R library MatchIt [22] was used to identify, within each region, a set of comparison sites which were as similar as possible to the sites managed for pheasant shooting in terms of area, elevation and forest cover.
Whereas the set of pheasant sites extracted from Green Shoots Mapping was assumed to be reasonably complete and represented sites that are managed for pheasant shooting, it is not possible to be certain that pheasant shooting has not taken place on any of the selected comparison sites. This is not a fundamental problem in quasi-experimental studies based on propensity score matching set of treatment and comparison units. Pheasant shooting does not take place on the majority of land in the UK-90,000 km2 of lowlands , including 14%–28% of woodland [23], and so it is reasonable to compare a large sample of pheasant sites with a large sample of similar 'background' comparison sites in order to draw inference about effects of pheasant shooting on forest properties and biodiversity.
2.4. Satellite Remote Sensing of Outcome Variables
Satellite remote sensing was used to map forest intactness, spectral diversity of forests and structural diversity of forests in 2023 across Great Britain. An airborne lidar dataset was used to map hedgerows across Great Britain in 2016.
Forest intactness in 2023 was derived from the Hansen [20] forest product. First a map of forest (0/1) in 2023 was produced. Then the area in hectares of the connected forest patch which each pixel belonged to was calculated. Since forest patch sizes varied by several orders of magnitude, this data was natural log transformed.
The forest intactness (connectivity) layer is a measure of forest configuration in the landscape. The greater the intactness, the more permeable the landscape is for forest-associated species which may have low dispersal abilities.
Spectral diversity of forests in 2023 was derived from atmospherically corrected and temporally composited Landsat surface reflectance data in 2023. A 3x3 kernel was passed over each waveband of data to calculate focal standard deviation of spectral reflectance. The measure of spectral diversity was the root mean square across all wavebands of the focal standard deviation of reflectance. This measure was then masked to forest only.
Structural diversity of forests in 2023 was calculated from C-band SAR backscattering coefficient following Santoro et al. [24]. A 3x3 kernel was passed over a map of above ground biomass in 2023 to calculate focal standard deviation. This measure was then masked to forest only.
Hedgerows in 2016 were characterised using the CEH woody linear features dataset derived from airborne lidar surveys [25]. This produced a line shapefile of all hedgerows in Great Britain.
The zonal mean of forest intactness, forest spectral diversity and forest structural diversity were calculated in all sites managed for pheasant shooting and comparison sites. The length of hedgerow in all sites was calculated. Hedgerow density (m hedgerow\ ha) was calculated as an outcome variable in order to account for differences in the area of the sites.
2.5. Biodiversity Data and Rarefaction
Birds, above-ground invertebrates (of which the majority were butterflies, and vascular plants emerged from the systematic literature review as the most commonly-reported taxa and these informed the selection of biodiversity data for the remote sensing study, with invertebrates limited to butterflies, for which data are particularly rich in the UK. In order to compare diversity of plants, birds, and butterflies between sites managed for pheasant shooting and comparison sites the Global Biodiversity Information Facility (GBIF) was queried to obtain biodiversity records. GBIF is a global database of biodiversity observations (record) which have been determined to species level. Each record has a scientific name, geographic co-ordinates and a date. Records are points. The pattern of points can be dense or sparse depending on the taxonomic group and location, which together determine recording effort. It is not meaningful to speak of a spatial resolution of GBIF records as this is not a gridded dataset. However GBIF records do have a co-ordinate precision. The location of most records is accurate within 10m (a 6 figure grid reference in the UK). This means it was possible accurately to determine whether records fall within sites managed for pheasant shooting and comparison sites in this study. The GBIF query parameters were as follows:
- Administrative area = United Kingdom
- Year = 2010-2024
- Basis of record = Human observation OR Preserved specimen
- Taxon rank = Species
- Scientific name = class Aves
- Scientific name = kingdom Plantae
- Scientific name = family Hesperiidae OR Papilionidae OR Pieridae OR Lycaenidae OR Riodinidae OR Nymphalidae
The records were obtained from the following DOIs.:
- Plants (URL: https://doi.org/10.15468/dl.eh653t )
- Birds (URL: https://doi.org/10.15468/dl.px4x77)
- Butterflies (URL: https://doi.org/10.15468/dl.dq98b4)
The GBIF records were converted to point shapefiles to identify sites managed for pheasant shooting or comparison site which they intersected. Rarefaction was used to estimate the asymptotic species richness of each taxonomic group in each site [26]. Since the sites differed in area and species richness increases logarithmically with area [27] species richness was converted to species density by dividing richness by area raised to the power 0.2 [28,29].
3. Results
3.1. Location of Studies in the Project
3.2. Systematic Review of Literature
3.2.1. Literature Assessed and Selected
Following good practice for systematic reviews, a distinction was made between ‘articles’ and studies’. Some articles contain more than one study (differences in methodological approach or location), only some of which may have been relevant to the current review question; the total number of studies included therefore exceeded the number of articles (Figure 2).
Twenty of the studies compared sites managed for pheasant shooting vs non-shooting sites (one of which had been a shooting site until 2 years before the research and was therefore considered appropriate as a controlled study), and 12 studies compared sites managed for pheasant shooting with other sites managed for pheasant shooting, where differences were in forest management or intensity of pheasant rearing or release. Study sites (sites managed for pheasant shooting and comparators) were all located in England (n=1202) with the exception of one site and comparator, which was located in Scotland.
The large drop in numbers screened for the review (2373 articles in total) to numbers included in the review (23 articles, yielding 32 individual studies) reveals the dearth of comparative studies in the literature. Earlier reviews have not been limited to comparative studies, and the numbers they report are therefore much higher. However, the questions posed in the current review require comparative data and it was therefore necessary to exclude those which provided data for biodiversity outcomes if they did not also include comparisons between sites managed for pheasant shooting and non-shooting sites. Publication dates of included studies were 1986-2021.
3.2.2. Site Characteristics
Of the studies that provided details of the sites on which pheasant shooting occurred, the majority reported having arable crops and were located in the South East of England, a predominantly arable farming region. Many pheasant shoots have arable crops on site which are grown as cover crops to shelter and feed birds and hence hold them in a desired location. These can be various types of arable crops (often maize, cereals, small grains or other longer lasting crops), and it therefore seems likely that these sites might have some sort of arable operation to be able to sow these crops annually and were not necessarily growing arable crops as their main activity. Some other sites reported having grassland/livestock, but details of the farming/management objectives were limited.
Most of the studies reported data for broadleaved forests (19 studies), with oak, ash and field maple most prominent dominant tree species, and with six conifer and four mixed-forest studies also reported. Eight studies reported data for hedgerows. It should be noted that seven of the studies contained data for more than one forest type. There was a disappointing lack of detail about forest management in the evidence base generally- 21 studies contained no information at all. Twenty-two studies did not report any dominant tree species details at all. Of those that did report some management activities, ride creation and maintenance and forest planting were reported most often.
There was very little information documented in the literature on the rearing and release of pheasants for shooting. Only two studies specified details about pheasant rearing and release practices, all bar two studies provided details on pheasant release practices, including release pen size, pheasant stocking density, and vegetation management and composition, indicating a gap.
In addition to the lack of information about pheasant rearing and release, 23 studies provided no information about shoot type or size. Of those that did, seven were reported to be commercial shoots, 2 private and one had data for both commercial and private shoots. No attempt was made to verify these designations. There was also very little information about the nature and size of the shoots. This lack of detail restricts understanding of how shoot type or size might differentially impact biodiversity.
3.3.3. Impact of Sites Managed for Pheasant Shooting on Biodiversity
In common with many systematic reviews of impacts on biodiversity, the most commonly reported data were bird abundance and diversity. Again, in common with many other reviews, there was little or no evidence for herptiles (reptiles and amphibians), non-vascular plants and fungi (Table 2).
Previous reviews on this topic [1,2,4,5] have used a scoring system to report on beneficial or detrimental impacts of gamebird management for shooting. In systematic reviews, however, care is taken not to use simple ‘vote counting’ to report on the impacts or effects of interventions on outcomes of interest. Instead meta-analysis is used to pool effects found in individual studies and carefully interpret them where the studies are sufficiently similar in design. In the current report, it is clear that the evidence base does not contain sufficient studies which have collected the same data in the same way in matched sites to enable meta-analysis. The current report therefore reflects what the authors of the individual studies considered to show positive, negative or neutral biodiversity outcomes of the sites managed for pheasant shooting compared with the non-shooting site. This should be viewed in the light of a summary of the evidence base rather than a definitive statistically significant statement of benefits or disbenefits of shooting on similar patches of land.
All the species that were identified by the articles’ authors with their assessment of whether there was increased presence, decreased presence or no difference of species on sites managed for pheasant shooting vs non-shooting sites can be found in Appendix B.
A complex picture of biodiversity outcomes emerges from the evidence base, most of which cannot easily be attributable to any particular forest management practice. Authors reported increases, decreases or no differences in biodiversity generally, or for specified taxa in sites managed for pheasant shooting compared with non-shooting sites. Some of these differences are simply presence/absence data. Very few contained numerical data that could be analysed statistically to determine the impact on biodiversity of shooting.
Six studies (from 5 articles) report both positive and negative for different taxa [5,30,31,32,33]. Some studies also recorded instances of no difference between the sites managed for pheasant shooting and non-shooting sites for some taxa.
The evidence base contains 14 studies (from 11 articles) in which the authors reported an increased presence of some biodiversity indicators for sites managed for pheasant shooting compared with their non-shooting comparator sites [5,30,31,32,33,34,35,36,37,38,39]. However, only two provided comparative details about the respective forest management strategies [32,38], which is necessary to interpret any possible benefits to biodiversity as a consequence of forest management.
Greenall reports that hedgerows are managed intensively, with practices such as controlled trimming and cover crop planting adjacent to hedges to enhance habitat for nesting and brood-rearing, thereby increasing pheasant productivity [38]. Stoate comments that hedgerows on a site managed for pheasant shooting include multi-layered vegetation, which often comprises ground flora, shrubs, and taller trees, creating varied microhabitats that cater to diverse species’ needs [32]. Furthermore, dense trimming practices maintain hedgerow cover at the base, which supports ground-nesting gamebirds and improves conditions for songbirds and other wildlife.
Nine studies (from 8 articles) reported some decreased presence of biodiversity of the sites managed for pheasant shooting compared with a non-shooting comparator site [23,30,31,32,33,40,41,42]. Only two of these [32,40] provided any forest management information for both the sites managed for pheasant shooting and the comparator sites. These showed some declines in vascular plants [40], and birds [32].
In total, 10 studies (from 9 articles) reported instances of no difference between sites managed for pheasant shooting and non-shooting sites for particular biodiversity measures [31,32,33,37,38,40,41,43,44]. The differences in management reported by Greenall [38] compared active with non-active forest/hedgerow management, and the taxa which did not differ between these two sites were bumblebees and songbirds. Stoate [32] sites compared thinning, forest planting and hedge management against no active management, and they recorded no difference for three species of birds.
Six studies were included on the basis that they compared different types of land management (e.g. arable vs livestock farming on two sites managed for pheasant shooting. However, only one of these (one of the Greenall [38] studies) provides any comparative forest management details to make any contribution to inferring what aspects of the forest management or forest structure may have contributed to this reported positive benefit to biodiversity. Again, when comparing two different sites managed for pheasant shooting with different characteristics (6 studies from 3 articles), only one of the Greenall [38] studies provided forest management comparisons.
3.2.4. Quality of the Evidence Base
The risk of bias assessment score indicates that the quality of the evidence base for this study is generally low. None of the reviewed studies achieved the highest score of 5, which would indicate minimal risk of bias. Only four studies scored a 4, with a further 4 falling between 2.5 and 3. Most studies (20) scored a 2, indicating a moderate risk of bias, while four scored a 1, indicating significant methodological concerns. Several issues contribute to these low scores. Many studies rely heavily on aggregated data, mainly combining results across different taxa, which limits the ability to draw meaningful site-specific conclusions. Few directly compare matched sites managed for pheasant shooting and non-shooting areas, making it difficult to clearly attribute observed effects to pheasant shooting management. Additionally, details about forest management practices are often missing, and raw data are frequently unavailable, reducing the scope for further analysis such as inclusion in a meta-analysis. In some cases, methods of data collection are also unclear, raising questions about the reliability of the results. This assessment shows the need for more robust, transparent, and detailed primary research in this field.
3.3. Remote Sensing
3.3.1. Performance of the Matching Procedure
The performance of the matching procedure was tested by using t-tests to check whether the sites managed for pheasant shooting and comparison sites were similar in terms of the matching covariates (Table 3). These t-tests should be non-significant, indicating that the two groups are not different. Perfect matching on all covariates was not possible in all regions (indicated by an asterisk in Table 3), however the overall performance of the matching was generally very good.
3.3.2. Habitat Quality
There was no significant difference in forest intactness (ln patch size of forest), a measure of forest landscape connectivity, between sites managed for pheasant shooting and comparison sites (t test, t = 1.7909, p = 0.0734, n = 1131 pheasant and 1131 comparison sites). The mean intactness of the sites managed for pheasant shooting was 1.22, the mean intactness of the comparison sites was 1.38.
There was no significant difference in spectral diversity of forest between sites managed for pheasant shooting and comparison sites (t-test, t = -1.4197, p = 0.1558, n = 1131 pheasant and 1131 comparison sites). The mean spectral diversity of forest in the sites managed for pheasant shooting was 0.015 and the mean spectral diversity of forest in the comparison sites was 0.014
Sites managed for pheasant shooting had significantly greater structural diversity of forest than comparison sites (t-test, t = -2.8036, p = 0.005097 **, n = 1131 pheasant and 1131 comparison sites). The mean structural diversity of forest in the sites managed for pheasant shooting was 43.12 and the mean structural diversity in the comparison sites was 40.22 (Figure 3).
Sites managed for pheasant shooting had significantly greater hedgerow density than comparison sites (t-test, t = -5.865, p<0.001 ***, n = 1131 pheasant and 1131 comparison sites). The mean hedgerow density in the sites managed for pheasant shooting was 55.06 m hedgerow/ha and the mean hedgerow density in the comparison sites was 20.58 m hedegerow/ha (Figure 4).
3.3.3. Biodiversity (Birds, Plants, Butterflies)
There was no significant difference in butterfly species density between sites managed for pheasant shooting and comparison sites in Great Britain (t test, t = 0.16771, p = 0.8668, n = 1131 pheasant and 1131 comparison sites). The mean butterfly species density of the sites managed for pheasant shooting was 0.534, the mean butterfly species density of the comparison sites was 0.496
There was no significant difference in plant species density between sites managed for pheasant shooting and comparison sites in Great Britain (t test, t = 0.46598, p = 0.6413, n = 1131 pheasant and 1131 comparison sites). The mean plant species density of the sites managed for pheasant shooting was 13.51, the mean plant species density of the comparison sites was 15.02
There was no significant difference in bird species density between sites managed for pheasant shooting and comparison sites in Great Britain (t test, t = 1.1824, p = 0.7923, n = 1131 pheasant and 1131 comparison sites). The mean bird species density of the sites managed for pheasant shooting was 12.60, the mean bird species density of the comparison sites was 10.389.
3.3.4. Differences Between Nations Within Great Britain
The remote sensing analyses in the previous section were repeated but disaggregated by the nations within Great Britain: England, Scotland and Wales. There was no significant difference in forest spectral diversity between sites managed for pheasant shooting and comparison sites in England (t-test, t = -1.5348, p = 0.125, n = 982 pheasant and 982 comparison sites). The mean forest spectral diversity in the sites managed for pheasant shooting was 0.0149 and the mean forest spectral diversity in the comparison sites was 0.0144. Sites managed for pheasant shooting had significantly greater forest structural diversity than comparison sites in England (t-test, t = -2.5516, p = 0.0108 *, n = 982 pheasant and 982 comparison sites). The mean forest structural diversity in the sites managed for pheasant shooting was 43.367 and the mean forest structural diversity in the comparison sites was 40.51. There was no significant difference in forest intactness (ln patch size of forest), a measure of forest landscape connectivity, between sites managed for pheasant shooting and comparison sites in England (t test, t = 1.7253, p = 0.08463, n = 982 pheasant and 982 comparison sites). The mean forest intactness of the sites managed for pheasant shooting was 1.21, the mean forest intactness of the comparison sites was 1.37. Sites managed for pheasant shooting had significantly greater hedgerow density than comparison sites in England (t-test, t = -5.704, p<0.001 ***, n = 982 pheasant and 982 comparison sites). The mean hedgerow density in the sites managed for pheasant shooting was 57.08m hedgerow/ha and the mean hedgerow density in the comparison sites was 20.14 m hedgerow/ha.
There was no significant difference in forest spectral diversity between sites managed for pheasant shooting and comparison sites in Scotland (t-test, t = 1.6763, p = 0.09594, n = 98 pheasant and 98 comparison sites). The mean forest spectral diversity in the sites managed for pheasant shooting was 0.0150 and the mean forest spectral diversity in the comparison sites was 0.0171. There was no significant difference in forest structural diversity between sites managed for pheasant shooting and comparison sites in Scotland (t-test, t = -1.0646, p = 0.288, n = 98 pheasant and 98 comparison sites). The mean forest structural diversity in the sites managed for pheasant shooting was 42.42 and the mean forest structural diversity in the comparison sites was 38.81. There was no significant difference in forest intactness (ln patch size of forest), a measure of forest landscape connectivity, between sites managed for pheasant shooting and comparison sites in Scotland (t test, t = -0.215, p = 0.829, n = 98 pheasant and 98 comparison sites). The mean forest intactness of the sites managed for pheasant shooting was 1.34, the mean forest intactness of the comparison sites was 1.27. There was no significant difference in hedgerow density between sites managed for pheasant shooting and comparison sites in Scotland (t-test, t = -0.490, p= 0.624, n = 98 pheasant and 98 comparison sites). The mean hedgerow density in the sites managed for pheasant shooting was 20.68 m hedgerow/ha and the mean hedgerow density in the comparison sites was 14.94 m hedgerow/ha.
Forest spectral diversity was significantly greater in sites managed for pheasant shooting than in comparison sites in Wales (t-test, t = -2.3463, p = 0.0216 *, n = 51 pheasant and 51 comparison sites. The mean forest spectral diversity in the sites managed for pheasant shooting was 0.0170 and the mean forest spectral diversity in the comparison sites was 0.0128. There was no significant difference in forest structural diversity between sites managed for pheasant shooting and comparison sites in Wales (t-test, t = -0.546, p = 0.585, n = 51 pheasant and 51 comparison sites). The mean forest structural diversity in the sites managed for pheasant shooting was 39.72 and the mean forest structural diversity in the comparison sites was 37.15. There was no significant difference in forest intactness (ln patch size of forest), a measure of forest landscape connectivity, between sites managed for pheasant shooting and comparison sites in Wales (t test, t = - 1.163, p = 0.248, n = 51 pheasant and 51 comparison sites). The mean forest intactness of the sites managed for pheasant shooting was 1.11, the mean forest intactness of the comparison sites was 1.63. There was no significant difference in hedgerow density between sites managed for pheasant shooting and comparison sites in Wales (t-test, t = -1.6998, p= 0.094, n = 51 pheasant and 51 comparison sites). The mean hedgerow density in the sites managed for pheasant shooting was 60.56 m hedgerow/ha and the mean hedgerow density in the comparison sites was 29.63 m hedgerow/ha.
3.3.5. Effect of Size of Polygon Area
An assessment was made whether the size of the area of polygons representing sites on which pheasant shooting had occurred had any effect on any outcome variables. There was no association between spectral diversity and area of these polygons (linear regression: slope = -1.512e-07, t = -0.383, p = 0.702, n = 1131 polygons). There was no association between structural diversity and area of polygons (linear regression: slope = 6.056e-04, t = 0.418, p = 0.676, n = 1131 polygons). There was no association between forest intactness and area of polygons (linear regression: slope = 0.0001709, t = 1.489, p = 0.137, n = 1131 polygons). There was no association between hedgerow density and area of polygons (linear regression: slope = 0.00023, t = 0.337, p = 0.601, n = 1131 polygons).
3.4. Limitations
3.4.1. Systematic Evidence Evaluation
It is widely recognised that all literature reviews have inherent limitations, and despite the implementation of a systematic evidence evaluation to minimise biases in study selection and synthesis, biases can still influence the interpretation of results. The issue of ‘vote counting’ in systematic evidence evaluations (i.e. recording the authors’ assessment of positive or negative effects, without independent meta-analysis) means that the coding of increased/decreased/no-difference to biodiversity in the current review must be seen as indicative only. Caution should be used in over-interpreting such results. A common limitation of many systematic reviews is that the evidence is drawn only from articles published in online academic journals. The current review sought to minimise this limitation by interrogating the older print material in the University of Oxford’s Bodleian libraries, the forestry section of which is a recognised important resource for forestry research and also including non-journal articles such as Organisation Annual reports and academic theses. Another well-documented limitation of published academic research is the tendency of journals to favour papers with positive or novel results. There is therefore a widely-known lack of studies that show little or no difference between controlled studies. Again, this is partially overcome by including non-journal material in the evidence base.
3.4.2. Remote Sensing
Remote sensing methods using instruments on satellites or aircraft make observations from a distance without physically touching the ecosystem being measured. This results in a certain amount of indirectness in the measurement. For example, it is possible to measure trees in the field using a tape measure and clinometer, and estimate growing stock volume very directly. Alternatively it is possible to estimate growing stock volume using satellite measurements of microwave backscattering, which can be calibrated and validated using field plots. Whenever remote sensing data products are used, it is necessary to take account of the maturity of the algorithms that have been used to develop the product and the level of validation that it has received. In this study data products, including the Hansen (2013) forest product which are widely accepted by the scientific community, were used. Spatial data products vary in spatial and temporal resolution, and it is important to ensure that the observations are at an appropriate scale to capture the phenomena on the ground. Visible and microwave products at 30m resolution were also used and along with temporal compositing over annual periods - appropriate for studying stands of forest.
However, having acknowledged that remote sensing approaches have limitations, it is also important to recognise that this approach has a number of advantages, especially the ability to collect data synoptically across landscapes in retrospective time-series. This has enabled us to conduct a study with a very large number of sample units - far more than could ever have been feasible using field survey methods, which has permitted this study to have very good statistical power to detect differences between pheasant and comparison areas.
A limitation to our interpretation of the effect of pheasant shooting on forest quality is that on sites managed for shooting, it is only known that pheasant shooting takes place, and presumably the site is managed to support pheasant shooting. However agricultural land and forest are used for many purposes, and it would be useful to collect further details about management practices on land holdings managed for pheasant shooting, such as crops and forest management practices.
4. Discussion
6.1. Extent and Composition of Forest, Margins, and Hedgerows
The literature review provided some indications that sites managed for pheasant shooting may influence forest and hedgerow characteristics, but the evidence is sparse and inconsistent. Studies have suggested that practices associated with pheasant shooting, such as maintaining hedgerows and forest rides, could enhance habitat complexity. However, the lack of robust, controlled studies makes it difficult to draw definitive conclusions. Variability in study design and the absence of detailed site-specific data further limit the generalisability of the findings. Consequently, the potential ecological significance of sites managed for pheasant shooting should be interpreted cautiously.
The remote sensing (spatial) analysis provided measurable differences between sites managed for pheasant shooting and comparison sites, offering a more objective assessment than what was previously available.
Sites managed for pheasant shooting exhibited significantly greater hedgerow density compared to non-managed sites (55.06 m/ha vs 20.58 m/ha) in Great Britain as a whole This aligns with the expectation that shooting estates may have been more likely to retain hedgerows when other estates were removing them. They may also have been more likely to create new hedges under successive agri-environmental schemes as these hedges would have benefits to the owner beyond wildlife and landscape improvements. It should be noted that this significant effect appears to be driven by the English data where the vast majority of the sites were found. There were also greater hedgerow densities in sites managed for pheasant shooting than comparison sites in Scotland and Wales but the effect is not significant in these nations, which may be explained by the lower sample sizes available.
Sites managed for pheasant shooting in Great Britain as a whole demonstrated significantly higher structural diversity in forests, a characteristic often linked with biodiversity potential. This could also be seen as an expected outcome as structural diversity in forests provides both warmth and roosting habitat for pheasants so management activities to maintain structural diversity could be more likely to have taken place in comparison with non-shooting estates. The same significant effect was seen in England, however there was no significant difference in forest structural diversity between sites managed for pheasant shooting and comparison sites in Scotland or Wales, although in both cases forest structural diversity was higher in sites managed for pheasant shooting than comparison sites. This is probably because sample sizes were much smaller in Scotland and Wales and there was insufficient power in these tests to detect an effect if it was present.
No significant differences were observed in forest spectral diversity, forest intactness (connectivity), or biodiversity (birds, plants, butterflies) between pheasant and comparison sites in Great Britain as a whole or any of the individual nations.
These results suggest that certain landscape features, such as hedgerow density and forest structural diversity, are influenced by pheasant shooting management, though the absence of detectable differences in biodiversity metrics underscores the need for caution when interpreting these outcomes.
6.2. Knowledge Gaps and Future Research Directions
The spatial analysis highlighted several areas requiring further investigation to improve our understanding of the impacts of pheasant shooting on landscape or site ecology and biodiversity.
The absence of significant differences in plant, bird, or butterfly diversity suggests that either these biodiversity metrics are not sensitive enough to detect changes or that pheasant shooting has minimal impact on these taxa. Future studies should explore additional biodiversity indicators or more refined metrics.
While pheasant-managed sites showed greater hedgerow density and structural diversity, it remains unclear whether these features directly contribute to ecological benefits or simply reflect management preferences.
Longitudinal studies are needed to assess how sites managed for pheasant shooting influences habitat and biodiversity over time. For instance, possible association between the length of time a site has been managed for pheasant shooting could identify temporal effects in biodiversity outcomes that may not be apparent from studies which sample at a single point in time.
The methods used in this approach are transparent and reproducible. It would be possible to repeat this analysis on the same set of sites managed for pheasant shooting and comparison sites (or an updated set) at intervals of approximately ten years in order to check whether these associations between pheasant shooting and forest habitats persist through time. An interval of about ten years is recommended before a repeat study to allow forest to be able to change in response to management, and because of the time intervals between availability of public lidar data for Great Britain which would enable the hedgerow analysis to be repeated.
Ground reference data could be collected in some of the pheasant and comparison sites used in this study to verify the remote assessed estimates. Techniques such as forest plots could be used to measure species diversity of trees and structural diversity of vegetation, and bird plot counts and butterfly transects could be used to compare biodiversity estimates on the ground with estimates from large databases. The data extraction/coding sheet used in the literature review to categorise research papers can form the basis of a robust study design to collect primary data from sites managed for pheasant shooting and non-shooting sites. Whilst the lack of controlled studies that reported adequately details of biodiversity measures provides a challenge in drawing conclusions from the data it also provides an opportunity to take stock and set the research agenda to create a high-quality comparative data set going forward.
Improved data on pheasant shoots e.g. the number of pheasants, their densities, rearing and release conditions would provide greater ability to differentiate between different types of sites managed for pheasant shooting and analyse links between those variables and environmental conditions. This information would therefore complement activities to collect better data on biodiversity impacts.
5. Conclusions
This study has shown that sites managed for pheasant shooting exhibit higher hedgerow density and greater woodland structural diversity than comparable non-shooting sites, suggesting that certain management practices associated with pheasant shooting contribute positively to habitat structure. To enhance ecological outcomes further, targeted strategies are recommended across five areas. First, continued Government support for hedgerow management should prioritise structural complexity and connectivity to maximise biodiversity benefits. Second, although the remote sensing comparisons did not show a clear relationship between forest structural diversity and biodiversity outcomes, the systematic evidence evaluation contained some evidence that forest management could promote structural diversity through actions such as maintaining deadwood, diversifying the understory, and varying ride structure—measures beneficial to both game species and wider wildlife. Third, improved understanding of agricultural and forestry practices on pheasant-managed land is essential to interpret ecological outcomes more accurately. Fourth, we advocate for the development of a robust, repeatable monitoring framework that integrates remote sensing with field-based assessments. Such a framework would facilitate long-term tracking of biodiversity and habitat change, inform adaptive management, and strengthen the evidence base. Finally, greater investment in research and education—including partnerships with land managers will be crucial to addressing persistent knowledge gaps and embedding evidence-based approaches in land management. These recommendations offer a pathway to more ecologically informed management of sites used for pheasant shooting in the UK.
Supplementary Materials
The following supporting information can be downloaded at the website of this paper posted on Preprints.org, Systematic Evidence Evaluation Data File.
Author Contributions
For research articles with several authors, a short paragraph specifying their individual contributions must be provided. The following statements should be used “Conceptualization, PRL, LP, WJH, PO, MWJ, and GP; methodology, PRL, LP, WJH, and GP; validation, PRL, LP, WJH, PO, MWJ, and GP.; formal analysis, PRL, LP, WJH, and GP; investigation, PRL, LP, WJH, PO, MWJ, and GP; resources, LP, WJH, and GP; data curation, LP; writing—original draft preparation, PRL, LP, WJH, PO, MWJ, and GP; writing—review and editing, PRL, LP, WJH, PO, MWJ, and GP; visualization, PRL and LP; supervision, PRL and GP; project administration, WJH; funding acquisition, LP, WJH, and GP. All authors have read and agreed to the published version of the manuscript.”.
Funding
This research was funded by The British Association for Shooting and Conservation (BASC).
Data Availability Statement
We encourage all authors of articles published in MDPI journals to share their research data. In this section, please provide details regarding where data supporting reported results can be found, including links to publicly archived datasets analyzed or generated during the study. Where no new data were created, or where data is unavailable due to privacy or ethical restrictions, a statement is still required. Suggested Data Availability Statements are available in section “MDPI Research Data Policies” at https://www.mdpi.com/ethics.
Acknowledgments
The authors would like to thank.
Conflicts of Interest
The authors declare no conflicts of interest. Although this work was funded by BASC, a group with a vested interest in the results, the funders had no role in the design of the study; in the collection, analyses, or interpretation of data; in the writing of the manuscript; or in the decision to publish the results.
Abbreviations
The following abbreviations are used in this manuscript:
| AONB – Area of Outstanding Natural Beauty |
| BASC – British Association for Shooting and Conservation |
| BACI – Before-After-Control-Intervention |
| BTO – British Trust for Ornithology |
| EIA – Environmental Impact Assessment |
| EU – European Union |
| GBIF – Global Biodiversity Information Facility |
| IUCN – International Union for Conservation of Nature |
| JNCC – Joint Nature Conservation Committee |
| LD – Linear Dichroism |
| MPA – Marine Protected Area |
| NGO – Non-Governmental Organization |
| NVC – National Vegetation Classification |
| RSPB – Royal Society for the Protection of Birds |
| SAC – Special Area of Conservation |
| SPA – Special Protection Area |
| SSSI – Site of Special Scientific Interest |
| UK – United Kingdom |
| WWF – World Wide Fund for Nature |
Appendix A
Systematic Evidence Evaluation Protocol: Assessing the Quality and Quantity of Woodland and Hedgerow Habitats on Areas Managed for Shooting
There is growing concern over the ecological impacts of managing land for game shooting, specifically on the quality and quantity of woodland and hedgerow habitats. In the United Kingdom, private landowners are often incentivized to manage woodlands for shooting purposes, especially for species like pheasants. While habitat management can encourage positive conservation outcomes, certain practices such as pheasant release pens can potentially degrade woodland ecosystems. To date, the impacts on these habitats have not been comprehensively reviewed, and there is a lack of robust evidence to support or refute claims about the benefits and harms of land management for shooting.
This systematic evidence evaluation aims to address this gap by collating and assessing existing evidence related to woodland and hedgerow management in areas used for game shooting, particularly for pheasants. The review will inform a research project designed to develop a methodology using remote sensing technologies to assess the ecological impact of shooting activities over time, with a focus on woodland and hedgerow habitats at a landscape scale.
The review will address the following one key primary research question and two subquestions:
- What is the existing evidence on the impact of pheasant shooting management on the quality and quantity of woodland and hedgerow habitats in the UK?
- How do management practices, such as pheasant release pens, affect woodland ecology, including biodiversity and habitat composition?
- What woodland and hedgerow management activities can improve or enhance ecological impacts on areas used for pheasant shooting?
A PICO framework has been chosen to categorise the different aspects for both the primary and sub-questions (Table A1).

Table A1.
PICO framework.
| Component | Description |
|---|---|
| Population | Estates/land holdings with woodlands in the UK |
| Intervention | Pheasant shooting on the estate. |
| Comparator | Non-pheasant shooting site. |
| Outcome | Ecological impacts on habitat quality (e.g., biodiversity, species richness, habitat structure) and habitat quantity (e.g., extent of woodland and hedgerows). |
A comprehensive literature search of academic sources will be conducted following best practices outlined by Livoreil et al. [45]. Keywords will initially be identified from background documents and references provided in previous reports (including [1,4]). The search will be optimised to return the maximum amount of relevant literature with the minimum number of irrelevant items [46]. The optimised keywords and search terms will then be combined into boolean strings used to search each online bibliographic database The search will be run in the three main bibliographic databases and aggregators (Web of Science, CAB Abstracts, & SCOPUS). The search will be conducted in English only and will be geographically limited to the United Kingdom. There will be no date limitations on publications.
The proposed initial search terms to be used in the optimization process are:
(("Phasianus colchicus" or Pheasant* or shoot* or game) AND (wood* or forest or hedge or copse or "land manage*" or estate) AND (England OR Ireland OR Scotland OR Wales OR UK OR "United Kingdom"))
In addition to searching the academic literature databases, a multifaceted approach will be taken to identify and collect ‘grey literature’ (e.g. books, conferences, institution reports, government publications) including: (i) searching for ‘grey literature’ in the University of Oxford’s Bodleian library databases; (ii) ‘snowballing’ from relevant literature reviews (i.e. chasing articles not picked up in our searches from published extensive literature reviews).
Following searches in each of the bibliographic databases and aggregators, as well as results from the grey literature searches, articles will be uploaded into EndNote20, subscription reference management software published by Clarivate. Duplicate articles will be removed, and the resulting combined set of articles will be uploaded into Rayyan, a free natural-language processing tool that employs machine learning for screening articles for systematic evidence evaluation.
Articles will be screened for eligibility at two stages: (i) title and abstract assessment, and (ii) full-text assessment. Articles will be single-screened by three screeners. To check the consistency of screening at the title and abstract stage, sets of 50 articles will be screened by all screeners, and inter-rater agreement will be assessed using Cohen's kappa [47]. Differences in screening will be discussed among the screeners, and the process will be repeated with sets of 50 articles until a satisfactory level of agreement (>0.6) is reached. At the full-text screening stage, sets of two articles will similarly be assessed by all screeners until inter-rater agreement is achieved. Screeners will assess articles and make decisions about inclusion with reference to the inclusion and exclusion criteria.
Members of the project team will ensure consistency in decision-making amongst screeners using recognised consistency-checking techniques and discussions to resolve differences of interpretation of the strategy. At least 5% of articles will be assessed by multiple reviewers to ensure common understanding of the inclusion criteria and consistency of decisions to include or exclude articles in the evidence base [48].
Clear and explicit eligibility criteria to guide the selection of articles for inclusion in this systematic review have been developed below (Table A2). This will ensure that the review process is transparent, systematic, and as objective as possible. The criteria will be based on the Population, Intervention, Comparator, and Outcome (PICO) framework and aligned with the scope of the review, focusing on the ecological impacts of land managed for shooting on woodland and hedgerow habitats in the United Kingdom.
Table A2.
Inclusion and exclusion criteria.
| Category | Inclusion | Exclusion |
|---|---|---|
| Population: Woodland and Hedgerow Habitats in the UK | Studies focusing on ecological characteristics (e.g., biodiversity, structural composition, extent) of woodland and hedgerow habitats in the UK managed specifically for game shooting activities (specifically pheasant). | Studies focusing on non-UK habitats or areas where game shooting is not a central land management practice. Studies examining agricultural landscapes without substantial woodland or hedgerow components. |
| Intervention: Land Management Practices Associated with Game Shooting | Studies investigating specific land management practices for game shooting, such as pheasant release pens, woodland management for game species, or shooting-related interventions affecting woodland and hedgerow habitats. | Studies examining unrelated land management activities, such as purely agricultural practices or recreational land uses without a connection to shooting. |
| Comparator: Sites with Different Management Practices | Studies including comparisons with control sites where game shooting management is not conducted or where alternative land uses (e.g., conservation-only, agricultural without shooting) are implemented. | Studies without any form of comparator, including purely descriptive accounts of game shooting sites without comparison to non-shooting or differently managed sites. |
| Outcome: Ecological Impacts on Habitat Quality and Quantity | Studies assessing the impact of game shooting management on habitat quality (e.g., species richness, species abundance, community composition) or habitat quantity (e.g., extent of woodland or hedgerows) in the UK. | Studies focusing exclusively on economic, social, or non-ecological outcomes. Studies lacking an evaluation of woodland or hedgerow impacts on habitat quality. |
| Study Type: Qualitative and Empirical Studies | Qualitative and empirical studies, including peer-reviewed articles, reports, and grey literature (e.g., government reports, NGO publications) evaluating the impact of game shooting on woodland and hedgerow habitats. | Modelling studies using third party data, opinion pieces or anecdotal accounts without full methodological descriptions. |
Data from the included studies will be extracted and summarised in a standardised evidence table. In addition to metadata about the article (authors, title, date of publication, source, abstract) taken directly from the bibliographic databases, and study design details coded by the review team, information based on the PICO elements will be extracted by the review team. Geographic location data (latitude/longitude expressed in decimal degrees) will either be taken directly from the article or added by looking up the locations of place names mentioned in the article and assigning latitude and longitude coordinates. Articles that provide data for multiple interventions will be treated as separate "studies." Consistency among coders and data extractors will be assessed in the same way as for full-text article screening, and differences will be resolved through repeated discussions until agreement is reached.
Appendix B
All the species that were identified in the Systematic Evidence Evaluation set (Table B1) by the articles’ authors with their assessment of whether there was increased presence, decreased presence or no difference of species on sites managed for pheasant shooting vs non-shooting sites (Table B2).
Table B1.
Included Articles (multiple studies indicated).
| Article Number | Citation | Number of Studies |
| 1 | Robertson, P. A. and Woodburn, M. I. A. and Hill, D. A., 1988. The Effects Of Woodland Management For Pheasants On The Abundance Of Butterflies In Dorset, England. BIOLOGICAL CONSERVATION. 45(3), 159-167. 10.1016/0006-3207(88)90136-X | 1 |
| 2 | Sage, R. B. and Ludolf, C. and Robertson, P. A., 2005. The ground flora of ancient semi-natural woodlands in pheasant release pens in England. BIOLOGICAL CONSERVATION. 122(2), 243-252. 10.1016/j.biocon.2004.07.014 | 1 |
| 3 | Draycott, R. A. H. and Hoodless, A. N. and Sage, R. B., 2008. Effects of pheasant management on vegetation and birds in lowland woodlands. JOURNAL OF APPLIED ECOLOGY. 45(1), 334-341. 10.1111/j.1365-2664.2007.01379.x | 2 |
| 4 | Draycott, R. A. H. and Hoodless, A. N. and Cooke, M. and Sage, R. B., 2012. The influence of pheasant releasing and associated management on farmland hedgerows and birds in England. EUROPEAN JOURNAL OF WILDLIFE RESEARCH. 58(1), 227-234. 10.1007/s10344-011-0568-0 | 2 |
| 5 | Neumann, J. L. and Holloway, G. J. and Sage, R. B. and Hoodless, A. N., 2015. Releasing of pheasants for shooting in the UK alters woodland invertebrate communities. BIOLOGICAL CONSERVATION. 191, 50-59. 10.1016/j.biocon.2015.06.022 | 2 |
| 6 | Capstick, L. A. and Sage, R. B. and Hoodless, A., 2019. Ground flora recovery in disused pheasant pens is limited and affected by pheasant release density. BIOLOGICAL CONSERVATION. 231, 181-188. 10.1016/j.biocon.2018.12.020 | 1 |
| 7 | Madden, J. R. and Buckley, R. and Ratcliffe, S., 2023. Large-scale correlations between gamebird release and management and animal biodiversity metrics in lowland Great Britain. ECOLOGY AND EVOLUTION. 13(5). 10.1002/ece3.10059 | 1 |
| 8 | Capstick, L., Draycott, R., Wheelwright, C., Ling, D., Sage, R. & Hoodless, A, 2019. The effect of game management on the conservation value of woodland rides. Forest Ecology and Management. | 1 |
| 9 | Greenall, T., 2007. Management of gamebird shooting in lowland Britain: Social attitudes, biodiversity benefits and willingness-to-pay. PhD Thesis, University of Kent., 296 pp. https://kar.kent.ac.uk/86403/ | 3 |
| 10 | Hall, A., Sage, R. A., & Madden, J. R., 2021. The effects of released pheasants on invertebrate populations in and around woodland release sites. Ecology and Evolution. 11, 13559–13569. | 1 |
| 11 | Hoodless, A. N. & Draycott, K., 2006. Effects of pheasant management at woodland edges. The Game Conservancy Trust Review. 37, 30-31 | 1 |
| 12 | Hoodless, A. N., Lewis, R.,& Palmer, J., 2006. Songbird use of pheasant woods in winter. The Game Conservancy Trust Review. 37, 28-29 | 1 |
| 13 | Hoodless, A., & Draycott, R., 2007. Pheasant releasing and woodland rides. The Game Conservancy Trust Review. 38, 16-17 | 1 |
| 14 | Stoate, C., 2002. Multifunctional use of a natural resource on farmland: wild pheasant (Phasianus colchicus) management and the conservation of farmland passerines. Biodiversity and Conservation. 11, 561-573 | 1 |
| 15 | Pressland, C.L., 2009. The impact of releasing pheasants for shooting on invertebrates in british woodlands | 1 |
| 16 | Sage, R.B., 2017. Impacts of pheasant releasing for shooting on habitats and wildlife on the south Exmoor estates. Report, Game & Wildlife Conservation Trust | 1 |
| 17 | Sage, R. B. and Putaala, A. and Pradell-Ruiz, V. and Greenall, T. L. and Woodburn, M. I. A. and Draycott, R. A. H., 2003. Incubation success of released hand-reared pheasants Phasianus colchicus compared with wild ones. Wildlife Biology. 9(3), 179-184 | 1 |
| 18 | Sage, R. B. and Woodburn, M. I. A. and Draycott, R. A. H. and Hoodless, A. N. and Clarke, S., 2009. The flora and structure of farmland hedges and hedgebanks near to pheasant release pens compared with other hedges. BIOLOGICAL CONSERVATION. 142(7), 1362-1369. 10.1016/j.biocon.2009.01.034 | 1 |
| 19 | Aebischer, N. J. and Bailey, C. M. and Gibbons, D. W. and Morris, A. J. and Peach, W. J. and Stoate, C., 2016. Twenty years of local farmland bird conservation: the effects of management on avian abundance at two UK demonstration sites. BIRD STUDY. 63(1), 10-30. 10.1080/00063657.2015.1090391 | 1 |
| 20 | Sánchez-García, C. and Buner, F. D. and Aebischer, N. J., 2015. Supplementary winter food for gamebirds through feeders: Which species actually benefit?. JOURNAL OF WILDLIFE MANAGEMENT. 79(5), 832-845. 10.1002/jwmg.889 | 4 |
| 21 | Sage, R. and Woodburn, M. and McCready, S. and Coomes, J., 2024. Winter game crop plots for gamebirds retain hedgerow breeding songbirds in an improved grassland landscape. WILDLIFE BIOLOGY. 2024(3). 10.1002/wlb3.01156 | 1 |
| 22 | Blake, D., 1996. What effects do releasing pheasants have on the ground flora of woodland rides?. WPA News. 50, 11-14 | 1 |
| 23 | Swan, G. J., Bearhop, S., Redpath, S. M., Silk, M. J., Padfield, D., Goodwin, C. E., & McDonald, R. A., 2022. Associations between abundances of free-roaming gamebirds and common buzzards Buteo buteo are not driven by consumption of gamebirds in the buzzard breeding season. Ecology and Evolution. 12, e8877. https://doi.org/10.1002/ece3.8877 | 1 |
Table B2.
Heatmap of species listed by authors in individual studies, their conservation status, and whether the biodiversity measure(s) reported showed an increased presence, decreased presence, or no difference in sites managed for pheasant shooting vs non-shooting sites. Note: common names (including category names) are taken from the conservation sources.
| Species Studied | Common Name | Taxonomic Group | Status | Increased Presence | Decreased Presence | No Difference | Total | Article Number |
| Abax parallelepipedus | Ground Beetle | Aboveground Invertebrates | Non-Priority | 0 | 1 | 1 | 2 | 5 |
| Acupalpus meridianus | Ground Beetle | Aboveground Invertebrates | Non-Priority | 0 | 1 | 1 | 2 | 5 |
| Agonum marginatum | Ground Beetle | Aboveground Invertebrates | Non-Priority | 0 | 1 | 1 | 2 | 5 |
| Amara aenea | Ground Beetle | Aboveground Invertebrates | Non-Priority | 0 | 1 | 1 | 2 | 5 |
| Amarasimilata | Ground Beetle | Aboveground Invertebrates | Non-Priority | 0 | 1 | 1 | 2 | 5 |
| Asaphidion curtum | Ground Beetle | Aboveground Invertebrates | Non-Priority | 0 | 1 | 1 | 2 | 5 |
| Asaphidion flavipes | Ground Beetle | Aboveground Invertebrates | Non-Priority | 0 | 1 | 1 | 2 | 5 |
| Badister bipustulatus | Ground Beetle | Aboveground Invertebrates | Non-Priority | 0 | 1 | 1 | 2 | 5 |
| Bembidion harpaloides | Ground Beetle | Aboveground Invertebrates | Non-Priority | 0 | 1 | 1 | 2 | 5 |
| Bembidion lampros | Ground Beetle | Aboveground Invertebrates | Non-Priority | 0 | 1 | 1 | 2 | 5 |
| Bembidion obtusum | Ground Beetle | Aboveground Invertebrates | Non-Priority | 0 | 1 | 1 | 2 | 5 |
| Calathus fuscipes | Ground Beetle | Aboveground Invertebrates | Non-Priority | 0 | 1 | 1 | 2 | 5 |
| Calathus melanocephalus | Ground Beetle | Aboveground Invertebrates | Non-Priority | 0 | 1 | 1 | 2 | 5 |
| Calathus rotundicollis | Ground Beetle | Aboveground Invertebrates | Non-Priority | 0 | 1 | 1 | 2 | 5 |
| Carabus arvensis | Ground Beetle | Aboveground Invertebrates | Non-Priority | 0 | 1 | 1 | 2 | 5 |
| Carabus monilis | Necklace Ground Beetle | Aboveground Invertebrates | Priority Species | 0 | 1 | 1 | 2 | 5 |
| Carabus nemoralis | Ground Beetle | Aboveground Invertebrates | Non-Priority | 0 | 1 | 1 | 2 | 5 |
| Carabus problematicus | Ground Beetle | Aboveground Invertebrates | Non-Priority | 0 | 1 | 1 | 2 | 5 |
| Carabus violaceus | Violet Ground Beetle | Aboveground Invertebrates | Non-Priority | 0 | 1 | 1 | 2 | 5 |
| Clivina fossor | Ground Beetle | Aboveground Invertebrates | Non-Priority | 0 | 1 | 1 | 2 | 5 |
| Cychrus caraboides | Snail Hunter Beetle | Aboveground Invertebrates | Non-Priority | 0 | 1 | 1 | 2 | 5 |
| Dromius agilis | Agile Ground Beetle | Aboveground Invertebrates | Non-Priority | 0 | 1 | 1 | 2 | 5 |
| Harpalus latus | Ground Beetle | Aboveground Invertebrates | Non-Priority | 0 | 1 | 1 | 2 | 5 |
| Harpalus rufipes | Strawberry Seed Beetle | Aboveground Invertebrates | Non-Priority | 0 | 1 | 1 | 2 | 5 |
| Leistus ferrugineus | Ground Beetle | Aboveground Invertebrates | Non-Priority | 0 | 1 | 1 | 2 | 5 |
| Leistus fulvibarbis | Ground Beetle | Aboveground Invertebrates | Non-Priority | 0 | 1 | 1 | 2 | 5 |
| Leistus rufomarginatus | Ground Beetle | Aboveground Invertebrates | Non-Priority | 0 | 1 | 1 | 2 | 5 |
| Leistus spinibarbis | Ground Beetle | Aboveground Invertebrates | Non-Priority | 0 | 1 | 1 | 2 | 5 |
| Leistus terminatus | Ground Beetle | Aboveground Invertebrates | Non-Priority | 0 | 1 | 1 | 2 | 5 |
| Loricera pilicornis | Springtail Beetle | Aboveground Invertebrates | Non-Priority | 0 | 1 | 1 | 2 | 5 |
| Nebria brevicollis | Ground Beetle | Aboveground Invertebrates | Non-Priority | 0 | 1 | 1 | 2 | 5 |
| Nebria salina | Ground Beetle | Aboveground Invertebrates | Non-Priority | 0 | 1 | 1 | 2 | 5 |
| Notiophilus biguttatus | Two-spotted Ground Beetle | Aboveground Invertebrates | Non-Priority | 0 | 1 | 1 | 2 | 5 |
| Patrobus atrorufus | Ground Beetle | Aboveground Invertebrates | Non-Priority | 0 | 1 | 1 | 2 | 5 |
| Pieris napi | Green-veined White | Aboveground Invertebrates | Non-Priority | 2 | 0 | 0 | 2 | 1, 9 |
| Platynus assimilis | Ground Beetle | Aboveground Invertebrates | Non-Priority | 0 | 1 | 1 | 2 | 5 |
| Pterostichus cupreus | Ground Beetle | Aboveground Invertebrates | Non-Priority | 0 | 1 | 1 | 2 | 5 |
| Pterostichus diligens | Ground Beetle | Aboveground Invertebrates | Non-Priority | 0 | 1 | 1 | 2 | 5 |
| Pterostichus macer | Ground Beetle | Aboveground Invertebrates | Non-Priority | 0 | 1 | 1 | 2 | 5 |
| Pterostichus madidus | Black Clock Beetle | Aboveground Invertebrates | Non-Priority | 0 | 1 | 1 | 2 | 5 |
| Pterostichus melanarius | Black Ground Beetle | Aboveground Invertebrates | Non-Priority | 0 | 1 | 1 | 2 | 5 |
| Pterostichus minor | Ground Beetle | Aboveground Invertebrates | Non-Priority | 0 | 1 | 1 | 2 | 5 |
| Pterostichusniger | Large Black Ground Beetle | Aboveground Invertebrates | Non-Priority | 0 | 1 | 1 | 2 | 5 |
| Pterostichus nigrita | Ground Beetle | Aboveground Invertebrates | Non-Priority | 0 | 1 | 1 | 2 | 5 |
| Pterostichus oblongopunctatus | Ground Beetle | Aboveground Invertebrates | Non-Priority | 0 | 1 | 1 | 2 | 5 |
| Pterostichus strenuus | Ground Beetle | Aboveground Invertebrates | Non-Priority | 0 | 1 | 1 | 2 | 5 |
| Stomis pumicatus | Ground Beetle | Aboveground Invertebrates | Non-Priority | 0 | 1 | 1 | 2 | 5 |
| Synuchus vivalis | Ground Beetle | Aboveground Invertebrates | Non-Priority | 0 | 1 | 1 | 2 | 5 |
| Trechus obtusus | Ground Beetle | Aboveground Invertebrates | Non-Priority | 0 | 1 | 1 | 2 | 5 |
| Trechus quadristriatus | Ground Beetle | Aboveground Invertebrates | Non-Priority | 0 | 1 | 1 | 2 | 5 |
| Bombus lapidaries | Red-tailed Bumblebee | Aboveground Invertebrates | Non-Priority | 0 | 0 | 1 | 1 | 9 |
| Bombus lucorum | White-tailed Bumblebee | Aboveground Invertebrates | Non-Priority | 0 | 0 | 1 | 1 | 9 |
| Bombus pascuorum | Common Carder Bumblebee | Aboveground Invertebrates | Non-Priority | 0 | 0 | 1 | 1 | 9 |
| Bombus terrestris | Buff-tailed Bumblebee | Aboveground Invertebrates | Non-Priority | 0 | 0 | 1 | 1 | 9 |
| Maniola jurtina | Meadow Brown | Aboveground Invertebrates | Non-Priority | 1 | 0 | 0 | 1 | 9 |
| Pieris brassicae | Large White | Aboveground Invertebrates | Non-Priority | 1 | 0 | 0 | 1 | 9 |
| Pieris rapae | Small White | Aboveground Invertebrates | Non-Priority | 1 | 0 | 0 | 1 | 9 |
| Pica pica | Eurasian Magpie | Birds | Least Concern | 0 | 4 | 2 | 6 | 4, 7, 14 |
| Columba palumbus | Common Wood Pigeon | Birds | Bird-Amber | 3 | 0 | 2 | 5 | 3, 4, 12 |
| Phylloscopus trochilus | Willow Warbler | Birds | Bird-Amber | 3 | 0 | 2 | 5 | 3, 4, 14 |
| Regulus regulus | Goldcrest | Birds | Least Concern | 3 | 2 | 0 | 5 | 3, 4, 12 |
| Sylvia atricapilla | Blackcap | Birds | Least Concern | 3 | 0 | 2 | 5 | 3, 4, 14 |
| Sylvia communis | Common Whitethroat | Birds | Least Concern | 3 | 0 | 2 | 5 | 3, 4, 14 |
| Erithacus rubecula | European Robin | Birds | Least Concern | 1 | 0 | 3 | 4 | 4, 12, 14 |
| Fringilla coelebs | Chaffinch | Birds | Least Concern | 1 | 0 | 3 | 4 | 4, 12, 14 |
| Prunella modularis | Dunnock | Birds | Bird-Amber | 2 | 0 | 2 | 4 | 4, 12, 14 |
| Troglodytes troglodytes | Eurasian Wren | Birds | Bird-Amber | 1 | 1 | 2 | 4 | 4, 12, 14 |
| Carduelis cannabina | Common Linnet | Birds | Least Concern | 1 | 0 | 2 | 3 | 4, 14 |
| Carduelis carduelis | European Goldfinch | Birds | Least Concern | 1 | 0 | 2 | 3 | 4, 14 |
| Carduelis chloris | European Greenfinch | Birds | Least Concern | 1 | 0 | 2 | 3 | 4, 14 |
| Corvus corone | Carrion Crow | Birds | Least Concern | 0 | 3 | 0 | 3 | 4, 7 |
| Parus caeruleus | Eurasian Blue Tit | Birds | Least Concern | 1 | 0 | 2 | 3 | 4, 14 |
| Parus major | Great Tit | Birds | Least Concern | 0 | 1 | 2 | 3 | 4, 14 |
| Sylvia borin | Garden Warbler | Birds | Least Concern | 2 | 1 | 0 | 3 | 3, 14 |
| Turdus merula | Common Blackbird | Birds | Least Concern | 1 | 0 | 2 | 3 | 4, 14 |
| Aegithalos caudatus | Long-tailed Tit | Birds | Least Concern | 0 | 0 | 2 | 2 | 4 |
| Anthus trivialis | Tree Pipit | Birds | Bird-Red | 2 | 0 | 0 | 2 | 4 |
| Athene noctua | Little Owl | Birds | Least Concern | 2 | 0 | 0 | 2 | 4 |
| Corvus frugilegus | Rook | Birds | Bird-Amber | 2 | 0 | 0 | 2 | 4 |
| Dendrocopos major | Great Spotted Woodpecker | Birds | Least Concern | 0 | 2 | 0 | 2 | 4 |
| Emberiza citronella | Yellowhammer | Birds | Least Concern | 0 | 0 | 2 | 2 | 4 |
| Falco tinnunculus | Common Kestrel | Birds | Bird-Amber | 0 | 2 | 0 | 2 | 4 |
| Garrulus glandarius | Eurasian Jay | Birds | Least Concern | 2 | 0 | 0 | 2 | 4 |
| Hirundo rustica | Barn Swallow | Birds | Least Concern | 0 | 2 | 0 | 2 | 4 |
| Motacilla flava | Western Yellow Wagtail | Birds | Bird-Red | 2 | 0 | 0 | 2 | 4 |
| Perdix perdix | Grey Partridge | Birds | Bird-Red | 2 | 0 | 0 | 2 | 4 |
| Phylloscopus collybita | Common Chiffchaff | Birds | Least Concern | 2 | 0 | 0 | 2 | 3 |
| Picus viridis | European Green Woodpecker | Birds | Least Concern | 0 | 0 | 2 | 2 | 4 |
| Poecile palustris | Marsh Tit | Birds | Bird-Red | 2 | 0 | 0 | 2 | 4 |
| Pyrrhula pyrrhula | Eurasian Bullfinch | Birds | Bird-Amber | 0 | 0 | 2 | 2 | 4 |
| Sylvia curruca | Lesser Whitethroat | Birds | Least Concern | 2 | 0 | 0 | 2 | 4 |
| Turdus philomelus | Song Thrush | Birds | Least Concern | 2 | 0 | 0 | 2 | 4 |
| Alauda arvensis | Skylark | Birds | Bird-Red | 0 | 1 | 0 | 1 | 14 |
| Buteo buteo | Common Buzzard | Birds | Least Concern | 0 | 1 | 0 | 1 | 7 |
| Corvus monedula | Western Jackdaw | Birds | Least Concern | 1 | 0 | 0 | 1 | 14 |
| Emberiza citrinella | Yellowhammer | Birds | Bird-Red | 0 | 0 | 1 | 1 | 14 |
| Regulus ignicapilla | Firecrest | Birds | Least Concern | 1 | 0 | 0 | 1 | 12 |
| Sitta europaea | Eurasian Nuthatch | Birds | Least Concern | 1 | 0 | 0 | 1 | 12 |
| Sciurus carolinensis | Eastern Grey Squirrel | Mammals | Non-Priority | 1 | 0 | 0 | 1 | 7 |
| Vulpes vulpes | Red Fox | Mammals | Non-Priority | 0 | 1 | 0 | 1 | 7 |
| Hedera helix | Common Ivy | Vascular Plants | Non-Priority | 0 | 1 | 0 | 1 | 2 |
| Hyacinthoides non-scripta | English Bluebell | Vascular Plants | Non-Priority | 0 | 1 | 0 | 1 | 6 |
| Lamium galeobdolon | Yellow Archangel | Vascular Plants | Non-Priority | 0 | 1 | 0 | 1 | 6 |
| Mercurialis perennis | Dog's Mercury | Vascular Plants | Non-Priority | 0 | 1 | 0 | 1 | 2 |
| Rubus fruticosus | Blackberry | Vascular Plants | Non-Priority | 0 | 1 | 0 | 1 | 2 |
| Rumex obtusifolius | Broad-leaved Dock | Vascular Plants | Non-Priority | 1 | 0 | 0 | 1 | 13 |
| Tripleurospermum inodorum | Scentless Mayweed | Vascular Plants | Non-Priority | 1 | 0 | 0 | 1 | 13 |
| Urtica dioica | Stinging Nettle | Vascular Plants | Non-Priority | 1 | 0 | 0 | 1 | 13 |
Where authors used a common name (for example for a bird), we transformed to binomial nomenclature (Latin names) so that we could match species against standard lists that categorise the conservation status of species in the UK. Status for birds was taken from Birds of Conservation Concern (BOCC), commonly referred to as the UK Red List for birds, and for invertebrates, mammals, and vascular plants from Biodiversity Action Plan (BAP) UK priority species list. Where authors only reported biodiversity outcomes at a level higher than Genus (e.g. groups like ‘shrubs, Diptera, etc) their results are not included in this table but can be found in the Supplementary Materials.
An alternative to using the BOCC list would have been the IUCN list. Stanbury et al. [49] point out that there is a great deal of commonality between the two lists with populations regarded as ‘threatened’ on the IUCN list, all but seven are on the BOCC red or amber lists. One important difference between the two processes is that BoCC focuses on the current and past status, while IUCN focuses on current and likely future trends. Given the historical nature of data extracted through the systematic review, it seemed appropriate therefore to choose the BOCC list to analyse findings. BoCC also focuses on various conservation metrics and the ‘status’ of the species in the UK relative to the European population whereas IUCN focuses primarily on extinction risk.
References
- Mason, L.R., Bicknell, J.E., Smart, J. and Peach, W.J., 2020. The impacts of non-native gamebird release in the UK: an updated evidence review. Report 66. RSPB Centre Conserv Sci, Sandy, UK. https://www.researchgate.net/publication/345717757_The_impacts_of_non-native_gamebird_release_in_the_UK_an_updated_evidence_review (accessed 30/05/2025).
- Sage, R.B., Hoodless, A.N., Woodburn, M.I., Draycott, R.A., Madden, J.R. and Sotherton, N.W., 2020. Summary review and synthesis: Effects on habitats and wildlife of the release and management of pheasants and red-legged partridges on UK lowland shoots. Wildlife Biology, 2020(4), pp.1-12. [CrossRef]
- Bicknell, J., Smart, J., Hoccom, D., Amar, A., Evans, A., Walton, P., Knott, J. and Lodge, T., 2010. Impacts of non-native gamebird release in the UK: a review. Royal Society for the Protection of Birds, Bedfordshire.
- Madden, J.R. and Sage, R.B., 2020. Ecological consequences of gamebird releasing and management on lowland shoots in England. Natural England report.(NEER016) https://publications.naturalengland.org.uk/publication/5078605686374400 (accessed 30/05/2025).
- Madden, J.R., Buckley, R. and Ratcliffe, S., 2023. Large-scale correlations between gamebird release and management and animal biodiversity metrics in lowland Great Britain. Ecology and Evolution, 13(5), p.e10059. [CrossRef]
- Pullin, A.S., Cheng, S.H., Cooke, S.J., Haddaway, N.R., Macura, B., Mckinnon, M.C. and Taylor, J.J., 2020. Informing conservation decisions through evidence synthesis and communication. Conservation research, policy and practice, pp.114-28.
- Konno, K. and Pullin, A.S., 2020. Assessing the risk of bias in choice of search sources for environmental meta-analyses. Research Synthesis Methods, 11(5), pp.698-713. [CrossRef]
- Haddaway, N.R., Bernes, C., Jonsson, B.G. Hedlund, K. 2016. The benefits of systematic mapping to evidence-based environmental management. Ambio 45 (2016): 613-620. [CrossRef]
- Collins, A., Coughlin, D., Miller, J. and Kirk, S., 2015. The production of quick scoping reviews and rapid evidence assessments: A how to guide. https://nora.nerc.ac.uk/id/eprint/512448/ (accessed 30/05/2025).
- Farella M.M; Fisher J.B, Jiao W, Kely K.B, Barnes, M.L. 2022 Thermal remote sensing for plant ecology from leaf to globe. Journal of Ecology 00: 1-19. [CrossRef]
- Cavender-Bares, J., Schnieder, F.D., Santos, M.J., Armstrong, A., Carnaval, A., Dahlin, K.M., Fatoyinbo, L., Hurt, G.C., Schimel, D., Townsend, P.A., Ustin, S.L., Wang, Z., Wilson, A.M. 2022 Integrating remote sensing with ecology and evolution to advance biodiversity conservation. Nature Ecology and Evolution. [CrossRef]
- Schweiger, A.K., Laliberte, E. 2022 Plant beta-diversity across biomes captured by imaging spectroscopy. Nature Communications. 13: 2767. [CrossRef]
- Lines, E.R., Fischer, F.J., Foord Owen, H.J., Jucker, T. 2022 The shape of trees: reimagining forest ecology in three dimensions with remote sensing. Journal of Ecology 00: 1-16. [CrossRef]
- Potapov, P., Li, X., Hernandez-Serna, A., Tyukavina, A., Hansen, M., Kommareddy, A., Pickens, A., Turubanova, A., Tang, H., Silva, C.E., Armston, J., Dubayah, R., Blair, J.B., Hofton, M. 2020 Mapping global forest canopy height through integration of GEDI and Landsat data. Remote Sensing of Environment, 112165. [CrossRef]
- BASC, 2025. Green shoots mapping. Available online: https://basc.org.uk/conservation-in-action/green-shoots-mapping/ (accessed 30/05/2025).
- Office for National Statistics, 2025. Administrative geographies. Available online: https://www.google.com/url?q=https://www.ons.gov.uk/methodology/geography/ukgeographies/administrativegeography&sa=D&source=docs&ust=1748598873027847&usg=AOvVaw3a_Ai2BSGPWAOWIpHGtv05 (accessed 30/05/2025).
- HM Land Registry, 2021. Index polygons spatial data (INSPIRE). Available Online: https://use-land-property-data.service.gov.uk/datasets/inspire/download (accessed 30/05/2025).
- Registers of Scotland, 2025. Land Register of Scotland, Available online: https://www.ros.gov.uk/our-registers/land-register-of-scotland (accessed 30/05/2025).
- Ordnance Survey, 2025. OS Open Built Up Areas. Available online: https://www.ordnancesurvey.co.uk/products/os-open-built-up-areas (accessed 30/05/2025).
- Hansen, M.C. et al., 2013. High-Resolution Global Maps of 21st-Century Forest Cover Change. Science 342, 850-853. [CrossRef]
- Farr, T.G., et al. 2007. The Shuttle Radar Topography Mission, Rev. Geophys., 45, RG2004. [CrossRef]
- Ho, D., Imai, K., King, G. and Stuart, E.A., 2011. MatchIt: nonparametric preprocessing for parametric causal inference. Journal of statistical software, 42, pp.1-28. [CrossRef]
- Madden, J.R., Buckley, R. and Ratcliffe, S., 2023. Large-scale correlations between gamebird release and management and animal biodiversity metrics in lowland Great Britain. Ecology and Evolution, 13(5), p.e10059. [CrossRef]
- Santoro, M., Beer, C., Cartus, O., Schmullius, C., Shvidenko, A., McCallum, I., Wegmüller, U. and Wiesmann, A., 2011. Retrieval of growing stock volume in boreal forest using hyper-temporal series of Envisat ASAR ScanSAR backscatter measurements. Remote Sensing of Environment, 115(2), pp.490-507. [CrossRef]
- Scholefield, P.A., Morton, R.D., Rowland, C.S., Henrys, P.A., Howard, D.C. and Norton, L.R., 2016. Woody linear features framework, Great Britain v. 1.0. NERC Environmental Information Data Centre (Dataset).
- Oksanen, J., Simpson, G.L., Blanchet, F.G., Kindt, R., Legendre, P., Minchin, P.R., O'Hara, R.B., Solymos, P., Stevens, M.H.H., Szoecs, E. and Wagner, H., 2022. vegan: Community ecology package (2.6-4). CRAN.
- Macarthur R.H., & Wilson, E. O. (1967). The Theory of Island Biogeography. Princeton University Press. Available online: http://www.jstor.org/stable/j.ctt19cc1t2 (accessed 30/05/2025).
- Rosenzweig, M.L. 1995. Species diversity in space and time. Cambridge, UK: Cambridge University Press.
- Long, P.R., Benz, D., Macias-Fauria, M., Seddon, A.W.R., Holland, P.W.A., Martin, A.C., Hagemann, R., Frost, T.K., Simpson, A.C., Power, D.J., Slaymaker, M.A., Willis, K.J. 2017 LEFT – a web-based tool for the remote measurement and estimation of ecological value across global landscapes. Methods in Ecology and Evolution 9: 571-579.
- Draycott, R.A.H., Hoodless, A.N., Cooke, M., and Sage, R. B., 2012. The influence of pheasant releasing and associated management on farmland hedgerows and birds in England. EUROPEAN JOURNAL OF WILDLIFE RESEARCH. 58(1), 227-234. [CrossRef]
- Hoodless, A., & Draycott, R., 2007. Pheasant releasing and woodland rides. The Game Conservancy Trust Review. 38, 16-17.
- Stoate, C., 2002. Multifunctional use of a natural resource on farmland: wild pheasant (Phasianus colchicus) management and the conservation of farmland passerines. Biodiversity and Conservation. 11, 561-573. [CrossRef]
- Sage, R.B., 2018. Impacts of pheasant releasing for shooting on habitats and wildlife on the south Exmoor estates. Report, Game & Wildlife Conservation Trust.
- Robertson, P. A. and Woodburn, M. I. A. and Hill, D. A., 1988. The Effects Of Woodland Management For Pheasants On The Abundance Of Butterflies In Dorset, England. BIOLOGICAL CONSERVATION. 45(3), 159-167. [CrossRef]
- Draycott, R. A. H. and Hoodless, A. N. and Sage, R. B., 2008. Effects of pheasant management on vegetation and birds in lowland woodlands. JOURNAL OF APPLIED ECOLOGY. 45(1). [CrossRef]
- Hoodless, A. N., Lewis, R.,& Palmer, J., 2006. Songbird use of pheasant woods in winter. The Game Conservancy Trust Review. 37, 28-29.
- Hoodless, A. N. & Draycott, K., 2006. Effects of pheasant management at woodland edges. The Game Conservancy Trust Review. 37, 30-31.
- Greenall, T., 2007. Management of gamebird shooting in lowland Britain: Social attitudes, biodiversity benefits and willingness-to-pay. PhD Thesis, University of Kent., 296 pp. Available online: https://kar.kent.ac.uk/86403/ (accessed 30/05/2025).
- Hall, A., Sage, R. A., & Madden, J. R., 2021. The effects of released pheasants on invertebrate populations in and around woodland release sites. Ecology and Evolution. 11, 13559–13569.
- Sage, R. B. and Ludolf, C. and Robertson, P. A., 2005. The ground flora of ancient semi-natural woodlands in pheasant release pens in England. BIOLOGICAL CONSERVATION. 122(2), 243-252. [CrossRef]
- Neumann, J.L., Holloway, G.J., Sage, R.B. and Hoodless, A.N., 2015. Releasing of pheasants for shooting in the UK alters woodland invertebrate communities. BIOLOGICAL CONSERVATION. 191, 50-59.
- Capstick, L. A. and Sage, R. B. and Hoodless, A., 2019. Ground flora recovery in disused pheasant pens is limited and affected by pheasant release density. BIOLOGICAL CONSERVATION. [CrossRef]
- Capstick, L., Draycott, R., Wheelwright, C., Ling, D., Sage, R. & Hoodless, A, 2019. The effect of game management on the conservation value of woodland rides. Forest Ecology and Management. [CrossRef]
- Pressland, C.L., 2009. The impact of releasing pheasants for shooting on invertebrates in british woodlands.
- Livoreil, B., Glanville, J., Haddaway, N.R., Bayliss, H., Bethel, A., de Lachapelle, F.F., Robalino, S., Savilaakso, S., Zhou, W., Petrokofsky, G. and Frampton, G., 2017. Systematic searching for environmental evidence using multiple tools and sources. Environmental Evidence, 6(1), pp.1-14. [CrossRef]
- Päivinen, R., Petrokofsky, G., Harvey, W.J., Petrokofsky, L., Puttonen, P., Kangas, J., Mikkola, E., Byholm, L. and Käär, L., 2023. State of forest research in 2010s–a bibliographic study with special reference to Finland, Sweden and Austria. Scandinavian Journal of Forest Research, 38(1-2), 23-38.
- Altman, D.G. Mathematics for kappa. Pract. Stat. Med. Res. 1991, 1991, 406–407.
- Frampton, G.K., Livoreil, B. and Petrokofsky, G., 2017. Eligibility screening in evidence synthesis of environmental management topics. Environmental Evidence, 6, pp.1-13. 10.1186/s13750-017-0102-2.
- Stanbury, A., Eaton, M., Aebischer, N., Balmer, D., Brown, A., Douse, A., Lindley, P., McCulloch, N., Noble, D. and Win, I., 2021. The status of our bird populations: the fifth Birds of Conservation Concern in the United Kingdom, Channel Islands and Isle of Man and second IUCN Red List assessment of extinction risk for Great Britain. British Birds, 114, pp.723-747.
Figure 1.
Location of sites managed for pheasant shooting (‘pheasant sites’) and sites not used for shooting (‘comparison sites’) in the spatial analysis and matched shooting vs non-shooting sites in the systematic review.
Figure 1.
Location of sites managed for pheasant shooting (‘pheasant sites’) and sites not used for shooting (‘comparison sites’) in the spatial analysis and matched shooting vs non-shooting sites in the systematic review.
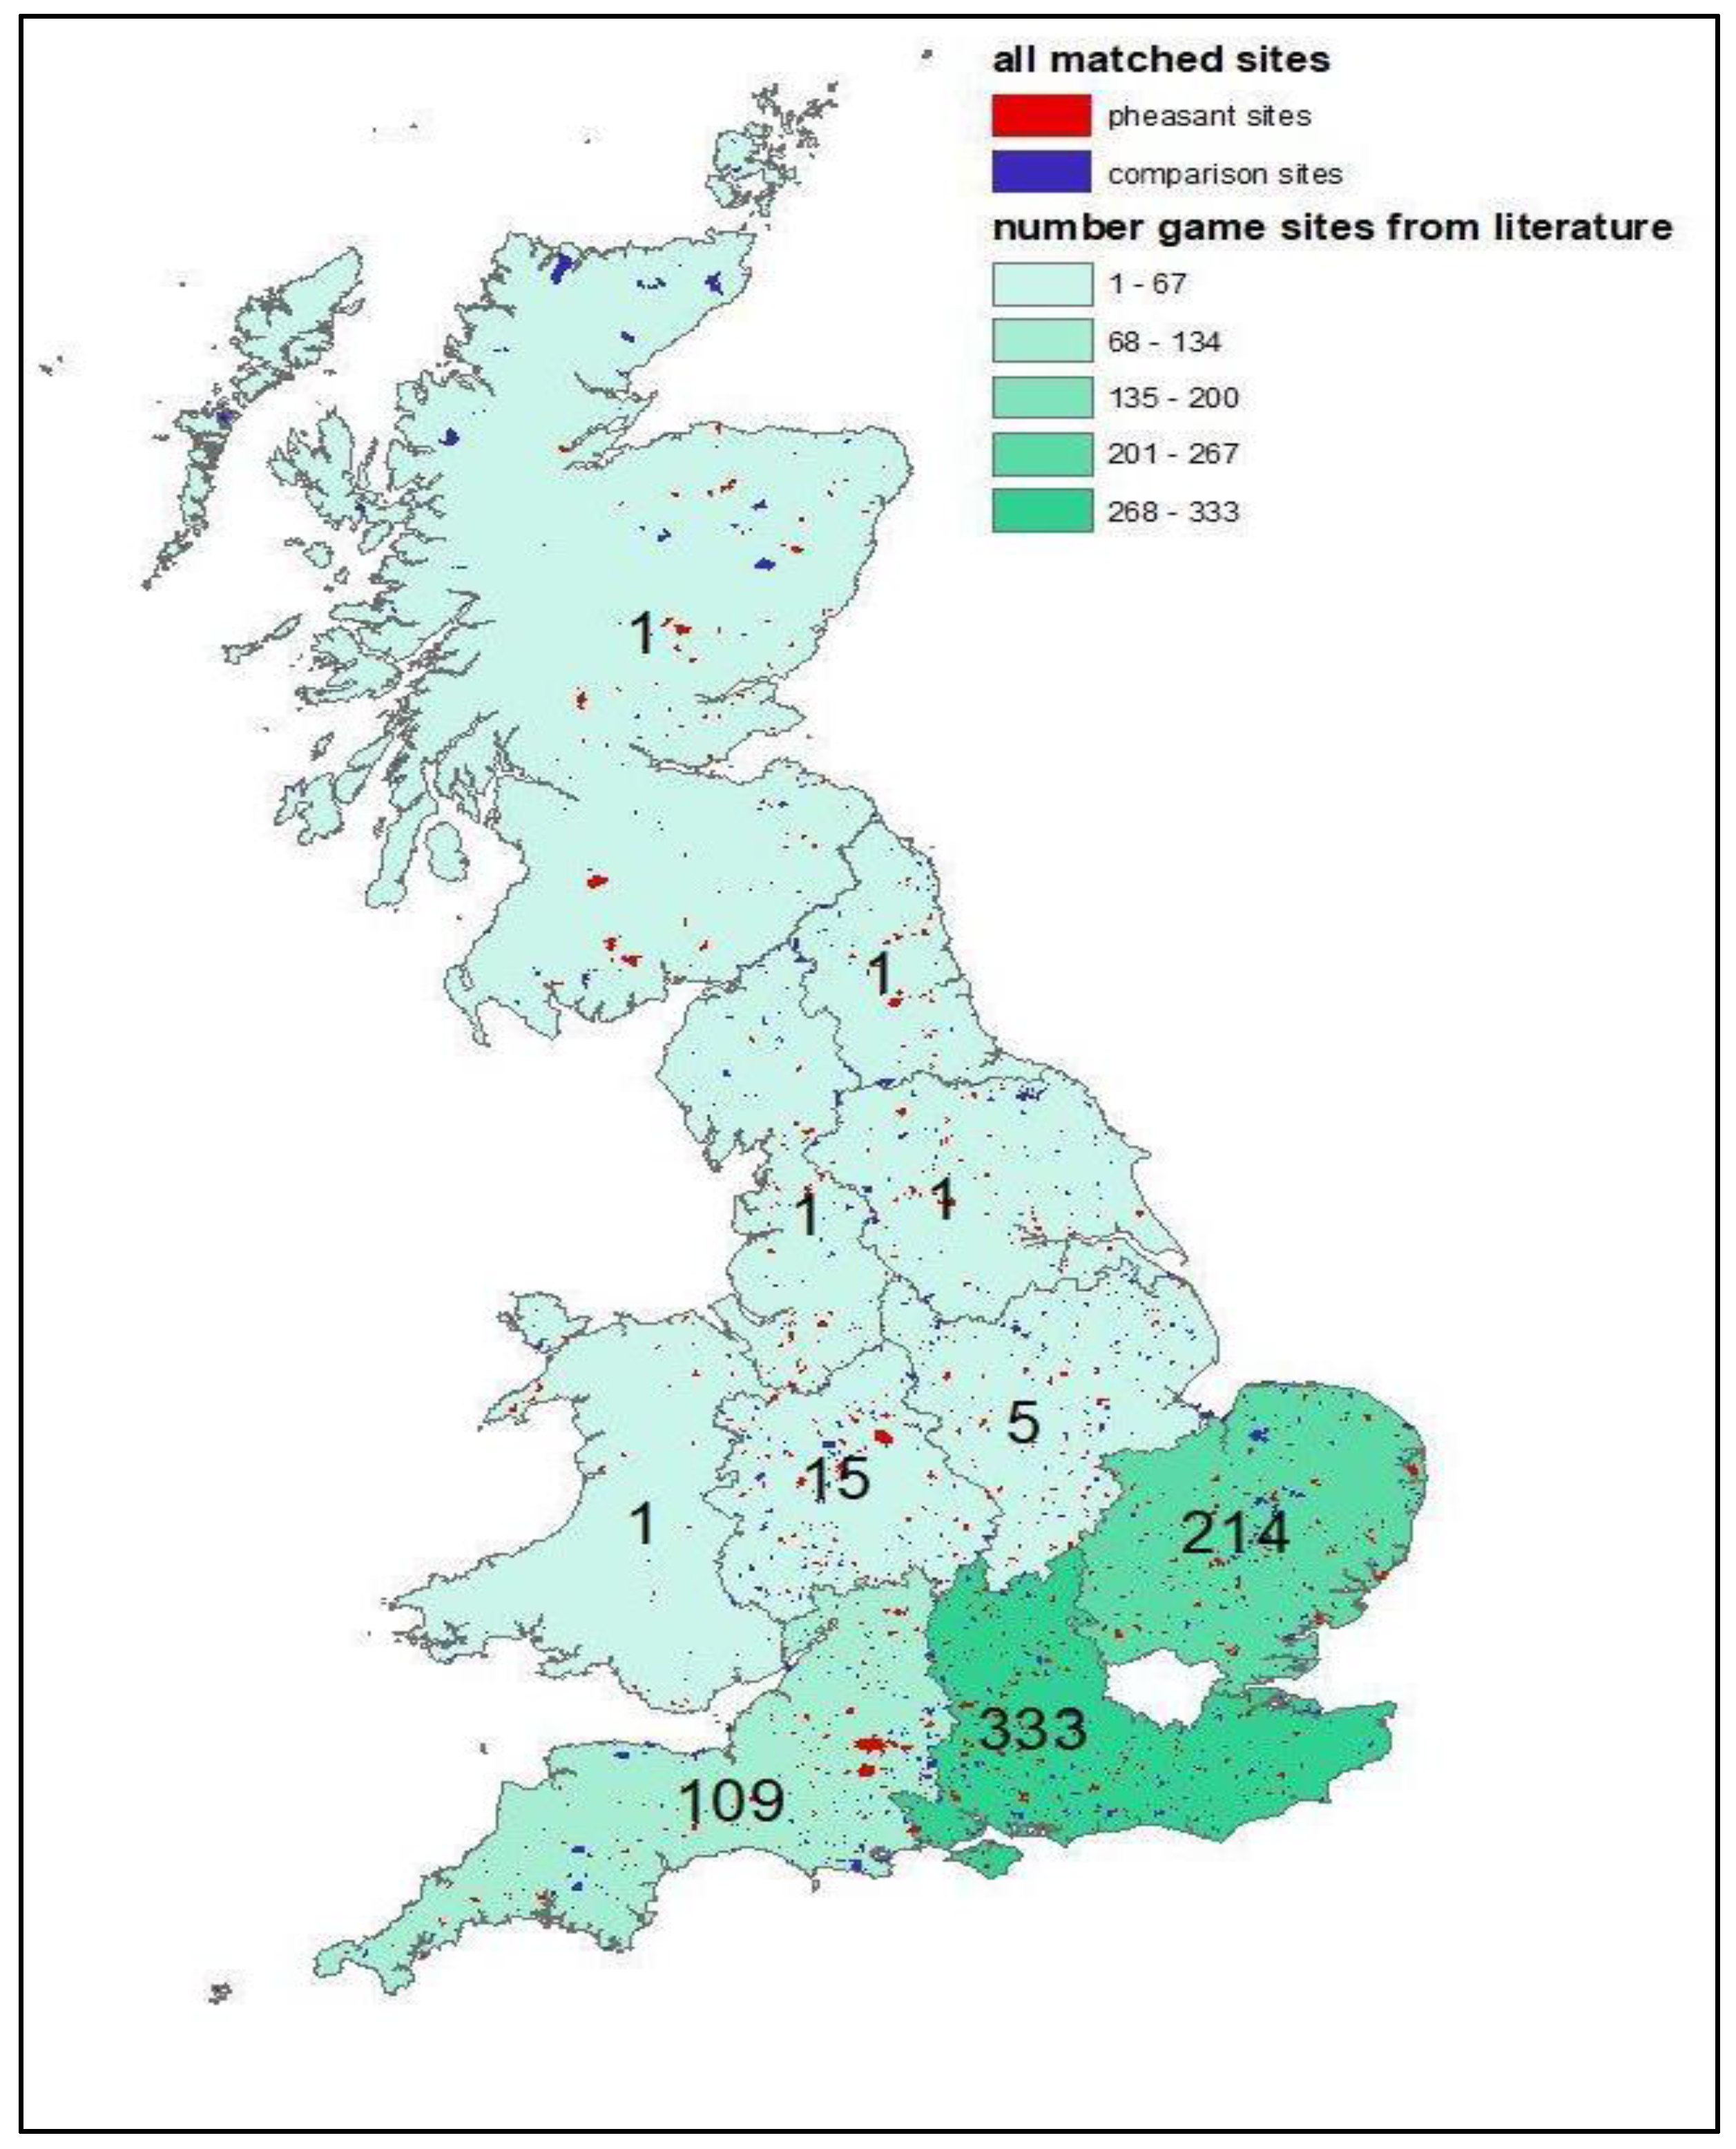
Figure 2.
Numbers of articles/studies retrieved through each evidence stream, numbers of inclusions and exclusions.
Figure 2.
Numbers of articles/studies retrieved through each evidence stream, numbers of inclusions and exclusions.
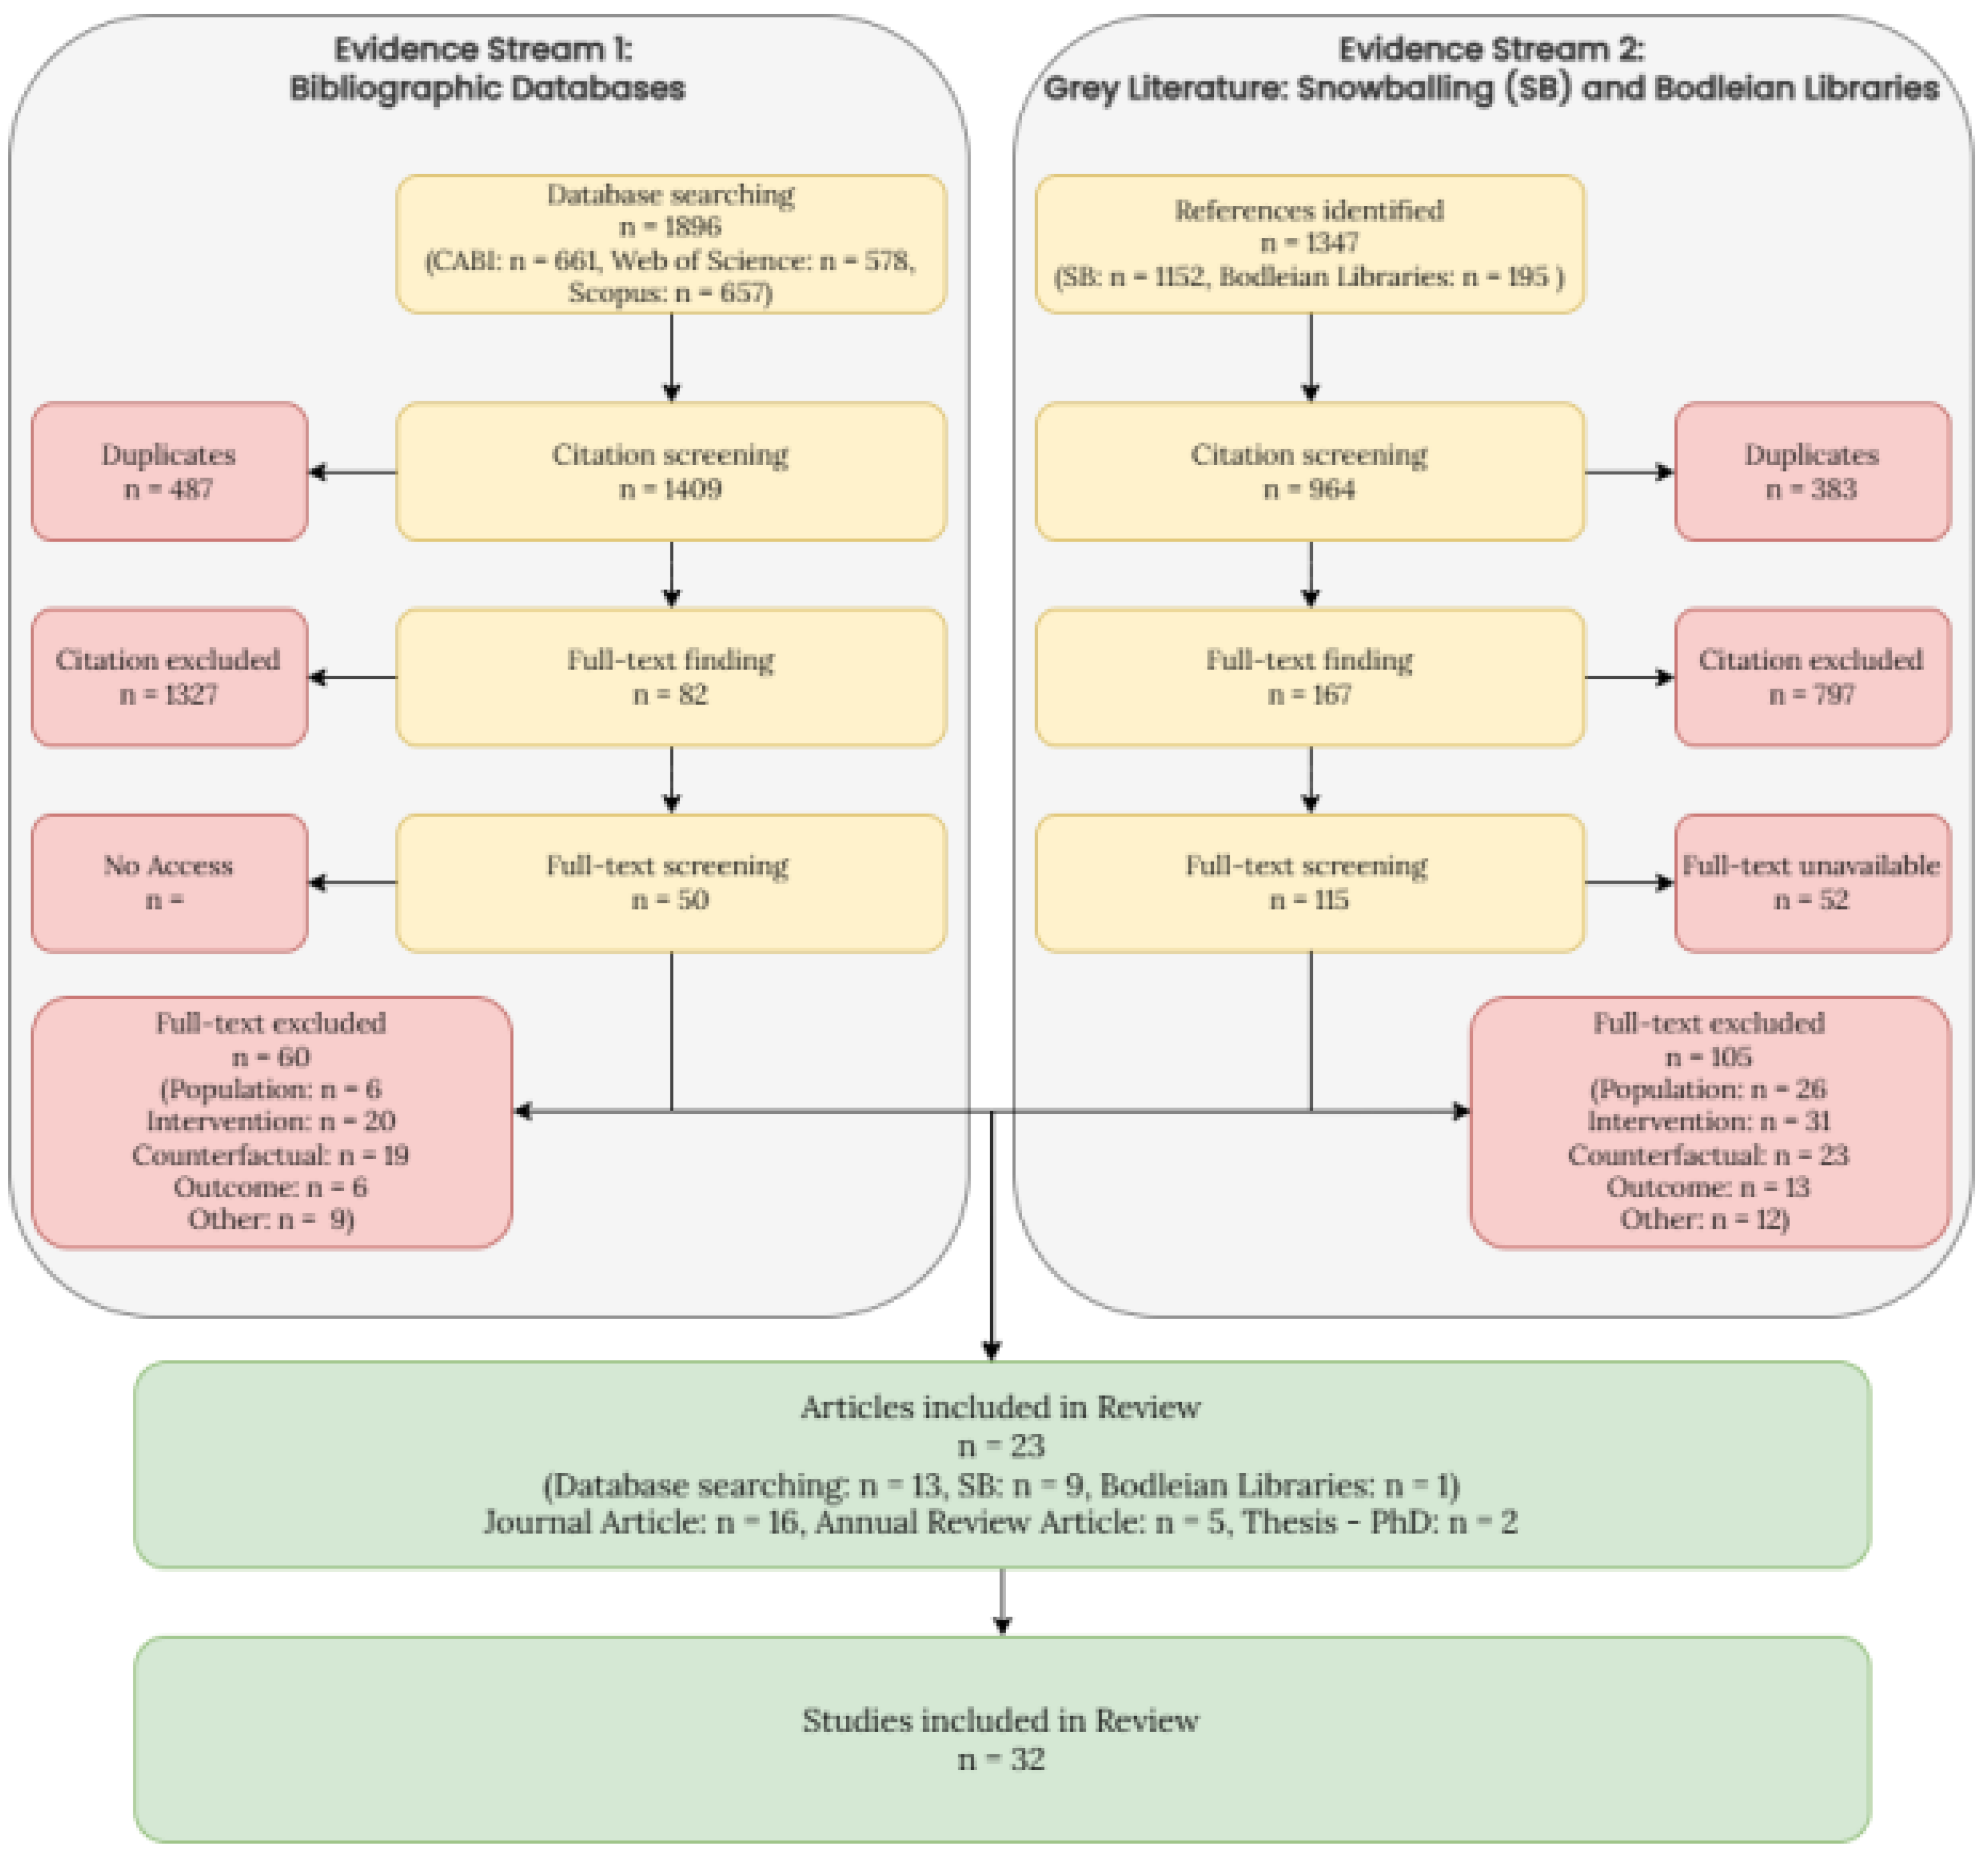
Figure 3.
Structural diversity of forest on sites managed for pheasant shooting and non-shooting sites.
Figure 3.
Structural diversity of forest on sites managed for pheasant shooting and non-shooting sites.
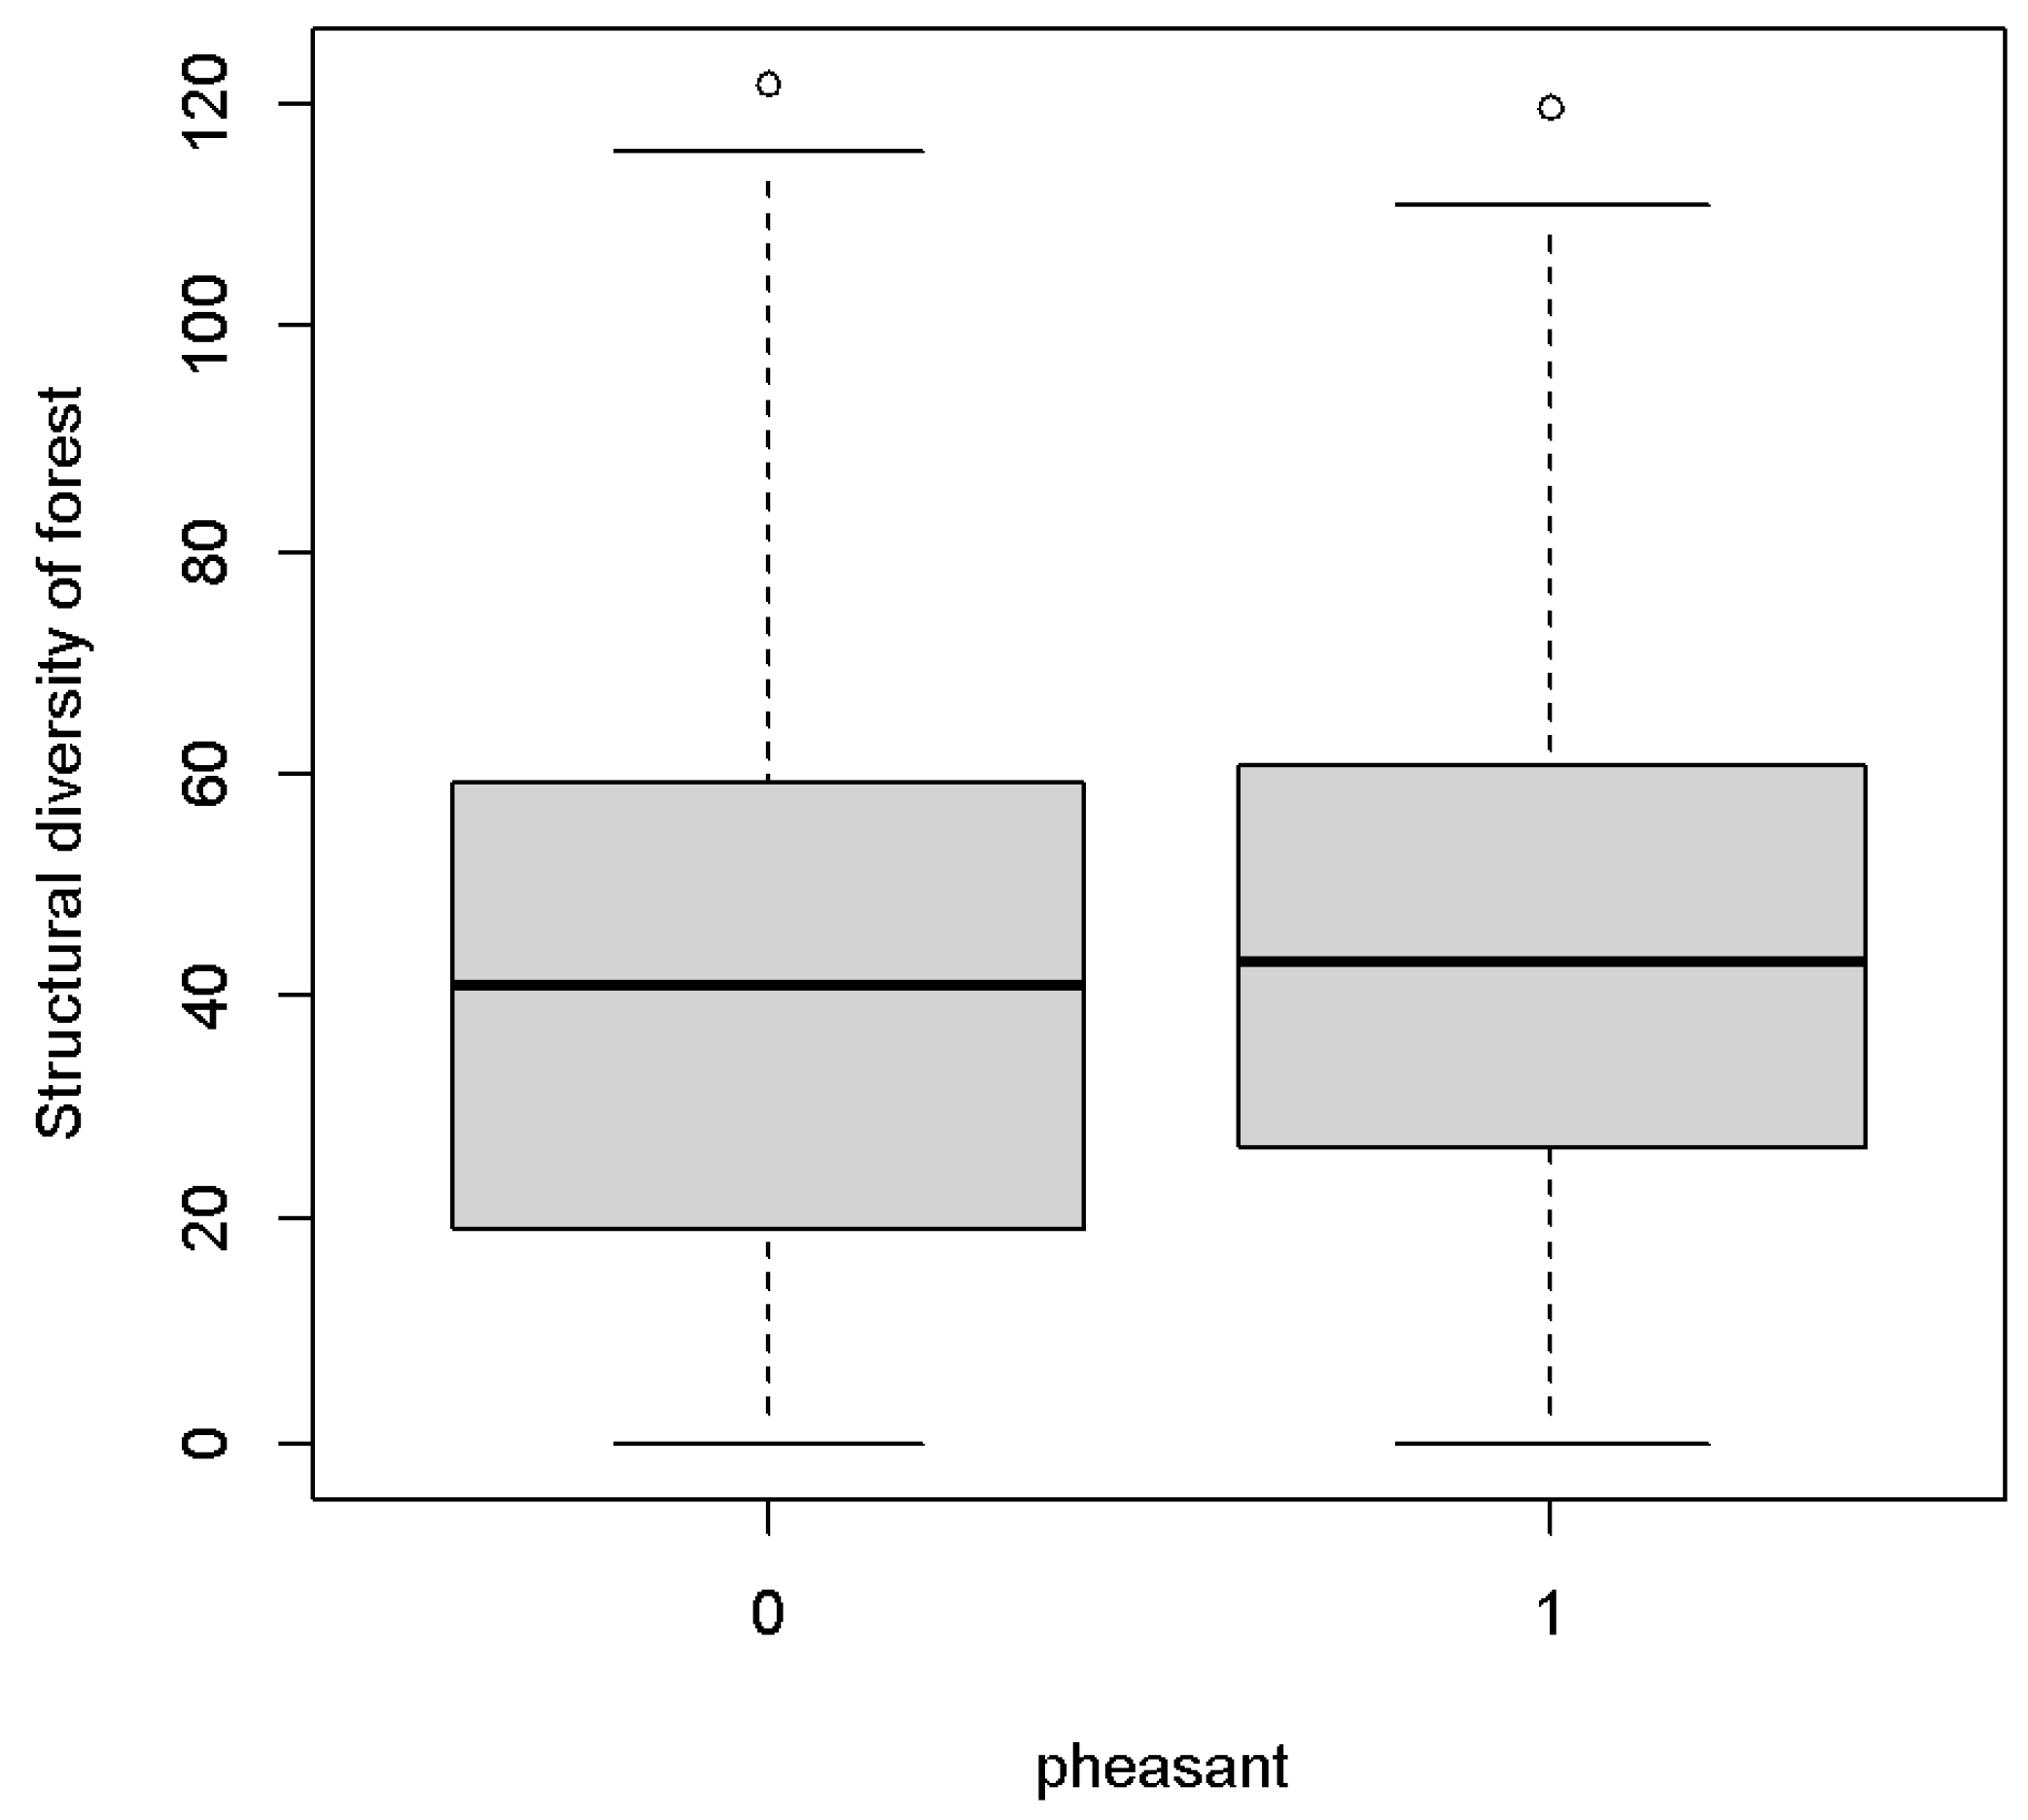
Figure 4.
Hedgerow density on sites managed for pheasant shooting and non-shooting sites.
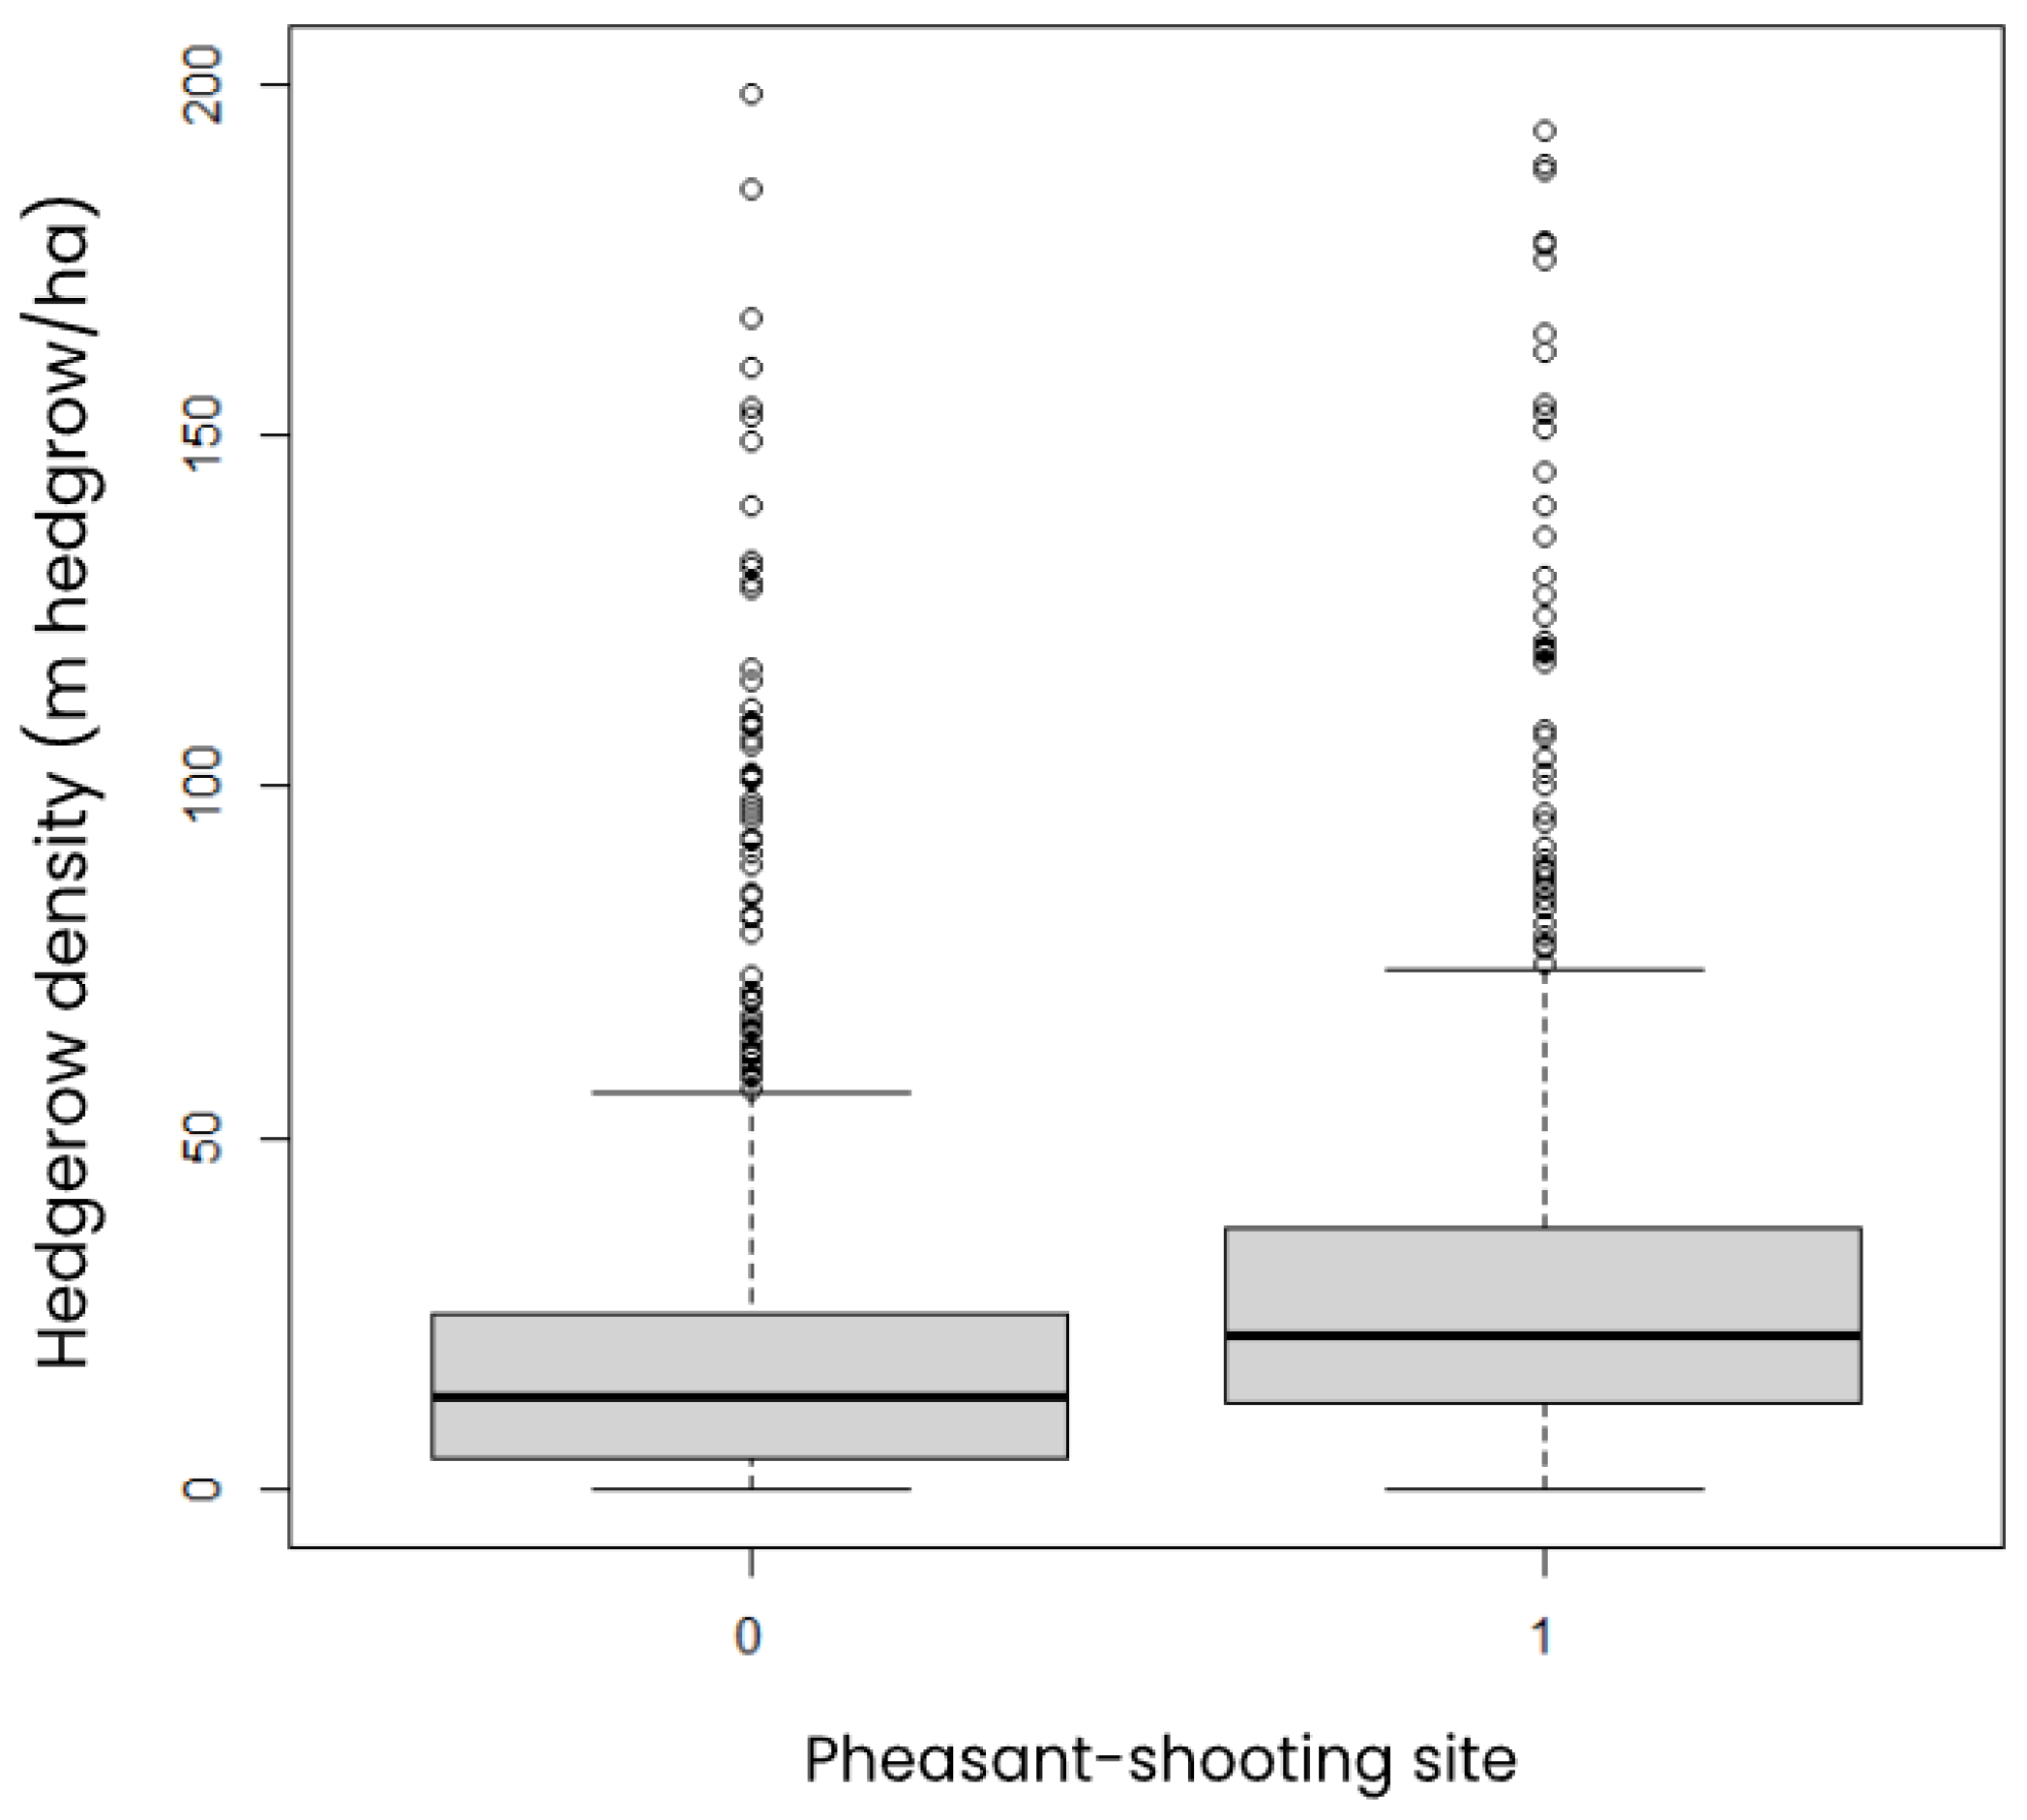
Table 1.
Shooting and comparator sites matched by ITL1 regions of England as used by the Office for National Statistics using three covariates: area (ha), elevation, and forest proportion in 2010.
Table 1.
Shooting and comparator sites matched by ITL1 regions of England as used by the Office for National Statistics using three covariates: area (ha), elevation, and forest proportion in 2010.
| Region | No. sites managed for shooting - Remote sensing | No. comparison sites - Remote sensing |
No. sites managed for shooting - Literature review | No. comparison sites - Literature review |
|---|---|---|---|---|
| East Midlands England | 117 | 117 | 5 | 5 |
| East of England | 152 | 152 | 214 | 119 |
| Northeast England | 42 | 42 | 1 | 1 |
| Northwest England | 79 | 79 | 1 | 1 |
| Scotland | 98 | 98 | 1 | 1 |
| Southeast England | 213 | 213 | 333 | 299 |
| Southwest England | 183 | 183 | 109 | 80 |
| Wales | 51 | 51 | 1 | 1 |
| West Midlands England | 118 | 118 | 15 | 15 |
| Yorkshire Humber England | 78 | 78 | 1 | 1 |
| Total | 1131 | 1131 | 681 | 523 |
Table 2.
Number of studies reporting different taxa (note several studies reported multiple taxonomic groups).
Table 2.
Number of studies reporting different taxa (note several studies reported multiple taxonomic groups).
| Taxonomic Groups Studied | Count of studies |
| Birds | 21 |
| Aboveground invertebrates | 10 |
| Vascular plants | 8 |
| Mammals | 6 |
| Soil invertebrates | 3 |
| Herptiles | 1 |
| Bryophytes | 1 |
| Non-vascular plants | 1 |
| Fungi | 0 |
Table 3.
Performance of the matching procedure. T tests for matching variables between sites managed for pheasant shooting (pheasant sites) and comparison sites by region. Bonferroni correction applied for 30 tests, (0.05/30 = 0.0016), alpha threshold for p is 0.0016. Significant values are indicated by *.
| Variable | Region | Mean pheasant sites | Mean comparison sites | t | p | n (each group) |
|---|---|---|---|---|---|---|
| Area (ha) | East Midlands England | 242 | 236 | -0.185 | 0.8526 | 117 |
| East of England | 254 | 254 | 0.0061 | 0.9951 | 152 | |
| Northeast England | 320 | 227 | -1.0544 | 0.2952 | 42 | |
| Northwest England | 295 | 146 | -2.6965 | 0.0077 | 79 | |
| Scotland | 495 | 335 | -1.5405 | 0.1251 | 98 | |
| Southeast England | 228 | 231 | 0.13319 | 0.8941 | 213 | |
| Southwest England | 277 | 207 | -1.1246 | 0.2618 | 183 | |
| Wales | 47 | 230 | -4.984 | 0.0001 * | 51 | |
| West Midlands England | 258 | 234 | -0.5002 | 0.6176 | 118 | |
| Yorkshire Humber England | 270 | 216 | -0.9042 | 0.3673 | 78 | |
| Elevation (m) | East Midlands England | 90 | 106 | 1.2901 | 0.1987 | 117 |
| East of England | 50 | 50 | 0.09639 | 0.9233 | 152 | |
| Northeast England | 142 | 143 | 0.037499 | 0.9702 | 42 | |
| Northwest England | 101 | 115 | 0.89397 | 0.3727 | 79 | |
| Scotland | 161 | 156 | -0.25507 | 0.799 | 98 | |
| Southeast England | 82 | 88 | 1.3539 | 0.1765 | 213 | |
| Southwest England | 115 | 120 | 0.59739 | 0.5507 | 183 | |
| Wales | 105 | 93 | -0.81658 | 0.4161 | 51 | |
| West Midlands England | 113 | 127 | 1.4657 | 0.1444 | 118 | |
| Yorkshire Humber England | 107 | 124 | 0.95971 | 0.3387 | 78 | |
| Forest 2010 (proportion) | East Midlands England | 0.08 | 0.13 | 2.0952 | 0.03732 | 117 |
| East of England | 0.08 | 0.08 | 0.09091 | 0.9276 | 152 | |
| Northeast England | 0.19 | 0.23 | 0.74704 | 0.4572 | 42 | |
| Northwest England | 0.14 | 0.27 | 3.7205 | 0.0002 * | 79 | |
| Scotland | 0.18 | 0.14 | -1.9579 | 0.051 | 98 | |
| Southeast England | 0.11 | 0.19 | 2.7658 | 0.00661 | 213 | |
| Southwest England | 0.15 | 0.25 | 3.7327 | 0.0002 * | 183 | |
| Wales | 0.15 | 0.3 | 3.3726 | 0.0011 * | 51 | |
| West Midlands England | 0.11 | 0.13 | 0.8982 | 0.37 | 118 | |
| Yorkshire Humber England | 0.11 | 0.19 | 2.7658 | 0.006 | 78 |
Disclaimer/Publisher’s Note: The statements, opinions and data contained in all publications are solely those of the individual author(s) and contributor(s) and not of MDPI and/or the editor(s). MDPI and/or the editor(s) disclaim responsibility for any injury to people or property resulting from any ideas, methods, instructions or products referred to in the content. |
© 2025 by the authors. Licensee MDPI, Basel, Switzerland. This article is an open access article distributed under the terms and conditions of the Creative Commons Attribution (CC BY) license (http://creativecommons.org/licenses/by/4.0/).
Copyright: This open access article is published under a Creative Commons CC BY 4.0 license, which permit the free download, distribution, and reuse, provided that the author and preprint are cited in any reuse.


