
Submitted:
02 June 2025
Posted:
03 June 2025
You are already at the latest version
Abstract
Understanding how thermal variability affects marine ectotherms is essential for predicting species resilience under climate change. We investigated the physiological responses of juvenile Nodipecten subnodosus (lion’s paw scallop), offspring of two genetically distinct populations (Bahía de Los Ángeles and Laguna Ojo de Liebre), reared under common garden conditions and exposed to three temperature regimes: constant, regular oscillation, and stochastic variability. After 15 days of exposure, scallops underwent an acute hyperthermia challenge. We measured metabolic rates, scope for growth (SFG), tissue biochemical composition, and oxidative stress markers (SOD, CAT, GPx, TBARS). No significant differences were detected between populations for most traits, suggesting phenotypic plasticity predominates over evolutionary divergence in thermal response. However, the temperature regime significantly influenced metabolic, biochemical and oxidative stress markers, indicating that scallops in variable conditions compensated through improved energy balance and food assimilation but also showed higher oxidative stress compared to the constant regime. Following acute hyperthermic exposure, energy demand escalated, compensatory mechanisms were impaired, and scallops attained a state of physiological maintenance and survival under stress, irrespective of their population or prior thermal regime exposure.
Keywords:
Phenotypic plasticity
; adaptive evolution
; acclimation
; hyperthermia
1. Introduction
As temperatures increase due to climate change, numerous organisms across various locations become closer to their upper thermal tolerance limits [1,2]. Extreme events like marine heatwaves and El Niño are happening more often and becoming stronger [3], which makes it more likely that temperatures will rise in some places to levels that could change ecosystems and processes like reproduction and growth during their occurrence [4]. Among marine species, most benthic marine invertebrates tend to be more susceptible to regional changes in temperature due to their inability to escape unfavorable conditions [2]. Their ability to deal with stress depends on their coping mechanisms (phenotypic plasticity), which could include metabolic depression, anaerobic energy production, and stress protection systems [5].
Phenotypic plasticity depends on the evolutionary background of populations (genetic adaptation) and the ecological experiences of individuals [6,7,8]. The contributions of these two components could significantly impact the future trajectories of populations and species. Grasping these factors is essential for predicting their vulnerability to different climate change scenarios. Even though it frequently presents significant challenges, a commonly employed method is the use of common garden experiments, which involves raising descendants from various populations (genetic) under uniform conditions (ecological). Moreover, to understand how organisms respond to environmental extremes and fluctuating temperatures linked to the ongoing climate change, experimental designs based on organisms exposed to constant temperatures are frequently insufficient [9,10,11,12], as determinations can reveal performance differences as compared to fluctuating temperatures such as daily oscillations [13,14]. Some evidence also suggests that different types of variability, such as regular oscillations vs. stochastic, unpredictable variability, may cause different responses in experimental organisms, even if the average and ranges of temperature are the same [13,14].
This study examines the two previously described issues by analyzing organisms from different populations (genetic component) that have grown in the same environment (ecological history) and are exposed to various temperature challenges. For these experiments, we used the lion's paw scallop, Nodipecten subnodosus (Sowerby, 1835), as a study model, given that its management in laboratory and basic culture conditions is relatively well known [15].
The lion's paw scallop is a highly appreciated fish product distributed along the Eastern Central Pacific, from Peru to Baja California, Mexico, where it sustained a regionally important artisanal fishery between 1990 and 2010 [16]. The Baja California fishery collapsed due to yet formally unknown reasons, and capture remains banned to this day. Within northwest Mexico, wild populations occur inside the major bays along the Baja California Peninsula, with genetic differences between those from the west (open Pacific Ocean) and east (Gulf of California) coasts [17]. As well as having different genes, organisms from both coasts have been shown to have different survival rates, growth rates, and heat tolerance in crossover field experiments [18,19]. Data suggests that the Gulf of California populations, which are exposed to higher temperatures and temperature variability amplitudes, are less vulnerable to abnormal warming events than those from the west coast. However, the experiments did not specifically assess the relative contribution of genetic adaptation and environmental conditions, nor did they look at how different modes of temperature variability affected the organism's performance.
2. Results
Only 2 of the 18 raw variables were normally distributed. After transformations, 12 variables were normally distributed and had homogenous variances (Table 1). An ANOVA for those 12 variables showed that the source of the population did not have a significant effect on any of the response variables, but the thermal regime (oscillatory, stochastic, and constant) did have a significant effect on eight variables, including the rates of respiration, ingestion, and assimilation; the scope for growth; the carbohydrate and total lipid levels in muscle; and the oxidative stress indicators SOD and CAT in muscle. The hyperthermia challenge also significantly affected the respiration rate, the scope for growth, and the levels of carbohydrates, total lipids, and CAT in muscle. Finally, significant interactions were also obtained between population and thermal variability regime for SOD in muscle and between thermal variability regime and hyperthermia challenge for carbohydrates and CAT in muscle. Regarding the variables that did not meet the ANOVA assumptions, Kruskal-Wallis analysis revealed a significant effect of the population only for carbohydrates in the mantle, while the thermal variability regime effect was significant on carbohydrates in mantle, GPX in muscle and mantle, and TBARS in muscle, and the thermal challenge on TBARS in muscle and CAT in mantle (Table 2).
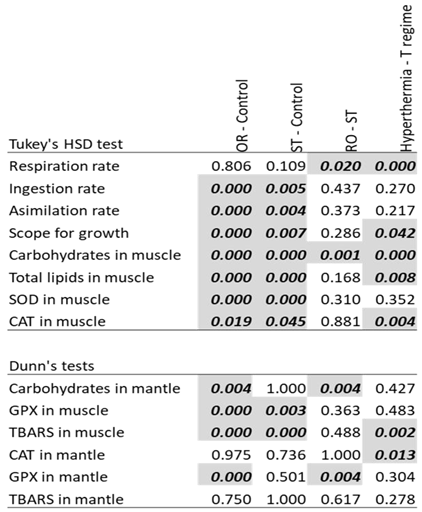
The post hoc pairwise comparisons, following ANOVA (Tukey’s HSD) or Kruskal-Wallis (Dunn), revealed significant differences between both variable thermal conditions (regular and stochastic) and the control (constant temperature) for ingestion and assimilation rates, the scope for growth, and carbohydrates, total lipids, SOD, CAT, GPx, and TBARS in muscle, and carbohydrates and GPX in mantle, while the comparison of the two thermal variable regimes (RO and ST) showed significant differences only in respiration rate, carbohydrates in muscle and in mantle and GPx in mantle (Table 3). However, as indicated previously by a significant interaction for SOD in muscle (Table 2) the effect of thermal variability regime was significant in fact only for the BLA population (not shown in Table 3, see Figure S1). For the acute hyperthermia challenge, significant differences were observed for respiration rate, scope for growth, carbohydrates, total lipids, TBARS in muscle and CAT in muscle and mantle (Table 3), although the interaction indicated that this effect was significant only for stochastic oscillation in the case of carbohydrates and for constant temperature in the case of CAT in muscle (See also Figure S1). The text continues here (Figure 2 and Table 2).
Figure 1 depicts the magnitude of the statistically significant differences in means between groups, as percentage, with panel a including the variables analyzed through ANOVA (Tukey’s HSD) and panel b those analyzed through Kruskal-Wallis (Dunn). For panel a (parametric), the major differences for all variables, except for respiration rate, occur between the regular oscillation and the constant temperature, being positive (bigger in the regular oscillation than in the constant temperature) for all except total lipids, where it is negative. The comparison of stochastic variability and the constant temperature follows the same pattern but with a slightly smaller magnitude. For the non-parametric groups, the largest differences also occur between both variability regimes (regular and stochastic) and the constant temperature, as large positive values in TBARS and GPx in muscle and small negative values in carbohydrates and GPx in mantle (only for regular oscillation vs constant). In contrast, the comparison between the regular and stochastic regimes shows only small negative values for respiration rate and carbohydrates in mantle, and positive values for carbohydrates in muscle and GPx in mantle. The acute hyperthermia challenge shows a relatively modest positive effect in respiration rate, total lipids, CAT, and TBARS in muscle, and negative for scope for growth, carbohydrates in muscle and CAT in mantle.
3. Discussion
In this study, young lion's paw scallops from different genetic backgrounds, but raised in the same environment, were exposed to different temperature regimes for 15 days and then exposed to hyperthermia for 17 hours. The responses were measured through metabolic rates, biochemical composition of tissues, and proxies of oxidative stress to explore three main questions: How adaptive evolution and environmental growing conditions influenced the animal's responses; how the thermal regime (constant, regular oscillations, and stochastic variability) affected the organism's performance; and how well the groups responded to an acute hyperthermia challenge after having been exposed to the different thermal regimes.
Regarding the first question, we found that most traits were unaffected by the geographical origin of the broodstock from which the experimental organisms were produced (called population for practical purposes in this work).
Prior studies indicated that mitochondrial DNA analyses reveal the Ojo de Liebre group is genetically distinct from scallops found in various locations within the Gulf of California, including Bahía de Los Angeles, likely due to approximately 5 million years of geographical isolation, coinciding with the formation of the Gulf of California [17]. At the ecological time scale, laboratory-determined optimal and critical temperatures point to the idea that different growth performance of Pacific and Gulf of California lion's paw scallop populations might be influenced by differences in their environments, especially because the Gulf is warmer and has a stronger seasonal amplitude [37]. Moreover, on site aquaculture studies comparing both populations and their reciprocal transplants indicate a higher performance of the Gulf of California population in terms of growth and survival [18] and net growth efficiency [19]. Together, this evidence suggests that fitness differences among populations are linked to their evolutive history.
In contrast, we present evidence that, based on our experimental design, there is no distinction across populations in 17 out of 18 assessed variables, which we take as indicative of the absence of evolutionary changes in physiological performance. We contend that, as acknowledged by the authors of previous field studies granting the gulf population a relative superiority over the Pacific one in terms of growth [18] or energy conservation [19], food availability could be playing a major role in shaping the performance differences. Similar results of an apparent higher adaptive capacity of a Gulf of California scallop population with respect to the Pacific coast have been reported for the catarina scallop (Argopecten ventricosus), and attributed to the combination of thermal stress, due to higher absolute temperatures and higher variability, and lower food availability [38,39]. Indeed, the major differences in several traits (growth, survival, SFG, and reproductive performance) between Pacific and Gulf populations of N. subnodosus [18,19] and A. ventricosus [38,39] were observed when grown at the Gulf sites, where unfavorable thermal conditions combined with limited food.
In our laboratory-based study, food was provided ad libitum and never conditioned the performance, which we believe allowed us to better detect the lack of evolutionary differences in temperature-driven performance.
A second important observation, associated with how the thermal regime affected the performance, was the strong effect of the temperature variability with respect to the constant temperature, independently of the variability pattern (regular or stochastic). Only four indicators showed significant differences between the regular and the stochastic variability challenges, including a 5% higher RR for the stochastic variability as compared to the regular oscillation regime and, also, modest differences in carbohydrates in muscle and mantle, and GPx in mantle. By far, the major differences occurred between both modes of temperature variability and the constant temperature. Compared to constant conditions, ectotherms exposed to variable thermal regimes may grow and survive more readily [40] and acquire wider physiological plasticity [41]. We observed that the free energy beyond the basal maintenance, as indicated by the SFG, was higher in individuals exposed to variable temperatures than in those maintained at constant conditions, indicating that thermal variability is a more favorable condition than the constant temperature. Our results are supported by a previous report by Sicard-González [42], who measured a 15% to 20% higher SFG in organisms under an oscillatory temperature regime than those under constant conditions. However, while Sicard-González [42] found that the higher SFG under variable temperature was associated with a 10% higher RR, we found no significant difference in RR rate and, instead, we associate the increase in SFG solely with increased feeding and digestive/absorption efficiency.
In addition to the energy balance, the levels of reserves were also affected, as revealed by higher levels of carbohydrates and lower levels of lipids in muscle of scallops exposed to both thermal variability regimes. The higher carbohydrate content probably resulted from the higher food assimilation. In contrast, the decreased concentration of muscle lipids, that are mainly represented by structural phospholipids and only to a minor extent by energy-reserve triglycerides [43,44] could be more related to membrane homeoviscous compensatory mechanisms involving structural rearrangement of phospholipids and fatty acids classes [45,46,47]. Further research measuring intra and inter tissular lipids turnover and comparing constant conditions with thermal variability in addition to decreasing and increasing temperatures may shed light on this mechanism.
A seemingly contradictory observation comes from the increased antioxidant enzyme activity (SOD, CAT and GPx) and oxidative stress levels (TBARS) in muscle under both regular oscillation (RO) and stochastic (ST) thermal regimes, compared to those maintained at constant temperature (CT). In particular, the TBARS indicates that the production of reactive oxidative species (ROS) under thermal variability was not neutralized by endogenous antioxidant capacity, as lipid damage was observed at the end of 15 days exposure to the thermal regimes. Several studies on bivalves have shown that gradual or abrupt changes in water temperature induce oxidative stress responses and antioxidant enzyme activity or RNA expression [48,49,50]. Based on survival rates and oxidative stress indicators in hemocytes, Rhaman et al. [51] reported that organisms less exposed to temperature shifts, such as subtidal mussel (Mytilus galloprovincialis) and sand-burried cokle (Katelysia rhytiphora), showed higher thermal tolerance, with antioxidant enzyme activity responding to higher stress thresholds, than the intertidal oyster (Crassostrea gigas). Given the ecological niche of Nodipecten subnodosus at relatively deep waters [18] it is not surprising that high temperature variability affected the experimental organisms. Unfortunately, studies exploring the effects of variable temperatures in marine mollusks have been focused on intertidal species [52], which are not readily comparable to our case study.
Although we observed no significant differences in the whole organism RR between variable and constant thermal regimes at the end of the 15-days day-trial, it seems likely that the frequent exposure to stressing thermal conditions occurring daily under both regular and stochastic variability regimes caused increases the oxygen consumption at the tissular level, especially in metabolically active tissues such as muscle, resulting in peaks of ROS production. Similar tissue-specific responses to those observed in our experiment (muscle but not mantle) have already been reported in previous studies [49], occurring not only after temperature increases, but also decreases [50], both replicated in our variable temperature regimes.
Based on metabolic balance and tissular composition indicators, we post that, overall, the performance of the lions’ paw scallop is better under variable temperature than under constant thermal conditions, although an oxidative stress was present. During the 15 days exposure, temperature periodically reached temperatures of 17 and 25°C [53], which are probably closer to the pejus levels than to the physiological optima. We propose that further studies where oxidative stress activity is evaluated under a narrower, less extreme thermal variability range, and for longer periods than that of our trial, are necessary to ultimately prove that variable thermal conditions are better for the species than staying constant near the physiological optima.
Regarding the response to an acute hyperthermia challenge after having been exposed to the different thermal regimes, we observed a significant effect of the hyperthermia challenge in seven of the indicators, but only in two variables there is an interactive effect of the hyperthermia challenge and the thermal regime from which the organisms where previously exposed, suggesting that the acclimation conditions did not substantially affected the response capacity to acute hyperthermia.
An increase in RR was observed after the exposure to hyperthermia, as previously documented after a thermal increase ramp experiment for the same species [54] and for other marine ectotherms [55 and references therein]. Likely, this change in RR caused a concomitant decrease in the SFG, which fits with the general assumption that energy is reallocated from conservation to compensation (i.e. growth vs maintenance) when individuals are facing a stressful condition, such as pejus temperature [56]. Although, it is difficult to extrapolate SFG to real growth within such a short period of time (17 h), 28°c is clearly considered within the pejus interval of the temperature range for the species [37].
The observed increase in metabolism points to an enhanced catabolic pathways activity to produce energy, which coincides with the observed use of carbohydrates reserves. However, this compensates only partially for the ATP, energy charge, and arginine phosphate decrease that occur under the hyperthermia [54,57].
We observed an increase in total lipids levels in muscle after the acute exposure to hyperthermia. Marine invertebrates have been shown to synthesize lipids de novo (lipogenesis) from carbohydrates, adjusting fatty acid profiles in response to environmental temperature shifts [45,47,58]. This process supports the formation of both membrane and storage lipids and is considered an adaptive trait in ectothermic species due to their thermal sensitivity. Our findings in juvenile N. subnudosus under hyperthermic conditions corroborate this, revealing a significantly greater increase in total muscle lipids. Yoon et al. [58] suggest that glucose for this de novo lipids synthesis derives from stored carbohydrates in the same tissue, also consistent with our observation of an approximate 25% reduction in carbohydrate levels in muscle. Another potential explanation involves the mobilization of lipids from the digestive gland, as a lipid reserve tissue [59], to the muscle, to satisfy its metabolic demand. Unfortunately, lipids classes and fatty acids across different tissues, which could help at documenting such mechanism, were not measured in the present work.
Under heat stress conditions, as a direct consequence of increased tissue oxygen consumption and enhanced ATP production to meet heightened energy demands, the observed changes in CAT in muscle, together with a significant increase in TBARS, are in line with the increase of ROS and consequent uncompensated lipid damage produced by acute increase of temperature [48,49,50]. This also aligns with findings in A. irradians [60], where increased enzyme activity to mitigate stress proves insufficient to reduce H2O2 at high temperature, revealing a limit to the antioxidant capacity. A significant interaction for hyperthermia and the thermal regime was registered for CAT in muscle, but apparently mostly linked to scallops coming from the constant temperature regime, a pattern also observed for TBARS in muscle (Supplementary Figure S1). In other words, under baseline conditions of constant temperature, oxidative stress is minimal but increased with exposure to hyperthermia, while for the organisms coming from the temperature variable regimes, an effect if acclimation seems to exist which is well known to decrease thermal sensitivity [61].
4. Materials and Methods
4.1. Source Organisms and Experimental Design
To separate the effect of the growth site conditions from the genetic factor (source population) on individual performance, this study used juvenile organisms of N. subnodosus born in the laboratory as the offspring of adults from two genetically different populations [17] and then raised in the same environment.
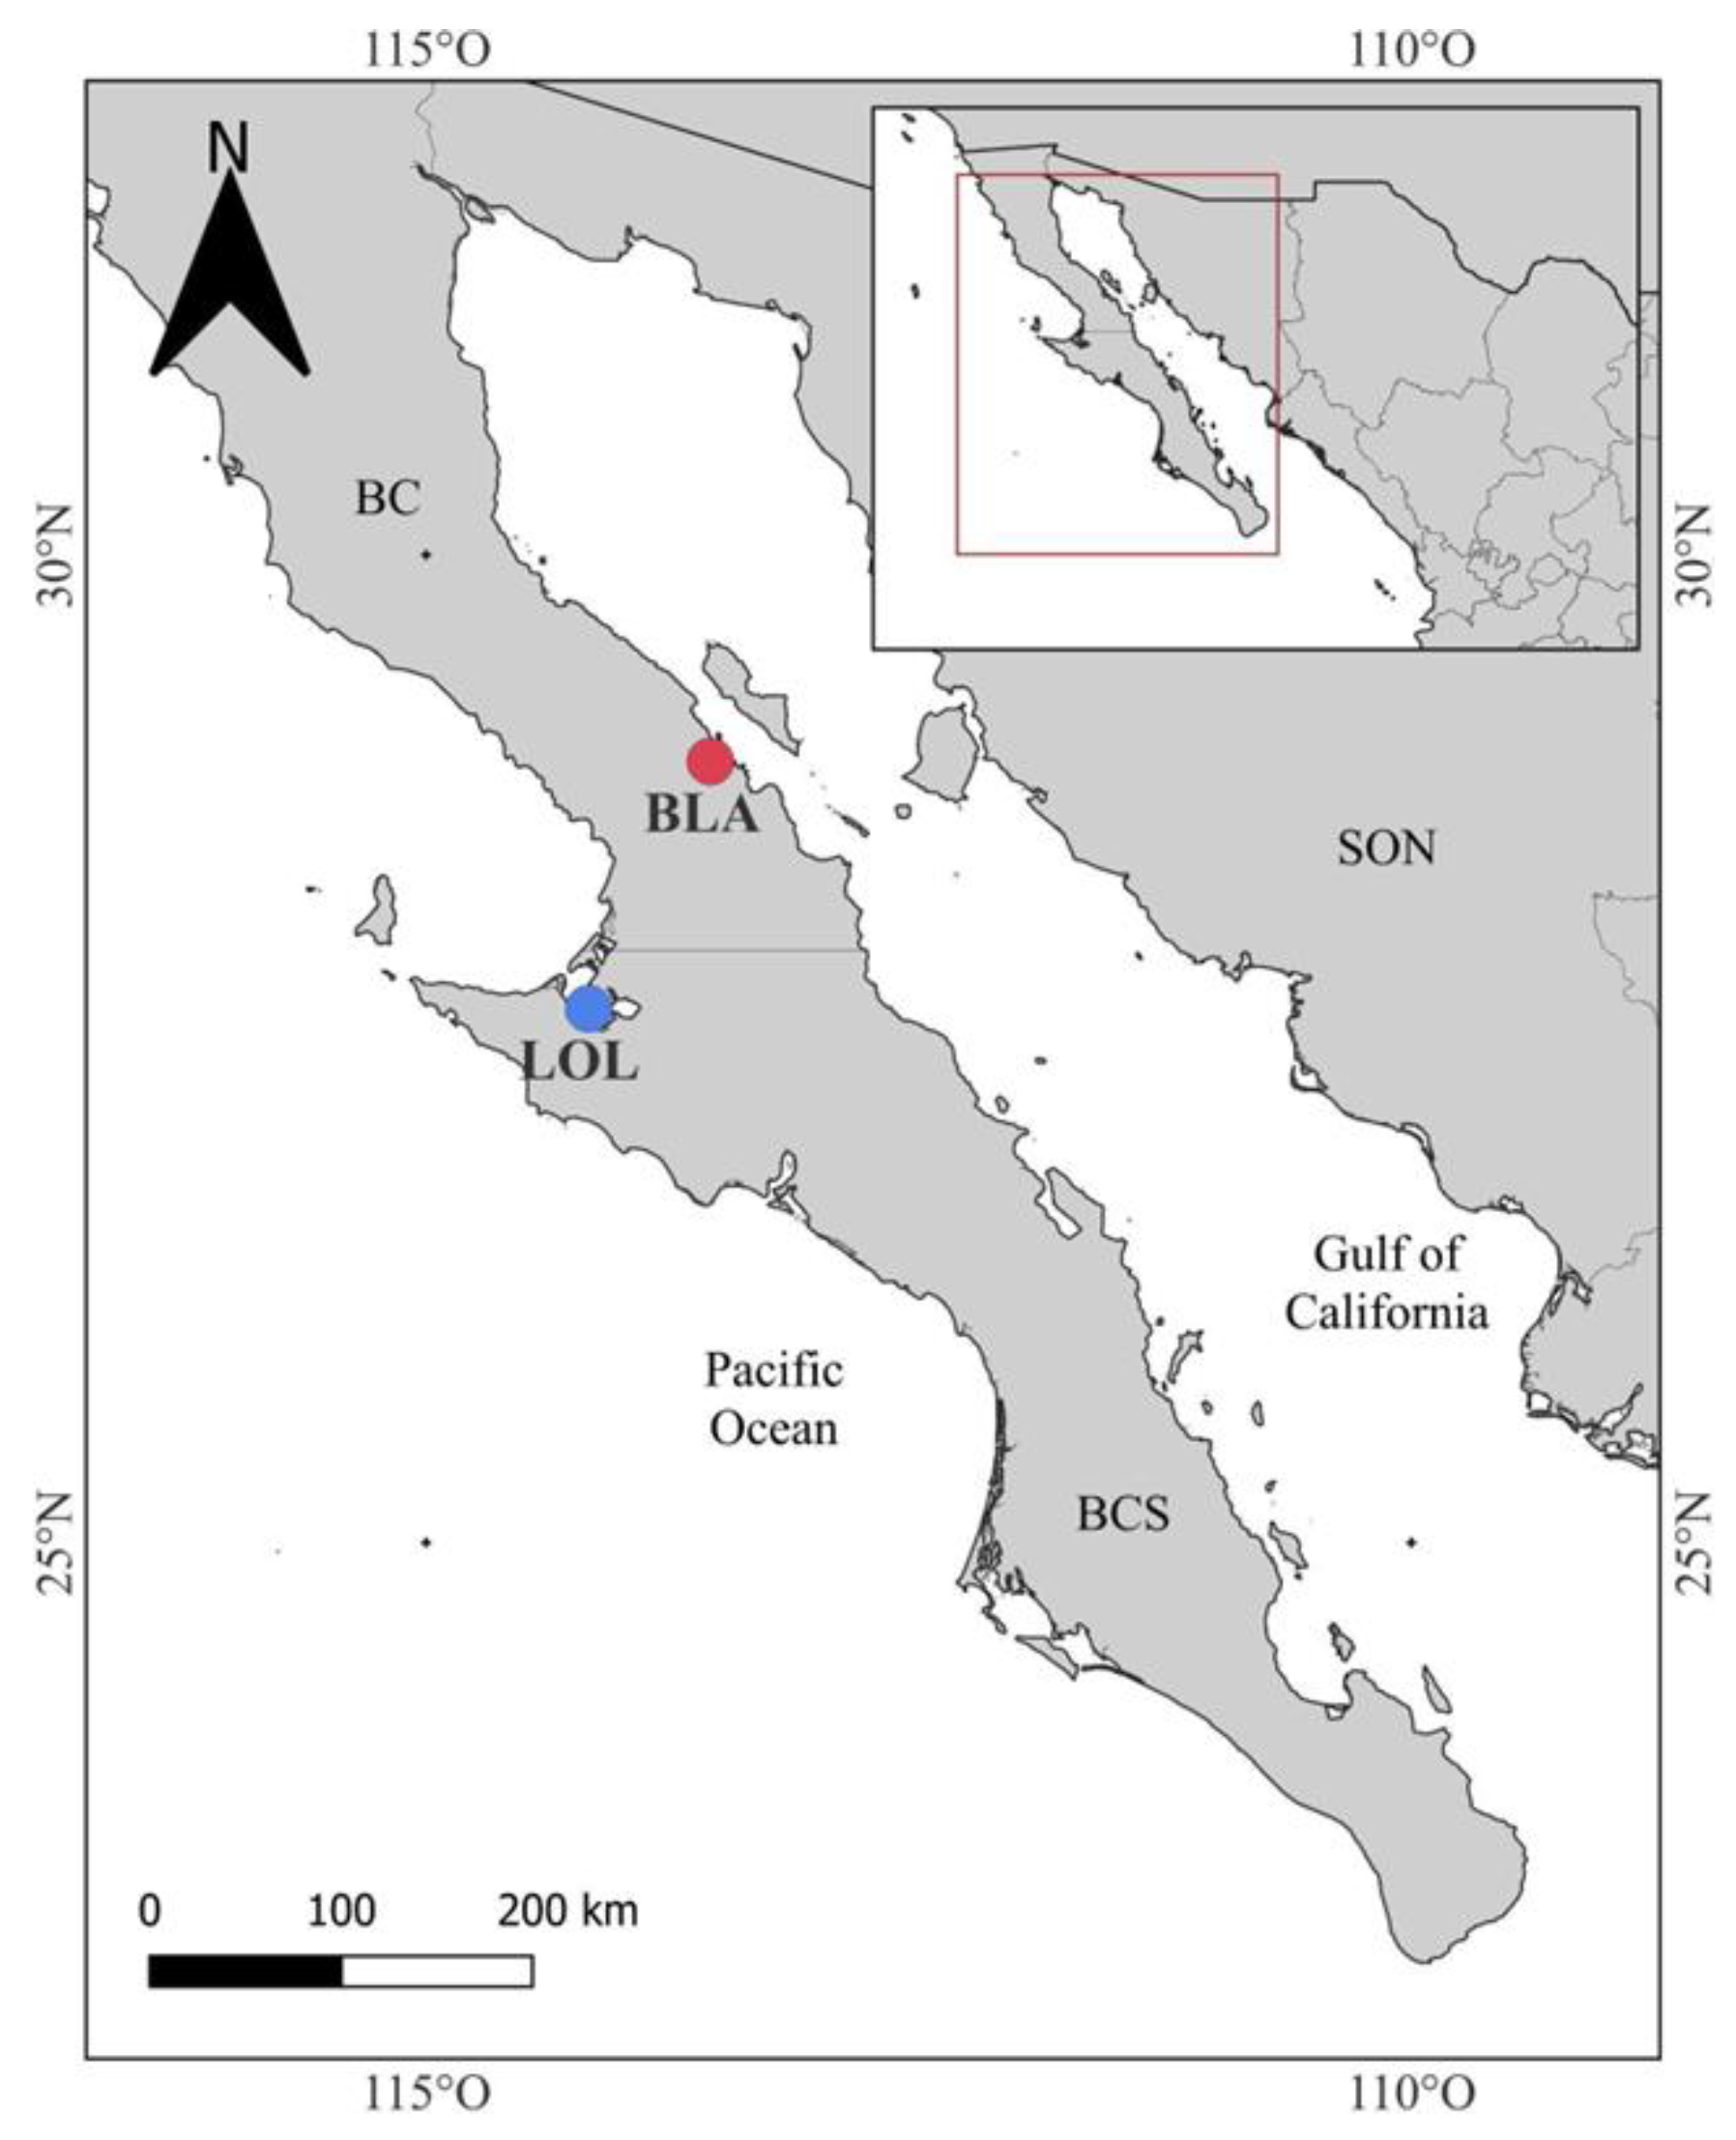
The breeders came from Bahía de Los Angeles (BLA; 28°57´ 17.867″ N, 113°33´ 24.039″ W), which is located in the Gulf of California, where the average temperature is 22.7 °C, with a historical range of 12.8 to 32.3 °C, and Laguna Ojo de Liebre (LOL; 27°42´ 10.871″ N, 114°10´ 28.937″ W), on the Pacific coast, where the mean temperature is 19.4°C and the thermal range is from 13.1 to 26.4°C [20]; Figure 2). Adult scallops were transported to the Northwestern Biological Research Center (CIBNOR) facilities in La Paz, Mexico, where they were maintained under controlled laboratory conditions to promote spawning induction and subsequent fertilization, adhering to established protocols [21].
Figure 2.
Sites of origin of the N. subnodosus broodstock used in this study: Bahía de Los Ángeles (BLA; red) and Laguna Ojo de Liebre (LOL; blue).
Figure 2.
Sites of origin of the N. subnodosus broodstock used in this study: Bahía de Los Ángeles (BLA; red) and Laguna Ojo de Liebre (LOL; blue).
After 142 days in the lab, the 3–5 mm larvae from both source populations were taken to Laguna Ojo de Liebre and kept in a suspended culture system (less than 2 m depth) for seven months until their shells were about 40 mm long. Thereafter, they were sent back to the lab for the acclimation phase. All juvenile individuals were maintained for 15 days in the laboratory at a constant temperature of 21 ± 1°C and a photoperiod of 12:12 (light: dark). During this period, the scallops were fed a microalgal diet consisting of Isochrysis galbana and Chaetoceros calcitrans at a concentration of 150,000 cells mL⁻¹. Daily monitoring of acclimation parameters encompassed food intake, measured via a particle counter (Multisizer, Beckman, US), water salinity (35–36 ppm; Extech Instruments, Waltham, MA, US), pO2 (90% air saturation; Microx TX2, Presens, Germany), and temperature (HOBO data logger Onset UA-002-64, US). No mortality was registered during the acclimation period.
For the bioassay phase after the acclimation, the organisms were segregated into experimental groups and subjected to different thermal variability regimes, designed according to the approximate mean and variability range of the sea surface temperature observed in the field. One group was exposed to a regular circadian thermal oscillation (RO), averaging 21.05°C and ranging from 17°C to 25°C, another to an unpredictable, stochastically variable regime (ST), also averaging 20.94°C and ranging from 17°C to 25°C, and the third was maintained as a control at a constant temperature (21 ± 2.87°C).
For the segregation, animals from each population source were randomly distributed into three replicates per thermal variability regime and placed in 140 L experimental tanks (n = 10 per tank, for a total of nine replicated tanks, three per thermal regime, by two population sources) for 15 days. After the thermal variability regime treatment, the temperature was raised from 21°C to 28°C at a rate of 1.75°C per hour and then kept at 28°C for 17 hours as an acute hyperthermia challenge. An automated system made up of previously standardized computer-controlled heaters and coolers was used to reach the desired temperature conditions for thermal variability and the hyperthermia challenges. Temperature, salinity, dissolved oxygen, and survival were monitored continuously during the entire experiment.
Determinations occurred firstly at the end of the 15-day exposure and secondly after the 17 h exposure to the acute TC. A total of 120 individuals were used for physiological rates determinations: 10 for each thermal variability regimen (3 to 4 per replicate) at the end of the 15 days and 10 at the end of the TC, for each Population. After the physiological determinations, animals were dissected, and three technical replicates of each tissue, mantle and muscle, from each organism, were frozen at -80°C until their analysis.
4.2. Energy Balance and Scope for Growth
Experimental individuals were placed in 300 mL tightly sealed glass incubation chambers mounted in a water bath inside 21°C controlled temperature 0.6 m2 tanks and incubated for two hours before measurements. Each chamber was connected to a microvalve to maintain an 80±2 mL constant inflow of oxygen-saturated water at 21°C with a food concentration of 300,000 cells mL⁻¹ C. calcitrans. Outflow was used for dissolved oxygen (DO) and ammonia determination and discharged. One chamber per treatment was maintained without an organism as a control to correct for microbial metabolic activity.
Using a Microx TX2 oximeter (PreSens, Regensburg, Germany) inside a T-cell placed in the water outflow of each chamber, the concentration of DO was measured every two seconds for one minute. The readings were then averaged over time. We computed the respiration rate (RR) as follows:
where F is the water flow (L h⁻¹), DOblank is the DO concentration from the blank chamber (without organism), DOorg is the lecture from the chamber with organism, and DTW is the dry tissue weight of the organism. DTW was obtained by the lyophilization (Telstar Cryodos Model 50 lyophilizer, Barcelona, Spain) of soft tissue and weighed on a precise analytical balance (Model XT 220A, Dietikon, Switzerland) with an accuracy of 0.01 g. The RR values (O₂ g⁻¹ h⁻¹) were transformed to energy units (J g⁻¹ h⁻¹), based on the assumption that 1 mL of O₂ equals 20.2 Joules [22].
RR = F*(DOblank -DOorg)/DTW
The ingestion rate (IR) was estimated as the difference between the food concentrations in the outflow water from the blank chamber and the chamber with the organism, per unit of time. To measure the concentration of food, two 20 mL replicated samples were taken at the outlet from each chamber, and the number of phytoplankton cells was measured with a cell counter, Beckman Multisizer 3. IR, expressed as cel⁻¹ h⁻¹, was converted to energy units using the particulate matter equivalent of 23,500 J g⁻¹, considering a cell weight of C. calcitrans as 39 pg [23].
Absorption efficiency (AE) was estimated using the Conover [24] method, based on the ratio between organic and inorganic matter in feces. After the two hours of incubation, feces were recovered from the chamber and filtered with a Micro Kitasato equipment, equipped with 0.75μm constant weight glass fiber filters and a vacuum pump. Filters containing feces samples were treated with a 3% ammonium formate solution to remove salts and then dried in a convection oven at 65 °C for 48 hours until a constant weight was achieved. The organic matter content was determined by weight difference. The filters were then incinerated in a muffle furnace at 540 °C for 12 hours to obtain a constant weight, and the ash-free dry weight was calculated by weight difference, following Sorokin [25].
To estimate the excretion rate, three replicated samples of water outflow were collected at the end of the two-hour incubation, placed in 2mL Eppendorf tubes, and frozen at -80°C for later processing. The measurement was then performed using a microplate adaptation of the Solórzano et al. [26] method.
The scope for growth, which is a proxy of the energy in the organism in excess of basal metabolism needs, results from the equation:
where SFG is scope for growth, typically in units of energy per time, I is the ingestion rate (energy consumed per unit time), AE is the absorption efficiency (a proportion), RR is the respiration rate (used metabolic energy), and ER is the excretion rate, mainly as nitrogenous waste [27].
SFG= (I * AE) - (RR + ER)
4.3. Biochemical Analyses of Tissues
Muscle and mantle samples were lyophilized (TELSTAR, Cryodos) at 0.05 mBar and -50 °C and ground to a fine powder with a ball mill mixer (MM400, Retsch, Germany). Approximately 0.02 g of dry tissue was rehydrated and homogenized in 1 mL of distilled water to obtain the working extract for the determination of biochemical components. For the quantification of total carbohydrates, 100 μL of the working extract was mixed with 100 μL of 20% trichloroacetic acid (TCA). The samples were centrifuged, and 25 μL of the supernatant was collected for each assay. Absorbance was measured at 630 nm. Total lipid content was determined following the methodology of Barnes [28], adapted for microplate format. A 25 μL aliquot of the working extract was combined with 250 μL of concentrated H₂SO₄ and incubated in a water bath at 90 °C for 10 minutes. Subsequently, 20 μL of this reaction mixture was transferred to a microplate, mixed with 200 μL of phospho-vanillin reagent, and absorbance was measured at 540 nm. For total protein quantification, alkaline digestion was conducted using 10 μL of the working extract and 90 μL of 0.1 N NaOH. From this mixture, 10 μL was taken and analyzed using the bicinchoninic acid (BCA) method, adapted for microplate format. Absorbance was measured at 562 nm.
4.4. Oxidative Stress Indicators
Approximately 1 g of fresh tissue was homogenized in 0.6 mL of phosphate buffer solution (50 mM, pH 7.5), EDTA (50 mM) and PMSF (1 mM). From the homogenates, the activity of three antioxidant enzymes, namely superoxide dismutase (SOD), catalase (CAT), and glutathione peroxidase (GPx) were evaluated, along with oxidative lipid damage assessed through the quantification of thiobarbituric acid reactive substances (TBARS). All measurements were performed in three technical replicates, and results were normalized to total protein content using the Bradford method [29].
SOD activity determination followed Suzuki [30], using the Cayman kit (ref. 706002). The analysis uses the xanthine/xanthine oxidase system as a source of superoxide radicals (O₂⁻), which reduce nitroblue tetrazolium (NBT) salt, producing a detectable coloration. The presence of SOD inhibits this reaction, and absorbance is then measured at 560 nm using a MultisKan spectrophotometer (Thermo Scientific). One unit of SOD activity (U) was defined as the amount of enzyme required to inhibit 50% of the O₂⁻-mediated reduction of NBT. Results were expressed as U mg⁻¹ of protein.
CAT activity was determined according to Aebi [31], using the Cayman kit (ref. 707002). This method measures the consumption of hydrogen peroxide (H₂O₂) in a potassium phosphate buffer (50 mM, pH 7.0) and contains EDTA (0.5 mM), as described by Hermes-Lima & Storey [32]. Absorbance was recorded at 240 nm with a MultisKan spectrophotometer. One unit of CAT activity (U) was defined as the amount of enzyme catalyzing the decomposition of 1 µmol of H₂O₂ per minute at 25°C.
GPx activity was quantified following the method of Flohé & Günzler [33], adapted for microplate format. This assay measures the oxidation of NADPH to NADP⁺ in the presence of H₂O₂ as a substrate, resulting in a decrease in absorbance at 340 nm, which is directly proportional to GPx activity. Readings were taken every 60 seconds for 5 minutes using a MultisKan microplate reader (Thermo Scientific). One unit of GPx activity (U) was defined as the amount of enzyme oxidizing 1 nmol of NADPH per minute at 25°C. Results were expressed as U mg⁻¹ of protein.
Oxidative lipid damage was evaluated by determining the content of thiobarbituric acid reactive substances (TBARS) [34], as adapted by Persky et al. [35]. Absorbance of the reaction products was measured at 535 nm using a MultisKan spectrophotometer. TBARS concentrations were calculated through a linear regression model from a standard curve (absorbance vs. concentration) using malondialdehyde (MDA) as the standard. Results were expressed as nmol of TBARS mg⁻¹ of protein.
4.5. Statistical Analyses
The Anderson-Darling test was used to see if all the response variables were normally distributed (p>0.05). If normality wasn't found, a routine was used to test different transformations (logarithmic, square root, and Box-Cox) until normality was found. Variables that proved not normal after the transformations were excluded from further parametric analyses. The homogeneity of variances assumption was tested through a Levene test and was met after data transformation. A three-way ANOVA was conducted, considering as factors the population (the offspring groups from LOL and BLA), temperature variability regime (regular oscillation -RO-, stochastic variability -ST-, and constant temperature -C-), and the measurements before and after the acute hyperthermia challenge (hyperthermia), followed by a pairwise Tukey HST post hoc to assess the significance of mean differences between groups (p<0.05). For variables that did not meet the ANOVA requirements, separate Kruskal-Wallis tests were done for each factor, followed by pairwise comparisons using Dunn’s test. All analyses were performed in the R environment [36]. Finally, for comparative purposes, all significant differences in means between groups were expressed as proportions:
where G1 is the mean value of the first group being compared, and G2 is the mean value of the second group.
% Change = (G1 - G2)/G2 * 100
5. Conclusions
The evidence presented in this report indicates that although the N. subnodosus populations from BLA and LOL are genetically independent, they exhibit similar responses, via phenotypic plasticity, to varying thermal regimes (constant, regular oscillations, and stochastic variability) and acute hyperthermia exposure. Multiple factors suggest that organisms display better performance under thermal variability compared to constant temperature conditions; however, the similar respiration rates among organisms subjected to various thermal regimes (constant, regular oscillations, and stochastic variability) imply that compensation was attained in every scenario by optimizing utilization of oxygen and enhancing ingestion and assimilation rates. Our findings indicate that following an abrupt temperature rise, energy demand increases, and compensation is hindered; indicators of oxidative stress, elevated metabolism (increase in respiration rate), depletion of total carbohydrates in muscle, and a substantial reduction in free energy (scope for growth) suggest a condition of physiological maintenance and survival under stress.
Supplementary Materials
The following supporting information can be downloaded at the website of this paper posted on Preprints.org. Figure S1: Raw data (before transformation). Means value for all groups and variables.
Author Contributions
Conceptualization, N.G.J.-M., S.E.L.-C. and I.R.; methodology, N.G.J.-M., D.P.C.-L. and S.A.U.; formal analysis, N.G.J.-M., S.E.L.-C. and I.R.; writing—original draft preparation, N.G.J.-M., S.E.L.-C., I.R.; writing—review and editing, S.A.U., D.P.C.-L.; funding acquisition, S.E.L.-C. All authors have read and agreed to the published version of the manuscript.
Funding
This research was funded by CONAHCYT project Fronteras de la Ciencia 78911.
Data Availability Statement
Dataset available on request from the authors.
Acknowledgments
Technical support was provided by Rosa Isela Vázquez Sánchez, Armando Monge Quevedo, José Luis Ramírez Arce, Roberto Hernández Herrera, Rosalinda Salgado García. Jorge Cobos Anaya and Felipe Javier Rosas have been instrumental for the functioning of the experimental facilities.
Conflicts of Interest
The authors declare no conflicts of interest.
Abbreviations
The following abbreviations are used in this manuscript:
| BLA | Bahía de Los Ángeles |
| LOL | Laguna Ojo de liebre |
| SFG | Scope for growth |
| RR | Respiration rate |
| AR | Absorption rate |
| IR | Ingestion rate |
| SOD | Superoxide dismutase |
| CAT | Catalase |
| GPx | Glutathione peroxidase |
| TBARS | Thiobarbituric acid reactive substances |
References
- Jutfelt, F., Roche, D.G., Clark, T.D., Norin, T., Binning, S.A., Speers-Roesch, B., Sundin, J., 2019. Brain cooling marginally increases acute upper thermal tolerance in Atlantic cod. J. Exp. Biol. 222(19), jeb208249. [CrossRef]
- Smith, K. E., Burrows, M. T., Hobday, A. J., King, N. G., Moore, P. J., Sen Gupta, A., 2022. Biological impacts of marine heatwaves. Annu. Rev. Mar. Sci. 15 (1), 119145. [CrossRef]
- Cooley, S., Schoeman, D., Bopp, L., Boyd, P., Donner, S., Ghebrehiwet, D.Y., Ito, S.-I., Kiessling, W., Martinetto, P., Ojea, E., Racault, M.-F., Rost, B., Skern-Mauritzen, M., 2022. Oceans and Coastal Ecosystems and Their Services, in: Pörtner, H.-O., Roberts, D.C., Tignor, M., Poloczanska, E.S., Mintenbeck, K., Alegría, A., Craig, M., Langsdorf, S., Löschke, S., Möller, V., Okem, A., Rama, B. (Eds.), Climate Change 2022: Impacts, Adaptation and Vulnerability. Contribution of Working Group II to the Sixth Assessment Report of the Intergovernmental Panel on Climate Change. Cambridge University Press, Cambridge, UK and New York, NY, USA, pp. 379–550. [CrossRef]
- Masanja, F., Yang, K., Xu, Y., He, G., Liu, X., Xu, X., Zhao, L., 2023. Impacts of marine heat extremes on bivalves. Front. Mar. Sci. 10, 1159261. [CrossRef]
- Pörtner, H. O., Farrell, A. P., 2008. Physiology and Climate Change. Science, 322(5902), 690–692. [CrossRef]
- Peck, L.S., Morley, S.A., Richard, J., Clark, M.S.,2014. Acclimation and thermal tolerance in Antarctic marine ectotherms. J. Exp. Biol., 217(1), 16-22. [CrossRef]
- Sasaki, M.,Dam, H.G.,2021. Global patterns in copepod thermal tolerance. J. Plankton Res. 43(4),598-609. [CrossRef]
- Stillman, J. H., Somero, G. N., 2000. A comparative analysis of the upper thermal tolerance limits of eastern Pacific porcelain crabs, genus Petrolisthes: influences of latitude, vertical zonation, acclimation, and phylogeny. Physiol. Biochem. Zool. 73(2), 200-208. https://www.journals.uchicago.edu/doi/epdf/10.1086/316738.
- Marshall, D.J., McQuaid, C.D., 2011. Warming reduces metabolic rate in marine snails: adaptation to fluctuating high temperatures challenges the metabolic theory of ecology. Proc. R. Soc. B 278(1703), 281–288. [CrossRef]
- Morash, A.J., Neufeld, C., MacCormack, T.J., & Currie, S.,2018. The importance of incorporating natural thermal variation when evaluating physiological performance in wild species. J. Exp. Biol., 221(14), jeb164673. [CrossRef]
- Niehaus, A.C., Angilletta Jr, M.J., Sears, M.W., Franklin, C.E., Wilson, R.S., 2012. Predicting the physiological performance of ectotherms in fluctuating thermal environments. J. Exp. Biol. 215(4), 694–701. [CrossRef]
- Vajedsamiei, J., Melzner, F., Raatz, M., Morón Lugo, S. C., & Pansch, C., 2021. Cyclic thermal fluctuations can be burden or relief for an ectotherm depending on fluctuation´s average and amplitude. Funct. Ecol., 35(11), 2483-2496. [CrossRef]
- Manenti, T., Sørensen, J.G., Moghadam, N.N., Loeschcke, V., 2014. Predictability rather than amplitude of temperature fluctuations determines stress resistance in a natural population of Drosophila simulans. Journal of evolutionary Biology, 27(10), 2113-2122. [CrossRef]
- Nancollas, S.J., Todgham, A.E., 2022. The influence of stochastic temperature fluctuations in shaping the physiological performance of the California mussel, Mytilus californianus. J. Exp. Biol., 225(14), jeb243729. [CrossRef]
- Ruiz-Verdugo, C.A., Koch, V., Félix-Pico, E., Beltran-Lugo, A.I., Cáceres-Martínez, C., Mazn-Suastegui, J.M., Robles-Mungaray, M., Caceres-Martínez, J., 2016. Scallop fisheries and aquaculture in Mexico. In: Developments in Aquaculture and Fisheries Science, Vol. 40, pp. 1111–1125. Elsevier. [CrossRef]
- Rupp G. S., Valdéz-Ramírez M. E., Lemeda-Fonseca M. (2011) Ecología y Biología pp.25-58. En: Maeda-Martínez A. N., Lodeiros-Seijo C. (Eds). Biología y cultivo de los moluscos pectínidos del género Nodipecten. Editorial Limusa, México.
- Petersen, J. L., Ibarra, A. M., & May, B., 2010. Nuclear and mtDNA lineage diversity in wild and cultured Pacific lion-paw scallop, Nodipecten subnodosus (Baja California Peninsula, Mexico). Marine biology, 157, 2751-2767. [CrossRef]
- Koch, V., Rengstorf, A., Taylor, M., Mazón-Suástegui, J.M., Sinsel, F., Wolff, M., 2015. Comparative growth and mortality of cultured Lion's Paw scallops (Nodipecten subnodosus) from Gulf of California and Pacific populations and their reciprocal transplants. Aquac. Res. 46(1), 185–201. [CrossRef]
- Purce, D.N., Donovan, D.A., Maeda-Martínez, A.N., Koch, V., 2020. Scope for growth of cultivated Pacific and Gulf of California populations of lion’s paw scallop Nodipecten subnodosus, and their reciprocal transplants. Latin Am. J. Aquat. Res. 48(4), 538–551. [CrossRef]
- Joachin-Mejia, N.G., 2022. Caracterización del hábitat térmico de la almeja mano de león (Nodipecten subnodosus) en el noroeste mexicano. [unpublished BSc dissertation]. Universidad Nacional Autónoma de México.
- Ramírez-Arce, J. L., 2009. Evaluación de la ventaja productiva y grado de esterilidad en triploides de almeja mano de león Nodipecten subnodosus (Sowerby 1835) como una alternativa para el cultivo en el Parque Nacional Bahía de Loreto, Golfo de California. [unpublished MSc dissertation]. Centro Interdisciplinario de Ciencias Marinas, México.
- Elliott JM, Davison W. 1975. Energy equivalents of oxygen consumption in animal energetics. Oecología 19: 195-201.
- Lora-Vilchis, M. C., Robles-Mungaray, M., Doktor, N., Voltolina, D., 2004. Food value of four microalgae for juveniles of the lion's paw scallop Lyropecten subnodosus (Sowerby, 1833). J. World Aquac. Soc. 35(2), 232–236. [CrossRef]
- Conover, R.J., 1966. Assimilation of organic matter by zooplankton. Limnology and Oceanography. 11: 338-345.
- Sorokin C., 1973. Dry weight, packed cell volume and optical density: In: Stein, J. (ed). Handbook of phycological methods. Culture methods and growth measurement. Cambridge University Press, Cambridge and New York. Pp. 321-343.
- Solorzano L. 1969. Determination of ammonia in natural waters by the phenolhypochlorite method. Limnol. Oceanogr. 14:799-800.
- Bayne, B.L., Widdows, J., Thompson, R.J., 1976. Physiological integrations. In: Marine Mussels: Their Ecology and Physiology (Ed. B.L. Bayne), Cambridge University Press, pp. 261–291.
- Barnes, H., Blackstock J., 1973. Estimation of lipids in marine animals and tissues: detailed investigations of the sulphophosphovainillin method for total lipids. J. Exp. Mar. Biol. Ecol. 12,103-118. [CrossRef]
- Bradford, M.M., 1976. A rapid and sensitive method for the quantification of microgram quantities of protein utilizing the principle of protein-dye binding. Anal. Bioch. 72,256-284.
- Suzuki, K., 2000. Measurement of Mn-SOD and Cu, Zn-SOD. In: Taniguchi, N., Gutteridge, J. (Eds.). Experimental protocols for reactive oxygen and nitrogen species. Oxford University Press, U.K. pp. 91-95.
- Aebi, H., 1984. Catalase in vitro. In: Methods in enzymology, oxygen radicals in biological systems. Elsevier, New York, pp. 121-126. [CrossRef]
- Hermes-Lima, M., Storey, J.M. y Storey, K.B., 2001. Antioxidant defenses and animal adaptation to oxygen availability during environmental stress, in: Storey, K.B., Storey, J.M (Eds.) Cell and Molecular Responses to Stress, vol. 2. Elsevier, Amsterdam, Netherlands. pp. 263-287. [CrossRef]
- Flohé, L., Günzler, W.A,. 1984. [12] Assays of glutathione peroxidase. Methods enzymol. 105, 114-120. [CrossRef]
- Buege, J.A., Aust, S.D., 1978. [30] Microsomal lipid peroxidation. In Methods in enzymology, Vol. 52, Academic press pp. 302-310. [CrossRef]
- Persky, A.M., Green, P.S., Stubley, L., Howell, C.O., Zaulyanov, L., Brzaeau, G.A., Simpkins, J.W., 2000. Protective effect of estrogens against oxidative damage to heart and skeletal muscle. Proceedings of the Society for Experimental Biology and Medicine, 223: 59–66. [CrossRef]
- R Core Team, 2021. R: A language and environment for statistical computing. R Foundation for Statistical Computing, Vienna, Austria. https://www.R-project.org/.
- Racotta, I., Joachin-Mejia, N., Sicard, M.T., Lluch-Cota, S.E. Aquaculture site selection for the lion´s paw scallop Nodipecten subnodosus, based on environmental temperature variability and organisms’ growth and ecophysiological performance. Aquacilture Reports, 2024. submitted.
- Cruz, P., Ramirez, J.L., Garcia, G.A., Ibarra, A.M., 1998. Genetic differences between two populations of catarina scallop (Argopecten ventricosus) for adaptations for growth and survival in a stressful environment. Aquaculture 166(3–4), 321–335. [CrossRef]
- Cruz, P., Rodríguez-Jaramillo, C., Ibarra, A.M., 1999. Environment and population origin effects on first sexual maturity of catarina scallop, Argopecten ventricosus (Sowerby II, 1842). Aquaculture 172(1), 105–115.
- Colinet, Hervé; Sinclair, Brent J; Vernon, Philippe; and Renault, David, "Insects in fluctuating thermal environments." (2015). Biology Publications. 67. https://ir.lib.uwo.ca/biologypub/67.
- Bozinovic, F., Bastías, D. A., Boher, F., Clavijo-Baquet, S., Estay, S. A., & Angilletta Jr, M. J. (2011). The mean and variance of environmental temperature interact to determine physiological tolerance and fitness. Physiol. Biochem.l Zool. 84(6), 543-552. http://www.jstor.org/stable/10.1086/662551.
- Sicard-González, M.T. (2006). Efecto de la oscilación térmica en la fisiología de la almeja mano de león (Nodipecten subnodosus Sowerby, 1835) [unpublished doctoral dissertation] Universidad Autónoma de Nuevo León.
- Palacios, E., Racotta, I.S., Kraffe, E., Marty, Y., Moal, J., Samain, J.F., 2005. Lipid composition of the giant lion's-paw scallop (Nodipecten subnodosus) in relation to gametogenesis: I. Fatty acids. Aquaculture 250(1–2), 270–282. [CrossRef]
- Palacios, E., Racotta, I.S., Arjona, O., Marty, Y., Le Coz, J.R., Moal, J., Samain, J.F., 2007. Lipid composition of the pacific lion-paw scallop, Nodipecten subnodosus, in relation to gametogenesis: 2. Lipid classes and sterols. Aquaculture 266(1–4), 266–273. [CrossRef]
- Pernet, F., Tremblay, R., Comeau, L.,Guderley, H., 2007. Temperature adaptation in two bivalve species from different thermal habitats: energetics and remodelling of membrane lipids. J. Exp. Biol. 210 (17), 2999–3014. [CrossRef]
- Artigaud, S., Richard, J., Thorne, M. A., Lavaud, R., Flye-Sainte-Marie, J., Jean, F., Pichereau, V. 2015. Deciphering the molecular adaptation of the king scallop (Pecten maximus) to heat stress using transcriptomics and proteomics. BMC genomics, 16, 1-14. [CrossRef]
- Laudicella, V. A., Whitfield, P. D., Carboni, S., Doherty, M. K., Hughes, A. D., 2020. Application of lipidomics in bivalve aquaculture, a review. Reviews in Aquaculture, 12(2), 678-702. [CrossRef]
- Abele, D., Heise, K., Pörtner, H.O., Puntarulo, S., 2002. Temperature-dependence of mitochondrial function and production of reactive oxygen species in the intertidal mud clam Mya arenaria. J. Exp. Biol. 205(13), 1831–1841. [CrossRef]
- Dong, X., Yang, Z., Liu, Z., Wang, X., Yu, H., Peng, C., ... & Bao, Z. (2022). Metabonomic analysis provides new insights into the response of Zhikong scallop (Chlamys farreri) to heat stress by improving energy metabolism and antioxidant capacity. Antioxidants, 11(6), 1084. [CrossRef]
- Song, J. A., Lee, E., Choi, Y. U., Park, J. J. C., & Han, J., 2025. Influence of temperature changes on oxidative stress and antioxidant defense system in the bay scallop, Argopecten irradians. Comp. Biochem Physiol.Part A: Mol. Integr. Physiol. 299, 111775. [CrossRef]
- Rahman, M. A., Henderson, S., Miller-Ezzy, P., Li, X. X., Qin, J. G., 2019. Immune response to temperature stress in three bivalve species: Pacific oyster Crassostrea gigas, Mediterranean mussel Mytilus galloprovincialis and mud cockle Katelysia rhytiphora. Fish shellfish Immunol. 86, 868-874. [CrossRef]
- Giraud-Billoud, M., Moreira, D. C., Minari, M., Andreyeva, A., Campos, É. G., Carvajalino-Fernández, J. M., ... & Hermes-Lima, M.,2024. Evidence supporting the ‘preparation for oxidative stress’(POS) strategy in animals in their natural environment. Comp. Biochem. Physiol. 111626.
- Bonesteve, A., Lluch-Cota, S. E., Sicard, M. T., Racotta, I. S., Tripp-Valdez, M. A., Rojo-Arreola, L.,2025. HSP mRNA sequences and their expression under different thermal oscillation patterns and heat stress in two populations of Nodipecten subnodosus. Cell Stress Chaperones, 30(1), 33-47. [CrossRef]
- Salgado-García, R. L., Kraffe, E., Tripp-Valdez, M. A., Ramírez-Arce, J. L., Artigaud, S., Flye-Sainte-Marie, J., Racotta, I. S.,2023. Energy metabolism of juvenile scallops Nodipecten subnodosus under acute increased temperature and low oxygen availability. Comp. Biochem. Physiol. Part A: Mol. Integr. Physiol., 278, 111373. [CrossRef]
- Götze, S., Bock, C., Eymann, C., Lannig, G., Steffen, J. B. M., & Pörtner, H. O.,2020. Single and combined effects of the “Deadly trio” hypoxia, hypercapnia and warming on the cellular metabolism of the great scallop Pecten maximus. Comp. Biochem. Physiol. B: Biochem. Mol. Biol. 243–244,110438. [CrossRef]
- Sokolova, I. M., Frederich, M., Bagwe, R., Lannig, G., Sukhotin, A. A., 2012. Energy homeostasis as an integrative tool for assessing limits of environmental stress tolerance in aquatic invertebrates. Marine environmental research, 79, 1-15.
- Bresollier. L., Salgado-García, R.L., Racotta, I., Kraffe, E., Sicard, M.T., Lluch-Cota, S.E. Tripp-Valdez, M.T. Contrasting cellular energy responses to regular and chaotic daily thermal oscillations in two populations of Nodipecten subnodosus scallops. J. Thermal Biol. 2025, submitted.
- Yoon, D. S., Byeon, E., Kim, D. H., Lee, M. C., Shin, K. H., Hagiwara, A., Lee, J. S., 2022. Effects of temperature and combinational exposures on lipid metabolism in aquatic invertebrates. Comp. Biochem. Physiol. C Toxicol. Pharmacol., 262, 109449. [CrossRef]
- Röszer, T., 2014. The invertebrate midintestinal gland (“hepatopancreas”) is an evolutionary forerunner in the integration of immunity and metabolism. Cell Tissue Res. 358, 685–695. [CrossRef]
- Song, J. A., Choi, C. Y.,2021. Temporal changes in physiological responses of Bay Scallop: Performance of antioxidant mechanism in Argopecten irradians in response to sudden changes in habitat salinity. Antioxidants, 10(11), 1673. [CrossRef]
- Seebacher, F., White, C. R., Franklin, C. E., 2015. Physiological plasticity increases resilience of ectothermic animals to climate change. Nature Climate Change, 5(1), 61-66. [CrossRef]
Figure 1.
Proportional differences in means between pairwise groups: Regular oscillation – constant temperatures (orange), stochastic variability regime – constant temperature (light blue), regular oscillation – stochastic variability (dark blue), and post – pre hyperthermia challenge (grey). Change is expressed as % change relative to the first group being compared.
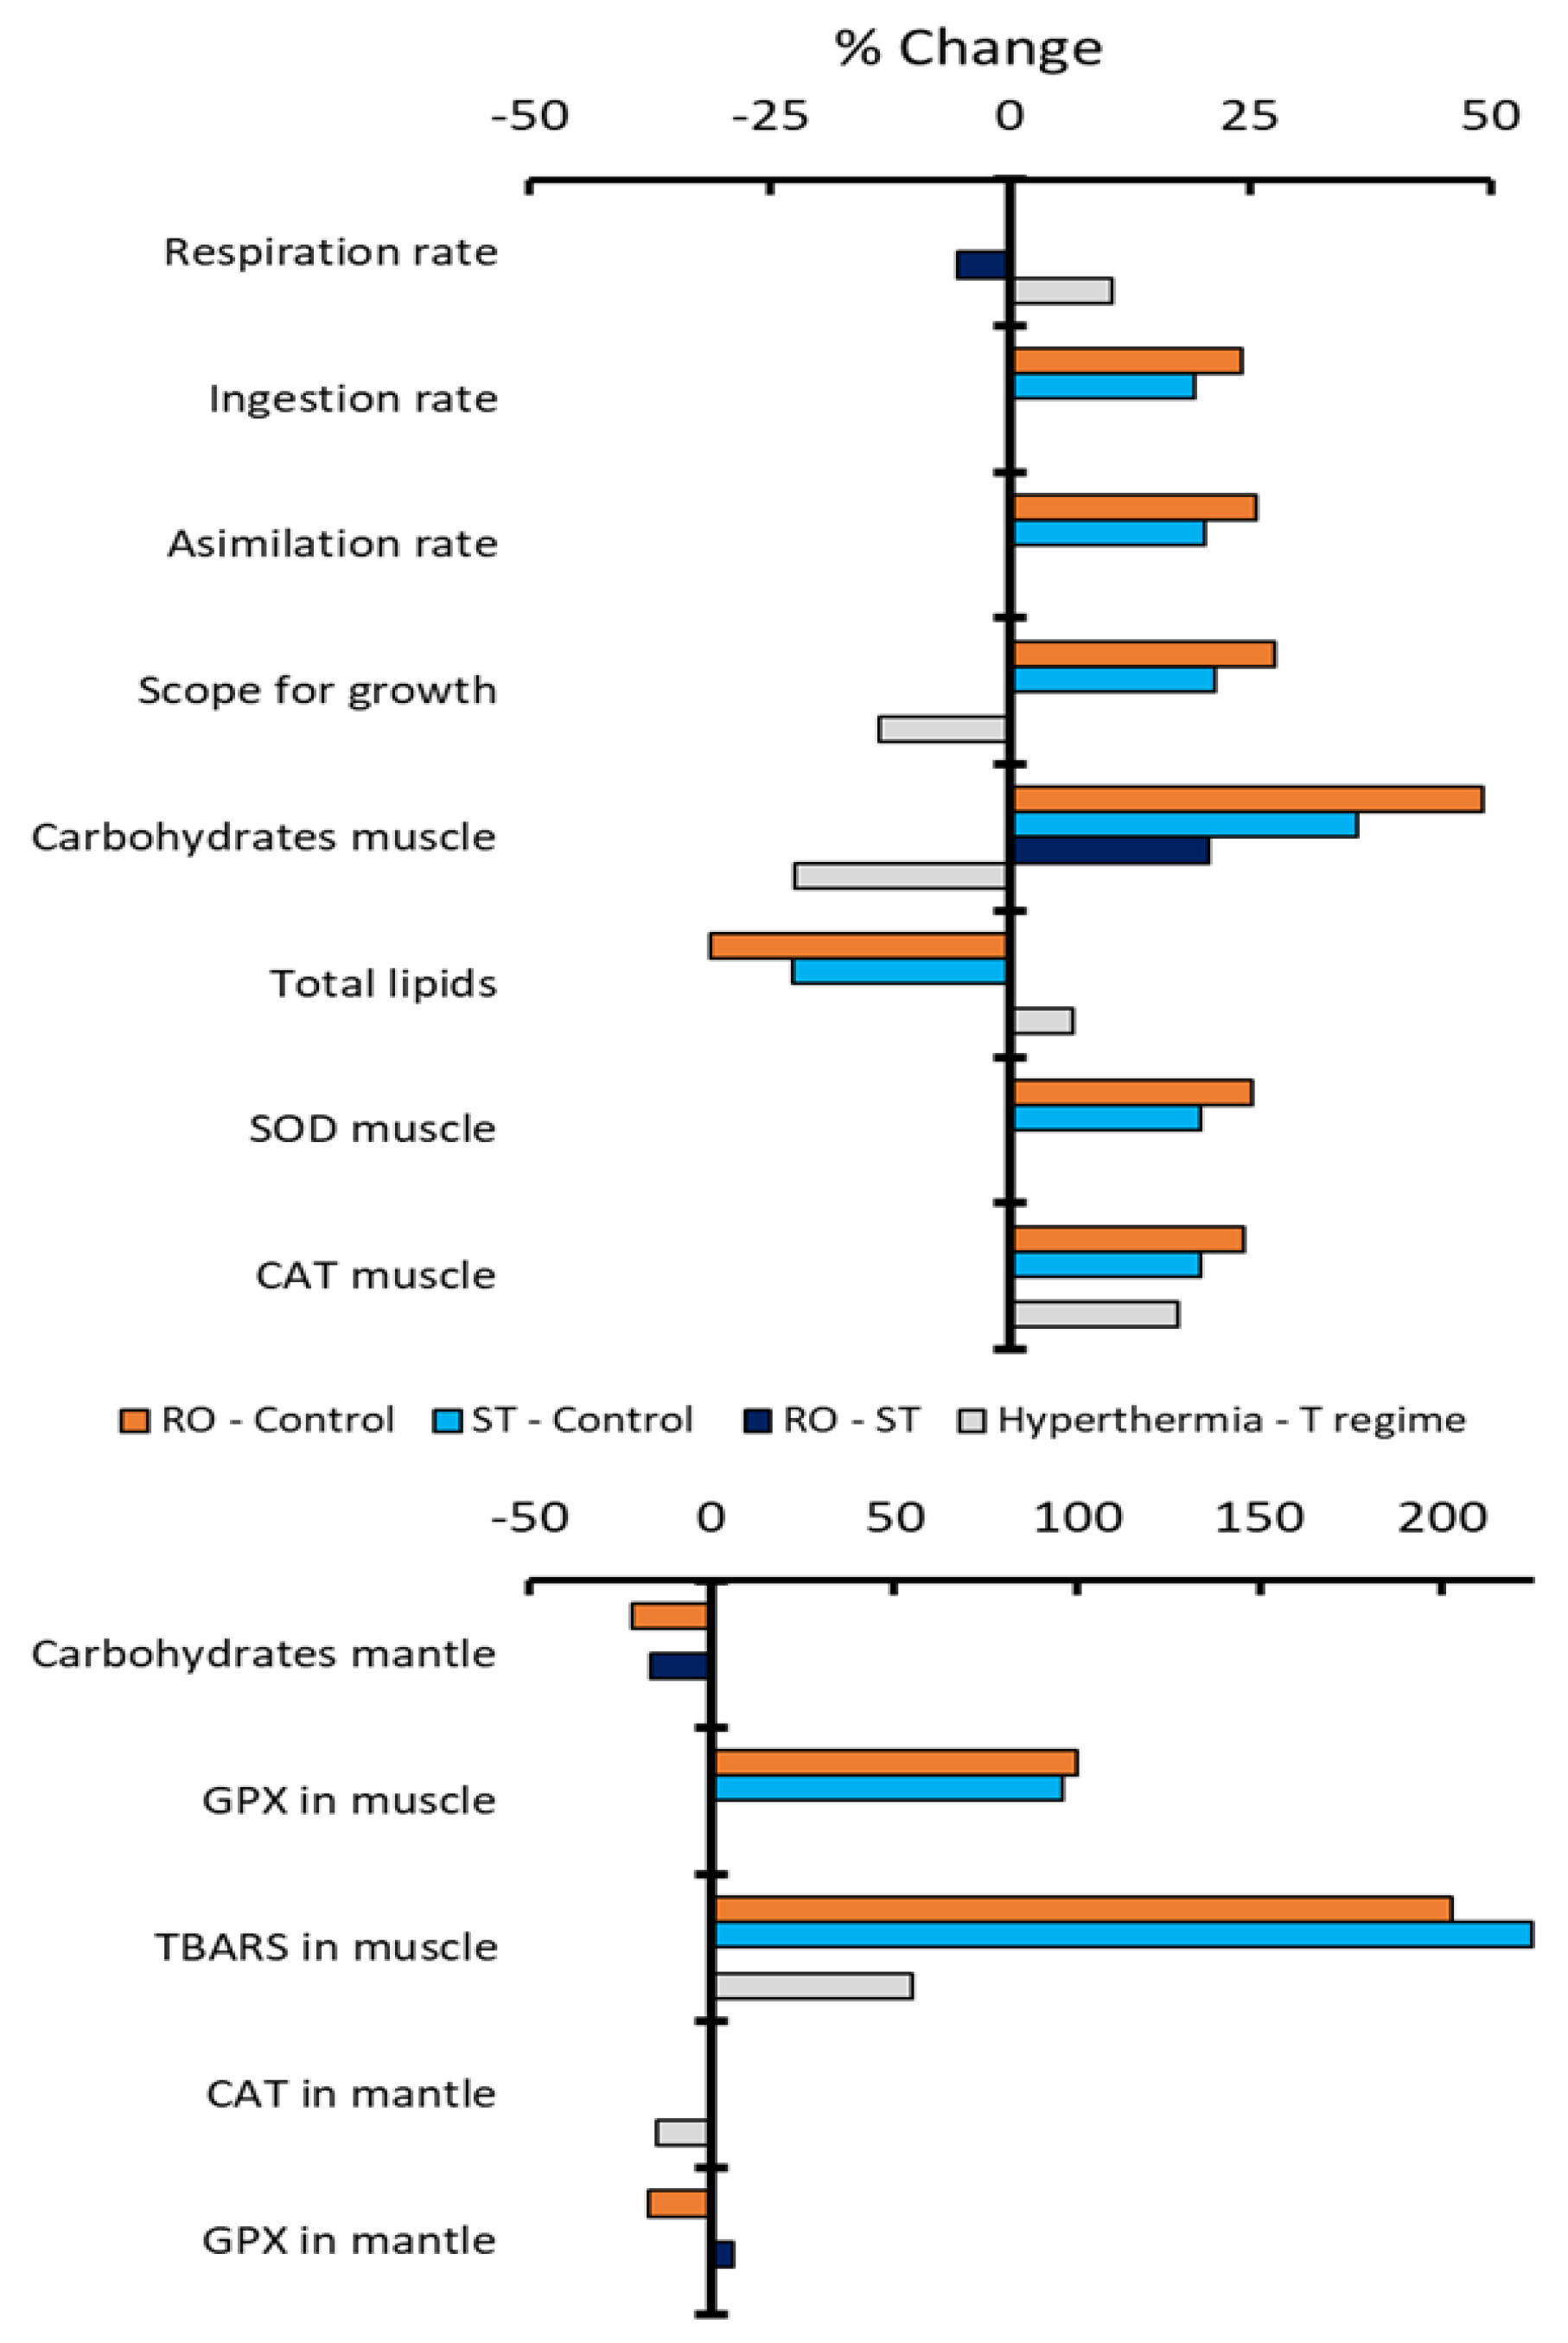

Table 1.
Normality tests (p-value > 0.05) for raw and normality-transformed variables.
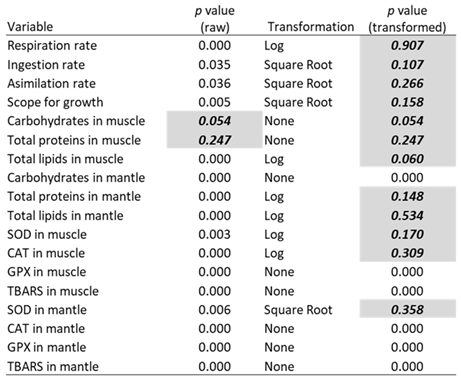
Table 2.
Results from the ANOVA (parametric variables) and Kruskal-Wallis test (non-parametric variables. Significant responses (p<0.05) are marked in bold italics.
Table 2.
Results from the ANOVA (parametric variables) and Kruskal-Wallis test (non-parametric variables. Significant responses (p<0.05) are marked in bold italics.
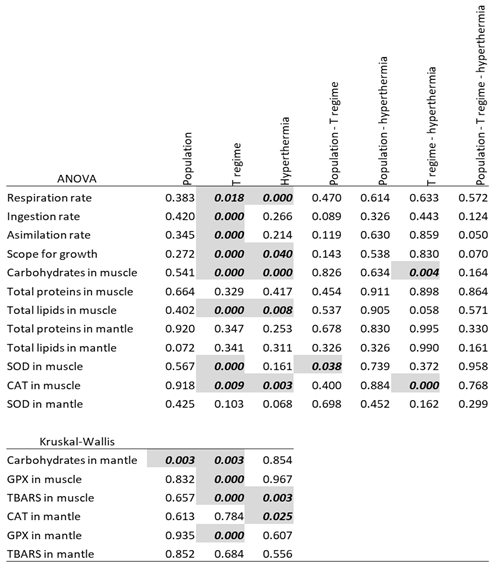
Table 3.
Post hoc analyses for groups with significant effects. Significant (p<0.05) differences in means for Tukey HDS test (parametric variables) and Dunns’s test (non-parametric variables) are marked in italic bold.
Table 3.
Post hoc analyses for groups with significant effects. Significant (p<0.05) differences in means for Tukey HDS test (parametric variables) and Dunns’s test (non-parametric variables) are marked in italic bold.
Disclaimer/Publisher’s Note: The statements, opinions and data contained in all publications are solely those of the individual author(s) and contributor(s) and not of MDPI and/or the editor(s). MDPI and/or the editor(s) disclaim responsibility for any injury to people or property resulting from any ideas, methods, instructions or products referred to in the content. |
© 2025 by the authors. Licensee MDPI, Basel, Switzerland. This article is an open access article distributed under the terms and conditions of the Creative Commons Attribution (CC BY) license (http://creativecommons.org/licenses/by/4.0/).
Copyright: This open access article is published under a Creative Commons CC BY 4.0 license, which permit the free download, distribution, and reuse, provided that the author and preprint are cited in any reuse.


