
Submitted:
02 June 2025
Posted:
02 June 2025
You are already at the latest version
Abstract
The endothelial glycocalyx (GCX) plays a crucial role in vascular health and integrity and influences many biochemical activities through mechanotransduction. Endothelin-1 (ET-1) is a potent vasodilator produced by endothelial cells (EC) and plays a significant role in many cardiovascular-related conditions, including hypertension and atherosclerosis. ET-1 binds to the endothelin B receptor (ETB) on ECs, stimulating vasodilation and to the endothelin A receptor on smooth muscle cells, stimulating vasoconstriction. Shear stress (SS) dependence of ET-1 and heparan sulfate (HS) has been shown, and reports suggest that ETB is also SS dependent. In this study, we hypothesize that GCX HS regulates the expression of ETB on the EC surface in a SS-dependent manner. Human Lung Microvascular ECs were exposed to various SS magnitudes in a parallel-plate flow chamber for 12 hours. Damaged GCX was simulated by treatment with 15mU/mL Heparinase-III during exposure to SS. Immunostaining and qPCR were used to evaluate changes in expression of ET-1, ETB, and heparan sulfate, a major GCX component. Results indicate that ETB is SS dependent, but this effect is reduced by HS degradation, indicating ETB expression may also be HS-dependent. Under SS, ET-1 synthesis increases without a corresponding rise in ET-1 protein expression, implying that post-translational regulation of ET-1 occurs independently of HS.
Keywords:
endothelial glycocalyx
; mechanotransduction
; heparan sulfate
; endothelin-1
; endothelin B receptor
; vascular disease
; shear stress
1. Introduction
The vascular endothelial glycocalyx (GCX) consists of a carbohydrate-rich layer and a transmembrane backbone coating the entire surface of endothelial cells (ECs) [1,2]. It is connected to the cytoskeleton and plays a crucial role in vascular permeability and endothelial integrity [3,4,5,6]. GCX is responsible for EC mechanosensing, where hemodynamic forces are converted into cellular signals, inducing biochemical processes [2,4,5]. Its functions have only recently become the subject of in-depth research. Diseases such as atherosclerosis [7,8] or hypertension [9,10] are known to lead to damage to the GCX, adversely affecting vascular health [3]. The GCX is comprised of a backbone of various transmembrane and membrane-bound proteoglycans and glycoproteins, such as syndecans [11] and glypicans [12], which are attached to glycosaminoglycans (GAG) by attachment sites on specific extracellular domains [2]. Heparan sulfate (HS) proteoglycans, including syndecan-1 (SDC1), perlecan (HSPG2), and glypican-1 are the most abundant proteoglycan present in the GCX [1]. Proteoglycan expression is dynamically regulated by external stimuli, and variations in shear stress (SS) magnitude can significantly alter their expression, thereby affecting their functional roles [1,11,13]. Two common HS-containing proteoglycans are SDC1 and HSPG2. Along with glypican-1, these have mechanosensory roles in the GCX, modulating cell behavior and proliferation via translation of mechanical stimulus to the cytoskeleton [2,14]. Studies have shown that GCX and specifically heparan sulfate proteoglycans (HSPG) play a role in regulating vascular tone through hemodynamic shear stress by production of nitric oxide (NO) [11,12,15,16].
The primary GAG chains that bind to proteoglycans in the GCX include HS, chondroitin sulfate, hyaluronan, sialic acids, and dermatan sulfate [2]. These proteoglycan and GAG complexes form an intricate network of interconnected carbohydrates creating an interface between the EC surface and blood [1]. HS is the most abundant GAG in the GCX and plays a significant role in mechanotransduction properties of the GCX. HS is degraded by heparinase-III (Hep-III), an HS cleaving enzyme, which has been shown to impair the mechanotransduction response in ECs [11]. This is demonstrated by the inhibition of NO production in bovine aortic ECs following treatment with 15mU/mL Hep-III [11,15].
Endothelin-1 (ET-1) is a potent vasoconstrictive and vasodilative peptide that plays a significant role in many cardiovascular-related conditions. Elevated ET-1 has been noted in patients with moderate-to-severe hypertension and atherosclerosis, implicating ET-1 in the pathogenesis of these conditions [10]. It is mainly produced by ECs and secreted into the extracellular space to bind to either the endothelin B receptor (ETB) on ECs, stimulating vasodilation, or the endothelial A receptor on smooth muscle cells, stimulating vasoconstriction [17]. Reports indicate that the expression of ET-1 is shear stress (SS) magnitude and time-dependent and that ET-1 expression is NO-mediated [17,18,19].
ETB, a plasma membrane-bound G protein-coupled receptor (GPCR) on both ECs and smooth muscle cells [20,21], has a high affinity for ET-1 [22,23,24]. It is present on both ECs and smooth muscle cells, and stimulation of ETB leads to a complex cellular response including vasodilation through NO and prostaglandin release, as well as G protein activation [21,25]. This response differs depending on the location of ETB, whether found on the EC surface or on smooth muscle cells [25]. Studies have demonstrated flow-sensitivity of GPCRs [26]. Morawietz et al. demonstrated ETB upregulation in human umbilical vein endothelial cells (HUVEC) in response to long-term (24-hr) laminar SS exposure at 1, 15, and 30 dynes/cm2. Upregulation was found to occur by an NO- and protein kinase C-dependent mechanism. However, the effects of other SS magnitudes on ETB expression are not well understood [17]. ETB may interact with other EC surface proteins, which include some components of the GCX.
Both ETB and GCX mediate nitric oxide (NO) which is mainly produced by endothelial nitric oxide synthase (eNOS). The GCX mediates NO production by mechanotransduction of stretching and flow-induced forces via proteoglycans and removal of HS and HSPGs reduces NO production significantly [12,27]. NO is vital for regulation of vascular tone, being activated by the signaling cascade induced by ET-1 binding to ETB and causing vasodilation by decreasing Ca2+ entry into smooth muscle cells [21]. The effects of NO on vascular tone regulation by ETB may be affected by HS degradation. Conversely, healthy levels of HS may cause better regulation of vascular tone by ETB. Since endothelial GCX is known to mediate NO production, it could play a significant role in ETB regulation [27].
Given the mechanosensing properties and spatial proximity of HS, its core proteins, and ETB [28,29], we hypothesize that ETB interacts with HS in a flow-dependent manner to regulate it’s expression on the surface of ECs. The interaction between ETB, ET-1 and GCX remains unclear and requires further investigation, which is the primary objective of this project. A deeper understanding of the role GCX plays in modulating ET-1 and ETB expression may lead to novel diagnostic and therapeutic methods for vascular diseases such as hypertension and atherosclerosis.
To investigate the relationship between ETB and HS, healthy and diseased states were simulated using various SS magnitudes simulating static, low, physiological, and high shear stress magnitudes. Damaged GCX was also simulated by dosing the media with Hep-III, an HS-cleaving enzyme, which will remove the HS component of the GCX to simulate damage or diseased GCX. Changes in protein and mRNA expression of ET-1, ETB, and HS and its core proteins were evaluated by immunocytochemistry (ICC) and qPCR, respectively.
2. Materials and Methods
2.1. Cell Culture
Human Lung Microvascular Endothelial Cells (HLMVEC) were purchased from Cell Applications Inc. (San Diego, CA, USA; Cat# 540-05a) and were cultured in T-75 flasks using Microvascular Endothelial Cell Growth Medium (MEGM) from Cell Applications Inc. at 37°C and 5% CO2 in a water-jacketed incubator. Once 85% confluent, cells were passaged using 0.25% Trypsin-EDTA from Gibco (Grand Island, NY, USA; Cat# 25200072). Cells were used for experiments at passage 6 (P6).
For exposure to fluid shear stress, cells were seeded onto 24mm x 60mm glass coverslips. Prior to seeding, coverslips were UV sterilized and coated with 10mg/mL fibronectin for 30 minutes. Cells were thawed and seeded directly onto the coverslips at 250k cells/coverslip. Cells were allowed to grow for 24 hours before exposure to flow.
2.2. Heparinase-III Treatment
To simulate damaged to HS, cells were dosed with Hep-III purchased from IBEX Pharmaceuticals (Mount Royal, Quebec; Cat# 60-021), at 15mU/mL for 2 hours prior to exposure to SS. Hep-III was also added to the flow system media at 15mU/mL for the 12-hour duration of the flow experiment.
2.3. Flow Experiment
Confluent HLMVECs on coverslips were placed inside a custom parallel-plate flow chamber warmed to 37°C. The flow system was primed with pre-warmed MEGM at 37°C and then placed inside an incubator for the 12-hour for SS exposure. HLMVECs were exposed to shear stress levels of 5, 15, and 25 dynes/cm2 for 12 hours. Media was exchanged for static control samples at the start of the SS experiments and were left in the incubator for the duration of the flow experiment.
2.4. Fixation
After exposure to SS, cells were rinsed with 1x PBS and were fixed in 2% formaldehyde and 0.1% glutaraldehyde in PBS for 10 minutes. Samples were then rinsed three times and stored at 4°C until immunostaining was performed (<1 week).
2.5. Immunostaining
Sample coverslips were split into multiple equal sections for immunostaining for ET-1, ETB, and HS. Samples were rinsed with 2% BSA in PBS 3 times for 5 minutes, then permeabilization of ET-1 and ETB samples was performed in 0.1% Triton X-100 in PBS for 20 minutes, followed by 3 5-minute washes in 2% BSA in PBS. Blocking was performed using 10% goat serum in PBS for one hour. Primary antibodies (Endothelin 1 Monoclonal Antibody, Invitrogen Cat# MA3-005; Endothelin B Receptor Polyclonal Antibody, Invitrogen Cat# PA3-066; Ab Heparan Sulfate, purified (clone F58-10E4), AMSBIO Cat# 370255-1) were prepared in antibody diluent containing 0.1% BSA in PBS and applied to the respective samples at a concentration of 1:500 for ET-1 and HS, and 1:1000 for ETB. Negative control samples received only antibody diluent for this step. Samples were incubated overnight at 4°C in the dark. Next, samples were rinsed 3 times for 5 minutes each with 2% BSA in PBS, and secondary antibodies (Goat anti-Mouse IgG1 Cross-Adsorbed Secondary Antibody, Invitrogen Cat# A-21121; Goat anti-Rabbit IgG (H+L) Highly Cross-Adsorbed Secondary Antibody, Invitrogen Cat# A-11036; Goat anti-Mouse IgG, IgM (H+L) Secondary Antibody, Invitrogen Cat# A10680) were applied for one hour at room temperature in the dark at concentrations of 1:400 for ET-1 and ETB and 1:5000 for HS secondary antibodies. After rinsing 3 times for 5 minutes with 2% BSA in PBS and 3 times with deionized water, coverslips were mounted with Fluoromount-G mounting medium with 4',6-diamidino-2-phenylindole (DAPI) (Cat# 00-4959-52) onto microscope slides and stored at room temperature in the dark overnight to cure mounting medium. Samples were kept at 4°C in the dark until imaging.
2.6. Imaging
A Nikon Eclipse Ti2 microscope with a CSU-W1 Confocal Scanner Unit from Yokogawa spinning disk confocal microscopy system was used to capture z-stack images of samples for quantification using an Olympus plan-achromat 60x 1.4 N.A. oil objective. Z-stack images were taken at a randomly selected area on the sample within the fluid flow path with a slice thickness of 0.2µm. 31 slices were taken for each image by finding the approximate middle of the cell layer and imaging 3µm in either direction from the center of the sample. Each z-stack was captured as a 16-bit image with a resolution of 2048x2048 pixels. Imaging parameters, including laser power and exposure duration, were kept consistent for all independent experiments.
2.7. Image Analysis
Fluorescent confocal images were analyzed using a custom image analysis pipeline using ImageJ FIJI (v1.54f) [30] and CellProfiler (v4.2.8) [31]. The sum projections of z-stack images were generated using ImageJ FIJI and saved as uncompressed TIFF files. These sum-projection images were loaded into CellProfiler for cell segmentation and analysis of fluorescent intensity. The CellProfiler pipelines used in this analysis are available in our GitHub repository. Fluorescent intensity was calculated per-cell area for ET-1 and ETB samples, and field of view (FOV) for HS samples, and a fold-change (FC) calculation was performed to compare the change in integrated intensity between the flow and diseased conditions and the static control for each sample.
Upon visual inspection, confocal images show little difference in fluorescent intensity between samples, and conclusions cannot be made in this manner. Rigorous computational analysis of fluorescent intensity in confocal images must be performed to properly analyze changes in fluorescent intensity in samples due to the various treatments. A version of this analysis has been performed previously by Mensah et al. and Cancel et al. [32,33]. However, for this study a more robust analysis method was developed to better assess any potential differences in expression via fluorescent intensity and eliminate sources of bias in image analysis. This analysis method utilized ImageJ FIJI [30] to generate sum projections of z-stacks and CellProfiler [31] to segment cells within the field of view (FOV) and measure the integrated intensity (the sum of all pixel intensity values) for each cell to get an average intensity per-cell value for ET-1 and ETB samples. This same method was utilized for HS samples, but the CellProfiler pipeline was tuned to select all areas of HS expression within the FOV, which is not localized to the cells, to get an average intensity value per image. To ensure a large enough sample size, at least 3 images for each ET-1 and ETB sample and at least 6 images for each HS sample were captured at random locations within the flow path and analyzed for each experiment. This method allows for unbiased image analysis by allowing for identical and minimal processing of all images and generates numerical values for each image for proper statistical analysis.
2.8. qPCR
qPCR was performed alongside immunostained samples using the SYBR Green Fast Advanced Cells-to-CT Kit from ThermoFisher Scientific (Waltham, MA, USA; Cat# A35379). After exposure to SS, cells outside of the flow path were removed from the coverslip using a cell scraper. Visual inspection under a microscope was used to confirm complete removal of cells. Coverslips were rinsed in PBS and cells were lifted from the coverslip using 0.25% Trypsin-EDTA and pelletized in a centrifuge. Cells were then counted and brought to a concentration of 25k cells/5µL in PBS, as directed by the manufacturer. Lysis was performed following manufacturer specifications using 50 µL lysis solution, 0.5 µL DNase I, and 5µL of cell suspension (25,000 cells), followed by gentle mixing and incubation at room temperature for 5 minutes. A stop solution was added to halt lysis, and the lysate was stored at -20°C until use (<2 weeks). Reverse transcription (RT) was performed using Fast Advanced RT buffer, enzyme mix, UltraPure™ DNase/RNase-Free Distilled Water from Invitrogen (Waltham, MA, USA; Cat# 10977015), and lysate. Controls used were nuclease free H2O, no-template control, and -RT. The RT reaction was performed in a Bio-Rad DNAEngine Peltier Thermal Cycler (Bio-Rad Laboratories; Waltham, MA, USA) with a Bio-Rad Alpha Unit Block Assembly (Bio-Rad, Cat# ALD1244) by holding at 37°C for 30 minutes, was inactivated at 95°C for 5 minutes, and resulting cDNA was stored at 4°C until use (<1 day).
Prior to loading the qPCR plate, master mixes (MMs) were prepared with SYBR Green, primers, and nuclease-free (NF) water. Controls were loaded, followed by 8µL of loaded into each respective well, then 2µL of cDNA or -RT (no reverse transcription) sample into each well. Triplicate samples were used for all samples, and duplicate wells were used for all controls due to lack of space on the plate. A no-template control (NTC) consisting of only 10µL of MM and two wells containing NF H2O were loaded prior to loading the plate, and two more wells were loaded after the plate was fully loaded to act as additional controls. The qPCR reaction was performed in a Quant Studio 6 Pro Real Time PCR system (Thermo Fisher Scientific, Plaquemine, LA, USA) protocol, beginning with UDG activation at 50C for 2 minutes, enzyme activation at 95C for 10 minutes, and 40 amplification cycles at 95°C for 3 seconds and 60°C for 30 seconds. Primers (See Table A1 in Appendix 1 for primer sequences) for ET-1, ETB, and HSPG2 were validated prior to use, and the SDC1 primer used was from Taghavi et al [34]. All primers were used at a final working concentration of 500nM. Expression was quantified using the 2-ΔΔCt method [35].
Primers were designed using NCBI Primer-BLAST [36]. Briefly, the gene ID was entered into Primer-BLAST to look for primers common to a group of sequences, then “primer must span an exon-exon junction” was selected. Primer sequences that had short product lengths, spanned an exon-exon junction, had a GC content between 40-60%, were 18-24bp total in length, contained balanced AT and GC content, and avoided runs of 4 or more bps were selected. Primers were ordered from Sigma-Aldrich (St. Louis, MO, USA). Primer sequences were validated on HLMVEC cells following the qPCR protocol above and using a range of primer concentrations from 100nM to 10uM along with -RT, NTC, and NF H2O controls to determine the best primer concentration and most effective primer. Melt curves were analyzed to confirm a single sharp peak appeared and minimal self-annealing had occurred. Primers which had consistent Ct values below 32 were considered acceptable, but most primers produced average Ct values below 25.
2.9. Statistics and Data Representation
All data is presented as the group mean and variance is presented as the standard error of the mean. At least 5 independent experiments were used as numerical replicates for each experimental group. Multiple-comparison analysis via ordinary one-way ANOVA tests to determine statistical significance between all sample means in an experiment when comparing control and enzyme treated samples with SS exposure to a static control. In the case of static control and enzyme treatment comparisons, an unpaired parametric t-test was performed to determine statistical significance between the two samples. P-values less than 0.05 were considered significant. All data presented graphically was analyzed using GraphPad Prism (Version 10.3.1 for Windows, GraphPad Software, www.graphpad.com).
3. Results
To investigate the relationship between ET-1, ETB, and HS, HLMVEC were exposed to uniform flow (UF) of varying SS magnitudes and treated with Hep-III for HS degradation. HLMVEC were selected because of our interest in studying hypertension and our strong understanding of the culture behavior of these cells. Immunostaining and qPCR were used for analysis of changes in ET-1, ETB, and HS expression. Confocal images of immunostained samples were analyzed using a custom pipeline created in ImageJ FIJI and CellProfiler, and analysis of mRNA expression via qPCR was performed using the 2-ΔΔCt method [31,35,37]. The following sections describe the effects of 12 hours of SS exposure combined with 15mU/mL Hep-III (Hep-III) treatment following a 2-hour pre-exposure period (14 hours of total Hep-III exposure).
3.1. ET-1 Results
Figure 1 presents confocal images of immunostained samples alongside the analysis of integrated intensity fold-change and Figure 2 presents the threshold cycle (Ct) fold change from qPCR in cells exposed to 0, 5, 15, and 25 dynes/cm2 of uniform SS. Following exposure to 15mU/mL Hep-III for 14 hours, ET-1 protein expression showed a slight increase under static conditions (p = 0.0037; Figure 1a). ET-1 gene expression did not significantly increase under enzyme exposure (p = 0.0958; Figure 2a).
ET-1 protein expression did not significantly change under low magnitude SS (Figure 1f,j) as shown by the graph in Figure 1b (p = 0.4304). However, ET-1 gene expression was markedly upregulated in both no-treatment (NT) and Hep-III conditions, with fluorescent intensity values more than doubling compared to static culture samples (p = 0.0021; Figure 2b). ET-1 gene expression was unaffected by the Hep-III treatment, indicating potential HS independence.
Under 15 dynes/cm2 of uniform SS, HLMVEC showed no change in ET-1 protein expression in both NT (Figure 1g) and HS-degraded (Figure 1k) conditions when compared to static conditions (p = 0.2270; Figure 1c). A strong increase in gene expression was observed under SS conditions (p = 0.0025; Figure 2c) and similarly to the lower SS results, this effect was unchanged by degradation of HS, suggesting HS-independence in ET-1 gene regulation.
Exposure to 25 dynes/cm2 of SS resulted again in no change in ET-1 protein expression under SS conditions (Figure 1h), and this effect was repeated under Hep-III (Figure 1l) treatment (p = 0.1665; Figure 1d). At high SS, ET-1 mRNA was again significantly increased (p = 0.0030; Figure 2d). This effect was eliminated by HS degradation, indicating a potential role for HS in regulating ET-1 transcription. This increase is similar in magnitude across all SS conditions, strongly demonstrating the SS-dependence of ET-1 expression and potentially suggesting HS-dependence of ET-1 under high SS magnitudes.
A detailed analysis showed that the integrated intensity fold-change of ET-1 protein expression remained unchanged in all SS magnitudes of 5, 15, and 25 dynes/cm2 when compared to static control samples. Additionally, application of SS with HS degradation had no significant effect on ET-1 protein expression within the cell at SS levels of 5, 15, or 25 dynes/cm2. This result suggests that HS might not be directly involved in the translational or post-translational regulation of ET-1.
Analysis of qPCR results showed ET-1 gene expression is significantly upregulated by SS, but not significantly affected by Hep-III treatment at 5 and 15 dynes/cm2, which is consistent with ICC results. Under uniform SS for 12 hours at 5, 15, and 25 dynes/cm2, ET-1 gene expression was significantly increased compared to static, confirming ET-1 expression is SS-dependent. When exposed to uniform SS at 5 and 15 dynes/cm2 in the presence of 15mU/mL Hep-III, no significant differences were observed compared to the SS control samples. At 25 dynes/cm2, ET-1 expression was decreased in samples dosed with Hep-III compared to untreated samples, with no significance in fold-change when compared to static samples. These results taken together could suggest that HS is involved in regulation of ET-1 expression at the transcriptional level when ECs are exposed to high physiological SS and that further investigation is required to understand the mechanisms at play. However, gene upregulation without a corresponding increase in protein expression taken together indicates post-translational regulation, potentially involving processes such as secretion or degradation.
3.2. ETB Results
Figure 3 describes ETB protein expression under 0, 5, 15, and 25 dynes/cm2. ETB expression showed no difference in protein expression under enzyme exposure (p = 0.3022; Figure 3a) and no change in gene expression under enzyme exposure (p = 0.2183; Figure 4a). ETB protein levels increased under SS exposure compared to static samples (Figure 3f) but this increase was abolished by Hep-III (Figure 3j) treatment (p = 0.0521; Figure 3b), resulting in no significant difference in ETB expression in Hep-III-treated samples compared to static samples. This demonstrates that ETB is SS-dependent in low physiological SS conditions and indicates potential HS-dependence for protein regulation. ETB gene regulation showed a non-significant decrease under low SS conditions, indicating a mild sensitivity to low physiological SS (p = 0.3772; Figure 4b).
In Figure 3g we show a strong increase in ETB protein expression under 15 dynes/cm2 of uniform SS compared to static samples (p = 0.0255; Figure 3c). This SS-induced increase in ETB was blocked by HS degradation (Figure 3k), possibly indicating HS-dependent expression of ETB. Conversely, ETB gene expression was drastically decreased under SS exposure (p = 0.0001; Figure 4c), and HS degradation did not significantly affect the transcriptional response, indicating potential HS-independent transcription under physiological SS conditions.
ETB expression under 25 dynes/cm2 of uniform SS is shown in Figure 3h. Under high physiological SS, ETB protein expression was again observed to increase (p = 0.0007; Figure 3d), and Hep-III treatment (Figure 3l) did not affect this increase. Gene expression decreased at high SS and was again not affected by Hep-III treatment, further suggesting HS-independent transcription of ETB (p = 0.0001; Figure 4d).
In summary, ETB protein expression was increased significantly in all tested SS conditions. HS degraded 5 and 15 dyne/cm2 samples showed no significant change compared to the static control, showing a reduction in the effect SS on ETB expression. This could indicate that HS is significantly involved in ETB expression, and removal of HS affects ETB expression at a post-translational level. However, no statistically significant change in ETB expression was found between NT and Hep-III-treated samples. Additionally, samples exposed to 25 dynes/cm2 exhibited significantly increased ETB expression under both control and enzyme-treated conditions. These results indicate ETB expression is SS dependent. Reduction of the mechanotransduction response by HS degradation may prevent ETB upregulation under low and physiological SS conditions, but this was not a statistically significant result and was not observed under high SS conditions.
ETB gene expression shown to be SS dependent and was found to be unaffected by Hep-III exposure under static conditions. Gene expression of ETB showed a non-significant decrease in fold-change compared to the static control when HLMVECs were exposed to low uniform SS, indicating a low sensitivity to mild SS. At 15 dynes/cm2, ETB gene expression was significantly decreased in both control and enzyme-dosed conditions with no significant fold-change difference between static control and enzyme treated conditions. At high SS (25 dynes/cm2), ETB gene expression fold-change further decreased and was not significantly affected by HS degradation, suggesting ETB gene expression is SS-dependent and HS independent.
3.3. HS Results
HS was significantly removed from the cell surface by Hep-III treatment as shown in Figure 5. Confocal images of HS ICC under static culture conditions comparing samples with and without 14-hour enzyme treatment are shown (Figure 5e,i), along with a graph depicting fold-change of integrated intensity (Figure 5a). Gene expression of HSPG2 (Figure 6a) and SDC1 (Figure 6e) was unchanged by enzyme treatment in static conditions.
HS expression on the EC surface significantly increased under 5 dynes/cm2 of uniform SS (p = 0.0001; Figure 5b). This increase (Figure 5f) was abolished under exposure to Hep-III (Figure 5j), confirming effective degradation of HS by 15mU/mL Hep-III. No significant changes occurred in HSPG2 (p = 0.7825; Figure 6b) or SDC1 (p = 0.9447; Figure 6f) gene expression under low SS, indicating that mild SS does not lead to HSPG transcription.
Expression of HS on HLMVEC surface also increased under 15 dynes/cm2 (Figure 5g) of uniform SS (p = 0.0006; Figure 5c). This effect was again eliminated by the introduction of Hep-III (Figure 5k) to degrade HS. Similarly to low SS exposure, under 15 dynes/cm2, no change was observed in HSPG2 (p = 0.3229; Figure 6c) or SDC1 (p = 0.4443; Figure 6G) gene expression, indicating that moderate SS does not lead to increased transcription of HSPGs.
25 dynes/cm2 also significantly increased HS expression (Figure 5h) on the EC surface, and Hep-III treatment (Figure 5l) completely reduced HS expression (p = 0.0002; Figure 5d). Even under high SS, gene expression of HS core proteins HSPG2 (p = 04882; Figure 6d) and SDC1 (p = 0.3465; Figure 6h) remained unchanged, strongly indicating that HS levels increase due to shear-induced post-transcriptional remodeling.
To summarize, HLMVEC were confirmed to robustly increase expression of HS on the cell surface under all SS conditions as shown by integrated intensity fold-change. This effect was eliminated when HS was degraded with Hep-III. The highest increase in HS expression was observed at 25 dynes/cm2, while Hep-III treatment completely eliminated HS. This result demonstrates the effective degradation of HS by Hep-III at 15mU/mL.
Gene expression fold-change analysis of HS proteoglycans HSPG2 and SDC1 showed no significant effect when HLMVECs were dosed with 15mU/mL Hep-III for 12 hours plus pre-treatment for 2 hours. Perlecan showed no fold-change difference between control and enzyme-treated static samples and syndecan-1 showed a slight but non-significant increase in gene expression by fold-change analysis. Gene expression of HSPG2 was not significantly affected by exposure to SS at 5, 15, or 25 dynes/cm2. SDC1 was also not significantly affected by uniform SS at 5, 15, or 25 dynes/cm2, indicating that SS may not induce HS proteoglycan synthesis.
4. Discussion
4.1. Summary of Results
In this study, we examined how HS and SS influence the expression of ETB on ECs. We hypothesize that SS-driven HS synthesis plays a regulatory role in modulating ETB expression in ECs. We conducted our study using a parallel plate flow chamber system modeled after a previously developed system to simulate uniform blood flow in vivo [38,39]. HLMVECs were exposed to UF for 12 hours and gene and protein expression of ET-1, ETB, and HS were evaluated by comparison to a static control (0 dynes/cm2). 5, 15, and 25 dynes/cm2 were chosen to replicate in vivo conditions for HLMVECs. 5 and 25 dynes/cm2 were chosen to replicate low and high physiological SS conditions as ET-1 release under 5 and 25 dynes/cm2 had been characterized and 15 dynes/cm2 was chosen to replicate normal healthy physiological conditions [17,18,40].
A summary of the observed effects of combined SS and HS degradation are shown in Table 1, below. Briefly, we observed no change in ET-1 protein expression accompanied by an increase in gene expression under SS conditions, and no difference was observed between NT and Hep-III samples except under 25 dynes/cm2 of SS. For ETB, we observed an increase in protein expression and a decrease in gene expression under SS, with some observed effect from HS degradation. Finally, a significant increase in HS on the cell surface was observed under SS, while HS proteoglycan gene expression remained unaffected by SS and Hep-III exposure.
4.2. Major Findings and Importance
To confirm that Hep-III treatment did not significantly alter baseline expression of ET-1, ETB, or HSPGs, comparisons were made between NT and Hep-III-treated samples under static conditions only (Figure 1a–4a and Figure 6a,e). The results of this control comparison show that the introduction of Hep-III to HLMVECs alone is not enough to cause significant protein expression changes in ETB or gene expression changes in ET-1, ETB, perlecan, or syndecan-1. This indicates that changes in protein or gene expression seen under SS conditions can be attributed to combined effects of SS or HS degradation and not by the addition of Hep-III alone.
ET-1 mRNA expression was significantly increased compared to static conditions un-der SS and was unaffected by HS degradation at 5 and 15 dynes/cm2. HS degradation completely suppressed the upregulation of ET-1 induced by high physiological shear stress (25 dynes/cm²). ET-1 protein expression was found to not change across all SS levels despite significant gene upregulation. HS degradation had no significant effect on ET-1 protein expression levels within the cell, which is consistent with gene expression results under 5 and 15 dynes/cm2 of uniform SS. This demonstrates that SS upregulates ET-1 transcription through an HS-independent pathway under low and moderate SS. Attenuation of mechanotransduction through HS degradation may disrupt the normal SS-dependent regulation of ET-1 gene expression. This data shows that ET-1 expression is SS-dependent, increasing ET-1 mRNA under SS conditions despite no change in protein expression. A lack of significant change in protein expression accompanying significant gene upregulation suggests post-translational regulation of ET-1 by a mechanism such as degradation or rapid secretion into the surrounding environment.
ETB gene expression showed a slight, non-significant decrease compared to static control under exposure to 5 dynes/cm2, indicating a low sensitivity to mild shear stress. At 15 dynes/cm2, ETB gene expression was significantly decreased, but the transcriptional response was not significantly affected by HS degradation, suggesting HS-independent transcription. At high SS (25 dynes/cm2), ETB gene expression further decreased significantly, and was also not significantly affected by HS degradation, confirming HS-independent transcription of ETB. Protein expression of ETB increased under 5, 15, and 25 dynes/cm2 compared to static conditions. Hep-III treatment for HS degradation eliminated the statistical significance of protein upregulation in low and physiological SS conditions but did not affect the change in protein expression under high SS conditions. Based on the data, it appears that ETB expression in response to SS may be dependent on a specific shear stress threshold.
While this result shows partially that ETB is HS-dependent, negation of the SS-induced change in ETB expression by degradation of HS may suggest that the presence of healthy, functional HS may play a role in regulating ETB expression. Overall, ETB expression was found to be SS-dependent, and indications of partial HS-dependence were observed. ETB gene expression was found to decrease in a SS-dependent manner independently of HS health, and ETB showed a SS-dependent increase in protein expression. Hep-III treatment, which disrupts HS-mediated mechanotransduction [11], led to a decrease in ETB integrated intensity measured by FC relative to NT conditions, although the change was not statistically significant. But the statistical significance of the SS-dependent change in ETB expression under healthy HS conditions was eliminated by Hep-III treatment under 5 and 15 dynes/cm2 conditions (Figure 3). SS is more responsible for ETB regulation, but this result, shown in Figure 3, implies HS-dependence. Alternatively, other GAGs maybe be more responsible for ETB modulation by GCX. Further research is required to elucidate the specific mechanisms involved in this cooperation.
HS expression on the EC surface was significantly increased under all SS conditions (5, 15, and 25 dynes/cm2). The highest increase in HS expression occurred under high SS, and Hep-III exposure completely removed the fluorescent signal. Hep-III treatment abolished the increase in HS endothelial surface expression in all treatments, confirming that Hep-III effectively degrades HS at 15mU/mL. These results suggest that SS exposure increases HS expression post-translationally, likely through increased GCX remodeling via GAG chain length or by reduced turnover [41]. HS gene expression was unchanged by SS exposure, highlighting that HS remodeling, not proteoglycan synthesis, mediates shear-induced changes in EC activity.
4.3. Alternative Explanations
The ET-1 regulatory pathway is known to be highly complex, with ET-1 release known to be, among others, thrombin-induced [42], vasopressin-induced [43], hypoxia-induced [44], and SS-dependent [18,19,45]. Under conditions of vascular stress or in the presence of vasoactive substances and inflammatory cytokines such as angiotensin II and tumor necrosis factor-α (TNF-α), ET-1 mRNA is known to be upregulated [21,46]. Under 20 dynes/cm2 of SS, ET-1 mRNA is known to increase under less than 2 hours of exposure followed by a decrease at exposure durations greater than 2 hours [47], further indicating the complexity of the ET-1 regulatory pathway. Under high physiological uniform SS, ET-1 gene expression was significantly elevated compared to static culture. In contrast, only a non-significant increase was observed after Hep-III treatment. This pattern was not observed at lower SS magnitudes, suggesting that ET-1 regulation under high SS may differ from that under lower SS magnitudes. These findings imply that ET-1 expression in response to high SS involves additional or alternative regulatory mechanisms beyond HS-mediated mechanotransduction alone, pointing toward a more complex, potentially threshold-dependent regulatory pathway for ET-1. Additionally, the SS-dependence of ET-1 may be more closely linked to a different mechanotransduction component of the GCX than HS, such as hyaluronic acid (HA) or sialic acids (SA), which are also known to be involved in mechanotransduction [16].
ETB was found to be SS-dependent and may also be partially HS-dependent, though our results showed no statistically significant difference between NT and Hep-III samples. The opposing trends of decreased gene expression alongside increased protein expression suggest that ETB regulation extends beyond simple HS-mediated SS-dependency, potentially involving post translational mechanisms. The lack of a significant SS-induced change in ETB expression in Hep-III-treated samples, which contrasted with the untreated condition, suggests that HS degradation impaired the mechanotransduction pathway responsible for mediating ETB upregulation under SS. These findings, together with the observed SS-dependent regulation of ETB, suggest that this response may be mediated, at least in part, by other GCX components with mechanotransducing properties, such as HA or SA [16]. It is also possible that a critical threshold of HS degradation is necessary to induce a statistically significant alteration in ETB expression.
Increased ETB protein expression coupled with decreased gene expression in response to 12 hours of exposure to uniform SS implies that there may be a shift in overall ETB expression in HLMVEC occurring around 12 hours of SS exposure. Consistent with the complex expression pattern of ET-1, exploring a broader range of SS intensities and exposure durations may help identify further modulatory effects on ETB expression.
While GCX components such as HS are anchored to the cytoskeleton via transmembrane HSPGs [48], transmembrane protein ETB is not known to be directly connected to the cytoskeleton. However, ETB may interact with the cytoskeleton through a signaling pathway that modulates the release of NO through eNOS activation [21,49,50]. This indicates that SS-dependence may rely on more than just HS-induced mechanotransduction. Krawczyk et al. found that the actin cytoskeleton was involved in transcriptional control of ETB via depolymerization of actin [51]. Binding of ET-1 to ETB in the endothelium begins a signaling cascade leading to actin-myosin interaction and SMC contraction [21]. Thi et al. have demonstrated the connection between GCX and the actin cortical web just beneath the plasma membrane within the EC [48]. These findings suggest that while alterations to the HS mechanotransduction pathway may still influence ETB regulation, additional pathways likely contribute, offering opportunities for further exploration beyond the scope of our current results.
Additionally, HS-dependent ETB expression may influence gene expression or post-translational regulation of ET-1. ETB is known to be concentrated in specific membrane microdomains such as caveolae and lipid rafts [52]. HS and glypican-1 have also been shown to cluster in lipid rafts when exposed to SS [53]. HS or HSPGs may cluster or organize ETB conformation or mobility.
4.4. Literature Comparison
These results suggest that HS is partially involved in regulation of ET-1. However, Morita et al. have demonstrated SS-induced alterations in EC cytoskeleton structures are responsible for increased ET-1 synthesis in porcine aortic ECs [54] and the GCX is known to be connected to the cytoskeleton [48]. Our results from static culture treatment with Hep-III showed a small but statistically significant increase in ET-1 protein expression but not gene expression when HS is cleaved. Additionally, the SS-dependent increase in ET-1 gene expression seen under high SS conditions was reduced by Hep-III treatment. These results, coupled with the known cytoskeletal connection from Morita et al. suggest that reducing the mechanotransduction ability of HLMVECs may lead to a response in ET-1 expression, suggesting a potential HS-dependence of ET-1 despite this result not being observed under all SS conditions.
ET-1 expression has been shown to be multi-phasic, with downregulation and upregulation both occurring in response to different SS magnitudes and varied SS exposure durations [55]. In contrast to our observations, Morawietz et al. and others have reported ET-1 mRNA expression as downregulated under long-term (8 and 24hr) exposure to 15 dynes/cm2 in human umbilical vein ECs (HUVEC) [17,56], while others, such as Morita et al. have reported upregulation of ET-1 in porcine aortic ECs under 5 dynes/cm2 for 6-12 hours [40,54]. Other studies have also reported elevated ET-1 mRNA expression in porcine ECs under low SS conditions. Yoshizumi et al. and others have found that hemodynamic SS stimulates ET-1 secretion [18,40]. These observations align with our findings regarding post-translational regulation of ET-1. Notably, shear-dependent ET-1 expression in HLMVECs remains largely unexplored. Given the distinct gene regulation profiles between EC types and the differing native environments of HUVECs and HLMVECs, and the known variability in GCX structure across organs [57], it is plausible that HLMVECs exhibit a unique response to SS compared to HUVECs, which may lead to differential expression of ET-1 and ETB. Exploring their expression profiles in cell types across donors would add valuable insight into their function.
Additionally, application of SS in many cases was performed using a cone-and-plate viscometer which applies SS differently to the parallel-plate flow chamber used in this study. Cone-and-plate viscometers have been shown to introduce secondary flow characteristics, causing more disturbed flow conditions than parallel-plate flow chambers which may lead to more varied or inconsistent cellular responses [38,58]. It may be the case that the method of SS application plays an important role in ET-1 gene regulation. The specific SS magnitude imparted on the cells also appears to be critical to the gene expression profile of ET-1.
The response of ETB to SS and its regulatory mechanisms are not yet well understood. ETB, a GPCR, belongs to a class of receptors known to be SS-sensitive in ECs [20,21,59]. Morawietz et al. reported an increase of ETB mRNA in HUVECs following prolonged (24hr) SS exposure, which they attributed to an NO-dependent mechanism [17]. Similarly, Tang et al. observed elevated ETB mRNA levels in rat pulmonary microvascular endothelial cells after 12 hours of SS exposure and noted an increase in ETB protein levels after 24 hours [49]. Supporting these findings, Redmond et al. demonstrated upregulation of ETB mRNA under SS using a transcapillary culture model on bovine aortic ECs [60].
In addition to SS, ETB has also been shown to be modulated by other stimuli, including perfusion pressure, where increased pressure leads to upregulation of ETB mRNA [61,62], as well as cytokines, growth factors, including TNF-α and fibroblast growth factor – and low-density lipoproteins [63,64]. Our results confirm the SS-dependence of ETB but yielded an opposite change in ETB mRNA than what Morawietz et al. and Tang et al. observed, likely due to the different SS exposure durations and cell type of our experiments. To the best of the authors knowledge, limited studies have explored ETB SS-dependence in endothelial cells, with only a few groups, including Morawietz et al. and Tang et al. reporting relevant data.
The response of GCX and its component HS on the EC surface to uniform SS is well understood. HS proteoglycan mRNA and its response to SS has not been as extensively studied. Gene expression of HS proteoglycans perlecan and syndecan-1 was not significantly changed under exposure to 5, 15, and 25 dynes/cm2 of uniform SS, indicating that exposure to SS at these magnitudes for 12 hours may not induce HS proteoglycan synthesis in ECs. Liu et al. demonstrated syndecan-1 upregulation due to short-term exposure to 4, 10, and 15 dynes/cm2 of SS in HUVEC with a peak in expression between 0.5 and 8 hours, but this effect was reduced or eliminated by long-term exposure (24-hr) [41]. They did not examine higher SS magnitudes or 12-hour exposure to SS. Russo et al. demonstrated increased perlecan gene expression under 4 dynes/cm2 of SS for 4 hours and a decrease in perlecan gene expression under 12 dynes/cm2 of SS for 4 hours compared to static controls using rabbit aortic ECs [65]. These differences in SS magnitude and time as well as cell type may explain the differential results in our study. Time course studies would aid in clarifying the SS-dependence of ETB. Future studies should also investigate the role of glypican-1, a key HSPG that modulates nitric oxide production and and endothelial remodeling [11,12]. While the role of glypican-1 in mechanotransduction and vascular homeostasis makes it a logical candidate for investigation, resource and time constraints prevented its inclusion in the current study.
In conclusion, further research is needed to explore ET-1 secretion dynamics, the effects of ETB antagonism, and additional mechanisms of GCX disruption. This study did not assess ET-1 secretion through ELISA or examine intracellular protein localization, both of which are important for clarifying the disconnect between gene upregulation and protein-level changes observed in our data. Future studies employing HS-specific knockdown models, such as perlecan or syndecan-1 CRISPR, may help identify the key HSPGs involved in ETB regulation. Moreover, analyzing HS sulfation patterns such as through 3-O sulfation assays could reveal specific modifications that influence ETB localization and function. Investigating ETB internalization and recycling pathways under SS will also provide insights into HS-mediated receptor trafficking. Additionally, atomic force microscopy (AFM) could be employed to quantify the binding forces between ET-1 and ETB in both healthy and diseased GCX states, offering a unique perspective on whether the GCX directly modulates ETB production or release. Together, these approaches will further elucidate the complex interplay between the GCX and ETB under SS conditions.
5. Conclusions
In summary, the complex relationship between ET-1, ETB, and HS and its proteoglycans was investigated. We found clear SS-dependence of both ET-1 and ETB, and that HS is potentially involved in regulation of both ET-1 and ETB, though to differing degrees and without conclusive results. SS triggers HS-independent transcriptional upregulation of ET-1, but not an increase in protein levels within the cell and on the cell surface, suggesting post-translational or secretion-based regulation of ET-1. We showed that SS induces gene downregulation of ETB and protein upregulation, demonstrating that ETB is SS-dependent and responsive to SS at both transcriptional and protein levels. Little research has been done in the area of ETB SS-dependence, and this research adds valuable insight into the regulation of ETB. SS is vital for vascular regulation and GCX health and homeostasis [3]. Degradation of HS may reduce the SS-dependence of ETB at low and physiological SS magnitudes by disrupting the mechanotransduction ability of the endothelium. Taken together, these results indicate that HS may facilitate ETB membrane localization, stability, or trafficking, though this response was minimal. While not strongly correlated, some change in ETB expression between enzyme-treated and untreated samples was seen, indicating the hypothesized cooperation with HS and likely with other GCX components. Finally, we demonstrated the SS-dependent increase in HS expression through post-translational remodeling. These observations suggest a complex relationship between SS, GCX integrity, ETB function, and ET-1 regulation within the cell. Understanding these complex relationships and further investigating the SS-dependence of ETB may aid in diagnosis and treatment for vascular diseases involving regulation of ETB and changes in SS such as hypertension.
Author Contributions
Conceptualization, S.A.M. and C.H.; methodology, C.H.; software, C.H.; validation, C.H. and S.N.N.; formal analysis, C.H.; investigation, C.H.; resources, S.A.M.; data curation, C.H. and S.A.M;; writing—original draft preparation, C.H. and S.N.N.; writing—review and editing, C.H., S.N.N., and S.A.M.; visualization, C.H. and S.A.M.; supervision, S.A.M.; project administration, S.A.M.; funding acquisition, S.A.M. All authors have read and agreed to the published version of the manuscript.
Funding
This research received no external funding
Institutional Review Board Statement
Not applicable.
Informed Consent Statement
Not applicable.
Data Availability Statement
The raw image and qPCR data and all analysis tools used in this study, including ImageJ FIJI macros and CellProfiler pipelines, will be made available by the authors on request.
Conflicts of Interest
The authors declare no conflicts of interest.
Abbreviations
The following abbreviations are used in this manuscript:
| GCX | Endothelial Glycocalyx |
| HLMVEC | Human Lung Microvascular Endothelial Cells |
| ECs | Endothelial Cells |
| GAGs | Glycosaminoglycans |
| SS | Shear Stress |
| UF | Uniform Flow |
| HS | Heparan Sulfate |
| ET-1 | Endothelin-1 |
| ETB | Endothelin B Receptor |
| HSPG | Heparan Sulfate Proteoglycan |
Appendix A
Appendix A.1

Table A1.
Primer sequences.
| Primer Target | Forward Sequence | Reverse Sequence |
|---|---|---|
| ET-1 | TCAACACTCCCGAGCACGTT | TCACGGTCTGTTGCCTTTGT |
| ETB | ATGATCACCTAAAGCAGAGACGG | CAGAGGGCAAAGACAAGGAC |
| HSPG2 | AGCATCTCAGGAGACGACCT | GAAATTCACCAGGGCTCGGA |
| SDC1 [34] | CTGCCGCAAATTGTGGCTAC | TGAGCCGGAGAAGTTGTCAGA |
| GAPDH | ACCATCTTCCAGGAGCGAGA | GACTCCACGACGTACTCAGC |
References
- Reitsma, S.; Slaaf, D.W.; Vink, H.; van Zandvoort, M.A.M.J.; oude Egbrink, M.G.A. The Endothelial Glycocalyx: Composition, Functions, and Visualization. Pflugers Arch. 2007, 454, 345–359. [Google Scholar] [CrossRef] [PubMed]
- Vittum, Z.; Cocchiaro, S.; Mensah, S.A. Basal Endothelial Glycocalyx’s Response to Shear Stress: A Review of Structure, Function, and Clinical Implications. Front. Cell Dev. Biol. 2024, 12, 1371769. [Google Scholar] [CrossRef] [PubMed]
- Harding, I.C.; Mitra, R.; Mensah, S.A.; Nersesyan, A.; Bal, N.N.; Ebong, E.E. Endothelial Barrier Reinforcement Relies on Flow-Regulated Glycocalyx, a Potential Therapeutic Target. Biorheology 2019, 56, 131–149. [Google Scholar] [CrossRef] [PubMed]
- Weinbaum, S.; Tarbell, J.; Damiano, E. The Structure and Function of the Endothelial Glycocalyx Layer. Annu. Rev. Biomed. Eng. 2007, 9, 121–167. [Google Scholar] [CrossRef]
- Tarbell, J.M.; Ebong, E.E. The Endothelial Glycocalyx: A Mechano-Sensor and -Transducer. Sci. Signal. 2008, 1, pt8–pt8. [Google Scholar] [CrossRef]
- Fu, B.M.; Tarbell, J.M. Mechano-Sensing and Transduction by Endothelial Surface Glycocalyx: Composition, Structure, and Function. Wiley Interdiscip. Rev. Syst. Biol. Med. 2013, 5, 381–390. [Google Scholar] [CrossRef]
- Grantham, J.A.; Schirger, J.A.; Williamson, E.E.; Heublein, D.M.; Wennberg, P.W.; Kirchengast, M.; Muenter, K.; Subkowski, T.; Burnett, J.C.J. Enhanced Endothelin-Converting Enzyme Immunoreactivity in Early Atherosclerosis. J. Cardiovasc. Pharmacol. 1998, 31, S22. [Google Scholar] [CrossRef]
- Kinlay, S.; Behrendt, D.; Wainstein, M.; Beltrame, J.; Fang, J.C.; Creager, M.A.; Selwyn, A.P.; Ganz, P. Role of Endothelin-1 in the Active Constriction of Human Atherosclerotic Coronary Arteries. Circulation 2001, 104, 1114–1118. [Google Scholar] [CrossRef]
- Chester, A.H.; Yacoub, M.H. The Role of Endothelin-1 in Pulmonary Arterial Hypertension. Glob. Cardiol. Sci. Pract. 2014, 2014, 62–78. [Google Scholar] [CrossRef]
- Cardillo, C.; Kilcoyne, C.M.; Waclawiw, M.; Cannon, R.O.; Panza, J.A. Role of Endothelin in the Increased Vascular Tone of Patients With Essential Hypertension. Hypertension 1999, 33, 753–758. [Google Scholar] [CrossRef]
- Ebong, E.E.; Lopez-Quintero, S.V.; Rizzo, V.; Spray, D.C.; Tarbell, J.M. Shear-Induced Endothelial NOS Activation and Remodeling via Heparan Sulfate, Glypican-1, and Syndecan-1. Integr. Biol. Quant. Biosci. Nano Macro 2014, 6, 338–347. [Google Scholar] [CrossRef] [PubMed]
- Bartosch, A.M.W.; Mathews, R.; Mahmoud, M.M.; Cancel, L.M.; Haq, Z.S.; Tarbell, J.M. Heparan Sulfate Proteoglycan Glypican-1 and PECAM-1 Cooperate in Shear-Induced Endothelial Nitric Oxide Production. Sci. Rep. 2021, 11, 11386. [Google Scholar] [CrossRef]
- Pretorius, D.; Richter, R.P.; Anand, T.; Cardenas, J.C.; Richter, J.R. Alterations in Heparan Sulfate Proteoglycan Synthesis and Sulfation and the Impact on Vascular Endothelial Function. Matrix Biol. Plus 2022, 16, 100121. [Google Scholar] [CrossRef]
- Melrose, J. Perlecan, a Modular Instructive Proteoglycan with Diverse Functional Properties. Int. J. Biochem. Cell Biol. 2020, 128, 105849. [Google Scholar] [CrossRef] [PubMed]
- Florian, J.A.; Kosky, J.R.; Ainslie, K.; Pang, Z.; Dull, R.O.; Tarbell, J.M. Heparan Sulfate Proteoglycan Is a Mechanosensor on Endothelial Cells. Circ. Res. 2003, 93, e136–e142. [Google Scholar] [CrossRef] [PubMed]
- Pahakis, M.Y.; Kosky, J.R.; Dull, R.O.; Tarbell, J.M. The Role of Endothelial Glycocalyx Components in Mechanotransduction of Fluid Shear Stress. Biochem. Biophys. Res. Commun. 2007, 355, 228–233. [Google Scholar] [CrossRef]
- Morawietz, H.; Talanow, R.; Szibor, M.; Rueckschloss, U.; Schubert, A.; Bartling, B.; Darmer, D.; Holtz, J. Regulation of the Endothelin System by Shear Stress in Human Endothelial Cells. J. Physiol. 2000, 525, 761–770. [Google Scholar] [CrossRef]
- Kuchan, M.J.; Frangos, J.A. Shear Stress Regulates Endothelin-1 Release via Protein Kinase C and cGMP in Cultured Endothelial Cells. Am. J. Physiol.-Heart Circ. Physiol. 1993, 264, H150–H156. [Google Scholar] [CrossRef]
- Malek, A.; Izumo, S. Physiological Fluid Shear Stress Causes Downregulation of Endothelin-1 mRNA in Bovine Aortic Endothelium. Am. J. Physiol.-Cell Physiol. 1992, 263, C389–C396. [Google Scholar] [CrossRef]
- Halaka, M.; Hired, Z.A.; Rutledge, G.E.; Hedgepath, C.M.; Anderson, M.P.; St. John, H.; Do, J.M.; Majmudar, P.R.; Walker, C.; Alawawdeh, A.; et al. Differences in Endothelin B Receptor Isoforms Expression and Function in Breast Cancer Cells. J. Cancer 2020, 11, 2688–2701. [CrossRef]
- Mazzuca, M.Q.; Khalil, R.A. Vascular Endothelin Receptor Type B: Structure, Function and Dysregulation in Vascular Disease. Biochem. Pharmacol. 2012, 84, 147–162. [Google Scholar] [CrossRef] [PubMed]
- Pollock, D.M.; Schneider, M.P. Clarifying Endothelin Type B Receptor Function. Hypertension 2006, 48, 211–212. [Google Scholar] [CrossRef]
- Rapoport, R.M.; Zuccarello, M. EndothelinA-endothelinB Receptor Cross-Talk and Endothelin Receptor Binding. J. Pharm. Pharmacol. 2011, 63, 1373–1377. [Google Scholar] [CrossRef] [PubMed]
- Rapoport, R.M.; Zuccarello, M. EndothelinA–EndothelinB Receptor Cross Talk in Endothelin-1–Induced Contraction of Smooth Muscle. J. Cardiovasc. Pharmacol. 2012, 60, 483. [Google Scholar] [CrossRef]
- Ivy, D.D.; McMurtry, I.F.; Yanagisawa, M.; Gariepy, C.E.; Le Cras, T.D.; Gebb, S.A.; Morris, K.G.; Wiseman, R.C.; Abman, S.H. Endothelin B Receptor Deficiency Potentiates ET-1 and Hypoxic Pulmonary Vasoconstriction. Am. J. Physiol.-Lung Cell. Mol. Physiol. 2001, 280, L1040–L1048. [Google Scholar] [CrossRef]
- Perez-Aguilar, S.; Torres-Tirado, D.; Martell-Gallegos, G.; Velarde-Salcedo, J.; Barba-de la Rosa, A.P.; Knabb, M.; Rubio, R. G Protein-Coupled Receptors Mediate Coronary Flow- and Agonist-Induced Responses via Lectin-Oligosaccharide Interactions. Am. J. Physiol.-Heart Circ. Physiol. 2014, 306, H699–H708. [Google Scholar] [CrossRef]
- Dragovich, M.A.; Chester, D.; Fu, B.M.; Wu, C.; Xu, Y.; Goligorsky, M.S.; Zhang, X.F. Mechanotransduction of the Endothelial Glycocalyx Mediates Nitric Oxide Production through Activation of TRP Channels. Am. J. Physiol.-Cell Physiol. 2016, 311, C846–C853. [Google Scholar] [CrossRef]
- Xu, J.; Mathur, J.; Vessières, E.; Hammack, S.; Nonomura, K.; Favre, J.; Grimaud, L.; Petrus, M.; Francisco, A.; Li, J.; et al. GPR68 Senses Flow and Is Essential for Vascular Physiology. Cell 2018, 173, 762–775.e16. [Google Scholar] [CrossRef] [PubMed]
- Hu, Y.; Chen, M.; Wang, M.; Li, X. Flow-Mediated Vasodilation through Mechanosensitive G Protein-Coupled Receptors in Endothelial Cells. Trends Cardiovasc. Med. 2022, 32, 61–70. [Google Scholar] [CrossRef]
- Schindelin, J.; Arganda-Carreras, I.; Frise, E.; Kaynig, V.; Longair, M.; Pietzsch, T.; Preibisch, S.; Rueden, C.; Saalfeld, S.; Schmid, B.; et al. Fiji: An Open-Source Platform for Biological-Image Analysis. Nat. Methods 2012, 9, 676–682. [Google Scholar] [CrossRef]
- Stirling, D.R.; Swain-Bowden, M.J.; Lucas, A.M.; Carpenter, A.E.; Cimini, B.A.; Goodman, A. CellProfiler 4: Improvements in Speed, Utility and Usability. BMC Bioinformatics 2021, 22, 433. [Google Scholar] [CrossRef]
- Mensah, S.A.; Nersesyan, A.A.; Harding, I.C.; Lee, C.I.; Tan, X.; Banerjee, S.; Niedre, M.; Torchilin, V.P.; Ebong, E.E. Flow-Regulated Endothelial Glycocalyx Determines Metastatic Cancer Cell Activity. FASEB J. Off. Publ. Fed. Am. Soc. Exp. Biol. 2020, 34, 6166–6184. [Google Scholar] [CrossRef]
- Cancel, L.M.; Ebong, E.E.; Mensah, S.; Hirshberg, C.; Tarbell, J.M. Endothelial Glycocalyx, Apoptosis and Inflammation in an Atherosclerotic Mouse Model. Atherosclerosis 2016, 252, 136–146. [Google Scholar] [CrossRef] [PubMed]
- Taghavi, S.; Abdullah, S.; Shaheen, F.; Mueller, L.; Gagen, B.; Duchesne, J.; Steele, C.; Pociask, D.; Kolls, J.; Jackson-Weaver, O. Glycocalyx Degradation and the Endotheliopathy of Viral Infection. PLoS ONE 2022, 17, e0276232. [Google Scholar] [CrossRef]
- Livak, K.J.; Schmittgen, T.D. Analysis of Relative Gene Expression Data Using Real-Time Quantitative PCR and the 2−ΔΔCT Method. Methods 2001, 25, 402–408. [Google Scholar] [CrossRef] [PubMed]
- Ye, J.; Coulouris, G.; Zaretskaya, I.; Cutcutache, I.; Rozen, S.; Madden, T.L. Primer-BLAST: A Tool to Design Target-Specific Primers for Polymerase Chain Reaction. BMC Bioinformatics 2012, 13, 134. [Google Scholar] [CrossRef] [PubMed]
- Fiji. Available online: https://imagej.github.io/software/fiji/index (accessed on 11 March 2025).
- Harding, I.C.; Mitra, R.; Mensah, S.A.; Herman, I.M.; Ebong, E.E. Pro-Atherosclerotic Disturbed Flow Disrupts Caveolin-1 Expression, Localization, and Function via Glycocalyx Degradation. J. Transl. Med. 2018, 16, 364. [Google Scholar] [CrossRef]
- Charoenphol, P.; Onyskiw, P.J.; Carrasco-Teja, M.; Eniola-Adefeso, O. Particle-Cell Dynamics in Human Blood Flow: Implications for Vascular-Targeted Drug Delivery. J. Biomech. 2012, 45, 2822–2828. [Google Scholar] [CrossRef]
- Yoshizumi, M.; Kurihara, H.; Sugiyama, T.; Takaku, F.; Yanagisawa, M.; Masaki, T.; Yazaki, Y. Hemodynamic Shear Stress Stimulates Endothelin Production by Cultured Endothelial Cells. Biochem. Biophys. Res. Commun. 1989, 161, 859–864. [Google Scholar] [CrossRef]
- Liu, J.; Yan, Z.; Zhang, Y.; Wu, J.; Liu, X.H.; Zeng, Y. Hemodynamic Shear Stress Regulates the Transcriptional Expression of Heparan Sulfate Proteoglycans in Human Umbilical Vein Endothelial Cell. Cell. Mol. Biol. 2016. [Google Scholar]
- Boulanger, C.; Lüscher, T.F. Release of Endothelin from the Porcine Aorta. Inhibition by Endothelium-Derived Nitric Oxide. J. Clin. Invest. 1990, 85, 587–590. [Google Scholar] [CrossRef] [PubMed]
- Emori, T.; Hirata, Y.; Ohta, K.; Kanno, K.; Eguchi, S.; Imai, T.; Shichiri, M.; Marumo, F. Cellular Mechanism of Endothelin-1 Release by Angiotensin and Vasopressin. Hypertension 1991, 18, 165–170. [Google Scholar] [CrossRef] [PubMed]
- Kourembanas, S.; McQuillan, L.P.; Leung, G.K.; Faller, D.V. Nitric Oxide Regulates the Expression of Vasoconstrictors and Growth Factors by Vascular Endothelium under Both Normoxia and Hypoxia. J. Clin. Invest. 1993, 92, 99–104. [Google Scholar] [CrossRef] [PubMed]
- Banecki, K.M.R.M.; Dora, K.A. Endothelin-1 in Health and Disease. Int. J. Mol. Sci. 2023, 24, 11295. [Google Scholar] [CrossRef]
- Hynynen, M.M.; Khalil, R.A. The Vascular Endothelin System in Hypertension – Recent Patents and Discoveries. Recent Patents Cardiovasc. Drug Discov. 2006, 1, 95–108. [Google Scholar] [CrossRef]
- Malek, A.M.; Zhang, J.; Jiang, J.; Alper, S.L.; Izumo, S. Endothelin-1 Gene Suppression by Shear Stress: Pharmacological Evaluation of the Role of Tyrosine Kinase, Intracellular Calcium, Cytoskeleton, and Mechanosensitive Channels. J. Mol. Cell. Cardiol. 1999, 31, 387–399. [Google Scholar] [CrossRef]
- Thi, M.M.; Tarbell, J.M.; Weinbaum, S.; Spray, D.C. The Role of the Glycocalyx in Reorganization of the Actin Cytoskeleton under Fluid Shear Stress: A “Bumper-Car” Model. Proc. Natl. Acad. Sci. U. S. A. 2004, 101, 16483–16488. [Google Scholar] [CrossRef]
- Tang, L.; Luo, B.; Patel, R.P.; Ling, Y.; Zhang, J.; Fallon, M.B. Modulation of Pulmonary Endothelial Endothelin B Receptor Expression and Signaling: Implications for Experimental Hepatopulmonary Syndrome. Am. J. Physiol.-Lung Cell. Mol. Physiol. 2007, 292, L1467–L1472. [Google Scholar] [CrossRef]
- Su, Y.; Edwards-Bennett, S.; Bubb, M.R.; Block, E.R. Regulation of Endothelial Nitric Oxide Synthase by the Actin Cytoskeleton. Am. J. Physiol.-Cell Physiol. 2003, 284, C1542–C1549. [Google Scholar] [CrossRef]
- Krawczyk, K.K.; Skovsted, G.F.; Perisic, L.; Dreier, R.; Berg, J.O.; Hedin, U.; Rippe, C.; Swärd, K. Expression of Endothelin Type B Receptors (EDNRB) on Smooth Muscle Cells Is Controlled by MKL2, Ternary Complex Factors, and Actin Dynamics. Am. J. Physiol.-Cell Physiol. 2018, 315, C873–C884. [Google Scholar] [CrossRef]
- Oh, P.; Horner, T.; Witkiewicz, H.; Schnitzer, J.E. Endothelin Induces Rapid, Dynamin-Mediated Budding of Endothelial Caveolae Rich in ET-B. J. Biol. Chem. 2012, 287, 17353–17362. [Google Scholar] [CrossRef] [PubMed]
- Zeng, Y.; Waters, M.; Andrews, A.; Honarmandi, P.; Ebong, E.E.; Rizzo, V.; Tarbell, J.M. Fluid Shear Stress Induces the Clustering of Heparan Sulfate via Mobility of Glypican-1 in Lipid Rafts. Am. J. Physiol.-Heart Circ. Physiol. 2013, 305, H811–H820. [Google Scholar] [CrossRef] [PubMed]
- Morita, T.; Kurihara, H.; Maemura, K.; Yoshizumi, M.; Yazaki, Y. Disruption of Cytoskeletal Structures Mediates Shear Stress-Induced Endothelin-1 Gene Expression in Cultured Porcine Aortic Endothelial Cells. J. Clin. Invest. 1993, 92, 1706–1712. [Google Scholar] [CrossRef]
- Goto, K.; Hama, H.; Kasuya, Y. Molecular Pharmacology and Pathophysiological Significance of Endothelin. Jpn. J. Pharmacol. 1996, 72, 261–290. [Google Scholar] [CrossRef]
- Ishibazawa, A.; Nagaoka, T.; Takahashi, T.; Yamamoto, K.; Kamiya, A.; Ando, J.; Yoshida, A. Effects of Shear Stress on the Gene Expressions of Endothelial Nitric Oxide Synthase, Endothelin-1, and Thrombomodulin in Human Retinal Microvascular Endothelial Cells. Invest. Ophthalmol. Vis. Sci. 2011, 52, 8496–8504. [Google Scholar] [CrossRef] [PubMed]
- Suzuki, A.; Tomita, H.; Okada, H. Form Follows Function: The Endothelial Glycocalyx. Transl. Res. 2022, 247, 158–167. [Google Scholar] [CrossRef]
- Wong, A.K.; LLanos, P.; Boroda, N.; Rosenberg, S.R.; Rabbany, S.Y. A Parallel-Plate Flow Chamber for Mechanical Characterization of Endothelial Cells Exposed to Laminar Shear Stress. Cell. Mol. Bioeng. 2016, 9, 127–138. [Google Scholar] [CrossRef]
- Chachisvilis, M.; Zhang, Y.-L.; Frangos, J.A. G Protein-Coupled Receptors Sense Fluid Shear Stress in Endothelial Cells. Proc. Natl. Acad. Sci. 2006, 103, 15463–15468. [Google Scholar] [CrossRef]
- Redmond, E.M.; Cahill, P.A.; Sitzmann, J.V. Flow-Mediated Regulation of Endothelin Receptors in Cocultured Vascular Smooth Muscle Cells: An Endothelium-Dependent Effect. J. Vasc. Res. 1997, 34, 425–435. [Google Scholar] [CrossRef]
- Lauth, M.; Berger, M.-M.; Cattaruzza, M.; Hecker, M. Elevated Perfusion Pressure Upregulates Endothelin-1 and Endothelin B Receptor Expression in the Rabbit Carotid Artery. Hypertension 2000, 35, 648–654. [Google Scholar] [CrossRef]
- Cahill, P.A.; Hou, M.; Hendrickson, R.; Wang, Y.; Zhang, S.; Redmond, E.M.; Sitzmann, J.V. Increased Expression of Endothelin Receptors in the Vasculature of Portal Hypertensive Rats: Role in Splanchnic Hemodynamics. Hepatology 1998, 28, 396. [Google Scholar] [CrossRef] [PubMed]
- Smith, P.J.W.; Teichert-Kuliszewska, K.; Monge, J.C.; Stewart, D.J. Regulation of Endothelin-B Receptor mRNA Expression in Human Endothelial Cells by Cytokines and Growth Factors. J. Cardiovasc. Pharmacol. 1998, 31, S158. [Google Scholar] [CrossRef] [PubMed]
- Muller, G.; Catar, R.A.; Niemann, B.; Barton, M.; Knels, L.; Wendel, M.; Morawietz, H. Upregulation of Endothelin Receptor B in Human Endothelial Cells by Low-Density Lipoproteins. Exp. Biol. Med. 2006, 231, 766–771. [Google Scholar] [CrossRef]
- Russo, T.A.; Banuth, A.M.M.; Nader, H.B.; Dreyfuss, J.L. Altered Shear Stress on Endothelial Cells Leads to Remodeling of Extracellular Matrix and Induction of Angiogenesis. PLoS ONE 2020, 15, e0241040. [Google Scholar] [CrossRef] [PubMed]
Figure 1.
Immunostaining results for ET-1 in cells exposed to 0, 5, 15, and 25 dynes/cm2 of uniform SS. Green represents ET-1, while blue represents cell nuclei. (a–d) Integrated intensity fold-change analysis of cells positive for ET-1 in NT and Hep-III conditions compared to NT static condition Confocal microscopy images of static controls (e,i), and samples exposed to 5 (f,j), 15 (g,k), and 25 (h,l) dynes/cm2 of uniform SS samples stained for ET-1 under NT and Hep-III conditions.
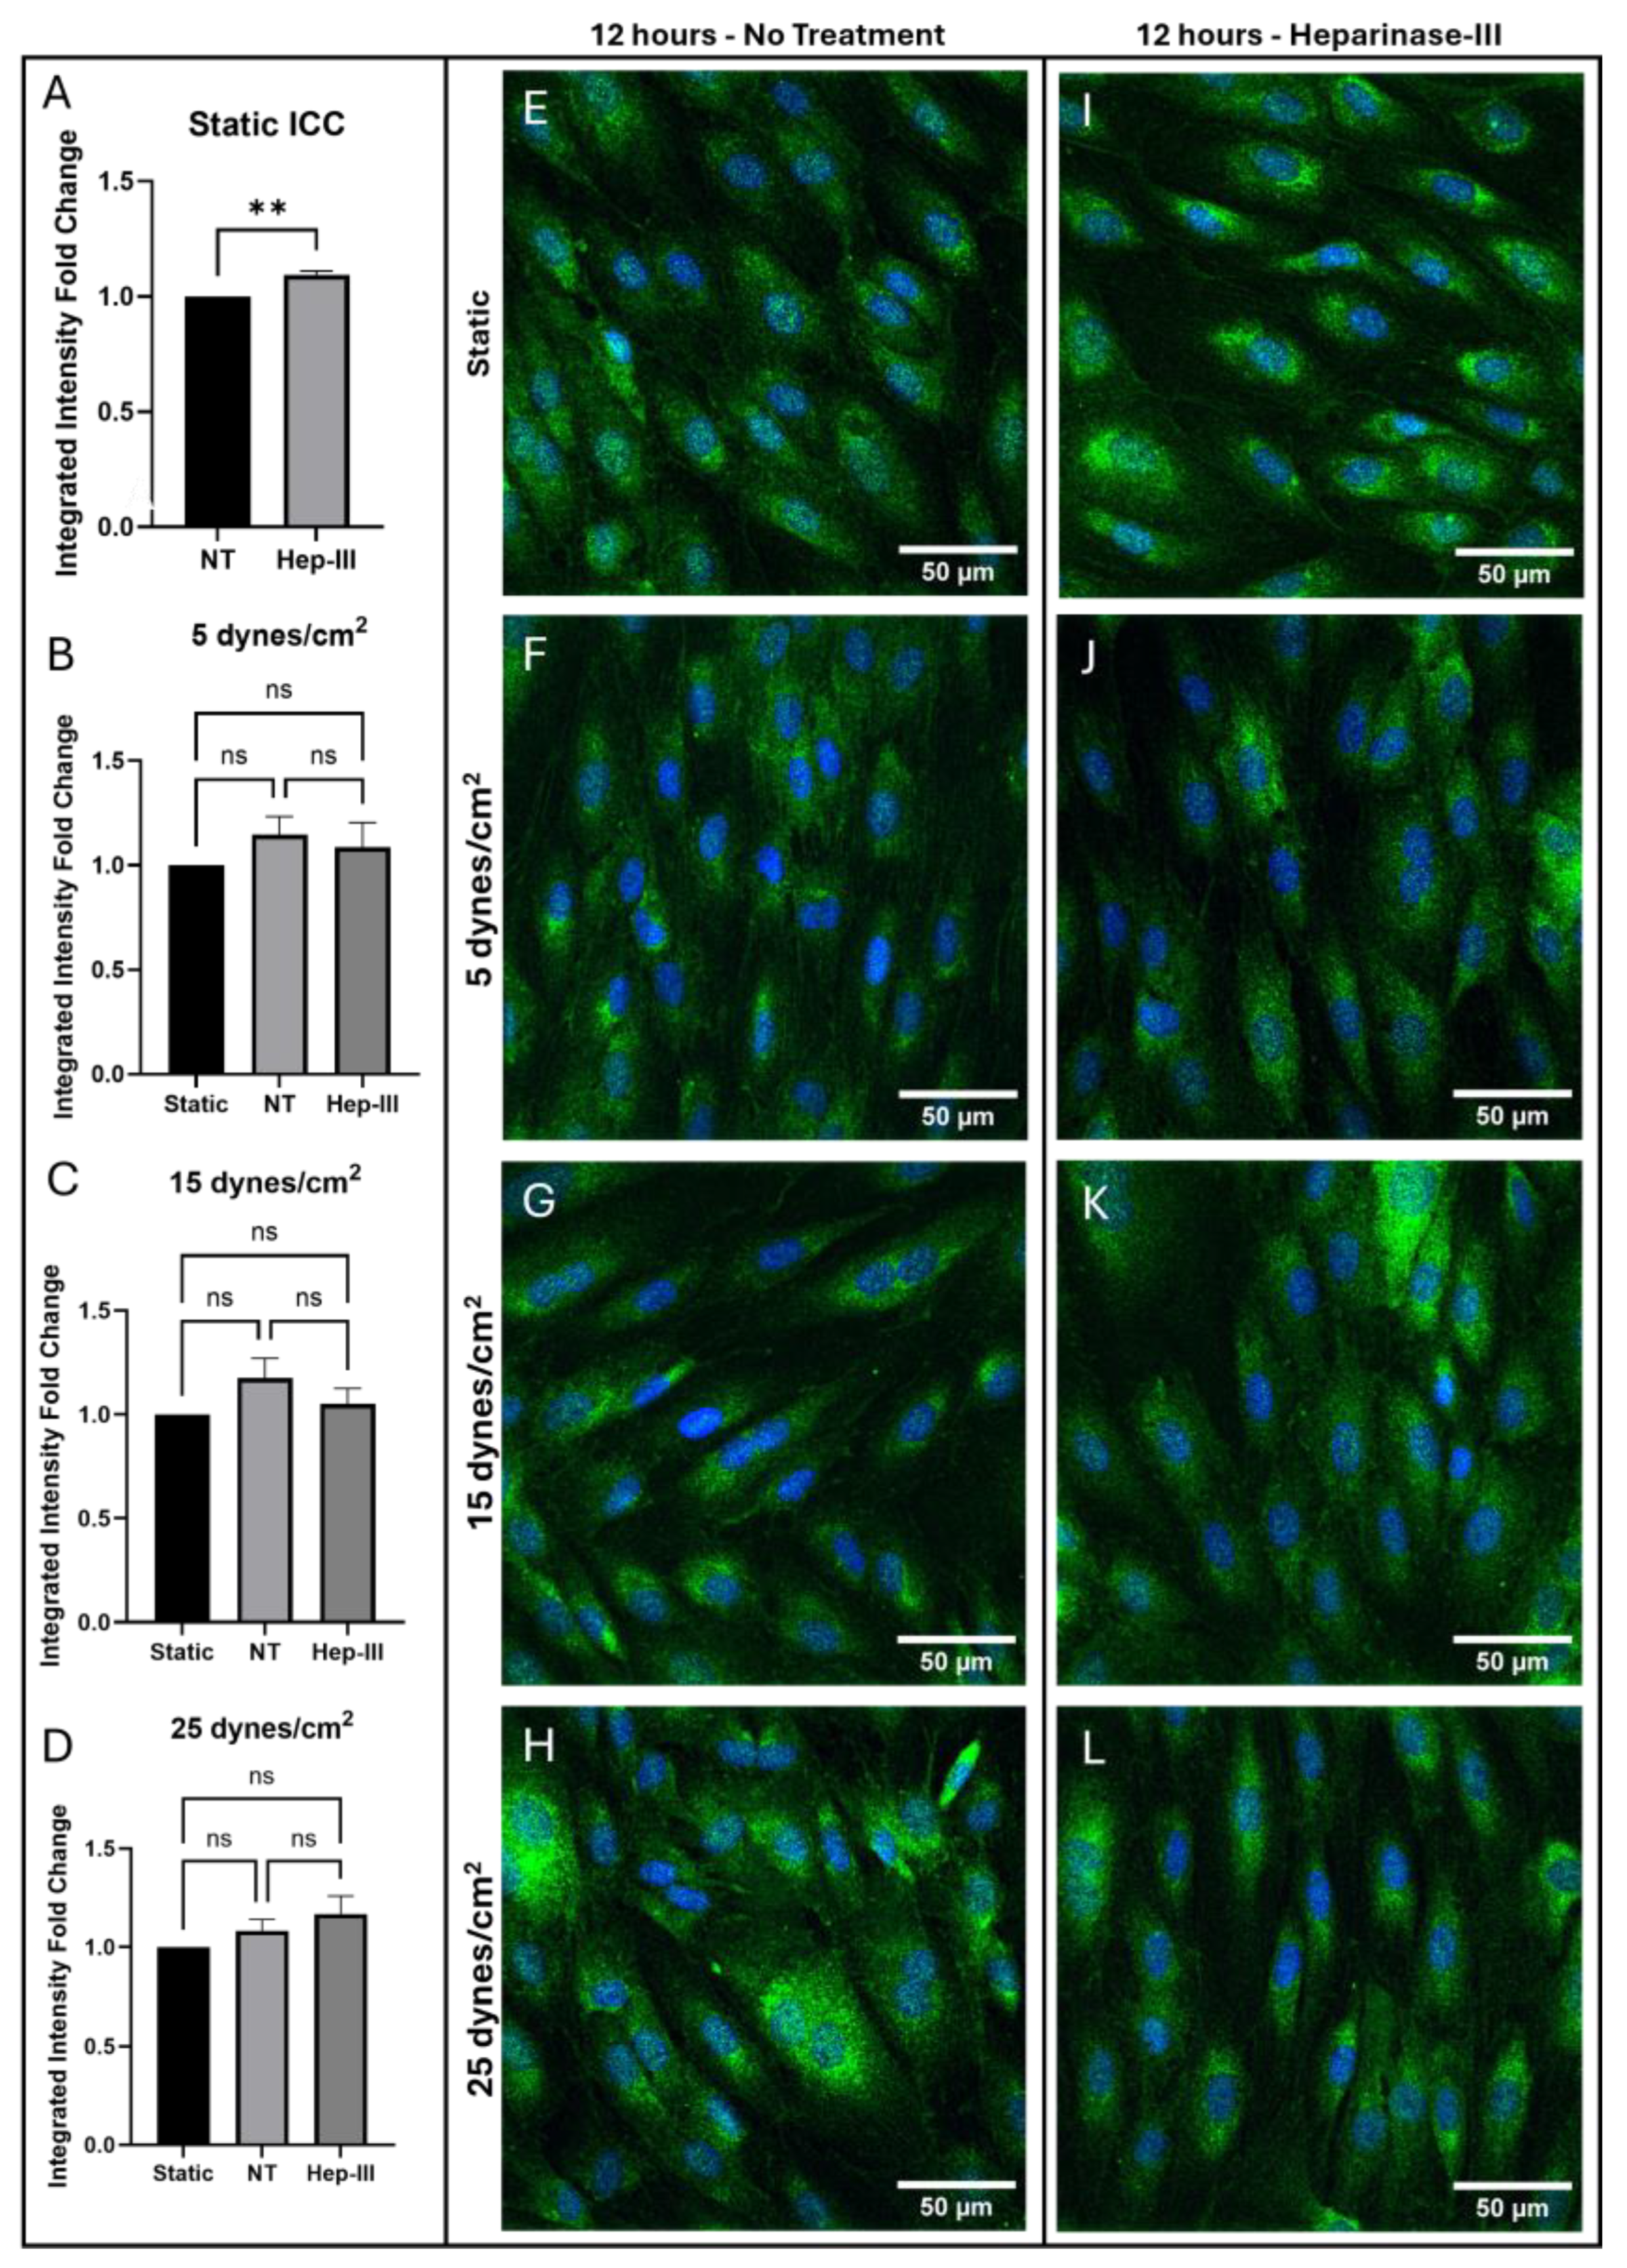
Figure 2.
qPCR results for ET-1 expression in cells exposed to (a) 0, (b) 5, (c) 15, and (d) 25 dynes/cm2 of uniform SS.
Figure 2.
qPCR results for ET-1 expression in cells exposed to (a) 0, (b) 5, (c) 15, and (d) 25 dynes/cm2 of uniform SS.
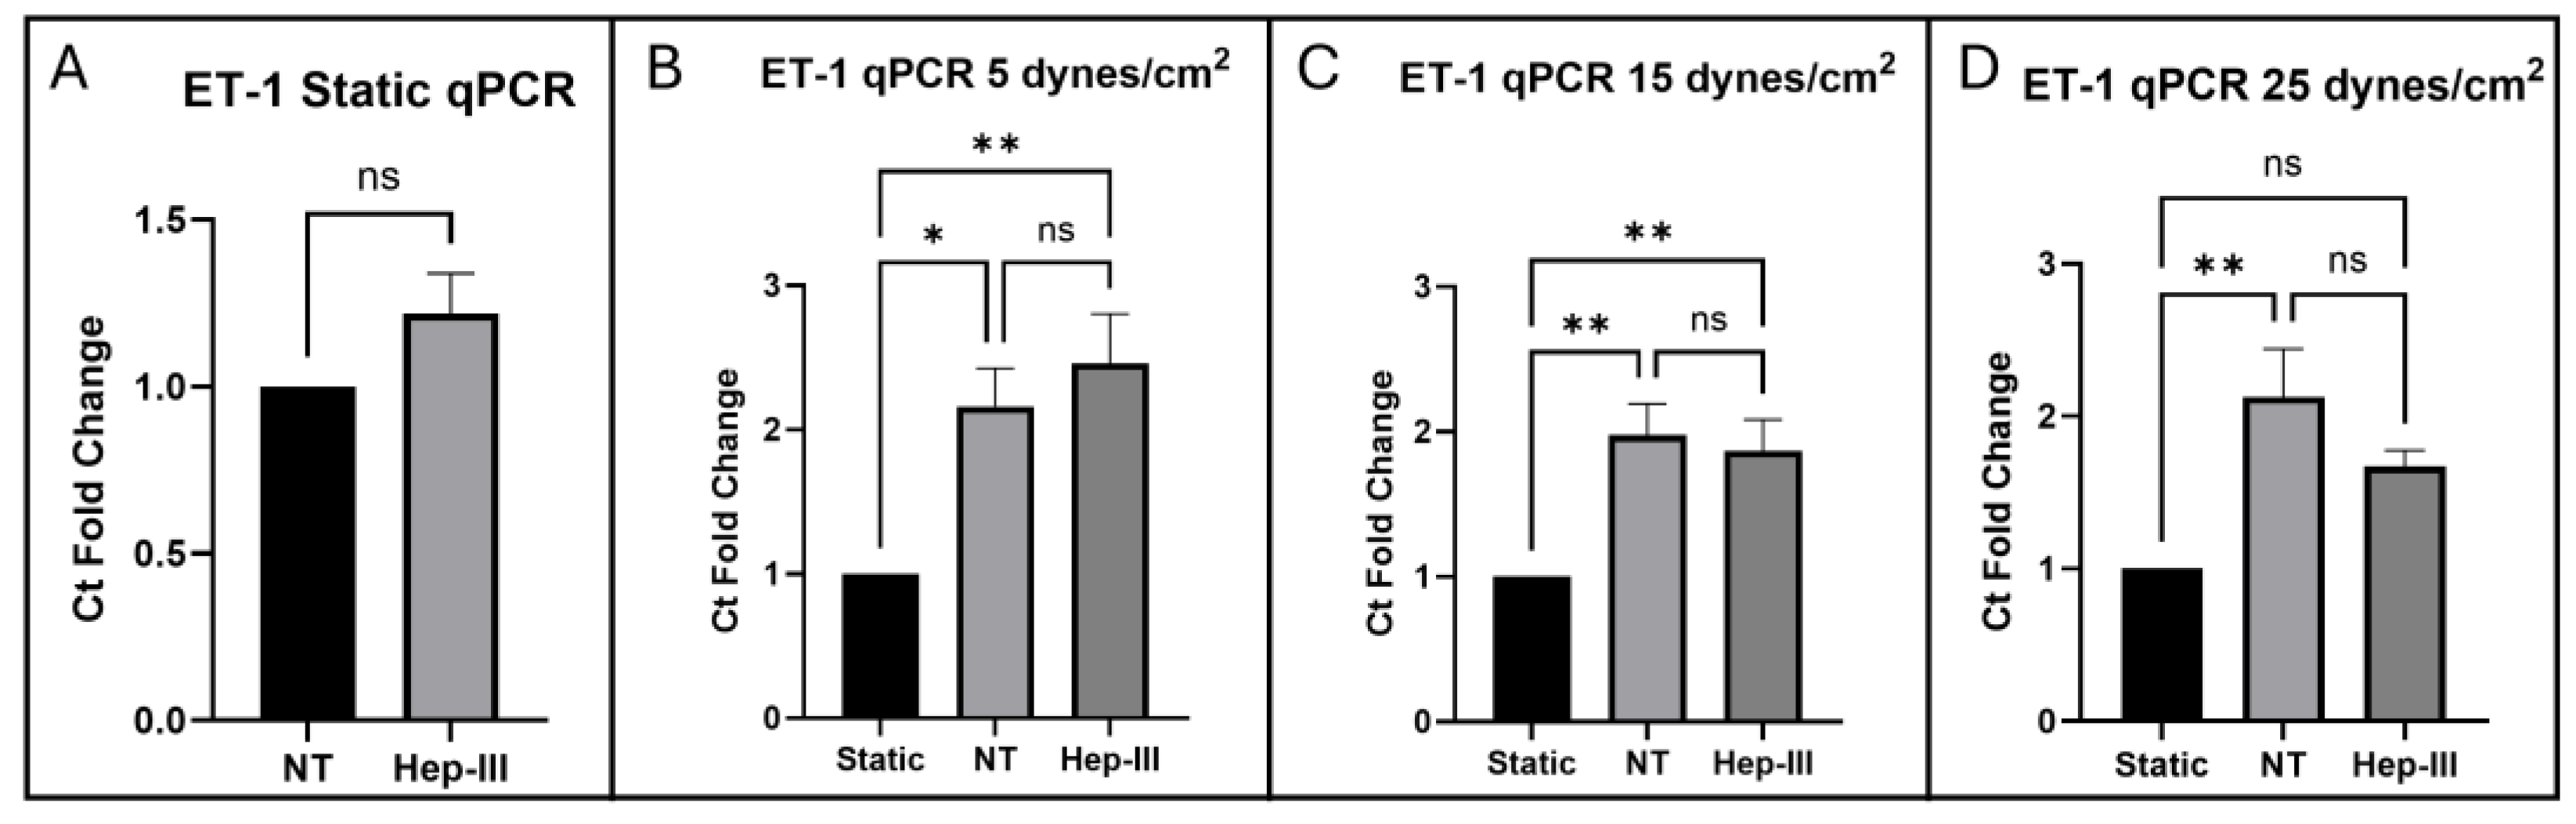
Figure 3.
Immunostaining results for ETB in cells exposed to 0, 5, 15, and 25 dynes/cm2 of uniform SS. Red represents ETB, while blue represents cell nuclei. (a–d) Integrated intensity fold-change analysis of cells positive for ETB in NT and Hep-III conditions compared to NT static condition Confocal microscopy images of static controls (e,i), and samples exposed to 5 (f,j), 15 (g,k), and 25 (h,l) dynes/cm2 of uniform SS samples stained for ETB under NT and Hep-III conditions.
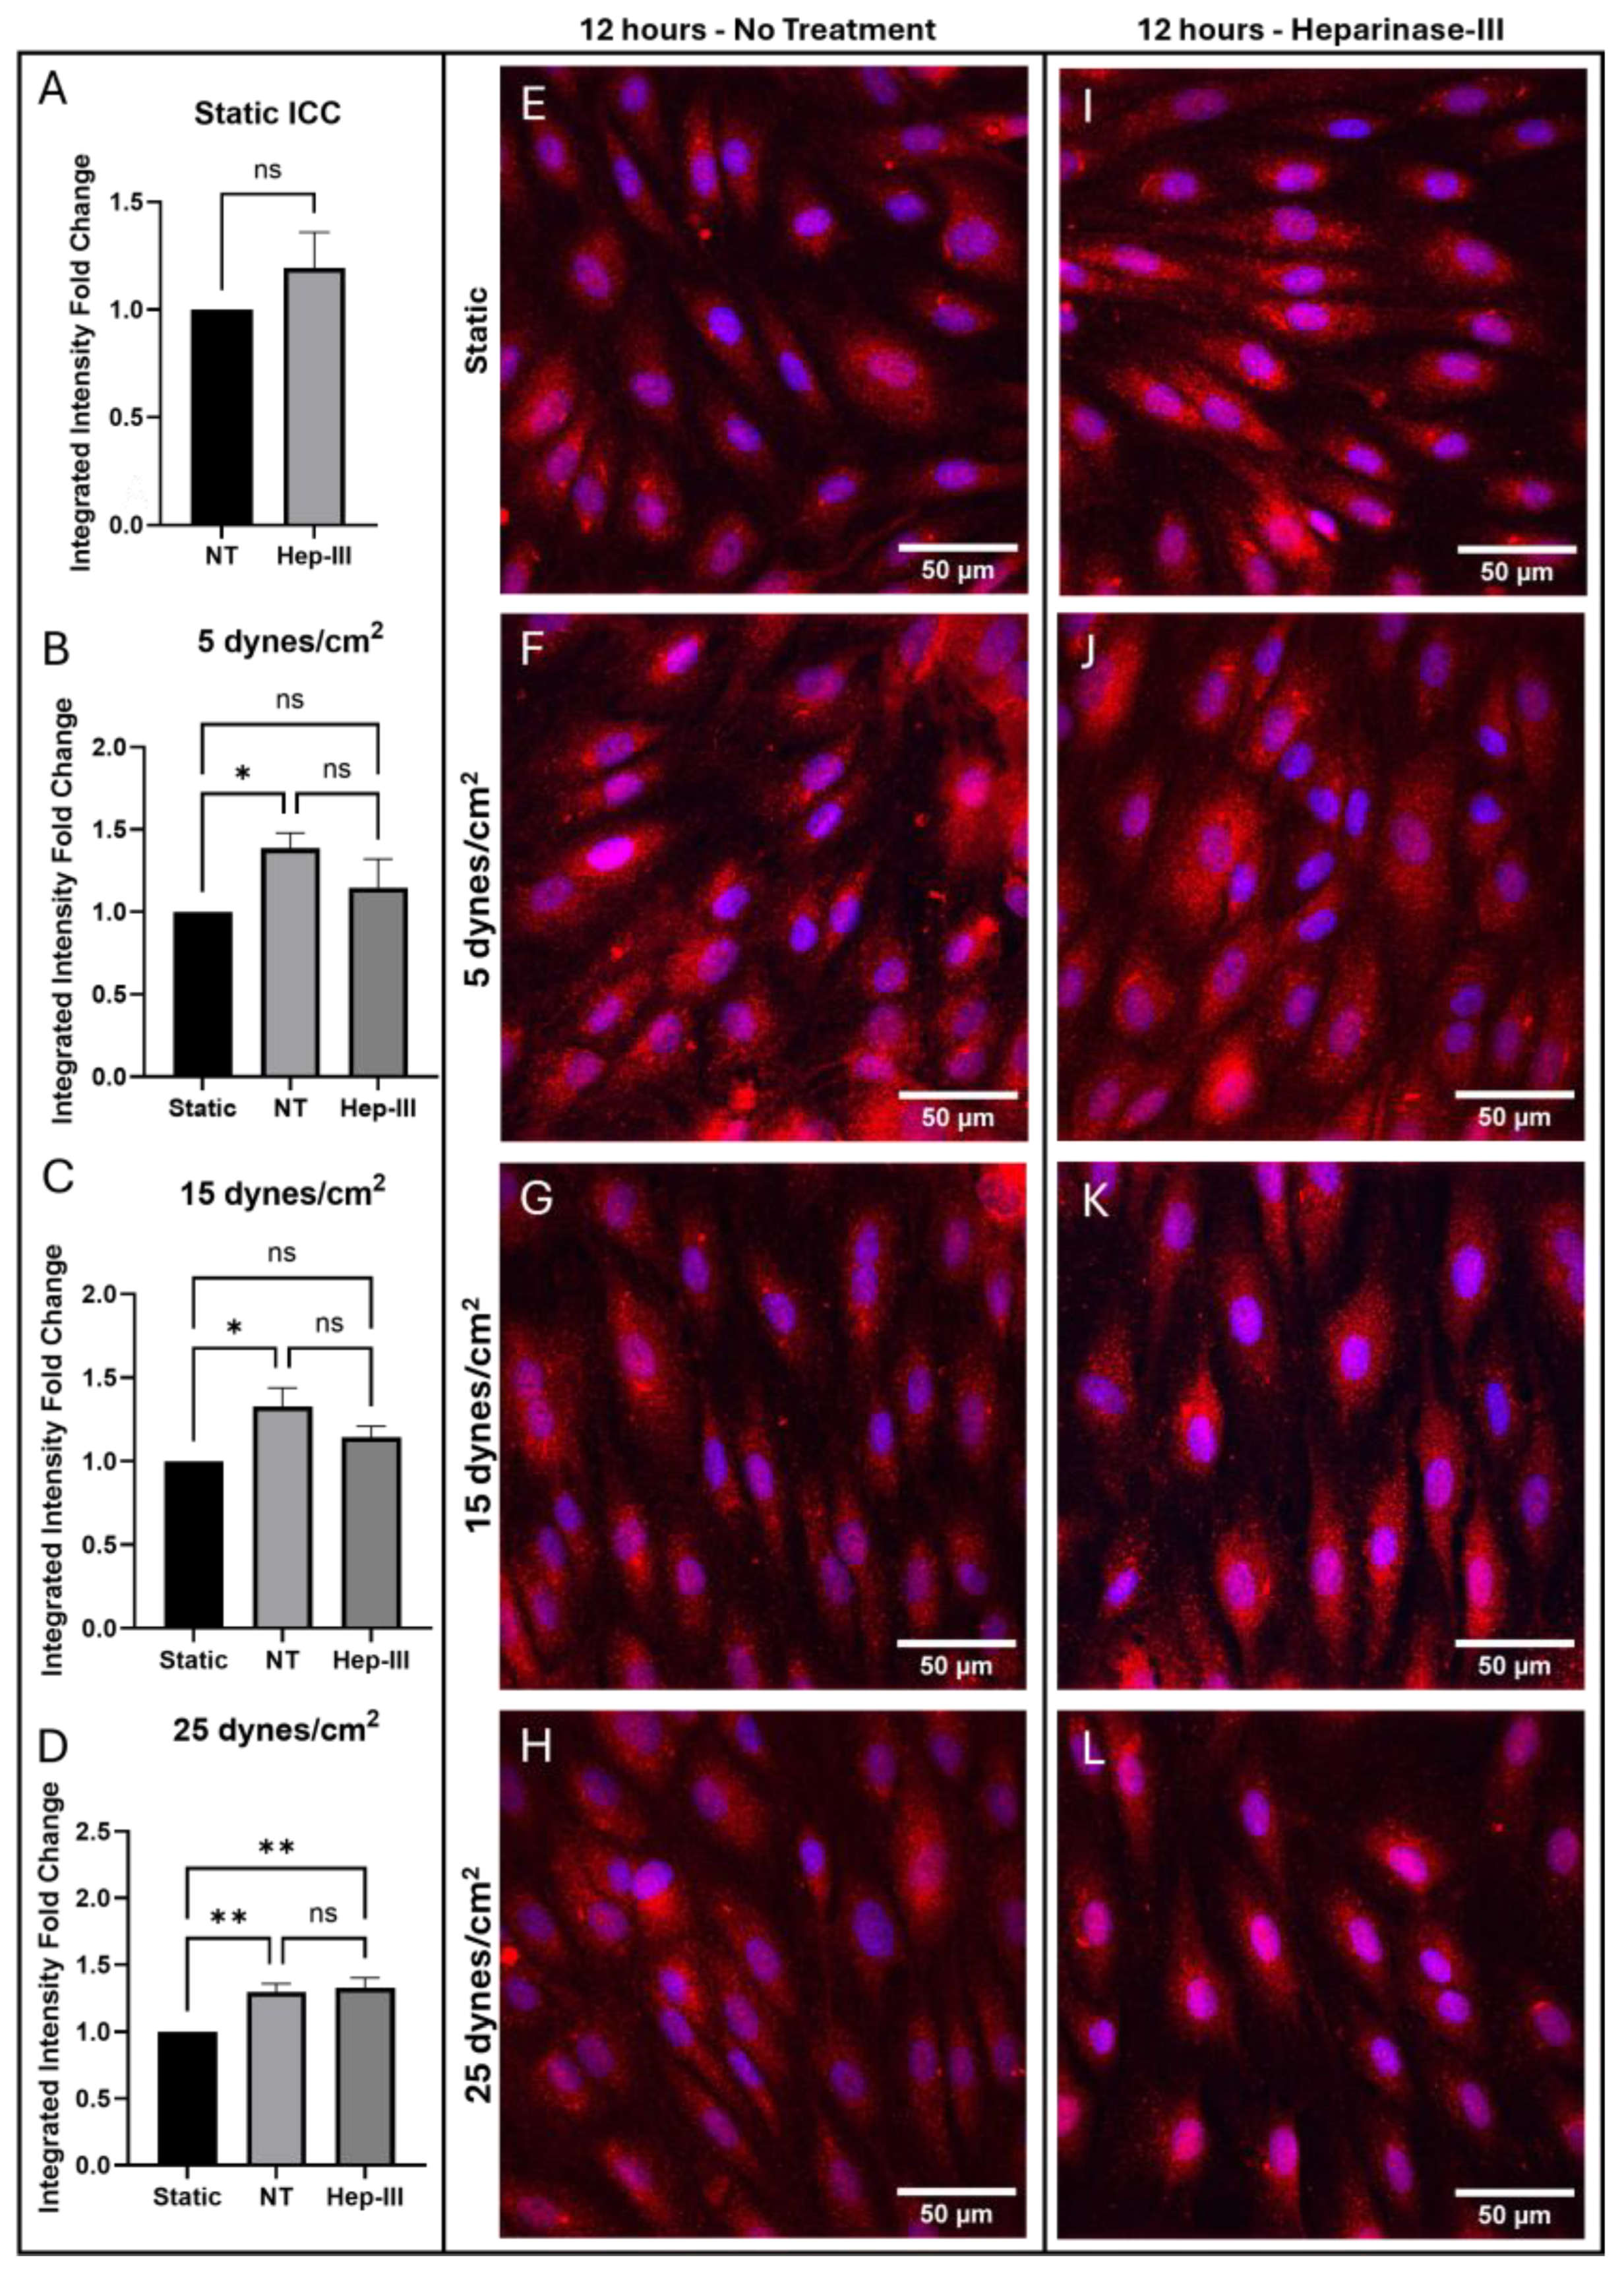
Figure 4.
qPCR results for ETB expression in cells exposed to (a) 0, (b) 5, (c) 15, and (d) 25 dynes/cm2 of uniform SS.
Figure 4.
qPCR results for ETB expression in cells exposed to (a) 0, (b) 5, (c) 15, and (d) 25 dynes/cm2 of uniform SS.
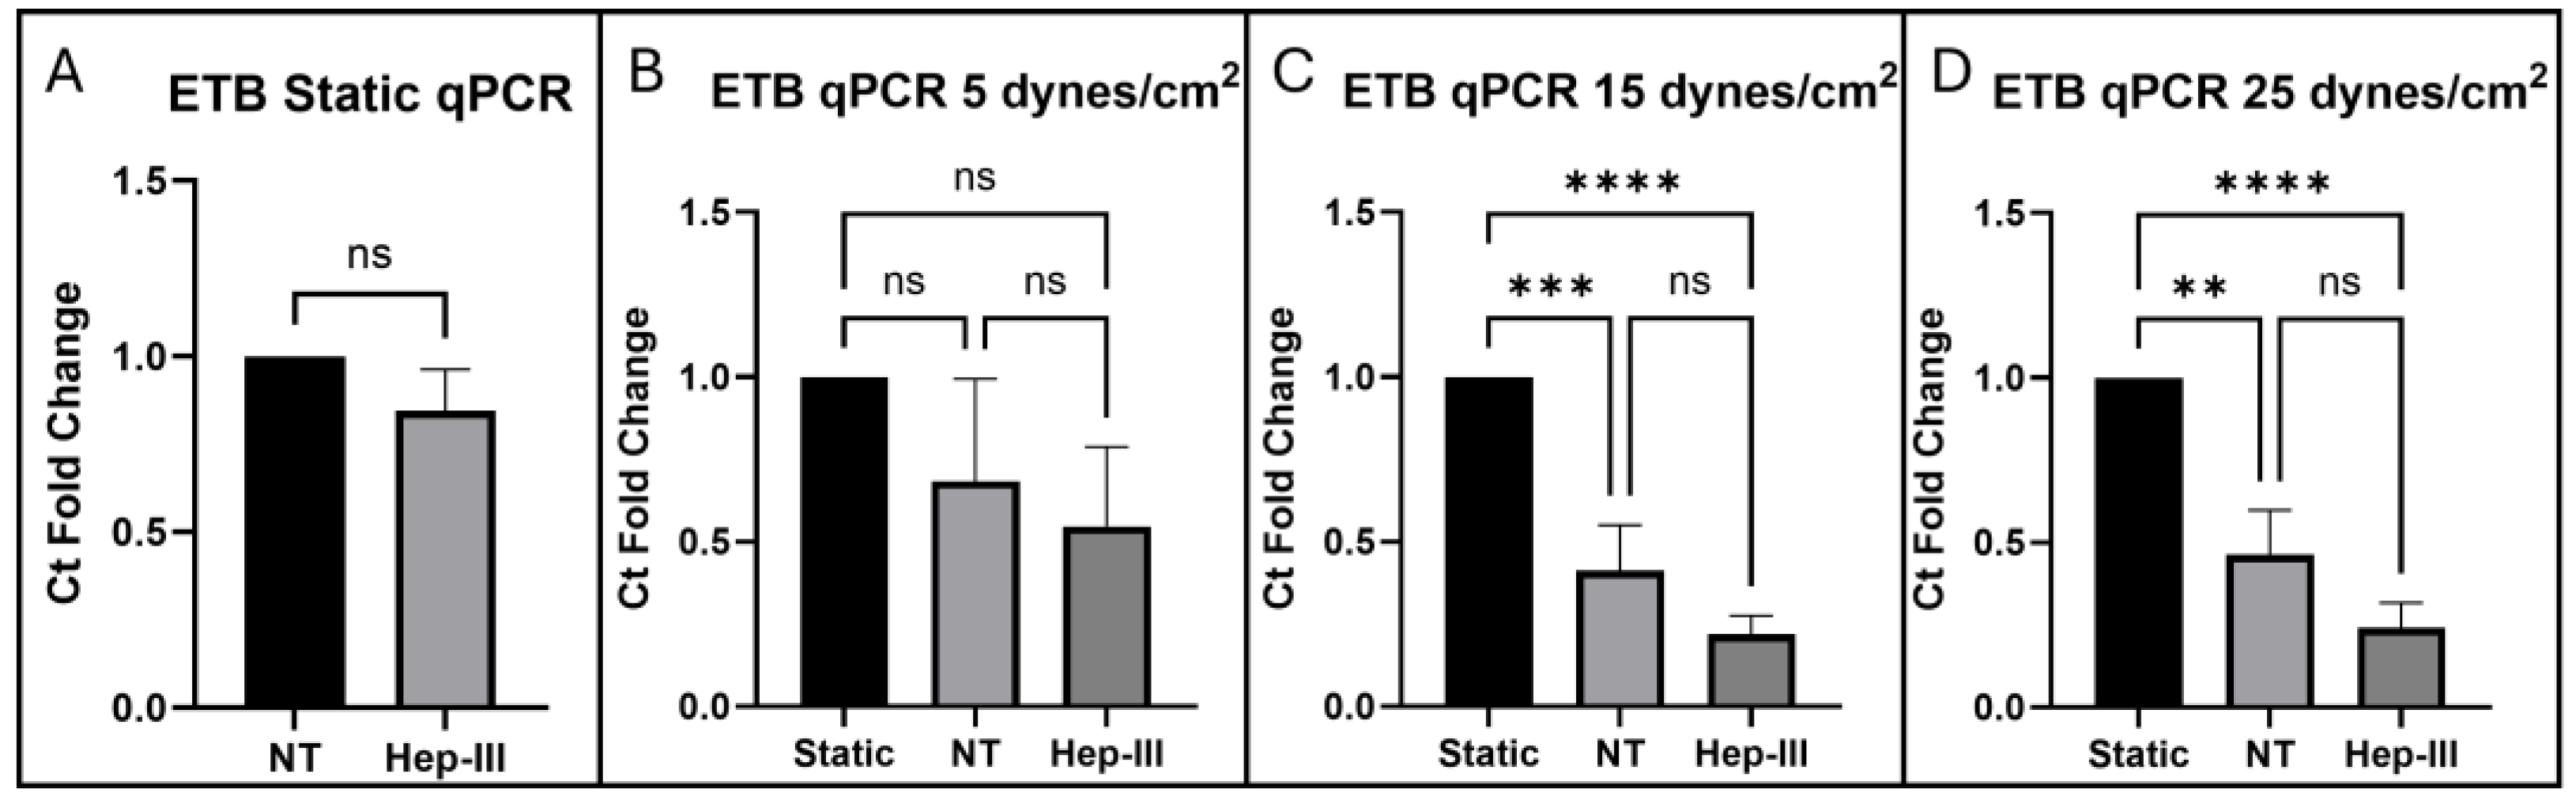
Figure 5.
Immunostaining results for HS in cells exposed to 0, 5, 15, and 25 dynes/cm2 of uniform SS. Green represents HS, while blue represents cell nuclei. (a–d) Integrated intensity fold-change analysis of cells positive for HS in NT and Hep-III conditions compared to NT static condition Confocal microscopy images of static controls (e,i), and samples exposed to 5 (f,j), 15 (g,k), and 25 (h,l) dynes/cm2 of uniform SS samples stained for HS under NT and Hep-III conditions.
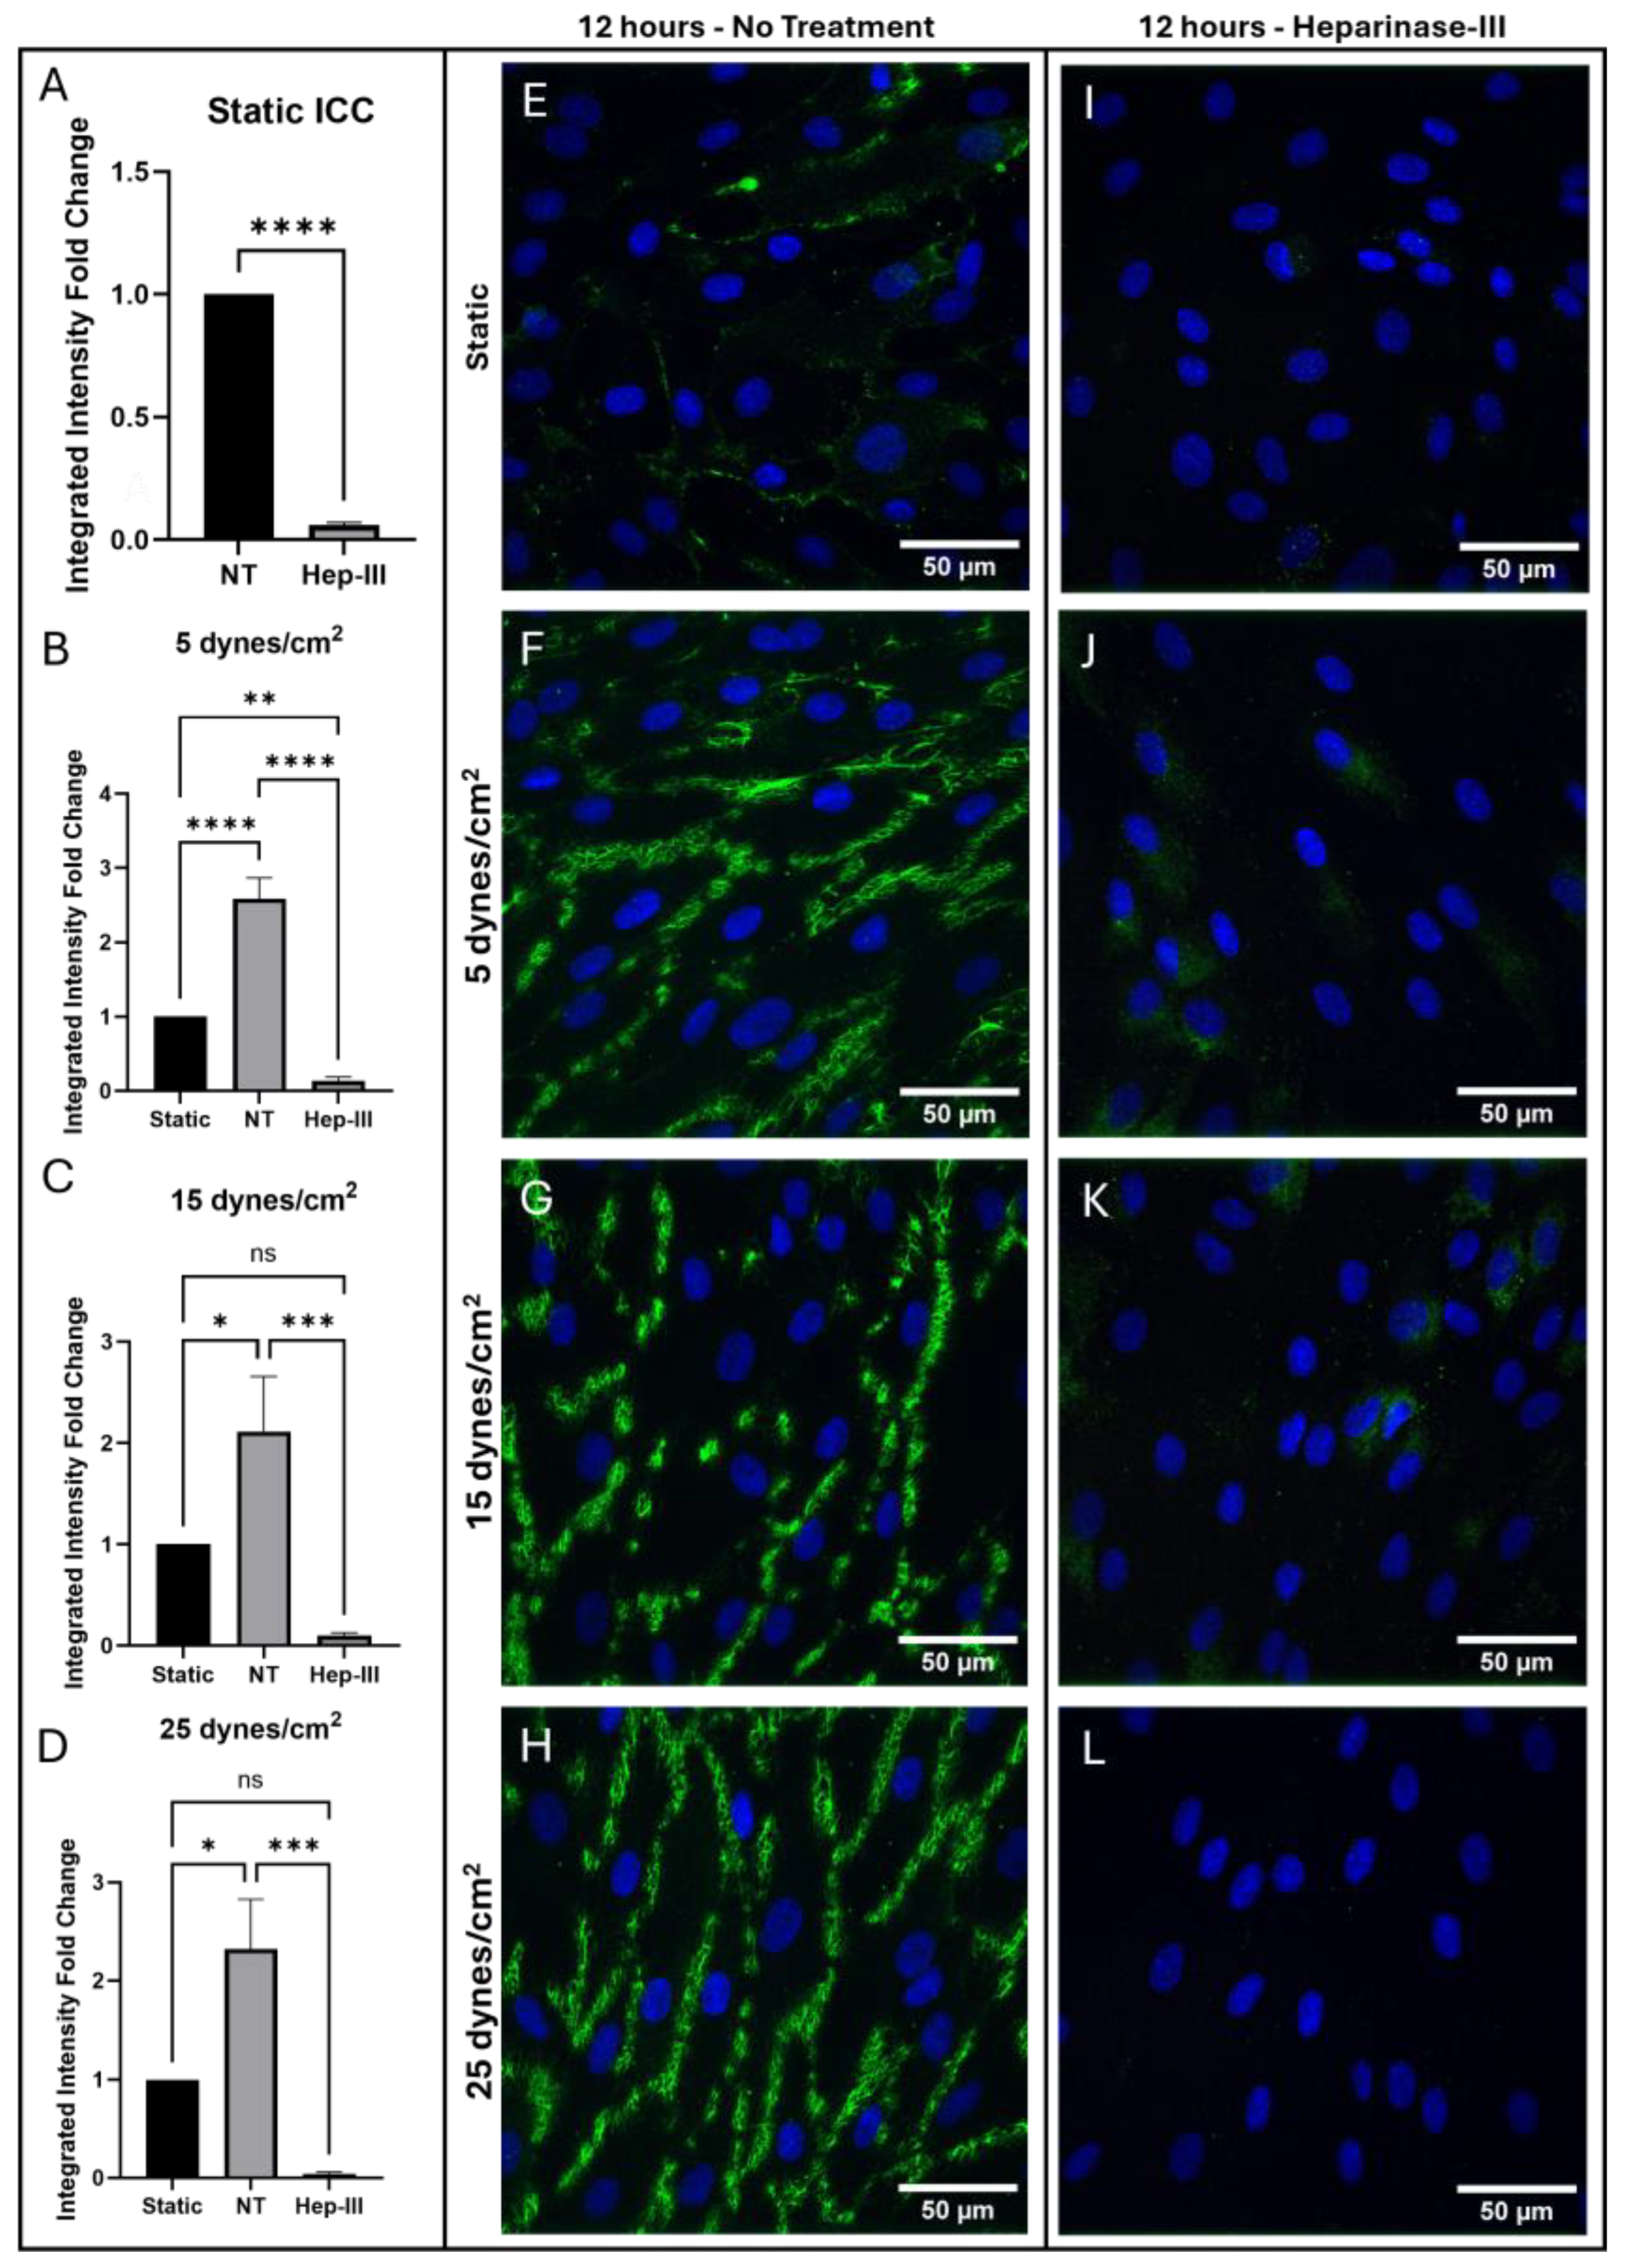
Figure 6.
qPCR results for HSPGs perlecan (HSPG2) exposed to (a) 0, (b) 5, (c) 15, and (d) 25 dynes/cm2 of uniform SS and syndecan-1 (SDC1) expression in cells exposed to (e) 0, (f) 5, (g) 15, and (h) 25 dynes/cm2 of uniform SS.
Figure 6.
qPCR results for HSPGs perlecan (HSPG2) exposed to (a) 0, (b) 5, (c) 15, and (d) 25 dynes/cm2 of uniform SS and syndecan-1 (SDC1) expression in cells exposed to (e) 0, (f) 5, (g) 15, and (h) 25 dynes/cm2 of uniform SS.
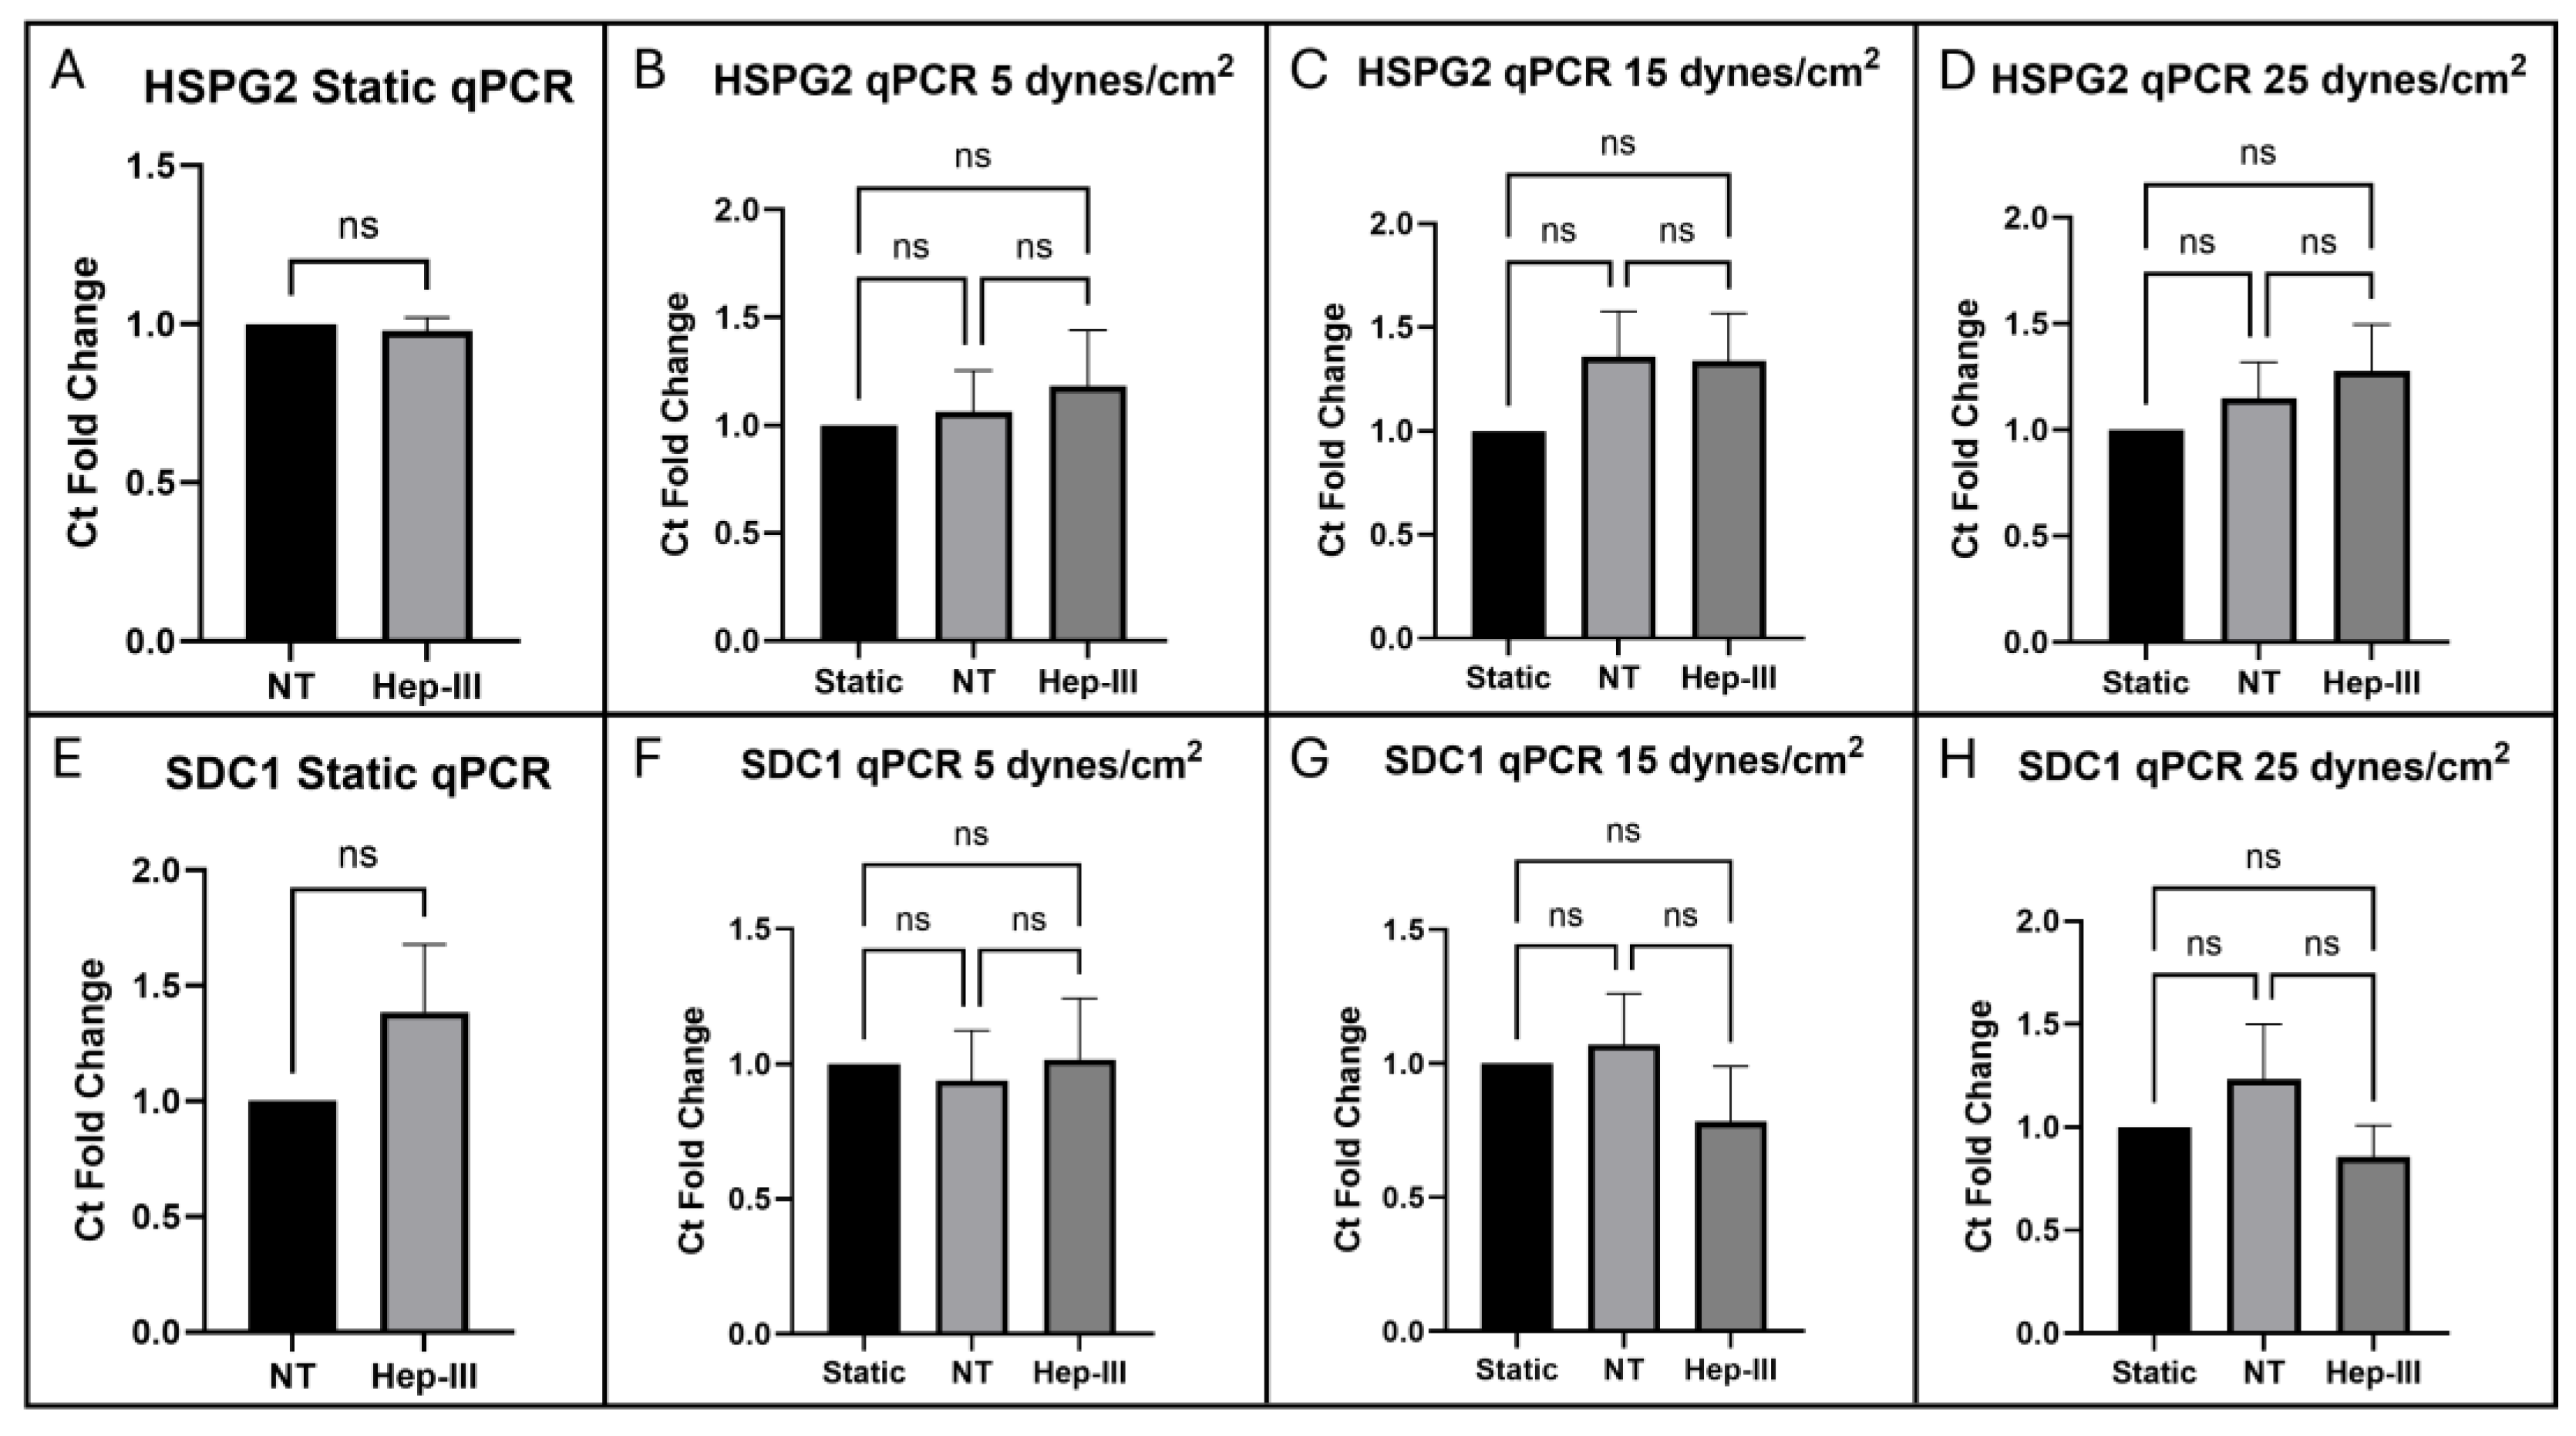
Table 1.
Summary of observed results for HLMVEC exposed to SS and 15mU/mL Hep-III.
| Parameter | 5 dynes/cm2 | 15 dynes/cm2 | 25 dynes/cm2 |
|---|---|---|---|
| ET-1 Protein (ICC) | No change | No change | No change |
| ET-1 Gene (qPCR) | ↑ HS-independent | ↑ HS-independent | ↑ Partial HS-dependence |
| ↑ SS-dependent | ↑ SS-dependent | ↑ SS-dependent | |
| ETB Protein (ICC) | ↑ Partial HS-dependence | ↑ Partial HS-dependence | ↑ HS-independent |
| ↑ SS-dependent | ↑ SS-dependent | ↑ SS-dependent | |
| ETB Gene (qPCR) | No change | ↓ HS-independent | ↓ HS-independent |
| ↓ SS-dependent | ↓ SS-dependent | ||
| Surface HS (ICC) | ↑ SS-induced | ↑ SS-induced | ↑ SS-induced |
| HS Proteoglycan Gene (qPCR) | No change | No change | No change |
Disclaimer/Publisher’s Note: The statements, opinions and data contained in all publications are solely those of the individual author(s) and contributor(s) and not of MDPI and/or the editor(s). MDPI and/or the editor(s) disclaim responsibility for any injury to people or property resulting from any ideas, methods, instructions or products referred to in the content. |
© 2025 by the authors. Licensee MDPI, Basel, Switzerland. This article is an open access article distributed under the terms and conditions of the Creative Commons Attribution (CC BY) license (http://creativecommons.org/licenses/by/4.0/).
Copyright: This open access article is published under a Creative Commons CC BY 4.0 license, which permit the free download, distribution, and reuse, provided that the author and preprint are cited in any reuse.


