
Submitted:
19 December 2024
Posted:
20 December 2024
You are already at the latest version
Abstract
VE-cadherin (VE-cad) membrane stability and localization regulates adhesion formation and actin cytoskeleton dynamics in angiogenesis and vascular remodeling and requires the heparan sulfate proteoglycan, Syndecan-4 (Sdc4). This study characterizes the interactions of the heparin receptor, Transmembrane protein-184A (TMEM184A), and Sdc4 in bovine aortic endothelial cells (BAOECs) and the regenerating Zebrafish (ZF) caudal fin and measures the effect of siRNA TMEM184A KD (siTMEM) and TMEM184A overexpression (TMEM OE) on VE-cad levels and localization in confluent and sub-confluent cultured BAOECs. Additionally, we examined the effect of siTMEM on key Rab GTPase trafficking regulators and migrating BAOECs in scratch wound healing assays. We demonstrated that TMEM184A and Sdc4 colocalize in BAOECs and that Sdc4 pulls down TMEM184A in cell lysate, while both Tmem184a and Sdc4 cooperate synergistically in ZF fin angiogenic and tissue repair. We also showed that siTMEM decreases VE-cad membrane and cytoplasmic levels, while increasing scratch wound migration rates. Whereas TMEM OE cells show increased vesicle formation and VE-cad trafficking and membrane recovery. These findings characterize TMEM184A-Sdc4 cooperation in angiogenesis and indicate a dual function of TMEM184A in signaling and trafficking in vascular cells that promotes VE-cad recovery and membrane localization.
Keywords:
VE-cadherin
; TMEM184A
; syndecan-4
; endothelial cells
; angiogenesis
1. Introduction
In vascular research with cultured cells, it has long been recognized that exogenous heparin modifies both endothelial and smooth muscle cell proliferation and the endothelial inflammatory stress response [1,2,3,4,5,6,7]. Endothelial cell (EC) remodeling and controlled proliferation in inflammation are essential to vascular wound healing and repair in a developed organism [8,9] and reparative angiogenesis can improve recovery from surgical treatments of cardiovascular disease, reviewed in [10]. There is clear evidence that Transmembrane Protein-184A (TMEM184A), a heparin receptor, is required for the heparin-induced MAPK signaling changes observed in cultured cells. Signaling through TMEM184A dampens cell proliferation and reduces stress fiber formation in the presence of growth factors or inflammatory mediators [1,4].
Repair of damaged endothelium and reparative angiogenesis typically require Vascular Endothelial Growth Factor (VEGF) which results in EC proliferation. It also results in increased survival of cells, increased migration, and modulation of endothelial cell-cell adhesion [11,12,13]. Angiogenesis involves VEGF activation of VEGFR2 and in mice requires the heparan sulfate proteoglycan (HSPG) Syndecan-2 (Sdc2), an HSPG also required for ZF vascular development [14,15]. Many studies of EC migration indicate the involvement of Syndecan-4 (Sdc4), e.g. [16,17], an HSPG recently shown to be involved in directed cell migration through specialized Integrin recycling [18,19,20], and required for VE-cadherin (VE-cad) internalization in murine wound healing and VEGF mediated pathological angiogenesis [21,22].
In the zebrafish (ZF) developmental angiogenesis system, VE-cad plays a role in outgrowth of new vessels and facilitates anastomosis of separate growing vessels to form complete vascular networks [23,24]. Previous studies of VE-cad in vascular cells have shown that tight regulation of VE-cad trafficking to and from adherens junctions (AJs) is required for vessel sprouting in angiogenesis as cells decouple, proliferate, and migrate toward growth signaling factors [11,21,24,25], and VE-cad internalized through clathrin mediated endocytosis leads to VE-cad C-terminal domain proteolytic cleavage and protein degradation [26]. In turn, rapid recycling of intact VE-cad in angiogenesis has been shown to depend classically on Rab4 and Rab11a GTPase redelivery of VE-cad to the membrane surface [21,27]. In early investigations of TMEM184A (also referred to as Sdmg1 in exocrine tissues), observations in IHC and IF showed discreet puncta of TMEM184A in pancreatic, salivary, and mammary tissues and increased apical cytoplasmic puncta in mammary tissue excised from pregnant and lactating mice [28]. It follows that TMEM184A, the vascular version of Sdmg1 and novel heparin receptor, may maintain a dual function in trafficking key proteins, including VE-cad in addition to initiating heparin-induced signaling. Consistent with that idea, Tmem184a KD in ZF embryos showed a decrease of total VE-cad in proliferating stalk cells [29].
Characterization of Tmem184a in vivo in the adult regenerating ZF caudal fin showed increased vascular EC proliferation with Tmem184a morpholino (MO)-mediated gene knockdown (KD) injections concurrent with reduced vascular and tissue outgrowth, while cell proliferation decreased with heparin injection of Tmem184a KD fins [30]. In a study of angiogenesis in the developing ZF embryo, Tmem184a KD resulted in greater endothelial cell proliferation and abrogation of intersegmental vessel (ISV) completion. In addition, removal of the putative heparin-binding domain also reduced ISV completion [29]. These results separate the proliferation of angiogenesis from vascular outgrowth that is angiogenesis, suggesting that endogenous TMEM184A signaling and protein interactions in wild-type vascular cells limit proliferation to promote cell organization in vessel formation.
These results led us to ask whether Tmem184a may modulate angiogenesis through Sdc4 interactions and whether changes in TMEM184A expression in bovine aortic ECs (BAOECs) affect VE- cad levels through modulation of trafficking and actin cytoskeleton dynamics in collective cell migration. In this report, we identified Sdc4 – TMEM184A interactions in BAOECs and observed that synergy of subthreshold tmem184a and sdc4 MOs contributed to a ZF vascular phenotype. In ECs, we’ve shown that TMEM184A expression affects relative levels of VE-cad at the cell surface and in vesicles, and that TMEM184A colocalizes with Rab4, Rab5a, and Rab11a GTPases. Collectively, these data support that TMEM184A and Sdc4 interactions regulate cell adhesion and coordinate cell movement in EC remodeling and angiogenic repair.
2. Materials and Methods
2.1. Zebrafish Strains, Housing, and Husbandry
The animal model that was used for this study is the ZF (Danio rerio) C32 strain [31]., 2003. The TG (fli1: eGFPy1) transgenic line from Lawson and Weinstein [32], was utilized for visualization of caudal fin regeneration. Male and female siblings were included in cohorts for this study. All animal experiments were conducted in accordance with the recommendations in the Guide for the Care and Use of Laboratory Animals from the National Institutes of Health. This protocol was approved by Lehigh’s Institutional Animal Care and Use Committee (IACUC) (Protocol # 172, initially approved 11/17/2014 and most recently renewed as protocol 172 approved 07/19/24). Our on-site study location, Lehigh University’s Animal Welfare Assurance Number is A-3877-01. All experiments were done with the implementation of Tricaine anesthesia to minimize animal pain and discomfort.
ZF were housed in a Pentair re-circulating water system in 3L and 10 L tanks containing 12-15 and 20-30 fish per tank, respectively. Tanks were maintained on a 14:10 light: dark cycle and the room temperature was kept at 27–29°C. A 10% water exchange was performed with daily water quality monitoring. Nitrogen levels were optimized by a biofilter and dosed automatically to maintain conductivity (400–600 μs) and pH (6.95–7.30). Sequential filtering of re-circulating water was achieved through the use of pad filters, bag filters, and a carbon canister. Water was passed through ultraviolet light for sterilization. Fish diets were maintained with one feeding of fresh brine shrimp (INVE artemia cysts) with one of two daily feedings of flake (Zebrafish Select Diet, Aquaneering Inc.).
2.2. Morpholino Injections
ZF fins were amputated (50% of the caudal fin length). At 72 hours post amputation (hpa), the identified amount of MO was injected into the dorsal half of the regenerating fin as described [33]. MO microinjections (sdc4 ATG translational start site blocker sequence (5’-TGAGGTAAACTTTCAACATCTTCTC-3’), tmem184a ATG translational start site blocker 166 (5’-CTGAGAGTAGTTTCATTCATCCTGA-3’), and control MO (5’-CCTCTTACCTCAGTTACAATTTATA-3’) all labeled with Lissamine rhodamine) (Gene Tools) were administered to the tip of each fin ray from the dorsum of the fin to the midline 3 days post amputation (dpa), and both injected and uninjected fin rays were electroporated (Nepal Gene CUY21EDIT) to encourage MO diffusion across cell membranes (as previously [30] ). Fins were harvested at 4 dpa into 4% PFA and fixed overnight at 4℃. Fixed fins were mounted in 50% glycerol for confocal microscopy.
2.3. Fin Imaging Measurements and Statistical Analysis
Fins were imaged with a Zeiss LSM 800 confocal microscope, 1024 x 1024 acquisition, 5 x objective at a central z-position to fin thickness to maximize the view of the vasculature. The Nikon Eclipse 8oi compound microscope with a GFP filter and NIS Elements software was used to obtain fin images of the 0.25 mM subthreshold synergy experiments at a 5x objective. Fin images of injected and uninjected sides from each fish within a representative group were aligned to measure total vessel and fin outgrowth from the amputation plane to the tip of the vessels and tissue outline. Measurements were taken in μm of the third and fourth rays of the injected and uninjected sides. A ratio of injected/uninjected measurements was calculated for each fin [30]. Statistical significance between the control and MO injected groups was determined with a one tailed, student t-test, for a heteroscedastic sample.
2.4. Materials – Antibodies
| Primaries | Host Organism | Company | Catalog number | RRID | |||||
| Sdc4 | Rabbit | BioVision | Cat# 3644-100 | AB_2183016 | |||||
| Mouse | Santa Cruz Biotechnology | Cat# sc-12766 | AB_628314 | ||||||
| TMEM184a | Rabbit | Thermo Fisher Scientific | Cat# PA5-96834 | AB_2808636 | |||||
| Rat | GenScript | protein G-purified peptide sequence from the N-terminal region of rat TMEM184A (N - PAGPQMDHMGNSSQC) | |||||||
| VE-Cadherin | Goat | Santa Cruz Biotechnology | Cat# sc-6458 | AB_2077955 | |||||
| Rabbit | Cell Signaling Technology | Cat# 2500 | AB_10839118 | ||||||
| Rab4 | Rabbit | Abcam | Cat# ab13252 | AB_2269374 | |||||
| Rab11a | Rabbit | Cell Signaling Technology | Cat# 5589 | AB_10693925 | |||||
| β-Actin | Rabbit | Cell Signaling Technology | Cat# 4970 | AB_2223172 | |||||
| Tubulin | Mouse | Abcam | Cat# 7291 | AB_2241126 | |||||
| Secondaries | Host Species | Company | Catalog number | RRID | |||||
| Alexa 647 anti-mouse | Donkey | Jackson ImmunoResearch Labs | Cat# 715-605-151 | AB_2340863 | |||||
| Alexa 647 anti-Rabbit | Donkey | Jackson ImmunoResearch Labs | Cat# 711-605-152 | AB 2492288 | |||||
| Alexa 647 anti-rabbit FC specific | Donkey | Jackson ImmunoResearch Labs | Cat# 111-605-046 | AB_2338076 | |||||
| Alexa 488 anti-rat | Donkey | Jackson ImmunoResearch Labs | Cat# 712-545-153 | AB_2340684 | |||||
| Alexa 488 anti-rat, F(ab’)2 specific | Donkey | Jackson ImmunoResearch Labs | Cat# 112-545-072 | AB_2338359 | |||||
| Alexa 488 anti-rabbit | Donkey | Jackson ImmunoResearch Labs | Cat# 711-545-152 | AB_2313584 | |||||
| CY3 anti-mouse | Donkey | Jackson ImmunoResearch Labs | Cat# 715-165-150 | AB_2340813 | |||||
| TRITC anti-rabbit | Donkey | Jackson ImmunoResearch Labs | Cat# 711-025-152 | RRID:AB_2340588 | |||||
| TRITC anti-goat | Donkey | Jackson ImmunoResearch Labs | Cat# 705-025-147 | RRID:AB_2340389 | |||||
2.5. Culturing and Transfections
Two separate primary cell lines of BAOECs (Cell Applications), passaged 6 – 10 times, were used for this study. Cells were passaged 1:2 to continue cultures in 1 X PBSE, 0.1 mM EDTA (Fisher) and 1X Trypsin/EDTA solution (Cell Applications) with Minimum Eagles Medium (MEM) (Sigma-Aldrich), 10% HI-FBS (Gibco), 4 mM L-Glutamine (Cell Applications), 1% Penicillin-Streptomycin (Sigma-Aldrich), 1% MEM Amino Acids (Sigma), 1% Sodium Pyruvate (Sigma). Cells were seeded in 100 mm and 150 mm dishes coated with 0.2% Porcine Gelatin (Sigma) and kept in a humidity incubator covered with 10-12 mL (100 mm) and 20-25 mL (150 mm) of MEM at 37℃, 5% CO2. Prior to electroporation and seeding for end-point harvests, cells were trypsinized and counted with a hemocytometer. Cells were seeded to achieve desired confluence endpoints in harvests, 60 – 80 % confluence and > 90% confluence for comparison in assays. BAOECs were trypsinized, counted and pelleted in an IEC Clinical centrifuge at 3000 rpm, then washed in sterile 1 X PBS and resuspended in Hepes Buffered Saline (HeBS) at a concentration of 5 x 10⁶cells per ml for electroporation. Cells were mixed gently with control siRNA-A or Bovine TMEM184A siRNA (Santa Cruz Biotechnology, 4 ng/μl) or TMEM184A-tGFP plasmid DNA (OriGene, Rockville, MD, 10 ng/μL) for each 200-400 μL reaction and electroporated in chilled 0.2 mm gap electroporation cuvettesusing the BioRad Gene Pulser Squre Wave preset protocol settings for mammalian, CHO cells with one pulse (Electroporation settings adapted from [34]. Cells were incubated on ice for 5-10 minutes prior to reseeding, fed the next day, then harvested within 48 hours post electroporation (hpe). A mock control electroporation was used to optimize electroporation parameters for cell survival and as a control measure for TMEM184A-5GFP electroporations as recommended [34].
2.6. Immunofluorescent Staining
Cells were fixed in 4% Paraformaldehyde (PFA) (ThermoFisher) to porcine gelatin coated glass coverslips for 20 minutes at room temperature (RT) with constant rocking. Cells were washed in 2 turns of 1 X PBS for 5 minutes and permeabilized in 0.1% Triton X-100 1 X PBS - 0.3% Triton X-100 1 X PBS blocking and permeabilization buffer, 5% normal donkey serum (NDS) (Sigma-Aldrich), 1% bovine serum albumin (BSA) (Sigma-Aldrich) for 10-30 minutes. In assays utilizing 10-minute permeabilization intervals to preserve visualization of the membrane, cells were blocked for an additional 20 minutes in buffer without detergent. Slips were washed in 1 turn of 1 X PBS and incubated overnight at 4℃ in primary antibody solutions. On day two, slips were washed in 3 turns of 1 X PBS for 5 minutes at RT with constant rocking, incubated in secondary antibody solutions for 1 hour at 37℃, and rinsed in three turns of 1 X PBS prior to mounting. Slips were imaged with the Zeiss Confocal using a 1024 x 1024 acquisition, 63x objective in a series of 10 z-stacks. Images in Figure 1. A. and B. show cells incubated as below and mounted in Vectashield (Vector labs). Images in Figure 3. and Figure 4. A. show cells incubated as below and mounted in Vectashield with DAPI mounting media.
| Figure | Primary1 | Primary2 | Secondary1 | Secondary2 |
| 1A | Sdc4 rb (1:100) | TMEM NTD rat (1:50) | Alexa 647 α-rb (1:200) | Alexa 488 α -rat (1:500) |
| 1B | Sdc4 mo (1:50) | TMEM CTD rb (1:50) | Alexa 488 α-mo (1:200) | TRITC α-rb (1:200) |
| S1C | TMEM CTD rb (1:50) | TMEM NTD rat (1:50) | TRITC α-rb (1:200) | Alexa 488 α - rat (1:500) |
| S2A | Sdc4 rb (1:100) | TMEM NTD rat (1:50) | Alexa 647 α-rb (1:200) | Alexa 488 α - rat (1:500) |
| S2B | Sdc4 mo (1:50) | TMEM CTD rb (1:50) | Alexa 488 α-mo (1:200) | TRITC α-rb (1:200) |
| 3/4 | VE cad gt(1:200) | TMEM CTD (1:100) | TRITC α-gt (1:200) | Alexa 647 α-rb (1:200) |
| S3 | VE cad gt (1:200) | TMEM CTD (1:100) | Alexa 488 α-gt (1:200) | Alexa 647 α-rb (1:200) |
2.7. Co-immunoprecipitation and WESTERN BLOTTING
Gels were poured and polymerized at 12%, 10%, and 8% acrylamide for running immunoprecipitation (IP) samples, whole cell lysate (WCL), and subcellular fractions on SDS-PAGE, respectively. Gels were run using the Hoeffer mini gel system at 80 V, 30 mA for 120 – 150 minutes and transferred to a nitrocellulose membrane using a semi-dry transfer system (Hoeffer) with 55 V, 150 mA for 15 – 40 minutes. Membranes were washed for 15 minutes in 1 X Tris buffered Saline pH 7.5 and blocked for one hour at RT – overnight at 4℃ in Hi-Blotto (1 X Tris Buffered Saline pH 7.5, 5% non-fat dry milk, 5% normal donkey serum, 0.1% Tween-20, 0.1% NaN3). Blots were incubated in primary antibody solutions in 1 X TBST (1 X Tris Buffered Saline pH 7.5, 0.1% Tween-20) at the following dilutions overnight at 4℃ with constant rocking. Blots were washed in 3 turns of 1 X TBST for 5 minutes and incubated in 1 X TBST secondary antibody solutions at RT with constant rocking and imaged with the BioRad Fluorescence ChemiDoc.
Cells grown on 150 mm dishes were harvested at 70% confluency into 2 % CHAPS/1 X PBSE, 5 mM EDTA, 1 X HALT (1 mL/150 mm dish), transferred to chilled microcentrifuge tubes, and incubated on ice for 30 minutes (cell lysis). The following protocol was adapted from our previous study [3] and an online sourced CHAPS immunoprecipitation protocol (available from FIVEphoton Biochemicals, 2016). Lysates were pre-cleared with Affinity protein IgG red gel beads (Sigma, 50 μL beads: 1 mL lysate), equilibrated with three cold lysis buffer washes, by rocking for one hour at 4℃ on a rotating rocker. Pre-cleared lysates were centrifuged at 10,000 rpm for 10 minutes, 4℃ and supernatant was transferred to chilled microcentrifuge tubes. Protein concentrations of pre-cleared lysates were determined with the Pierce ® BCA Protein Assay kit (ThermoFisher). Protein from a 300 μL aliquot of each sample was precipitated in a chilled microcentrifuge tube with 10% TCA for 30 minutes to overnight to serve as an input sample [4]. A calculated volume of Sdc4 mouse antibody to achieve 2 μg antibody: 500 μg of total protein was added to designated immunoprecipitation (IP) lysate, keeping one tube of lysate without added antibody to serve as a beads only (BO) control. BO and IP samples were rocked for one hour at 4℃, then centrifuged for 1 minute at 10,000 rpm, 4℃, and transferred to chilled and washed IgG red gel beads (50 μL: 1 mL of sample). Samples were rocked for an additional hour at 4℃, then centrifuged for 3 minutes at 10,000 rpm, 4℃. Supernatant (unbound protein) was TCA precipitated (10%) on ice for 30 minutes - overnight. Beads were washed 3 times with 1mL 0.002% Tween-20 1 X PBSE 3, spinning for 3 minutes at 10,000 rpm, 4 ℃. Washed beads were boiled in two turns of 2 X SDS sample buffer for 15 minutes at 90-95℃ to achieve a double elution of the bound protein. Input and unbound fraction protein pellets were solubilized in sample buffer and samples were run on 12% SDS-PAGE to confirm pull downs and co-immunoprecipitations with immunolabeling using the primary and secondary antibodies in the following table.
| Figure WB | Primary1 | Primary2 | Secondary1 | Secondary2 |
| 1C/ S2 C | Sdc4 rb (1:100) | TMEM NTD rat (1:200) | Alexa 647 α-rb FC site Specific (1:10,000) | Alexa-488 α-rat F(ab’)2 specific (1:10,000) |
| 3C/4D | VE-cad rb (1:1000) | β-actin rb (1:1000) | Alexa-488 α-rb (1:10,000) | |
| 4C | TMEM CTD rb (1:500) | Tubulin mo (1:10,000) | Alexa-488 α-rb (1:10,000) | Alexa 647 α-mo (1:10,000) |
| S1. A. | TMEM CTD rb (1:500) | Tubulin mo (1:10,000) | Alexa-488 α-rb (1:10,000) | CY3 α- mo (1:10,000) |
| S1. C. | TMEM CTD rb (1:200) | Sdc4 mo (1:200) | Alexa 647 α-rb (1:10,000) | CY3 α- mo (1:10,000) |
| S2. D. | Sdc4 rb (1:1000) | Alexa 647 α-rb FC site Specific (1:10,000) | ||
| S3. A | VE-cad goat (1:5000) | Tubulin mo (1:10,000) | Alexa-488 α-goat (1:10,000) | Alexa 647 α-mo (1:10,000) |
2.8. WCL Harvest and Cell Fractionation
To prepare whole cell lysate, cells were harvested into 2x sample buffer directly or 2% CHAPS/PBSE with 0.5 mM EDTA and 1 X HALT protease inhibitor, 5 x 10⁶ cells/mL of buffer, vortexed and incubated on ice for 30 minutes – overnight at -80℃ prior to standardization. To prepare lysates for subcellular fractionation (adapted from [27]), cells grown to 60 – 70% confluence on 100 mm dishes were scraped into 300 μL of 0.2% CHAPS lysis buffer (0.2% CHAPS PBSE 5 mM EDTA, 1% Triton X-100, 1X HALT protease inhibitor, 1 mM PMSF, pH 7.4) for siRNA-A and siTMEM lysates or 0.5% Tris lysis buffer (Tris 10 mM, NaCl 140 mM, 5 mM EDTA, 0.05% SDS, 1% Triton X-100, 1X HALT protease inhibitor, 1 mM PMSF, pH 7.4) for cells electroporated in buffer only or TMEM-tGFP, incubated on ice for 20 minutes, and vortexed once vigorously for 5 seconds prior to standardization. Lysates were centrifuged at 13,000 x g for 12 minutes to separate the soluble from the insoluble fraction and the supernatant was transferred to a chilled microcentrifuge tube (cytoplasm fraction). The remaining pellet was solubilized in 100 μL of 2% CHAPS PBSE with setting 8-10 vortexing (membrane fraction). Protein was precipitated from whole and subcellular CHAPS cell lysates with 10% TCA incubations on ice for 30 minutes – overnight at 4 ℃. Samples were centrifuged at 10,000 RPM, 4 ℃ for 10 minutes. Protein pellets were washed once with 1 mL of sterile water and centrifuged for 1 minute at 10,000 RPM. Water was aspirated, pellets were air dried and resuspended in 2 x sample buffer (equilibrated with Tris HCl pH 8.8), and samples were boiled for 10-15 minutes at 90 – 95℃ for western blotting. Samples obtained with Tris buffers were solubilized in equal parts of 2 x sample buffer. The blots in Figure S1A,B., Figure 3. C., and Figure 4. C. and D. were run on poured 8% gels and the blot in S3. A. was run on a poured 10% gel. The blots were incubated with antibodies shown in the table above.
2.9. RNA Purification and RT-qPCR
BAOECs were transiently transfected with either TMEM184A siRNA or control siRNA-A following the established electroporation protocol and maintained following the established subculturing conditions for 24-30 hours and harvested while cells were under 65% confluent in pairs from the same line and passage. RNA was isolated from 100 mm dishes of TMEM184a siRNA or siRNA-A cells in parallel using 500μl of Trizol. 100 μl of chloroform was added to lysates, incubated for 3 minutes and transferred to phase lock tubes. Samples were centrifuged at 12,000g for 15 minutes at 4°C. The aqueous phase was transferred to a separate tube where a DNase I recombinant digest was performed (Roche, 04716728001) for 30 minutes at 37°C. 250 μl of isopropanol was added to the aqueous phase, mixed and incubated for 10 minutes at 4°C. Samples were centrifuged for 10 minutes at 4°C. The supernatant was removed and pellets washed 3 times in 75% EtOH and centrifuged for 5 minutes at 7500g and 4°C each. Pellets were air dried and resuspended in 20-40 μl RNase free water.
To ensure quality of RNA samples, nanodrop measurements were taken and an A260/280 ratio of approximately 2 was considered pure. If reading were suboptimal ethanol precipitation with 3 volumes of 100% EtOH and 0.1 volume of 3 M sodium acetate at -20°C for 16 hours, was performed to remove impurities and centrifuged for 30 minutes at 13,000 rpm and 4°C. Followed by 2 washes of 500μl of 75% EtOH, air dried and resuspended in 20ul RNase free water. Samples had nanodrop measurements taken to assess concentration and purity.
cDNA was prepared using ThermoScientific, Revert Aid First strand cDNA synthesis kit (K1621). Real time PCR was performed on all samples utilizing Qiagen's RotorGene RT-PCR equipment and their RoterGene SYBR green PCR kit (204074) to amplify GAPDH, VE-cad and TMEM184a. Three biological replicates were completed in technical duplicate. Each sample had 200 ng of cDNA added. Cycling conditions include denaturation at 95°C for 10 seconds, a combined annealing and extension 60 seconds at 60°C for 80 cycles followed with a melt curve to test specificity. Analysis of the data was calculated with the 2^-ΔΔCT method based upon GAPDH. Primers for both GAPDH and VE-cad were previously published by [35] and [36] respectively. The TMEM184A primers were designed by the authors:
| Primer Name | Primer 5’-3’ | Reference |
| GAPDH Forward | ACACCCTCAAGATTGTCAGCAA | [35] |
| GAPDH Reverse | TCATAAGTCCCTCCACGATGC | [35] |
| VE-Cadherin Forward | TCTGCCGGCAAGGTGTTCCG | [36] |
| VE-Cadherin Reverse | CATGGTCTGCCACCGTGGGG | [36] |
| TMEM184a Forward | CTTCTGCAAGCAGCCCAC | |
| TMEM184a Reverse | CCTGAAGTTGCAGGCGTC |
2.10. VEGF Treatment and Vesicle Staining
VEGF-165 (Human VEGF 165 recombinant protein, Cat#48143 Cell Signaling) treatments were administered to cells in culture in warmed media, 37℃, 5% CO2 at 100 ng/mL for 5 – 20 minutes depending on the Rab-GTPase intracellular staining method (Rab4 – 10 minutes, and Rab11 – 20 minutes).
Cells treated with 10- or 20-minute incubations of VEGF recombinant protein were harvested for IF treatment and fixed as previously described (see Immunofluorescence Staining), then incubated for 30 minutes in 0.5% Triton X-100 blocking and permeabilization buffer with constant rocking (adapted from [25]). Slips were incubated in primary and secondary antibody solutions, mounted in Vectashield, and imaged as described previously (see Immunofluorescence Staining). Images in Figure 5. A. and C. show cells incubated in anti-Rab4 rabbit (1:50) and Alexa-647 anti-rabbit (1:200) with anti-TMEM184A NTD rat (1:50) and alexa-488 anti-rat (1:500). Images in Figure 5. B. and D. show cells incubated in anti-Rab11a rabbit (1:50) and Alexa-647 anti-rabbit (1:200) with anti-TMEM184A NTD as previously described for A. and C.
2.11. Corrected Total Cell Fluorescence (CTCF) and Image J Fiji Quantification
CTCF values for primary antibody staining of cell images shown in Figure 3 and Figure 4 were obtained using the lasso tool to measure the integrated density of each fluorophore and the background (area multiplied by the average mean density) was subtracted to correct for non-specific stain. CTCF values were normalized to the average of the CTCF control values for each protein measured in Figure 3 and Figure 4. B. to compare their relative absorbance values. Statistical significance between the siRNA-A or mock control cells and siTMEM or TMEM OE cells was determined with one tailed, student t-tests. Protein levels in western blotting in Figure 3 and Figure4. C. were quantified using the Image J rectangular tool to plot a profile of their integrated densities. Densities were measured using the line tool to close peaks and the wand tool to highlight and measure peaks associated with protein bands. In Figure S1. A., Figure 3 and Figure 4. C., TMEM184A densities were normalized to that of Tubulin and VE-cad densities were normalized to that of Actin densities for quantitative comparison.
2.12. RStudio Visualization of Immunofluorescent Cell Experiments
RStudio (2024.04.2+764) software was used for visualization of siTMEM and TMEM OE static cell experiments. Multiple packages were utilized, including ggplot2, tidyr, readxl, dplyr, and scales to illustrate the density and distribution of the data. Tissue and vessel percent differences calculated in excel were input into RStudio to show varying titration concentrations and TMEM-Sdc4 synergy distributions. Cell CTCF data, sourced from IF images using Image J, was normalized in Excel and reformatted in RStudio to compare siRNA-A control and siTMEM knockdown groups for TMEM184A and VE-cad CTCF values to compare TMEM184A and VE-cad CTCF values within siRNA-A control and siTMEM groups or mock control and TMEM OE groups. The creation of violoin plots was performed using ggplot and geomviolin functions with plots customized with shades of red (TMEM184A) and green (VE-cad). For each respective plot, darker shades indicate control (siRNA-A) and lighter shades indicate knockdown (siTMEM). For OE plots compared to control plots the inverse is true, where lighter red and green violins represent control (mock) cell CTCF values and darker green and red violins represent TMEM OE CTCF values. Error bars were added to show measures of central tendency and variability using the scales package. Summary statistics, including mean and standard deviation, were calculated using data summary and scales was employed for error bar placement and accuracy. These methods were utilized for clear visual representation of experimental and control cell data, allowing for effective comparison between knockdown and control TMEM184A and VE-cad in IF staining and across fin injections. Violin plots were colorized for ZF data as described in the legend.
2.13. Scratch Wounding and Leading-Edge Analysis
BAOECs were transiently transfected with either TMEM184A siRNA or control siRNA-A following our established electroporation protocol and maintained following established subculturing conditions. Cells were grown to >85% confluency then placed in a starvation media Growth media above, containing only 0.2-0.5% Hi-FBS (Gibco), for one hour prior to scratching monolayers, allowing cells to acclimate to new culture media. Cells were then scratched (with a silicone spatula) and washed with one turn of 1 X PBS before replacing fresh starvation media. All scratches occurred 24-48 hours post electroporation. To calculate rate of closure, cells were imaged on a Nikon Eclipse TE2000-U microscope with a 10x objective at 0 and 8 hours post scratch and processed with an Image J plug-in [37]. Width of scratches at each timepoint were measured in μm and the rate of closure was calculated for 8 hours post scratch as using the following equation:
siTMEM and siRNA-A calculated rates were normalized to the average rates of siRNA-A per replicate. A Mann-Whitney U test was performed to determine significance (p < 0.05).
Rate (R) = (Width Initial (WI) - Width Final (WF))/(Time (T) in minutes)
Cells were harvested at 0, 4, and 8 hours for immunofluorescence visualization of the leading edge of scratch wounds using our established fixing and permeabilization protocol in 1 X PBS 0.1% Triton-X 100 (above). Leading edges of the scratches were imaged using confocal microscopy (Zeiss) with a 63x objective, 1024 x 1024 acquisition, and 10-13 zi-stacks. The images in Figure 6 were stained with 488 Phalloidin and mounted in Vectashield. Additional images were taken far away from each scratch as an internal control. The percentage of cells containing lamellipodia was calculated by noting if each cell on the leading edge of the scratch contained evidence of lamellipodia. A chi squared test was performed to determine significance (p < 0.05).
3. Results
3.1. TMEM184A Interacts with Sdc4 in Vascular ECs
TMEM184A is important for heparin-induced signaling in vascular cells, leading to decreased proliferation and KD of TMEM184A decreases heparin-induced effects along with increasing the proliferation of vascular cells. Together this knowledge led us to hypothesize that endogenous HSPGs also interact with TMEM184A. We used a commercial TMEM184A CTD antibody (confirmed in BAOECs in Figure S1. A. B. and C) and a rat polyclonal antibody (designed in house and confirmed in Figure S1 C, IF and S1 D, IP) to TMEM184A to facilitate these studies (See Materials-Antibodies for details). We noted that both TMEM184A CTD and NTD bind vascular cells in IF separately and when incubated together in a co-stain, TMEM184A NTD appears to outcompete the binding of TMEM184A CTD (Figure S1. C.), further supporting that both antibodies are binding regions of close proximity where TMEM184A is localized. TMEM184A NTD verification was further confirmed in a +NTD pull down in BAOEC lysate with TMEM184A CTD staining at 48 kDa and 55 kDa in WB (Figure S1. D.).
To examine interactions between TMEM184A and Sdc4, we first determined co-localization in cultured cells. Sdc4 co-localized with TMEM184A C-terminal and N-terminal domains in in BOAECs (Figure 1. A and B). Moreover, Sdc4 and TMEM184A appear to colocalize centrally on and below the cell surface (Figure 1. A. and B., white arrows and orthogonal views). In initial assays with a 0.3% Triton-X 100 increased detergent percentage (Figure S2. A. and B.), we observed lower levels of colocalization between both protein pairs overall, indicating that a semi-intact plasma membrane preserves these endogenous interactions.
Figure 1.
TMEM184A interacts with Syndecan-4 proteoglycans in BAOECs. Panel A. IF staining of Sdc4 CTD (green) merged with TMEM184A NTD (red) with orthogonal views, labeled as Slide 1 A (crosshairs correspond with white arrows in merged image). Scale 20 μm. B. IF staining of Sdc4 NTD (green) and TMEM184A CTD (red) with orthogonal views, labeled as Slide 2 B (crosshairs correspond with white arrows in merged image as in A.). Scale 20 μm. Images are representative of 14 slides (TMEM NTD) and 10 slides (TMEM CTD) across two independent experiments for each antibody combination. C. Comparison of bound and unbound fractions in western blotting of a Sdc4 mouse monoclonal (+Sdc4) pull down in BAOEC cell lysate stained with anti-Sdc4 rabbit (56 and 44 kDa doublet) and TMEM184A NTD (46 kDa band). Red gel bead shed is shown at 35 kDa. Sdc4 IP and WB was obtained in duplicate.
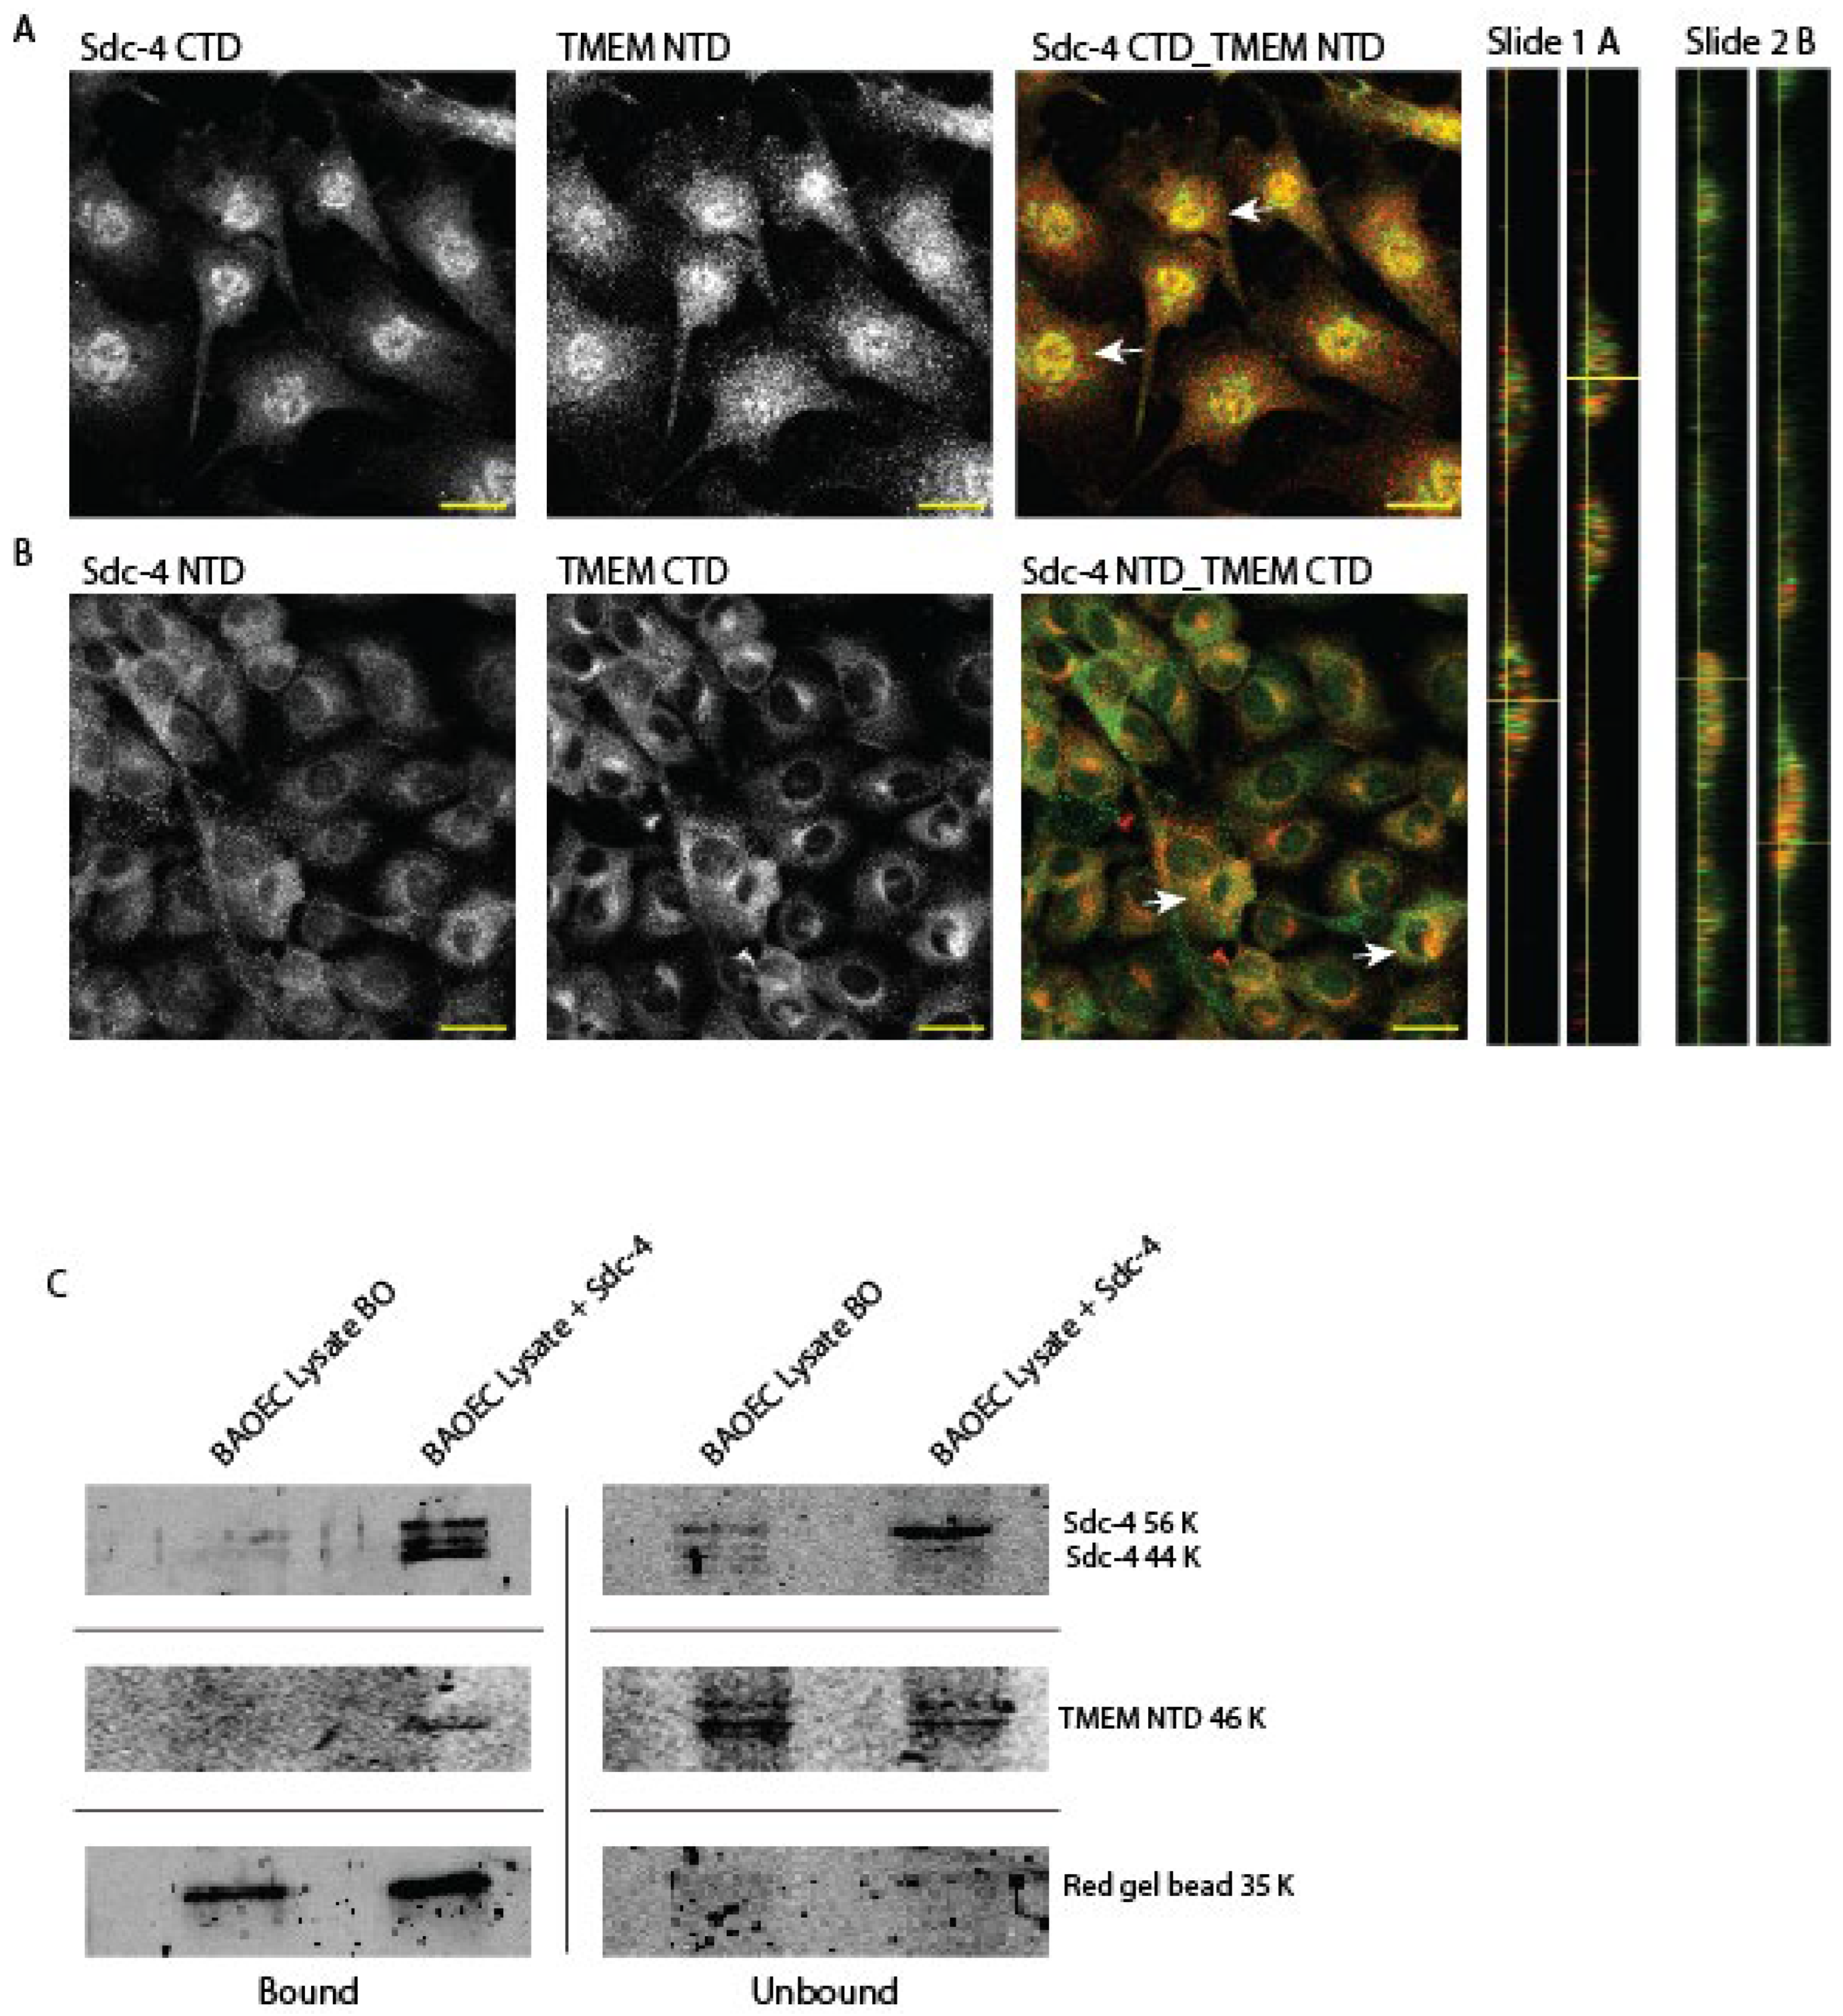
Our pull downs of Sdc4 confirmed in WB (Figure 1. C.), co-precipitated the heparin receptor, and this interaction appeared to increase with shorter incubation times and gentle agitation, evident with increased band density in pull down TMEM184A immunolabeling in samples rocked with beads and antibody for 30 minutes – 1 hour compared to overnight (Figure S2. C.). These data suggest that intra-cellular binding of the receptor and proteoglycans is potentially fleeting in vitro when cells are lysed to completion. The reciprocal pull down of Sdc4 with the heparin receptor (+NTD) was confirmed in WB (Figure S1.D.) and identification of the heavy chain (HC) Sdc4 antibody is shown in Figure S2.D.
3.2. Sdc4 and Tmem184a Function Cooperatively to Promote Vessel and Tissue Outgrowth
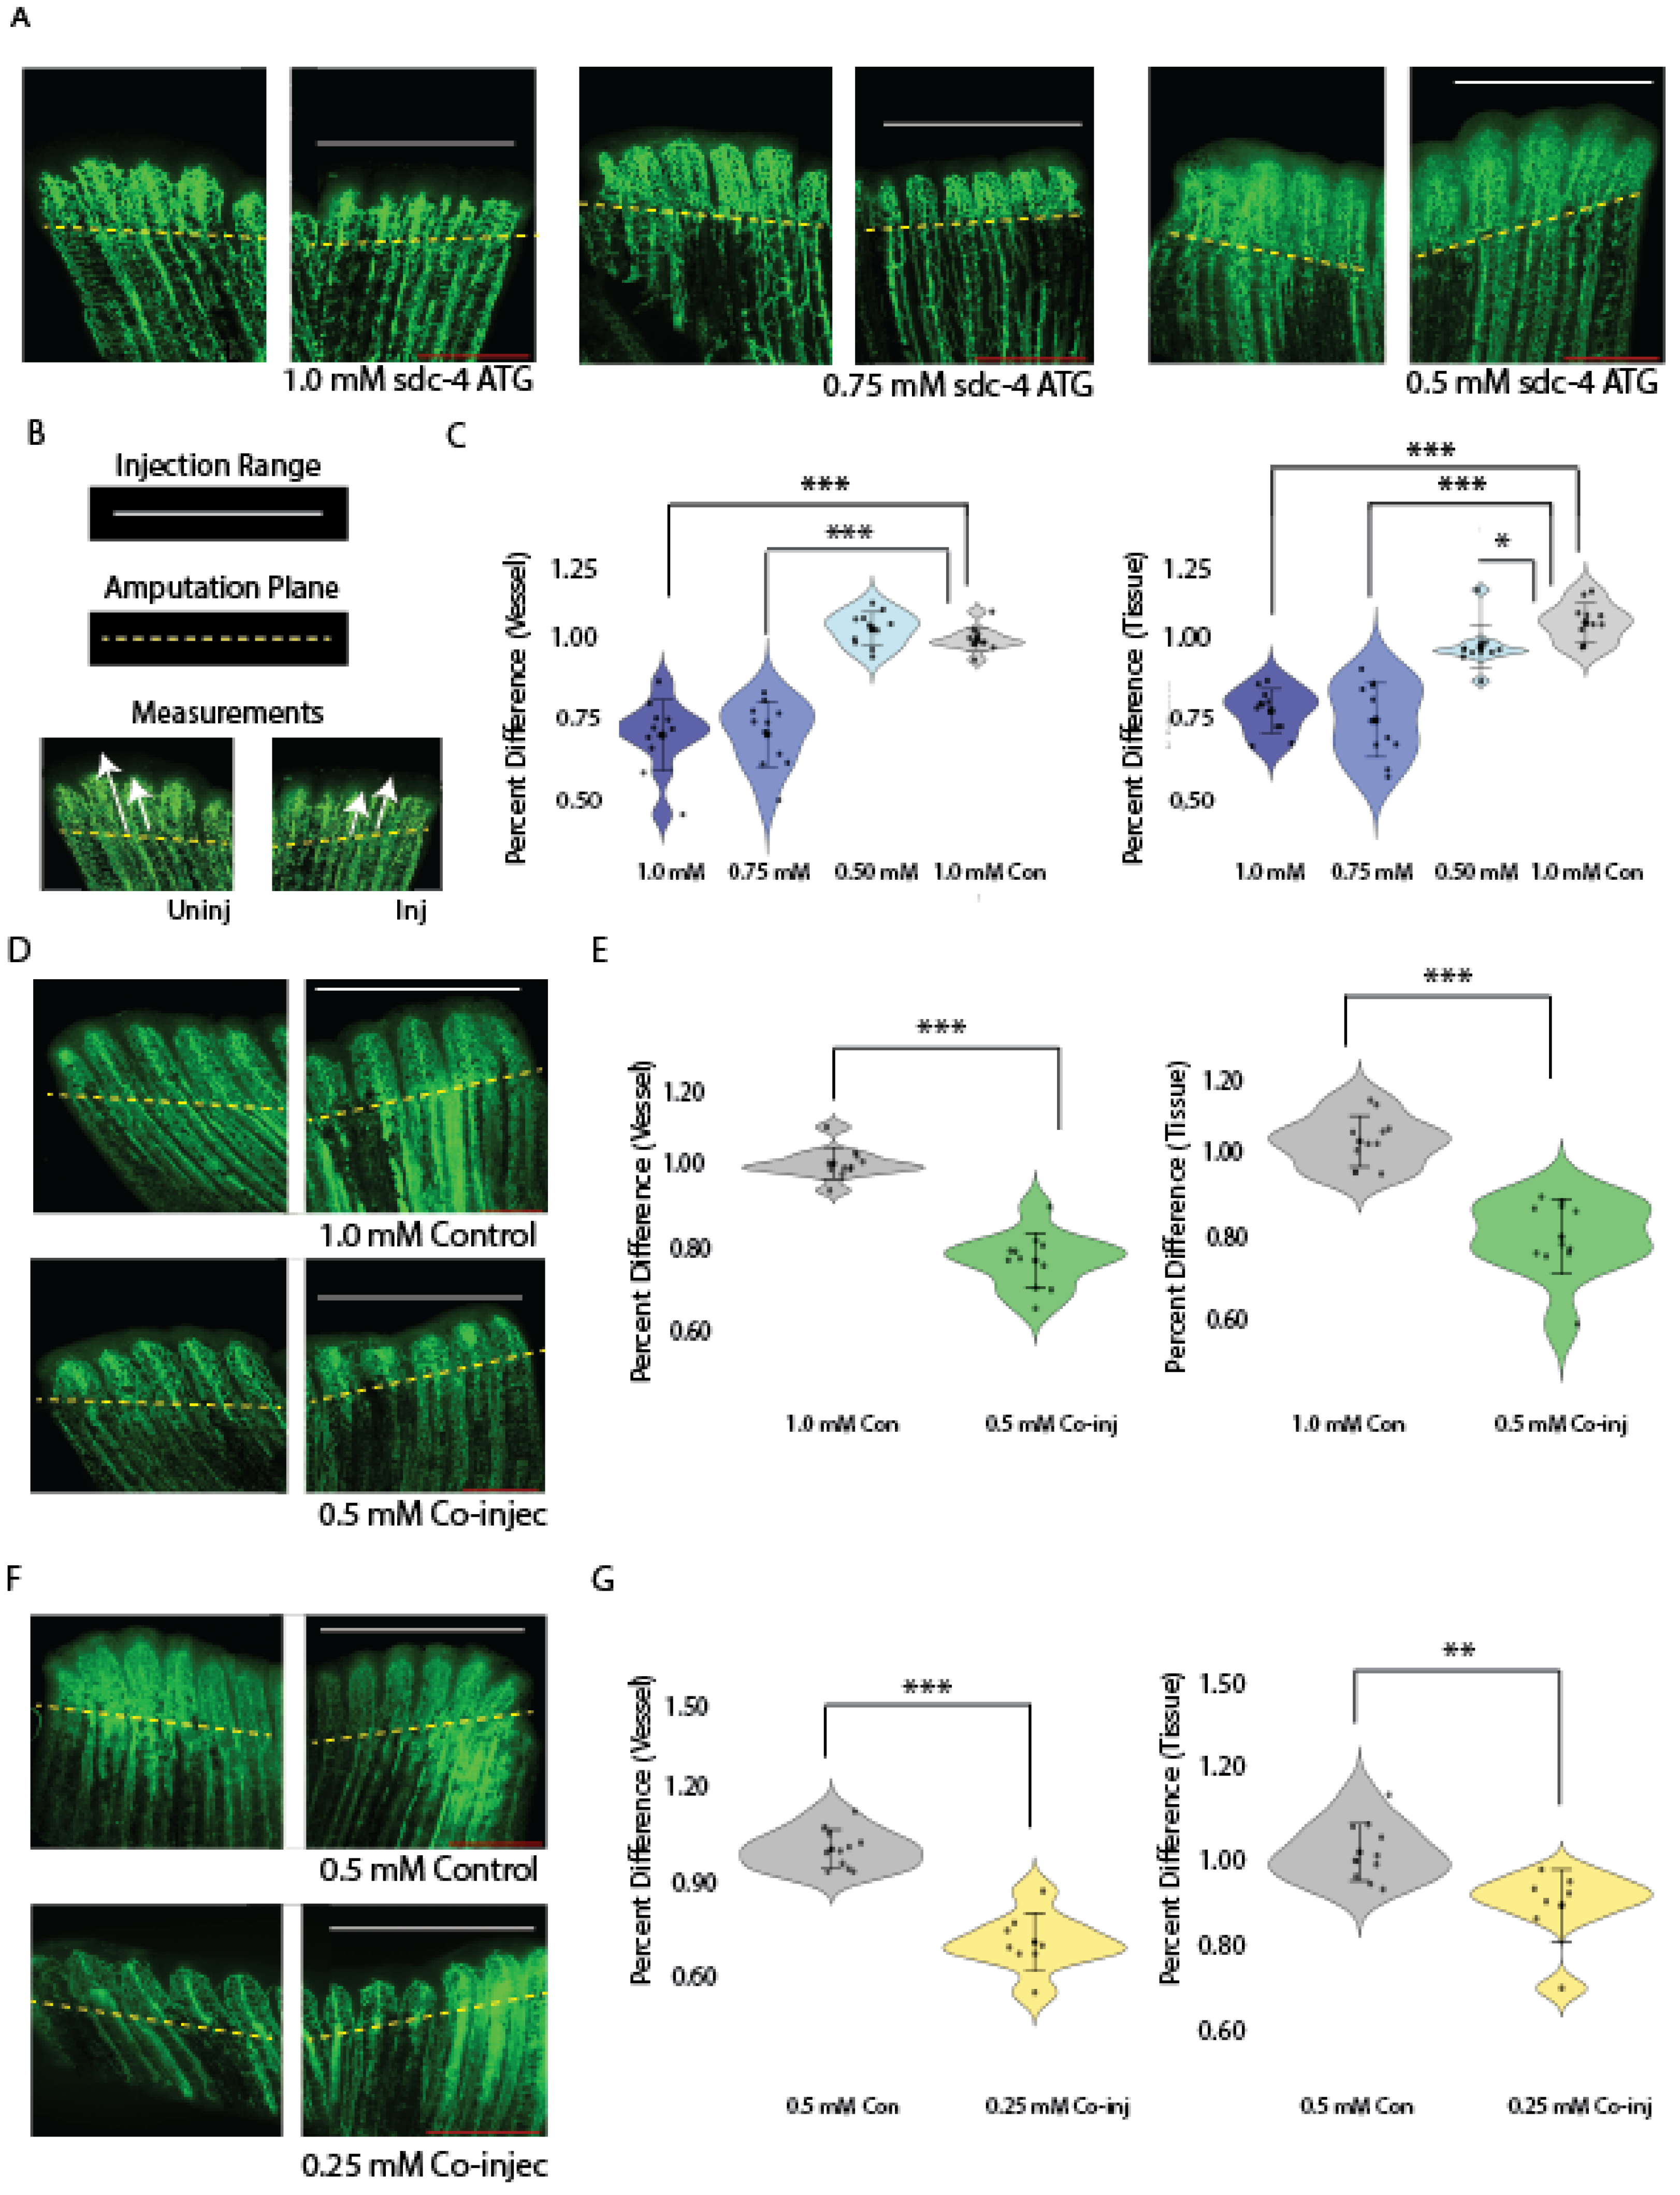
Confirmation of Sdc4 and TMEM184A interactions in ECs, as well as recent literature findings that show Sdc4 requirement in pathological angiogenesis and wound healing [21,22], prompted us to consider whether both proteins cooperate in the same pathway to promote angiogenesis. In our previous work in ZF embryos, we observed no effect on ISV outgrowth with 0.5 mM tmem184a MO injections [29]. Here, we determined sub-threshold concentrations of sdc4 MO by titrating 1.0-, 0.75-, 0.5- and 0.25 (not shown)-mM amounts, or injecting control MO at 1.0 mM and examining the phenotypes, comparing the outgrowth in MO injected half of the fin to the uninjected half. (Figure 2A and B). Percent difference calculations (as described in Methods) showed that vessel and tissue outgrowth were decreased by 20% in fins injected with a 1.0 mM – 0.75 mM range of sdc4 MO, while no significant decrease was observed with lower sdc4 MO concentrations (** p < 0.05) (Figure 2 B). To determine whether Sdc4 and Tmem184a synergize, we co-injected 0.5 mM sdc4 MO and 0.5 mM tmem184a MO and compared the levels to 1.0 mM control MO and the subthreshold levels of each MO alone (Figure 2C). Percent difference calculations indicated 20% decreased outgrowth in the co-injected fins *** p < 0.0001) (Figure 2C). We also examined subthreshold injections at 0.25 mM concentrations for both MOs, as well as 0.5 mM control MO and 0.25 mM sdc4 with 0.25 mM tmem184a MO co-injections (Figure 2D). Our statistical analysis of fins injected with half of the subthreshold concentrations of both morpholinos in a co-injection confirmed the cooperation of both proteins in vessel (*** p < 0.0001) and tissue repair (** p < 0.005), which suggests the interaction is critical for reparative angiogenesis in wound healing.
Figure 2.
Combined subthreshold morpholinos sdc4 and tmem184a blockers synergize to produce a vascular phenotype. Panel A. Representative confocal images of sdc4 MO titration in Tg(fli-egfp) fin regenerants. Scale 500 μm. B. Illustration of method showing injection range along fin rays, amputation plane demarcation, and measurements of vessel and tissue outgrowth comparison to generate percent difference calculations. C. Violon plots of quantitation of sdc4 MO titration injections (blue range violins from darkest (1.0 mM) to lightest (0.5 mM)) for vessel (left) and tissue (right) outgrowth of the uninjected and injected third rays compared with Lissamine control MO (gray violin) shown in A. sdc4 blocker: n = 11 for 0.5 mM, 0.75 mM, and 1.0 mM representative groups, * p < 0.05 and *** p < 0.0005 in a student t-test. D. Confocal images of Tg(fli-egfp) fin regenerants injected with 1.0 mM Lissamine control MO (1.0 mM Con) and combined 0.5 mM sdc4 and 0.5 mM tmem morpholinos, (0.5 mM Co-injec). Scale 500 μm. E. Violin plots of quantitation, as in C., showing direct comparisons of vessel and tissue outgrowth for the 1.0 mM Con (grey violins) and 0.5 mM co-injec (green violins) groups of the injected and uninjected third rays from the amputation planes, n = 11 for 1.0 mM Con and 0.5 mM Co-injec representative groups, *** p < 0.0005 in a student t-test. F. Confocal images of Tg( fli-egfp) fin regenerants injected with 0.5 mM Lissamine control MO (0.5 mM Con) and combined 0.25 mM sdc4 and 0.25 mM tmem184a ATG morpholinos, (0.25 mM Co-injec). Scale 500 μm. G. Violin plots of quantitation, as in E., showing direct comparisons of vessel and tissue outgrowth for the 0.5 mM Con (grey violins) and 0.25 mM co-injec (yellow violins) groups of the injected and uninjected third rays from the amputation planes, n = 11 for 0.5 mM Con group and n = 8 for 0.5 mM Co-injec group, *** p < 0.0005, ** p < 0.005 in a student t-test.
a. TMEM184A is Required to Maintain post-translational VE-cad levels in sub-confluent ECs.
Our recent developmental angiogenesis study ZF found that Tmem184a KD significantly decreased levels of total VE-cad in embryo lysates and in developing ISVs, in parallel to decreased angiogenesis [29]. Coupled with published evidence of Sdc4 involvement in EC migration and VE-cad recycling and our TMEM184A-Sdc4 interactions above, these findings led us to ask whether the stability of VE-cad was dependent on TMEM184A expression and function in cultured ECs.
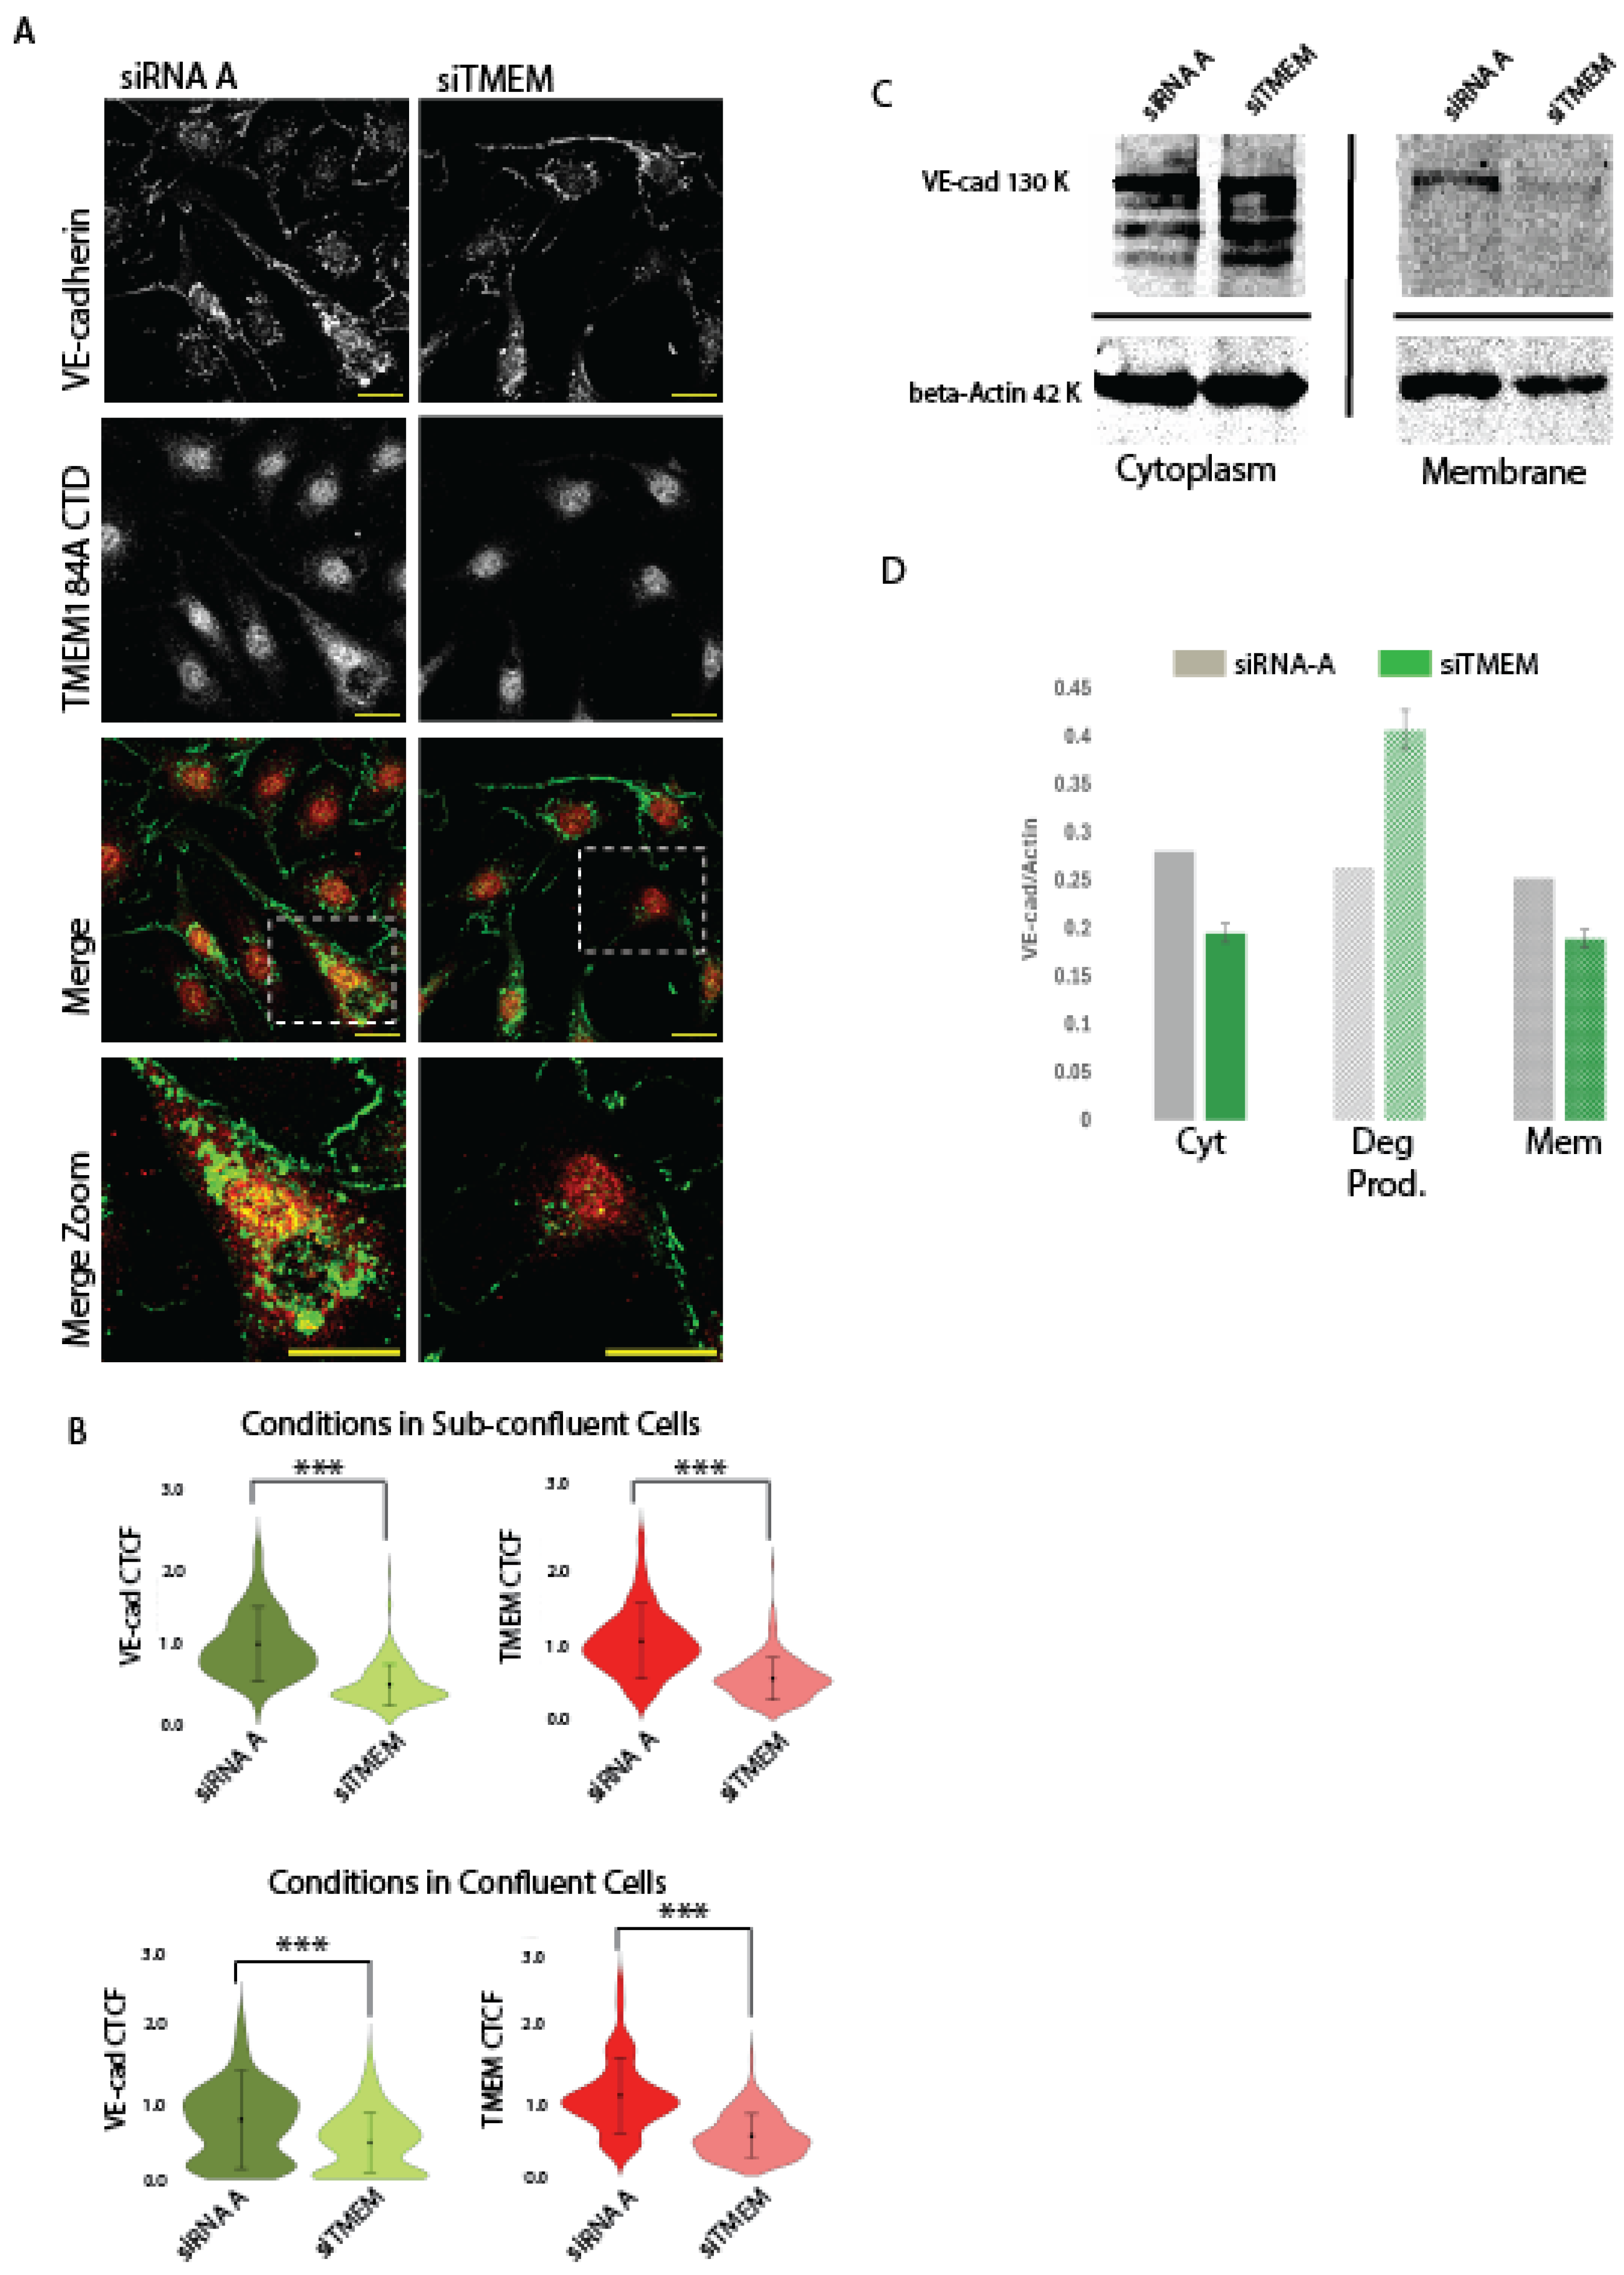
We employed a transient transfection of BAOECs with bovine TMEM184A siRNA and compared VE-cad antibody staining in IF with that of siRNA-A control cell staining. Our analysis of stained transfected cells confirmed transient TMEM184A KD in cells with 65% – 75% confluence (Figure 3 A.) and in cells with confluence greater than 90% (IF images shown in Figure S3.B. and quantitation in Figure 3.B.) through a calculation of the relative absorbance of the TMEM184A siRNA compared to control siRNA-A cells (Figure 3. B.). Relative absorbance of VE-cad staining in the TMEM184A KD sub-confluent cells compared to control cells decreased by about 50% - 60%, (Figure 3. B.). Visually, the greater effect of TMEM184A siRNA on sub-confluent cells shows a marked decrease in VE-cad puncta when compared directly to TMEM184A siRNA knockdown VE-cad staining (Figure 3. A., boxed and zoomed images), indicating that TMEM184A KD significantly affects the trafficking and sorting of VE-cad in actively proliferating and migrating cells.
To determine whether VE-cad membrane stability was affected in KD cells we fractionated TMEM184A siRNA and control siRNA-A cells into cytoplasmic (supernatant) and membrane (pellet) samples and evaluated their VE-cad levels with WB (see Materials and Methods for details). This protocol employed a moderately fast (13,000 x g) and long (12 minutes) cold spin that efficiently separated all cytoplasmic components including vesicles and intra organelle components from the membranes of the cell including the plasma, ER and nuclear membranes. In WB of sub-confluent cells (Figure 3. C.), both cytoplasm (Cyt) and membrane (Mem) VE-cad levels are decreased in TMEM184A siRNA (siTMEM) cells compared to siRNA -A control cell levels and siTMEM cells show increased VE-cad degradation (Deg Prod.) compared to control cells. (Figure 3. D.)
RT-qPCR of TMEM184A and siRNA-A control sub-confluent cell populations with 60% showed confirmation of decreased TMEM184A transcript in siTMEM cells normalized to GAPDH (0.12-fold). Relative levels of VE-cad transcript neither increased or decreased relative to TMEM184A or GAPDH transcript levels, suggesting that VE-cad transcriptional changes are not affected by changes in TMEM184A expression. Taken together with our IF and WB results, these data support that TMEM184A is required to maintain post-translational VE-cad levels and VE-cad membrane stability potentially through the regulation of its sorting and trafficking.
Figure 3.
TMEM184A siRNA KD decreases post-translational levels of VE-cad in the membrane and in cytoplasmic vesicles. Panel A. Comparisons of VE-cad (green) and TMEM CTD staining (red) in siRNA-A and siTMEM BAOECs. Reduced levels of VE-cad and TMEM are highlighted in merged, dashed box, zoom, comparisons. Scale 20 μm. B. Violin plots of corrected total cell fluorescence (CTCF) values of VE-cad and TMEM184A across siRNA-A (dark green and dark red violins) and siTMEM cells (light green and light red violins) in sub-confluent and confluent BAOECs across three independent experiments, n = 179 in sub-confluent condition, n = 193 in confluent condition, *** p < 0.000.1 C. WB of siRNA-A and siTMEM subcellular fractionation lysates comparing Cyt (supernatant) and Mem (pellet) fractions. Cyt fractions show full length VE-cad (130 kDa) and Actin loading control (42 kDa) with increased degradation in the siTMEM lane. In Mem fractions, full length VE-cad and Actin loading control bands are compared in one independent experiment. D. Quantification of WB of subcellular fractionation densities of VE-cad normalized to Actin for full length VE-cad, VE-cad degradation products, and membrane VE-cad bands from one representative blot.
b. TMEM184A-tGFP Expression Colocalizes in VE-cad puncta and Increases total VE-Cad in Sub-Confluent ECs.
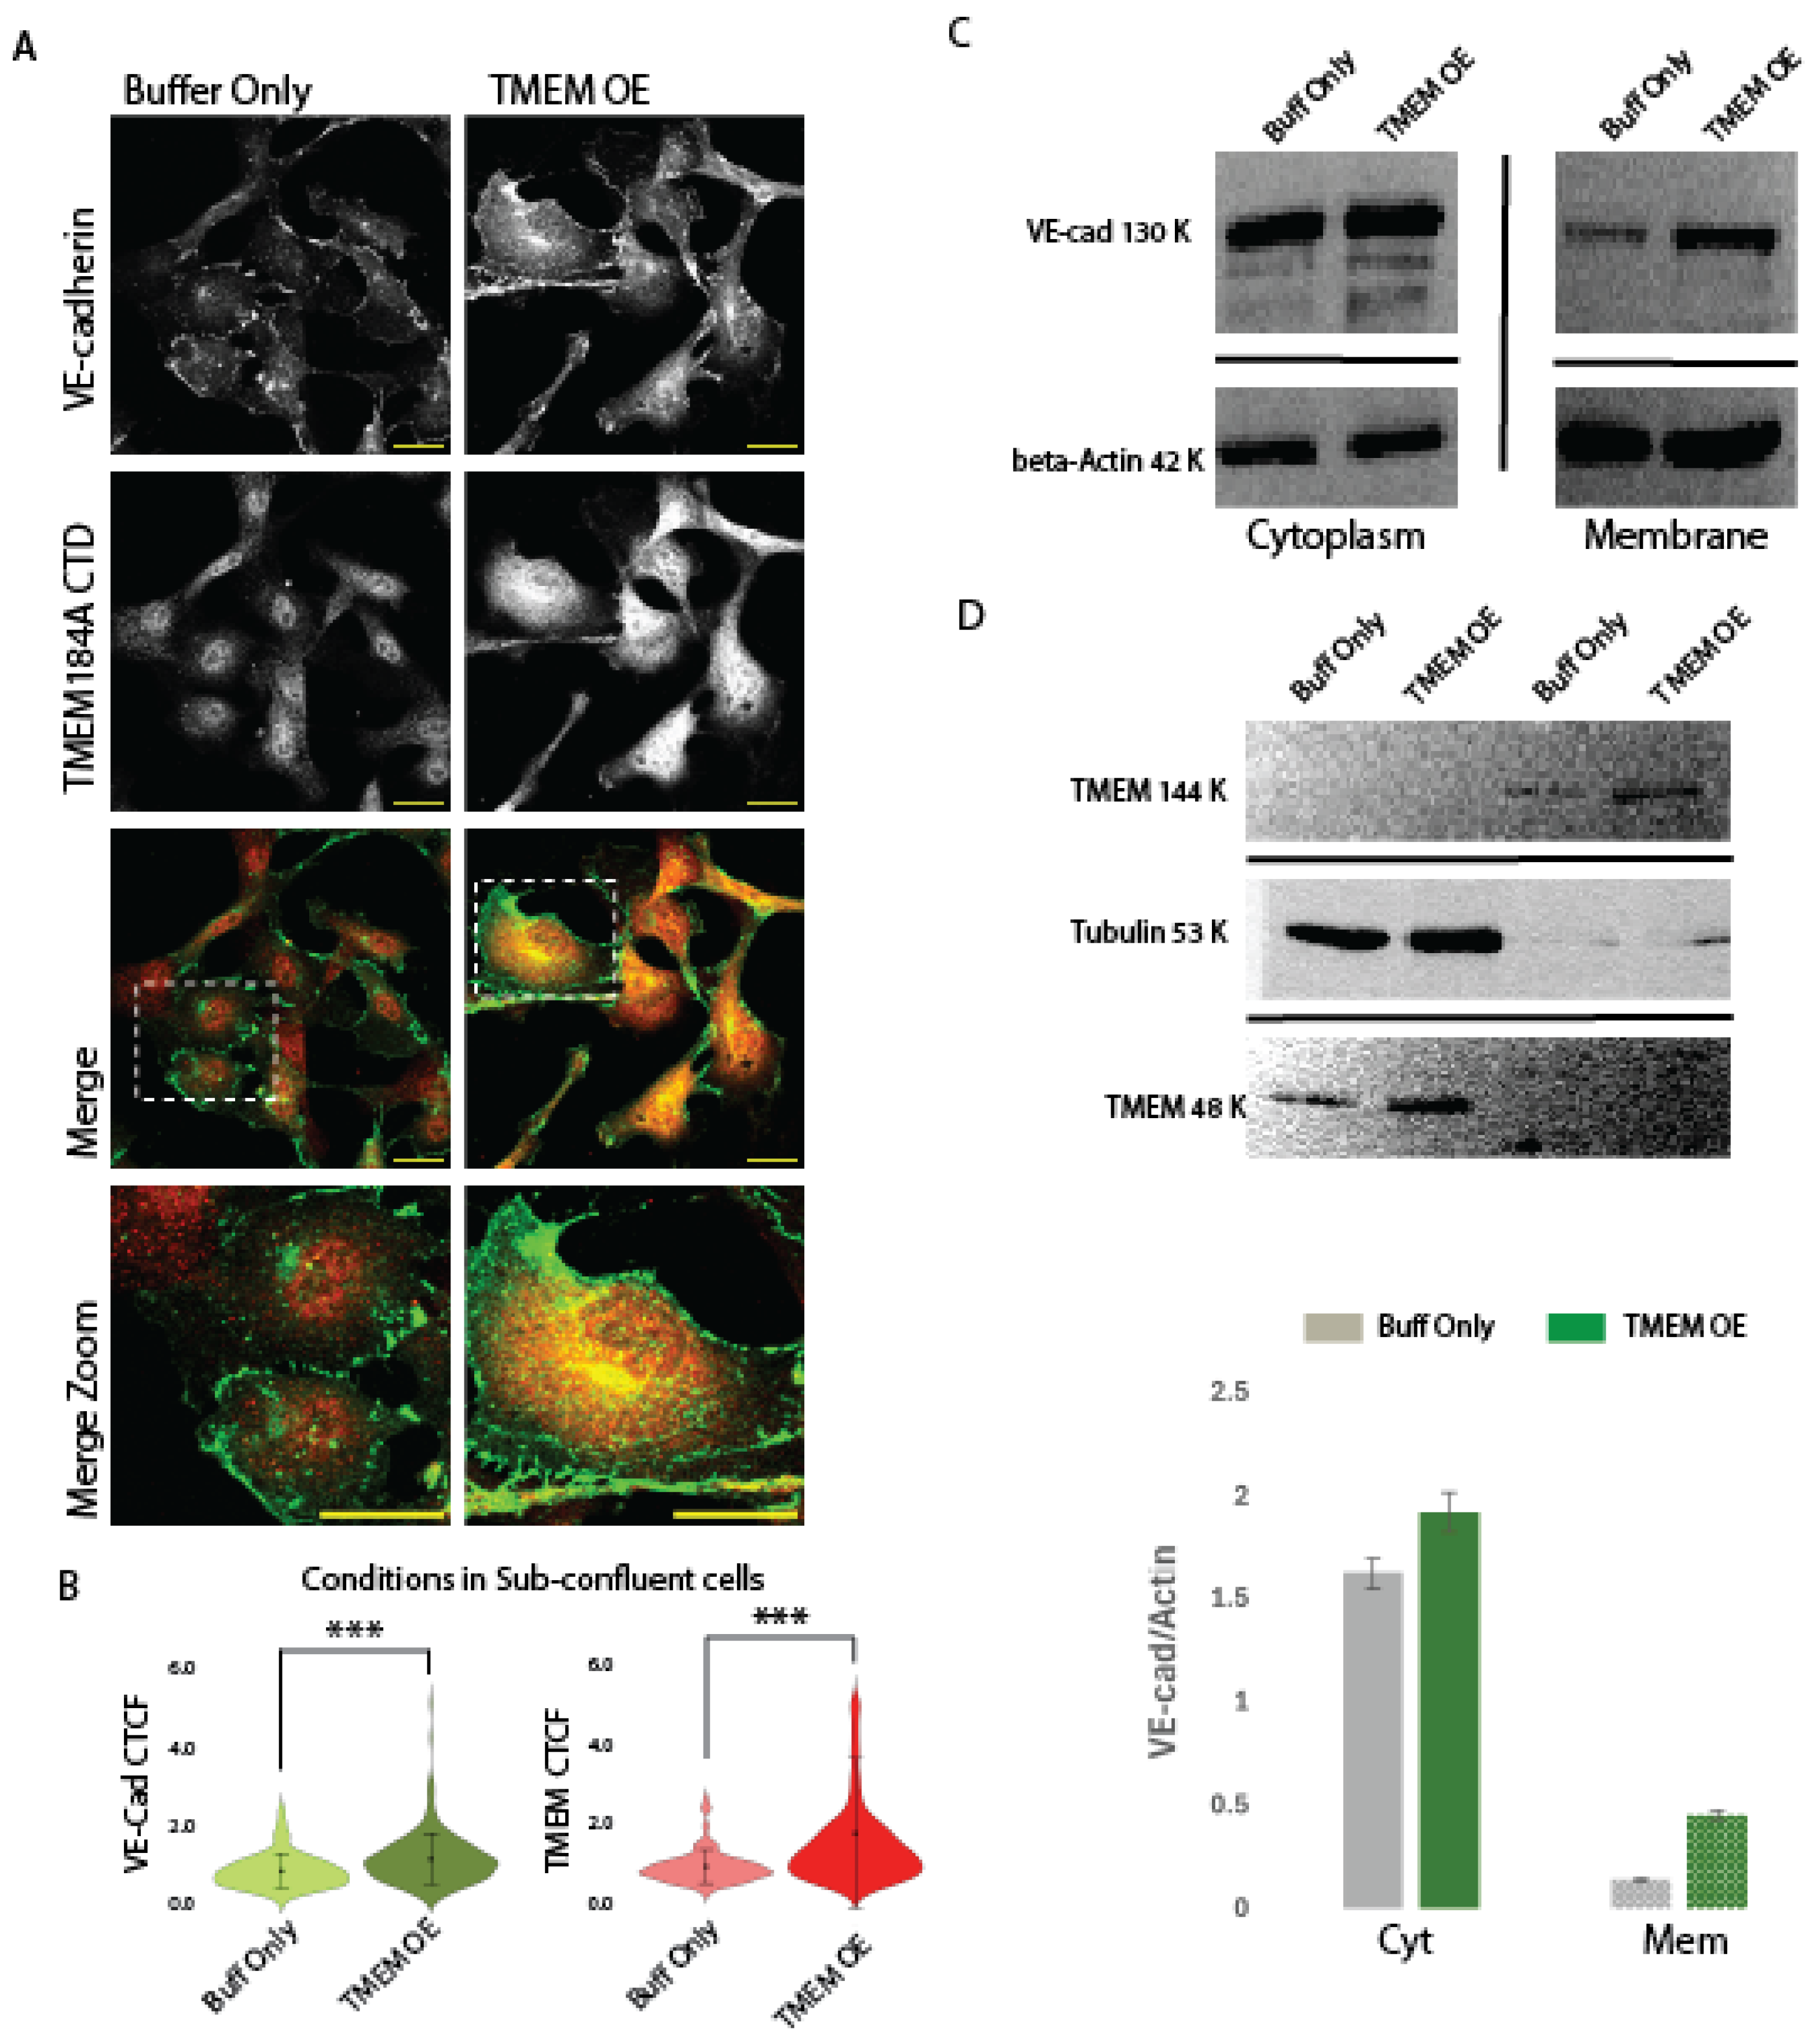
Since TMEM184A siRNA significantly decreased VE-cad levels in cell culture, we asked whether overexpression of the TMEM184A receptor would increase VE-cad levels, we used electroporation of a TMEM184A-tGFP construct compared with a mock control electroporation in buffer only. TMEM184A-tGFP expression (TMEM OE) showed increased colocalization rates of TMEM184A with VE-cad in both vesicles and perinuclear regions when compared to mock electroporation (Figure 4. A., boxed and zoomed images) and increased relative absorbance of both VE-cad and TMEM184A were observed in TMEM OE compared to mock control cells (Figure 4. B.). This was also visually observed in the increased density of VE-cad in AJ sites in static TMEM OE cells compared with mock control cells. To confirm TMEM OE electroporation as well as IF findings, and to determine whether TMEM OE increases VE-cad membrane stability, we used subcellular fractionation and immunostaining of TMEM184A and VE-cad in WB to show differences in the relative densities of cytoplasm (supernatant) and membrane (pellet) samples. (Figure 4. C. and D.) Fractionated samples of TMEM OE show increased levels of TMEM184A CTD in both cytoplasm and membrane fractions (Figure 4. C.), as well as increased stability of VE-cad in the membrane, with an increased amount of VE-cad and VE-cad degradation products in the cytoplasm (supernatant) of TMEM OE cells (Figure 4. D.). Quantitation of Cyt and Mem VE-cad bands shown in D. confirmed an increase in the relative densities of VE-cad bands normalized to Actin in TMEM OE cells compared to mock control cells (Figure 4. E.). Collectively, these results suggest that constitutive recycling of TMEM184A is induced in TMEM OE cells and results in increased recycling and membrane recovery of VE-cad.
Figure 4.
TMEM OE increases VE-cad rapid recycling and membrane levels. Panel A. Comparisons of VE-cad (green) and TMEM184A CTD (red) staining in siRNA-A and siTMEM BAOECs. Increased levels of VE-cad and TMEM and VE-cad-TMEM colocalization in TMEM OE are highlighted in merged, dashed box, zoom, comparisons. Scale 20 μm. B. Violin plots of corrected total cell fluorescence (CTCF) values of VE-cad and TMEM184A across cells electroporated with buffer only (Buff only, light green and light red violins) and cells electroporated with TMEM-tGFP (dark green and dark red violins) in sub-confluent BAOECs across three independent experiments, n = 198, *** p < 0.0001. C. TMEM OE confirmation with TMEM184A CTD staining in cells electroporated with buffer only (Buff only) and cells electroporated with TMEM-tGFP showing TMEM184A CTD (144 kDa, 48 kDa) and Tubulin (53 kDa). D. Representative WB of subcellular fractionation samples from Buff Only and TMEM OE cells, VE-cad (130 kDa), beta-Actin (42 kDa). WB was obtained in duplicate, once with beta-Actin and once with Tubulin. E. Western blot quantifications of VE-Cad densities normalized to Actin for Cyt and Mem fractions of Buff Only cells (grey boxes) and TMEM OE cells (green boxes) from the representative blot shown in D. TMEM184A colocalizes with Rab-GTPases in response to VEGF.
c. TMEM184A Colocalizes with Rab-GTPases in Response to VEGF
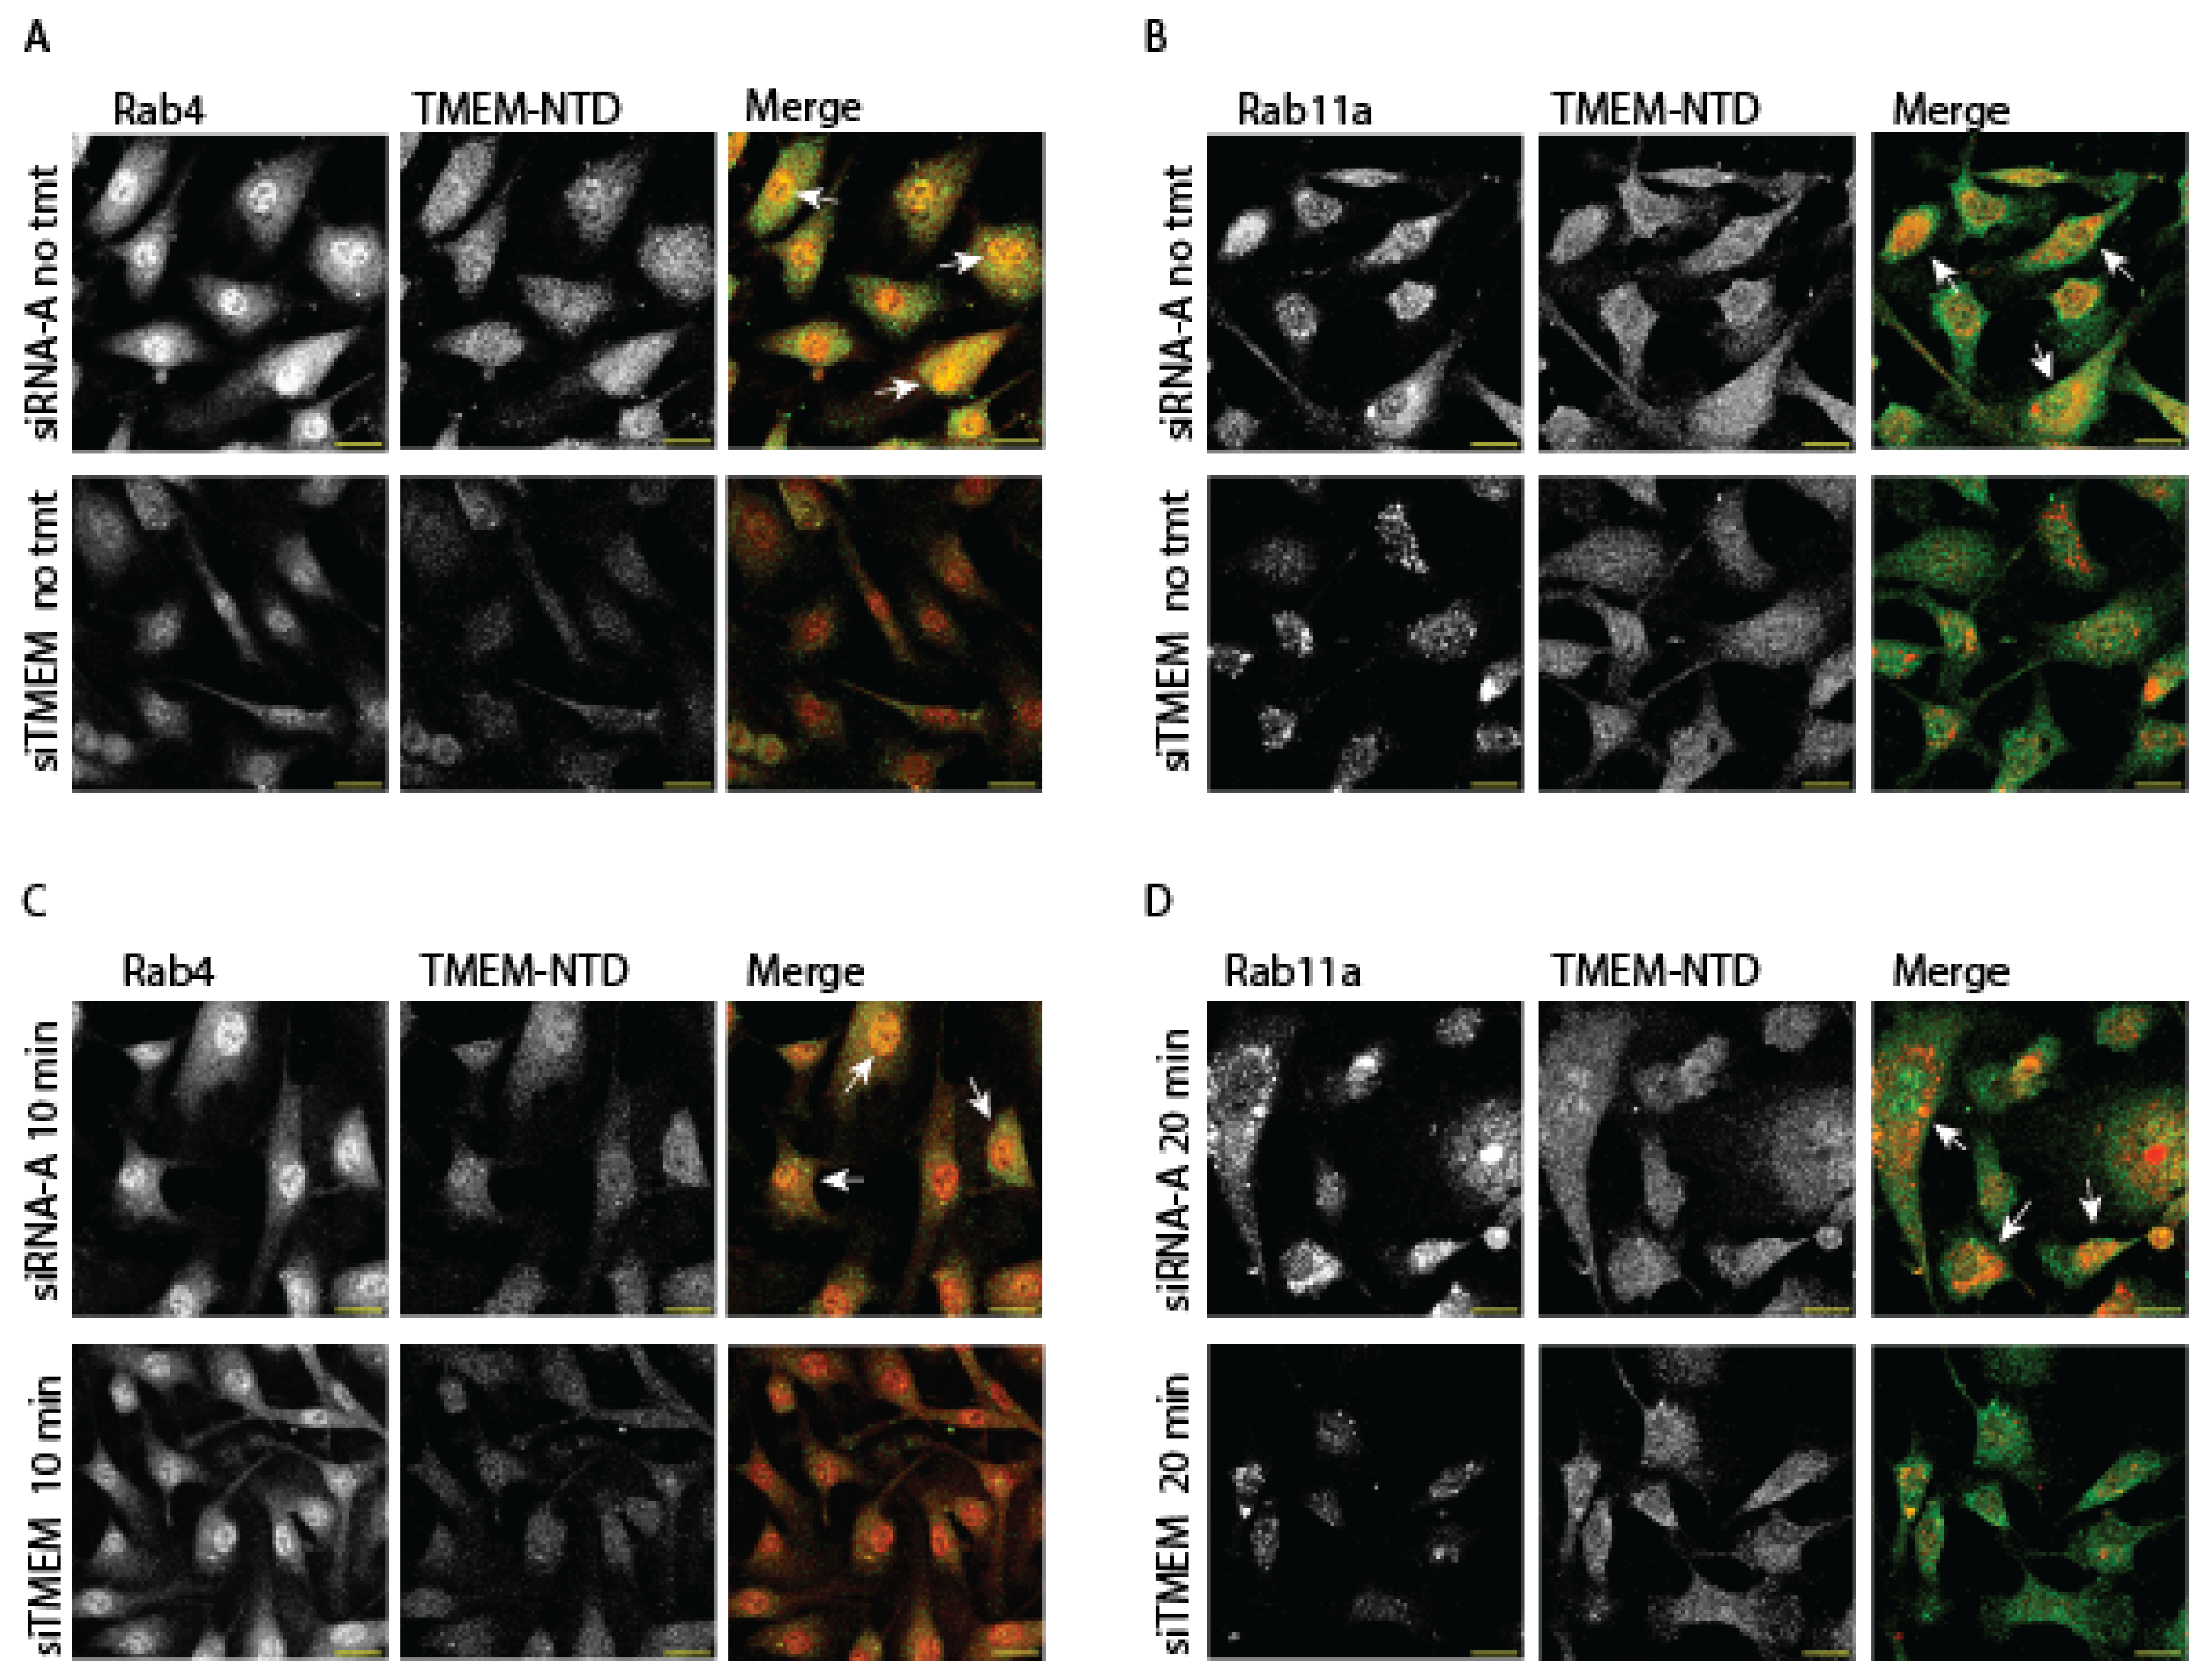
Because TMEM184A forms vesicle puncta, VE-cad levels were significantly decreased in siTMEM ECs both at adhesion sites and in intracellular puncta, and TMEM OE cells exhibited increased vesicles of TMEM184A colocalized with VE-cad puncta, we asked whether TMEM184A colocalizes with Rab4 or Rab11a key trafficking players in ECs with induced growth factor signaling through VEGF treatment. In IF staining of untreated BAOECs, TMEM184A colocalizes with Rab4 in puncta both in the Rab4 sorting compartment (Figure 5. A., white arrows) and in cytoplasmic vesicles, and there is a visible decrease in Rab4 fluorescence levels in untreated siTMEM cells. Untreated BAOECs also show colocalization of TMEM184A with Rab11a in bright perinuclear yellow and orange puncta (Figure 5. B., white arrows), and Rab11a vesicles are visibly decreased in siTMEM cells. In BAOECs treated with 10 minutes of VEGF, TMEM184A and Rab4 colocalization is visibly decreased in the sorting compartment (Figure 5. C., white arrows) and Rab4 fluorescence levels appear unchanged in treated siTMEM cells compared to treated control cells. However, 20 minute VEGF treated cells stained with Rab11a and TMEM184A appear to maintain the Rab11a-TMEM colocalization observed in untreated cells while showing increased yellow and orange vesicles (Figure 5. D., white arrows), and siTMEM cells maintain low levels of Rab11a compared to that of control cells with 20 minute VEGF treatments. Taken together, these data suggest that TMEM184A is a component of the sorting and late endosomal trafficking system in vascular ECs and is required for the regulation of Rab4 sorting endosome levels in untreated cells and Rab11a late recycling endosomes in both the presence and absence of VEGF treatment.
Figure 5.
TMEM184A colocalizes with recycling Rab-GTPases in the presence of VEGF. BAOECs were treated with VEGF-165 or left untreated as noted, fixed, and permeabilized with 0.5% Triton X-100 to increase the visibility of vesicles. A. In untreated cells, Rab4 (red) colocalizes with TMEM184A NTD (green) in the vesicle sorting compartment and in the cytoplasm shown in bright yellow puncta (white arrows) and Rab4 and TMEM-NTD fluorescence levels are visibly decreased in siTMEM cells. Scale 20 μm. Images are representative of 11 images from two independent experiments. B. Rab11a (red) colocalizes with TMEM184A NTD (green) in bright yellow and orange puncta (white arrows) in cells without treatment. Rab11a fluorescence, along with TMEM184A NTD fluorescence levels are visibly decreased in siTMEM cells. Scale 20 μm. Images are representative of 15 images from three independent experiments. C. Rab4 (red) and TMEM184A NTD (green) colocalization appears to decrease (white arrows) upon VEGF treatment in control cells and Rab4 levels appear to not decrease visibly in treated siTMEM cells compared to untreated cells in A. Scale 20 μm. Images are representative of 10 images from two independent experiments. D. Rab11a (red) colocalizes with TMEM184A NTD (green) in a greater number of bright yellow and orange puncta (white arrows) in control cells treated with VEGF for 20 minutes. Rab11a vesicle formation is depleted in siTMEM cells treated with VEGF for 20 minutes. Scale 20 μm. Images are representative of 15 images from three independent experiments.
d. TMEM184A KD Cells Migrate Faster Compared to Control siRNA Cells in Wounding
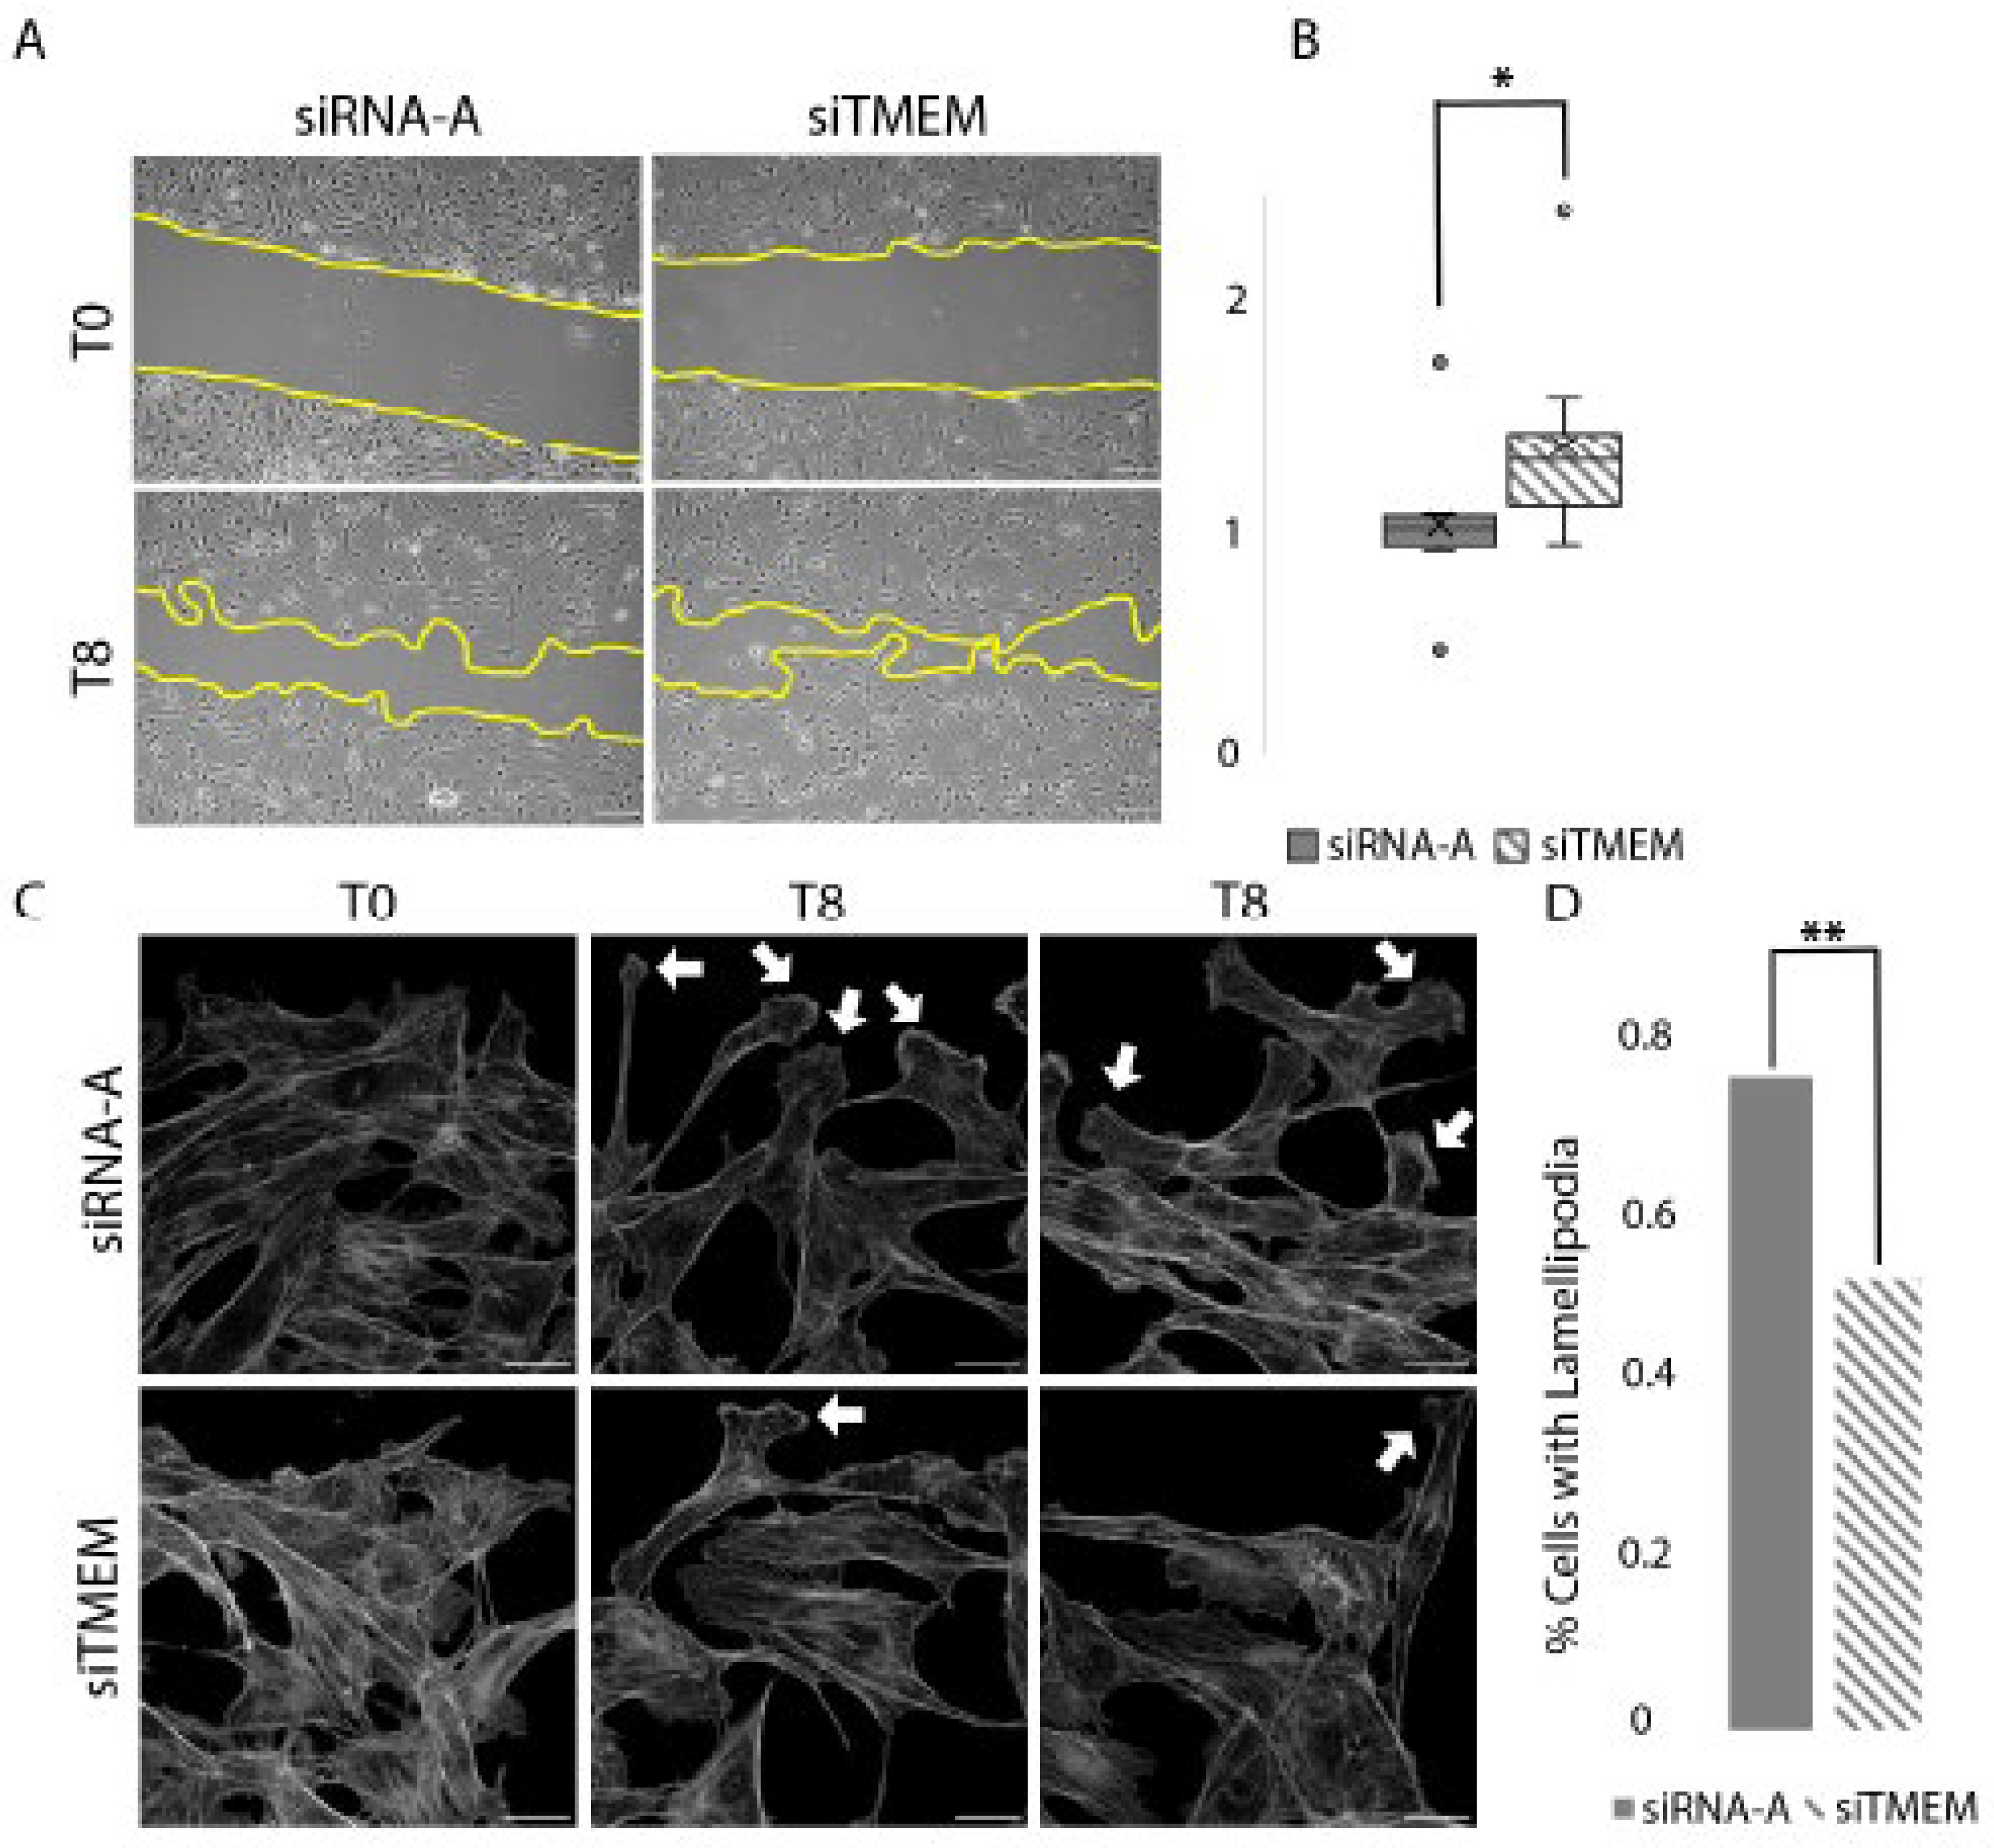
Previously, we have shown that Tmem184a KD in the regenerating ZF caudal fin results in aberrant vascular outgrowth [30]. (Farwell 2017) TMEM184A KD also decreases VE-cad levels. We hypothesized that TMEM184A KD would alter the speed and/or organization of migration in cultured ECs. We therefore asked whether TMEM184A siRNA treated ECs migrate differently compared to control siRNA cells in scratch wound healing assays. siTMEM cells migrate faster than control siRNA cells at 8 hours post scratch (Figure 6. A.). The relative rate of closure was determined for siTMEM and control cells over 8 hours post wounding. Migration of cells into the wound area during the eight hours was significantly faster in siTMEM cells. (Figure 6. B.) Following our brightfield observations of cell migration, we examined the wounded layers for morphological differences in migrating cells by looking at the filamentous actin in cells at the leading edge of the scratch. (Figure 6. C.) We determined that the KD cells contained approximately 30% fewer lamellipodia compared to the control cells at 8 hours post scratch. (Figure 6. D.) Taken together, these data suggest that TMEM184A expression is required for consistent directional movement in collective cell migration in wound healing.
Figure 6.
Rate of closure in siTMEM and siRNA-A cells. Panel A. Phase contrast (10x) images of transiently transfected BAOEC (siTMEM or siRNA-A) cells undergoing migration 0 and 8 hours post scratch. Seeded on 0.2% porcine gel; conducted in 0.2-0.5% Hi-FBS MEM media, 37°C, and 5% C02. The yellow line indicates the leading edge of migration. Scale 100um. B. Rate of closure per well (siTMEM n = 11, siRNA-A n = 10) was calculated and normalized to average rate of closure for siRNA-A per replicate (n = 3). A Mann-Whitney U test was performed, *p < 0.05. (U = 20, p = 0.013). C. Confocal microscopy of the leading edge at 0 and 8 hours post scratch (Gray: Phalloidin) (scale 20 um). White arrows indicate lamellipodia during cell migrating at the leading edge at T8. D. Percentage of migratory front cells containing lamellipodia (KD n = 125, siRNA-A n = 132 cells). A chi-squared test was performed **p < 0.001.
4. Discussion
Our early experiments with cultured vascular cells indicated that heparin treatment induced MAPK signaling changes downstream of PKG activation and increased c-GMP production [2,6]. We now know that heparin is a ligand that binds TMEM184A and that TMEM184A is required for at least some of the downstream heparin effects we observe in vascular cells, including decreased levels of p-ERK in VSMCs, and DUSP1 dependent decreased levels of p-p38 and p-JNK as well as decreased levels of stress fiber formation in the presence of inflammatory mediators in ECs [1,4,6,38,39]. The decreased p-ERK antiproliferative effect specific to the vasculature also requires calcium dependent eNOS activation in focal adhesion (FA) sites [3]. Our further characterization of TMEM184A in studies in vivo, has shown that Tmem184a is required for proper vascular regeneration in the ZF caudal fin in a manner that slows proliferation, potentially impacting cell organization and polarity [30]. In developing ZF embryos, tmem184a MO KD produced similar vascular defects [29].
In a pathological angiogenesis mouse model, Sdc-4 interacted with VE-cad in an HS independent manner and was required for VE-cad internalization and processive angiogenesis [21]. VE-cad is a mechanosensor protein that is integral to AJs and forms homotypic associations in clusters with VE-cad in the membrane of neighboring cells. There is additional supporting evidence in the literature that Syndecans play crucial roles in the localization and trafficking regulation of cell surface mechanosensors, including the trafficking of Cadherin and Integrin types to stabilize AJs and FAs in migrating fibroblasts [18,40].
In the present study, we examined the hypothesis that TMEM184A interacts with Sdc4 in vivo. In cultured ECs, we found co-localization of TMEM184A and Sdc4 that could also persist through mild cell disruption and IP. In addition, Sdc4 and Tmem184a synergize in a zebrafish caudal fin regeneration model supporting the idea that these two proteins interact in vascular function. It is likely that other HSPGs can also interact with TMEM184A through their HS chains (or possibly also through protein-protein interactions).
The requirements for Sdc4 in migration may be critical for wound healing. Homozygous and heterozygous Sdc4 KO in an epithelial mouse model showed decreased size in the developing microvasculature of epidermal granular tissue, and Sdc4 KD in HUVECs slowed vascular tube formation and decreased cortical actin fiber rings and vinculin puncta, promoting cell elongation and decreasing cell roundness [16,22]. In a related study, Sdc4 inhibition of Rac activity promoted directional cell migration in neural crest cells [19]. These data suggest that while Sdc4 is required for internalization of VE-cad in order that AJs may decouple and reform in cell proliferation and migration [21], forces exerted directly or indirectly through flow or the ECM also impact VE-cad movement and junctional integrity.
In addition to the observation that Tmem184a KD induced truncation of ISVs outgrowth in the developing ZF embryo, Tmem184a KD reduced total VE-cad levels in proliferating stalk cells, suggesting that TMEM184A expression and or function is required to maintain VE-cad levels in proliferating cells [29]. In studies of VE-cad in static cells and in flow, Src family kinases and VE-PTP contribute to the phosphorylation schemes of the cytoplasmic tail of VE-cad, its stability in the membrane, and its rapid recycling or degradation in the remodeling of AJs. reviewed in [41]. In a recent study of VE-cad in flow, activated Src-family related YES kinase at the plasma membrane, was required for VE-cad Tyr phosphorylation and internalization in HUVECs and vascular tissues [42], and YES deletion increased cortical actin ring bundles and collective cell migration rates in HUVECs and promoted leakage in a vascular mouse model [42].
Here we find that depletion of TMEM184A in proliferating BAOECs in culture decreases the relative levels of VE-cad in AJs and in intracellular vesicles without decreasing relative mRNA levels. This effect is observed with statistical significance, but to a lesser extent, in siTMEM confluent monolayers, suggesting that the recovery of VE-cad in proliferating and migrating cells and in junctional remodeling of monolayers is dependent at least in part on TMEM184A expression. Conversely, we found that TMEM184A OE sub-confluent ECs displayed relatively increased levels of VE-cad that colocalized with TMEM184A, leading to jagged AJs and rounded morphology likely due to increased VE-cad membrane turnover. Similar to our findings in the ZF caudal fin, developing embryo, and in vascular cell culture, CMTM4 MO KD in ZF truncated ISV outgrowth, and OE of CMTM4 in HUVECS enhanced vesicular VE-cad and increased Rab4, Rab11, and Rab7 GTPases promoting both degradation and turnover as well as rapid recycling of VE-cad to AJs [27].
VE-PTP dynamics have been shown to classically regulate AJ dynamics through dephosphorylation mechanisms at the CTD of VE-cad that either promote p120-catenin binding and its membrane stability or VE-cad internalization to early endosomes [43]. VE-PTP was also shown to prevent VE-cad internalization and promote junctional integrity through binding of RhoGEF GEF-H1, sequestering it from Rho and reducing Rho activation at AJs [44]. Our study of inflammatory signaling in ECs showed that TMEM184A was required for the induction of dual specificity phosphatase-1 (DUSP1) in the presence of heparin, and that this event reduced p-p38 and pJNK levels in modulation of the inflammatory response [1]. Since TMEM activation with heparin upregulated DUSP1, the possibility that TMEM expression and function increases PTP cell surface activation or Rho activity suggests further investigation.
Both the finding that CMTM4 colocalized with Rabs in its upregulation and increased VE-cad turnover and the finding in this study that TMEM OE increased vesicle puncta that contained both TMEM184A and VE-cad, prompted us to investigate whether TMEM184A colocalized with Rab-GTPases. This question is further supported by earlier findings in published literature of TMEM184A (Sdmg-1) where Sdmg1 is observed colocalized with VAMP-1 in non-vascular cell types [28,45]. Indeed, we found that TMEM184A colocalizes with Rab4 vesicles and Rab11a endosomes, indicating that TMEM184A promotes VE-cad vesicle transport recovery to AJs in proliferating ECs.
ECM changes, such as increased stiffness or the deposition of Fibronectin in the matrix, recruit and activate scaffolding players that promote specific Integrins to the membrane and regulate FA stability [46,47]. Rac and Rho signaling regulates cortical actin bundles and actomyosin pulling forces on stress and intermediate fibers respectively that further remodel AJs and FAs, and Sdc4 colocalizes with FAK and is required for the maintenance of specific Cadherins in fibroblast AJs in an HS dependent manner [9,40]. Since Sdc4 directly impacts migratory behavior in cells through interactions with fibronectin ECM and through the regulation of Integrin recruitment to FAs [18], we asked whether the vascular phenotype that resulted from Tmem184a and Sdc4 subthreshold MO injections were due in part to changes in cell migration.
Studies of Sdc4 mediated force transduction that recruits talin-1 and kindlin-2 to FAs to the basement membrane shows that propagated signal requires ROCK1 and PI3K, like that of signal transduction induced through forces applied to VE-cad; and Sdc4 Fibronectin complex formation induces Caveolin-1 dependent Rac1 endocytosis that promotes filopodia extension and directional migration in fibroblasts [20,48]. Since Integrin and VE-cad recycling dynamics and localization to the membrane require dynamic regulation for actin cytoskeletal organization and directional migration [23,24,49] and also require Sdc4 and Syntenin binding [18,50], we asked whether siTMEM cells exhibit migratory defects in scratch wound healing assays. Our results demonstrated that siTMEM cells migrated at a faster rate compared with control cells but in a less coordinated fashion. This finding is further supported by visualization of the leading edge of migrating cells where lamellipodia are significantly decreased in siTMEM cells. Further, in our recent studies in cells, TMEM184A activation through heparin treatment resulted in TMEM184A colocalization with eNOS in FAs, an outcome that required signaling through TRPV4 and eNOS activation [3]. Collectively, our findings and published data support a mechanism in which a loss of Sdc4-TMEM184A interactions and/or VE-cad recovery at the membrane surface in siTMEM cells decrease lamellipodia formation through changes in VE-cad recruitment and Actin polymerization.
This study of the novel heparin receptor, TMEM184A, has provided new knowledge in its characterization of a dual function of the receptor in signaling and trafficking that is required to maintain vascular integrity in wound healing and immune responses as a direct regulator of junctional AJ dynamics through VE-cad turnover. E-cadherin binding induced intracellularly through Cadherin-Catenin Clusters (CCCs) driven by Catenin Associated Proteins (CAPs) forming super-complex arrangements outside of traditional AJs formed through Cadherin homotypic associations are a phenomenon observed specifically in epidermal cells [51]. However, this unusual finding fits a model where dual signaling/recycling proteins such as TMEM184A help to remodel AJs through recruitment of scaffolding proteins regulated by intercellular signaling and trafficking that synchronizes signals propagated across cell monolayers and through tissues. A recent study of a shear stress model in HUVECs showed that NRP-1 localization to AJs stabilized VE-cad in the membrane and promoted p120-Catenin binding promoting cytoskeletal realignment in flow [52], yet another potential mechanism in which TMEM184A signaling and recycling may promote VE-cad stability in endothelial remodeling.
5. Conclusions
Here, we have presented strong evidence that TMEM184A has a dual function in vascular cells through signaling and trafficking mechanisms. Due to progress in clinical cardiovascular research, a broader range of risk factors associated with atherosclerosis, including inherited genetic variants and chronic inflammatory diseases, are now known. These factors present a critical need to develop treatments that reduce cardiovascular inflammation that may lead to atherosclerosis and major cardiac events. Elucidating TMEM184A’s role specific to the regulation of permeability, cell proliferation, and migration in vascular cells will provide us with new knowledge required to develop therapeutic strategies that target TMEM184A to slow the progression of chronic inflammation in atherosclerosis.
Supplementary Materials
The following supporting information can be downloaded at: www.mdpi.com/xxx/s1.
Author Contributions
For research articles with several authors, a short paragraph specifying their individual contributions must be provided. The following statements should be used “Conceptualization, L.M.A., G.O.C., S.L.N.F., and L.J.L-K..; methodology, L.M.A, M.K.I., and L.J.L-K.; software, L.M.A., A.K, S.H.W.; validation, L.M.A., A.K, and S.H.W..; formal analysis, L.M.A., A.K., S.H.W.; investigation, L.M.A., S.H.W., G.O.C., R.L.O., and S.L.N.F.; resources, M.K.I, and L.J.L-K.; data curation, X.X.; writing—original draft preparation, L.M.A., S.H.W. and L.J.L-K.; writing—review and editing, L.M.A., S.H.W., G.O.C., A.K., R.L.O., S.L.N.F., M.K.I., and L.J.L-K.; visualization, L.M.A. and S.H.W..; supervision, M.K.I. and L.J.L-K; project administration, L.J.L-K.; funding acquisition, L.J.L-K. All authors have read and agreed to the published version of the manuscript.
Funding
This research was funded by National Heart, Lung, and Blood Institute, grant number R15HL054269-08 to L.J.L-K.
Institutional Review Board Statement
The animal study protocol was approved by Lehigh’s Institutional Animal Care and Use Committee (IACUC) (Protocol # 172, initially approved 11/17/2014 and most recently renewed as protocol 172 approved 07/19/24).
Acknowledgments
The authors acknowledge Maggie Zasowski, Julia Shapiro, Ivonne Morban and Isabella Papov for help with collection of data, Alex Seaver for help with zebrafish experiments and zebrafish lab managers Nicole Barbera and Cole Bower for their help with fish maintenance.
Conflicts of Interest
The authors declare no conflicts of interest. The funders had no role in the design of the study; in the collection, analyses, or interpretation of data; in the writing of the manuscript; or in the decision to publish the results.
References
- Farwell, S.L.; Kanyi, D.; Hamel, M.; Slee, J.B.; Miller, E.A.; Cipolle, M.D.; Lowe-Krentz, L.J. Heparin Decreases in Tumor Necrosis Factor alpha (TNFalpha)-induced Endothelial Stress Responses Require Transmembrane Protein 184A and Induction of Dual Specificity Phosphatase 1. The Journal of biological chemistry 2016, 291, 5342–5354. [Google Scholar] [CrossRef] [PubMed]
- Gilotti, A.C.; Nimlamool, W.; Pugh, R.; Slee, J.B.; Barthol, T.C.; Miller, E.A.; Lowe-Krentz, L.J. Heparin responses in vascular smooth muscle cells involve cGMP-dependent protein kinase (PKG). Journal of cellular physiology 2014, 229, 2142–2152. [Google Scholar] [CrossRef] [PubMed]
- Li, Y.; Talotta-Altenburg, L.M.; Silimperi, K.A.; Ciabattoni, G.O.; Lowe-Krentz, L.J. Endothelial nitric oxide synthase activation is required for heparin receptor effects on vascular smooth muscle cells. American journal of physiology. Cell physiology 2020, 318, C463–C475. [Google Scholar] [CrossRef] [PubMed]
- Pugh, R.J.; Slee, J.B.; Farwell, S.L.; Li, Y.; Barthol, T.; Patton, W.A.; Lowe-Krentz, L.J. Transmembrane Protein 184A Is a Receptor Required for Vascular Smooth Muscle Cell Responses to Heparin. The Journal of biological chemistry 2016, 291, 5326–5341. [Google Scholar] [CrossRef] [PubMed]
- Pukac, L.A.; Carter, J.E.; Ottlinger, M.E.; Karnovsky, M.J. Mechanisms of inhibition by heparin of PDGF stimulated MAP kinase activation in vascular smooth muscle cells. Journal of cellular physiology 1997, 172, 69–78. [Google Scholar] [CrossRef]
- Savage, J.M.; Gilotti, A.C.; Granzow, C.A.; Molina, F.; Lowe-Krentz, L.J. Antibodies against a putative heparin receptor slow cell proliferation and decrease MAPK activation in vascular smooth muscle cells. Journal of cellular physiology 2001, 187, 283–293. [Google Scholar] [CrossRef]
- Thourani, V.H.; Brar, S.S.; Kennedy, T.P.; Thornton, L.R.; Watts, J.A.; Ronson, R.S.; Zhao, Z.Q.; Sturrock, A.L.; Hoidal, J.R.; Vinten-Johansen, J. Nonanticoagulant heparin inhibits NF-kappaB activation and attenuates myocardial reperfusion injury. American journal of physiology. Heart and circulatory physiology 2000, 278, H2084–2093. [Google Scholar] [CrossRef]
- Barry, A.K.; Wang, N.; Leckband, D.E. Local VE-cadherin mechanotransduction triggers long-ranged remodeling of endothelial monolayers. Journal of cell science 2015, 128, 1341–1351. [Google Scholar] [CrossRef] [PubMed]
- Dorland, Y.L.; Huveneers, S. Cell-cell junctional mechanotransduction in endothelial remodeling. Cell Mol Life Sci 2017, 74, 279–292. [Google Scholar] [CrossRef] [PubMed]
- Libby, P. Inflammation during the life cycle of the atherosclerotic plaque. Cardiovascular research 2021, 117, 2525–2536. [Google Scholar] [CrossRef]
- Gavard, J.; Gutkind, J.S. VEGF controls endothelial-cell permeability by promoting the beta-arrestin-dependent endocytosis of VE-cadherin. Nat Cell Biol 2006, 8, 1223–1234. [Google Scholar] [CrossRef] [PubMed]
- Koch, S.; Tugues, S.; Li, X.; Gualandi, L.; Claesson-Welsh, L. Signal transduction by vascular endothelial growth factor receptors. The Biochemical journal 2011, 437, 169–183. [Google Scholar] [CrossRef] [PubMed]
- Xie, Y.; Mansouri, M.; Rizk, A.; Berger, P. Regulation of VEGFR2 trafficking and signaling by Rab GTPase-activating proteins. Scientific reports 2019, 9, 13342. [Google Scholar] [CrossRef] [PubMed]
- Chen, E.; Hermanson, S.; Ekker, S.C. Syndecan-2 is essential for angiogenic sprouting during zebrafish development. Blood 2004, 103, 1710–1719. [Google Scholar] [CrossRef] [PubMed]
- Corti, F.; Wang, Y.; Rhodes, J.M.; Atri, D.; Archer-Hartmann, S.; Zhang, J.; Zhuang, Z.W.; Chen, D.; Wang, T.; Wang, Z.; et al. Publisher Correction: N-terminal syndecan-2 domain selectively enhances 6-O heparan sulfate chains sulfation and promotes VEGFA165-dependent neovascularization. Nat Commun 2019, 10, 2124. [Google Scholar] [CrossRef] [PubMed]
- Vuong, T.T.; Reine, T.M.; Sudworth, A.; Jenssen, T.G.; Kolset, S.O. Syndecan-4 is a major syndecan in primary human endothelial cells in vitro, modulated by inflammatory stimuli and involved in wound healing. J Histochem Cytochem 2015, 63, 280–292. [Google Scholar] [CrossRef] [PubMed]
- Nunes, S.S.; Outeiro-Bernstein, M.A.; Juliano, L.; Vardiero, F.; Nader, H.B.; Woods, A.; Legrand, C.; Morandi, V. Syndecan-4 contributes to endothelial tubulogenesis through interactions with two motifs inside the pro-angiogenic N-terminal domain of thrombospondin-1. Journal of cellular physiology 2008, 214, 828–837. [Google Scholar] [CrossRef] [PubMed]
- Morgan, M.R.; Hamidi, H.; Bass, M.D.; Warwood, S.; Ballestrem, C.; Humphries, M.J. Syndecan-4 phosphorylation is a control point for integrin recycling. Dev Cell 2013, 24, 472–485. [Google Scholar] [CrossRef] [PubMed]
- Matthews, H.K.; Marchant, L.; Carmona-Fontaine, C.; Kuriyama, S.; Larrain, J.; Holt, M.R.; Parsons, M.; Mayor, R. Directional migration of neural crest cells in vivo is regulated by Syndecan-4/Rac1 and non-canonical Wnt signaling/RhoA. Development 2008, 135, 1771–1780. [Google Scholar] [CrossRef]
- Williamson, R.C.; Cowell, C.A.M.; Reville, T.; Roper, J.A.; Rendall, T.C.S.; Bass, M.D. Coronin-1C Protein and Caveolin Protein Provide Constitutive and Inducible Mechanisms of Rac1 Protein Trafficking. The Journal of biological chemistry 2015, 290, 15437–15449. [Google Scholar] [CrossRef]
- De Rossi, G.; Vahatupa, M.; Cristante, E.; Arokiasamy, S.; Liyanage, S.E.; May, U.; Pellinen, L.; Uusitalo-Jarvinen, H.; Bainbridge, J.W.; Jarvinen, T.A.H.; et al. Pathological Angiogenesis Requires Syndecan-4 for Efficient VEGFA-Induced VE-Cadherin Internalization. Arteriosclerosis, thrombosis, and vascular biology 2021, 41, 1374–1389. [Google Scholar] [CrossRef] [PubMed]
- Echtermeyer, F.; Streit, M.; Wilcox-Adelman, S.; Saoncella, S.; Denhez, F.; Detmar, M.; Goetinck, P. Delayed wound repair and impaired angiogenesis in mice lacking syndecan-4. The Journal of clinical investigation 2001, 107, R9–R14. [Google Scholar] [CrossRef]
- Sauteur, L.; Krudewig, A.; Herwig, L.; Ehrenfeuchter, N.; Lenard, A.; Affolter, M.; Belting, H.G. Cdh5/VE-cadherin promotes endothelial cell interface elongation via cortical actin polymerization during angiogenic sprouting. Cell Rep 2014, 9, 504–513. [Google Scholar] [CrossRef] [PubMed]
- Grimsley-Myers, C.M.; Isaacson, R.H.; Cadwell, C.M.; Campos, J.; Hernandes, M.S.; Myers, K.R.; Seo, T.; Giang, W.; Griendling, K.K.; Kowalczyk, A.P. VE-cadherin endocytosis controls vascular integrity and patterning during development. The Journal of cell biology 2020, 219. [Google Scholar] [CrossRef] [PubMed]
- Delva, E.; Kowalczyk, A.P. Regulation of cadherin trafficking. Traffic 2009, 10, 259–267. [Google Scholar] [CrossRef]
- Su, W.; Kowalczyk, A.P. The VE-cadherin cytoplasmic domain undergoes proteolytic processing during endocytosis. Molecular biology of the cell 2017, 28, 76–84. [Google Scholar] [CrossRef] [PubMed]
- Chrifi, I.; Louzao-Martinez, L.; Brandt, M.M.; van Dijk, C.G.M.; Burgisser, P.E.; Zhu, C.; Kros, J.M.; Verhaar, M.C.; Duncker, D.J.; Cheng, C. CMTM4 regulates angiogenesis by promoting cell surface recycling of VE-cadherin to endothelial adherens junctions. Angiogenesis 2019, 22, 75–93. [Google Scholar] [CrossRef] [PubMed]
- Best, D.; Adams, I.R. Sdmg1 is a component of secretory granules in mouse secretory exocrine tissues. Developmental dynamics : an official publication of the American Association of Anatomists 2009, 238, 223–231. [Google Scholar] [CrossRef]
- Field, C.J.; Perez, A.M.; Samet, T.; Ricles, V.; Iovine, M.K.; Lowe-Krentz, L.J. Involvement of transmembrane protein 184a during angiogenesis in zebrafish embryos. Frontiers in physiology 2022, 13, 845407. [Google Scholar] [CrossRef]
- Farwell, S.L.N.; Reylander, K.G.; Iovine, M.K.; Lowe-Krentz, L.J. Novel Heparin Receptor Transmembrane Protein 184a Regulates Angiogenesis in the Adult Zebrafish Caudal Fin. Frontiers in physiology 2017, 8, 671. [Google Scholar] [CrossRef]
- Rawls, J.F.; Frieda, M.R.; McAdow, A.R.; Gross, J.P.; Clayton, C.M.; Heyen, C.K.; Johnson, S.L. Coupled mutagenesis screens and genetic mapping in zebrafish. Genetics 2003, 163, 997–1009. [Google Scholar] [CrossRef] [PubMed]
- Lawson, N.D.; Weinstein, B.M. In vivo imaging of embryonic vascular development using transgenic zebrafish. Developmental biology 2002, 248, 307–318. [Google Scholar] [CrossRef] [PubMed]
- Thummel, R.; Kathryn Iovine, M. Using Morpholinos to Examine Gene Function During Fin Regeneration. Methods Mol Biol 2017, 1565, 79–85. [Google Scholar] [CrossRef]
- Farwell, S.L.; Slee, J.B.; Li, Y.; Lowe-Krentz, L.J. Using a GFP-tagged TMEM184A Construct for Confirmation of Heparin Receptor Identity. Journal of visualized experiments : JoVE 2017. [Google Scholar] [CrossRef]
- Divari, S.; Berio, E.; Biolatti, B.; Cannizzo, F.T. Reference Gene Selection and Prednisolone Target Gene Expression in Adipose Tissues of Friesian Cattle. J Agric Food Chem 2017, 65, 11140–11145. [Google Scholar] [CrossRef] [PubMed]
- Kuntz, M.; Mysiorek, C.; Petrault, O.; Boucau, M.C.; Aijjou, R.; Uzbekov, R.; Berezowski, V. Transient oxygen-glucose deprivation sensitizes brain capillary endothelial cells to rtPA at 4h of reoxygenation. Microvasc Res 2014, 91, 44–57. [Google Scholar] [CrossRef] [PubMed]
- Suarez-Arnedo, A.; Torres Figueroa, F.; Clavijo, C.; Arbelaez, P.; Cruz, J.C.; Munoz-Camargo, C. An image J plugin for the high throughput image analysis of in vitro scratch wound healing assays. PloS one 2020, 15, e0232565. [Google Scholar] [CrossRef] [PubMed]
- Blaukovitch, C.I.; Pugh, R.; Gilotti, A.C.; Kanyi, D.; Lowe-Krentz, L.J. Heparin treatment of vascular smooth muscle cells results in the synthesis of the dual-specificity phosphatase MKP-1. Journal of cellular biochemistry 2010, 110, 382–391. [Google Scholar] [CrossRef]
- Patton, W.A., 2nd; Granzow, C.A.; Getts, L.A.; Thomas, S.C.; Zotter, L.M.; Gunzel, K.A.; Lowe-Krentz, L.J. Identification of a heparin-binding protein using monoclonal antibodies that block heparin binding to porcine aortic endothelial cells. The Biochemical journal 1995, 311 Pt 2, 461–469. [Google Scholar] [CrossRef]
- Gopal, S.; Multhaupt, H.A.B.; Pocock, R.; Couchman, J.R. Cell-extracellular matrix and cell-cell adhesion are linked by syndecan-4. Matrix Biol 2017, 60-61, 57–69. [Google Scholar] [CrossRef]
- Gulino-Debrac, D. Mechanotransduction at the basis of endothelial barrier function. Tissue Barriers 2013, 1, e24180. [Google Scholar] [CrossRef] [PubMed]
- Jin, Y.; Ding, Y.; Richards, M.; Kaakinen, M.; Giese, W.; Baumann, E.; Szymborska, A.; Rosa, A.; Nordling, S.; Schimmel, L.; et al. Tyrosine-protein kinase Yes controls endothelial junctional plasticity and barrier integrity by regulating VE-cadherin phosphorylation and endocytosis. Nat Cardiovasc Res 2022, 1, 1156–1173. [Google Scholar] [CrossRef] [PubMed]
- Xiao, K.; Garner, J.; Buckley, K.M.; Vincent, P.A.; Chiasson, C.M.; Dejana, E.; Faundez, V.; Kowalczyk, A.P. p120-Catenin regulates clathrin-dependent endocytosis of VE-cadherin. Molecular biology of the cell 2005, 16, 5141–5151. [Google Scholar] [CrossRef] [PubMed]
- Juettner, V.V.; Kruse, K.; Dan, A.; Vu, V.H.; Khan, Y.; Le, J.; Leckband, D.; Komarova, Y.; Malik, A.B. VE-PTP stabilizes VE-cadherin junctions and the endothelial barrier via a phosphatase-independent mechanism. The Journal of cell biology 2019, 218, 1725–1742. [Google Scholar] [CrossRef] [PubMed]
- Best, D.; Sahlender, D.A.; Walther, N.; Peden, A.A.; Adams, I.R. Sdmg1 is a conserved transmembrane protein associated with germ cell sex determination and germline-soma interactions in mice. Development 2008, 135, 1415–1425. [Google Scholar] [CrossRef]
- Bennett, M.; Cantini, M.; Reboud, J.; Cooper, J.M.; Roca-Cusachs, P.; Salmeron-Sanchez, M. Molecular clutch drives cell response to surface viscosity. Proceedings of the National Academy of Sciences of the United States of America 2018, 115, 1192–1197. [Google Scholar] [CrossRef] [PubMed]
- Ciobanasu, C.; Wang, H.; Henriot, V.; Mathieu, C.; Fente, A.; Csillag, S.; Vigouroux, C.; Faivre, B.; Le Clainche, C. Integrin-bound talin head inhibits actin filament barbed-end elongation. The Journal of biological chemistry 2018, 293, 2586–2596. [Google Scholar] [CrossRef] [PubMed]
- Chronopoulos, A.; Thorpe, S.D.; Cortes, E.; Lachowski, D.; Rice, A.J.; Mykuliak, V.V.; Rog, T.; Lee, D.A.; Hytonen, V.P.; Del Rio Hernandez, A.E. Syndecan-4 tunes cell mechanics by activating the kindlin-integrin-RhoA pathway. Nat Mater 2020, 19, 669–678. [Google Scholar] [CrossRef] [PubMed]
- van der Flier, A.; Badu-Nkansah, K.; Whittaker, C.A.; Crowley, D.; Bronson, R.T.; Lacy-Hulbert, A.; Hynes, R.O. Endothelial alpha5 and alphav integrins cooperate in remodeling of the vasculature during development. Development 2010, 137, 2439–2449. [Google Scholar] [CrossRef] [PubMed]
- Zimmermann, P.; Meerschaert, K.; Reekmans, G.; Leenaerts, I.; Small, J.V.; Vandekerckhove, J.; David, G.; Gettemans, J. PIP(2)-PDZ domain binding controls the association of syntenin with the plasma membrane. Mol Cell 2002, 9, 1215–1225. [Google Scholar] [CrossRef]
- Troyanovsky, R.B.; Sergeeva, A.P.; Indra, I.; Chen, C.S.; Kato, R.; Shapiro, L.; Honig, B.; Troyanovsky, S.M. Sorting of cadherin-catenin-associated proteins into individual clusters. Proceedings of the National Academy of Sciences of the United States of America 2021, 118. [Google Scholar] [CrossRef]
- Bosseboeuf, E.; Chikh, A.; Chaker, A.B.; Mitchell, T.P.; Vignaraja, D.; Rajendrakumar, R.; Khambata, R.S.; Nightingale, T.D.; Mason, J.C.; Randi, A.M.; et al. Neuropilin-1 interacts with VE-cadherin and TGFBR2 to stabilize adherens junctions and prevent activation of endothelium under flow. Science signaling 2023, 16, eabo4863. [Google Scholar] [CrossRef] [PubMed]
- Baratchi, S.; Knoerzer, M.; Khoshmanesh, K.; Mitchell, A.; McIntyre, P. Shear Stress Regulates TRPV4 Channel Clustering and Translocation from Adherens Junctions to the Basal Membrane. Scientific reports 2017, 7, 15942. [Google Scholar] [CrossRef]
- Vellino, S.; Oddou, C.; Rivier, P.; Boyault, C.; Hiriart-Bryant, E.; Kraut, A.; Martin, R.; Coute, Y.; Knolker, H.J.; Valverde, M.A.; et al. Cross-talk between the calcium channel TRPV4 and reactive oxygen species interlocks adhesive and degradative functions of invadosomes. The Journal of cell biology 2021, 220. [Google Scholar] [CrossRef]
- Cappelli, H.C.; Kanugula, A.K.; Adapala, R.K.; Amin, V.; Sharma, P.; Midha, P.; Paruchuri, S.; Thodeti, C.K. Mechanosensitive TRPV4 channels stabilize VE-cadherin junctions to regulate tumor vascular integrity and metastasis. Cancer letters 2019, 442, 15–20. [Google Scholar] [CrossRef] [PubMed]
Disclaimer/Publisher’s Note: The statements, opinions and data contained in all publications are solely those of the individual author(s) and contributor(s) and not of MDPI and/or the editor(s). MDPI and/or the editor(s) disclaim responsibility for any injury to people or property resulting from any ideas, methods, instructions or products referred to in the content. |
© 2024 by the authors. Licensee MDPI, Basel, Switzerland. This article is an open access article distributed under the terms and conditions of the Creative Commons Attribution (CC BY) license (http://creativecommons.org/licenses/by/4.0/).
Copyright: This open access article is published under a Creative Commons CC BY 4.0 license, which permit the free download, distribution, and reuse, provided that the author and preprint are cited in any reuse.


