Submitted:
30 May 2025
Posted:
01 June 2025
You are already at the latest version
Abstract
High-density urban residential areas represent critical hotspots of resource consumption and environmental degradation. By 2050, 68% of the global population is projected to live in urban areas, driving a 70% increase in food demand and a doubling of energy demand. Although Food-Energy-Water (FEW) system imbalances are increasingly recognized, translating conceptual frameworks into quantifiable, economically viable spatial strategies remains a significant challenge for sustainable development.
This study proposes a multi-objective optimization framework to transform FEW system in high-density urban areas. The framework integrates three key innovations: a dual rooftop-ground hierarchy that redefines residential spaces as integrated micro-production units; quantitative interlinkage nodes that map material and energy flows across subsystems; and the NSGA-II to simultaneously optimize food production, energy output, and system costs. This integrated approach overcomes the limitations of prior single-objective models and simplistic scenario analyses, offering a robust method for evaluating spatial trade-offs.
The model produced 175 non-dominated solutions, highlighting nonlinear trade-offs between resource outputs and system costs. The cone-shaped Pareto front underscores diminishing marginal returns as resource inputs increase. Sensitivity analysis demonstrated robust model performance, with objective variations constrained to < 3% under ±5% parameter perturbations. The selected compromise solution achieves annual outputs of 5,223 tons of food and 49.09 GWh of energy at a total cost of CNY 160 million, exceeding local demand by 100.2% and 22.6%, respectively. These results significantly enhance local resource self-sufficiency while providing system redundancy to mitigate risks from climate variability and supply disruptions.
This study demonstrates that coordinated spatial configurations of FEW system generate synergistic benefits that exceed those of isolated subsystem optimizations. By bridging the gap between resource systems theory and spatial planning practice, the proposed differentiated spatial strategy redefines conventional urban resource layouts, offering a transformative pathway for high-density cities to evolve into hybrid production-consumption spaces. Furthermore, it delivers a scalable and economically viable solution to the global challenges posed by urbanization and climate change.
Keywords:
food-energy-water nexus
; urban resource self-sufficiency
; multi-objective optimization
; spatial configuration
; resource-productive communitie
1. Introduction
The climate crisis and rapid urbanization are driving unprecedented global challenges. By 2050, urban populations are projected to reach 68%, resulting in a 70% increase in food demand, a doubling of energy demand, and a 30% rise in water usage (FAO, 2024; IEA, 2021; Van Vuuren et al., 2019). High-density urban residential areas, which occupy over one-third of urban space, face critical imbalances within Food-Energy-Water (FEW) systems, alongside resource inefficiencies and deteriorating environmental conditions (Liu et al., 2020; Peng et al., 2024). Addressing these challenges through productive retrofitting—integrating food production, energy generation, and water recycling—offers a strategic pathway to enhance self-sufficiency, urban sustainability, and resilience (Frantzeskaki & Kabisch, 2016).
Current research on urban spatial resource optimization primarily adopts several approaches. The first focuses on single-resource optimization models, such as photovoltaic (PV) layouts for energy production, rooftop farming for food production, or rainwater harvesting to alleviate water scarcity (Costanzo et al., 2016; Ross et al., 2022). These models, typically applied at the building or site scale, have advanced spatial allocation but often overlook interactions between resource systems (Ogbolumani & Nwulu, 2021). The second approach utilizes urban metabolism models to optimize resource efficiency by analyzing material flows at urban or regional scales. However, these models lack explicit guidance on specific spatial layouts, limiting their applicability to residential areas. The third approach involves the emerging FEW-Nexus model, which integrates food, energy, and water systems to explore synergies and coupling relationships (Ghosh et al., 2024; Salem et al., 2022). Yet, most FEW-Nexus studies remain focused on regional scales, offering limited relevance to urban spatial planning. In addition, multi-objective optimization methods have been employed to balance social, economic, and environmental benefits in urban resource management. However, insufficient consideration of cost constraints often limits their practical application (Ogbonna et al., 2023; Okola et al., 2025).
The limitations in existing literature reveal three major research gaps. First, most studies address food, energy, or water systems in isolation, lacking an integrated understanding of the complex interactions among them. Specifically, systematic research on spatial optimization for efficient FEW system integration at the residential scale remains underexplored (Montealegre et al., 2022). Second, a central challenge in applying FEW-Nexus research to urban spatial design lies in cross-scale integration—aligning macro-level resource flow efficiency with micro-level spatial configurations. The absence of a theoretical and methodological framework for cross-scale coordination constitutes a key bottleneck to advancing this field. Third, there is a notable lack of multi-objective optimization studies on FEW system in high-density urban residential areas (Ma et al., 2023) , and no comprehensive methodological framework currently exists that combines multi-system, multi-link coordination with economic feasibility.
To address these gaps, this study proposes a multi-objective coordinated optimization framework tailored to the FEW system in high-density urban residential contexts. The specific aims are: (1) to develop a green retrofitting strategy that integrates food, energy, and water resources; (2) to explore coupling patterns between resource transformation processes and spatial configurations; and (3) to maximize resource production potential through multi-objective optimization, while ensuring both economic feasibility and practical operability. We organize our manuscript as follows: The subsequent section outlines our conceptual foundation and research hypotheses, elaborating the theoretical basis of the FEW system. Section 3 details the research methods, including system boundary definitions, data collection, model development, and optimization algorithms. Section 4 presents and validates the results of the multi-objective optimization model. Section 5 discusses the findings and draws conclusions.
2. Conceptual Framework and Research Hypotheses
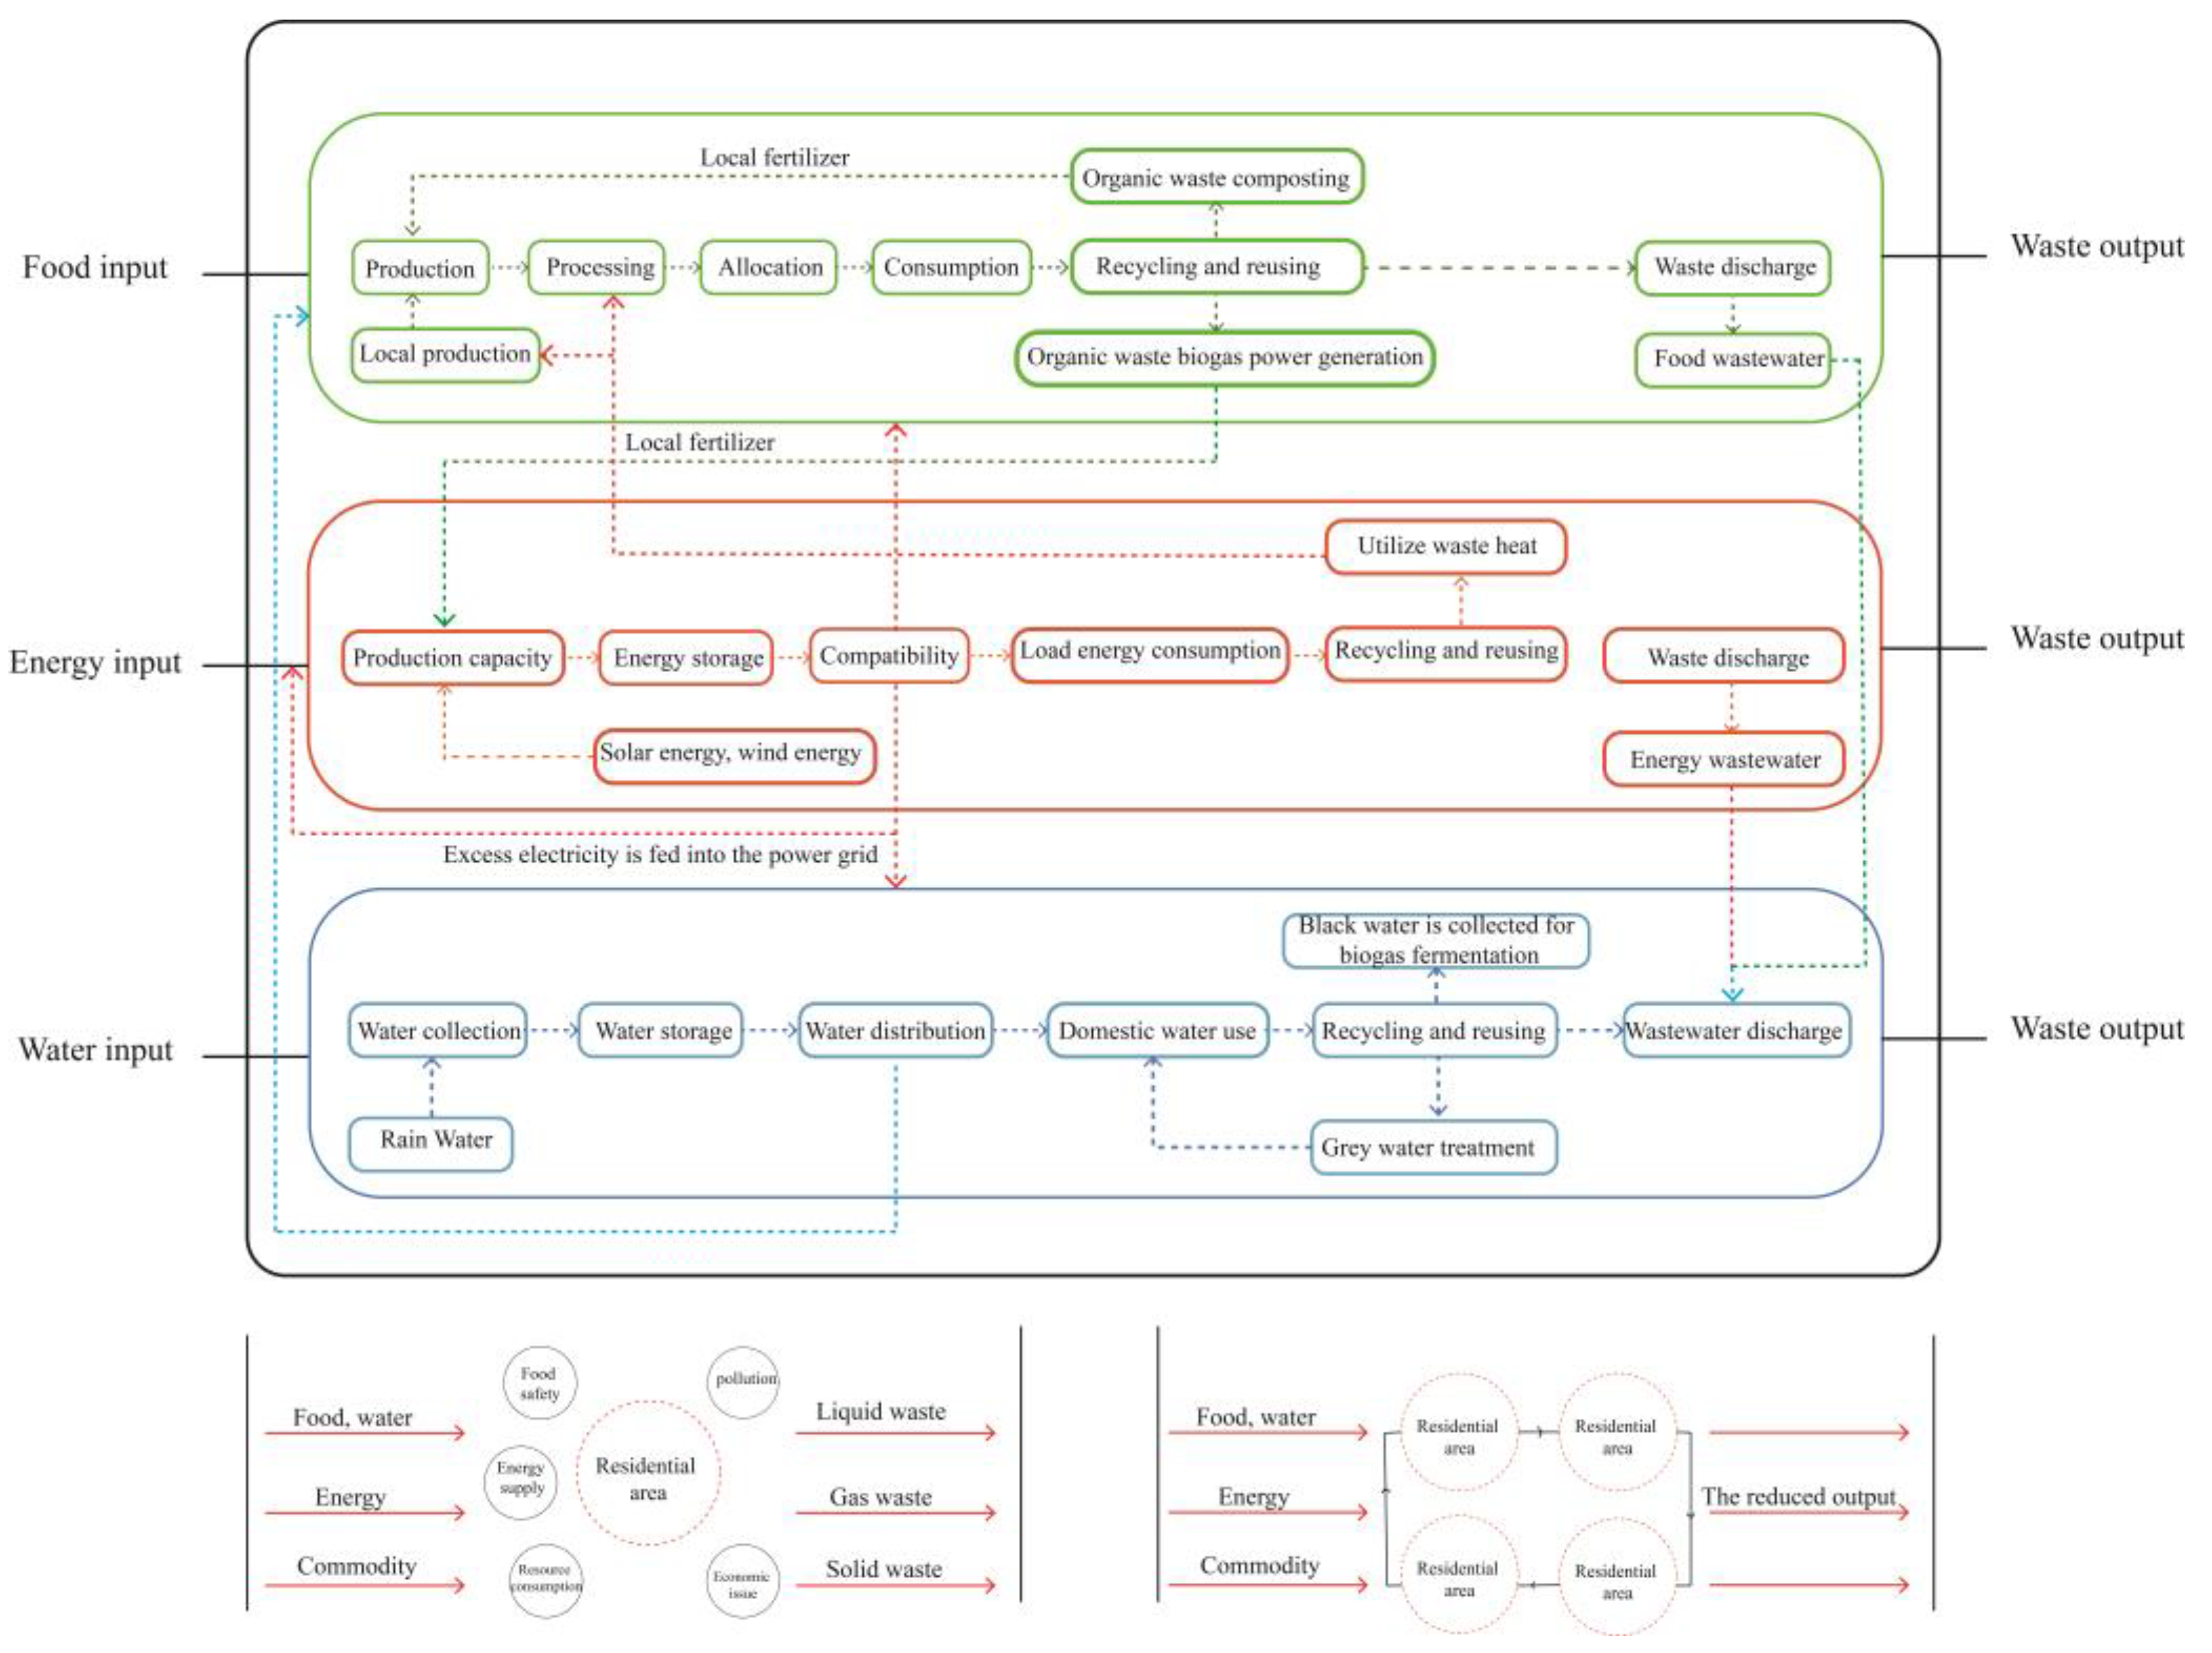
The FEW system within residential communities comprises three interlinked subsystems—food, energy, and water—and the dynamic interactions among them. These components are spatially and materially integrated, forming closed or semi-closed loops of resource metabolism (Garcia et al., 2019; Kibler et al., 2018). The food subsystem utilizes ground-level green spaces, rooftop areas, greenhouses, and indoor environments to support vegetable and fruit cultivation, hydroponics, and small-scale processing. Water for these processes is supplied through rainwater harvesting and water reclamation systems, while energy is primarily derived from distributed PV installations and, in part, from systems converting organic waste into usable energy. The energy subsystem is predominantly composed of PV arrays installed on flat rooftops, greenhouse roofs, or sloped surfaces, complemented by biogas systems and waste incineration infrastructure. The water subsystem is structured through rainwater collection, storage, and distribution, as well as domestic wastewater recovery and treatment, providing water for irrigation and non-potable purposes. Purification and reuse processes are energy-driven, and a portion of the treated water is reintegrated into the food production cycle, enabling bidirectional flows of materials and energy.
Building upon this integrated framework, the study adopts a dual spatial hierarchy—“rooftop–ground level”—to reorganize the spatial structure of residential communities. The goal is to transform traditional consumption-driven spaces into multifunctional micro-production units that combine resource generation, waste management, and renewable energy production. Through the coordinated planning of key interventions—such as rooftop farming, rainwater capture, solar energy generation, and organic waste recycling—the strategy seeks to simultaneously increase resource availability and reduce consumption. This approach minimizes external resource dependency, enhances local self-sufficiency, promotes circular resource flows, and maximizes spatial efficiency.
Moreover, the study introduces the concept of “coupling nodes” to elucidate the pathways of material and energy transformation among the subsystems. For instance, the coupling between the water and energy subsystems is reflected in the electricity demand for rainwater treatment and wastewater reuse. The food–energy coupling is evident in the energy required for crop cultivation, processing, and packaging, as well as in energy recovered from combustible organic waste. The food–water interconnection primarily involves the reliance on rainwater and reclaimed water for irrigation in cultivation and processing stages, and the recovery of water and nutrients during waste treatment. These interwoven pathways constitute the core resource flow routes within the community-scale FEW system, offering theoretical underpinnings for systemic optimization during micro-scale urban renewal.
Building on the above conceptual framework, this study proposes the following research hypotheses:
H1.
Within the FEW system, the food, energy, and water subsystems exhibit significant synergistic interactions, whereby integrated system optimization outperforms the optimization of individual subsystems.
H2.
Resource production efficiency and economic cost vary markedly across different renewal scenarios, and an optimal configuration exists that simultaneously maximizes local resource self-sufficiency while minimizing economic expenditure.
H3.
In high-density residential areas, optimizing the spatial allocation ratio between rooftop and ground-level resource production strategies can substantially enhance the local production capacity of the FEW system, thereby facilitating sustainable and circular development at the community scale.
Figure 1.
Theoretical Framework for the FEW-Nexus in Urban Residential Systems.
3. Methods
3.1. Definition of System Boundaries
This study aims to develop a broadly applicable decision-making framework and methodological process. To ensure scientific rigor and operational feasibility, the system boundaries are defined as follows: Spatial boundaries encompass three types of areas—rooftops, ground-level green spaces, and hardscaped surfaces. While building façades offer integration potential, they are excluded from the current model due to limitations in technological adaptability. Additionally, building-induced shading effects, which are closely tied to site-specific spatial morphologies, are not considered in this study. Temporal boundaries are established based on annual average values. Technological boundaries are restricted to mature and widely implemented technologies. The PV system is assumed to utilize monocrystalline silicon modules, and vegetable cultivation is designated as the default planting type. Economic boundaries encompass both the initial capital investment—covering materials, equipment, and installation—and the average annual operation and maintenance (O&M) costs associated with each facility. To ensure comparability across subsystems, a uniform 20-year lifecycle is applied. All construction and O&M costs are annualized and incorporated into the optimization model. Although external benefits—such as environmental and educational value—are acknowledged as important, they are not included in the current optimization objective function.
3.2. Data Collection and Spatial Survey
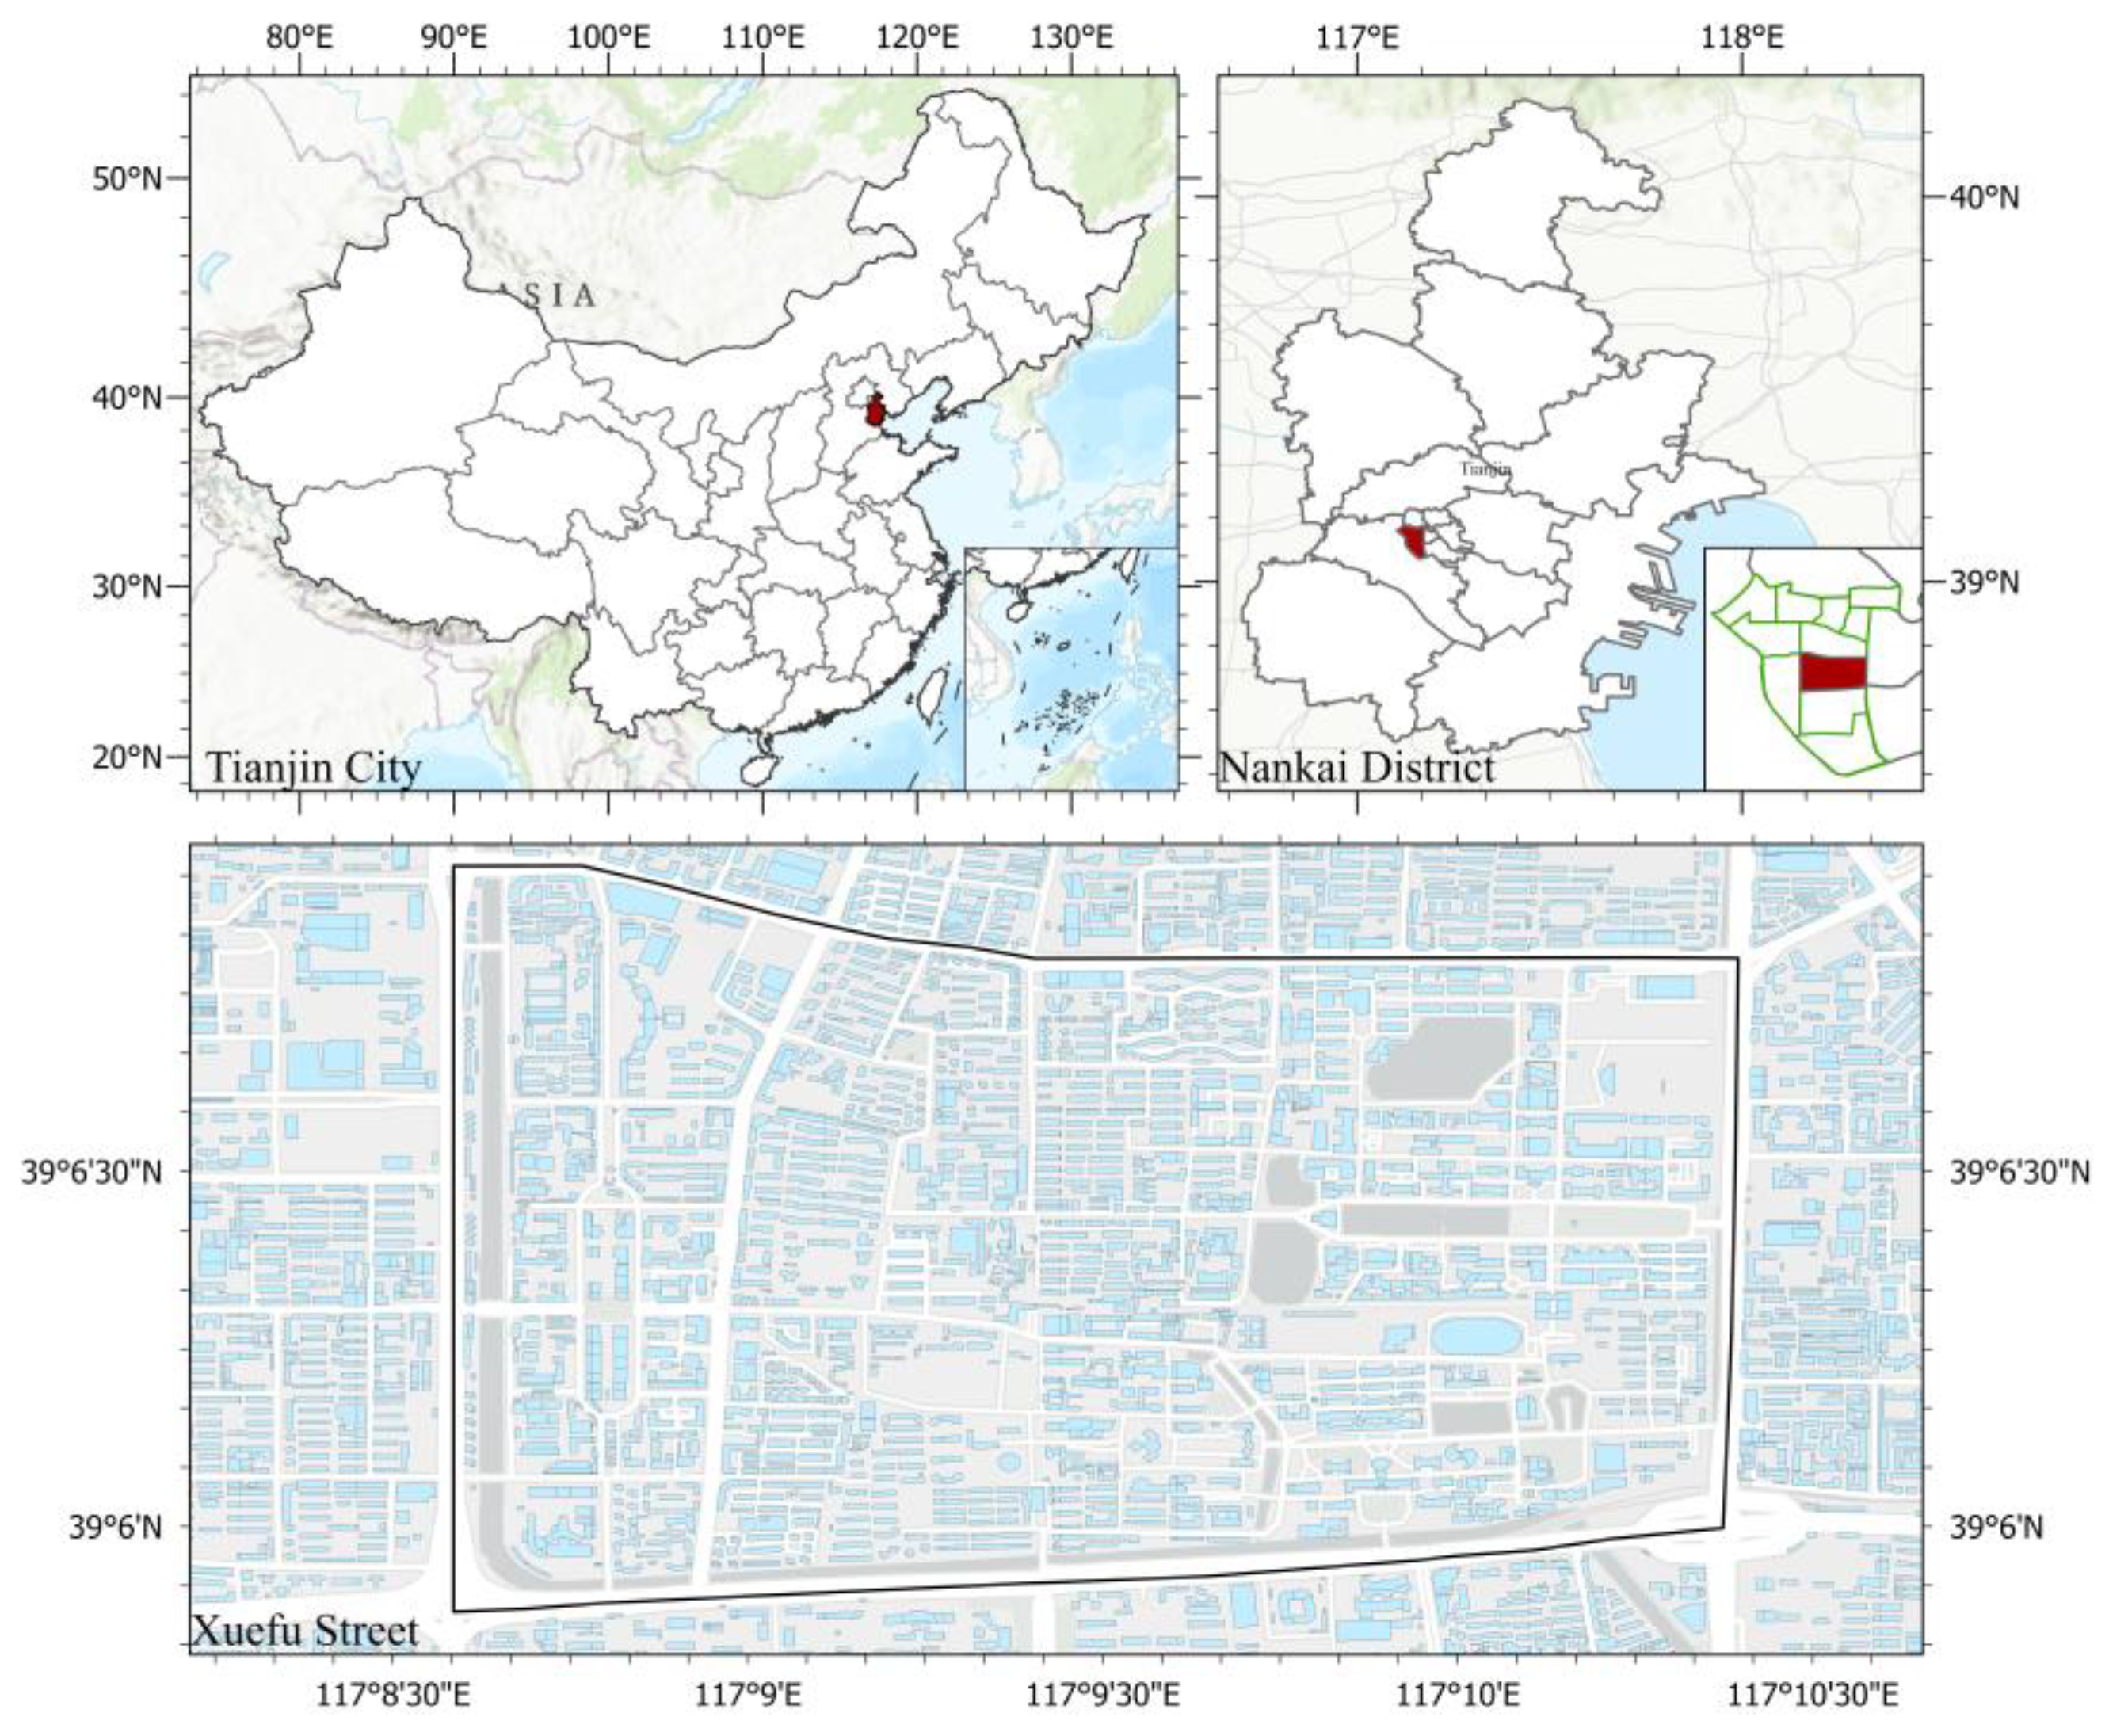
This study selects Xuefu Subdistrict in Nankai District, Tianjin Municipality, as the research site. Located in a solar-rich region, Nankai District offers favorable conditions for both agricultural production and photovoltaic energy generation. Xuefu Subdistrict spans approximately 0.848 square kilometers and has a population of about 34,470, indicating high population density and substantial food and energy demand. According to statistical yearbooks, the annual per capita electricity consumption is 1169 kWh. Notably, some residents have already undertaken self-initiated retrofitting activities to repurpose available spaces for productive uses, such as small-scale cultivation or renewable energy applications.
Figure 2.
Study Area Location Map.
Using the image classification tool in ArcGIS, a maximum likelihood classifier was trained, achieving an overall accuracy of 0.783 and a Kappa coefficient of 0.74. The classification identified six categories: water bodies, hard surfaces, vegetation, flat rooftops, sloped rooftops, and other rooftop types. To enhance the classification accuracy, a mode filtering algorithm available within the ArcGIS platform was applied, resulting in a refined dataset and the generation of the final land cover classification map (Figure 3). The quantified areas corresponding to each category are detailed in Table 1.
Figure 3.
Land Cover Classification of Xuefu Subdistrict.
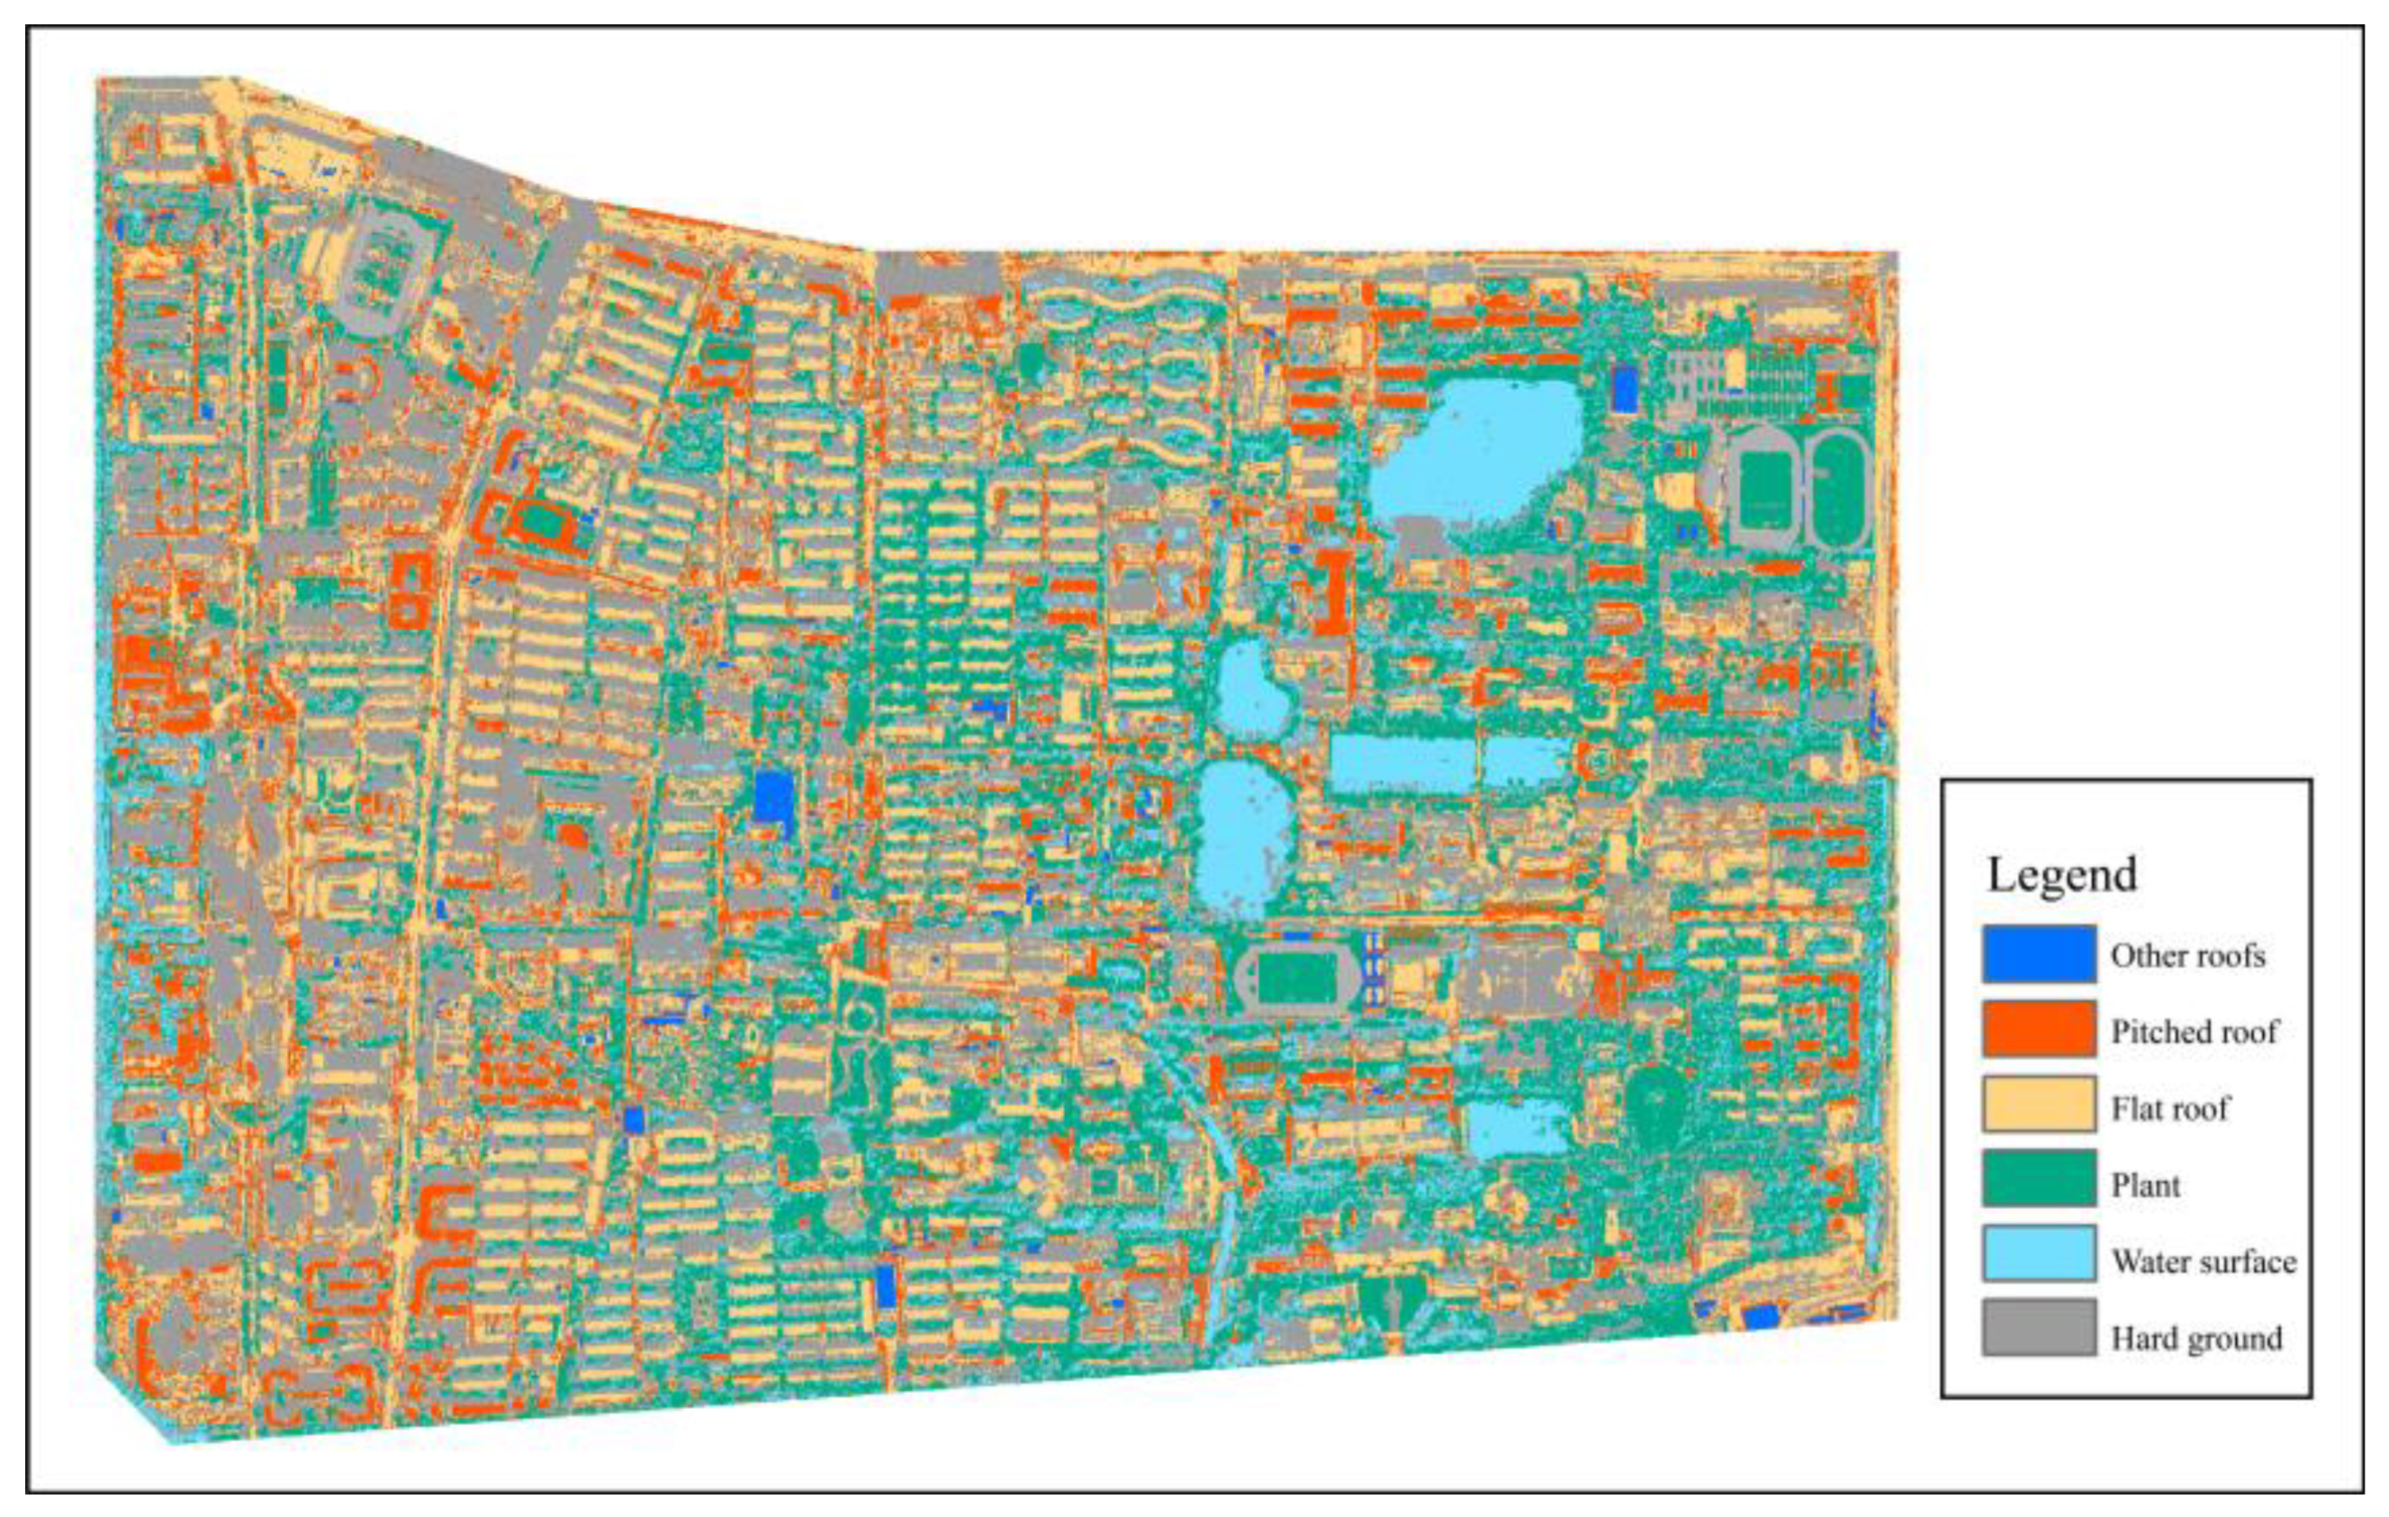

Table 1.
Land Use Screening Results for Xuefu Subdistrict, Tianjin .
| Spatial Elements | Area (ha) | Proportion of Total Area (%) |
| Water Surface | 33.86 | 7.85% |
| Paved ground Surface | 150.96 | 35.00% |
| Green Space | 87.43 | 20.27% |
| Flat Rooftop | 84.16 | 19.51% |
| including flat rooftops ≥16 m² | 72.37 | 16.78% |
| including flat rooftops ≥64 m² | 62.79 | 14.55% |
| Sloped Rooftop | 44.34 | 10.28% |
| including sloped rooftops ≥16 m² | 37.26 | 8.64% |
3.3. Assessment Model for Resource Production Potential
This study develops mathematical models to assess the resource potential of the food, energy, and water subsystems, with the land area allocated to each type of resource production serving as the independent variable.
The energy subsystem incorporates two widely adopted and mature technologies: PV power generation and biogas-based electricity generation. To ensure computational feasibility, the model calculates annual energy output as the total of each technology’s unit-area energy yield multiplied by its corresponding allocated area:
In this equation: E represents the total annual energy output (kWh/year). yᵢ denotes the area or volume allocated to the ith type of energy production, such as flat roof PV area (y₁), greenhouse surface area (y₂), and sloped roof PV area (y₃). bᵢ is the unit energy yield: 178.39 kWh/m² for PV systems and 5.8 kWh/m³ for biogas systems.
The PV energy yields were simulated using PVSyst software with monocrystalline silicon panels, reflecting the predominant commercial technology. Biogas yields were estimated based on calorific value and power station conversion efficiency, referencing the Compilation of Technical Standards for Rural Energy Construction in China and the Renewable Energy Statistical Yearbook.
The annual vegetable production potential is calculated as the sum of the products of unit-area yields and the corresponding areas for each food production type:
In this equation: F denotes the total annual food output (kg/year). aⱼ represents the average annual yield per unit area (kg/m²) of the jth food production type. xⱼ refers to the cultivable area (m²) available for the jth method, which includes ground cultivation (x₁), rooftop cultivation (x₂), PV greenhouse cultivation (x₃), and indoor hydroponic systems (x₄). Unit yields are set at 5.6 kg/m² for ground and rooftop cultivation, and 40 kg/m² for controlled-environment agriculture, such as PV greenhouses and hydroponics. Yield parameters were obtained from the Facility Agriculture Experimental Base of the Beijing Academy of Agricultural and Forestry Sciences and adjusted for Tianjin’s climatic conditions.
For the water subsystem, this analysis focuses on the collection and utilization of rainwater:
In this equation: W represents the total annual volume of rainwater collected (m³). zₖ is the area (m²) of the kth rainwater-harvestable surface type, such as flat roof collection areas (z₁) and newly added hardscape surfaces (z₂). cₖ represents the surface runoff coefficient, set at 0.9 for flat roofs and 0.6 for hardscapes, based on the Tianjin local standard DB/T 29-236-2016: Technical Specifications for Urban Rainwater Utilization. R is the annual precipitation (m), with a long-term average of 0.6186 m (618.6 mm) for Tianjin’s central urban area, as reported in the Tianjin Statistical Yearbook 2023. All outputs are standardized to cubic meters.
A critical interaction within the FEW-Nexus lies in the water demand associated with food production. For newly developed cultivation spaces, the total irrigation demand is calculated as follows:
In this equation: G represents the total annual irrigation water demand for the food subsystem (L/year). sₚ is the irrigated area (m²) for the pth cultivation type, including open-field cultivation (s₁), greenhouse drip irrigation (s₂), and hydroponic drip irrigation (s₃). dₚ denotes the unit irrigation demand, set at 142.5 L/m² for open-field cultivation and 180.0 L/m² for both greenhouse and hydroponic systems. These values are based on the standard DB11/T 1764.2-2021: Water Use Quotas for Irrigating Leafy Vegetables in both open-field and protected environments and are adjusted according to practical water allocation strategies in the Tianjin Plain region.
3.4. Cost Assessment Method
The total economic cost is calculated as the combined expenditure of four subsystems: PV power generation, open-field cultivation, greenhouse and hydroponic cultivation, and rainwater harvesting, as shown in Equation (13). Each subsystem’s cost includes its respective capital investment, O&M expenses, production input costs, and resource consumption, with deductions made for revenue generated, such as income from electricity production.
Since the biogas yield is treated as a fixed parameter, independent of spatial configuration, its associated cost does not vary with decision variables and is therefore excluded from the cost component of the objective function. However, it is included in the total energy output calculation.
The cost evaluation of PV systems includes module installation costs and annual O&M expenses, net of revenue generated from electricity production. Key parameters are sourced from the China Photovoltaic Industry Development Roadmap (2022–2023), market quotations, and O&M standards issued by the China Photovoltaic Industry Association. These parameters are further calibrated using 2024 mainstream PV module specifications and local commercial electricity prices to ensure an accurate, contemporary and context-specific economic evaluation. We compute the comprehensive expenditure for solar power production as the sum of the PV module installation cost (A) and system O&M cost (B), minus the electricity revenue (C):
The cost assessment of open-field cultivation is based on the Compilation of Costs and Returns of Agricultural Products in China 2024, which disaggregates cost components for vegetable production in urban settings, including land preparation, fertilizers, pesticides, labor, and irrigation. To ensure conservative and operationally feasible evaluations, the lowest estimated values are adopted. The total cost of open-field cultivation consists of land preparation and tillage cost (D), fertilizer cost (E), pesticide cost (F), labor cost (G), and irrigation cost (H):
The construction, operation, and resource input costs of greenhouse and indoor hydroponic systems are derived from the empirical study by Zhen et al. (2020) on lifecycle costs of community-supported agriculture (CSA) in peri-urban Beijing. These values are further adjusted based on current greenhouse configurations and management practices to ensure data representativeness and practical applicability. The total cost of greenhouse cultivation and indoor hydroponics includes construction cost (I), production input cost (J), O&M cost (K), fertilizer cost (L), pesticide cost (M), waste management cost (N), and irrigation cost (O):
For the rainwater harvesting system, the cost is assessed in terms of construction expenses, O&M costs, and water quality treatment fees. These estimates are based on market surveys of leading commercial suppliers and calibrated against municipal water pricing systems in representative Chinese cities. This provides a robust framework for evaluating the cost-benefit potential of rainwater harvesting. The total cost of rainwater utilization comprises construction cost (P), O&M cost (Q), and water treatment cost (R), offset by the economic benefit of conserved water resources (S). The rainwater catchment area is optimized to precisely match the irrigation demand:
Table 2.
Cost Calculation Indicators.
| System Type | Cost Components | Parameter |
| Photovoltaic Power Generation | A: Construction cost of PV modules | 525 CNY /m² |
| B: Operation and maintenance cost | 6.45 CNY /m² | |
| C: Revenue from electricity generation | 57.8 CNY /m² | |
| Open-field Cultivation | D: Land preparation and cultivation cost | 2.5 CNY /m² |
| E: Fertilizer cost | 3 CNY /m² | |
| F: Pesticide cost | 1.5 CNY /m² | |
| G: Labor cost | 4.29 CNY /m² | |
| H: Irrigation cost | 1 CNY /m³ | |
| Greenhouse Cultivation / Indoor Hydroponics | I: Greenhouse construction cost | 350 CNY /m² |
| J: production input cost | 6.28 CNY /m² | |
| K: Operation and maintenance cost | 20 CNY /m² | |
| L: Fertilizer cost | 0.17 CNY /m² | |
| M: Pesticide cost | 0.11 CNY /m² | |
| N: Waste management cost | 10 CNY /m² | |
| O: Irrigation cost | 1.59 CNY /m³ | |
| Rainwater Harvesting | P: Construction cost of rainwater collection facilities | 30 CNY /m² |
| Q: Operation and maintenance cost | 2 CNY /m² | |
| R: Water quality treatment cost | 0.5 CNY /m³ | |
| S: Economic benefit from water savings | 0.5 CNY /m³ |
3.5. Multi-Objective Optimization Model Construction
To enable system-level optimization within the FEW-Nexus framework, this study develops a multi-objective optimization model that simultaneously seeks to maximize annual food production (F_max), maximize annual energy production (E_max), and minimize total system cost (C_min). These objectives inherently involve structural trade-offs and potential synergies: food and energy systems often compete for limited spatial resources (e.g., rooftops), and increasing outputs generally requires higher capital investment, thereby elevating system costs. However, through integrated system design and coordinated resource utilization—such as leveraging shared infrastructure or reclaiming water resources—these conflicts can be mitigated, and overall efficiency can be enhanced. The Non-dominated Sorting Genetic Algorithm II (NSGA-II) is employed to derive a Pareto-optimal set of solutions from a wide range of potential resource allocation configurations. To ensure the model's reliability and robustness, its outcomes are further validated through local sensitivity analysis, assessing the impact of parameter variations on optimization results.
3.6. Decision Variables and Constraint Settings
To ensure that optimization results are both practically feasible and implementable, this study establishes two primary types of constraints: resource system constraints and spatial area constraints. The resource system constraints focus on achieving internal resource circularity and self-sufficiency, while the spatial constraints define realistic bounds based on the physical availability and accessibility of space.
At the resource system level, three key constraints are applied. First, the total output of clean energy from the energy subsystem must meet or exceed the average annual energy demand of the residential community (E ≥ 40.04 GWh) to ensure minimum operational energy requirements. Second, the annual rainwater harvesting volume (W) must meet or exceed the total annual irrigation water demand (G) required for controlled-environment agriculture, i.e., W ≥ G, thereby supporting water recycling and ensuring irrigation stability. Third, the cost objective function is minimized while satisfying the above physical constraints, ensuring sustainable resource system operations alongside economic feasibility and practical applicability.
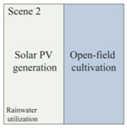
In terms of spatial constraints, this study adopts a scenario planning approach to define the upper limits for the deployment of productive infrastructure. Four prototypical resource allocation scenarios are constructed, each reflecting different resource prioritization strategies. These scenarios simulate the maximum spatial occupation within the residential community, enabling the determination of feasible development boundaries for optimization variables.
Table 3.
Scenario Configuration for Each Scheme.
| Production Scenario | Energy Production Area (㎡) | Cultivation Area (㎡) | Rainwater Harvesting Area (㎡) |
|---|---|---|---|
 |
Rooftop PV 196815 | / | Rooftop 196815 |
 |
Rooftop PV 98407 |
Rooftop Cultivation 98407 Ground Agriculture 85125 |
Rooftop 196815 New Green Space 42424 Permeable Pavement 47200 |
 |
Rooftop PV 98407 |
Rooftop Greenhouse 98407 Ground Agriculture 85125 |
Rooftop 98407 New Green Space 42424 Permeable Pavement 47200 |
 |
Rooftop PV 98407 |
Rooftop Greenhouse 49203 Rooftop Cultivation 49203 Ground Agriculture 85125 |
Rooftop 98407 New Green Space 42424 Permeable Pavement 47200 |
Based on the spatial allocation results from four scenario simulations, this study identifies the maximum spatial usage values for each subsystem under different configuration conditions and sets these as the upper limits for relevant variables in the optimization model. Specifically, the ground agricultural area is capped at 85,125 m², rooftop agricultural facilities (including PV greenhouses and hydroponic systems) are limited to a total of 98,406 m², and the maximum rooftop area available for PV installations is set at 196,815 m².
To account for practical factors such as building structural load capacity, shading from facilities, and access requirements for equipment maintenance, feasible utilization rates are further defined. Drawing on remote sensing image classification results, field surveys of 30 buildings of varying ages within the study area, and references to global and domestic urban agriculture and green roof retrofit practices (Melius et al., 2013), the utilization rate for flat rooftops is set at 40%, corresponding to a developable area of 33.66 hectares. For sloped rooftops, factors such as orientation, slope angle, drainage system interference, and the load-bearing capacity of older buildings result in a utilization rate of 20%, corresponding to a developable area of 8.87 hectares. Studies indicate that actual rooftop utilization rates in high-density cities typically range between 30% and 50%, making these estimates conservative yet realistic.
In configuring the energy system, additional parameters are established for rooftop areas available for PV installations. For PV greenhouse roofs (y₂), considering the impact of panel shading on plant growth and the requirements for light and thermal regulation in facility agriculture, this study references modern PV greenhouse practices (Trypanagnostopoulos et al., 2017) and sets the usable area as 70% of the total greenhouse roof area (y₂ = 0.7X₃). For sloped rooftop PV (y₃), the usable area is defined as 20% of the developable sloped rooftop area (y₃ = 0.2S_slope), prioritizing deployment on unobstructed south-facing roofs while accounting for slope, drainage, and structural stability. To simplify the model structure and reduce variable dimensions, certain variables with minimal impact on the objective function are assigned their maximum feasible values.
In the production scenario comparisons, although PV greenhouses are advantageous for enhancing residential self-sufficiency, their high construction and operational costs, coupled with their impact on rainwater harvesting, make them unsuitable for immediate large-scale deployment. Therefore, based on the settings in Scenario 4, the annual biogas production—primarily derived from residential sewage and organic household waste—is calculated at approximately 845,822 m³. This value is treated as a fixed constraint in the optimization model to ensure the practical feasibility and data consistency of the energy system configuration.
Table 4.
Annual Waste Output of the Residential Community.
| Waste Output Type | Domestic Wastewater | Household Waste | Organic Household Waste | Feces | Urine |
|---|---|---|---|---|---|
| Per Capita Output | Domestic Water Use × 85% | 0.62 kg/(person·day) | Household Waste × 60% | 0.2 kg/(person·day) | 1.15 kg/(person·day) |
| Annual Output (Community) | 1313369.136t | 7800.561t | 4680.337t | 2516.31t | 14468.7825t |
Table 5.
Biogas Yield Potential of Organic Waste and Total Solids (TS) Content.
| Waste Type | Organic Household Waste | Human Feces |
|---|---|---|
| Biogas Yield Potential (m³/kg TS) | 0.389 | 0.49 |
| Total Solids (TS) Content (%) | 10.2 | 20 |
Table 6.
Overview of Key Constraints in Multi-objective Optimization.
| Category | Constraint Expression | Description |
|---|---|---|
| Food Subsystem | ≤ 85125 | Ground agriculture area limit |
| + ≤98406 | Combined rooftop greenhouse and hydroponics area limit | |
| Energy Subsystem | E≥40030120 | Annual energy output must meet residential electricity demand |
| Water Resource System | W≥26 535 | Annual rainwater harvesting ≥ annual irrigation water demand |
Following the generation of a Pareto-optimal solution set through the multi-objective optimization model, this study employs a standardized scoring method with equal weighting to comprehensively evaluate all candidate solutions. The solution achieving the highest composite score is identified as the compromise optimal solution for subsequent spatial configuration analysis. By normalizing the three objective functions—maximizing food production, maximizing energy output, and minimizing total system cost—and assigning equal importance to each, this approach ensures a balanced optimization outcome. It enables effective cost control without significantly compromising resource productivity, thus enhancing both the feasibility and contextual adaptability of the solution.
However, the optimization model provides only the aggregate land area requirements for the food, energy, and water subsystems, without detailing how these functional components should be embedded within the physical layout of the residential site. To operationalize the allocation results, it is essential to develop a systematic spatial configuration plan that integrates considerations of building typologies, spatial morphology, and available resource conditions.
At the master planning level, functional zones should be delineated based on the site’s existing spatial structure. Tailored retrofitting strategies should be developed for each subsystem according to spatial suitability. Flat rooftops are optimal for agricultural production, whereas the rooftops of high-rise buildings—due to heightened wind loads and thermal variation—are less suitable for cultivation. Roofs of industrial buildings or those with pollution risks should prioritize PV deployment. Public buildings offer opportunities for multifunctional use, integrating agriculture with recreation and commercial services. Sloped rooftops are best suited for PV panel installation. For idle or underutilized land parcels, lightweight and mobile planting systems are recommended to minimize initial capital investment and facilitate post-use site restoration.
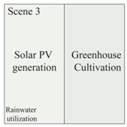
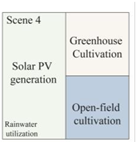
Figure 4 illustrates a range of spatial and resource system typologies tailored to high-density urban residential contexts. These configurations include ground-level greening, rooftop agriculture, rainwater harvesting systems, and vertical farming structures, each supporting multifunctional land use. Deployment should be context-specific, guided by factors such as building typology, rooftop geometry, spatial accessibility, and infrastructural compatibility. These typologies provide actionable pathways for the spatial realization of localized FEWsystem integration.
4. Result
4.1. Optimization Results and Validation
To enhance computational efficiency and model operability, this study applied a tri-objective FEW-Nexus optimization framework, focusing on five decision variables: ground-level cultivation area (X₁), rooftop cultivation area (X₂), PV greenhouse area (X₃), indoor hydroponics area (X₄), and flat-roof PV installation area (y₁). The genetic algorithm utilized specific operational parameters: 500 individuals per generation running through 800 evolutionary cycles, with solution retention set at 0.7 to ensure a balanced trade-off between convergence and solution diversity. This process generated a set of 175 Pareto-optimal, non-dominated solutions, providing a diverse and robust basis for guiding residential regeneration and integrated resource allocation strategies.
To assess the robustness of the selected compromise solution, a local sensitivity analysis was conducted. Each decision variable was perturbed by ±5%, and the resulting effects on the three objective functions—maximizing food production, maximizing energy output, and minimizing total system cost—were evaluated. Objective values were recalculated and compared to the baseline, and the maximum relative deviations were recorded. Results indicated that variations across all objectives remained below 2%, demonstrating high model stability. This robustness under localized perturbations highlights the solution’s practical feasibility and resilience, providing strong support for its application in real-world FEW system integration and urban planning.
Table 7.
Sensitivity Analysis Results of Decision Variables (±5% perturbation).
| Variable. | Food (%) | Energy (%) | Cost(%) |
|---|---|---|---|
| X1 Ground Planting Area | 0.28% | 0.00% | 0.02% |
| X2 Rooftop Planting Area | 1.03% | 0.00% | 0.07% |
| X3 PV Greenhouse Area | 1.86% | 0.62% | 1.09% |
| X4 Indoor Hydroponics Area | 1.82% | 0.00% | 0.57% |
| y1 Flat Roof PV Area | 0.00% | 2.27% | 1.84% |
The 3D scatter plot in Figure 5 directly illustrates the original value distribution of the objective functions. Since the algorithm employs a minimization strategy, the two objectives intended for maximization (Food and Energy) are transformed into negative values, resulting in a “reversed” Pareto front extending from the lower left to the upper right. The plot reveals that while Cost (Objective 3) is relatively concentrated across most solutions, a significant nonlinear coupling persists between Food (Objective 1) and Energy (Objective 2). This gradually inclined solution set suggests that increases in food or energy production do not correspond to linear cost increases, reflecting the classic pattern of diminishing marginal returns in resource allocation. A discernible trend emerges: through spatial configuration optimization, the system can enhance both food and energy outputs without substantially increasing costs. However, a clear nonlinear trade-off among the three objectives remains, underscoring the inherent complexity of balancing competing priorities.
Figure 6 presents the same solution set using actual physical units (kg for food, kWh for energy, and RMB for cost), with cost visualized through a continuous color gradient. This visualization enhances the interpretability of Pareto-optimal solutions. In the low-cost region (indicated by cooler colors), solutions cluster within modest production ranges (Food ≤ 2 million kg, Energy ≤ 50 million kWh), suggesting that limited production layouts are feasible under tight budget constraints. Toward the upper-right, higher production levels are associated with steep cost increases (warmer colors), indicating that achieving near-complete self-sufficiency requires substantial investment in infrastructure and operations. The overall distribution of solutions forms a conical shape, reflecting diminishing marginal returns on resource investment. Specifically, as energy output exceeds approximately 60 million kWh, the cost curve steepens significantly, signaling decreasing economic efficiency for further expansion.
Collectively, Figure 5 and Figure 6 demonstrate that no single solution achieves optimal performance across all three objectives. Trade-offs are intrinsic to the system, and selecting an appropriate compromise requires balancing available resources, policy constraints, and fiscal capacity. In practical terms, urban renewal strategies should prioritize solutions along the Pareto front that are both financially viable and operationally scalable. Moreover, the varying density of solutions across the cost-output spectrum provides flexibility indicators: denser, lower-cost regions support adaptive planning, while sparse, high-output regions necessitate more deliberate strategic consideration.
4.2. Selection of the Compromise Solution and Parameter Description
From the tri-objective optimization results, the model produced a diverse set of Pareto-optimal solutions, all satisfying the non-dominance condition and reflecting the inherent trade-offs between food production, energy generation, and total system cost. To identify a balanced and practical solution, this study employed an equal-weight normalized scoring method, resulting in the following compromise-optimal configuration:
As shown in Table 8, the selected compromise solution satisfies all constraint conditions. For instance, the ground-level cultivation area is 53,056.8 m², remaining well below the maximum threshold of 85,125 m². The total area allocated to greenhouse cultivation (X₃ + X₄) amounts to 96,276.9 m², corresponding to 97.8% of the allowable maximum. Rainwater harvesting yields 27,385.6 m³, fully meeting the irrigation demand for controlled-environment agriculture (26,535 m³), indicating that water system constraints were not a limiting factor.
Regarding spatial allocation, rooftop space is predominantly utilized for cultivation (X₂ = 192,011.8 m²), while the area assigned to flat-roof PV panels (y₁) is 124,967.8 m², accounting for a substantial portion of the total available rooftop area. This distribution suggests that the majority of energy production is supported by flat-roof PV (y₂) and greenhouse rooftop PV (y₃), rather than competing directly with rooftop agriculture for space.
Compared with the four predefined planning scenarios, the compromise solution is free from any preset strategic bias. Instead, it emerges through algorithmic optimization as the most efficient spatial and resource configuration. For example, Scenario 1 (PV-prioritized) minimizes costs but significantly limits food production, while Scenario 3 (agriculture-prioritized) achieves high yields at the expense of sharply increased costs. By contrast, the selected solution achieves a favorable balance between these extremes, effectively controlling total investment while attaining relatively high levels of self-sufficiency. This outcome validates the advantage of multi-objective optimization in navigating complex trade-offs and providing actionable insights for integrated resource planning.
Table 9.
Objective Values of the Compromise Solution.
| Objective | Value |
|---|---|
| Food Output (F) | 5223462 kg / year |
| Energy Output (E) | 5223462 kWh / year |
| Total Cost (C) | 160448441.93 RMB |
The selected solution achieves high annual outputs—5,223 tons of vegetables and 49.09 GWh of clean energy—without significantly increasing investment costs. The energy output exceeds the predefined annual demand (40.03 GWh), indicating that the system possesses a moderate degree of redundancy, which is advantageous for addressing real-world challenges such as supply instability. The ratio of unit output to unit cost ranks among the highest in the entire Pareto solution set, reflecting favorable resource-to-cost efficiency. These results underscore the strong practical feasibility of the proposed configuration and its potential for broader implementation.
4.3. Spatial Configuration and System Distribution Characteristics
The compromise solution generated by the optimization algorithm not only achieves a mathematical balance among the three objective functions but also provides a spatially feasible and implementable configuration. Figure 7, Figure 8, Figure 9 and Figure 10 illustrate the schematic spatial layouts of the residential district based on this optimal solution.
As shown in the overall layout (Figure 7), rooftop agricultural systems are primarily distributed across mid- to high-rise public buildings, commercial complexes, and structurally robust residential towers, with open-air cultivation serving as the dominant form. Rooftop greenhouses are concentrated in the densely built western zone, where a centralized greenhouse platform facilitates coordinated management, stabilized output, and seasonal control of production.
PV systems are deployed based on factors such as building orientation, solar exposure, and structural load-bearing capacity. These systems are predominantly installed on high-rise rooftops and industrial buildings, particularly on unshaded flat and sloped roofs that provide optimal solar access. Water systems are spatially organized with a focus on rainwater harvesting, storage, and reuse, ensuring efficient water resource management.
Ground-level agricultural areas are primarily located in open zones within the residential district that are flat, well-lit, and free from shading. These areas are also selected for their low foot traffic, ensuring good ventilation and operational convenience, making them ideal for open-field cultivation and community farming initiatives. The design of ground-level agriculture is carefully integrated with road networks, drainage systems, and rainwater harvesting infrastructure, enabling cost-effective and minimally invasive deployment of agricultural land use.
Overall, the spatial configuration derived from the optimization ensures the synergistic operation of the integrated FEW system while accommodating the diversity of existing spatial structures and architectural forms. The design achieves a high degree of spatial coupling between ground-level and rooftop resources, maximizing land-use efficiency within the constraints of urban density.
4.4. System Outputs and Resource Balance Validation
To evaluate the applicability and resource allocation effectiveness of the optimal compromise solution at the scale of an actual residential district, this study integrates annual resource consumption data for urban communities in Tianjin. Drawing from the 2024 Tianjin Statistical Yearbook, the 2022 Urban and Rural Construction Statistical Yearbook, and field-based survey data, the annual resource demand and supply for the target district were estimated and compared against the model’s output. This comparison assesses the degree of supply-demand alignment and identifies system redundancies.
For the food system, based on the annual per capita consumption of fresh vegetables and fruits (110.6 kg and 75.7 kg, respectively), the total annual demand for produce within the district is approximately 2,609 tons. The compromise solution incorporates ground-level cultivation, rooftop farming, and protected agriculture units, collectively producing 5,223 tons annually. This output not only ensures full self-sufficiency but also generates surplus capacity for external distribution, highlighting the potential for enhancing urban agricultural productivity in high-density contexts.
Regarding the energy system, the annual per capita energy demand, expressed in electricity consumption and converted to standard coal equivalent (SCE), is 1,196 kWh per person, resulting in a total demand of approximately 40.03 GWh for the residential community. The optimized configuration supplies 49.09 GWh of clean energy, exceeding the demand by 22.6%. This surplus enhances system resilience against uncertainties such as climatic fluctuations or grid instability. Importantly, the configuration avoids spatial conflicts between rooftop PV and agriculture by prioritizing energy generation on greenhouse rooftops and sloped roofs, thereby maximizing both spatial and energy efficiencies.
Regarding the water system, per capita domestic water use averages 122.81 kg per day, totaling 1.545 million tons annually, with approximately 1.313 million tons of wastewater requiring treatment. The integrated system includes rainwater harvesting infrastructure with an annual yield of 27,386 m³, meeting nearly all of the 26,535 m³ irrigation demand for protected agriculture. Additionally, treated wastewater is reused for green space maintenance and supplemental agricultural irrigation, significantly reducing freshwater demand and supporting the development of a water-efficient residential community.
In conclusion, the selected compromise solution not only meets the multi-objective optimization criteria at the modeling level but also demonstrates strong alignment with real-world consumption patterns, robust redundancy across subsystems, and scientifically rational spatial configurations. These outcomes validate the model’s practical feasibility and scalability, offering a robust framework for advancing the productive renewal of urban residential districts.
Table 10.
Annual Fresh Fruit and Vegetable Consumption in the Residential Community.
| Food Type | Fresh Fruit | Fresh Vegetables |
| Annual Per Capita Consumption (kg) | 75.7 | 110.6 |
| Total Annual Community Consumption (kg) | 2609379 | 8372.42 |
Table 11.
Annual Energy Consumption in the Residential Community.
| Energy Type | Electricity (Annual) | Household Energy Consumption (Annual) |
| Per Capita Consumption | 1,196 kWh/person (146.95 kg of standard coal) | 959 kg of standard coal/person |
| Total Annual Community Consumption | 40030120kWh (4744700 kg of standard coal) | 33056730 kg of standard coal |
Table 12.
Annual Water Consumption in the Residential Community.
| Water Metric | Daily Per Capita Water Use | Annual Per Capita Water Resource |
| Per Capita Consumption | 122.81 kg/(person·day) | 121.71 m³/person |
| Total Annual Community Consumption | 1545140.16t | 4195343.7m³ |
5. Discussion
The tri-objective optimization model developed in this study generated 175 non-dominated solutions, revealing nonlinear trade-offs among food production, energy output, and total cost. The Pareto front exhibits a conical distribution, highlighting diminishing marginal returns on resource inputs—particularly when energy output exceeds 60 million kWh, beyond which costs rise sharply. Sensitivity analysis confirmed the model's robustness: under ±5% perturbations in key decision variables, all objective functions varied by less than 2%. The selected compromise solution achieved high performance, delivering an annual output of 5,223 tons of food and 49.09 GWh of energy at a total cost of 160 million CNY—exceeding residential demand by 100.2% and 22.6%, respectively. These results not only validated the three core hypotheses but also significantly enhanced community-level resource self-sufficiency while introducing system redundancy, providing critical buffering capacity against uncertainties such as climate variability and unstable energy supply.
The spatial configuration automatically identified by the optimization algorithm reveals a differentiated land-use pattern: ground cultivation occupies 53,056.8 m² (62.3%), rooftop cultivation 192,011.8 m² (57.0%), and the combined area of PV greenhouses and indoor hydroponics reaches 96,276.9 m² (97.8%). Energy generation primarily relies on flat-roof PV and greenhouse rooftop installations. The water system achieved an almost complete closed-loop cycle, with a 96.9% matching rate between rainwater harvesting and irrigation demand. These findings extend the work of Toboso-Chavero et al. (2023) on multifunctional urban rooftop use, offering more precise and quantifiable spatial configuration indicators.
This study advances the FEW-Nexus framework by translating it into a quantifiable spatial optimization model, introducing several theoretical and methodological innovations. The novel concept of “coupling nodes” enables the mapping of material and energy flows across subsystems. The model integrates isolated resource solutions—such as PV deployment, rooftop farming, and rainwater harvesting—into a cohesive and computable composite system. By applying the NSGA-II algorithm to spatial FEW system optimization, the model transcends the limitations of single-objective approaches and simplistic scenario analyses. The results demonstrate that coordinated spatial planning can generate synergistic benefits exceeding the aggregate effect of individually optimized subsystems, echoing the conclusions of Hachaichi and Egieya (2023) on the advantages of integrated resource systems.
Importantly, this study incorporates spatial dimensions into the resource optimization framework, bridging the gap between macro-level resource flows and micro-scale spatial configurations (Ma et al., 2023). It reconceptualizes urban residential areas as hybrid micro-production units, offering practical solutions to urban external dependency challenges highlighted by Zhang et al. (2019). In doing so, the research moves beyond theoretical modeling to provide actionable guidance for urban planning and policy development.
Based on our findings, we propose the following policy recommendations: (1) amend building codes to formally recognize the legal status of productive rooftop spaces; (2) establish interdepartmental coordination mechanisms to overcome fragmented resource governance; and (3) implement financial incentives and integrate smart technologies to mitigate institutional barriers and market inefficiencies.
The study’s limitations include its exclusion of building façades and shading effects, as well as its focus on mature technologies rather than emerging innovations. Future research should expand the model to incorporate carbon emissions targets, seasonal variability, regional climate adaptability, and cross-scale system integration. Despite these limitations, the study offers a novel pathway for transforming high-density cities from consumption-driven to integrated production–consumption spaces. These findings affirm the critical role of FEW-Nexus optimization in enhancing urban resilience and sustainability.
6. Conclusions
This study developed a multi-objective optimization framework for the integrated transformation of FEW system in high-density urban residential areas, successfully validating three core hypotheses. First, significant synergies exist among food, energy, and water subsystems, with joint optimization yielding superior outcomes compared to isolated subsystem optimization. Second, balanced optimal solutions can be identified between resource production and economic cost within different retrofitting scenarios. Third, rational spatial configuration can substantially enhance the system’s overall resource production potential.
The Pareto-optimal solutions generated by the NSGA-II algorithm reveal nonlinear trade-offs between resource outputs and total cost. The selected compromise solution achieves high levels of self-sufficiency, producing 5,223 tonnes of food and 49.09 GWh of energy annually at a total cost of CNY 160 million—exceeding local residential demand by 100.2% and 22.6%, respectively. The central innovation of this study lies in transforming the FEW-Nexus conceptual framework into an actionable spatial optimization model, bridging the long-standing gap between macro-scale resource flows and micro-scale spatial configurations.
While limitations remain—such as predefined system boundaries, an exclusive focus on mature technologies, and the use of static evaluation methods—this study demonstrates the pivotal role of FEW system co-optimization in enhancing urban resilience and sustainability.
Looking ahead, we envision a future urban landscape composed of interconnected “productive residential communities”, linked through decentralized energy microgrids, shared food networks, and closed-loop water systems. This transformation represents not merely a technological or spatial shift, but a fundamental reconfiguration of urban logic: from linear consumption to circular regeneration. Within this vision, urban residents evolve from passive resource consumers to active participants in production, reestablishing a harmonious relationship between humans and nature, and between production and everyday life.
This study takes a concrete step toward realizing that vision, demonstrating that resource self-sufficiency and economic viability can be simultaneously achieved, even in densely populated urban contexts. In light of escalating global resource constraints and intensifying climate challenges, this integrated, multifunctional approach to urban spatial planning offers a compelling and scalable pathway toward sustainable urban development. It presents a replicable solution to the pressing resource challenges faced by rapidly urbanizing regions worldwide.
Author Contributions
Conceptualization, J.Z. and YK.Z.; methodology, J.Z. MX.L. LL.S and HY.L.; software, MX.L. and LL.S.; validation, J.Z. and MX.L.; formal analysis, MX.L. LL.S and HY.L.; investigation, LL.S and J.Z.; resources, MX.L. and LL.S.; writing—original draft preparation, J.Z., LL.S. and MX.L.; writing—review and editing, J.Z.., MX.L. and YK.Z.; visualization, LL.S. MX.L.; supervision, YK.Z.; project administration, J.Z. and YK.Z.; funding acquisition, J.Z.. All authors have read and agreed to the published version of the manuscript.
Funding
This work was supported by China National Key R&D Program under grant No. 2024YFD1600402 ;China Architecture Design and Research Group Innovation Project grant No. 1100C080240208.
Data Availability Statement
Data will be made available on request.
Conflicts of Interest
The authors declare that they have no known competing financial interests or personal relationships that could have appeared to influence the work reported in this paper.
References
- Costanzo, V., Evola, G., & Marletta, L. (2016). Energy savings in buildings or UHI mitigation? Comparison between green roofs and cool roofs. Energy and Buildings, 114, 247-255. [CrossRef]
- FAO, I., UNICEF, WFP, WHO. (2024). The State of Food Security and Nutrition in the World 2024 – Financing to end hunger, food insecurity and malnutrition in all its forms. FAO. [CrossRef]
- Frantzeskaki, N., & Kabisch, N. (2016). Designing a knowledge co-production operating space for urban environmental governance—Lessons from Rotterdam, Netherlands and Berlin, Germany. Environmental Science & Policy, 62, 90-98.
- Garcia, D. J., Lovett, B. M., & You, F. (2019). Considering agricultural wastes and ecosystem services in Food-Energy-Water-Waste Nexus system design. Journal of Cleaner Production, 228, 941-955. [CrossRef]
- Ghosh, B., Gubareva, M., Ghosh, A., Paparas, D., & Vo, X. V. (2024). Food, energy, and water nexus: A study on interconnectedness and trade-offs. Energy Economics, 133, 107521. [CrossRef]
- Hachaichi, M., & Egieya, J. (2023). Water-Food-Energy Nexus in Global Cities: Addressing Complex Urban Interdependencies. Water Resources Management, 37(4), 1811-1825. [CrossRef]
- IEA. (2021). Net Zero by 2050: A Roadmap for the Global Energy Sector. https://www.iea.org/reports/net-zero-by-2050.
- Kibler, K. M., Reinhart, D., Hawkins, C., Motlagh, A. M., & Wright, J. (2018). Food waste and the food-energy-water nexus: A review of food waste management alternatives. Waste Management, 74, 52-62. [CrossRef]
- Liu, F., Tait, S., Schellart, A., Mayfield, M., & Boxall, J. (2020). Reducing carbon emissions by integrating urban water systems and renewable energy sources at a community scale. Renewable and sustainable energy reviews, 123, 109767. [CrossRef]
- Ma, N., Zhang, Y., Zhang, R., Zhang, W., & Li, X. (2023). Comprehensive review of food-energy-water nexus at the community scale. Journal of Cleaner Production, 420, 138311. [CrossRef]
- Melius, J., Margolis, R., & Ong, S. (2013). Estimating rooftop suitability for PV: a review of methods, patents, and validation techniques.
- Montealegre, A. L., García-Pérez, S., Guillén-Lambea, S., Monzón-Chavarrías, M., & Sierra-Pérez, J. (2022). GIS-based assessment for the potential of implementation of food-energy-water systems on building rooftops at the urban level. Science of The Total Environment, 803, 149963. [CrossRef]
- Ogbolumani, O. A., & Nwulu, N. I. (2021). Multi-objective optimisation of constrained food-energy-water-nexus systems for sustainable resource allocation. Sustainable Energy Technologies and Assessments, 44, 100967. [CrossRef]
- Ogbonna, C. G., Nwachi, C. C., Okeoma, I. O., & Fagbami, O. A. (2023). Understanding Nigeria’s transition pathway to carbon neutrality using the Multilevel Perspective. Carbon Neutrality, 2(1), 24. [CrossRef]
- Okola, I., Omulo, E. O., Ochieng, D. O., & Ouma, G. (2025). Multi-Objective Optimization of the Food-Energy-Water Nexus Problem: A Review of the Key Concepts and Emerging Opportunities in Objective Functions, Decision Variables, and Optimization Techniques. Earth's Future, 13(4), e2024EF004718. [CrossRef]
- Peng, Z., Sun, Q., Li, P., Sun, F., Ren, S., & Guan, R. (2024). The environmental impact of the entire renovation process of urban aged residential buildings in China. International Journal of Building Pathology and Adaptation, ahead-of-print(ahead-of-print). [CrossRef]
- Ross, T. T., Alim, M. A., & Rahman, A. (2022). Community-scale rural drinking water supply systems based on harvested rainwater: A case study of Australia and Vietnam. Water, 14(11), 1763. [CrossRef]
- Salem, H. S., Pudza, M. Y., & Yihdego, Y. (2022). Water strategies and water–food Nexus: challenges and opportunities towards sustainable development in various regions of the World. Sustainable Water Resources Management, 8(4), 114. [CrossRef]
- Toboso-Chavero, S., Montealegre, A. L., García-Pérez, S., Sierra-Pérez, J., Muñoz-Liesa, J., Gabarrell Durany, X., Villalba, G., & Madrid-López, C. (2023). The potential of local food, energy, and water production systems on urban rooftops considering consumption patterns and urban morphology. Sustainable Cities and Society, 95, 104599. [CrossRef]
- Trypanagnostopoulos, G., Kavga, A., Souliotis, Μ., & Tripanagnostopoulos, Y. (2017). Greenhouse performance results for roof installed photovoltaics. Renewable Energy, 111, 724-731. [CrossRef]
- Van Vuuren, D. P., Bijl, D. L., Bogaart, P., Stehfest, E., Biemans, H., Dekker, S. C., Doelman, J. C., Gernaat, D. E. H. J., & Harmsen, M. (2019). Integrated scenarios to support analysis of the food–energy–water nexus. Nature Sustainability, 2(12), 1132-1141. [CrossRef]
- Zhang, P., Zhang, L., Chang, Y., Xu, M., Hao, Y., Liang, S., Liu, G., Yang, Z., & Wang, C. (2019). Food-energy-water (FEW) nexus for urban sustainability: A comprehensive review. Resources, Conservation and Recycling, 142, 215-224. [CrossRef]
Figure 4.
llustrative spatial design strategies for FEW system localization.
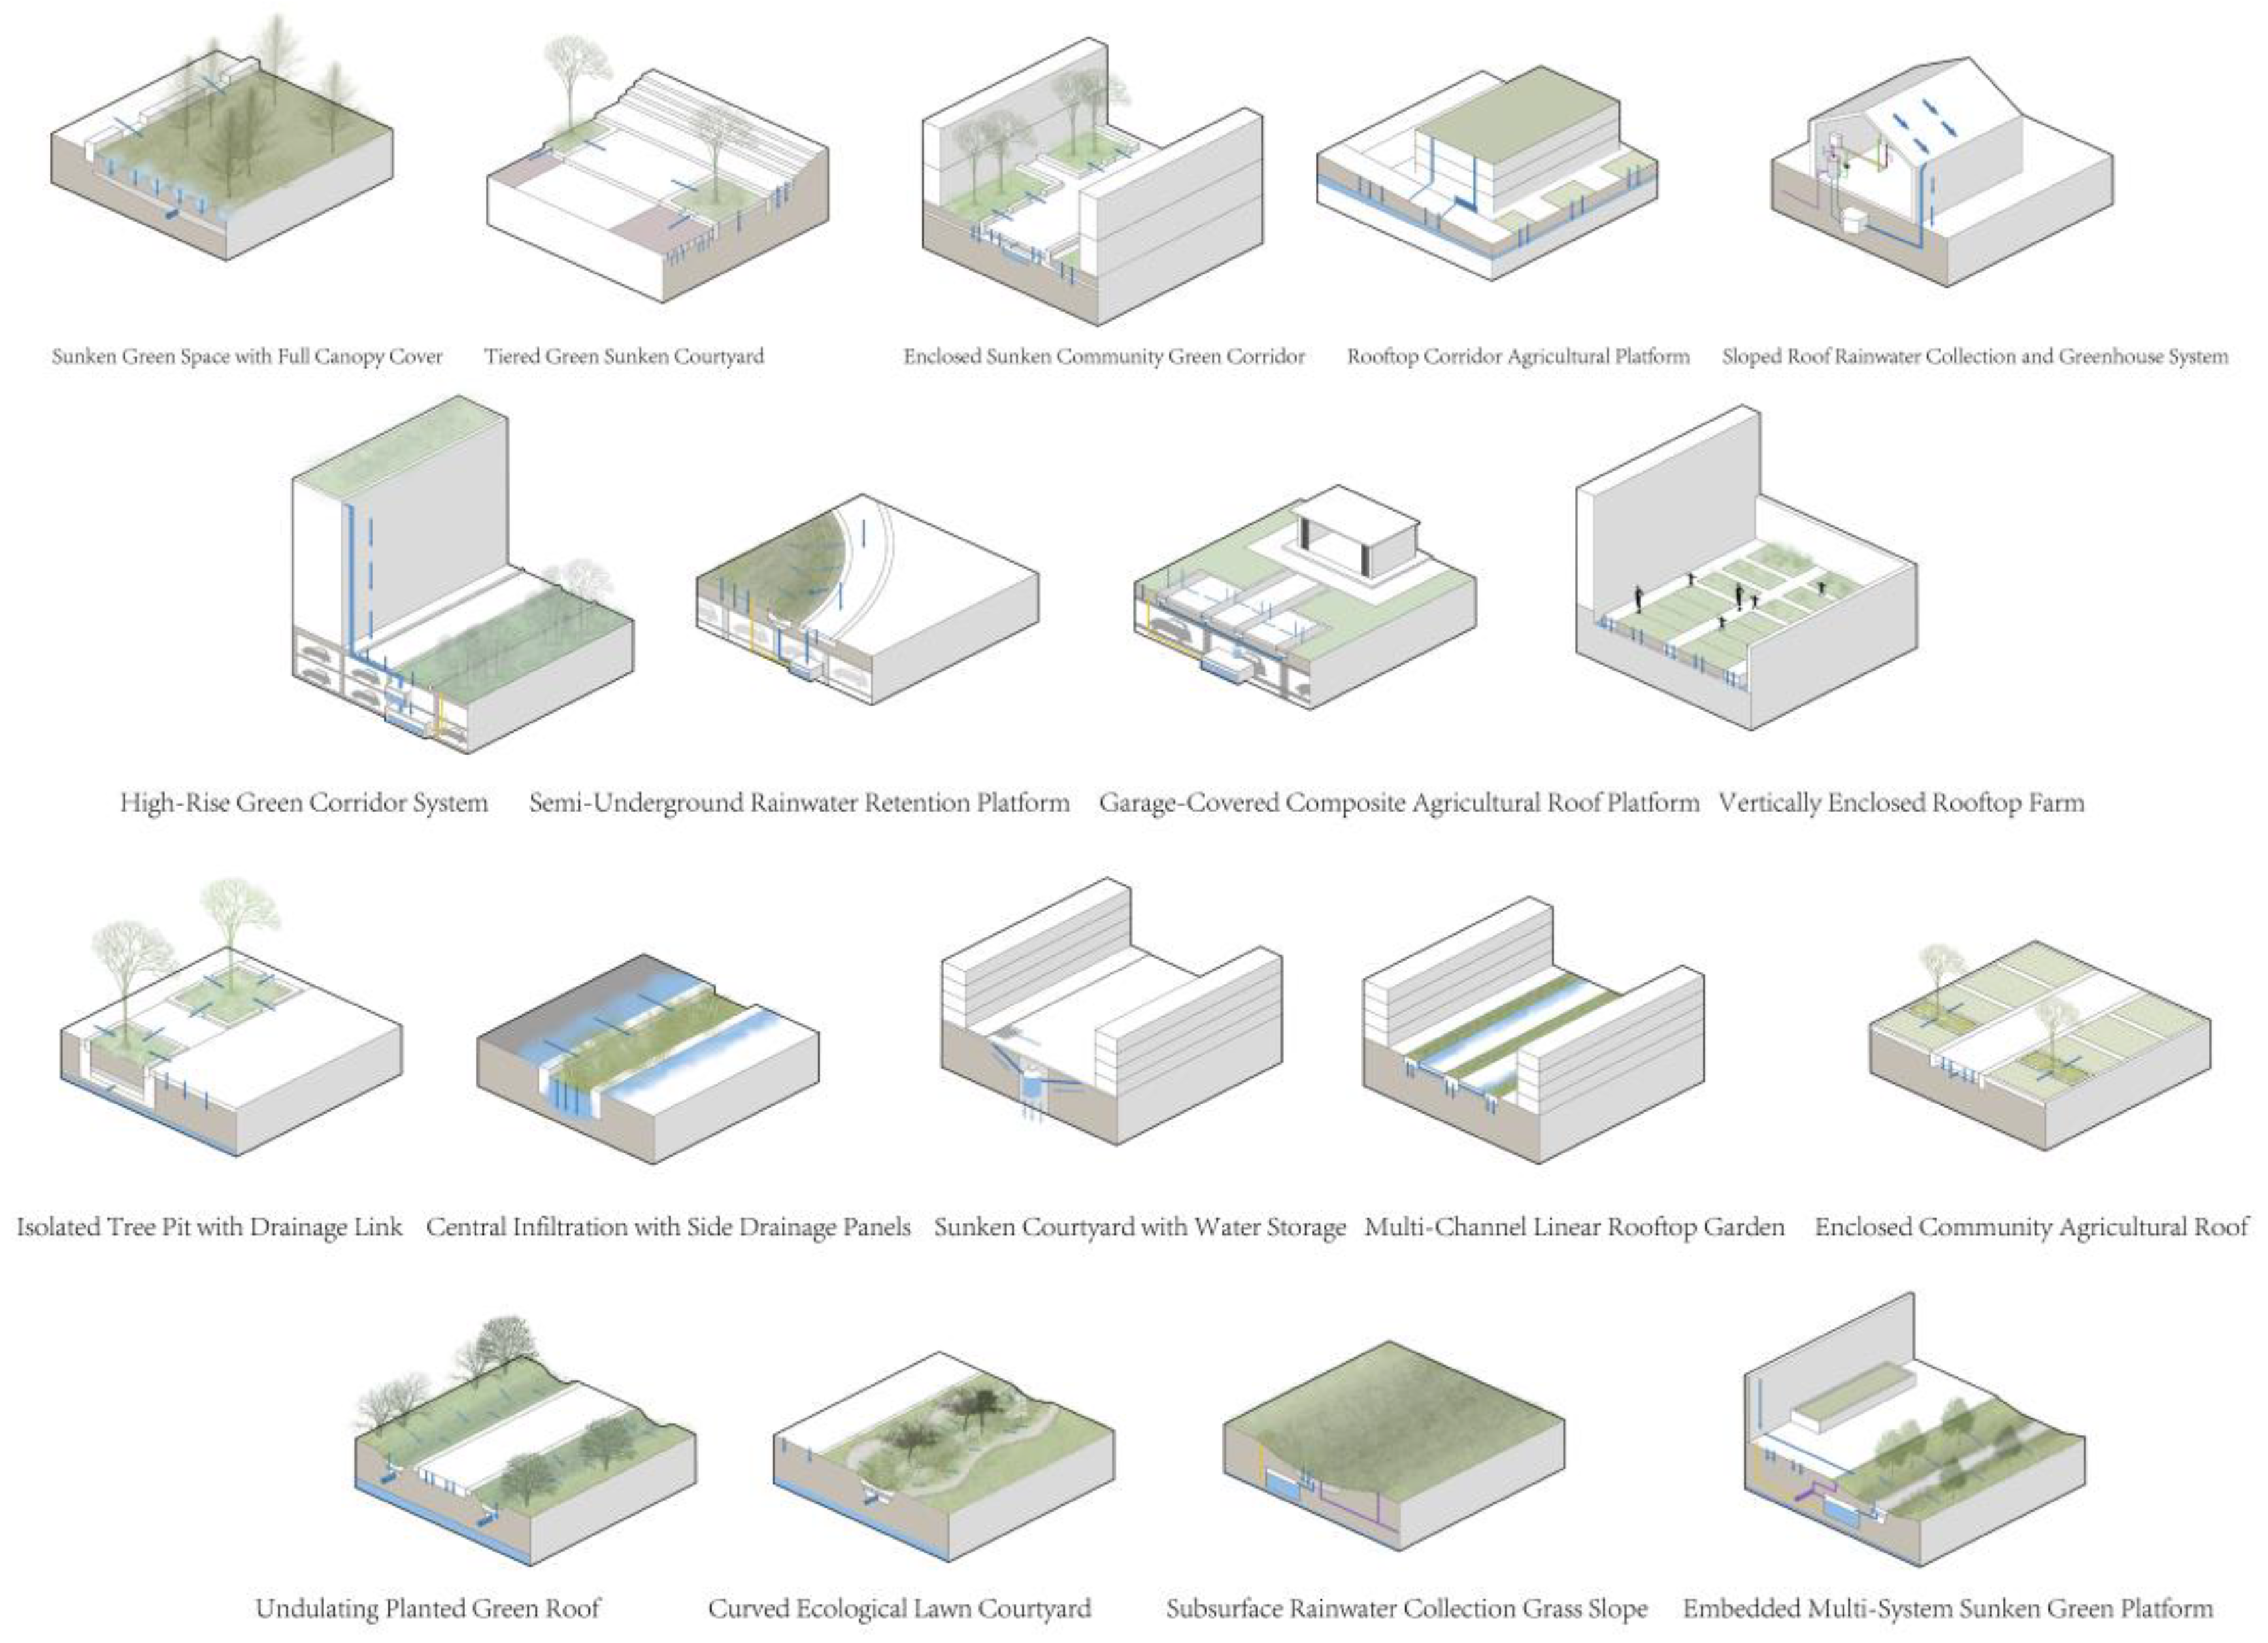
Figure 5.
Distribution of the Original Objective Space.
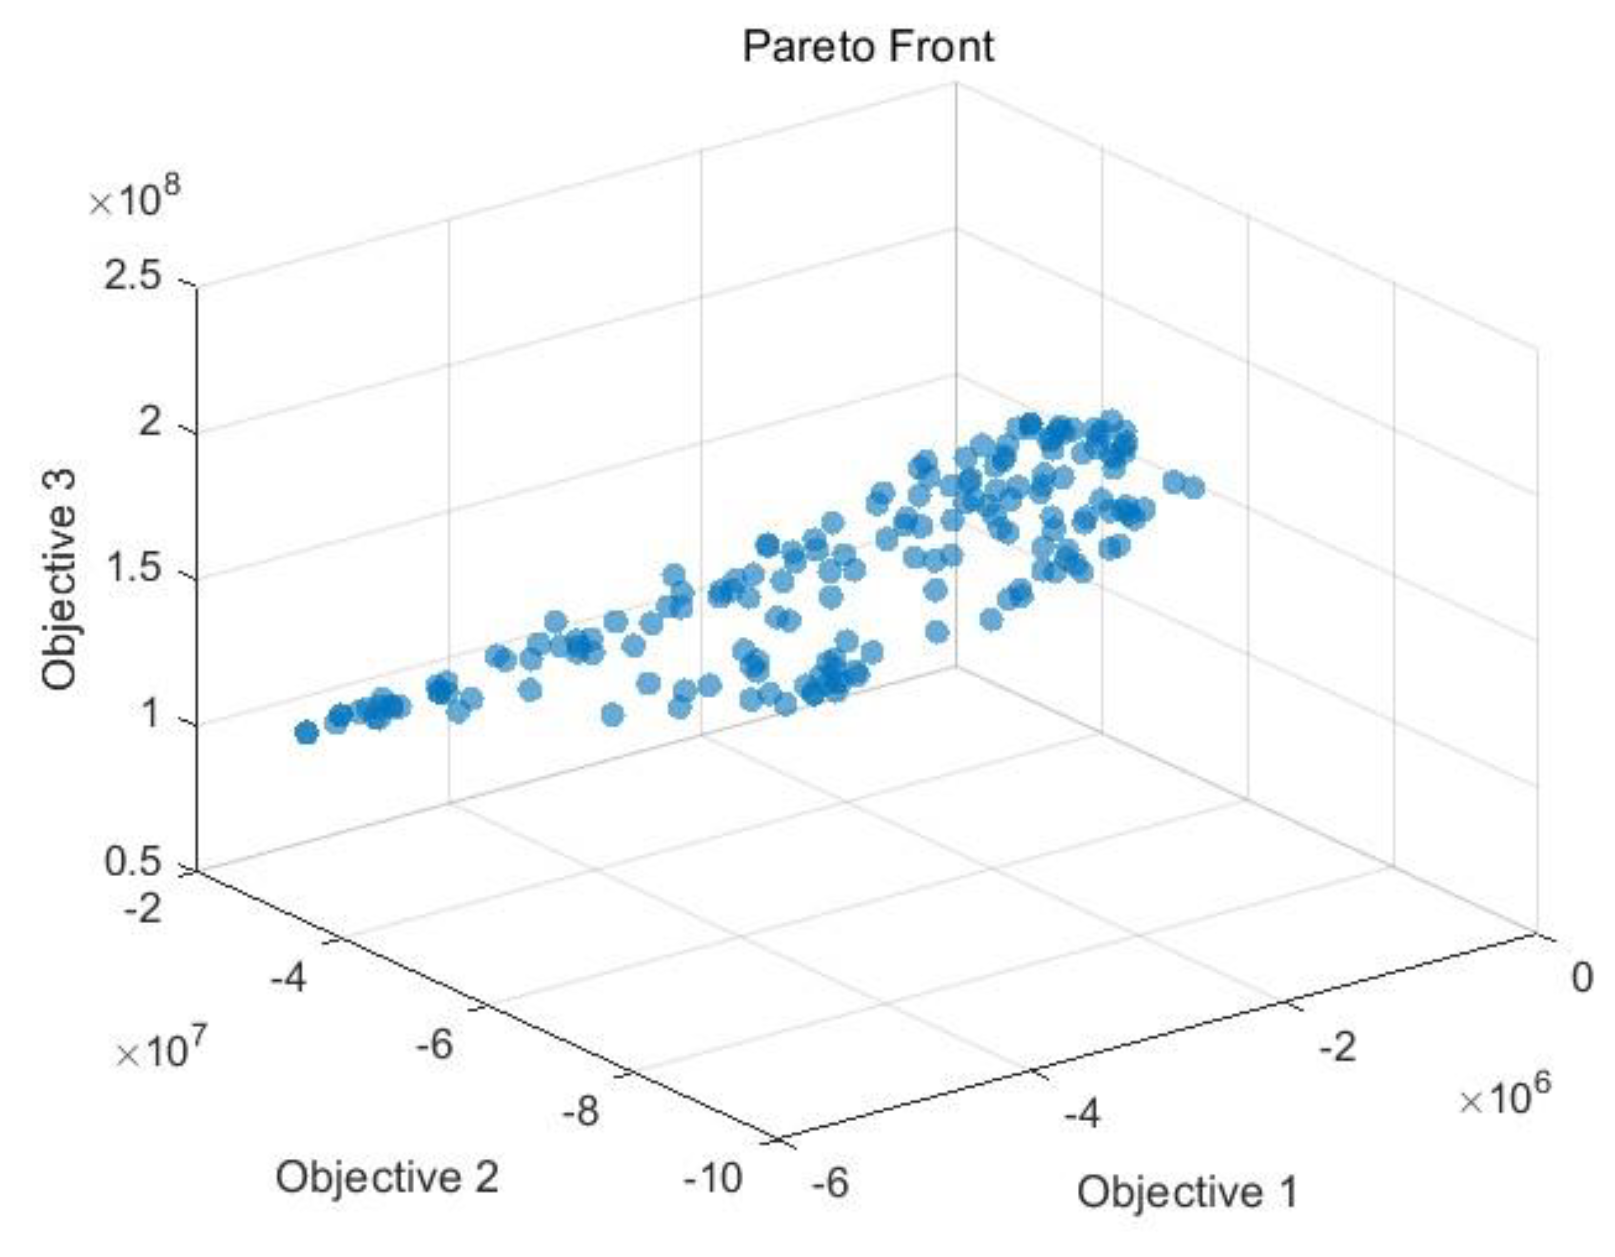
Figure 6.
Pareto Solution Set Illustrating Trade-offs Among Objectives.
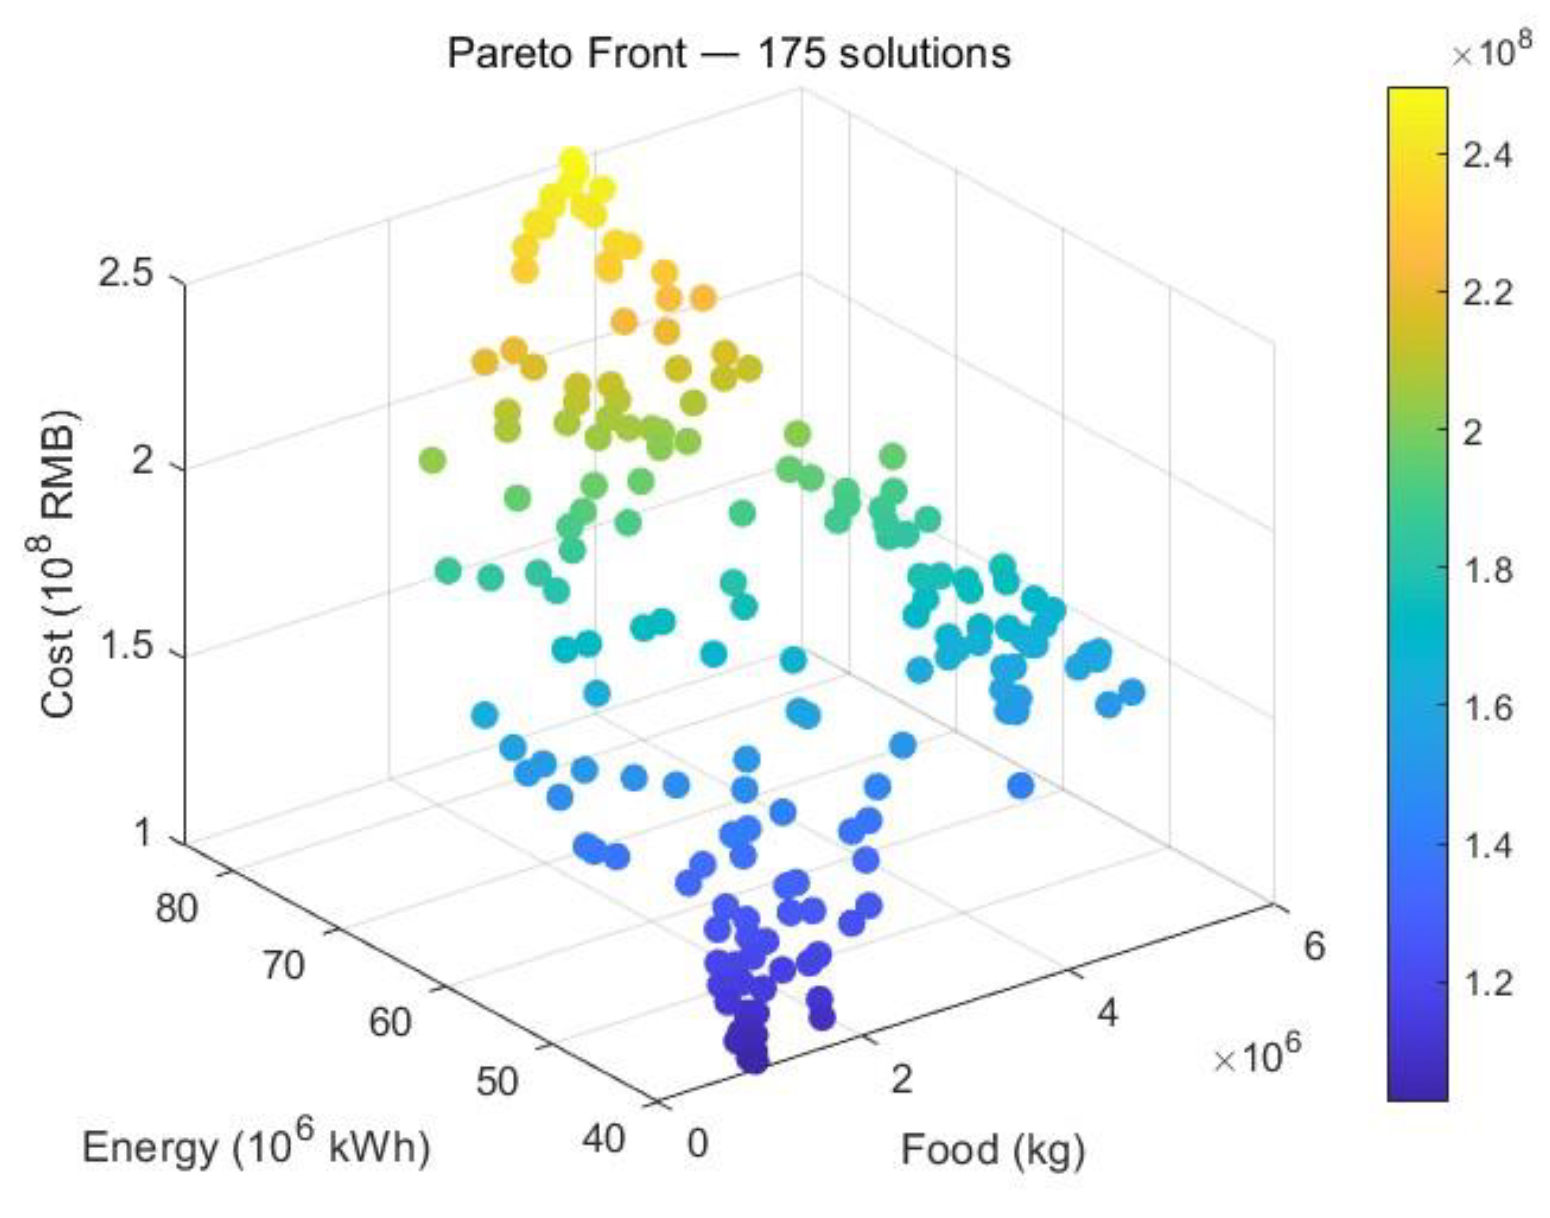
Figure 7.
Overall Spatial Configuration Plan.
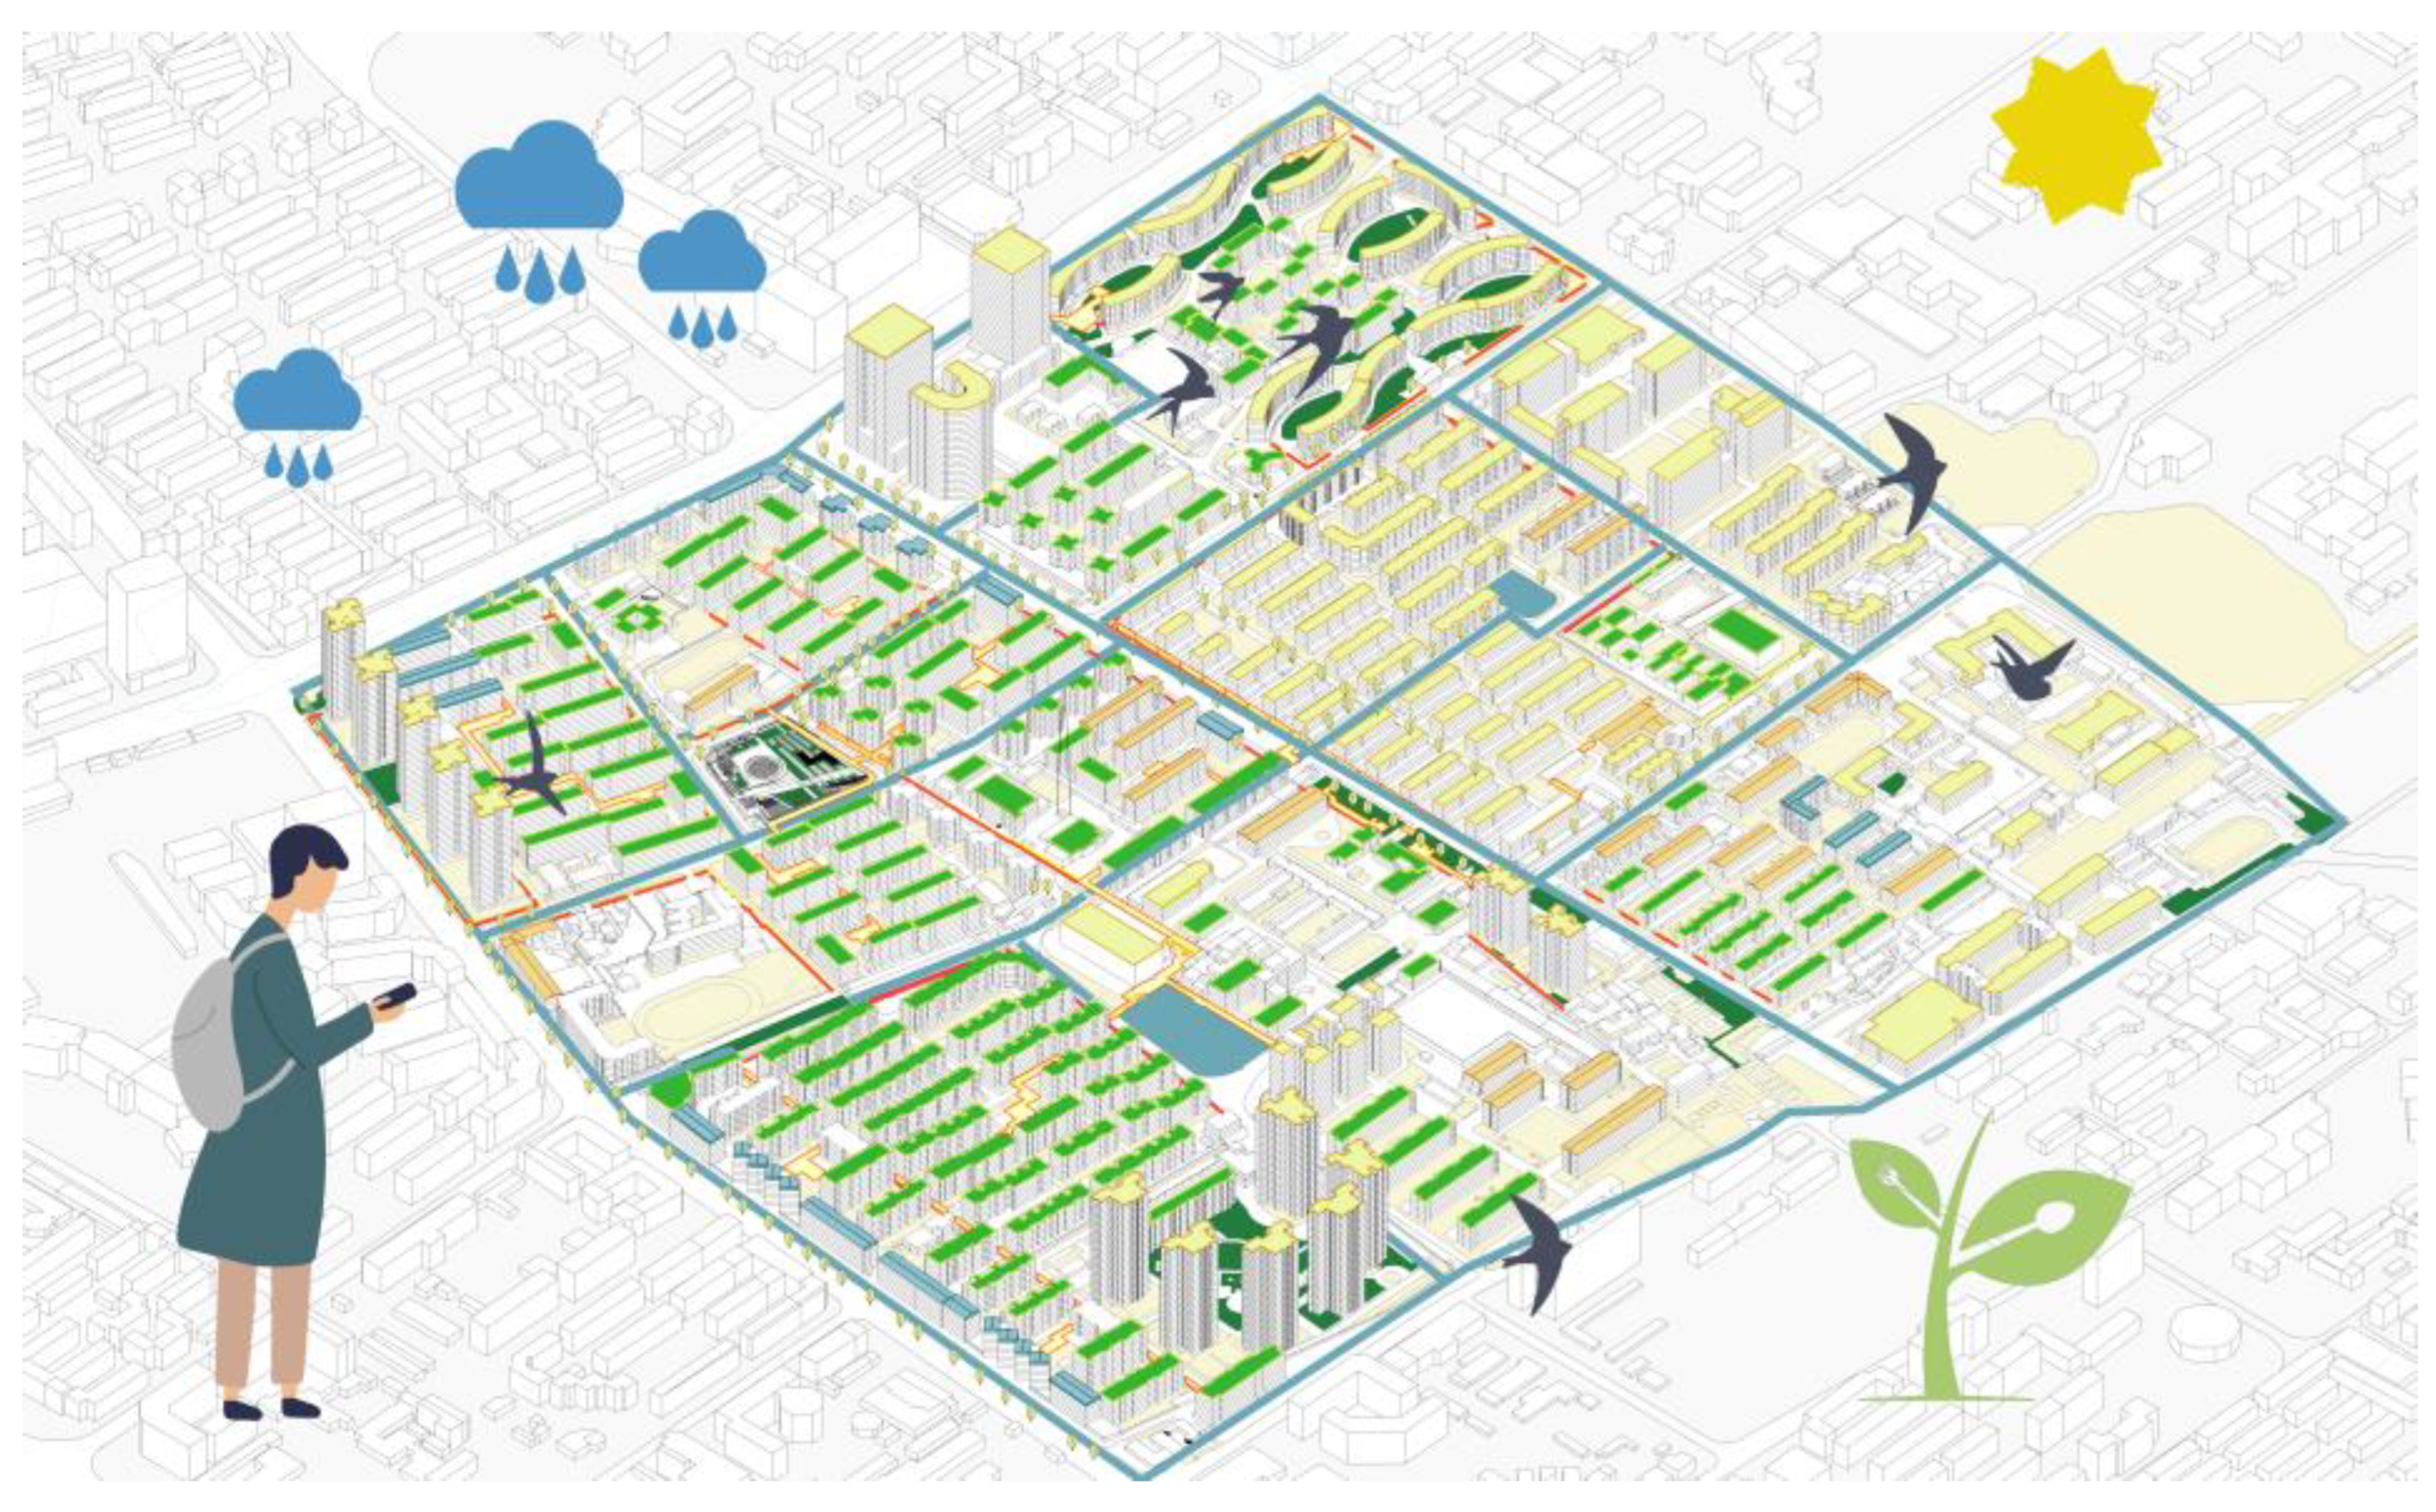
Figure 8.
Food Subsystem Layout.
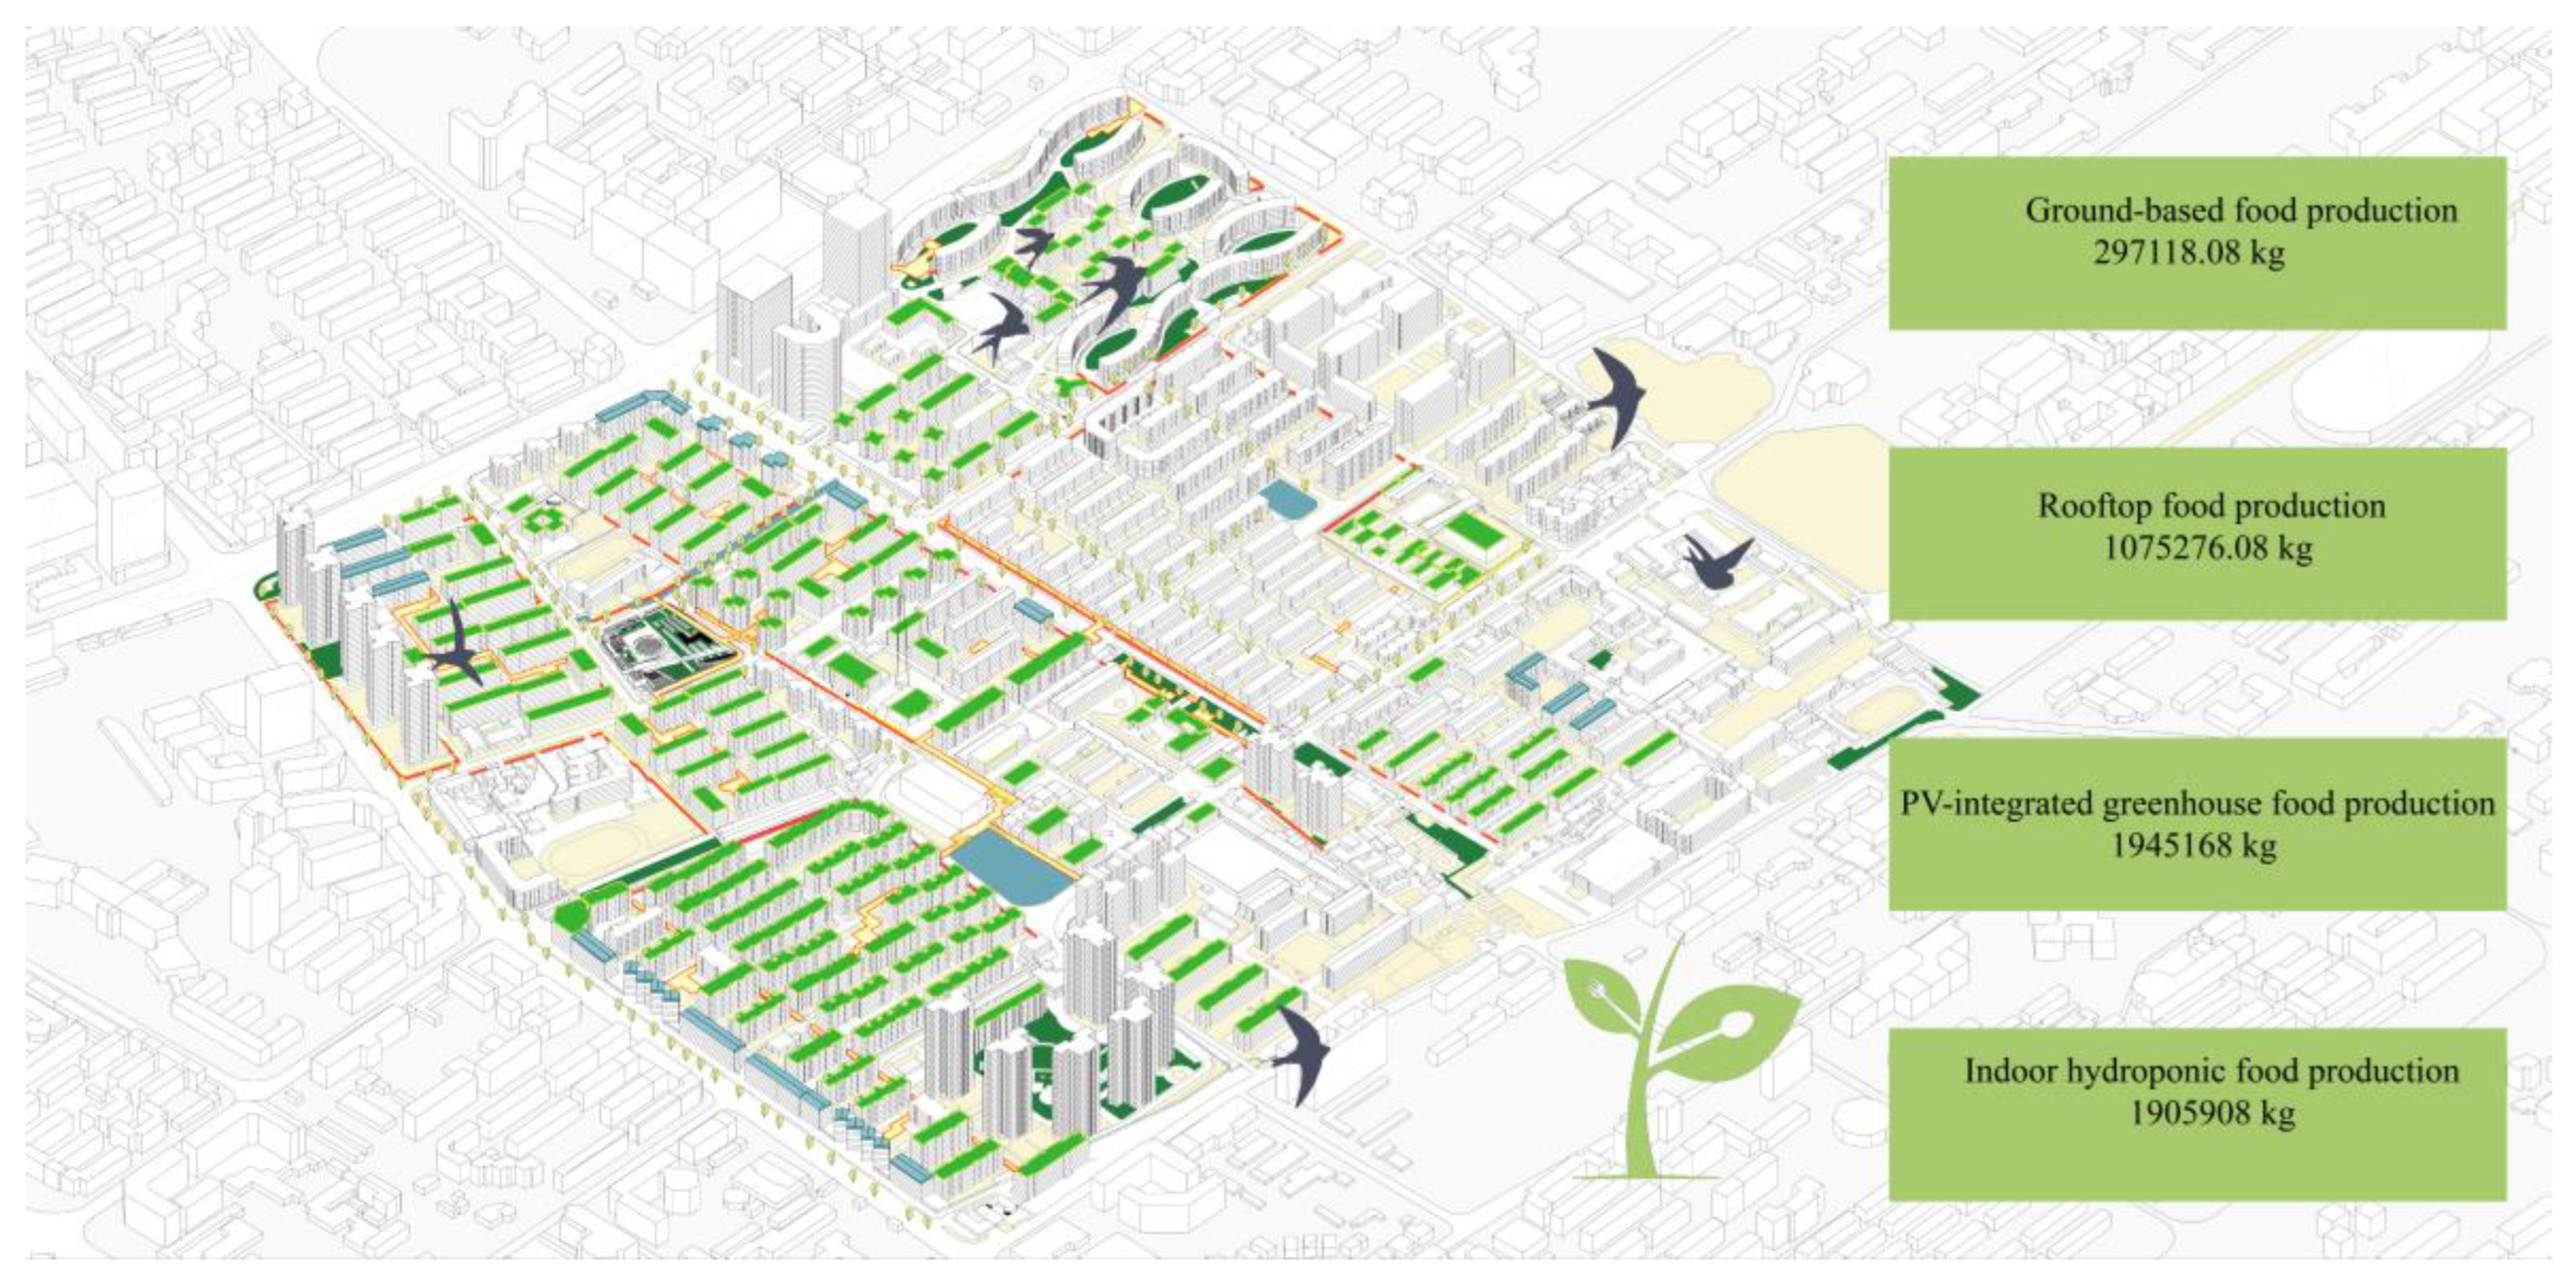
Figure 9.
Energy Subsystem Layout.
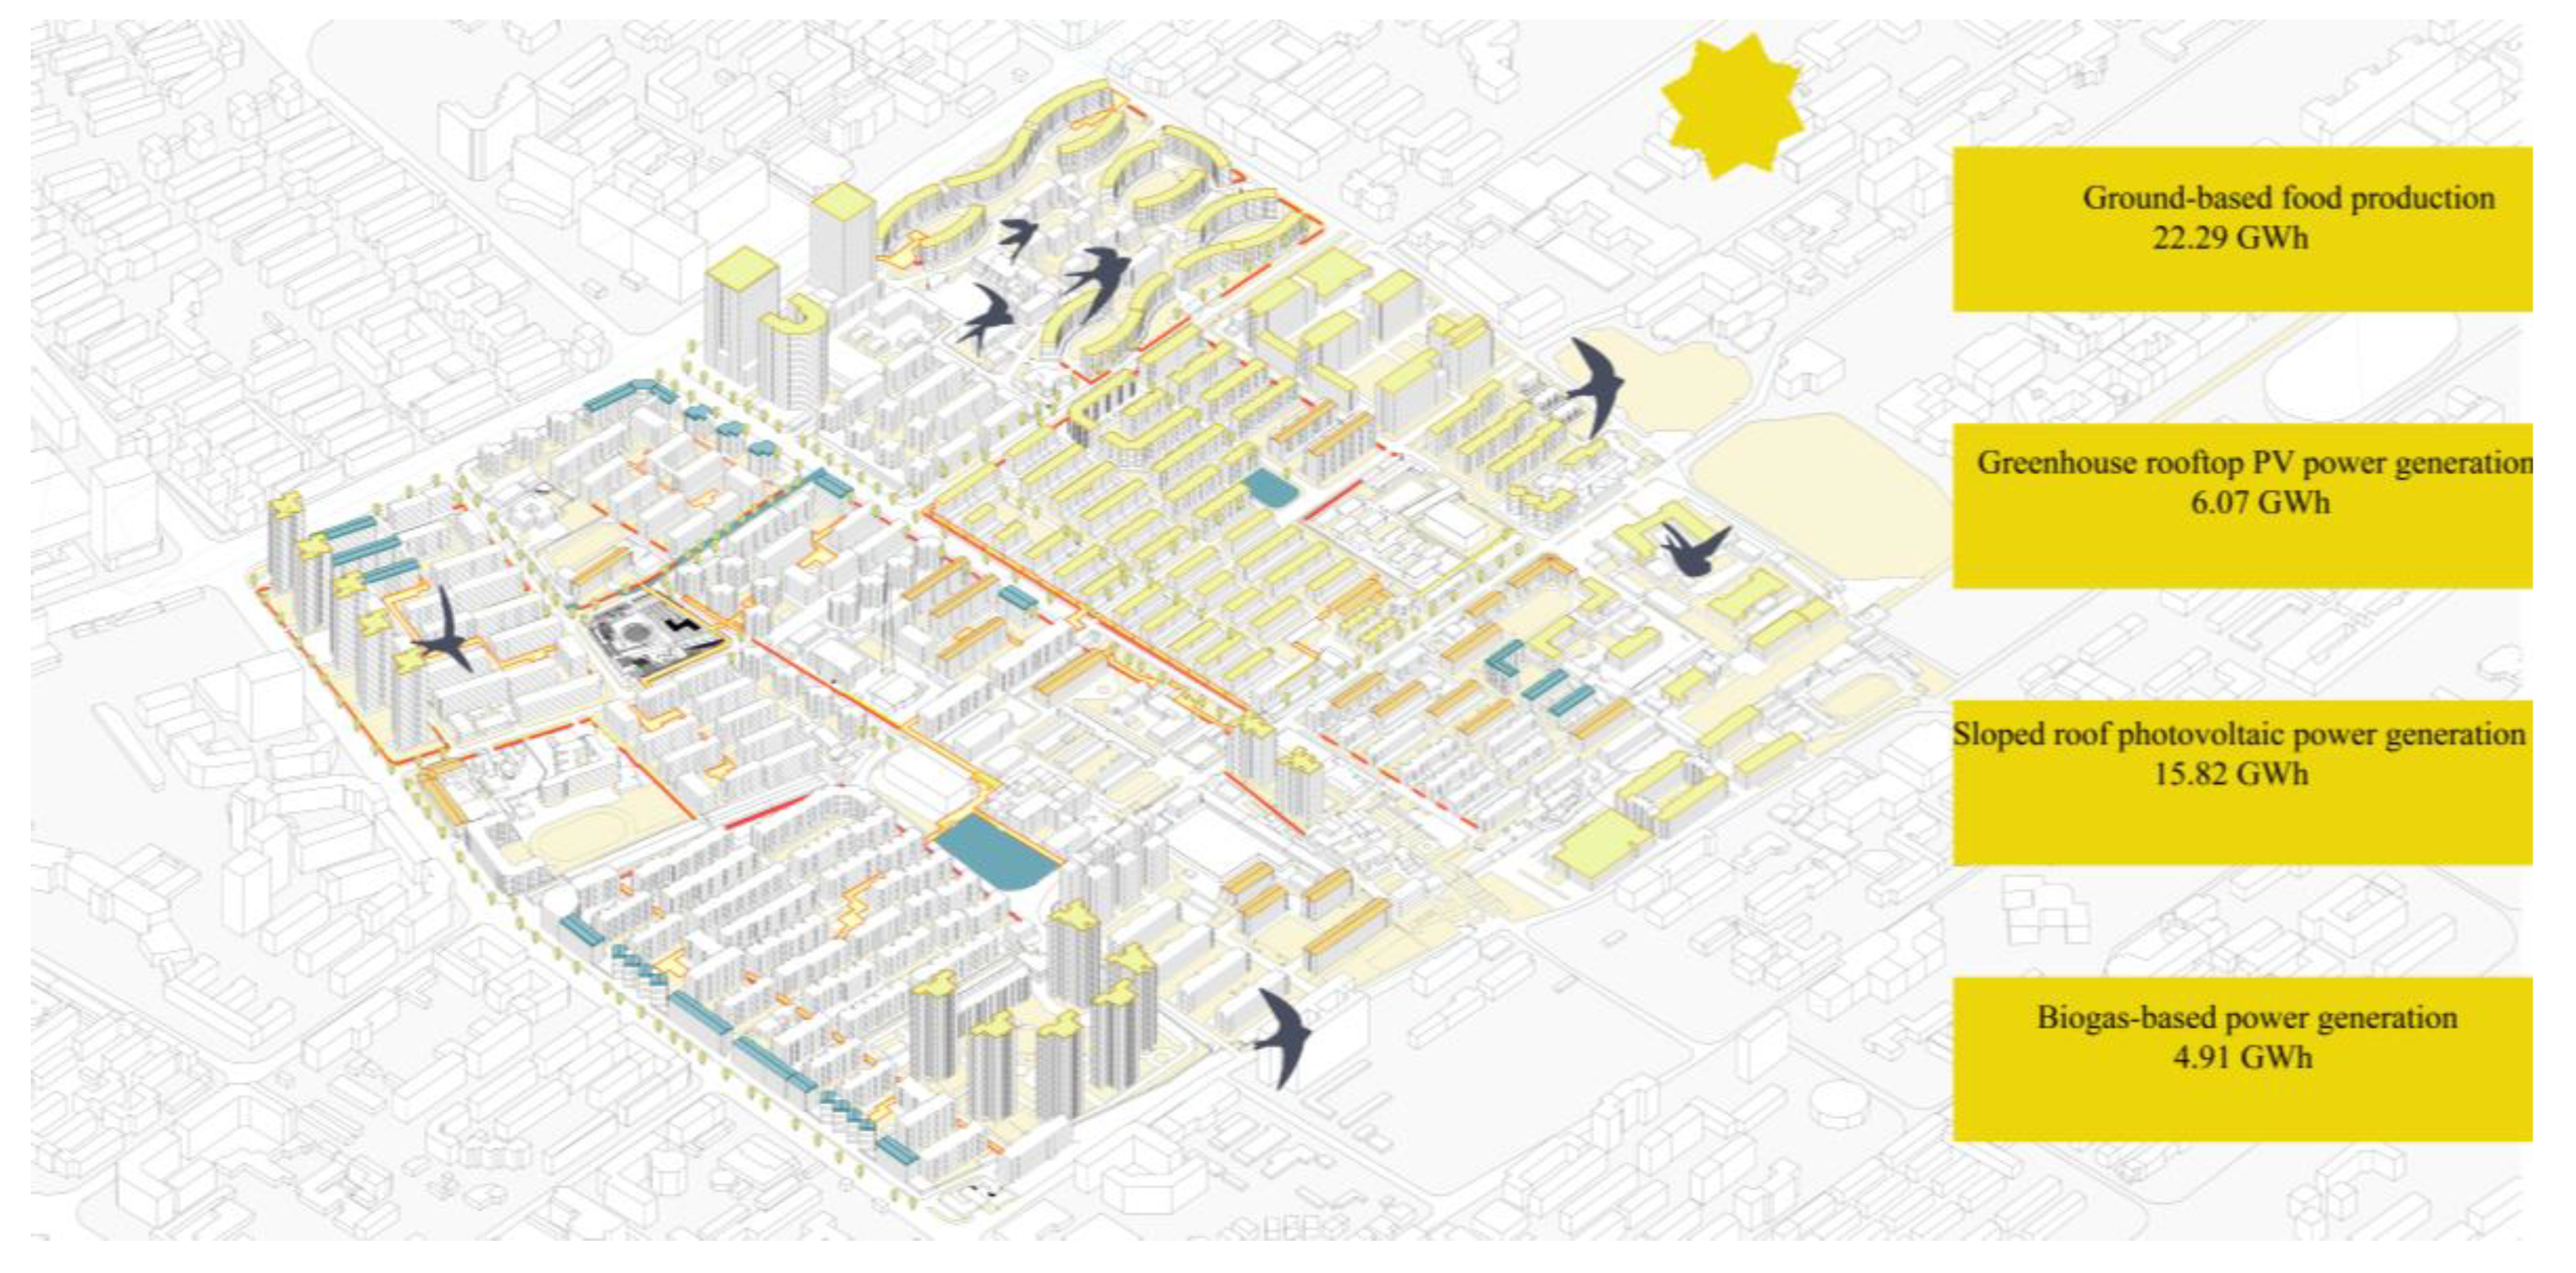
Figure 10.
Water Subsystem Layout.
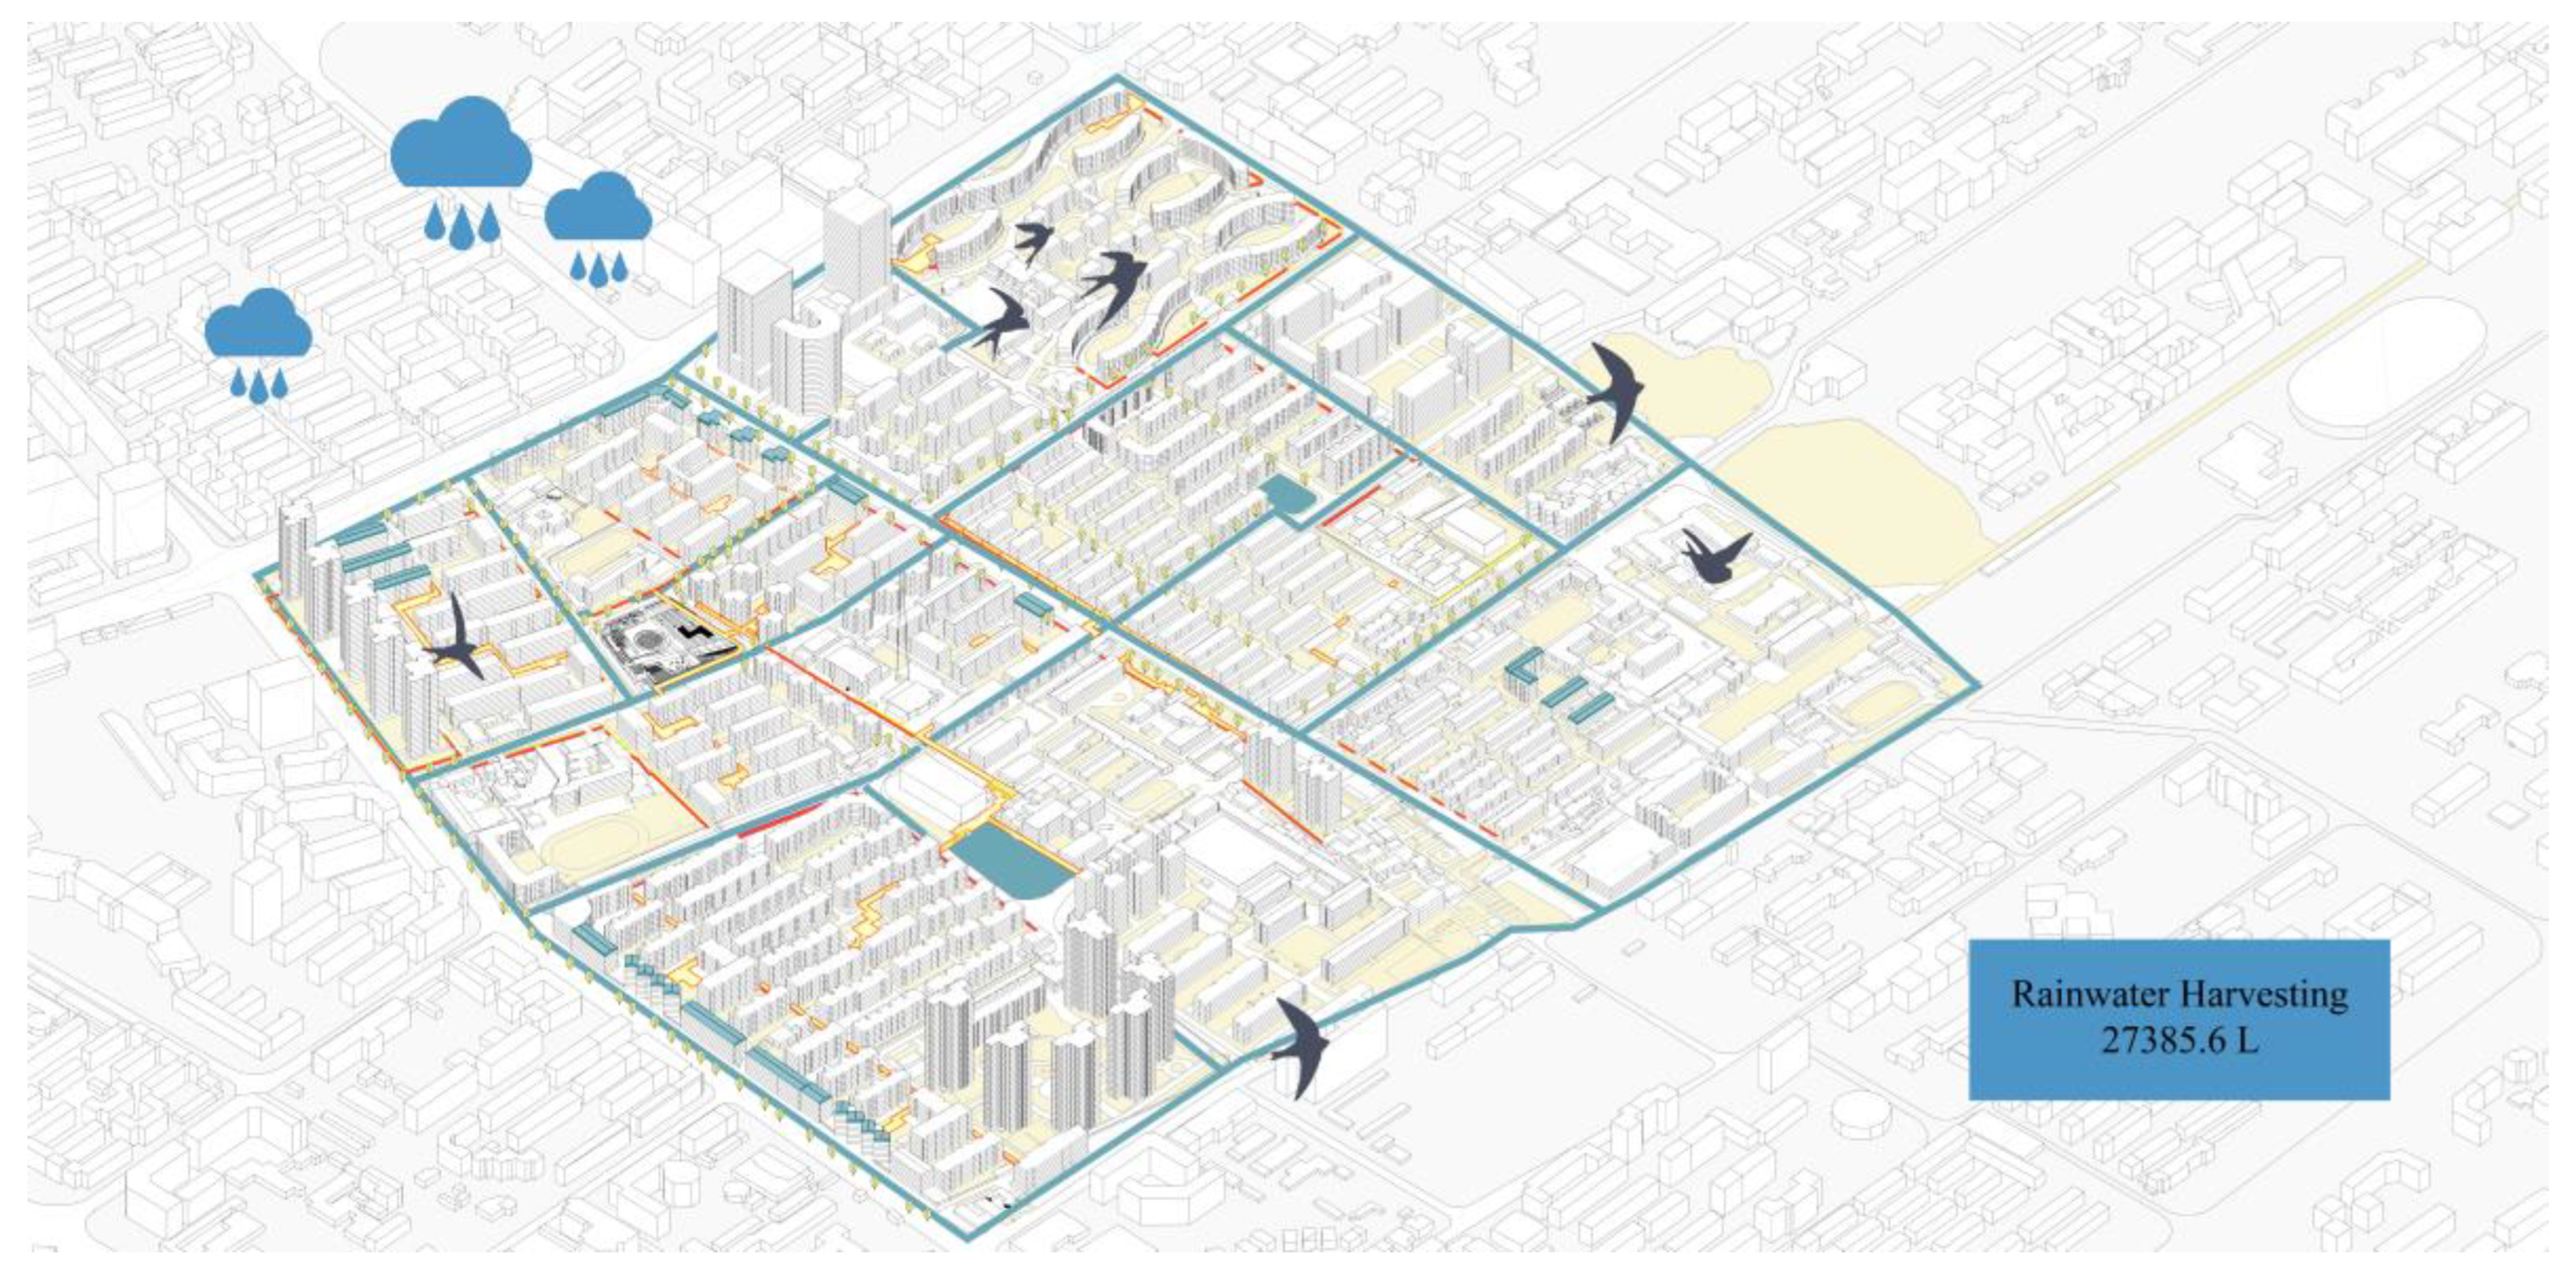
Table 8.
Decision Variables in the Compromise-Optimal Solution.
| System | Variable | Description | Value | Utilization Rate of Upper Bound |
|---|---|---|---|---|
| Food | X₁ | Ground-level cultivation area (㎡) | 53056.8 | 62.3 % (≤ 85 125) |
| X₂ | Rooftop cultivation area (㎡) | 192011.8 | 57.0% % (X₂+y₁≤ 336 640) | |
| X₃ | PV greenhouse area (㎡) | 48629.2 | 49.4 % (X₃+X₄≤ 98 406) | |
| X₄ | Indoor hydroponic area (㎡) | 47647.7 | 48.4 % (X₃+X₄≤ 98 406) | |
| Energy | y₁ | Flat-roof PV area (㎡) | 124967.8 | 37.1 % (y₁ +X₂≤ 336 640) |
| y₂ | PV on greenhouse roofs = 0.7 × X₃ (㎡) | 34040.44 | – | |
| y₃ | PV on sloped roofs = 0.2 × S_slope (㎡) | 88 680 | – | |
| y₄ | Biogas production (m³) | 845822 | – | |
| Water | W | Annual rainwater harvest (m³) | 27 385.6 | – |
| G | Annual irrigation demand (m³) | 26 535 | 96.9 % (≤ W) |
Note: “–” indicates either a fixed parameter or one not constrained by an upper limit.
Disclaimer/Publisher’s Note: The statements, opinions and data contained in all publications are solely those of the individual author(s) and contributor(s) and not of MDPI and/or the editor(s). MDPI and/or the editor(s) disclaim responsibility for any injury to people or property resulting from any ideas, methods, instructions or products referred to in the content. |
© 2025 by the authors. Licensee MDPI, Basel, Switzerland. This article is an open access article distributed under the terms and conditions of the Creative Commons Attribution (CC BY) license (http://creativecommons.org/licenses/by/4.0/).
Copyright: This open access article is published under a Creative Commons CC BY 4.0 license, which permit the free download, distribution, and reuse, provided that the author and preprint are cited in any reuse.


