
Submitted:
28 May 2025
Posted:
30 May 2025
You are already at the latest version
Abstract
Background: Treatment of metastatic cancer remains a challenge, because cancer cells acquire resistance even to the most contemporary therapies. This study analyzed the role of the phosphoprotein Stathmin 1 (STMN1) in regulating cancer cell growth and metastatic potential.Methods: Public datasets with metastatic castration-resistant prostate cancer (mCRPC) and breast cancer (BC) were analyzed to determine the interrelationship between STMN1, hepatocyte growth factor (HGF), and MET proto-oncogene (MET) expression, overall survival, and response to chemotherapy. Site-directed mutagenesis, cell cycle analysis, proliferation, migration and invasion assays determined the impact of STMN1 phosphorylation on proliferation and metastatic potential. Results: Increased STMN1 associates with HGF and MET gene expression in mCRPC, and taxane chemotherapy further increases HGF expression. STMN1 and HGF are highest, and overall survival is poorest in mCRPC to liver compared to other sites, implying the metastatic site influences their expression levels and potentially pattern of metastatic spread. Increased STMN1 and MET also predict taxane responsiveness in BC patients. Analysis of STMN1 serine (S)16, 25, 38, and 63 determined total (t) STMN1 and STMN1 S16 phosphorylation (pSTMN1S16) are co-regulated by HGF/MET during cell cycle progression, pSTMN1S16 alone can promote cell proliferation, and pSTMN1S16 shortens the cell cycle similar to HGF treatment, while STMN1S16 dephosphorylation lengthens the cell cycle to arrest cell growth in G2/M, similar to HGF plus the MET inhibitor AMG337. Importantly, STMN1S16 does not promote metastasis. Conclusion: Selectively inhibiting STMN1S16 phosphorylation may provide an alternative strategy for inhibiting MET-mediated cell growth to eliminate metastatic cancer cells and inhibit further metastasis.
Keywords:
Stathmin 1 (STMN1)
; phosphorylation
; serine 16
; S16
; hepatocyte growth factor/scatter factor (HGF/SF)
; cell cycle
; prostate cancer
; breast cancer
; metastasis
1. Introduction
For all of the advances made in the treatment of cancer, one statistic remains unchanged – most deaths from solid tumors are caused by metastasis. The aggressive, systemic treatment of metastatic cancers like prostate and breast cancer consists of multiple approaches, including hormonal therapy, chemotherapy, targeted therapies, and/or immunotherapy [1,2]. Recent work on the role of the cell cycle in cancer growth provides evidence that instead of undergoing uncontrolled cell division, cancer cells are primarily compromised in their ability to exit the cell cycle and therefore continue to divide [3]. Taxane-based chemotherapies target microtubules during mitosis and interphase, causing stabilization of the mitotic spindle leading to arrest in mitosis and ultimately cancer cell death [4]. While taxanes showed an improvement in overall survival in metastatic (m) cancer, they are not curative [4,5].
Stathmin (STMN1), a phosphoprotein that modulates microtubule formation, is overexpressed in many cancers, including prostate and breast cancer [6,7]. Docetaxel (DTX) is a standard first-line chemotherapy for patients with metastatic castration-resistant prostate cancer (mCRPC), which binds to β-tubulin to promote microtubule assembly and stabilization of the mitotic spindle, resulting in G2/M arrest, apoptosis, and cell death [8,9]. While DTX treatment extends overall patient survival, mCRPC still develops drug resistance [8,9]. STMN1 itself is not a growth factor, however in response to growth factors and other factors, STMN1 facilitates cell division and cell motility by regulating spindle and microtubule formation via the differential phosphorylation of 4 STMN1 serines (S), S16, S25, S38, and S63 (reviewed in [10,11]. Phosphorylation inactivates STMN1, causing the release of α/β-tubulin dimers and making them available for spindle and microtubule formation [12]. STMN1 is reactivated through dephosphorylation to bind free α/β tubulin dimers to promote cell entry into a new interphase [13] or to cause the breakdown (i.e., catastrophe) of microtubules [12].
STMN1 overexpression has primarily been analyzed by gene expression profiling and immunohistochemical approaches, either in clinical cancer samples or cell lines; however, much less is known about the differential phosphorylation of the STMN1 serines and their functions in driving cancer progression and therapeutic resistance. Cell culture based studies investigating cell migration and invasion, and/or proliferation have focused on the phosphorylation of S16 [14,15] or S38 [16,17] alone, or in specific combinations of select serines such as S16+S38 [18], S16+S63 [19], S25+S63 [20], or all 4 serines [21-23]. While these studies provide insight into different aspects of STMN1 phosphorylation, our knowledge on how an individual serine regulates a specific STMN1 function, and how the phosphorylation status of the 3 remaining serines co-modulates that function is surprisingly lacking. Determining how the selective phosphorylation of STMN1 serines regulates cell growth or metastasis would provide much needed insight into why therapeutic strategies against cell division or metastasis often fail.
The tumor microenvironment produces key regulators of cancer growth and metastasis, including growth factors such as hepatocyte growth factor (HGF) [24]. HGF is a MET proto-oncogene/receptor tyrosine kinase ligand produced by cancer-associated fibroblasts secreted into the microenvironment, where it binds the MET receptor on cancer cells to activate MET signaling [24]. In DU-145 prostate cancer (PCa) cells, HGF is reported to increase proliferation; however, STMN1 phosphorylation was not evaluated in this seminal study [25]. Clinical studies report MET and HGF overexpression correlate with cancer progression and poor prognosis. In PCa, MET overexpression correlates with cancer progression [26,27], metastasis to bone and lymph nodes [28,29], and castration resistance [30]. Higher HGF plasma levels also correlate with metastatic PCa and decreased overall survival [31] and HGF expression is greater in PCa compared to benign prostate hyperplasia (BPH) [32]. Moreover, the increase in HGF is concomitant with increased MET expression [29]. Similarly, MET overexpression is observed in many other cancers, including breast cancer (BC) [33] where serum HGF levels increase with BC and are higher in patients with mBC [34]. Taken together, STMN1, HGF, and MET overexpression are associated with cancer progression; however, the mechanisms by which STMN1 overexpression promotes prostate and breast cancer are still unclear. As STMN1 function is regulated by its differential phosphorylation, the present investigation aimed to unravel the mechanism by which pSTMN1S16 regulates cell proliferation.
Given the complexity of STMN1 phosphorylation, and that pSTMN1S16 is primarily associated with cell proliferation [14,15], our approach was to determine the function of pSTMN1S16 on proliferation and metastatic potential, and how phosphorylation of the other three serines (S25, S38, and S63) coregulated pSTMN1S16 function. Herein we show that tSTMN1 levels and pSTMN1S16 are regulated by HGF/MET during the cell cycle and that pSTMN1S16 alone is a primary regulator of tSTMN1 expression, cell proliferation, and cell cycle progression, similar to that observed in response to HGF/MET signaling. Moreover, pSTMN1S16 predominantly regulates proliferation, as it does not initiate or increase metastatic potential.
2. Materials and Methods
2.1. Prostate and Breast Cancer Clinicogenomics
Four datasets from cBioPortal (RRID:SCR_014555) and two datasets from TCPA were queried for the clinicogenomic analysis in our study [35,36]. While PCa is a male-specific disease and BC occurs primarily in females, the most common metastatic sites for both cancer types include bone and liver [37]. Therefore, we postulated that STMN1, MET and HGF would exhibit similar expression profiles in metastatic PCa and BC. For PCa analysis, we selected the Fred Hutchinson Cancer Research Center study on prostate adenocarcinoma [38] with expression microarray (accession number GSE77930) and clinical annotations including metastatic organ sites, the TCPA reverse phase protein array dataset of prostate adenocarcinoma samples and breast invasive carcinoma, the SU2C-PCF Dream Team study on mCRPC [39] with clinical annotations and gene expression, and the Memorial Sloan Kettering study on prostate adenocarcinoma [40] with clinical annotations including metastatic organ sites, castration resistance status, and overall survival. Analyses included gene expression correlation (Spearman’s) gene expression comparison by site using one-way ANOVA, survival analysis using Kaplan-Meier plot with Log-Rank statistics, and gene expression comparison by chemotherapy treatment using Student’s t-test. Data was visualized using the R package ‘ggplot2’ v.3.5.1 in R version 4.3.0 [41,42]. For the BC analysis, we used the ROC Plotter tool (ROCplot, RRID:SCR_025347) and the filter selections ‘taxane chemotherapy treatment’ and ‘node positive nodal status’ to query the ROCplot dataset on breast cancer [43] for STMN1, HGF, MET, and STMN1/MET signatures. Of note was that a BC study with data on metastatic organ sites was not found, and therefore it was not possible to query individual metastatic organ sites for BC. Analyses were output as box-whisker plots and compared using Mann-Whitney test and receiver-operator characteristic plots with area-under-curve integration. Additional patient sample information is provided in Figure Legend 1 and the Results section.
2.2. Cells and Reagents
The DU-145 (ATCC # HTB-81, RRID:CVCL_0105) and NMuMG (ATCC # CRL-1636, RRID:CVCL_0075) cell lines were obtained from American Type Culture Collection. HGF (Cat. # 100-39H) was purchased from PeproTech. AMG-337 (Cat. # HY-18696) was purchased from MedChemExpress. Lipofectamine™ 2000 (Cat. # 11668019) was purchased from ThermoFisher Scientific. Polycarbonate track-etch (PCTE) membranes (pore size 8 µm, AP48) for the Neuro Probe chemotaxis chamber were purchased from Neuro Probe. Antibodies against STMN1, STMN1pS16, Cyclin A2, Cyclin B1, Cyclin D1, Cyclin E1, GAPDH, HGF, Met, pMET, and p21 are provided in Table S1. The pECFP-N1. STMN1 (a.k.a. stathmin-CFP; Addgene plasmid #86783; RRID:Addgene_86783) was purchased from Addgene. The pECFP-N1 empty vector was generated by deleting the STMN1 gene and sequence verified. The MISSION® pLKO.1-puro Non-Target shRNA control (Millipore Sigma, Cat # SHC016) and pLKO/shSTMN1 (Millipore Sigma, shRNA Clones, STMN1, TRC Clone ID: TRCN0000281292) plasmids were purchased from Millipore Sigma and characterized previously [44]. The STMN1 substitution mutations S16A, S16E, S25A, S25E, S38A, S38E, S63A, S63E, S(16,38)E, S(16)A/(25,38,63)E, S(16)E/(25,38,63)A, S(16,25,38,63)A, and S(16,25,38,63)E were generated using the Quikchange Lightning Site Directed Mutagenesis Kit (Agilent Part #210519) as per the manufacturer’s protocol. A diagram outlining the positions of the 4 serines and the nomenclature for all of the substitution mutations generated in this study is provided in Figure S3C, and the primer sequences for generating these substitution mutations are provided in Table S2.
2.3. qPCR
Forward and reverse primers for generating the STMN1 substitution mutations (Table S2) were designed using the Agilent QuikChange Primer Design program (RRID:SCR_025323). All plasmids were sequence-verified by the DNA Sequencing and Genotyping Core, Cincinnati Children’s Hospital Medical Center.
2.4. Cell Viability Assays
Cell growth assays were performed as published previously [44,45]. Briefly, cells were plated at 2x10⁴ cells/mL/well in 24-well plates in complete medium (Minimum Essential Medium with Earle′s Balanced Salts (Millipore Sigma, Cat. # 56419C) 10% fetal bovine serum (Cytiva HyClone™, Cat. # SH30071.03), 1% penicillin/streptomycin (Thermo Fisher Scientific, Cat. #: 15140122) overnight, followed by replacement of medium (serum free or 1% FBS as indicated) and incubation for 12-18 h. Cells were treated with fresh medium containing vehicle control or HGF -/+ AMG-337 for 72 h and viable and non-viable cell numbers were determined (Trypan Blue Exclusion Test of Cell Viability, Thermo Fisher Scientific, Cat. # 15250061).
2.5. Transfection Assays
Transfection assays were performed as published previously [44,45]. DU-145 and NMuMG cells were transfected with a control plasmid (pECFP-N1 empty vector control or pLKO.1-puro Non-Target shRNA control), pECFP-N1.STMN1 (wt human STMN1), pLKO.1/shSTMN1, or pECFP-N1.STMN1 containing a STMN1 serine substitution mutation using a standard Lipofectamine 2000 protocol (Invitrogen). Cells were treated with vehicle control or HGF -/+ the MET inhibitor AMG-337 as indicated and harvested for analysis.
2.6. Doubling Time Assays
DU-145 and NMuMG cells were transfected prior to synchronization, then synchronized using double thymidine block to obtain >75% in early S phase [46,47] and plated at 7.5x10⁴ cells/well in 24-well plates. The following day, cells were treated as indicated, harvested each day for 6 consecutive days, and viable and non-viable cells were counted (Trypan Blue Exclusion Test). The protocols for establishing double thymidine block and cell treatment are outlined in Figure S3.
2.7. Migration and Invasion Assays
The Neuroprobe migration and invasion assays, using non-coated and Corning® Matrigel® Growth Factor Reduced (GFR) (Life Sciences, Cat. #354230)-coated membranes respectively, were performed as described previously [44].
2.8. Western Blot Analysis
Cells (asynchronous or synchronized as indicated) were harvested using RIPA buffer (Invitrogen Inc., Cat. # R0278;) with 1% protease inhibitor cocktail (Thermo Fisher Scientific, Cat. # NC0939492;) and phosphatase inhibitor cocktail (Thermo Fisher Scientific, Cat. # 53-913-110VL;), cellular debris was removed, and protein concentrations were quantified (BCA protein assay, Abcam, Cat. # 102536). Proteins were separated by 10% SDS-PAGE (40 or 50 µg protein/lane), transferred to polyvinylidene difluoride membrane, and blocked for 1h at room temperature in 3% non-fat dry milk in Tris buffered saline/0.1% Tween. Membranes were probed with primary antibody at 4oC overnight. Peroxidase conjugated secondary antibody was added at a 1:10,000 dilution for both rat and mouse antibodies, and blots were developed using an Enhanced Chemiluminescence kit (Pierce/Thermo Fisher Scientific, Cat # 32132). For each experiment, the membranes were placed into the same container and probed in sequence, first with phospho-antibodies followed with antibodies to total protein, and lastly with GAPDH (as indicated in the Figure legends). Antibodies and dilutions are listed in Table S1. Nocodazole (Thermo Fisher Scientific, Cat # AC358240100) was selected as a positive control for STMN1S16 phosphorylation, since companies use Nocodazole to validate their anti-pSTMN1S16 antibodies (e.g., Thermo Fisher Scientific, Cat. # PA5-17091, RRID:AB 10979092) on Western blots.
2.9. Flow Cytometry
Cells were harvested, washed 1x in cold PBS, and fixed with 1:2 cold PBS:Ethanol for at least 2 h at 4oC. PBS:Ethanol was removed by centrifugation and cells were resuspended in 1 mL cold PBS followed by the addition of 1 µL RNase A (Thermo Fisher Scientific, Cat. # EN0531), a 30 min incubation for 30 min at 37oC, and addition of 100 µL Propidium Iodide (PI; Thermo Fisher Scientific, Cat. # P1304MP) to stain cell nuclei. Stained cells were sorted using the Luminex Guava® Flow Cytometer and sample readouts were analyzed using FlowJo v.10 software, RRID:SCR_008520 to create cell cycle distribution histograms for analysis.
2.10. Quantification and Statistical Analysis
Statistical analysis and quantification of significant differences between experiments with multiple treatments were analyzed using one-way ANOVA applying Dunnett’s post-hoc correction for multiple comparisons in GraphPad Prism version 9.4.0 (RRID:SCR_002798). Number of culture plates or wells/treatment, n=4. Number of repeats per assay, n≥3.
3. Results
3.1. Increased STMN1 Is Associated with Increased MET and HGF in mCRPC
A microarray dataset from PCa tissues and mCRPC lesions found in liver, adrenal gland, lung, lymph node, bone, peritoneal cavity, and bladder sites acquired by rapid autopsy (171 tumors from 63 men) [38] was analyzed to determine whether STMN1 correlated with MET and HGF gene expression. All patients received androgen-deprivation therapy, and following disease progression, most patients also received at least one additional AR pathway-targeted agent (most commonly bicalutamide and flutamide), and at least one systemic chemotherapy (most commonly DTX) [38]. We determined a positive correlation between STMN1 and MET expression (p=0.0001), implying that STMN1 and MET gene expression were co-regulated (Figure 1A). At the translational level in an independent Prostate Adenocarcinoma cohort (350 tumors) from The Cancer Proteome Atlas (TCPA) consortium [48,49], reverse phase protein array analysis demonstrated that STMN1 protein expression and phosphorylated MET-pY1235 protein expression showed a strong positive correlation (p = 2.2e-16) (Figure 1B). Similar results were observed in a TCPA Breast Cancer cohort (876 tumors; Figure 1C). Together, these observations imply that the STMN1 and MET proteins are stronger indicators of a positive correlation than their gene expression. In addition, STMN1, MET, and HGF were expressed at similar levels in primary PCa tissues and mCRPC lesions in bone, adrenal gland, lung, lymph node, peritoneum, and bladder (Figure 1D-1F), inferring that the levels of STMN1, MET, and HGF expression were independent of any observed tumor heterogeneity between men.
3.2. Increased STMN1 and HGF Expression Is Associated with Liver Metastasis and Decreased Overall Survival
When STMN1, MET, and HGF expression in mCRPC lesions in liver were compared to the other metastatic sites, STMN1 (p=0.001) and HGF (p=0.05), but not MET expression were higher in mCRPC lesions in the liver (Figure1D-1F). Whether the levels of STMN1, MET, and HGF gene expression are interdependent remains to be established. However, an increase in STMN1 and HGF expression in metastatic liver lesions (Fig 1D-F) could correlate with MET via function, in that increased HGF would likely increase MET phosphorylation which, in turn, would phosphorylate STMN1 to regulate its activity. To further define the association of STMN1 with PCa mortality, we analyzed a SU2C-PCF Dream Team dataset comprising of gene expression and survival data from a cohort of 81 patients with mCRPC [39] and stratified them based on median STMN1 gene expression. This analysis revealed that mCRPC patients with high STMN1 expression had a poorer overall survival (median of 17.71 months, p = 0.011) compared to those with low STMN1 expression (median of 33.02 months; Figure 1G). In a second dataset from the Memorial Sloan Kettering cohort providing survival parameters for mCRPC patients [40], stratification of a castration resistant subset of 240/424 patients with mCRPC based on the presence of liver metastases showed a poorer median overall survival of 23.23 months (p = 0.00096) in patients with liver metastases compared to patients with other types of metastases (median overall survival of 61.37 months; Figure1H). Together, these observations imply that STMN1 gene expression promotes mCRPC progression and plays a significant role in patient mortality. Additionally, the liver provides a favorable microenvironment for the establishment of metastatic lesions having high HGF and STMN1 expression levels.
We next examined STMN1 expression in mCRPC samples from patients treated with/without chemotherapy in the Memorial Sloan Kettering cohort [40], primarily DTX which targets microtubule dynamics (a cellular function regulated by STMN1). Unexpectedly, HGF expression was greater (p=0.001) in patients receiving chemotherapy after androgen deprivation therapy (ADT) and second-line therapy (e.g., bicalutamide or flutamide) as compared to those receiving ADT only (Figure1I), suggesting that chemotherapy may upregulate HGF gene expression.
3.3. STMN1 and MET Predict Response to Taxane Chemotherapy in Node-Positive BC Patients
Since taxanes are commonly used to treat other hormonally dependent cancers, we also analyzed the link between STMN1, HGF, MET, and STMN1/MET gene expression signatures and taxane treatment response in a mBC patient cohort using the ROCplot dataset on BC [43]. Interestingly, STMN1 (p=0.0073) and MET (p=0.031), but not HGF, expression was higher in patients who remained unresponsive to paclitaxel (Figure1J-1L). Moreover, STMN1 and MET, but not HGF, expression showed capacity to predict taxane response in node-positive BC patients (AUC=0.632 and AUC=0.606, respectively) and a combined signature improved this score (AUC=0.654), whereas HGF showed no discernable predictive capacity (Figure1M-1P). mBC biopsy specimens from different metastatic sites were not available; therefore, a comparison of HGF gene expression following chemotherapy or STMN1, MET and HGF expression levels between different metastatic sites could not be done.
Together, the mCRPC and mBC studies suggest when STMN1 and MET expression are high, response to taxane chemotherapy is poor; and while responsiveness to taxane is similar, the effectors promoting this response may be selective, as seen by STMN1 and HGF expression being higher in mCRPC, while STMN1 and MET are higher in mBC. Moreover, subdividing patients with mCRPC (which highly express STMN1) further into “high” and “low” STMN1 subgroups could serve as a prognostic indicator of overall survival in these group of patients. Since the co-regulation of STMN1 with HGF and MET protein expression is indicative of a coordinated mechanism, the differential phosphorylation of STMN1 was evaluated to determine its impact on cancer progression and metastasis.
3.4. STMN1S16 Phosphorylation and Cell Proliferation Are Regulated by HGF/MET
STMN1S16 phosphorylation is associated with cancer cell proliferation [15] and HGF is a stromal cell growth factor that promotes DU-145 PCa cell proliferation [25]. Therefore, the following experiments were performed to determine the impact of HGF/MET activity on proliferation and phosphorylation of MET and STMN1. In asynchronized DU-145 cells, HGF promoted DU-145 cell proliferation similar to that reported by Humphrey et. al [25], and growth was optimal at 25 ng/mL HGF (p<0.01) (Figure 2A). In addition, cells maintained a classic cobblestone-like morphology [Figure S1 and [44]]. In contrast, proliferation decreased at 40 ng/mL HGF (p<0.001); however, cells remained viable and exhibited a spindle shape-like morphology reminiscent of the scatter factor properties of HGF [25]. Therefore, 25 ng/mL HGF was used in subsequent experiments to ensure that cells exhibited typical DU-145 proliferation and contact inhibition characteristics. In addition, cell growth decreased (p<0.001) when cells were treated with HGF and 100 ng/mL AMG337 [50], a highly selective small-molecule inhibitor of MET in advanced solid tumors (Figure 2B).
Analysis of HGF-mediated MET phosphorylation (pMET) determined that pMET was induced at 5 min post HGF treatment and peaked at 180 min (~132- and 180-fold increase over control, respectively), and AMG337 inhibited MET phosphorylation to nearly undetectable levels (Figure 2C, 2D). Similarly, HGF induced pSTMN1S16 at 5 min (~398-fold increase over control), with peaks at 30 min (~815-fold increase over control) and 90 min (~1,107-fold increase over control), and as above, AMG337 inhibited pSTMN1S16 to nearly undetectable levels (Figure 2C, 2G). In contrast, HGF did not regulate tMET (Figure 2E) or tSTMN1 (Figure 2F) levels; however, in the control groups, tMET levels appeared modestly biphasic, while tSTMN1 levels decreased over 30 min and did not return to basal control levels by 180 min. Together, these observations imply that in asynchronous cells, basal tMET and tSTMN1 levels were modulated over time, and that HGF primarily regulated cell proliferation and pMET and pSTMN1S16 in a time-dependent manner.
Ca2+/calmodulin-dependent protein kinase II (CaMKII) is a primary kinase known to phosphorylate STMN1S16 to regulate spindle and microtubule formation in different cell types, including Jurkat T, HeLa, HepG2, and MCF7 cells [10,19,51]. However, others have reported that CAMKII does not phosphorylate STMN1S16 in K562 cells [52]. Therefore, to determine whether oleic acid promoted STMN1S16 phosphorylation in PCa cells, DU-145 cells were treated with a primary CaMKII activator, oleic acid. Nocodazole, an established inducer of STMNS16 phosphorylation, was also used as a positive control, (a standard established by companies such as Thermo Fisher, Cell Signaling Technology, and Abeomics, to validate their phosphorylated STMNS16 antibodies). Oleic acid had no effect on phosphorylating STMN1S16, while nocodazole increased pSTMN1S16 in a dose dependent manner, indicating that CAMKII activity did not phosphorylate pSTMN1S16 (Figure S2). Together, these findings imply that CaMKII-mediated STMN1 phosphorylation is cell/tissue-specific.
3.5. Both pSTMN1S16 and tSTMN1 Levels Are Modulated by HGF/MET During Cell Cycle Progression
To determine the impact of HGF/MET on cell doubling time, DU-145 cells were synchronized in early S phase using double thymidine block as outlined in Figure S3 [46,47,53]. Treatment with HGF shortened cell doubling time to 22.7 h (p<0.01), while addition of HGF+AMG337 lengthened doubling time to 32.4 h (p<0.01) as compared to the vehicle control group (25.2 h) (Figure 3A). When cells were treated with HGF, flow cytometric analysis showed that the % phase distribution of cells in the second S phase at 12 h was similar to that in the first S phase at 0 h when cells were released from the double thymidine block, indicating that HGF-treated cells had completed one cell cycle within 12 h (Figure 3B). Furthermore, analysis of the individual time points revealed that HGF shortened the cell cycle by 4 h compared to the vehicle control group, with cells entering G2/M at 1 h, exiting into G1 at 8 h, and entering the second S phase at 12 h. In contrast, HGF+AMG227 lengthened the cell cycle by extending the S phase to 6 h, with cells entering into G2/M at 8 h and remaining arrested in G2/M at 12 h. In addition, the % phase distribution of cells in G1 remained relatively constant during this time period.
pSTMN1S16 and tSTMN1 protein levels were also determined during cell cycle progression. In the vehicle control group, pSTMN1S16 was detected at low levels during G2/M and G1 (Figure 3C, 3D). However, after treatment with HGF, pSTMN1S16 was detected at 1 h as cells entered G2/M and remained phosphorylated throughout G2/M as expected for mitosis [54], and then increased as cells exited into G1 at 8h (Figure 3F, 3G). In addition, a higher molecular weight band appeared during G1 and decreased as cells entered into the second S phase. At least twelve increasingly phosphorylated STMN1 isoforms have been identified; therefore, the higher bands likely contain other phosphorylated serines (i.e., S25, S38, and/or S63) in addition to pSTMN1S16 [12,52,55]. In contrast, the addition of AMG337 inhibited the HGF-induced pSTMN1S16 (Figure 3I, 3J).
In contrast, in the control group, tSTMN1 was initially detected in S phase at 1 h following release from thymidine block, with a modest decrease at 4 h when entering G2/M before increasing at 6 h to a constant level through G1 (Figure 3C, 3E). With HGF treatment, tSTMN1 was already detected in S phase at 0 h, and levels increased in G2/M, followed by a decrease most likely due to the increase in pSTMN1S16 isoforms observed in G1 (Figure 3F, 3H). The addition of AMG337 inhibited tSTMN1 expression to nearly undetectable levels throughout the extended S phase and into early G2/M at 8 h, followed by a rise at 10-12 h (Figure 3I, 3K). Interestingly, tSTMN1 expression was low/absent at 0 h in S phase in the control group and during the extended S phase of HGF+AMG337 the group, suggesting that inhibition of tSTMN1 was required to maintain extended S phase.
Collectively, these observations imply that HGF/MET promotes pSTMN1S16 in G2/M, the phase in which STMN1 phosphorylation is required to promote mitosis [54], and that additional serines are phosphorylated to exit into G1. While tSTMN1 overexpression is reported to prevent mitotic spindle formation in early mitosis [13], the role of over phosphorylation by HGF treatment remains an avenue to be explored. A possible role of HGF-induced over phosphorylation of STMN1S16 may be to disrupt mitosis and facilitate the rapid re-entry of cells into the second S phase. In addition, tSTMN1 is upregulated with HGF treatment. Whether the modulation in tSTMN1 levels is due to HGF/MET-regulated transcription or changes in protein stability/degradation remain to be established.
3.6. Cyclins and p21 Are Concomitantly Regulated by pSTMN1S16.
Since growth factors regulate cyclins to facilitate progression into S phase [24], and HGF promotes cell proliferation and regulates STMN1S16 phosphorylation, synchronized DU-145 cells were treated with vehicle control or HGF ± AMG337, and cyclin protein levels were analyzed. In the control group, expression of the cyclins was typical of that expected during cell cycle progression (Figure 4A, 4C). Cyclin E1, a regulator of entry into S phase, increased modestly until 4 h and then decreased gradually in G2/M through G1. Cyclin A2, a regulator of S phase and mitotic entry, increased during S into G2/M and decreased late in G2/M into G1. Cyclin B1, a regulatory protein involved in mitosis, increased to peak later in G2/M at 8 h, and Cyclin D1, which regulates transition from G1 to S phase, increased in the latter half of G2/M through into G1, but did not transition into a second phase in the absence of growth factor activity.
In contrast, HGF promoted cell cycle progression, resulting in a time-dependent rise in cyclin E1 levels through S phase, and in parallel, a decrease in cyclin D1 levels from entry into G/2M through to re-entry into the second S phase (Figure 4A, 4E). In contrast, cyclin A2 and cyclin B1 levels remained constant through G/2M, with cyclin A2 decreasing in the second S phase. An exception was the downregulation of cyclin B1 expression to a low level at 8 h, followed by a dramatic peak in expression in G1 at 10 h. These observations suggest that high cyclin B1 levels in combination with low cyclin D1 expression in G phase could drive the rapid progression of cells into the second S phase. Furthermore, the addition of the AMG337 inhibitor blocked cell cycle progression in G2/M, with cyclin E1 expression rising in S phase and remaining fairly high in G/2M, while cyclin A2 and cyclin D1 levels remained relatively unchanged in the extended S phase, with cyclin D1 showing a modest peak at 10 h (Figure 4A, 4G). Importantly, cyclin B1 decreased in the S phase and only showed a modest peak at 10 h compared to that seen in HGF-treated cells.
We also analyzed p21, a cell cycle inhibitor that mediates cell cycle arrest in G1 [56]. In vehicle control treated DU-145 cells, p21 expression was expressed in S phase following release of the double thymidine block and increased during G2/M (4-6 h) followed by a decrease to undetectable levels in G1 (Figure 4B, 4D). The addition of HGF decreased p21 expression to below detectable levels in S phase, with p21 levels remaining lower during G2/M compared to vehicle control and decreasing again in G1 and the second S phase (Figure 4B, 4F). The addition of HGF+AMG337 caused p21 expression to increase throughout the extended S phase and decreased in G2/M with (Figure 4B, 4H). Together these observations imply that HGF downregulates overall p21 expression to shorten the cell cycle, while the addition of AMG337 increased p21 expression to block DU-145 cells in G2/M.
3.7. pStathminS16 Alone Is Sufficient for Regulating Cell Cycle Progression and Growth
A series of plasmids expressing S16, S25, S38 and S63 to alanine (A) or glutamic acid (E) substitution mutations to mimic dephosphorylation and phosphorylation respectively (Figure S3C, Table S2), were generated to investigate the function of S16 phosphorylation alone, or in combination with S25, S38, and/or S63 phosphorylation, in regulating cell proliferation. STMN1S16E mimicking S16 phosphorylation increased cell proliferation (p<0.001), while STMN1S16A mimicking S16 dephosphorylation decreased cell proliferation (p<0.01) as compared to several controls, including a pECFP empty vector control, a pECFP vector expressing wildtype (WT) STMN1, and an UT (untransfected) control group (Figure 5A). Our previous study characterized STMN1 knockdown using shSTMN1 [44]. Since STMN1 phosphorylation inactivates STMN1 function [12,13], we transfected DU-145 cells with the shSTMN1 plasmid to determine whether knocking down STMN1 protein inhibited DU-145 cell proliferation. As seen in Figure 5A, shSTMN1 decreased cell proliferation (p<0.001) compared to a pLKO.1 vector control (containing scrambled RNA). In addition, the 4E mutant where all 4 serines were substituted with E to mimic total phosphorylation also inhibited cell growth (p<0.01) similar to that observed for shSTMN1, implying that 4E acted as a functional knockdown. In contrast, the 4A mutant representing activated STMN1 where all 4 serines were dephosphorylated did not significantly affect cell proliferation.
We also compared the activities of the other 3 serines to STMN1S16E (a.k.a., S16E) and determined that only S38E, but not S25A, S25E, S38A, S63A, or S63E increased cell proliferation (p<0.01; Figure 5B). This finding was expected as cyclin dependent kinase 1 (CDK1) phosphorylates STMN1S38 [10,11]. Taken together, these observations suggested that STMN1S16E regulated cell proliferation and that STMN1S38E could participate in this process. Therefore, STMN1S16E and STMN1S38E expression were analyzed in combination using cell doubling time to determine whether both serines were essential for promoting cell proliferation. In synchronized cells, STMN1S16E shortened doubling time by 2.6 h (p<0.01) while STMN1S(16,38)E shortened doubling time by 3.1 h (p<0.01) compared to the pECFP control; however, these doubling times were not statistically different (p=1.0) (Figure 5C). In contrast, STMN1S16A lengthened cell doubling time by 2.6 h (p<0.01) compared to the pECFP control, and pLKO.1/shSTMN1 lengthened doubling time by 5.8 h (p<0.01) compared to the pLKO.1 control.
In addition, flow cytometric analysis using synchronized cells transfected with STMN1S16E, STMN1S16A, or shSTMN1 was performed and compared to vector controls and untransfected cells treated with vehicle, HGF, or HGF+AMG337 (in Figure 3B) to determine whether STMN1S16E or STMN1S16A activated or inhibited cell cycle progression. Cells expressing STMN1S16E entered G2/M at 1 h, exited into G1 at 8 h, and entered the second S phase at 12 h (Figure 5D), thus shortening the S phase by 4 h, similar to that observed in HGF-treated cells (Figure 3B). In contrast, cells expressing STMN1S16A delayed entry into G2/M by 4 h and the cells were arrested in G2/M at 12 h (Figure 5D), similar to that observed in HGF+AMG322 treated cells (Figure 3B). In shSTMN1 expressing cells, STMN1 knockdown promoted entry into G2/M at 2 h, and cells remained arrested in G2/M at 12 h, similar to that observed in STMN1S16A expressing cells and HGF+AMG322 treated cells.
Collectively, these data imply that STMN1S16 phosphorylation is a key regulator of cell cycle progression. In addition, STMN1S38 phosphorylation is secondary to STMN1S16 phosphorylation since combining STMN1S38E with STMN1S16E does not increase doubling time over that observed with STMN1S16E alone, and phosphorylation of all 4 serines (4E) act as a STMN1 functional knockdown, similar to that observed with shSTMN1.
3.8. STMN1S16E and STMN1S16A Modulate tSTMN1, Cyclins, and p21 Levels
To determine whether STMN1S16 phosphorylation modulated tSTMN1 expression, cells were transfected with STMN1S16E or STMN1S16A and synchronized as outlined in Figure S3B. Untransfected cells treated with vehicle, HGF, or HGF+AMG337 in Figure 3 served as controls for tSTMN1 expression to determine whether STMN1S16E or STMN1S16A regulated tSTMN1 expression levels. When cells expressed STMN1S16E, tSTMN1 was detected at low levels in S phase (at 0 h), increased during G2/M, and decreased back down to low levels in G1 and entry into the second S phase (Fig 6A, 6B), similar to that observed for untransfected HGF-treated cells (Figure 3F, 3H), albeit at a lower amplitude. When STMN1S16A was expressed, tSTMN1 was detected at 1 h and remained modestly higher up to 6 h followed by a slight decrease at 8 h onward (Figure 6A, 6C), in a pattern similar to that in untransfected vehicle control cells (in Figure 3C, 3E). However, a key difference was that the time STMN1S16A cells spent in S phase was shifted to the right by 4 h, resulting in G2/M arrest, whereas vehicle control cells exited into G1 at 10 h, demonstrating that dephosphorylation of S16 (as represented by S16A) was sufficient to prevent STMN1S16A cells from completing the cell cycle. A further difference was that while STMN1S16A cells were arrested in G2/M similar to that observed in untransfected HGF+AMG337 cells (Figure 3I, 3K), tSTMN1 expression in STMN1S16A cells was considerably higher during the S phase compared to HGF+AMG337 cells where tSTMN1 levels only increased during G2/M, implying that STMN1S16A deregulated tSTMN1 expression.
In addition, cells were transfected with STMN1S16E or STMN1S16A and synchronized as outlined in Figure S3B and untransfected cells treated with vehicle, HGF, or HGF+AMG337 in Figure 4 served as controls for cyclin and p21 expression to determine whether STMN1S16E or STMN1S16A regulated their expression and activated or inhibited cell cycle progression. A key observation was the length of the cell cycle for STMN1S16E cells (Figure 5D) and untransfected cells treated with HGF (Figure 3B) were the same, with cells completing the cycle and entering the next S phase at 12 h. In STMN1S16E cells, the pattern of cyclin A2 expression (Figure 6D, 6E) was similar to that in untransfected cells treated with HGF (Figure 4A, 4E). Cyclin B1 expression was also similar to that in untransfected cells treated with HGF; and while the peak of expression shifted to 6 h (G2/M) compared to 10 h (G1) in the HGF-treated cells, the length of the STMN1S16E cell cycle remained the same as that of cells treated with HGF. One difference between S16E expression and HGF treatment was that cyclin E1 expression in STMN1S16E cells was high and remained fairly constant throughout the cell cycle whereas in HGF-treated untransfected cells, cyclin E1 was low in S where it increased steadily through S and G2/M with the highest levels in G1 as would be expected for the cyclin E1-mediated transition from G1 to S-phase [57]. Another difference was that the regulation of cyclin D1 expression in STMN1S16E cells was more typical of a normal cell cycle [58], with cyclin D1 levels low during S phase, increasing during G2, remaining high in G1, and then decreasing back down in the second S phase; while in HGF-treated untransfected cells, cyclin D1 decreased in the latter half of G2/M through exit into G1.
Another key observation was that the length of the STMN1S16A cell cycle (Figure 5D) was the same as that of untransfected cells treated with HGF+AMG337 (Figure 3B) where cells in both groups were arrested in G2/M. In STMN1S16A cells (Figure 6D, 6F), cyclin A2 and cyclin E1 expression was similar to that of untransfected HGF+AMG337 treated cells (Figure 4A, 4G). Likewise, the pattern of cyclin B1 expression was similar to untransfected HGF+AMG337 treated cells, albeit at a lower amplitude, while cyclin D1 expression appeared elevated compared to untransfected HGF+AMG337 treated cells.
We also analyzed the impact of STMN1S16 phosphorylation status on p21 expression. The pattern of p21 expression in STMN1S16E cells during the cell cycle (Figure 6G, 6H) was similar to that of p21 in HGF-treated cells. In STMN1S16A cells, the pattern of p21 expression during the cell cycle was similar to that observed in HGF+AMG337 treated cells (Figure 6G, 6I). Of note is that while the pattern of p21 expression in these groups was similar, the overall amplitude of p21 expression was higher in STMN1S16E and STMN1S16A cells, compared to the HGF and HGF+AMG337 cells respectively, suggesting that the selective modulation of S16 phosphorylation increased overall p21 levels.
Collectively, the modulation of tSTMN1, the cyclins and p21 during cell cycle progression, as well as the length of the cell cycle are sufficiently similar to group S16 phosphorylation (represented by STMNS16E) with HGF treatment, and S16 dephosphorylation (represented by STMNS16A) with HGF+AMG337 treatment. Together, these observations indicate that the S16 phosphorylation signature alone could impact the rate of cell proliferation by regulating tSTMN1, cyclins A2, B1, D1, and E1, and p21 expression.
3.9. pSTMN1S16 Regulates Cell Proliferation but Not Metastatic Potential
Since HGF and MET play important roles in cancer growth and metastasis [24,26,27], and STMN1S16 phosphorylation is regulated by HGF/MET signaling, the NMuMG and DU-145 cell lines were used to determine the impact of STMN1S16 phosphorylation on cell growth, migration, and invasion. In contrast to the breast cancer cell lines, the NMuMG mammary gland cell line will undergo epithelial mesenchymal transition (EMT) [59], and they express the MET receptor [60] and low STMN1 levels required to undergo EMT [44]. Similarly, DU-145 cells express the MET receptor, and they undergo EMT when STMN1 levels are low/knocked down [44]. In addition, DU-145 cells only exhibit moderate metastatic potential under basal conditions, allowing for the analysis of factors that promote or inhibit metastatic potential using the same cell line [44,61]. Therefore, these lines were selected to investigate the impact of modulating STMN1S16 phosphorylation alone or in combination with other serines on cell growth, migration, and invasion.
NMuMG cells were transfected with plasmids expressing STMN1S16E or STMN1S16E(3A) to determine whether dephosphorylation of the other three serines (S25, S38, S63) modulated the effect of S16 phosphorylation (Figure 7A). Cells were also transfected with STMN1S16A or STMN1S16A(3E) to determine whether the phosphorylation of the other three serines modulated the effect of S16 dephosphorylation. Controls included untreated cells and cells transfected with empty vector and cells treated with vehicle. STMN1S16E and STMN1S16E(3A) expression promoted NMuMG cell proliferation, while STMN1S16A or STMN1S16A(3E) expression inhibited cell proliferation (p<0.01). Similar results were observed when DU-145 cells were transfected with the same plasmids for comparison (p<0.001) (Figure 7B), confirming that S16E promoted proliferation, S16A inhibited proliferation, and activating (3A) or inhibiting (3E) the other serines in combination with S16E or S16A respectively did not alter S16-mediated activity. Analysis of doubling time showed that NMuMG cell doubling time decreased by 1.6 h in cells expressing STMN1S16E and increased by 2.4 h in cells expressing STMN1S16A (Figure 7C). While NMuMG doubling time did not reach statistical significance, the trend was similar to that observed in DU-145 cells (Figure 5C).
In addition, DU-145 and NMuMG were transfected with STMN1S16E or STMN1S16A and analyzed in migration and invasion assays to determine whether S16 phosphorylation also regulated metastatic potential. Untreated cells, vehicle-treated cells, and cells transfected with empty vector and treated with vehicle served as baseline controls, while NMuMG cells transfected with shSTMN1 served as a positive invasion control (Figure 7D) [44]. Given that DU-145 cells exhibited moderate metastatic potential under basal culture conditions [44,61], it was not surprising that DU-145 cells in the control groups migrated readily through the membrane; however, transfection with STMN1S16E or STMN1S16A did not alter the rate of DU-145 cell migration (Figure 7E, Figure S4). Similarly, NMuMG cells showed low basal migration; however, transfection with STMN1S16E or STMN1S16A did not alter basal migration rates (Figure 7G). In addition, DU-145 and NMuMG cells expressing STMN1S16E or STMN1S16A did not show induced invasion through the Matrigel-coated membrane (Figure 7F, 7H), as compared to the shSTMN1 control, suggesting that STMN1S16 did not modulate metastatic potential. Together, these observations imply that pSTMN1S16 alone is sufficient to regulate NMuMG and DU-145 cell proliferation, and that pSTMN1S16 is not required to regulate metastatic potential.
4. Discussion
Our study provides evidence from clinical mCRPC and mBC studies that STMN1 and MET expression are co-regulated at a transcriptional and translational level, with STMN1 and MET proteins being stronger indicators of a positive correlation than their gene expression; and that response to taxane chemotherapy is poor when STMN1 and MET expression are high. In mCRPC patients who already express high levels of STMN1, further dividing them into “high” and “low” subgroups appears to be a more accurate prognostic indicator of overall survival. Further, STMN1 and HGF levels are highest, and overall survival is poorest in mCRPC to the liver compared to bone and other metastatic sites combined.
While bone remains the most common metastatic site for PCa, liver metastasis has gained considerable attention due to its increased incidence [62-64]. Liver metastasis appears more resistant to therapy, with a worse median survival of 13.5 months compared to 21.3 months for bone metastases [62]. Our findings substantiate these statistics, wherein patients with mCRPC to the liver had a median overall survival of 23.23 months (p = 0.00096) in patients with liver metastases compared to patients with other types of metastases (median overall survival of 61.37 months) (Fig.1H), further emphasizing liver as a more lethal metastatic site. A recent study reported that the pattern of metastatic spread impacted the combinatorial efficacy of enzalutamide and ADT, since this treatment appeared less effective in men with visceral metastases compared to those with bone or lymph node metastases [65]. These clinical observations imply that the metastatic microenvironment plays a broader role in supporting cancer cell survival and metastasis under adverse therapeutic-induced conditions.
Many clinical studies, including those in Fig. 1, employ ‘omics approaches such as microarray, RNA seq, and proteomics to determine gene or protein expression. Thus, a positive correlation between STMN1, MET, and HGF expression and metastasis, responsiveness to taxane, and overall survival in prostate and breast cancer patients is based on total STMN1 expression within these tumors [66-68]. However, in addition to primarily epithelial-derived cancer cells, solid tumors contain numerous other cell types that express STMN1, including cancer-associated fibroblasts (CAFs) [69], endothelial, and immune cells [70]. We reported that freshly isolated primary prostate cancer (PCa) cells from patient prostate cancer (PCa) biopsy specimens and the NMuMG cell line expressed low endogenous levels of STMN1, and that these cells exhibited increased metastatic potential in vivo and in vitro respectively [44]. Moreover, knocking down STMN1 expression in DU-145 cells using a shRNA approach also increased metastatic potential [44]. Collectively, these observations imply different tumor cell types express varying levels of STMN1, and analysis of STMN1 expression and function at the cellular level would be more reflective of the role STMN1 plays in promoting tumor growth and metastasis.
As most studies typically use tSTMN1 as a predictor of progression, the expression levels of tSTMN1 do not substantively represent the impact of its phosphorylation-mediated biological activity in CRPC and metastasis. For instance, while an increase in tSTMN1 expression is associated with poorer disease-free survival [66-68], the phosphorylation signatures of STMN1 may predict therapeutic responsiveness to paclitaxel. For example, STMN1 phosphorylation on S16 or S63 was strongly associated with improved disease-free survival, while phosphorylation on S25 or S38 was associated with poorer disease-free survival in patients with luminal subtype breast cancer [68]. The taxanes paclitaxel and docetaxel stabilized microtubules and induced cell cycle arrest at the G2/M phase [71], and the paclitaxel-induced phosphorylation of S16 stabilized microtubules and induced apoptosis and cell death in the acute lymphoblastic leukemia (ALL) Jurkat and Namalwa cell lines [14]. Our study showed that pSTMN1S16 regulated both prostate cancer and mammary gland cell growth, but did not increase metastatic potential (summarized in Fig. 7H). Moreover, STMN1S16A also arrested cells in G2/M similar to that reported for taxane treatment [71], implying that the S16 phosphorylation signature could predict therapeutic responsiveness. Together, these studies support the concept that selectively modulating STMN1S16 phosphorylation could prevent or block taxane resistance or extend the period of responsiveness to taxane-based therapies.
We observed that tSTMN1 expression and STMN1S16 phosphorylation were both regulated by HGF/MET signaling, and that inhibition of MET decreased tSTMN1 expression. Determining the mechanisms by which HGF/MET regulates tSTMN1 gene or protein expression was beyond the scope of this study; however, since MET also regulates gene transcription [72], we would predict that inhibition of MET would inhibit MET-mediated transcriptional activity, thereby decreasing STMN1 gene transcription and protein levels and concomitantly increasing the levels of soluble tubulin available for microtubule formation. Only a few regulators of STMN1 gene transcription have been identified to date. Forkhead box M1 (FoxM1) directly regulates STMN1 gene transcription to overexpress tSTMN1 and confer resistance to paclitaxel in SKBR3 breast cancer cells [73]. In addition, p53 mutations or loss of p53 expression derepress STMN1 gene transcription, resulting in tSTMN1 overexpression [74]. Mutagenesis of E2F Transcription Factor 1 (E2F1) binding sites in the STMN1 gene decreased STMN1 mRNA and protein levels [75]. Another putative mechanism for decreasing tSTMN1 protein levels could be via post-translational modification, e.g., phosphorylation [76]. A study by Gradin et al. reported that STMN1S16 phosphorylation was associated with the partial degradation of tSTMN1 protein, and that down-regulation of tSTMN1 increased polymerized tubulin and microtubule formation in K562 cells [52]. Whether the HGF/MET-mediated regulation of tSTMN1 occurs via transcription or protein degradation remains to be determined.
In the seminal study on HGF function in PCa cells, Humphrey et. al. reported that DU-145 cell proliferation increased in response to HGF treatment [25]; however, STMN1 phosphorylation was not evaluated. Indeed, most studies on the HGF/MET-mediated phosphorylation of STMN1 have not used prostate cancer cell lines, nor have they investigated in detail the regulation of both tSTMN1 and STMN1 phosphorylation during cell cycle progression. One study reported that in Jurkat T, HeLa, and K562 cells, the dual phosphorylation of STMN1S25 and STMN1S38 was a prerequisite for the phosphorylation of STMN1S16 and STMN1S63 during mitosis [77]. In endothelial cells, HGF restored the endothelial cell barrier by inducing peripheral microtubule elongation via Rac1/PAK1 activity, resulting in STMN1S38 phosphorylation, microtubule assembly, and recovery of the peripheral actin cytoskeleton [78]. In primary human keratinocytes, HGF increased phosphorylated STMN1S38 to promote keratinocyte cell proliferation and cell migration through PI3K/AKT and MAPK signaling [79]. In MDA-MB-231 human breast cancer cells, HGF stimulated the transportation of the PAK1/WAVE2 complex to the leading edge of lamellipodia through phosphorylation of STMN1S38 [23]. Together, these studies showed that multiple pathways regulate STMN1S38 phosphorylation and that this was dependent on cell type. The pathways regulating STMN1 phosphorylation in CRPC remain to be determined.
One reported pathway specifically regulating STMN1 phosphorylation at S16 is Ca2+/calmodulin-dependent protein kinase II (CaMKII); and CaMKII phosphorylated STMN1S16 regulates spindle and microtubule formation in Jurkat T, HeLa, HepG2, and MCF7 cells [10,19,51]. However, CAMKII did not phosphorylate STMN1S16 in K562 cells [52], and our study showed likewise that CAMKII did not phosphorylate STMN1S16 in DU-145 cells. We also determined that STMN1S16 phosphorylation did not promote metastasis, unlike that reported for metastatic lung (A549) and head and neck small cell carcinoma (212LN) cells [80]. Together, these diverse differences imply that STMN1 phosphorylation and activities are cell type- and growth factor-specific and that cancer-specific approaches will likely be required to effectively block STMN1 phosphorylation-mediated tumor cell growth and metastasis.
Regrettably, therapies targeting HGF/MET in mCRPC have not been as effective as predicted. Phase I-III clinical trials to block MET activity were done with cabozatinib (XL-184), a dual MET/VEGFR-2 inhibitor. Cabozatinib appeared promising in a Phase I trial where 86% of patients with metastatic CRPC showed a significant reduction of bone metastasis and 64% showed a reduction in pain levels [29]. Similar results were obtained in Phase II and III trials; however, both trials were discontinued due to significant adverse side effects [81,82]. In a single-arm Phase II trial using the selective small molecule MET inhibitor AMG337, antitumor activity was observed in 18% of adults with MET-amplified gastric, gastroesophageal junction, and esophageal adenocarcinomas; however, significant adverse side effects were also observed [50]. These trials imply that directly targeting the MET receptor can regulate alternative or non-specific pathways and suggests that inhibiting a selected down-stream target of MET signaling may be more specific with fewer adverse side effects.
Of particular significance, MET and AR expression are inversely corelated. AR repressed Sp1-induced transcription of MET in a ligand-dependent manner [83] while ADT increased MET levels, implying that the down-regulation of AR activity induced MET which, in turn, promoted PCa cell survival and progression to CRPC [83,84]. In a Phase I study of concurrent enzalutamide and crizotinib administration, improvement in bone pain and reduction in total alkaline phosphatase and plasma serum C-terminal telopeptide (CTX) were not observed; however, significant drug-drug interactions resulted in the active clearance of crizotinib, indicating that suboptimal dosing had occurred [85].
5. Conclusions
In summary, the STMN1/HGF/MET signaling axis is upregulated in both mCRPC and mBC, modulated by taxane therapy, and STMN1S16 phosphorylation regulates cell cycle progression and proliferation but not metastasis. In addition, expression of STMN1S16A blocks cells in G2/M and promotes apoptosis, mimicking that reported for treatment with docetaxel [86]. Thus, we postulate that modulating STMN1S16 phosphorylation status may provide tumor stage-specific windows-of-opportunity to selectively kill tumor cells while preventing/inhibiting the emergence of metastatic disease. While clinical trials have provided proof-of-principle that blocking MET activity reduces bone metastasis and pain levels in mCRPC, decreasing the side effects and adverse pharmacokinetics of drug interactions remain a major challenge. MET remains an important oncogenic driver associated with clonal expansion, metastasis, and cancer cell survival under adverse therapeutic-induced conditions. Thus, developing new approaches for blocking MET kinase-mediated activity is paramount, and could include targeting downstream effectors such as STMN1S16 phosphorylation to inhibit the cell cycle and tumor cell growth, in addition to more selective small molecule inhibitors or peptides for inhibiting MET, developing alternative strategies such as siRNA-based therapeutics for inhibiting HGF or MET expression, and screening for MET mutations to identify new actionable targets. In combination, inhibition of MET-mediated pSTMN1S16 and AR activity could significantly advance the treatment of metastatic cancers.
Supplementary Materials
The following supporting information can be downloaded at the website of this paper posted on Preprints.org, Table S1: Primary antibodies and concentrations used; Table S2: Primers for generating the STMN1 substitution mutations. Figure S1: HGF Concentration differentially modulates DU-145 cell morphology. Figure S2: Oleic acid does not phosphorylate STMN1S16. Figure S3: Diagrammatic representation of experimental timelines and serine substitution mutation nomenclature. Figure S4: STMN1 phosphorylation status HGF/MET signaling do not induce NMuMG and DU-145 cell migration or invasion.
Author Contributions
Conceptualization, P.L.D, K.A.B., and S.K..; methodology, P.L.D., S.K.; validation, P.L.D., A.V.H, and S.K.; formal analysis, P.L.D., A.V.H, B.G.H, and S.V.; investigation, P.L.D., A.V.H., B.G.H., S.V., and S.E.W.; resources, S.E.W., and S.K.; data curation, S.K.; writing—original draft preparation, P.L.D., B.G.H., S.V., and S.K.; writing—review and editing, P.L.D., A.V.H., B.G.H., S.V., S.E.W., K.A.B., and S.K.; visualization, P.L.D., A.V.H., B.G.H., and S.V.; supervision, S.K.; funding acquisition, P.L.D., B.G.H., S.E.W., and S.K. All authors have read and agreed to the published version of the manuscript.” Please turn to the CRediT taxonomy for the term explanation. Authorship must be limited to those who have contributed substantially to the work reported.
Funding
Research reported in this manuscript was supported by the Department of Defense Idea Development Award (W81XWH-17-1-0601 to SK), by the Department of Veteran’s Affairs, Research Service, Cincinnati Veteran's Affairs Medical Center, Cincinnati, OH, USA (I01BX000803 to SEW) and by National Institutes of Health Awards (R01CA239696 to SEW), (F31CA228373 to BGH) and (T32CA117846 to PLD).
Data Availability Statement
cBioPortal (RRID:SCR_014555) was the source of publicly available data on mPCa and mBC biopsy specimens generated by others 1,2. Data that supports the findings of this study will be made available on request by the corresponding author. Expression microarray data (accession number GSE77930) and primary tumor tissues with clinical annotations and sample sites (Fig. 1A-1E, 1G) were downloaded from the Fred Hutchinson Cancer Research Center study on metastatic prostate adenocarcinoma 3. Clinical annotations including sample site, castration resistance status, and overall survival data (Fig. 1F) were downloaded from the Memorial Sloan Kettering study on metastatic prostate adenocarcinoma 4. The publicly available ROCplot BC dataset on metastatic breast cancer 5 and ROC Plotter (RIDD:SCR_025347), the ROCplot web-based bioinformatics tool, were used to query for STMN1, HGF, MET, and STM1/MET combined signatures with taxane chemotherapy treatment selected and node positive nodal status filter selected (Fig. 1H - 1N).
Conflicts of Interest
The authors declare that they have no conflicts of interest with the contents of this article.
Abbreviations
The following abbreviations are used in this manuscript:
| A | alanine |
| ADT | androgen deprivation therapy |
| a.k.a. | a.k.a. - also known as |
| ANOVA | ANOVA - analysis of variance |
| AR | AR - androgen receptor |
| BC | BC - breast cancer |
| BPH | BPH - benign prostate hyperplasia |
| CDK1 | cyclin dependent kinase 1 |
| cDNA | copy deoxynucleic acid |
| CTX | C-terminal telopeptide |
| E | glutamic acid |
| ECL | Enhanced Chemiluminescence |
| EMT | epithelial mesenchymal transition |
| Fig | figure |
| FoxM1 | Forkhead Box M1 |
| G1/S/G0/M | phases of cell cycle |
| HGF | hepatocyte growth factor |
| m | metastatic |
| mCRPC | metastatic castration-resistant prostate cancer |
| MET | MET proto-oncogene, Receptor Tyrosine Kinase |
| p | phospho |
| p21 | Cyclin Dependent Kinase Inhibitor 1A |
| P53 | tumor protein 53 |
| PCa | prostate cancer |
| pECFP | plasmid enhanced cyan fluorescent protein |
| pLKO.1/shSTMN1 | MISSION® pLKO.1-puro Non-Target shRNA control |
| RNA | ribonucleic acid |
| STMN1 | Stathmin 1 |
| S | serine |
| sh | Short hairpin |
| Sp1 | Sp1 transcription factor |
| t | total |
| VEGFR-2 | vascular endothelial growth factor receptor 2 |
References
- Roy, S.; Saad, F. Metastatic castrate-resistant prostate cancer: a new horizon beyond the androgen receptors. Current opinion in supportive and palliative care 2022, 16, 223-229. [CrossRef]
- Muralidhar, A.; Potluri, H.K.; Jaiswal, T.; McNeel, D.G. Targeted Radiation and Immune Therapies-Advances and Opportunities for the Treatment of Prostate Cancer. Pharmaceutics 2023, 15. [CrossRef]
- Matthews, H.K.; Bertoli, C.; de Bruin, R.A.M. Cell cycle control in cancer. Nature reviews. Molecular cell biology 2022, 23, 74-88. [CrossRef]
- Sumanasuriya, S.; De Bono, J. Treatment of Advanced Prostate Cancer-A Review of Current Therapies and Future Promise. Cold Spring Harbor perspectives in medicine 2018, 8. [CrossRef]
- Iacopetta, D.; Ceramella, J.; Baldino, N.; Sinicropi, M.S.; Catalano, A. Targeting Breast Cancer: An Overlook on Current Strategies. International journal of molecular sciences 2023, 24. [CrossRef]
- Shi, Y.; Yeh, Y.A.; Cheng, S.; Gu, X.; Yang, S.; Li, L.; Khater, N.P.; Kasper, S.; Yu, X. Stathmin 1 expression in neuroendocrine and proliferating prostate cancer. Discov Oncol 2025, 16, 19. [CrossRef]
- Yang, H. Tau and stathmin proteins in breast cancer: A potential therapeutic target. Clin Exp Pharmacol Physiol 2022, 49, 445-452. [CrossRef]
- Herbst, R.S.; Khuri, F.R. Mode of action of docetaxel - a basis for combination with novel anticancer agents. Cancer treatment reviews 2003, 29, 407-415. [CrossRef]
- Martin, S.K.; Kyprianou, N. Exploitation of the Androgen Receptor to Overcome Taxane Resistance in Advanced Prostate Cancer. Adv Cancer Res 2015, 127, 123-158. [CrossRef]
- Sobel, A. Stathmin: a relay phosphoprotein for multiple signal transduction? Trends Biochem Sci 1991, 16, 301-305.
- Cassimeris, L. The oncoprotein 18/stathmin family of microtubule destabilizers. Curr Opin Cell Biol 2002, 14, 18-24.
- Beretta, L.; Dobransky, T.; Sobel, A. Multiple phosphorylation of stathmin. Identification of four sites phosphorylated in intact cells and in vitro by cyclic AMP-dependent protein kinase and p34cdc2. J Biol Chem 1993, 268, 20076-20084.
- Rubin, C.I.; Atweh, G.F. The role of stathmin in the regulation of the cell cycle. J Cell Biochem 2004, 93, 242-250.
- Machado-Neto, J.A.; Rodrigues Alves, A.P.N.; Fernandes, J.C.; Coelho-Silva, J.L.; Scopim-Ribeiro, R.; Fenerich, B.A.; da Silva, F.B.; Scheucher, P.S.; Simoes, B.P.; Rego, E.M.; et al. Paclitaxel induces Stathmin 1 phosphorylation, microtubule stability and apoptosis in acute lymphoblastic leukemia cells. Heliyon 2017, 3, e00405. [CrossRef]
- Ma, Y.; Liu, T.; Song, X.; Tian, Y.; Wei, Y.; Wang, J.; Li, X.; Yang, X. Siva 1 inhibits proliferation, migration and invasion by phosphorylating Stathmin in ovarian cancer cells. Oncology letters 2017, 14, 1512-1518. [CrossRef]
- Wu, H.; Deng, W.W.; Yang, L.L.; Zhang, W.F.; Sun, Z.J. Expression and phosphorylation of Stathmin 1 indicate poor survival in head and neck squamous cell carcinoma and associate with immune suppression. Biomark Med 2018, 12, 759-769. [CrossRef]
- Wik, E.; Birkeland, E.; Trovik, J.; Werner, H.M.; Hoivik, E.A.; Mjos, S.; Krakstad, C.; Kusonmano, K.; Mauland, K.; Stefansson, I.M.; et al. High phospho-Stathmin(Serine38) expression identifies aggressive endometrial cancer and suggests an association with PI3K inhibition. Clinical cancer research : an official journal of the American Association for Cancer Research 2013, 19, 2331-2341. [CrossRef]
- Jurmeister, S.; Ramos-Montoya, A.; Sandi, C.; Pertega-Gomes, N.; Wadhwa, K.; Lamb, A.D.; Dunning, M.J.; Attig, J.; Carroll, J.S.; Fryer, L.G.; et al. Identification of potential therapeutic targets in prostate cancer through a cross-species approach. EMBO Mol Med 2018, 10. [CrossRef]
- Li, N.; Jiang, P.; Du, W.; Wu, Z.; Li, C.; Qiao, M.; Yang, X.; Wu, M. Siva1 suppresses epithelial-mesenchymal transition and metastasis of tumor cells by inhibiting stathmin and stabilizing microtubules. Proceedings of the National Academy of Sciences of the United States of America 2011, 108, 12851-12856.
- Zhao, Y.; Chen, S.; Shen, F.; Long, D.; Yu, T.; Wu, M.; Lin, X. In vitro neutralization of autocrine IL-10 affects Op18/stathmin signaling in non-small cell lung cancer cells. Oncol Rep 2019, 41, 501-511. [CrossRef]
- Xu, J.; Wu, W.; Tang, Y.; Lin, Y.; Xue, Y.; Hu, J.; Lin, D. PRL-3 exerts oncogenic functions in myeloid leukemia cells via aberrant dephosphorylation of stathmin and activation of STAT3 signaling. Aging (Albany NY) 2019, 11, 7817-7829. [CrossRef]
- Chen, X.; Liao, Y.; Long, D.; Yu, T.; Shen, F.; Lin, X. The Cdc2/Cdk1 inhibitor, purvalanol A, enhances the cytotoxic effects of taxol through Op18/stathmin in non-small cell lung cancer cells in vitro. Int J Mol Med 2017, 40, 235-242. [CrossRef]
- Takahashi, K.; Suzuki, K. Membrane transport of WAVE2 and lamellipodia formation require Pak1 that mediates phosphorylation and recruitment of stathmin/Op18 to Pak1-WAVE2-kinesin complex. Cell Signal 2009, 21, 695-703. [CrossRef]
- Sahai, E.; Astsaturov, I.; Cukierman, E.; DeNardo, D.G.; Egeblad, M.; Evans, R.M.; Fearon, D.; Greten, F.R.; Hingorani, S.R.; Hunter, T.; et al. A framework for advancing our understanding of cancer-associated fibroblasts. Nature reviews. Cancer 2020, 20, 174-186. [CrossRef]
- Humphrey, P.A.; Zhu, X.; Zarnegar, R.; Swanson, P.E.; Ratliff, T.L.; Vollmer, R.T.; Day, M.L. Hepatocyte growth factor and its receptor (c-MET) in prostatic carcinoma. Am J Pathol 1995, 147, 386-396.
- Hass, R.; Jennek, S.; Yang, Y.; Friedrich, K. c-Met expression and activity in urogenital cancers - novel aspects of signal transduction and medical implications. Cell Commun Signal 2017, 15, 10. [CrossRef]
- Knudsen, B.S.; Edlund, M. Prostate cancer and the met hepatocyte growth factor receptor. Adv Cancer Res 2004, 91, 31-67. [CrossRef]
- Knudsen, B.S.; Gmyrek, G.A.; Inra, J.; Scherr, D.S.; Vaughan, E.D.; Nanus, D.M.; Kattan, M.W.; Gerald, W.L.; Vande Woude, G.F. High expression of the Met receptor in prostate cancer metastasis to bone. Urology 2002, 60, 1113-1117. [CrossRef]
- Varkaris, A.; Corn, P.G.; Gaur, S.; Dayyani, F.; Logothetis, C.J.; Gallick, G.E. The role of HGF/c-Met signaling in prostate cancer progression and c-Met inhibitors in clinical trials. Expert Opin Investig Drugs 2011, 20, 1677-1684. [CrossRef]
- Xie, Y.; Lu, W.; Liu, S.; Yang, Q.; Carver, B.S.; Li, E.; Wang, Y.; Fazli, L.; Gleave, M.; Chen, Z. Crosstalk between nuclear MET and SOX9/beta-catenin correlates with castration-resistant prostate cancer. Mol Endocrinol 2014, 28, 1629-1639. [CrossRef]
- Humphrey, P.A.; Halabi, S.; Picus, J.; Sanford, B.; Vogelzang, N.J.; Small, E.J.; Kantoff, P.W. Prognostic significance of plasma scatter factor/hepatocyte growth factor levels in patients with metastatic hormone- refractory prostate cancer: results from cancer and leukemia group B 150005/9480. Clin Genitourin Cancer 2006, 4, 269-274. [CrossRef]
- Aftab, D.T.; McDonald, D.M. MET and VEGF: synergistic targets in castration-resistant prostate cancer. Clin Transl Oncol 2011, 13, 703-709. [CrossRef]
- Raghav, K.P.; Wang, W.; Liu, S.; Chavez-MacGregor, M.; Meng, X.; Hortobagyi, G.N.; Mills, G.B.; Meric-Bernstam, F.; Blumenschein, G.R., Jr.; Gonzalez-Angulo, A.M. cMET and phospho-cMET protein levels in breast cancers and survival outcomes. Clinical cancer research : an official journal of the American Association for Cancer Research 2012, 18, 2269-2277. [CrossRef]
- Yang, H.; Zhang, C.; Cui, S. Expression of hepatocyte growth factor in breast cancer and its effect on prognosis and sensitivity to chemotherapy. Molecular medicine reports 2015, 11, 1037-1042. [CrossRef]
- Cerami, E.; Gao, J.; Dogrusoz, U.; Gross, B.E.; Sumer, S.O.; Aksoy, B.A.; Jacobsen, A.; Byrne, C.J.; Heuer, M.L.; Larsson, E.; et al. The cBio cancer genomics portal: an open platform for exploring multidimensional cancer genomics data. Cancer discovery 2012, 2, 401-404. [CrossRef]
- Gao, J.; Aksoy, B.A.; Dogrusoz, U.; Dresdner, G.; Gross, B.; Sumer, S.O.; Sun, Y.; Jacobsen, A.; Sinha, R.; Larsson, E.; et al. Integrative analysis of complex cancer genomics and clinical profiles using the cBioPortal. Science signaling 2013, 6, pl1. [CrossRef]
- Lan, H.; Wu, B.; Jin, K.; Chen, Y. Beyond boundaries: unraveling innovative approaches to combat bone-metastatic cancers. Front Endocrinol (Lausanne) 2023, 14, 1260491. [CrossRef]
- Kumar, A.; Coleman, I.; Morrissey, C.; Zhang, X.; True, L.D.; Gulati, R.; Etzioni, R.; Bolouri, H.; Montgomery, B.; White, T.; et al. Substantial interindividual and limited intraindividual genomic diversity among tumors from men with metastatic prostate cancer. Nature medicine 2016, 22, 369-378. [CrossRef]
- Abida, W.; Cyrta, J.; Heller, G.; Prandi, D.; Armenia, J.; Coleman, I.; Cieslik, M.; Benelli, M.; Robinson, D.; Van Allen, E.M.; et al. Genomic correlates of clinical outcome in advanced prostate cancer. Proceedings of the National Academy of Sciences of the United States of America 2019, 116, 11428-11436. [CrossRef]
- Stopsack, K.H.; Nandakumar, S.; Wibmer, A.G.; Haywood, S.; Weg, E.S.; Barnett, E.S.; Kim, C.J.; Carbone, E.A.; Vasselman, S.E.; Nguyen, B.; et al. Oncogenic Genomic Alterations, Clinical Phenotypes, and Outcomes in Metastatic Castration-Sensitive Prostate Cancer. Clinical cancer research : an official journal of the American Association for Cancer Research 2020, 26, 3230-3238. [CrossRef]
- .
- Wickham, H. ggplot2: Elegant Graphics for Data Analysis; Springer-Verlag: New York, 2016.
- Fekete, J.T.; Gyorffy, B. ROCplot.org: Validating predictive biomarkers of chemotherapy/hormonal therapy/anti-HER2 therapy using transcriptomic data of 3,104 breast cancer patients. International journal of cancer 2019, 145, 3140-3151. [CrossRef]
- Williams, K.; Ghosh, R.; Vummidi Giridhar, P.; Gu, G.; Case, T.; SM, B.; Kasper, S. Inhibition of Stathmin1 Accelerates the Metastatic Process Cancer research 2012, 72, 5407-5417, doi:doi: 10.1158/0008-5472.CAN-12-1158. .
- Ghosh, R.; Gu, G.; Tillman, E.; Yuan, J.; Wang, Y.; Fazli, L.; Rennie, P.S.; Kasper, S. Increased expression and differential phosphorylation of stathmin may promote prostate cancer progression. The Prostate 2007, 67, 1038-1052.
- Wang, R.C.; Wang, Z. Synchronization of Cultured Cells to G1, S, G2, and M Phases by Double Thymidine Block. Methods in molecular biology 2022, 2579, 61-71. [CrossRef]
- Wee, P.; Wang, Z. Cell Cycle Synchronization of HeLa Cells to Assay EGFR Pathway Activation. Methods in molecular biology 2017, 1652, 167-181. [CrossRef]
- Li, J.; Lu, Y.; Akbani, R.; Ju, Z.; Roebuck, P.L.; Liu, W.; Yang, J.Y.; Broom, B.M.; Verhaak, R.G.; Kane, D.W.; et al. TCPA: a resource for cancer functional proteomics data. Nature methods 2013, 10, 1046-1047. [CrossRef]
- Li, J.; Akbani, R.; Zhao, W.; Lu, Y.; Weinstein, J.N.; Mills, G.B.; Liang, H. Explore, Visualize, and Analyze Functional Cancer Proteomic Data Using the Cancer Proteome Atlas. Cancer research 2017, 77, e51-e54. [CrossRef]
- Van Cutsem, E.; Karaszewska, B.; Kang, Y.K.; Chung, H.C.; Shankaran, V.; Siena, S.; Go, N.F.; Yang, H.; Schupp, M.; Cunningham, D. A Multicenter Phase II Study of AMG 337 in Patients with MET-Amplified Gastric/Gastroesophageal Junction/Esophageal Adenocarcinoma and Other MET-Amplified Solid Tumors. Clinical cancer research : an official journal of the American Association for Cancer Research 2019, 25, 2414-2423. [CrossRef]
- le Gouvello, S.; Manceau, V.; Sobel, A. Serine 16 of stathmin as a cytosolic target for Ca2+/calmodulin-dependent kinase II after CD2 triggering of human T lymphocytes. Journal of immunology 1998, 161, 1113-1122.
- Gradin, H.M.; Marklund, U.; Larsson, N.; Chatila, T.A.; Gullberg, M. Regulation of microtubule dynamics by Ca2+/calmodulin-dependent kinase IV Gr-dependent phosphorylation of oncoprotein 18. Mol Cell Biol 1997, 17, 3459-3467, doi:Doi 10.1128/Mcb.17.6.3459.
- Chen, G.; Deng, X. Cell Synchronization by Double Thymidine Block. Bio Protoc 2018, 8. [CrossRef]
- Belletti, B.; Baldassarre, G. Stathmin: a protein with many tasks. New biomarker and potential target in cancer. Expert Opin Ther Targets 2011, 15, 1249-1266. [CrossRef]
- Chen, P.W.; Lin, S.J.; Tsai, S.C.; Lin, J.H.; Chen, M.R.; Wang, J.T.; Lee, C.P.; Tsai, C.H. Regulation of microtubule dynamics through phosphorylation on stathmin by Epstein-Barr virus kinase BGLF4. J Biol Chem 2010, 285, 10053-10063. [CrossRef]
- Abbas, T.; Dutta, A. p21 in cancer: intricate networks and multiple activities. Nature reviews. Cancer 2009, 9, 400-414. [CrossRef]
- Ghule, P.N.; Seward, D.J.; Fritz, A.J.; Boyd, J.R.; van Wijnen, A.J.; Lian, J.B.; Stein, J.L.; Stein, G.S. Higher order genomic organization and regulatory compartmentalization for cell cycle control at the G1/S-phase transition. J Cell Physiol 2018, 233, 6406-6413. [CrossRef]
- Yang, K.; Hitomi, M.; Stacey, D.W. Variations in cyclin D1 levels through the cell cycle determine the proliferative fate of a cell. Cell Div 2006, 1, 32. [CrossRef]
- Brown, K.A.; Aakre, M.E.; Gorska, A.E.; Price, J.O.; Eltom, S.E.; Pietenpol, J.A.; Moses, H.L. Induction by transforming growth factor-beta1 of epithelial to mesenchymal transition is a rare event in vitro. Breast Cancer Res 2004, 6, R215-231.
- Accornero, P.; Miretti, S.; Bersani, F.; Quaglino, E.; Martignani, E.; Baratta, M. Met receptor acts uniquely for survival and morphogenesis of EGFR-dependent normal mammary epithelial and cancer cells. PloS one 2012, 7, e44982. [CrossRef]
- Xue, J.; Pu, Y.; Smith, J.; Gao, X.; Wang, C.; Wu, B. Identifying metastatic ability of prostate cancer cell lines using native fluorescence spectroscopy and machine learning methods. Scientific reports 2021, 11, 2282. [CrossRef]
- Nafissi, N.N.; Kosiorek, H.E.; Butterfield, R.J.; Moore, C.; Ho, T.; Singh, P.; Bryce, A.H. Evolving Natural History of Metastatic Prostate Cancer. Cureus 2020, 12, e11484. [CrossRef]
- Gandaglia, G.; Abdollah, F.; Schiffmann, J.; Trudeau, V.; Shariat, S.F.; Kim, S.P.; Perrotte, P.; Montorsi, F.; Briganti, A.; Trinh, Q.D.; et al. Distribution of metastatic sites in patients with prostate cancer: A population-based analysis. The Prostate 2014, 74, 210-216. [CrossRef]
- Ma, B.; Wheeler, S.E.; Clark, A.M.; Whaley, D.L.; Yang, M.; Wells, A. Liver protects metastatic prostate cancer from induced death by activating E-cadherin signaling. Hepatology 2016, 64, 1725-1742. [CrossRef]
- Armstrong, A.J.; Shore, N.D.; Szmulewitz, R.Z.; Petrylak, D.P.; Holzbeierlein, J.; Villers, A.; Azad, A.; Alcaraz, A.; Alekseev, B.; Iguchi, T.; et al. Efficacy of Enzalutamide plus Androgen Deprivation Therapy in Metastatic Hormone-Sensitive Prostate Cancer by Pattern of Metastatic Spread: ARCHES Post Hoc Analyses. The Journal of urology 2021, 205, 1361-1371. [CrossRef]
- Hsieh, S.Y.; Huang, S.F.; Yu, M.C.; Yeh, T.S.; Chen, T.C.; Lin, Y.J.; Chang, C.J.; Sung, C.M.; Lee, Y.L.; Hsu, C.Y. Stathmin1 overexpression associated with polyploidy, tumor-cell invasion, early recurrence, and poor prognosis in human hepatoma. Molecular carcinogenesis 2010, 49, 476-487. [CrossRef]
- Nie, W.; Xu, M.D.; Gan, L.; Huang, H.; Xiu, Q.; Li, B. Overexpression of stathmin 1 is a poor prognostic biomarker in non-small cell lung cancer. Laboratory investigation; a journal of technical methods and pathology 2015, 95, 56-64. [CrossRef]
- Kuang, X.Y.; Chen, L.; Zhang, Z.J.; Liu, Y.R.; Zheng, Y.Z.; Ling, H.; Qiao, F.; Li, S.; Hu, X.; Shao, Z.M. Stathmin and phospho-stathmin protein signature is associated with survival outcomes of breast cancer patients. Oncotarget 2015, 6, 22227-22238. [CrossRef]
- Mercier, I.; Casimiro, M.C.; Wang, C.; Rosenberg, A.L.; Quong, J.; Minkeu, A.; Allen, K.G.; Danilo, C.; Sotgia, F.; Bonuccelli, G.; et al. Human breast cancer-associated fibroblasts (CAFs) show caveolin-1 downregulation and RB tumor suppressor functional inactivation: Implications for the response to hormonal therapy. Cancer Biol Ther 2008, 7, 1212-1225. [CrossRef]
- Askeland, C.; Wik, E.; Finne, K.; Birkeland, E.; Arnes, J.B.; Collett, K.; Knutsvik, G.; Kruger, K.; Davidsen, B.; Aas, T.; et al. Stathmin expression associates with vascular and immune responses in aggressive breast cancer subgroups. Scientific reports 2020, 10, 2914. [CrossRef]
- Bhalla, K.N. Microtubule-targeted anticancer agents and apoptosis. Oncogene 2003, 22, 9075-9086. [CrossRef]
- Kaposi-Novak, P.; Lee, J.S.; Gomez-Quiroz, L.; Coulouarn, C.; Factor, V.M.; Thorgeirsson, S.S. Met-regulated expression signature defines a subset of human hepatocellular carcinomas with poor prognosis and aggressive phenotype. The Journal of clinical investigation 2006, 116, 1582-1595. [CrossRef]
- Carr, J.R.; Park, H.J.; Wang, Z.; Kiefer, M.M.; Raychaudhuri, P. FoxM1 mediates resistance to herceptin and paclitaxel. Cancer research 2010, 70, 5054-5063. [CrossRef]
- Singer, S.; Ehemann, V.; Brauckhoff, A.; Keith, M.; Vreden, S.; Schirmacher, P.; Breuhahn, K. Protumorigenic overexpression of stathmin/Op18 by gain-of-function mutation in p53 in human hepatocarcinogenesis. Hepatology 2007, 46, 759-768. [CrossRef]
- Chen, Y.L.; Uen, Y.H.; Li, C.F.; Horng, K.C.; Chen, L.R.; Wu, W.R.; Tseng, H.Y.; Huang, H.Y.; Wu, L.C.; Shiue, Y.L. The E2F transcription factor 1 transactives stathmin 1 in hepatocellular carcinoma. Ann Surg Oncol 2013, 20, 4041-4054. [CrossRef]
- Lee, J.M.; Hammaren, H.M.; Savitski, M.M.; Baek, S.H. Control of protein stability by post-translational modifications. Nature communications 2023, 14, 201. [CrossRef]
- Larsson, N.; Marklund, U.; Gradin, H.M.; Brattsand, G.; Gullberg, M. Control of microtubule dynamics by oncoprotein 18: dissection of the regulatory role of multisite phosphorylation during mitosis. Mol Cell Biol 1997, 17, 5530-5539.
- Tian, X.; Tian, Y.; Moldobaeva, N.; Sarich, N.; Birukova, A.A. Microtubule dynamics control HGF-induced lung endothelial barrier enhancement. PloS one 2014, 9, e105912. [CrossRef]
- Schmitt, S.; Safferling, K.; Westphal, K.; Hrabowski, M.; Muller, U.; Angel, P.; Wiechert, L.; Ehemann, V.; Muller, B.; Holland-Cunz, S.; et al. Stathmin regulates keratinocyte proliferation and migration during cutaneous regeneration. PloS one 2013, 8, e75075. [CrossRef]
- Alesi, G.N.; Jin, L.; Li, D.; Magliocca, K.R.; Kang, Y.; Chen, Z.G.; Shin, D.M.; Khuri, F.R.; Kang, S. RSK2 signals through stathmin to promote microtubule dynamics and tumor metastasis. Oncogene 2016, 35, 5412-5421. [CrossRef]
- Smith, D.C.; Smith, M.R.; Sweeney, C.; Elfiky, A.A.; Logothetis, C.; Corn, P.G.; Vogelzang, N.J.; Small, E.J.; Harzstark, A.L.; Gordon, M.S.; et al. Cabozantinib in patients with advanced prostate cancer: results of a phase II randomized discontinuation trial. J Clin Oncol 2013, 31, 412-419. [CrossRef]
- Smith, M.; De Bono, J.; Sternberg, C.; Le Moulec, S.; Oudard, S.; De Giorgi, U.; Krainer, M.; Bergman, A.; Hoelzer, W.; De Wit, R.; et al. Phase III Study of Cabozantinib in Previously Treated Metastatic Castration-Resistant Prostate Cancer: COMET-1. J Clin Oncol 2016, 34, 3005-3013. [CrossRef]
- Verras, M.; Lee, J.; Xue, H.; Li, T.H.; Wang, Y.; Sun, Z. The androgen receptor negatively regulates the expression of c-Met: implications for a novel mechanism of prostate cancer progression. Cancer research 2007, 67, 967-975. [CrossRef]
- Qiao, Y.; Feng, F.Y.; Wang, Y.; Cao, X.; Han, S.; Wilder-Romans, K.; Navone, N.M.; Logothetis, C.; Taichman, R.S.; Keller, E.T.; et al. Mechanistic Support for Combined MET and AR Blockade in Castration-Resistant Prostate Cancer. Neoplasia 2016, 18, 1-9. [CrossRef]
- Tripathi, A.; Supko, J.G.; Gray, K.P.; Melnick, Z.J.; Regan, M.M.; Taplin, M.E.; Choudhury, A.D.; Pomerantz, M.M.; Bellmunt, J.; Yu, C.; et al. Dual Blockade of c-MET and the Androgen Receptor in Metastatic Castration-resistant Prostate Cancer: A Phase I Study of Concurrent Enzalutamide and Crizotinib. Clinical cancer research : an official journal of the American Association for Cancer Research 2020, 26, 6122-6131. [CrossRef]
- Hu, G.; Cun, X.; Ruan, S.; Shi, K.; Wang, Y.; Kuang, Q.; Hu, C.; Xiao, W.; He, Q.; Gao, H. Utilizing G2/M retention effect to enhance tumor accumulation of active targeting nanoparticles. Scientific reports 2016, 6, 27669. [CrossRef]
Figure 1.
STMN1 and HGF/MET expression co-varies in clinical samples of mCRPC and mBC. (a), Correlation analysis of MET and STMN1 gene expression in mCRPC [accessed via cBioPortal, expression microarray and limited clinical annotations, accession number GSE77930 3] (n = 133); (b) Correlation analysis of cMETpY1235 and STMN1 protein expression in mCRPC (TCGA-PRAD cohort 48 (n = 425); (c), Correlation analysis of cMETpY1235 and STMN1 protein expression in mBC (TCGA-BRCA cohort 49 (n=877); (d) STMN1, (e) MET, (f) HGF expression in PCa samples taken from primary or mCRPC sites (GSE77930 cohort 3); (g) Kaplan-Meier plot of patients with castration resistant PCa (CRPC) overall survival stratified by gene expression of STMN1 from the SU2C/PCF Dream Cohort (High STMN1 exp; n= 40, Low STMN1 exp; n=41) [accessed via cBioPortal, whole exome sequencing and clinical annotations]; (h) Survival of patients with CRPC with liver metastases (Liver; n=6) or not (Other; n=234) [accessed via cBioPortal, mutation/alteration data with clinical annotations but no expression data]. Curve comparisons made using Log-Rank statistics; horizontal line indicates 0.50 probability, and vertical line indicates where each curve reaches 0.50 probability (which is the median value, each listed on graph near respective curves); (i) HGF expression when stratifying samples in this dataset based on whether the patient received chemotherapy or not prior to sample acquisition. HGF expression increased significantly following Chemotherapy; (j) STMN1, (k) MET, and (l) HGF expression in tumors of mBC patients receiving taxane treatment stratified by response (Responder; n=110) or lack thereof (Non-responder; n=379) [accessed via ROCplot, expression microarray from a single specimen per patient and clinical annotations including response to chemotherapy 5]; (m), STMN1, (n) MET, (o) STMN1 and MET combined, and (p) HGF expression capacity to predict response to taxane treatment in mBC patients determined through receiver-operator characteristic (ROC; area under curve; AUC) analysis 5. Statistical significance in the respective statistical tests were depicted as *p < 0.05, **p < 0.01.
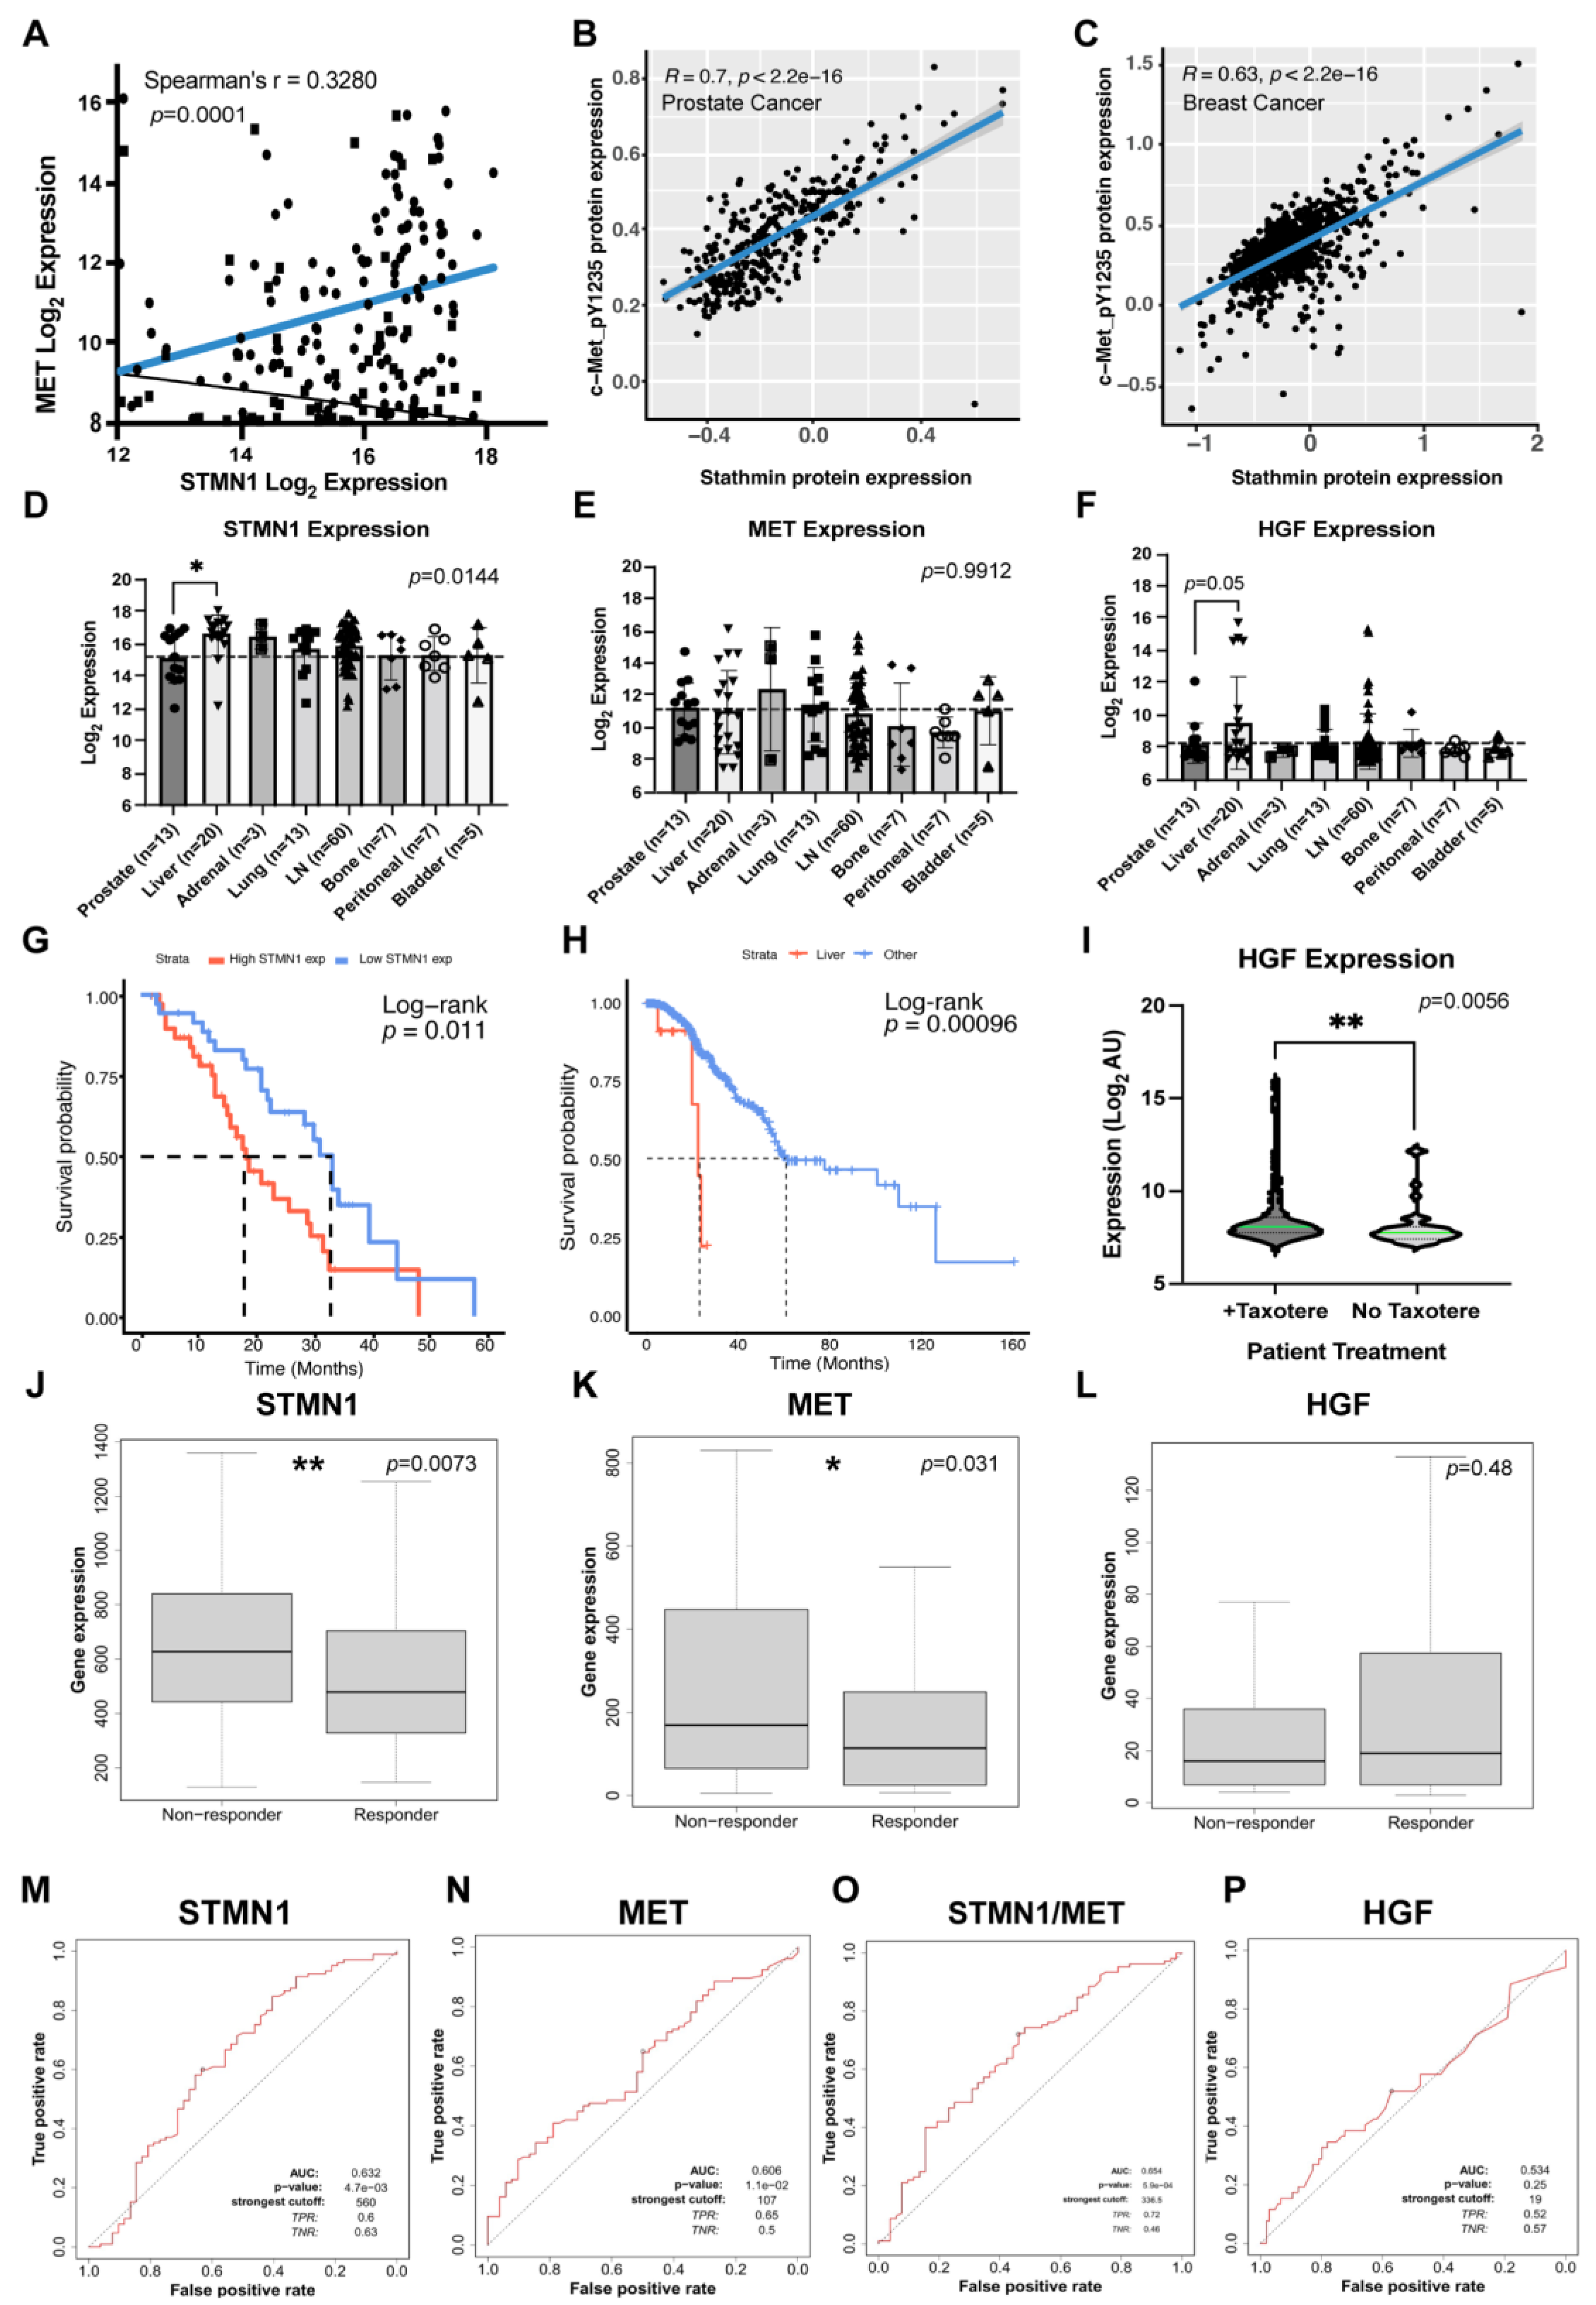
Figure 2.
HGF treatment promotes MET and STMN1S16 phosphorylation and cell growth.(a) Asynchronous DU-145 cells were treated with increasing HGF concentrations as indicated for 72 h. Live and dead cell numbers were determined using the Trypan Blue Exclusion Test of cell viability; (b) Asynchronous DU-145 cells were treated with 25 ng/ml HGF ± 25, 100 or 500 ng/ml AMG337 for 72 h, and cell number was determined using the Trypan Blue Exclusion Test. Treatment replicates, n=4; independent experimental replicates, n=3; and data were presented as the mean ± SD. Statistical comparisons were made using one-way ANOVA applying Dunnett’s post-hoc correction for multiple comparisons where *p<0.01, **p<0.001; (c) The western blots represent one complete experiment, where asynchronous DU-145 cells were treated with vehicle control, 25 ng/ml HGF, or 25 ng/ml + 100 mg/ml AMG337 for the times indicated; and the blots/membranes were placed into the same container and probed in sequence first with anti-pSTMN1 Ser16, anti-pMET, anti- anti-STMN1, MET, and finally anti-GAPDH antibodies. The blots for pMET (d), MET (e), tSTMN1 (f), and pSTMN1S16 (g) were analyzed by densitometry (ImageJ software). Given that tSTMN1 levels varied down to undetectable levels (densitometry value=0) in response to HGF/MET activity, it was not possible to compare pSTMN1S16/tSTMN1. Therefore, pSTMN1S16 levels were compared to the GAPDH control as this analysis most closely represented the intensity of pSTMN1S16 expression on the western blots. Independent experimental replicates, n=3.
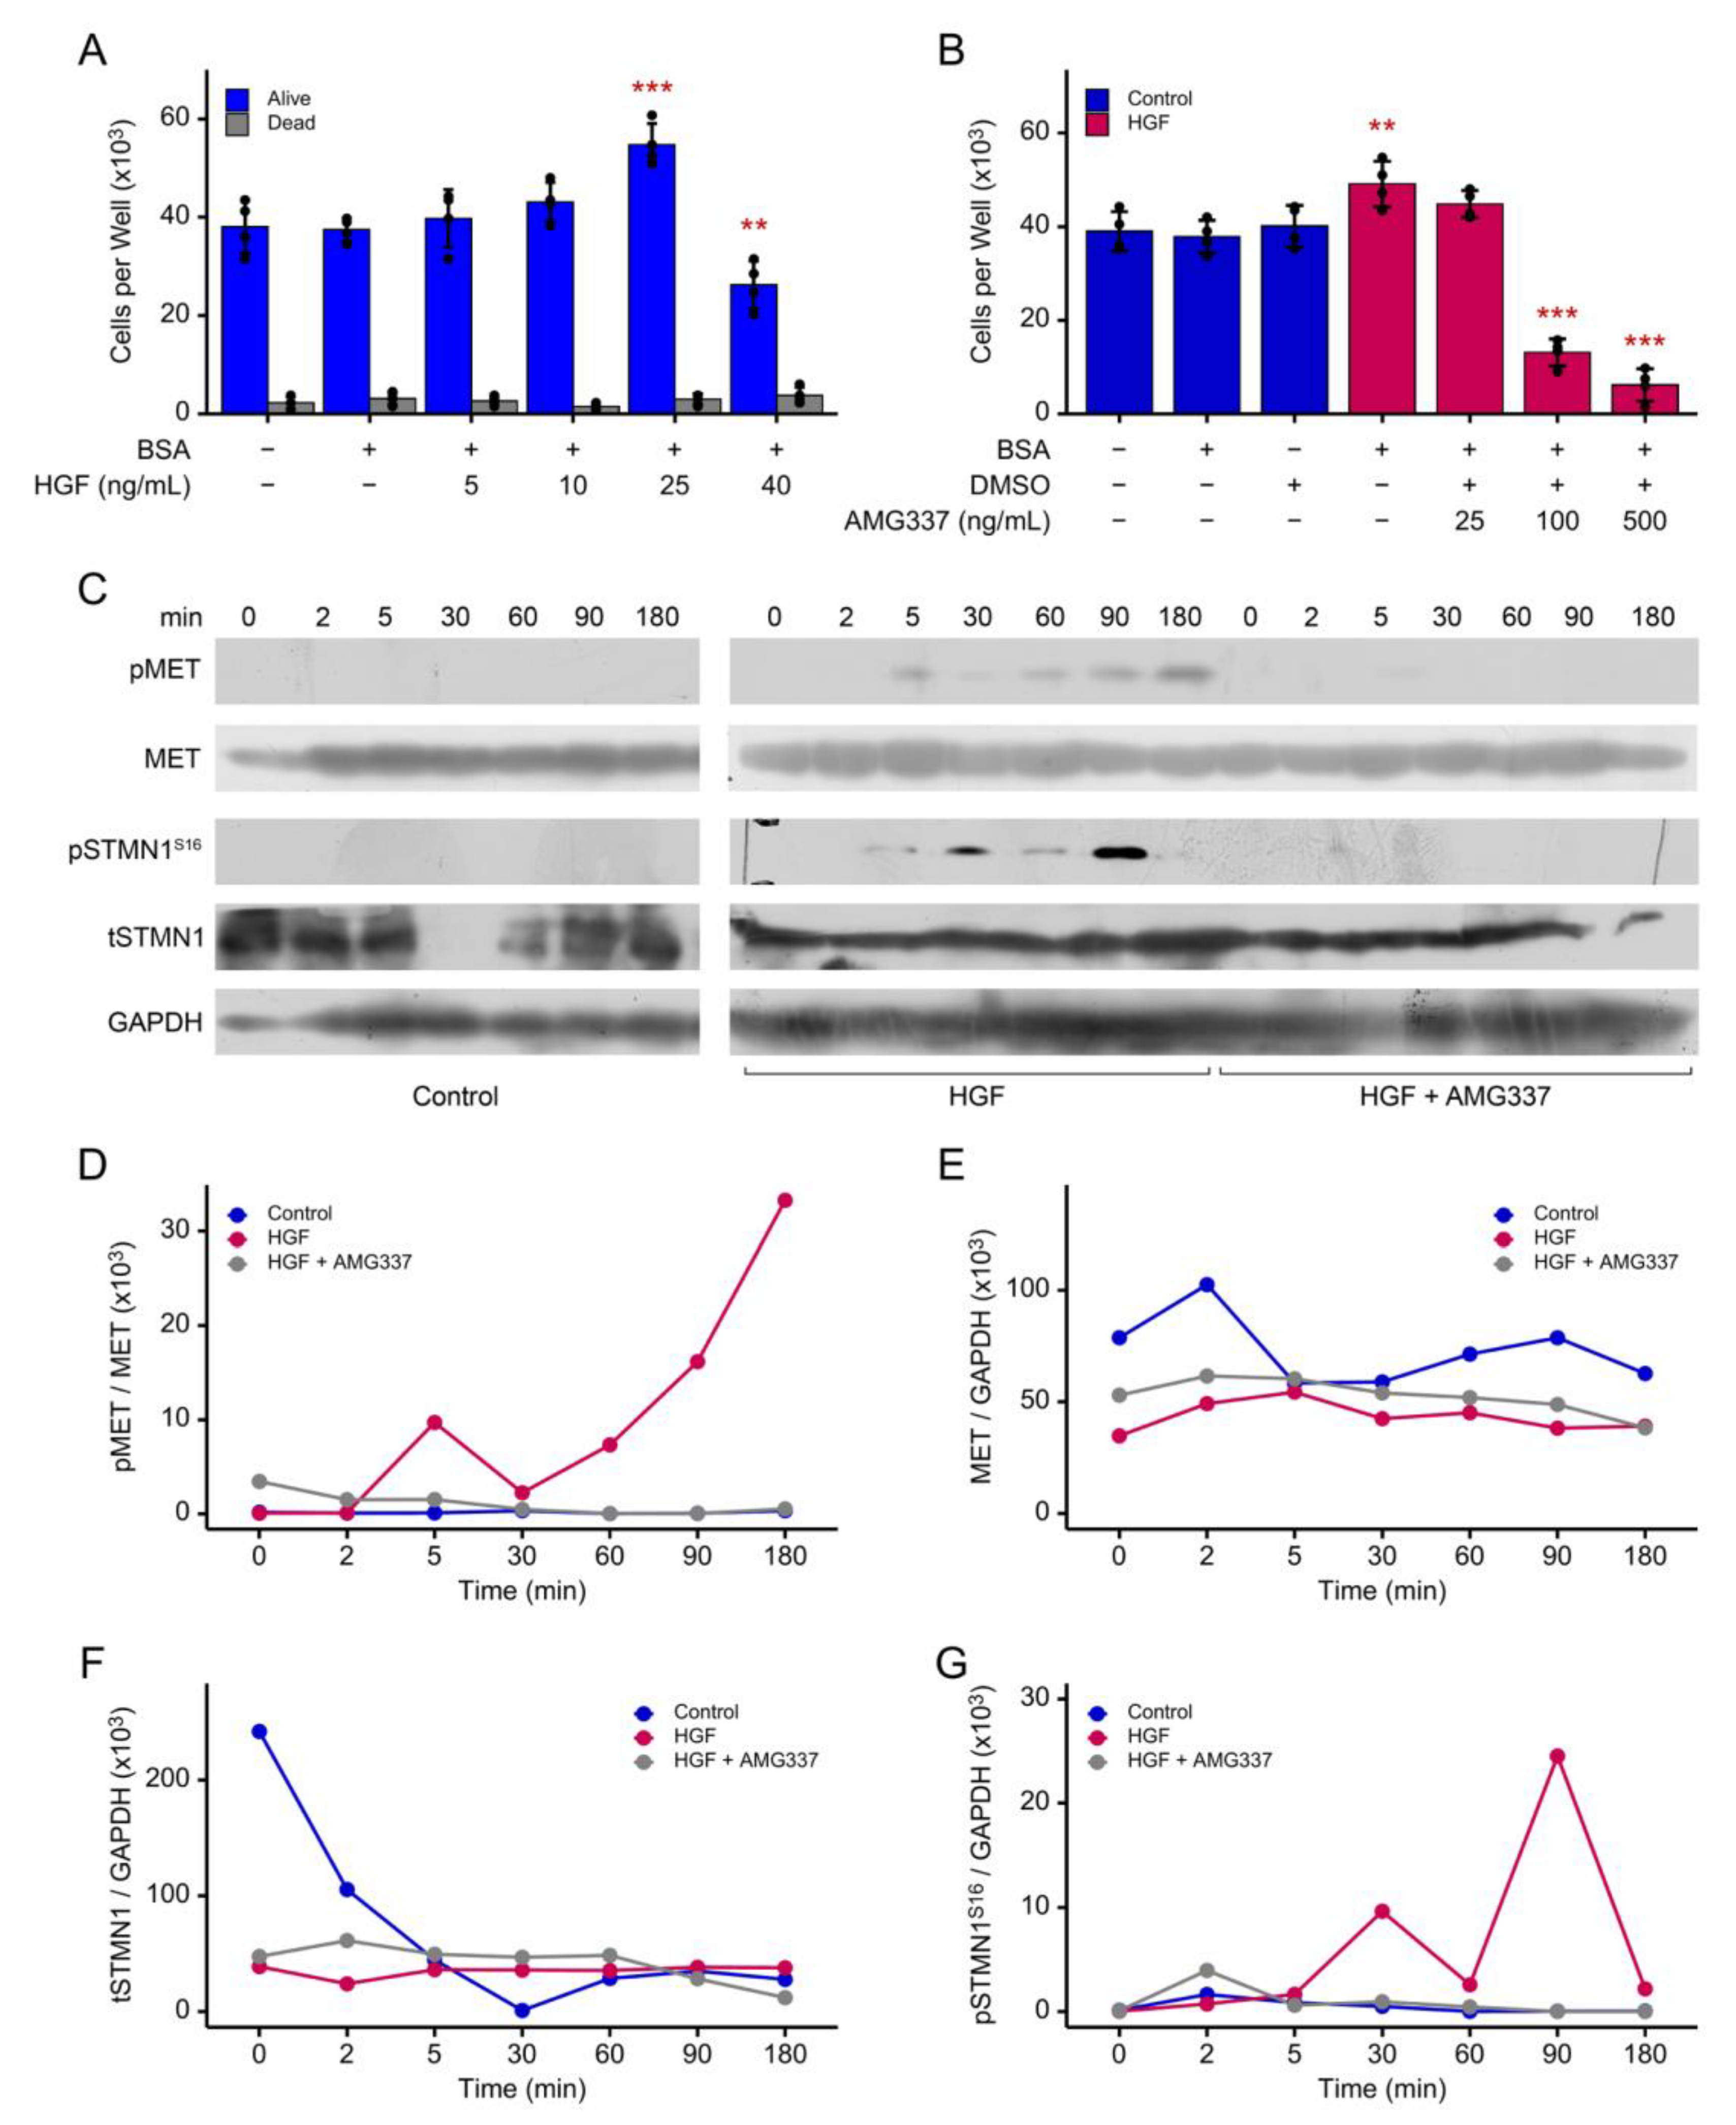
Figure 3.
HGF/MET activity regulates cell doubling and modulates pSTMN1S16 and tSTMN1 levels during cell cycle progression. DU-145 cells were synchronized in early S phase using double thymidine block (as outlined in Figure S3A) and treated with vehicle control, 25 ng/ml HGF, or 25 ng/ml HGF + 100 mg/ml AMG337 for the times indicated; (a), Cell doubling time. Treatment replicates, n=4; independent experimental replicates, n=3; data were presented as mean ± SD; and statistical comparisons were made using one-way ANOVA applying Dunnett’s post-hoc correction for multiple comparisons where *p<0.0001; (b) Flow cytometry was performed and % cell populations in S, G2/M and G1 were determined (FlowJo software). The times spent in G1, S, or G2 phases were marked above the western blots to determine where in the cell cycle pSTMN1S16 and tSTMN1 were expressed. The western blots represent one complete experiment, where cells were treated with vehicle control (c), HGF (f), and HGF+AMG337 (i); and the blots/membranes were placed into the same container and probed first with the pSTMN1 Ser16 antibody, followed by anti-STMN1 and then anti-GAPDH antibodies. The HGF-treated group clearly expressed both pSTMN1S16 and tSTMN1 and these blots served as positive controls for the vehicle control and HGF+AMG337 blots expressing low/no levels of pSTMN1S16 or tSTMN1. The relative levels of pSTMN1S16 and tSTMN1 expression in vehicle control (d,e), HGF (g,h) and HGF+AMG337 (j,k) were determined by densitometry (ImageJ software). Given that total STMN1 expression levels varied down to undetectable levels (densitometry value=0) in response to HGF/MET activity during the cell cycle, it was not possible to compare pSTMN1S16/tSTMN1. Therefore, pSTMN1S16 levels were compared to the GAPDH control as this most closely represented band intensity of pSTMN1S16 expression on the western blots. Independent experimental replicates, n=3.
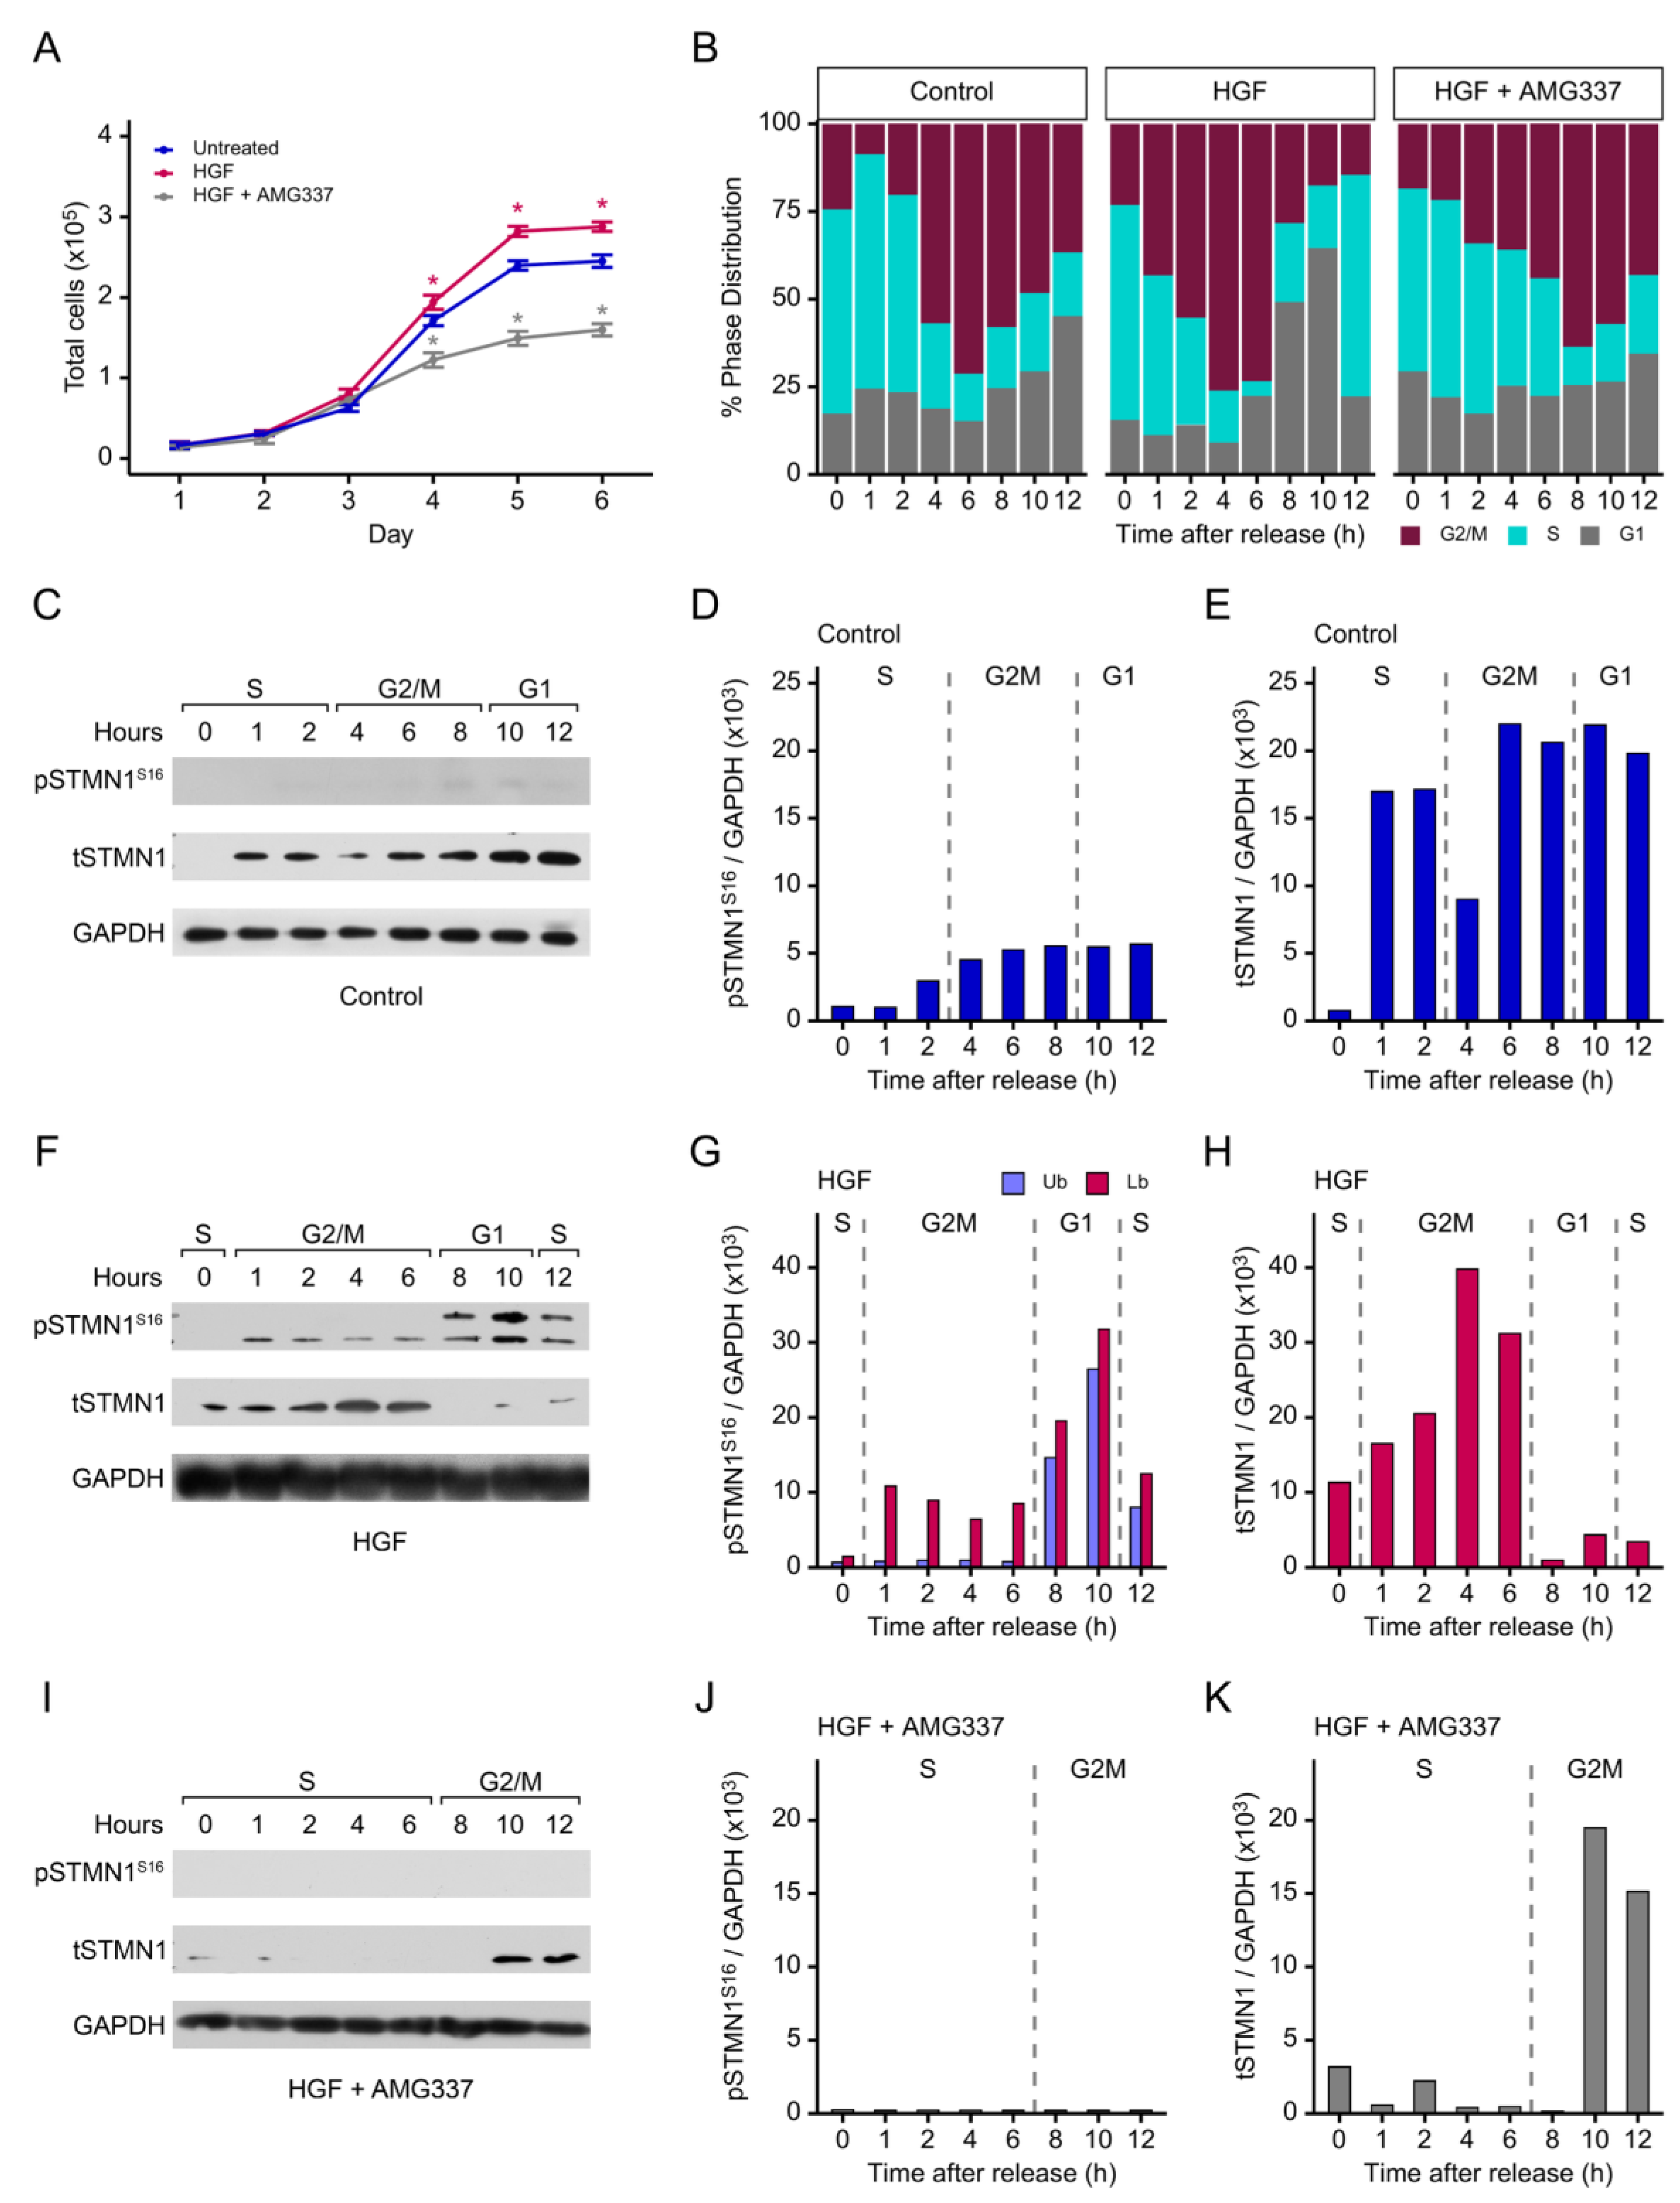
Figure 4.
Cyclin and p21 levels are co-regulated with pSTMN1S16 during the cell cycle. To dissect the involvement of pSTMN1S16 in the cell cycle, DU-145 cells were synchronized in early S phase using double thymidine block and treated with vehicle control, 25 ng/ml HGF, or 25 ng/ml HGF + 100 mg/ml AMG337 for the times indicated. The western blots represent one complete experiment as described in Figure 3, and westerns blots were probed with anti-cyclin D1, -cyclin E1, -cyclin A2, -cyclin B1 and -cyclin GAPDH (a) and -p21 (b) as indicated. Relative intensity of expression was analyzed by densitometry (ImageJ software) in response to vehicle (c, d), HGF (e, f), and HGF+AMG337 (g, h). The approximate times spent in G1, S, or G2/M phases are marked above the western blots and densitometric analysis. Independent experimental replicates, n=3.
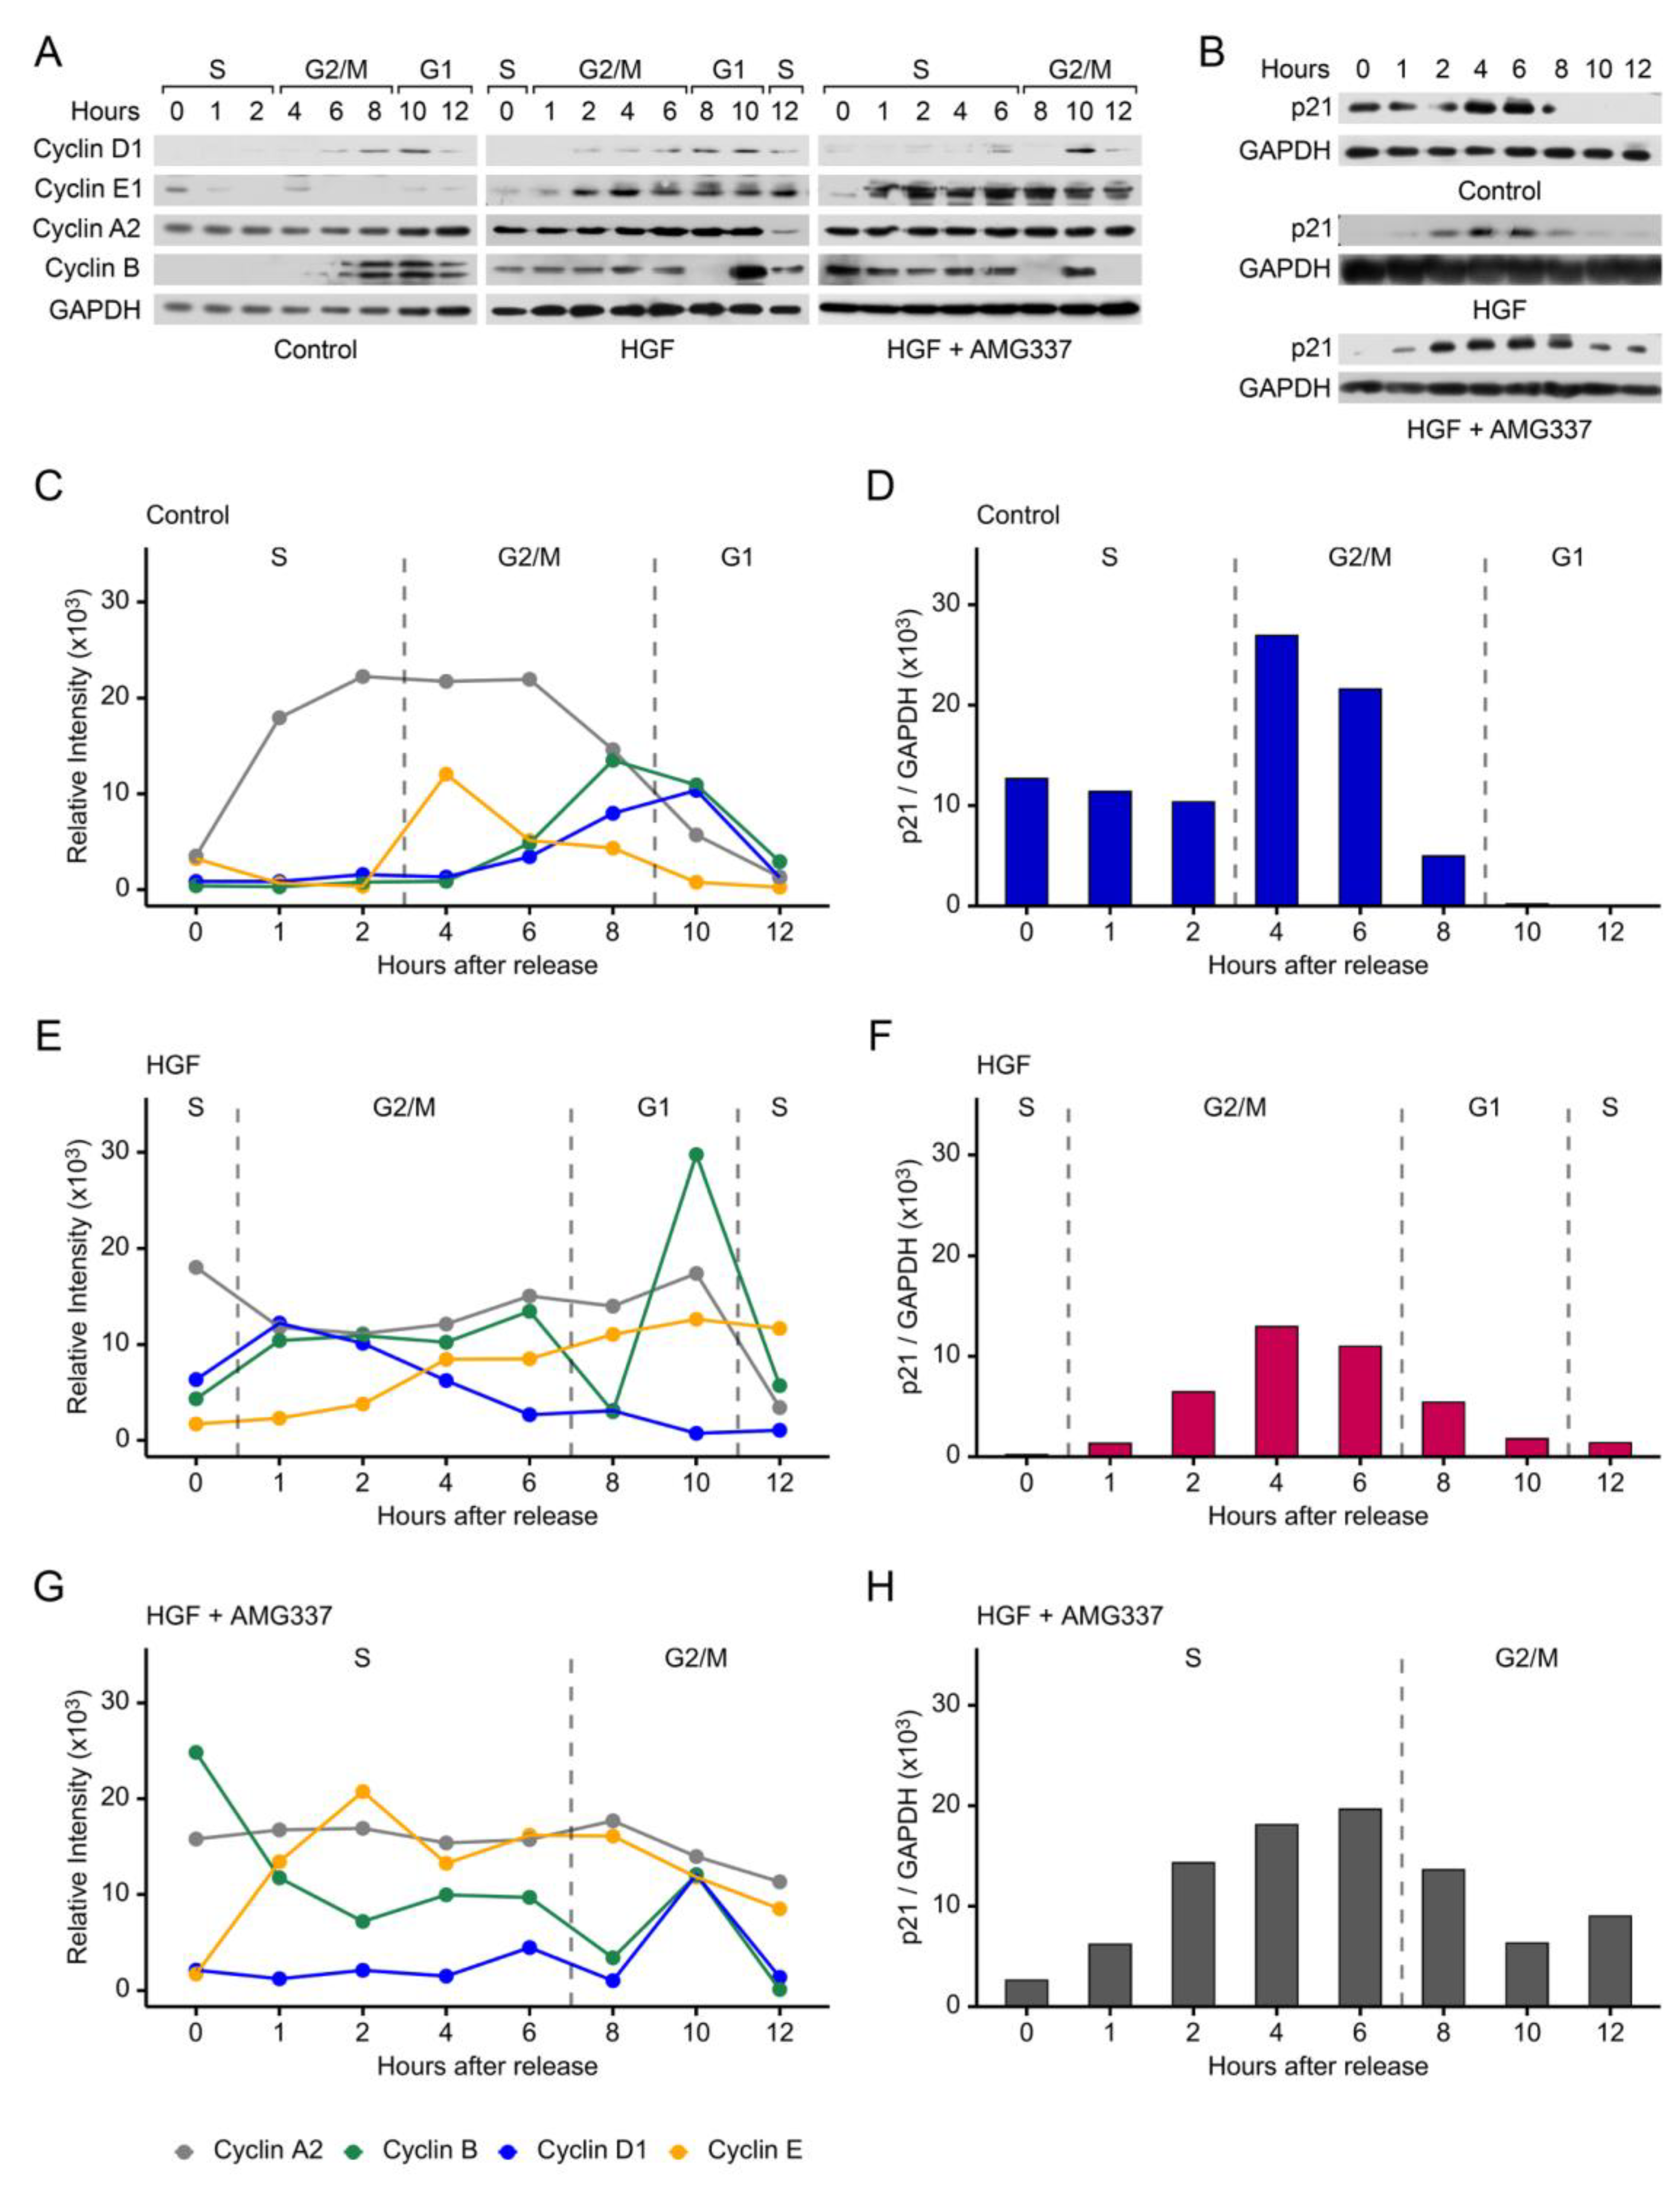
Figure 5.
STMN1S16E alone is sufficient for promoting cell cycle progression and growth. (a) and (b), Cell proliferation assays. DU-145 cells that were transfected with the pECFP empty vector control, or with pECFP expressing wild type (wt) STMN1, or S16, S25, S38, S63 substitution mutants where S was substituted with alanine (A) or glutamic acid (E) to mimic dephosphorylation and phosphorylation respectively (detailed in Figure S3C and Table S2). In 4A, all 4 serines were substituted with A, and in 4E, all 4 serines were substituted with E. Additional controls: UT, untransfected control; pLKO.1 control (containing scrambled RNA), pLKO.1/shSTMN1 [44]; (c) Cell doubling time. DU-145 cells were transfected with the plasmids as indicated and synchronized in early S phase using double thymidine block (protocol outlined in Fig. S3B). Cells were counted on days 1 through 6 after time of release. (a-c) Treatment replicates, n=4; independent experimental replicates, n=3; and data were presented as mean ±SD. Statistical comparisons were made using one-way ANOVA applying Dunnett’s post-hoc correction for multiple comparisons where *p<0.01, **p<0.001; (d), Flow cytometric analysis (FlowJo software). Cells were transfected with control vectors pECFP or pLKO.1, or STMN1S16E, STMN1S16A or pLKO.1/shSTMN1, synchronized in G1/S, and the % cell populations in S, G2/M and G1 were determined. A representative flow cytometric analysis was presented; independent experimental replicates, n=3.
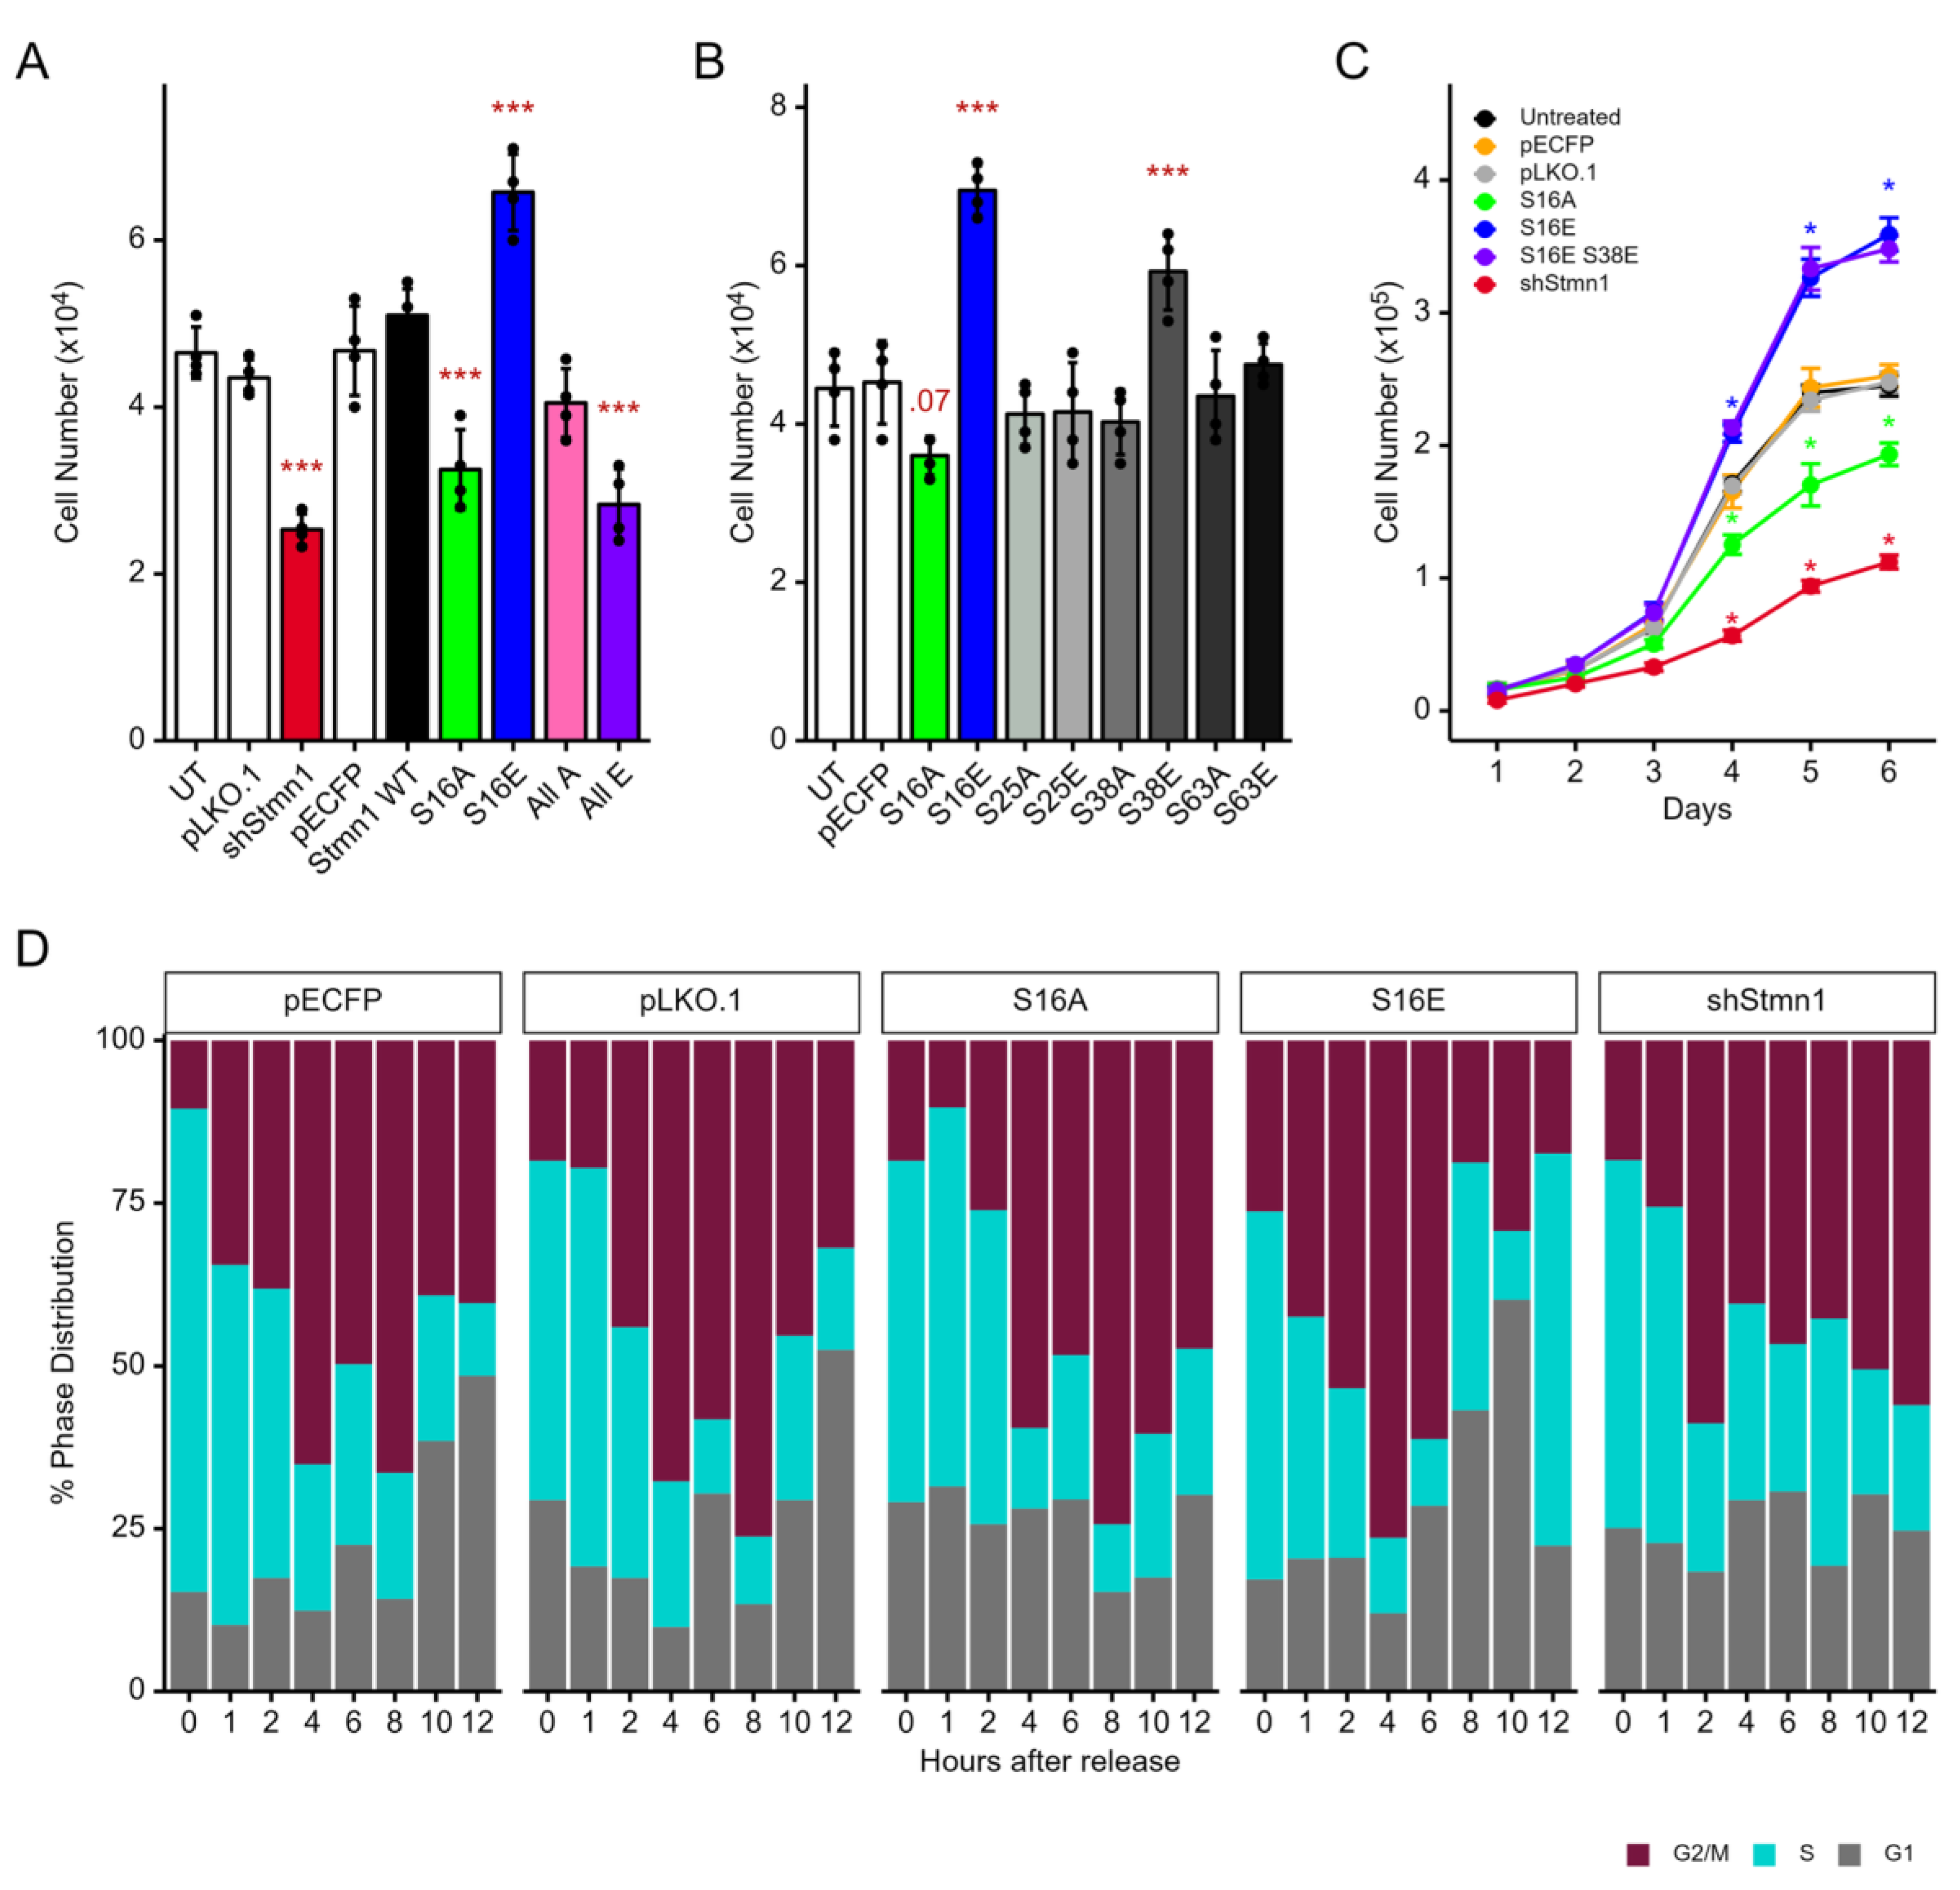
Figure 6.
STMN1S16 phosphorylation status regulates total STMN1 and cell cycle protein expression. DU-145 cells were transfected with pECFP/STMN1S16E (b, e, h) or pECFP/STMN1S16A (c, f, i), synchronized in early S phase using double thymidine block, and collected every h for 12 h after release from thymidine block. Westerns blots were probed with anti-STMN1 (a), anti-cyclin D, -cyclin E1, -cyclin A2, and -cyclin B1 (d) and -p21 antibodies (g), and relative intensity of expression was analyzed by densitometry for STMN1 (b, c), the cyclins (e, f), and p21 (h, i). Representative western blots and densitometry were shown; independent experimental replicates, n=3. Untransfected cells treated with vehicle, HGF, or HGF+AMG337 in Fig. 3 served as controls for tSTMN1 expression to determine whether STMN1S16E or STMN1S16A regulated tSTMN1 expression levels. In addition, untransfected cells treated with vehicle, HGF, or HGF+AMG337 in Fig. 4 served as controls for cyclin and p21 expression to determine whether STMN1S16E or STMN1S16A regulated their expression and activated or inhibited cell cycle progression.
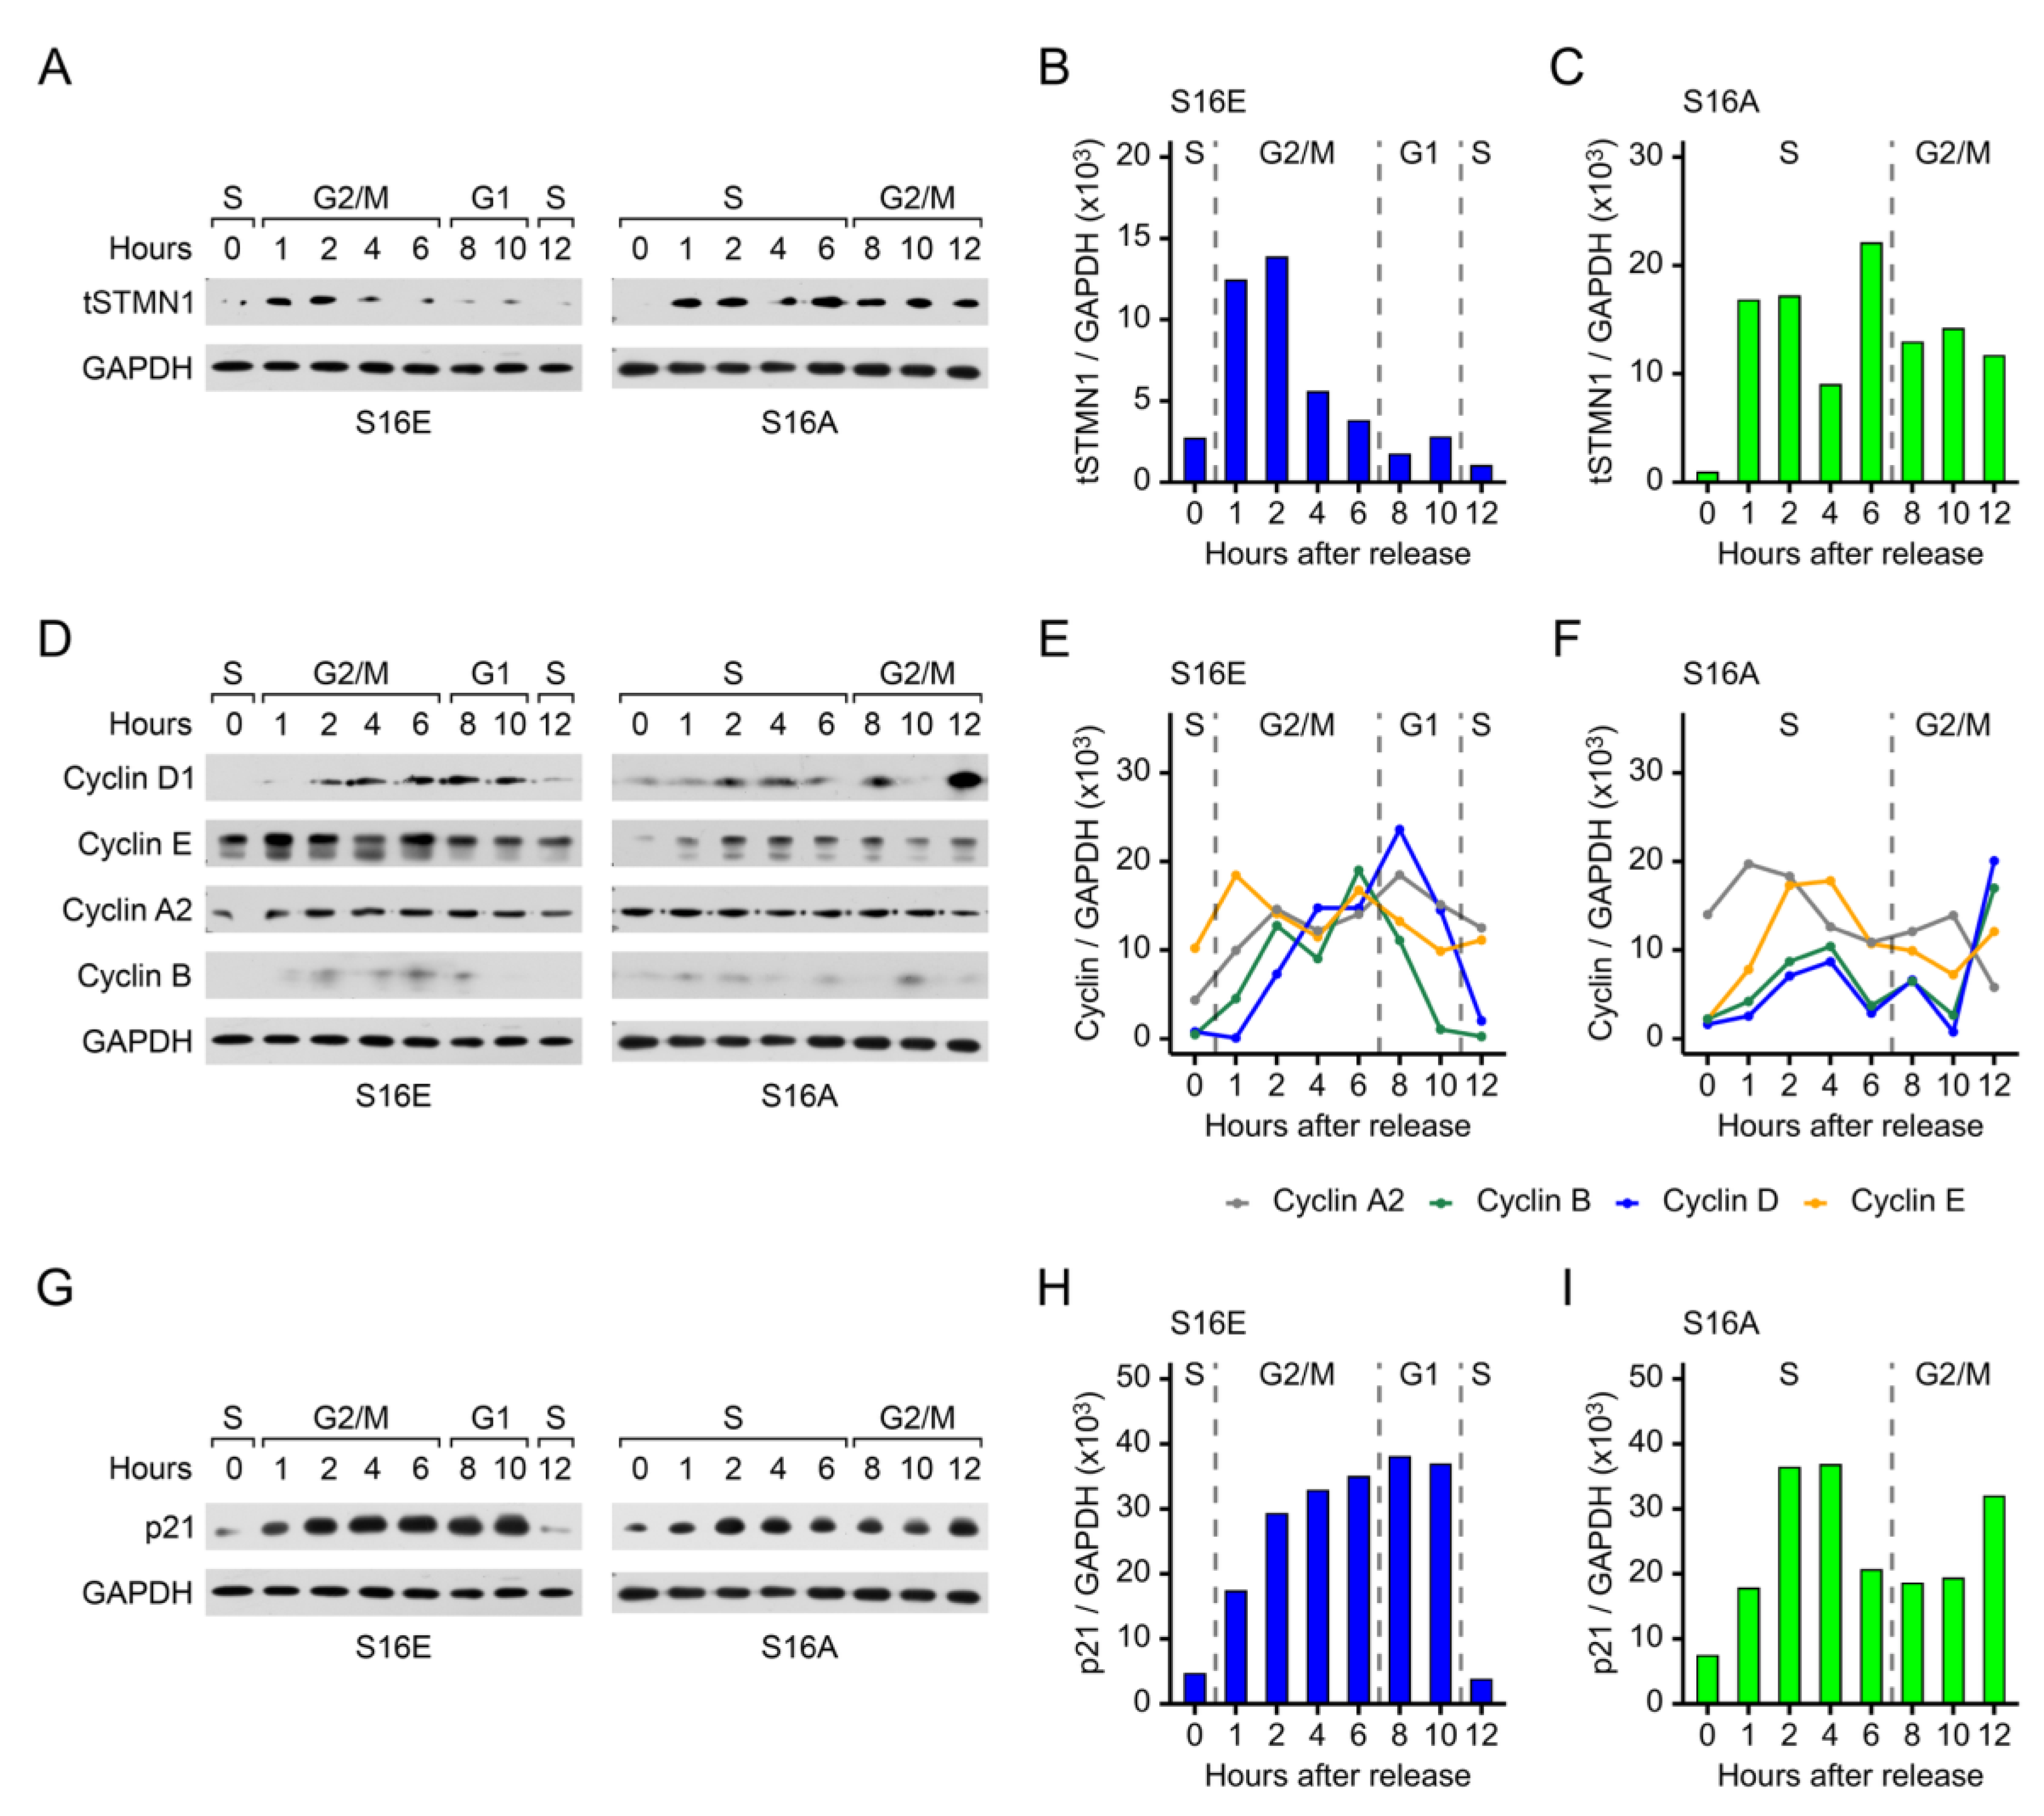
Figure 7.
NMuMG and DU-145 cell proliferation, but not metastatic potential, is modulated by STMN1S16 phosphorylation. (a) NMuMG and (b) DU-145 cells were transfected with the indicated plasmids and cell numbers were determined using the Trypan Blue Exclusion Test; (c) NMuMG cell doubling time. NMuMG cells were transfected according to the protocol outlined in Figure S3B and synchronized in early S phase using double thymidine block. Cells were counted on days 1 through 6 after time of release; (d), NMuMG cells were either treated with vehicle control, transfected with pECFP, or shSTMN1, to serve as a positive invasion assay control (e-f), DU-145 and (g-h), NMuMG cells were treated with vehicle control, or transfected with pECFP, pECFP/STMN1S16E, or pECFP/STMN1S16A as indicated. Neuroprobe migration (e,g) and invasion (f, h) assays using non-coated and Corning® Matrigel® Growth Factor Reduced (GFR) (Life Sciences, Cat. #354230)-coated membranes respectively, were performed as described previously [44]. Images of wells containing migrating or invading cells are provided in Figure S4. Treatment replicates, n=4; independent experimental replicates, n=3; and data were presented as mean ±SD; Statistical comparisons were made using one-way ANOVA applying Dunnett’s post-hoc correction for multiple comparisons for (a-c), and Tukey’s post-hoc correction for multiple comparisons for (d-h), where * p<0.05, ** p<0.01; (i) Diagrammatic representation of the HGF/MET-mediated regulation of STMN1S16 phosphorylation in the regulation of cell cycle progression, cell proliferation, and metastatic potential designed using BioRender.
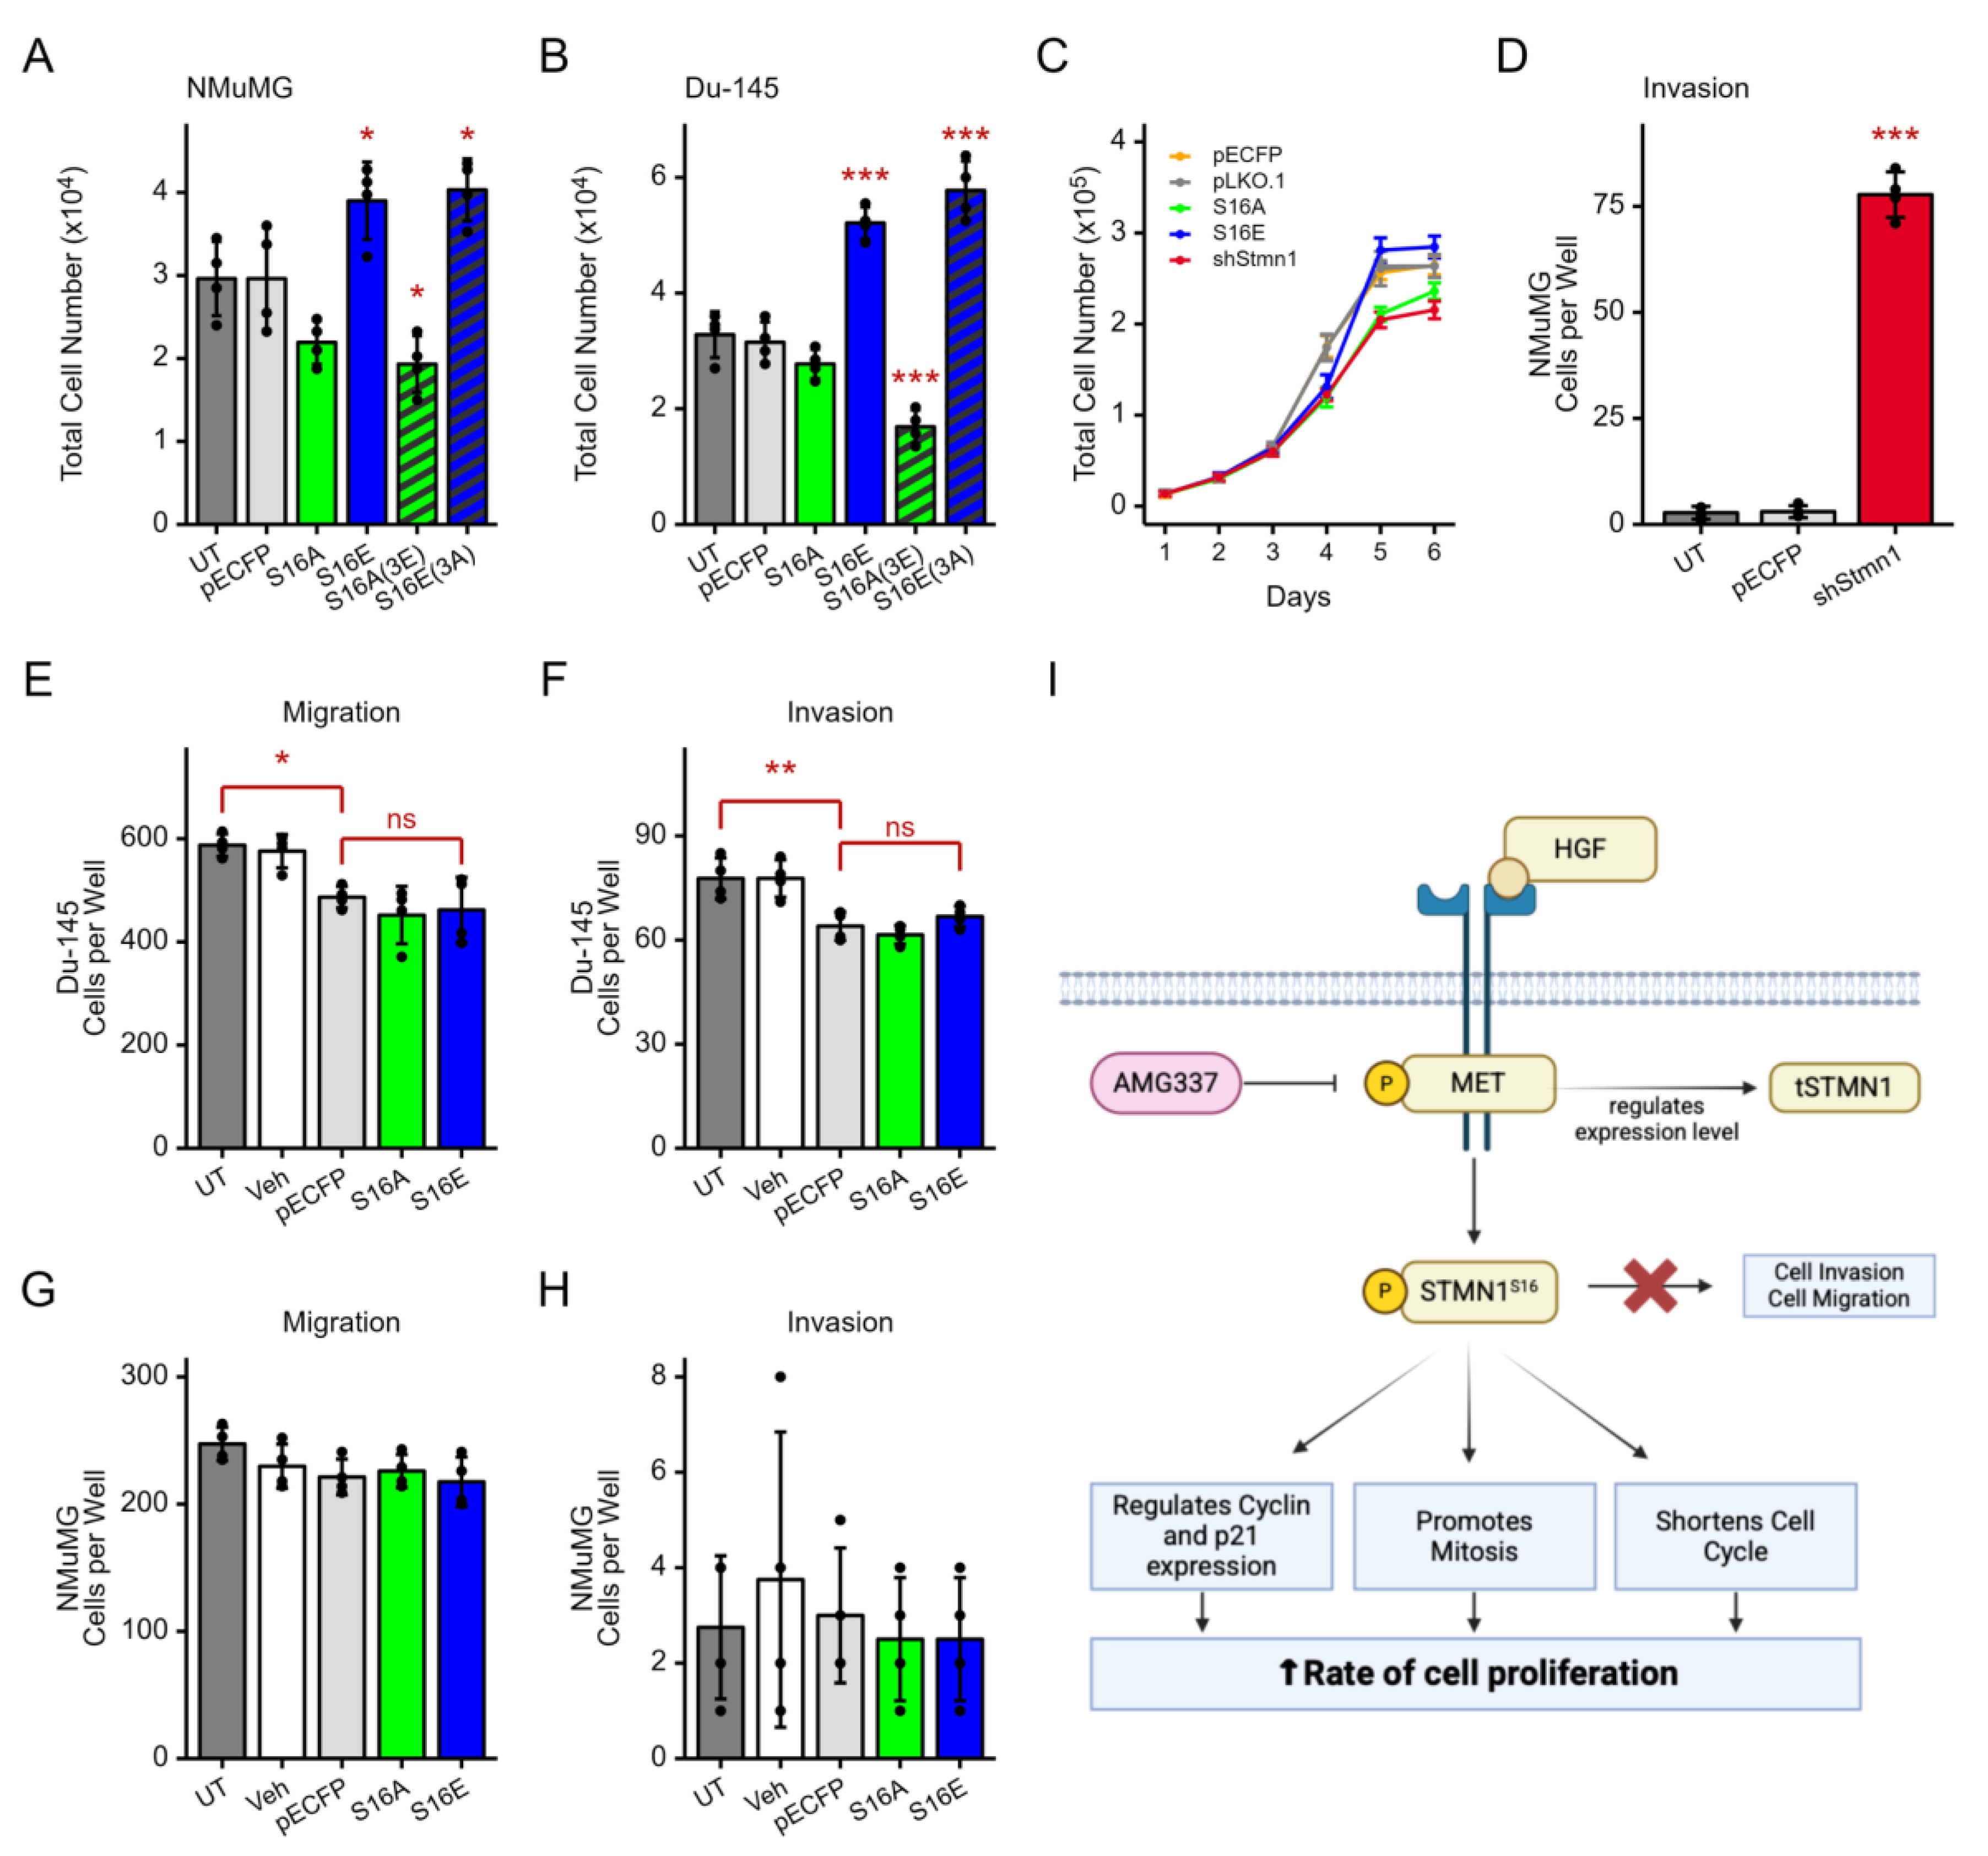
Disclaimer/Publisher’s Note: The statements, opinions and data contained in all publications are solely those of the individual author(s) and contributor(s) and not of MDPI and/or the editor(s). MDPI and/or the editor(s) disclaim responsibility for any injury to people or property resulting from any ideas, methods, instructions or products referred to in the content. |
© 2025 by the authors. Licensee MDPI, Basel, Switzerland. This article is an open access article distributed under the terms and conditions of the Creative Commons Attribution (CC BY) license (http://creativecommons.org/licenses/by/4.0/).
Copyright: This open access article is published under a Creative Commons CC BY 4.0 license, which permit the free download, distribution, and reuse, provided that the author and preprint are cited in any reuse.


