
Submitted:
29 May 2025
Posted:
29 May 2025
You are already at the latest version
Abstract
This study presents a monolithic silicalite-1 catalyst support designed for tritium oxidation in wet conditions. A monolithic molecular sieve (sil-s) was fabricated via secondary crystallization (175°C, 24 h) converting the silica binder into silicalite-1. XRD revealed a 150% crystallinity increase with narrowed (101) peak width (FWHM: 0.42°→0.31°), confirming enhanced structural ordering. FTIR/²⁹Si NMR demonstrated a 50% reduction in silanol defects, attributed to Si–OH healing during the secondary crystallization. Water adsorption decreased by 49%, directly linking defect reduction to hydrophobicity enhancement. After loading the monolithic silicalite-1 with 2% platinum, the catalysts showed enhanced stability in wet conditions, with only a decline of 0.01%/min over 800 minutes. This work fabricate low-gas-resistance, moisture-resistant catalysts, advancing tritium management in fusion energy systems.
Keywords:
silicalite-1
; defect engineering
; hydrophobicity
; tritium removal
; monolithic catalyst
1. Introduction
The rapid development of nuclear energy in China and the advancement of the International Thermonuclear Experimental Reactor (ITER) program[1] have propelled fusion energy toward engineering applications. Tritium (T), as both the fuel and primary radioactive byproduct in fusion reactors, poses significant safety challenges due to its β-radiotoxicity (half-life: 12.3 years), high isotopic exchange reactivity, and water solubility that facilitates biological uptake through respiration[2]. Effective tritium management, particularly through Air Detritiation Systems (ADS), is therefore critical for ensuring nuclear safety and regulatory compliance[3].
Conventional catalytic oxidation-zeolite adsorption systems rely on Pt/Al₂O₃ catalysts operating above 200°C to convert gaseous HT into HTO (tritiated water), followed by molecular sieve adsorption[4]. However, this energy-intensive approach necessitates complex thermal management and introduces reliability risks under accident conditions[5].
A critical challenge persists: competitive water vapor adsorption (1–5% in the process stream) severely poisons catalysts at <60 °C[6]. To improve the catalytic activity at room temperature, a catalyst should has little absorbing capacity for water vapor. Recent advancements in room-temperature detritiation Pt/ASDBC (alkyl-styrene diviyl-benzene copolymer) catalysts have demonstrated promising alternatives[7] . However, organic hydrophobic polymer has weak stability at temperatures above 350 °C, Instead, the pure silica silicalite-1 has been used for as the support for humidity-tolerant Pt/silicalite-1 catalysts in H2 and tritium oxidation reaction[5].
For practical application of zeolite catalyst, power catalysts have to be shaped with the addition of a binder[8]. However, the binder (alumina, silica, clay etc.) will deteriorate the catalytic performance by blocking or modifying the catalytic sites. A binder-free shaped zeolite catalyst can overcome these shortcomings.
This study develops a binder-free monolith fabrication strategy for zeolite silicalite-1. Using silica as the binder for silicalite-1 combined with a secondary DGC(dry gel conversion)crystallization enables the binder conversion to silicalite-1. This strategy produces a binder-free monolithic silicalite-1.
2. Results and Discussion
2.1. Shaping of Sil to Binder-Free Sil-s
The XRD analysis (Figure 1) reveals distinct structural evolution across samples. Pristine silicalite-1(sil) exhibits characteristic MFI-type silicalite-1 diffraction peaks at 2θ = 7.9°, 8.8°, and 23.1° (JCPDS No. 48-0072), with the (101) plane reflection (23.1°) showing an FWHM of 0.42°.
The (101) peak intensity of sil-s is 1.5 times that of sil and 2.1 times that of sil-mix, but FWHM shrinks to 0.31° suggesting improved structural ordering. The increase in crystallinity means that the silica binder has been fully converted into silicalite-1 in the secondary crystallization conditions.
Figure 2 delineates the morphological progression of silicalite-1 architectures via TEM analysis. The pristine silicalite-1 (sil, left) exhibits characteristic hexagonal plate-like crystals (~200 nm) with well-defined lattice fringes (0.39 nm d-spacing, indexed to the MFI (101) plane). The sil-mix (middle) displays a composite structure, featuring zeolite surfaces densely decorated with amorphous silica species. In contrast, the consolidated sil-s monolith (right) achieves full amorphous phase elimination, with ~110 nm newly-formed crystallites.
The FTIR spectrum of sil (Figure 3) exhibits sharp peaks at 3726 cm⁻¹ and 3680 cm⁻¹ assigned to internal silanols within the MFI framework. A broadened absorption band centered at 3550 cm⁻¹ corresponds to hydroxyl nests [(Si-OH)ₙ, n≥3] formed by vicinal silanols. Notably, the absence of a characteristic peak at 3745 cm⁻¹ (typically ascribed to external isolated hydroxyls) is attributed to spectral overlap with the dominant internal silanol signal at 3726 cm⁻¹.
Sil-s reveals silanol suppression compared with sil: integrated intensities of internal silanols (3726 cm⁻¹ and 3680 cm⁻¹) decrease by 21% and 18%, respectively, while the hydroxyl nest signature (3550 cm⁻¹) exhibits a 24% decrease. These reductions in intensity indicate that some defects in the starting zeolite sil were also healed during the conversion of the binder to silicalite-1.
The variation of the defect concentration was quantitatively revealed by 29Si magic angle spinning nuclear magnetic resonance (29Si MAS NMR) technique (Figure 4). The spectra of the starting sil and sil-s at –103 ppm and –115 ppm corresponded to the Q3 structure (HO–Si–(OSi)₃ with silica hydroxyl defects) and the Q4 structure ( Si–(OSi)₄, complete tetra-coordinated silicon). The defect density of sil-s was significantly reduced from 8.6% to 3.8% (Figure 4). This result is consistent with the FTIR analysis (Figure 3) and confirms the reduction of the skeleton defect concentration.
As shown in Figure 5 comparing the water vapor adsorption isotherms of sil with sil-s, the adsorption capacity of sil-s was significantly reduced from 80 mg/g to 41 mg/g (48.8% decrease) at a relative pressure (P/P₀) of 0.90. It indicates that the decrease in the number of hydrophilic defect sites can lead to the improvement of sil-s.
2.2. Characterization and Catalytic Properties of Pt/sil and Pt/sil-s After Loading Sil and Sil-s by Pt
The surface elemental states of Pt/sil and Pt/sil-s catalysts were analyzed by X-ray photoelectron spectroscopy (Figure 7). It can be seen that platinum in the catalyst are due to metallic platinum (Pt0) and divalent platinum (Pt2+) appeared, and Pt0 is dominant with a binding energy of 71.2 eV. The low contents of Pt2+ indicates some degree of oxidation.
Figure 8 shows the transmission electron micrographs (TEM) of Pt/sil and Pt/sil-s. The average particle size of both catalysts is 21 nm. Table 2 shows the CO chemisorption data of Pt/sil and Pt/sil-s catalysts, which show similar noble metal dispersion and noble metal particle sizes, which are consistent with the transmission electron microscopy.
The hydrogen catalytic oxidation activity test for Pt/sil and Pt/sil-s catalysts is shown in Figure 9. The activity of Pt/sil and Pt/sil-s had similar activity in the dry conditionsand both catalysts decreases steadily. However, Pt/sil-s is more stable than Pt/sil in wet conditions showing activity decrease of only 0.01%/min over 800 minutes. The stability enhancement of Pt/sil-s can be ascribed to the enhanced hydrophobicity of sil-s.
4. Materials and Methods
4.1. Materials Synthesis
The silicalite-1 zeolite (denoted as Sil) was synthesized using tetrapropylammonium hydroxide (TPAOH, 40 wt%, purchased from Beijing Hwrkchemical Co) as the structure-directing agent and tetraethyl orthosilicate (TEOS, 98%, Aladdin) as the silica source. The reaction mixture was prepared according to the stoichiometric ratio of TPAOH:SiO₂:H₂O = 0.4:1:35. Specifically, TPAOH aqueous solution (52.74 g), TEOS (33.75 g), and ultrapure water (62.55 g) were sequentially added to a polytetrafluoroethylene (PTFE)-lined autoclave. The mixture was magnetically stirred at room temperature for 16h to ensure complete hydrolysis of TEOS. Subsequently, the temperature was raised to 80°C and maintained for 3 h, during which ethanol (hydrolysis byproduct) was removed via reduced-pressure distillation, and an equivalent molar amount of ultrapure water was supplemented to maintain liquid-phase equilibrium. The homogenized sol was transferred to a PTFE-lined autoclave for static hydrothermal crystallization at 175°C for 72 h. The resultant product was centrifuged and subjected to four cycles of ultrapure water washing to eliminate residual organic templates. Finally, stepwise calcination was performed in a tube furnace under synthetic air (21% O₂/79% N₂) at 550°C with a heating rate of 5°C/min (6 h per step), yielding highly crystalline silicalite-1.
4.2. Formulation Optimization of Monolithic Silicalite-1
The binder-free monolithic silicalite-1 (denoted as sil-s) was fabricated via secondary crystallization-assisted shaping strategy. The base formulation involved pre-synthesized silicalite-1 (1.6 g), amorphous silica (colloidal silica sol, 0.72 g, 18 wt% of silicalite-1) as a supplementary silicon source, and tetrapropylammonium hydroxide (TPAOH, 0.244 g, 40 wt%, Adamas) as the structure-directing agent. The components were thoroughly mixed in a centrifuge tube under 30 min of mechanical stirring, followed by pre-drying at 80°C for 2 h to form precursor monoliths. The monoliths were then transferred to a polytetrafluoroethylene (PTFE)-lined autoclave with 3 mL of ultrapure water and subjected to hydrothermal crystallization at 175°C for 24 h, enabling the amorphous silica to recrystallize into MFI-type crystals under TPAOH guidance. The final product was washed, dried, and calcined in synthetic air (21% O₂/79% N₂) at 550°C with a two-step protocol (6 h per step) to remove organic templates and reinforce the framework.
For formulation optimization, the molar ratio of amorphous SiO₂ to TPAOH was fixed at 10:1 based on preliminary studies, while the mass fraction of amorphous silica relative to seeds was systematically varied (18%, 24%, and 30%, corresponding to 0.72, 0.96, and 1.20 g of silica sol, respectively) as shown in Table 3. Experimental results revealed that at 30% silica loading, excessive viscosity during hydrothermal treatment induced microcracks and a volumetric shrinkage of 22%. In contrast, the 18% formulation yielded a homogeneous porous structure with <8% shrinkage, meeting industrial catalyst support requirements. Consequently, the 18% silica loading was selected as the optimal ratio as shown in Figure 10.
4.3. Preparation of Pt/sil-s and Pt/sil
A chloroplatinic acid aqueous solution was prepared by dissolving 1 g of chloroplatinic acid reagent in 12.5 mL of ultrapure water. For the preparation of Pt/Sil, 0.5 g of sil zeolite was placed in a clean, dry mortar. Subsequently, 175 μL of the chloroplatinic acid solution (corresponding to a 2 wt% Pt loading) was slowly dripped into the mortar. The mixture was thoroughly homogenized using a pestle, yielding a uniform pale-yellow powder. The powder was transferred to a centrifuge tube and dried in an oven at 80°C for 3 h, followed by further drying at 110°C for 3 h to obtain a dark-gray powder. The dried sample was calcined in a tubular furnace under a synthetic air atmosphere at 400°C for 2 h and then reduced under a 10% H₂/Ar atmosphere at 350°C for 1 h to produce the final Pt/Sil catalyst. The Pt/sil-s catalyst was synthesized using an identical procedure by replacing Sil with 0.5 g of sil-s zeolite during the impregnation step.
5. Conclusions
In this study, a binder-free silicalite-1 monolith was fabricated by a secondary DGC crystallization method in which the binder silica was converted into silicalite-1. The shaped silicalite-1 have increased crystallinity, decreased defect concentration, and increased hydrophobicity. The catalytic stability of the supported Pt catalyst in wet conditions was also improved for the shaped monolith compared with the starting silicalite-1.
Author Contributions
Conceptualization, supervision, C.X.; validation, T.W.; investigation, B.Y.; data curation, B.Y.; writing—original draft preparation, B.Y.; writing—review and editing, C.X. All authors have read and agreed to the published version of the manuscript.
Funding
The authors acknowledge the funding provided by INPC (YC0601).
Data Availability Statement
All data can be provided upon request.
Conflicts of Interest
The authors declare no conflicts of interest.
References
- Fiore, K. Nuclear Energy and Sustainability: Understanding ITER. Energy Policy 2006, 34, 3334–3341. [Google Scholar] [CrossRef]
- Rizzello, C.; Borgognoni, F.; Pinna, T.; Tosti, S. Review of Tritium Confinement and Atmosphere Detritiation System in Hot Cells Complex. Fusion Engineering and Design 2010, 85, 58–63. [Google Scholar] [CrossRef]
- Beloglazov, S.; Camp, P.; Hayashi, T.; Lepetit, L.; Perevezentsev, A.; Yamanishi, Y. Configuration and Operation of Detritiation Systems for ITER Tokamak Complex. Fusion Engineering and Design 2010, 85, 1670–1674. [Google Scholar] [CrossRef]
- Iwai, Y.; Sato, K.; Taniuchi, J.; Noguchi, H.; Kubo, H.; Harada, N.; Oshima, Y.; Yamanishi, T. Room-Temperature Reactor Packed with Hydrophobic Catalysts for the Oxidation of Hydrogen Isotopes Released in a Nuclear Facility. Journal of Nuclear Science and Technology 2011, 48, 1184–1192. [Google Scholar] [CrossRef]
- Xiao, C.; Yang, Y.; Zhou, X.; Du, Y.; Tan, Z. Humidity-Tolerant H2O2 Recombination Platinum Catalyst for Mitigating Hydrogen Using Silicalite-1 as Support. Microporous and Mesoporous Materials 2019, 279, 395–399. [Google Scholar] [CrossRef]
- Iwai, Y.; Sato, K.; Yamanishi, T. Development of Pt/ASDBC Catalyst Applicable for Hydrogen Oxidation in the Presence of Saturated Water Vapor at Room Temperature. 2010, 9, 332–337.
- Iwai, Y.; Sato, K.; Yamanishi, T. Development of Pt/ASDBC Catalyst for Room Temperature Recombiner of Atmosphere Detritiation System. Fusion Engineering and Design 2011, 86, 2164–2167. [Google Scholar] [CrossRef]
- Lakiss, L.; Gilson, J.-P.; Valtchev, V.; Mintova, S.; Vicente, A.; Vimont, A.; Bedard, R.; Abdo, S.; Bricker, J. Zeolites in a Good Shape: Catalyst Forming by Extrusion Modifies Their Performances. Microporous and Mesoporous Materials 2020, 299, 110114. [Google Scholar] [CrossRef]
Figure 1.
XRD patterns of sil ,sil-mix,sil-s.
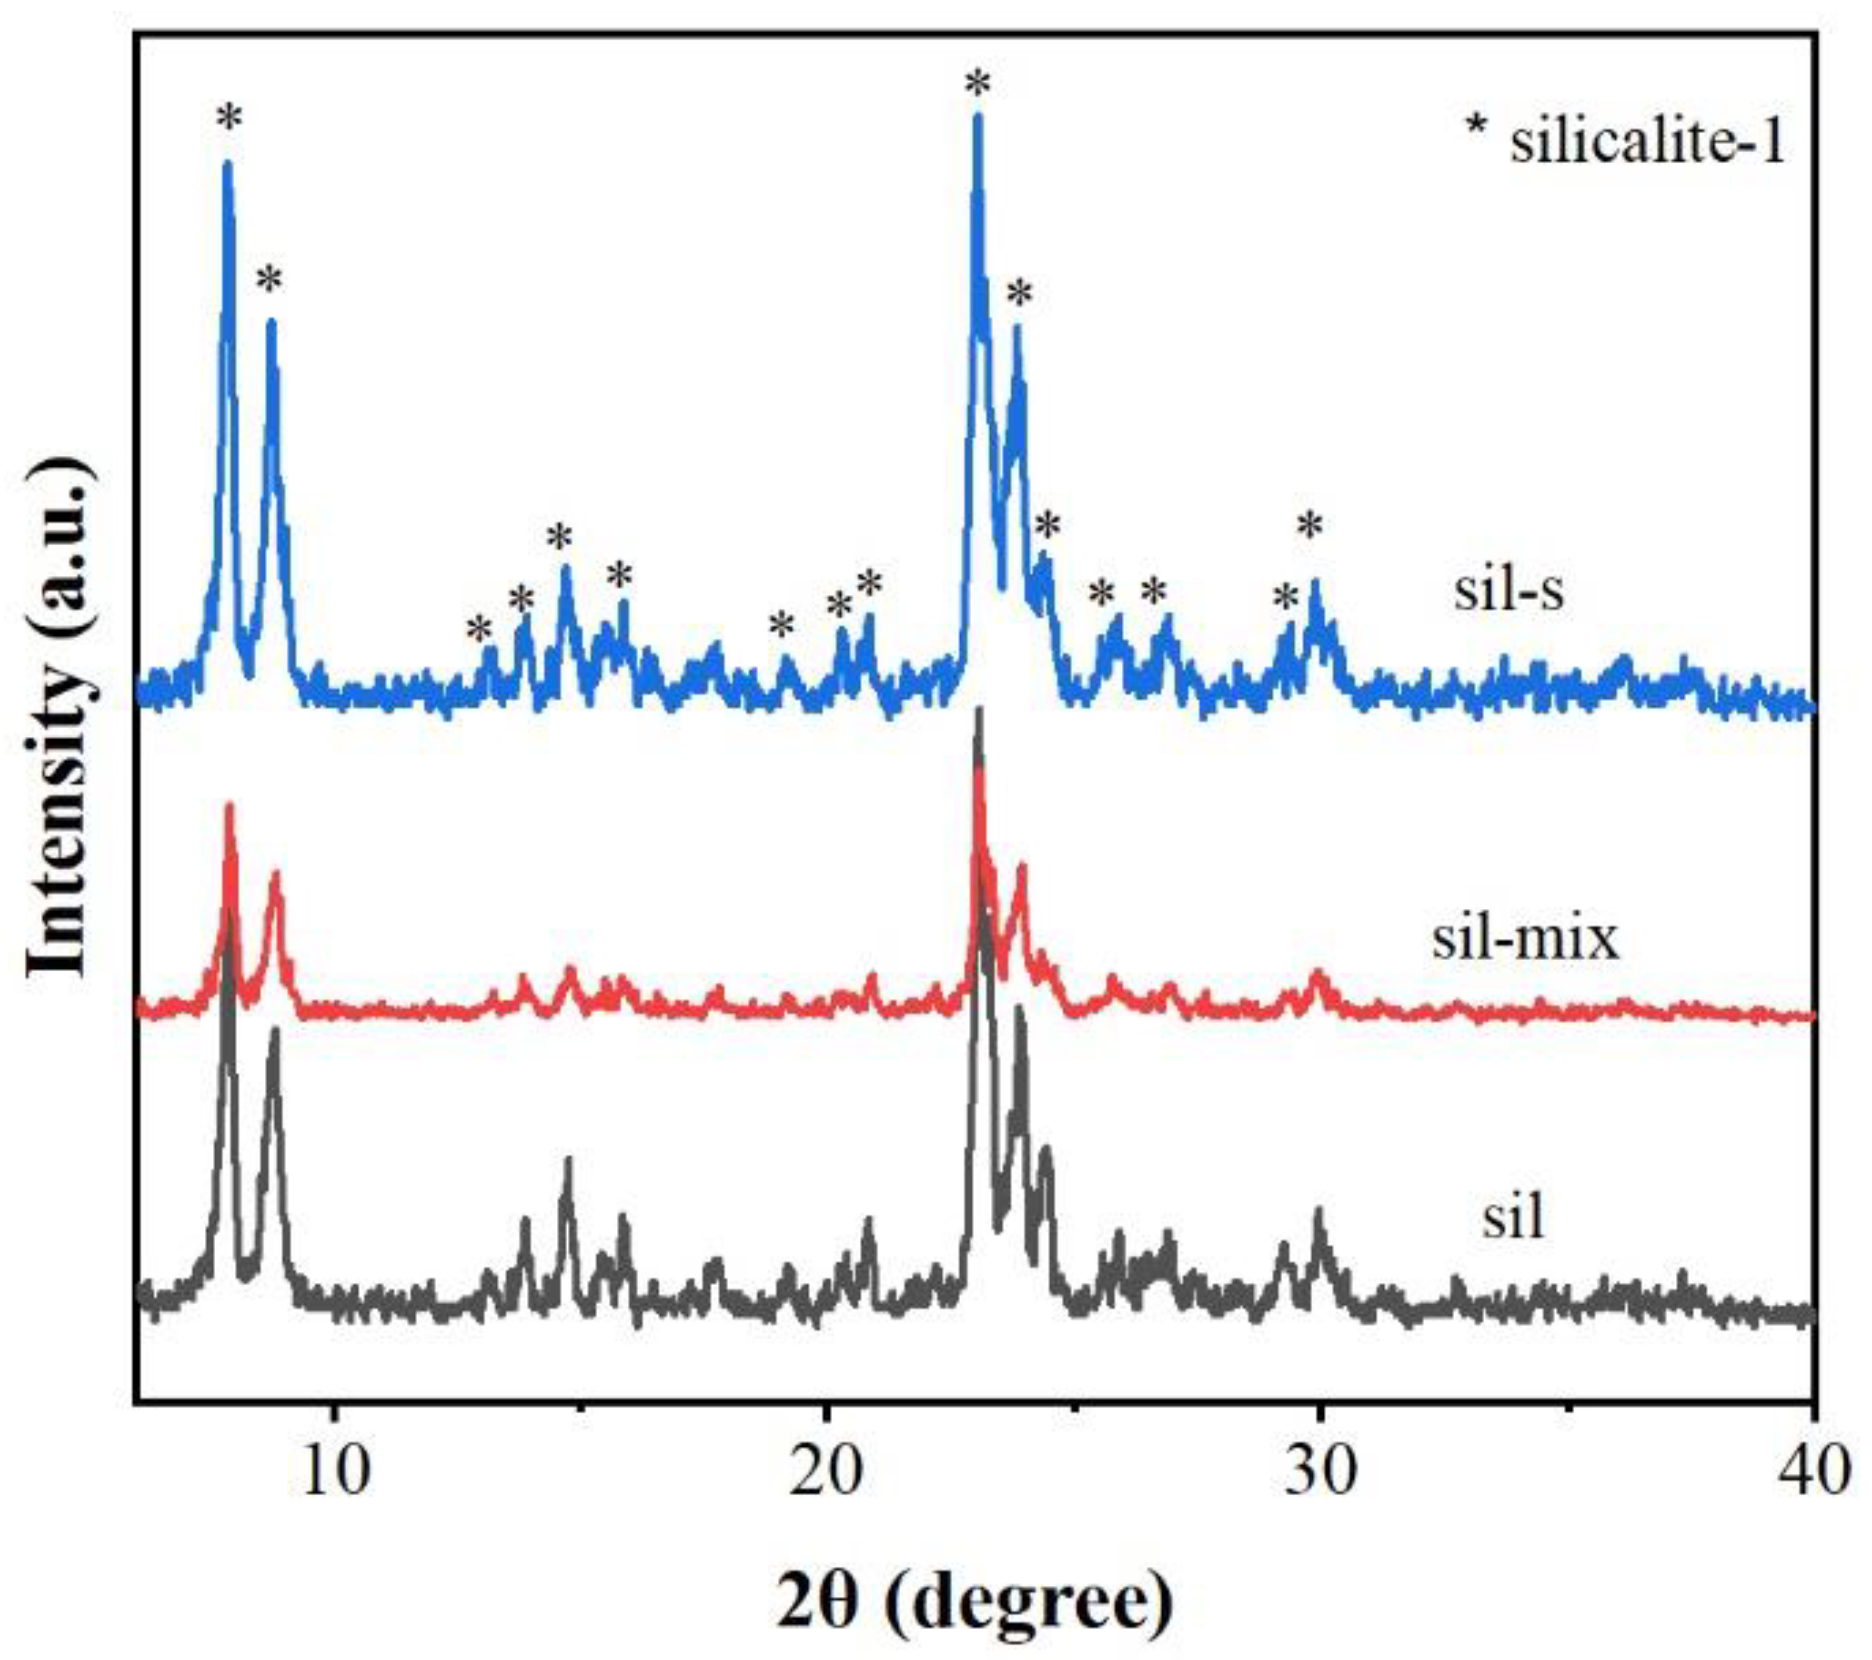
Figure 2.
TEM images of sil ,sil-mix,sil-s.
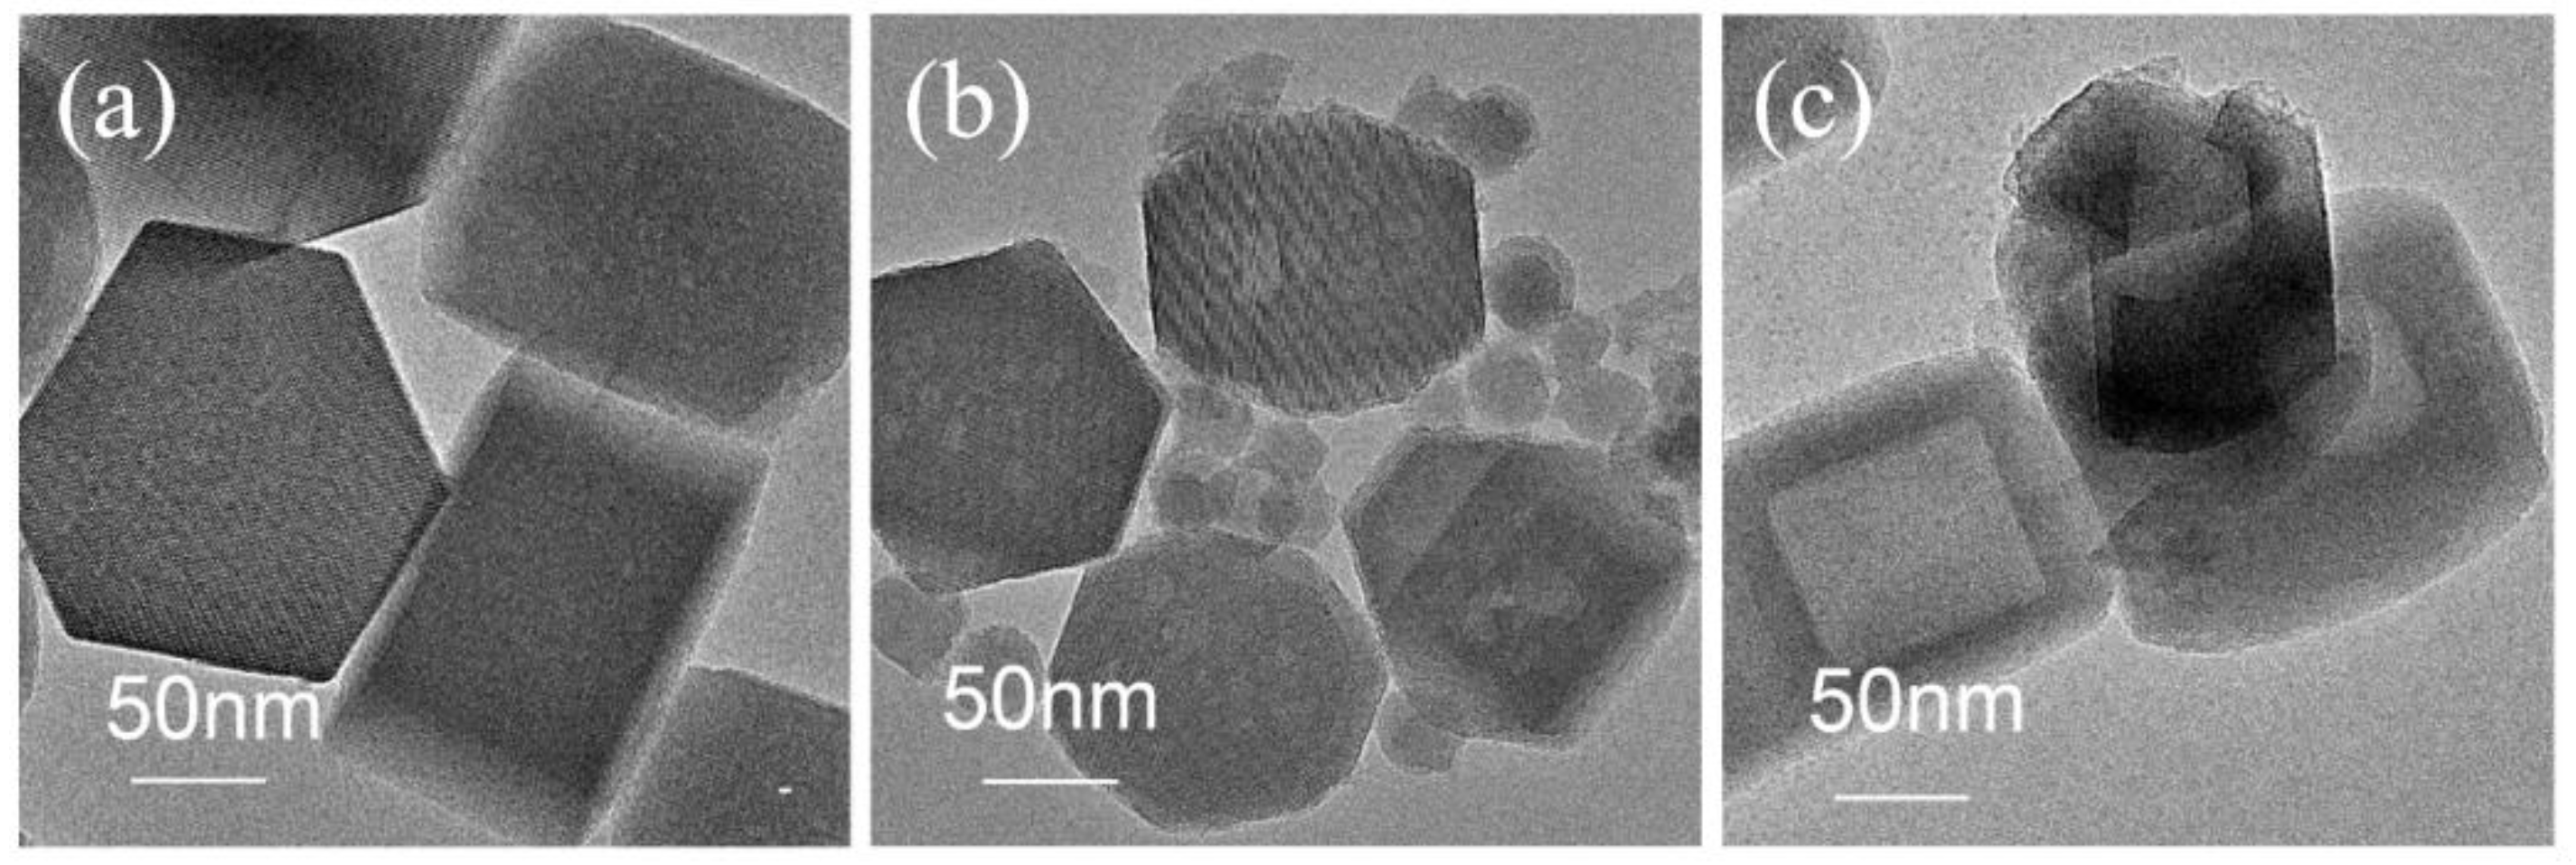
Figure 3.
Fourier-transform infrared (FTIR) spectra of sil and sil-s.
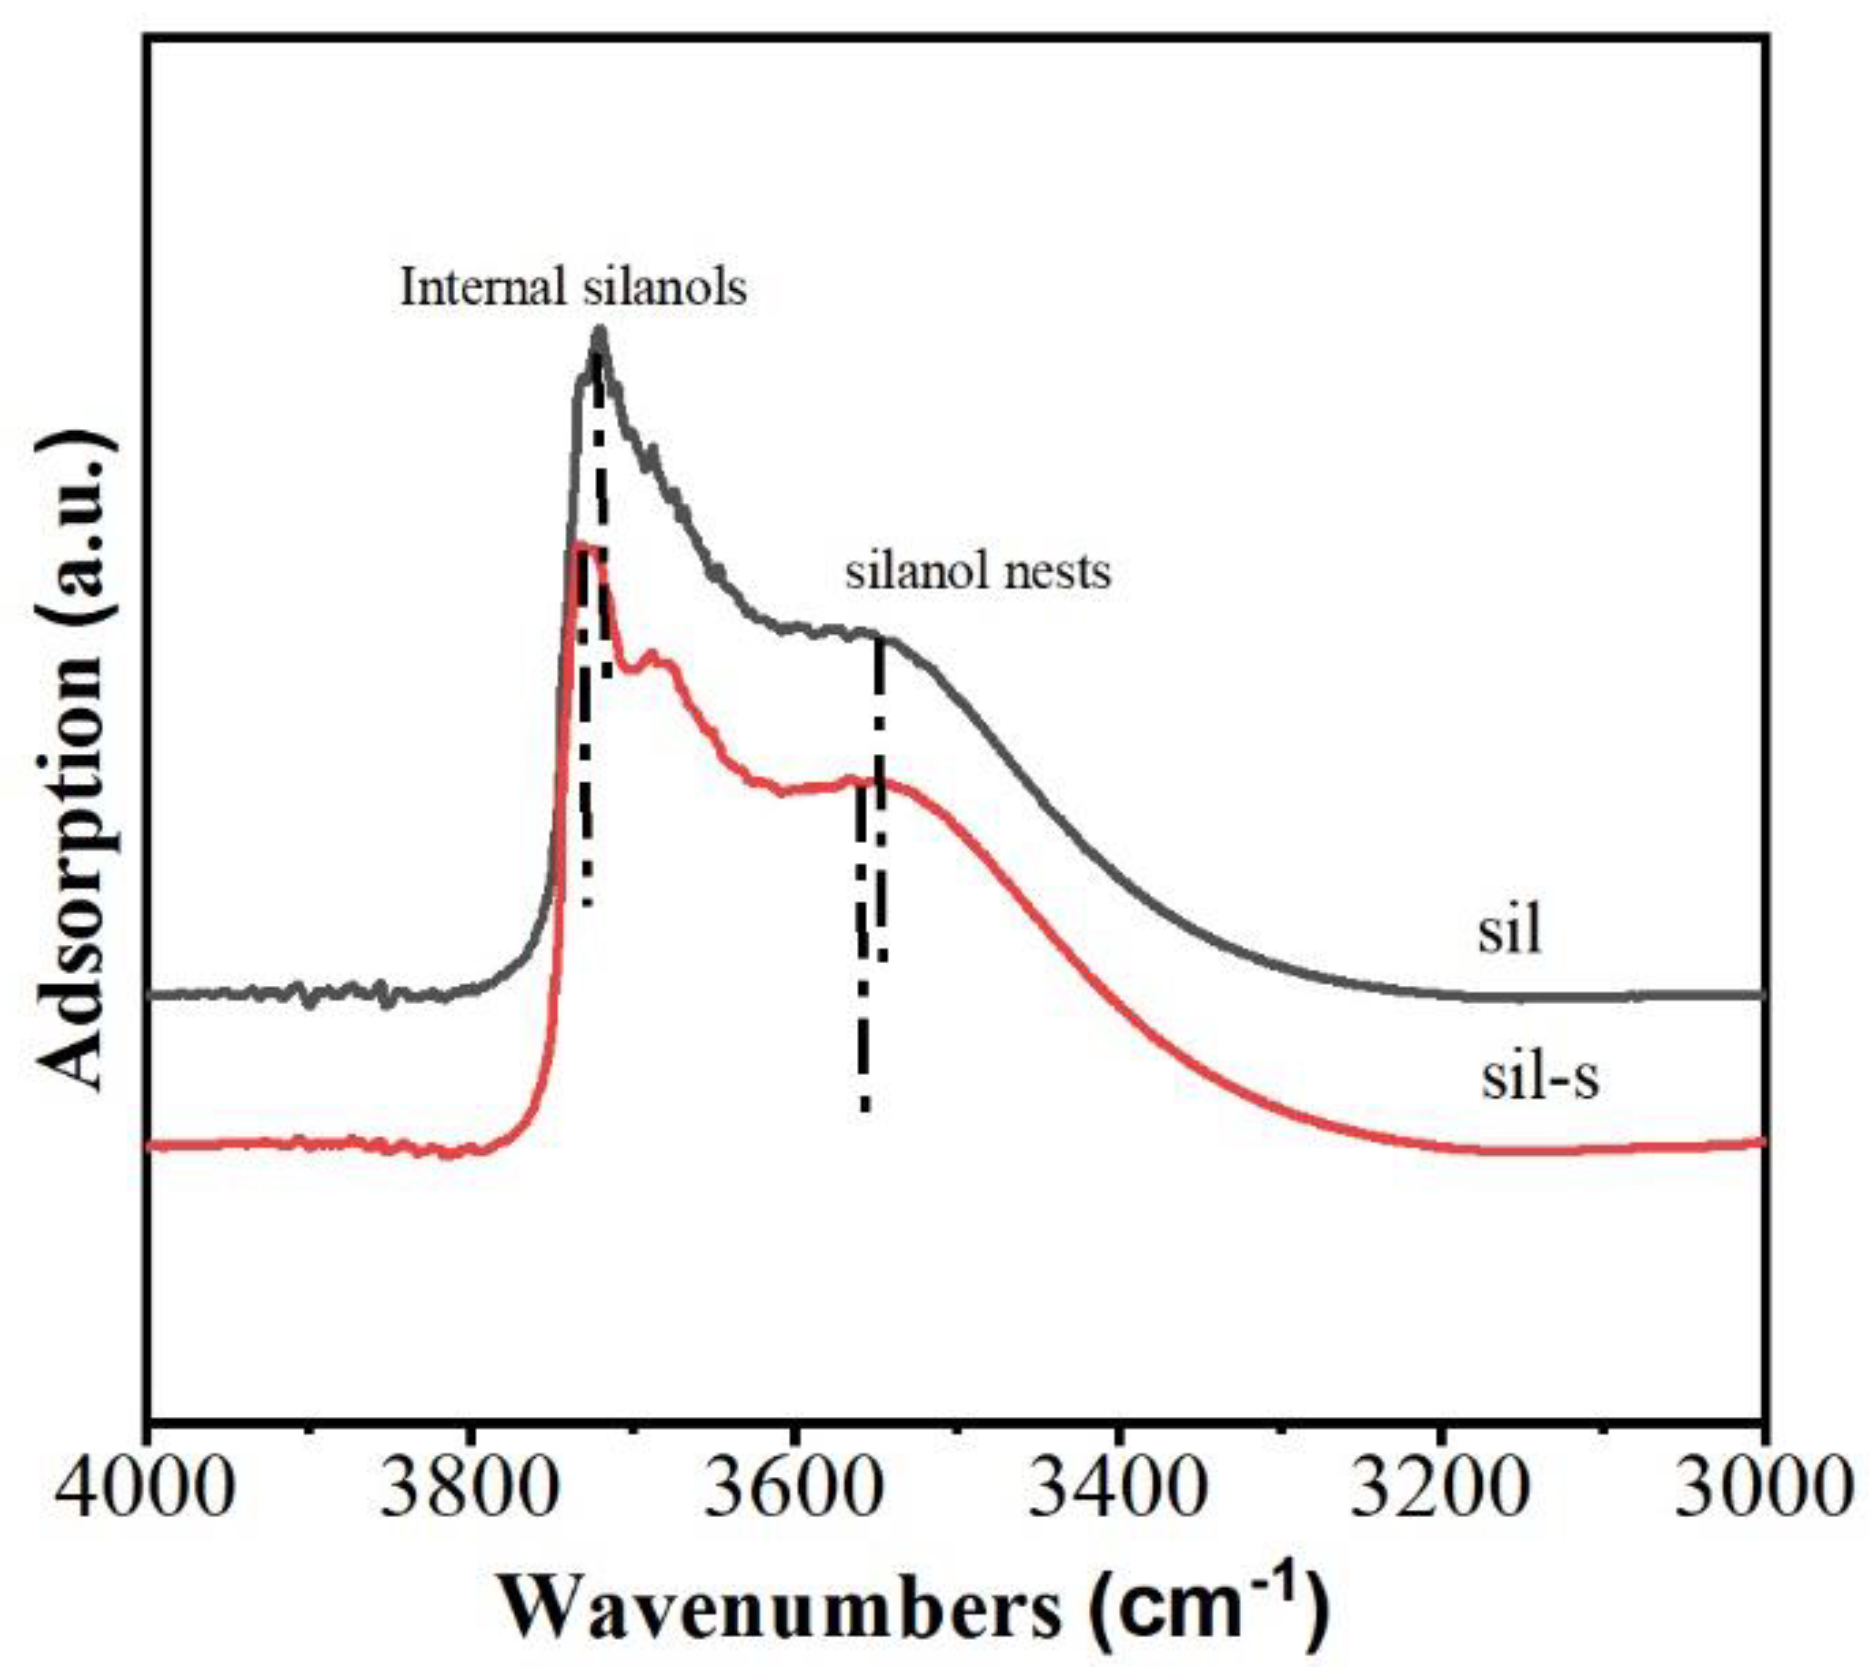
Figure 4.
29Si MAS NMR spectra of sil and sil-s.
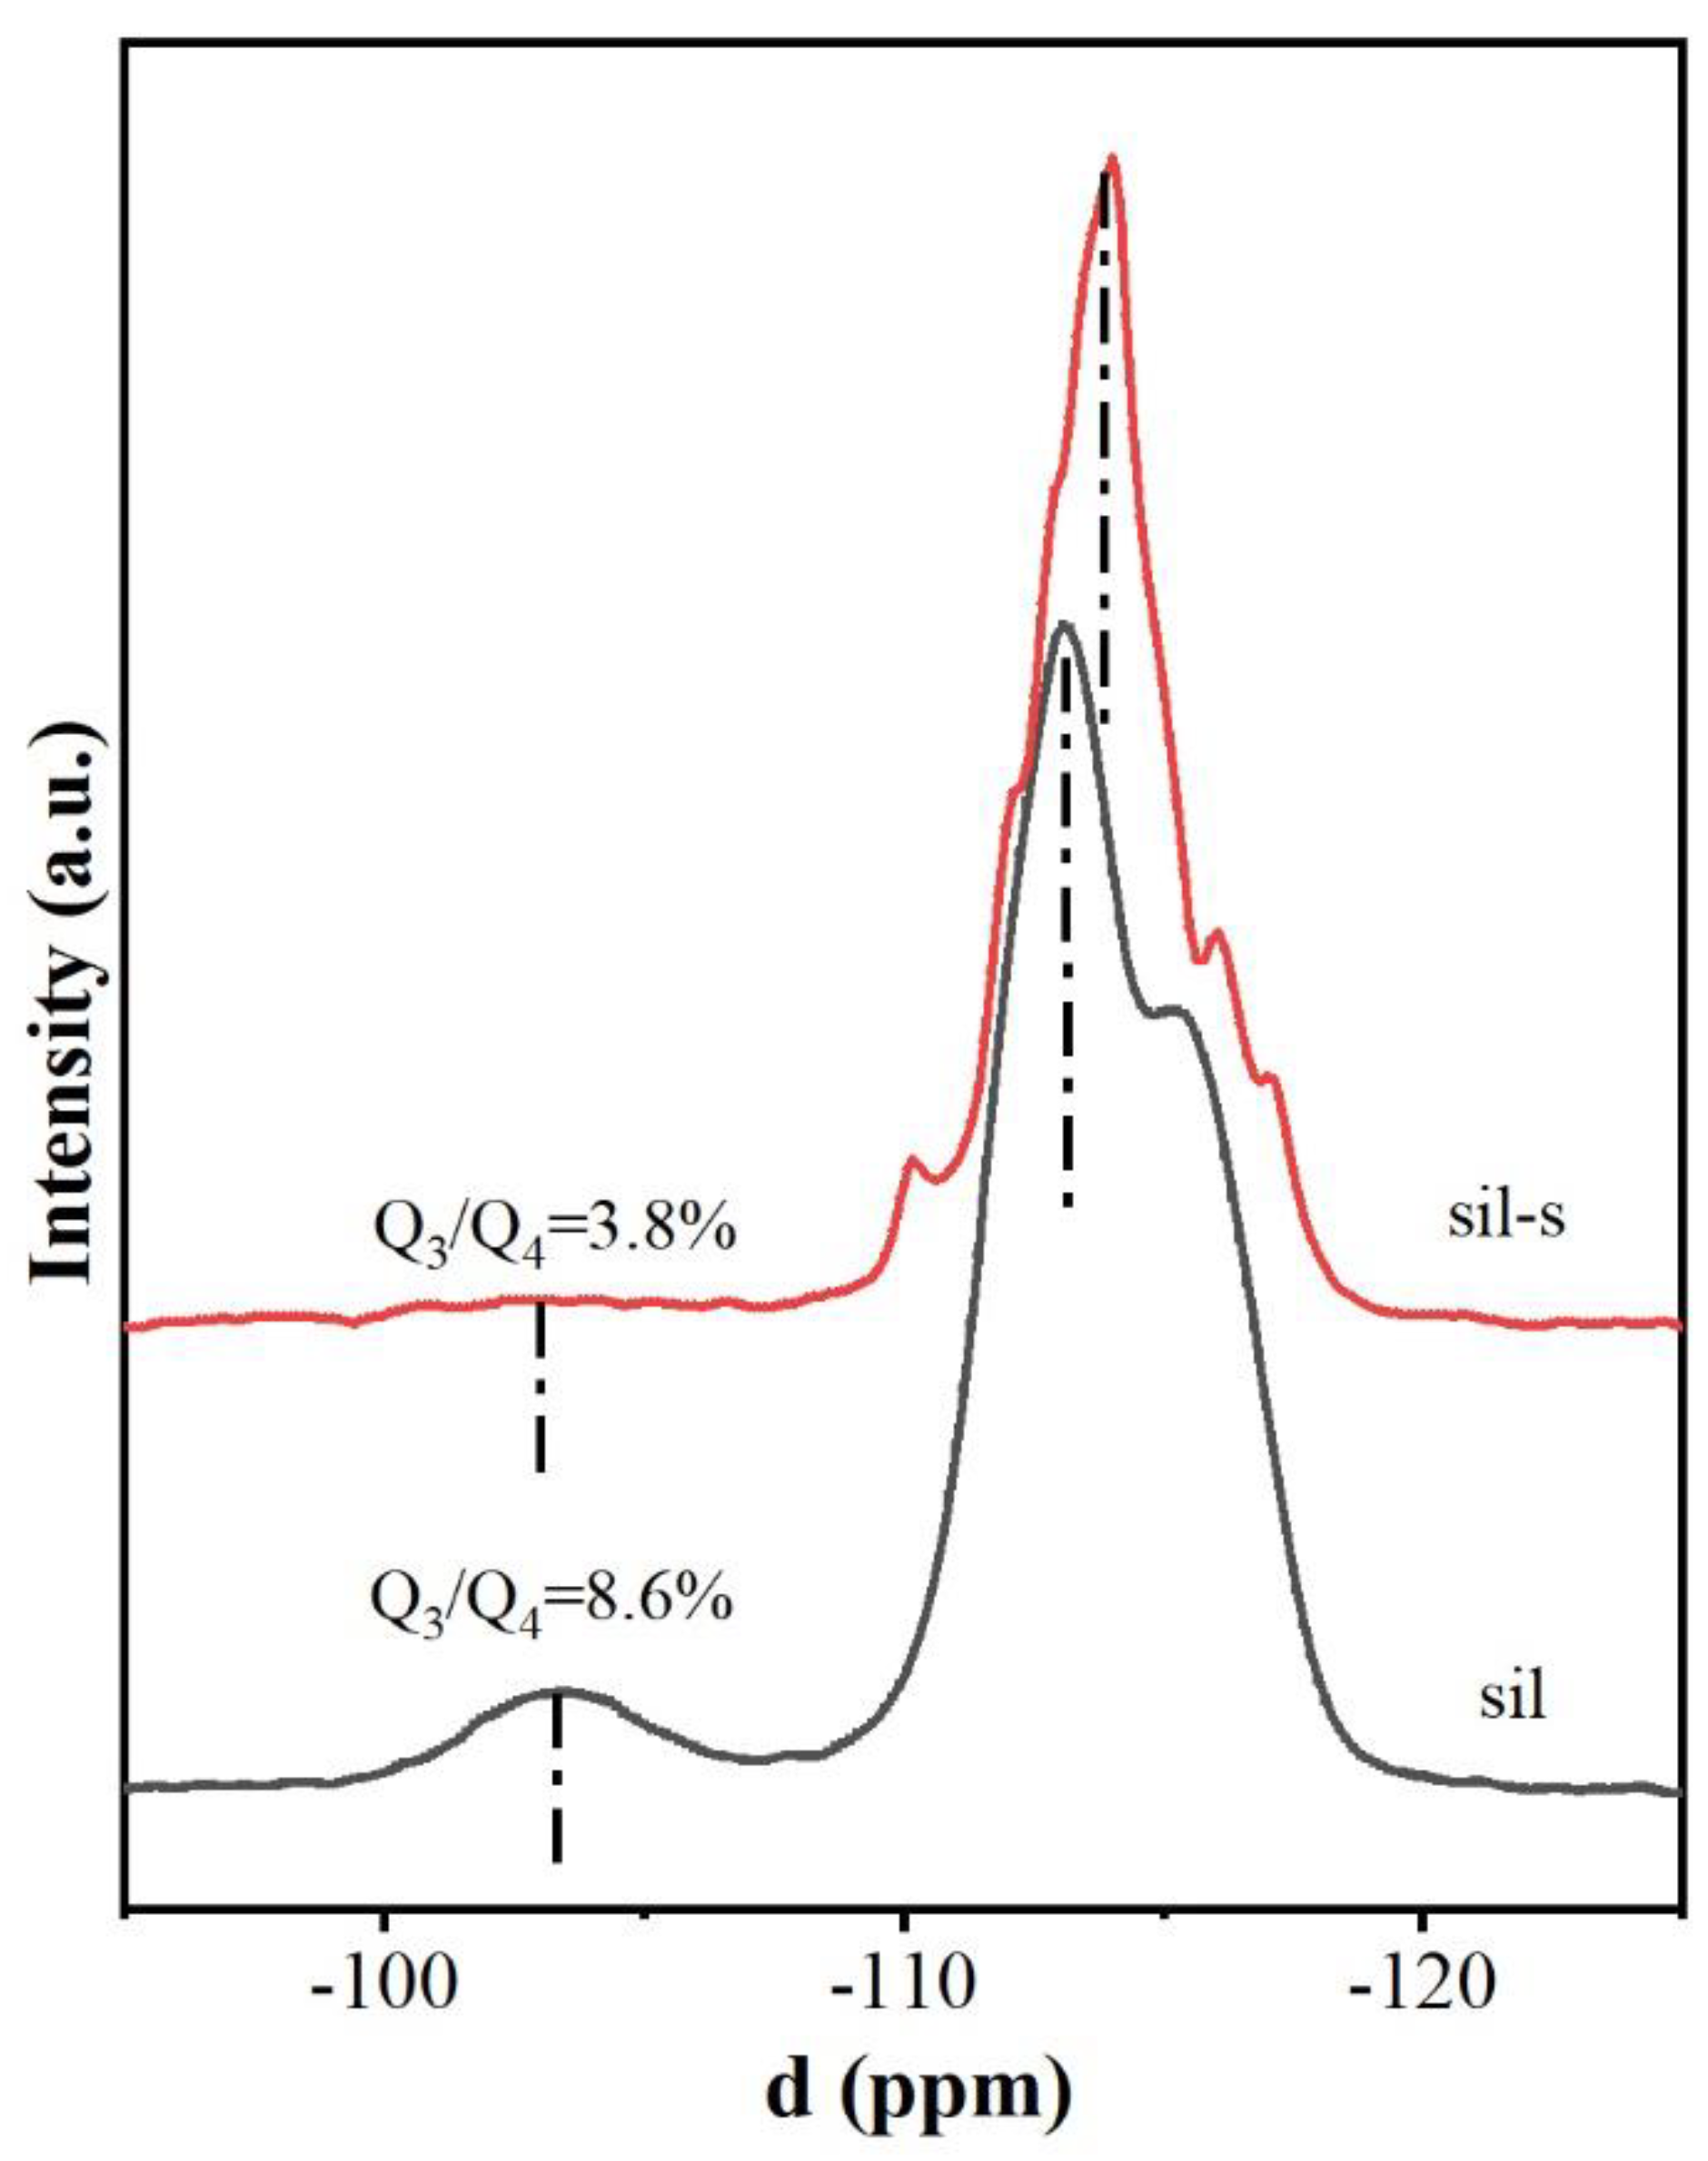
Figure 5.
Water vapor adsorption isotherms for sil, sil-s.
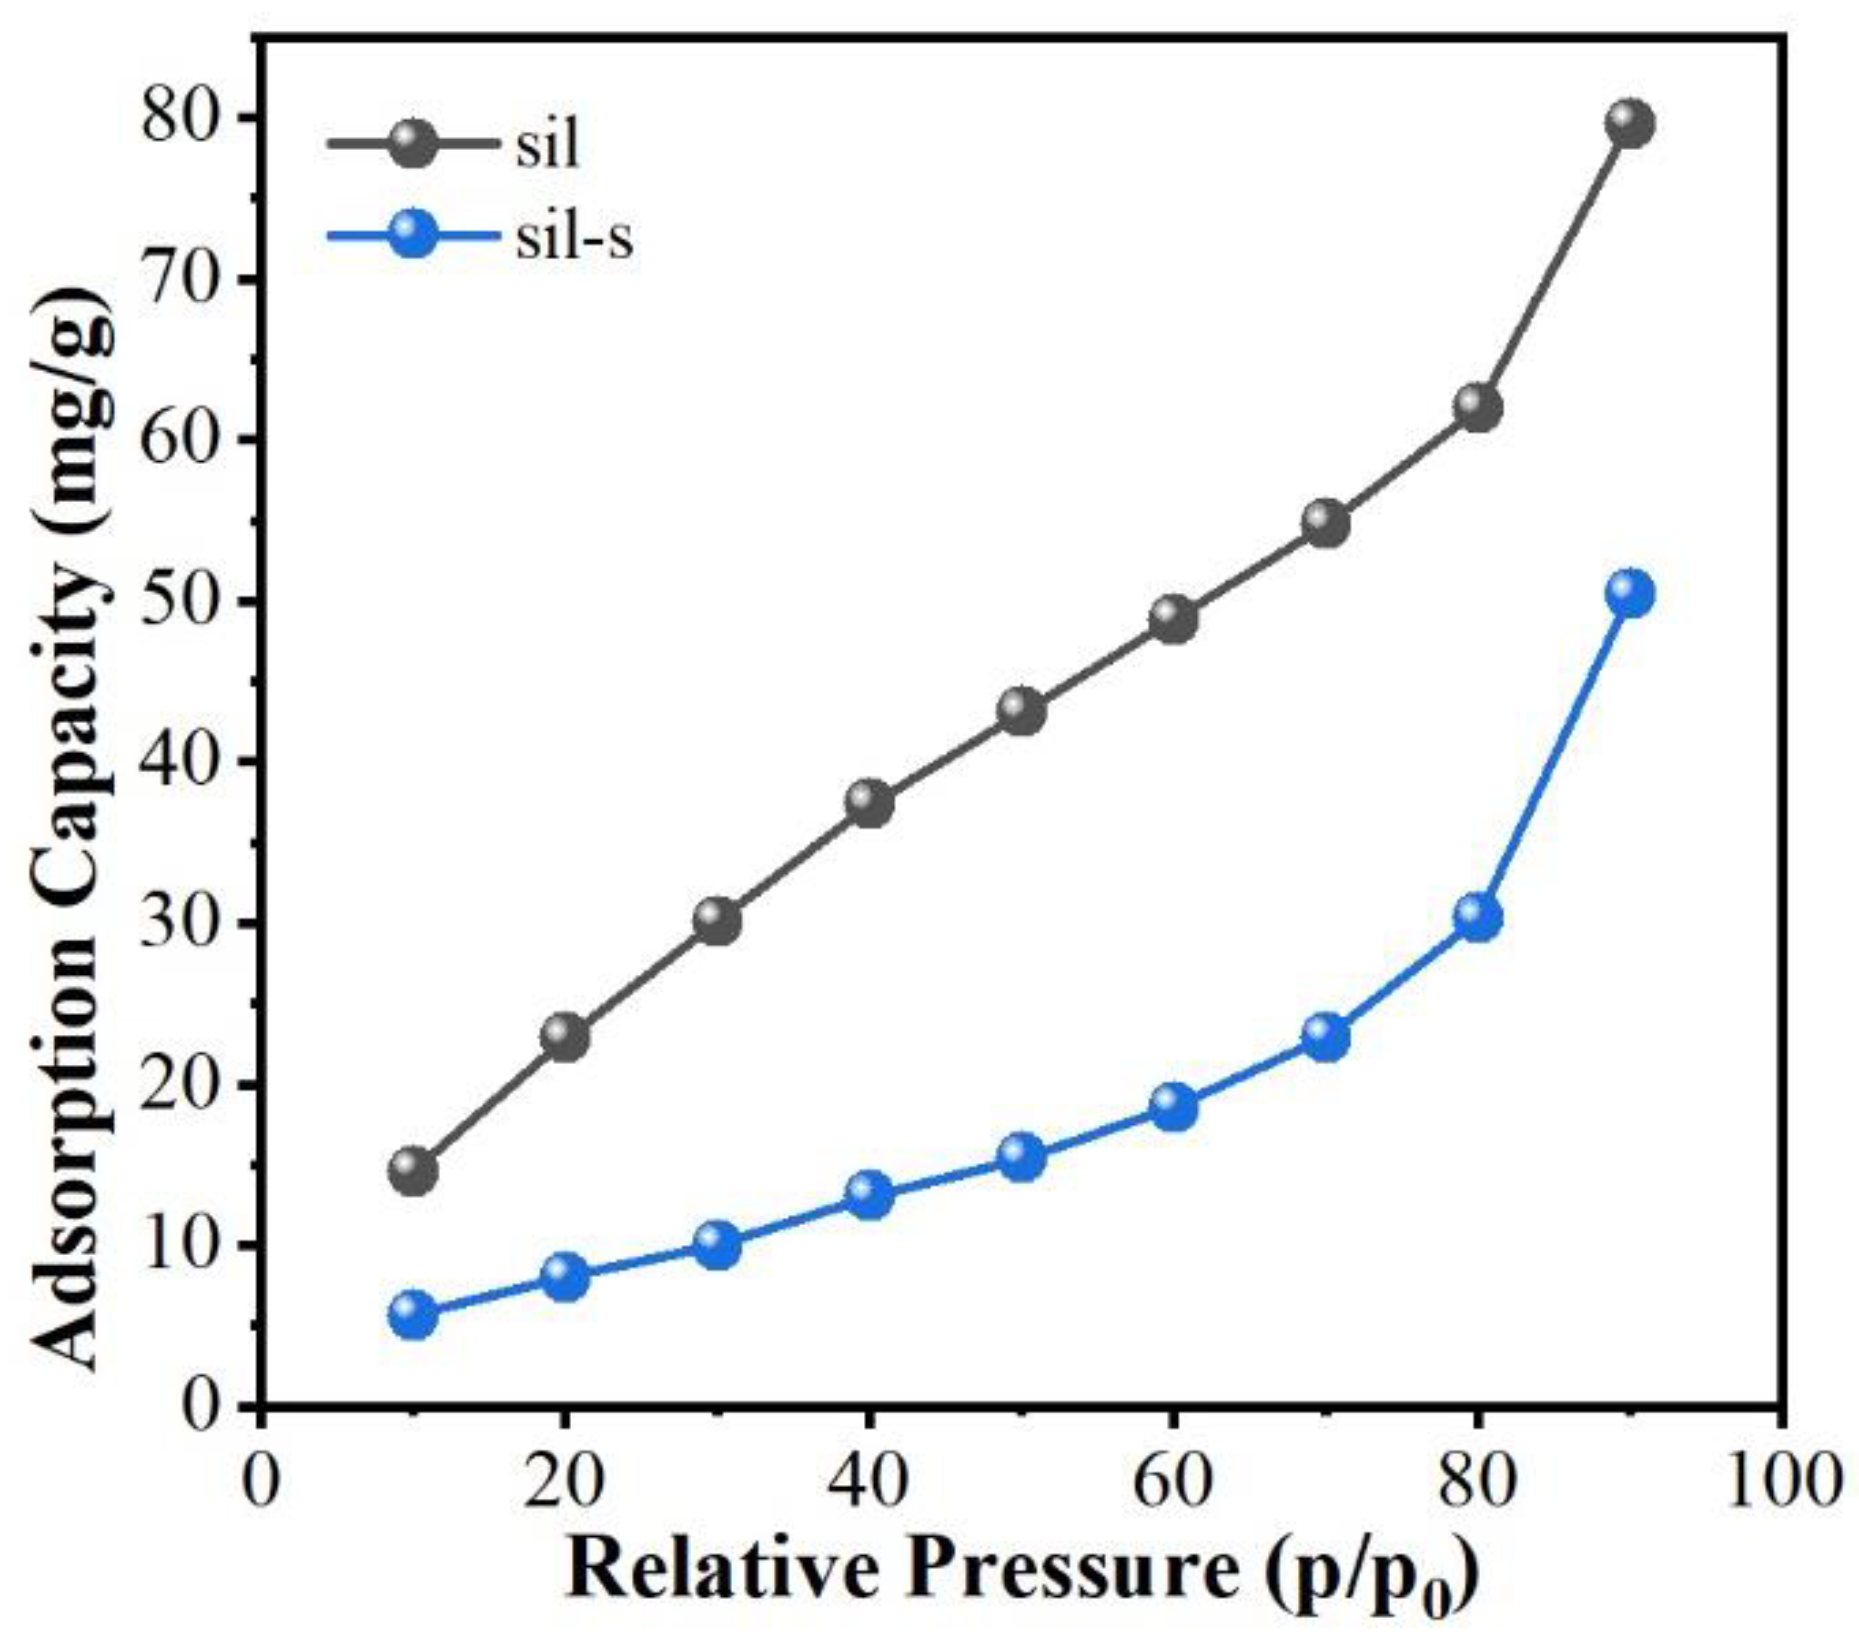
Figure 6.
N2 adsorption and desorption images of Pt/sil, Pt/sil-s and their pore size distribution。.
Figure 6.
N2 adsorption and desorption images of Pt/sil, Pt/sil-s and their pore size distribution。.
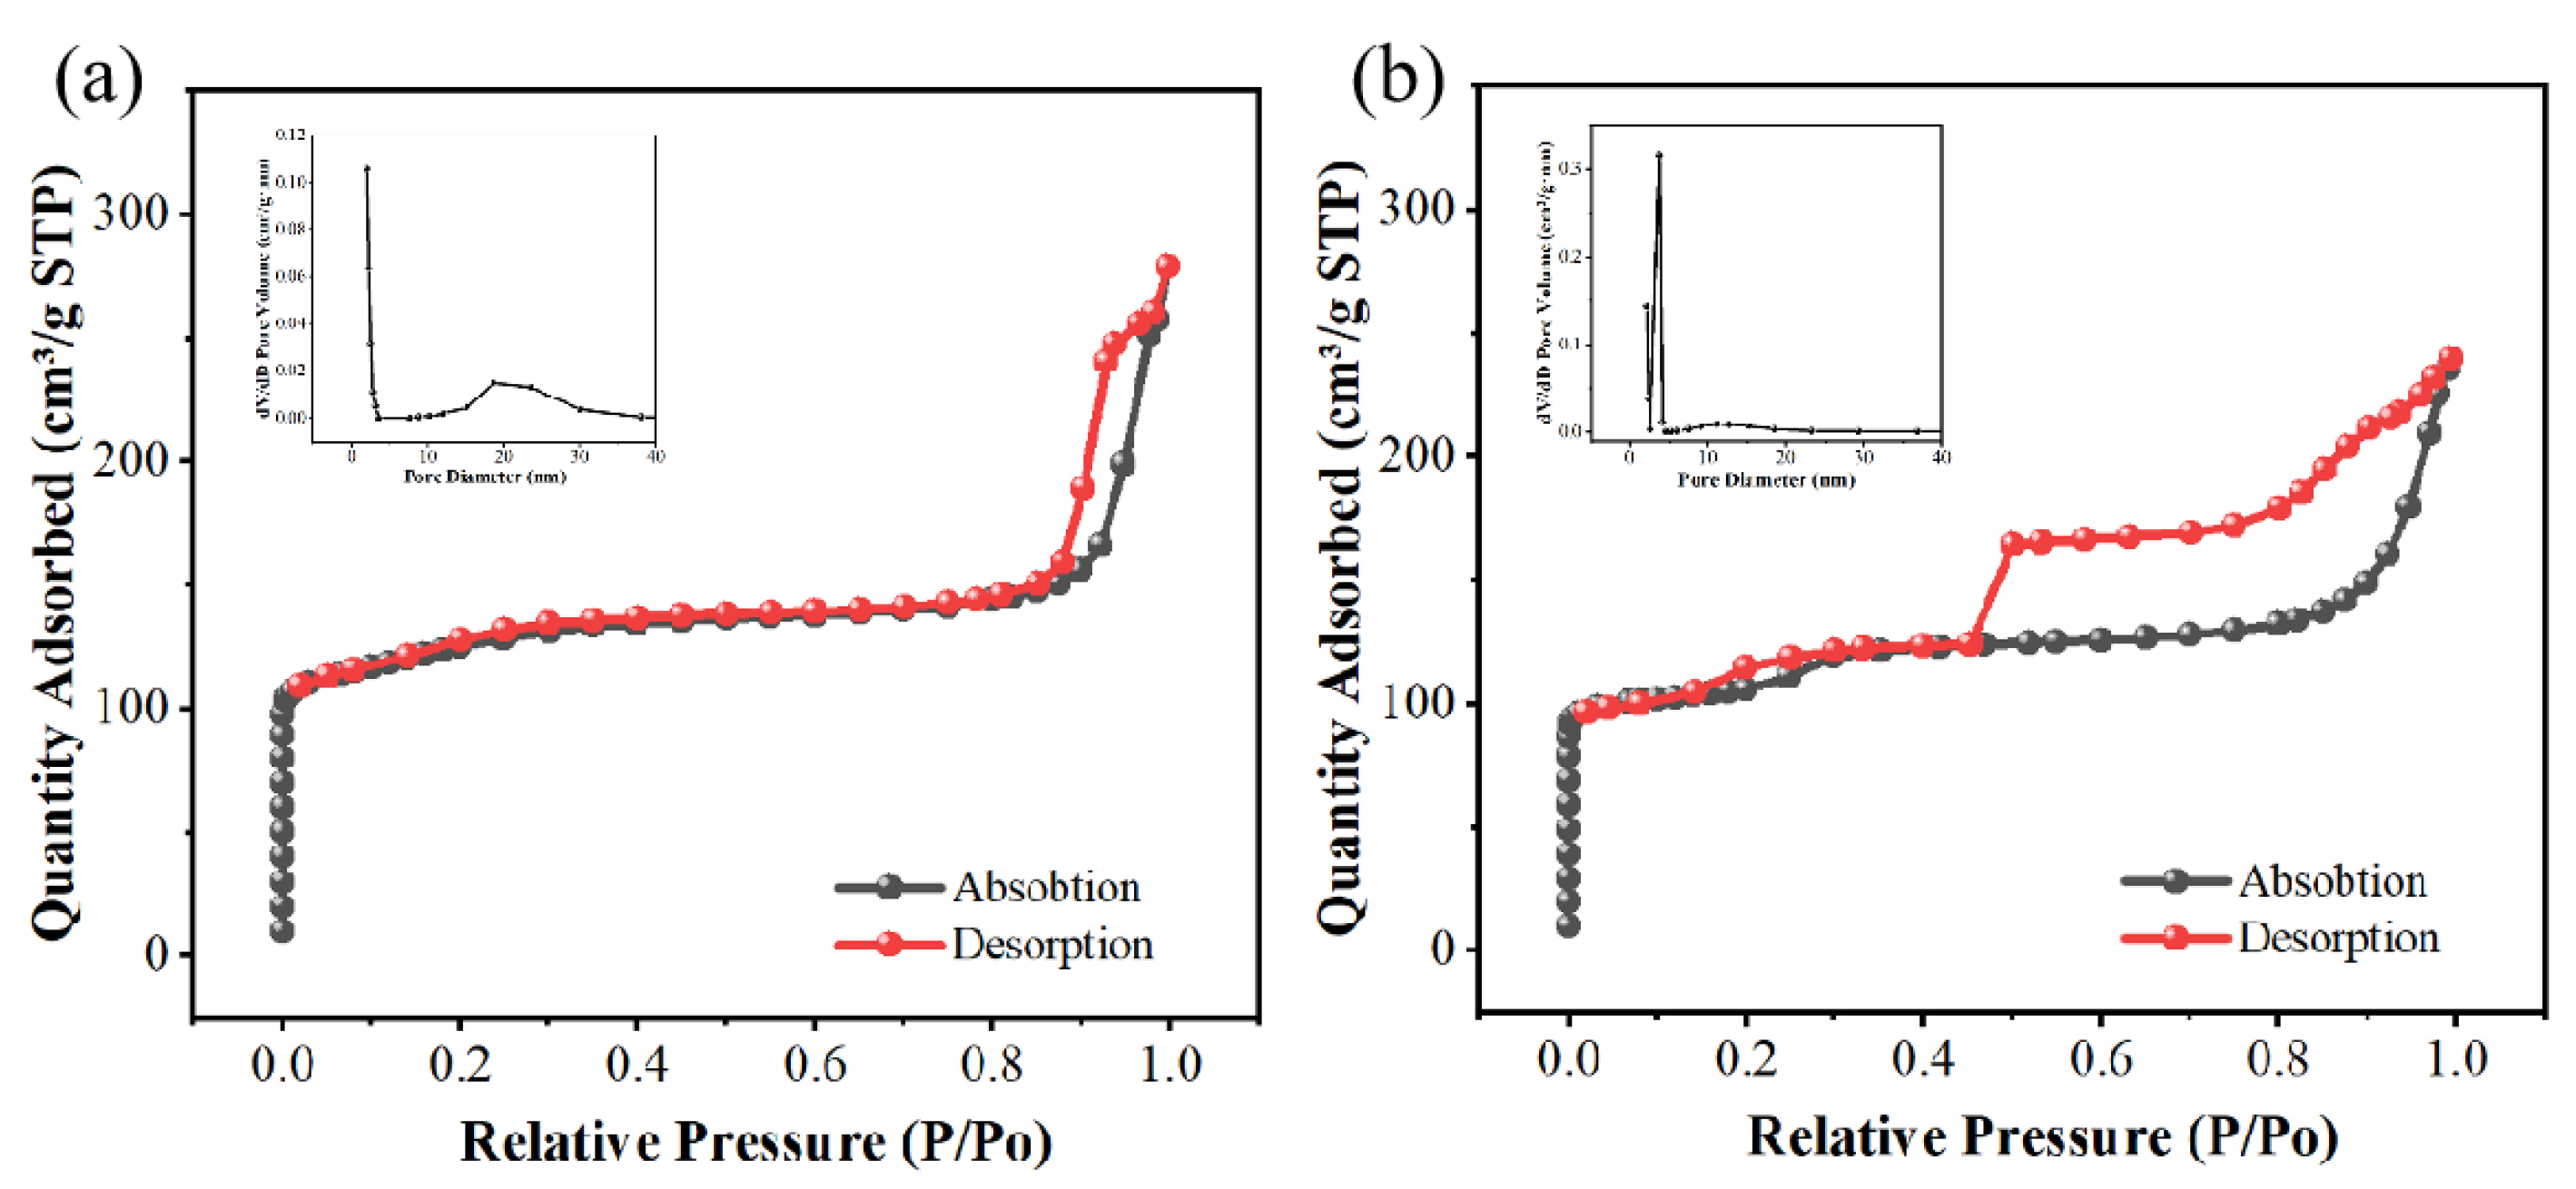
Figure 7.
(a)High-resolution XPS spectrum of Pt 4f in Pt/sil ; (b) XPS survey scan of Pt/sil; (c) High-resolution XPS spectrum of Pt 4f in Pt/sil-s; (d)XPS survey scan of Pt/sil-s.
Figure 7.
(a)High-resolution XPS spectrum of Pt 4f in Pt/sil ; (b) XPS survey scan of Pt/sil; (c) High-resolution XPS spectrum of Pt 4f in Pt/sil-s; (d)XPS survey scan of Pt/sil-s.
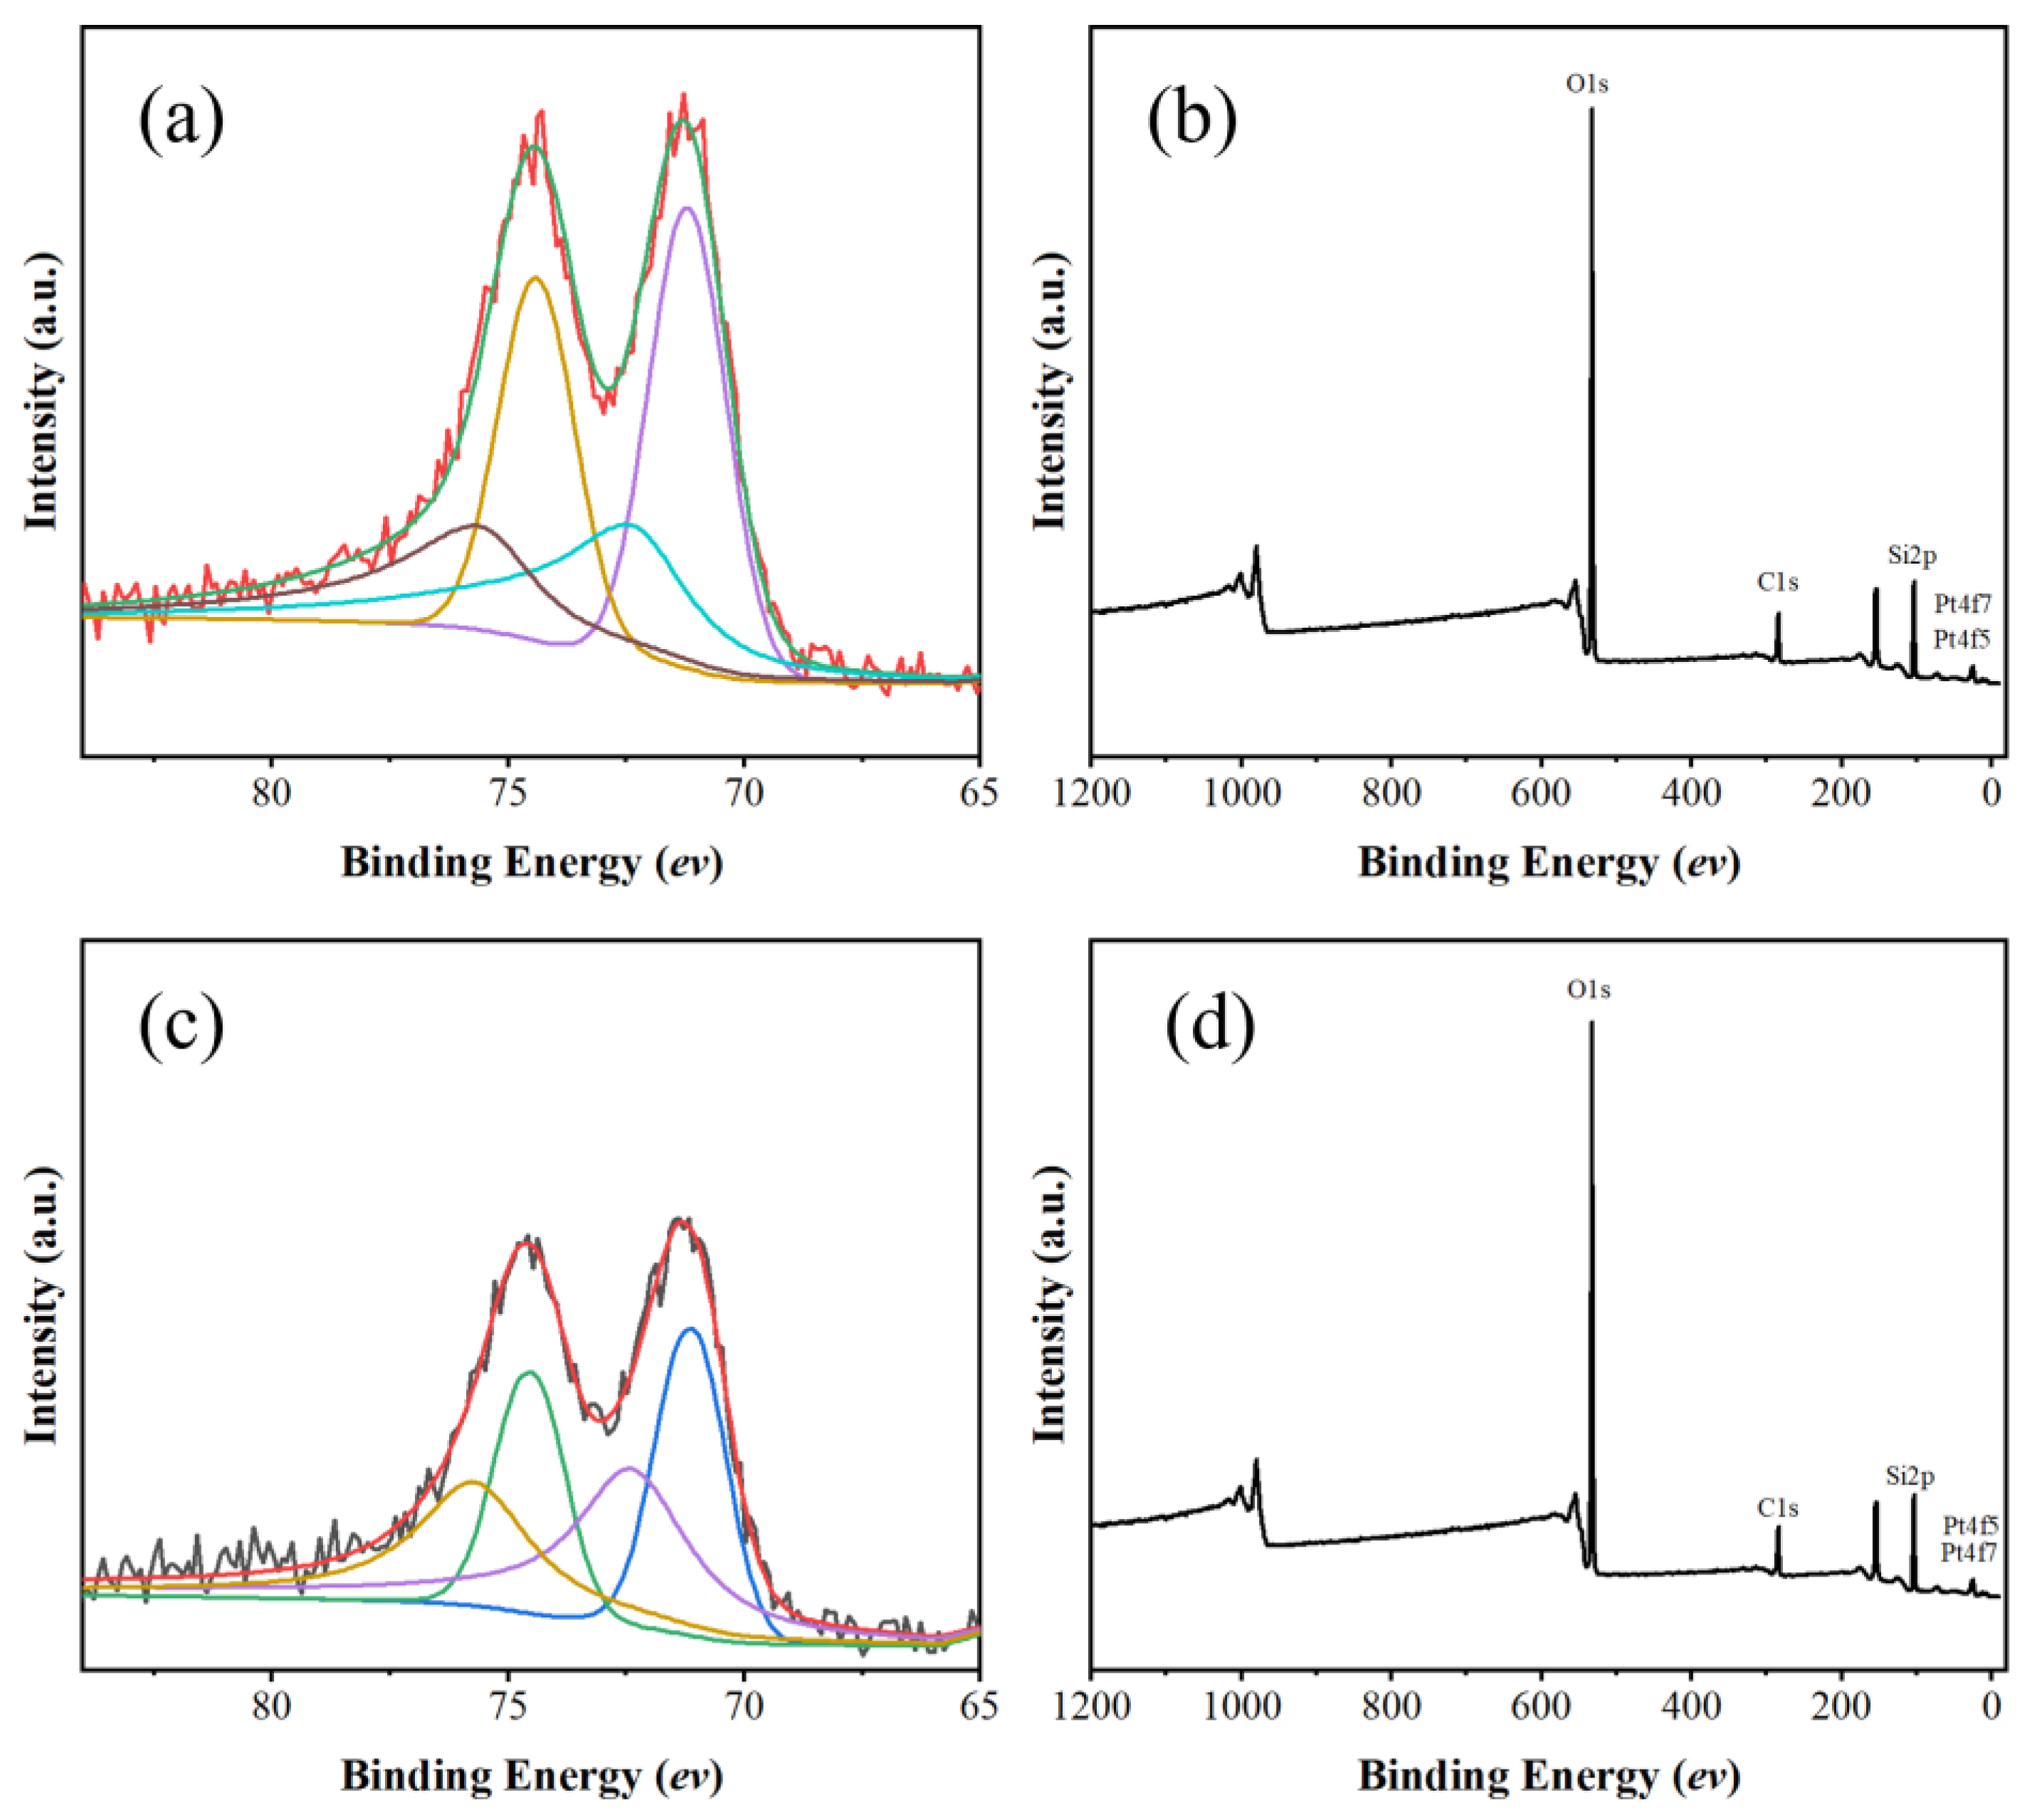
Figure 8.
Comparative TEM analysis: (a,c) TEM images of Pt/SiL and Pt/SiL-S; (b,d) Corresponding Pt nanoparticle size distributions.
Figure 8.
Comparative TEM analysis: (a,c) TEM images of Pt/SiL and Pt/SiL-S; (b,d) Corresponding Pt nanoparticle size distributions.
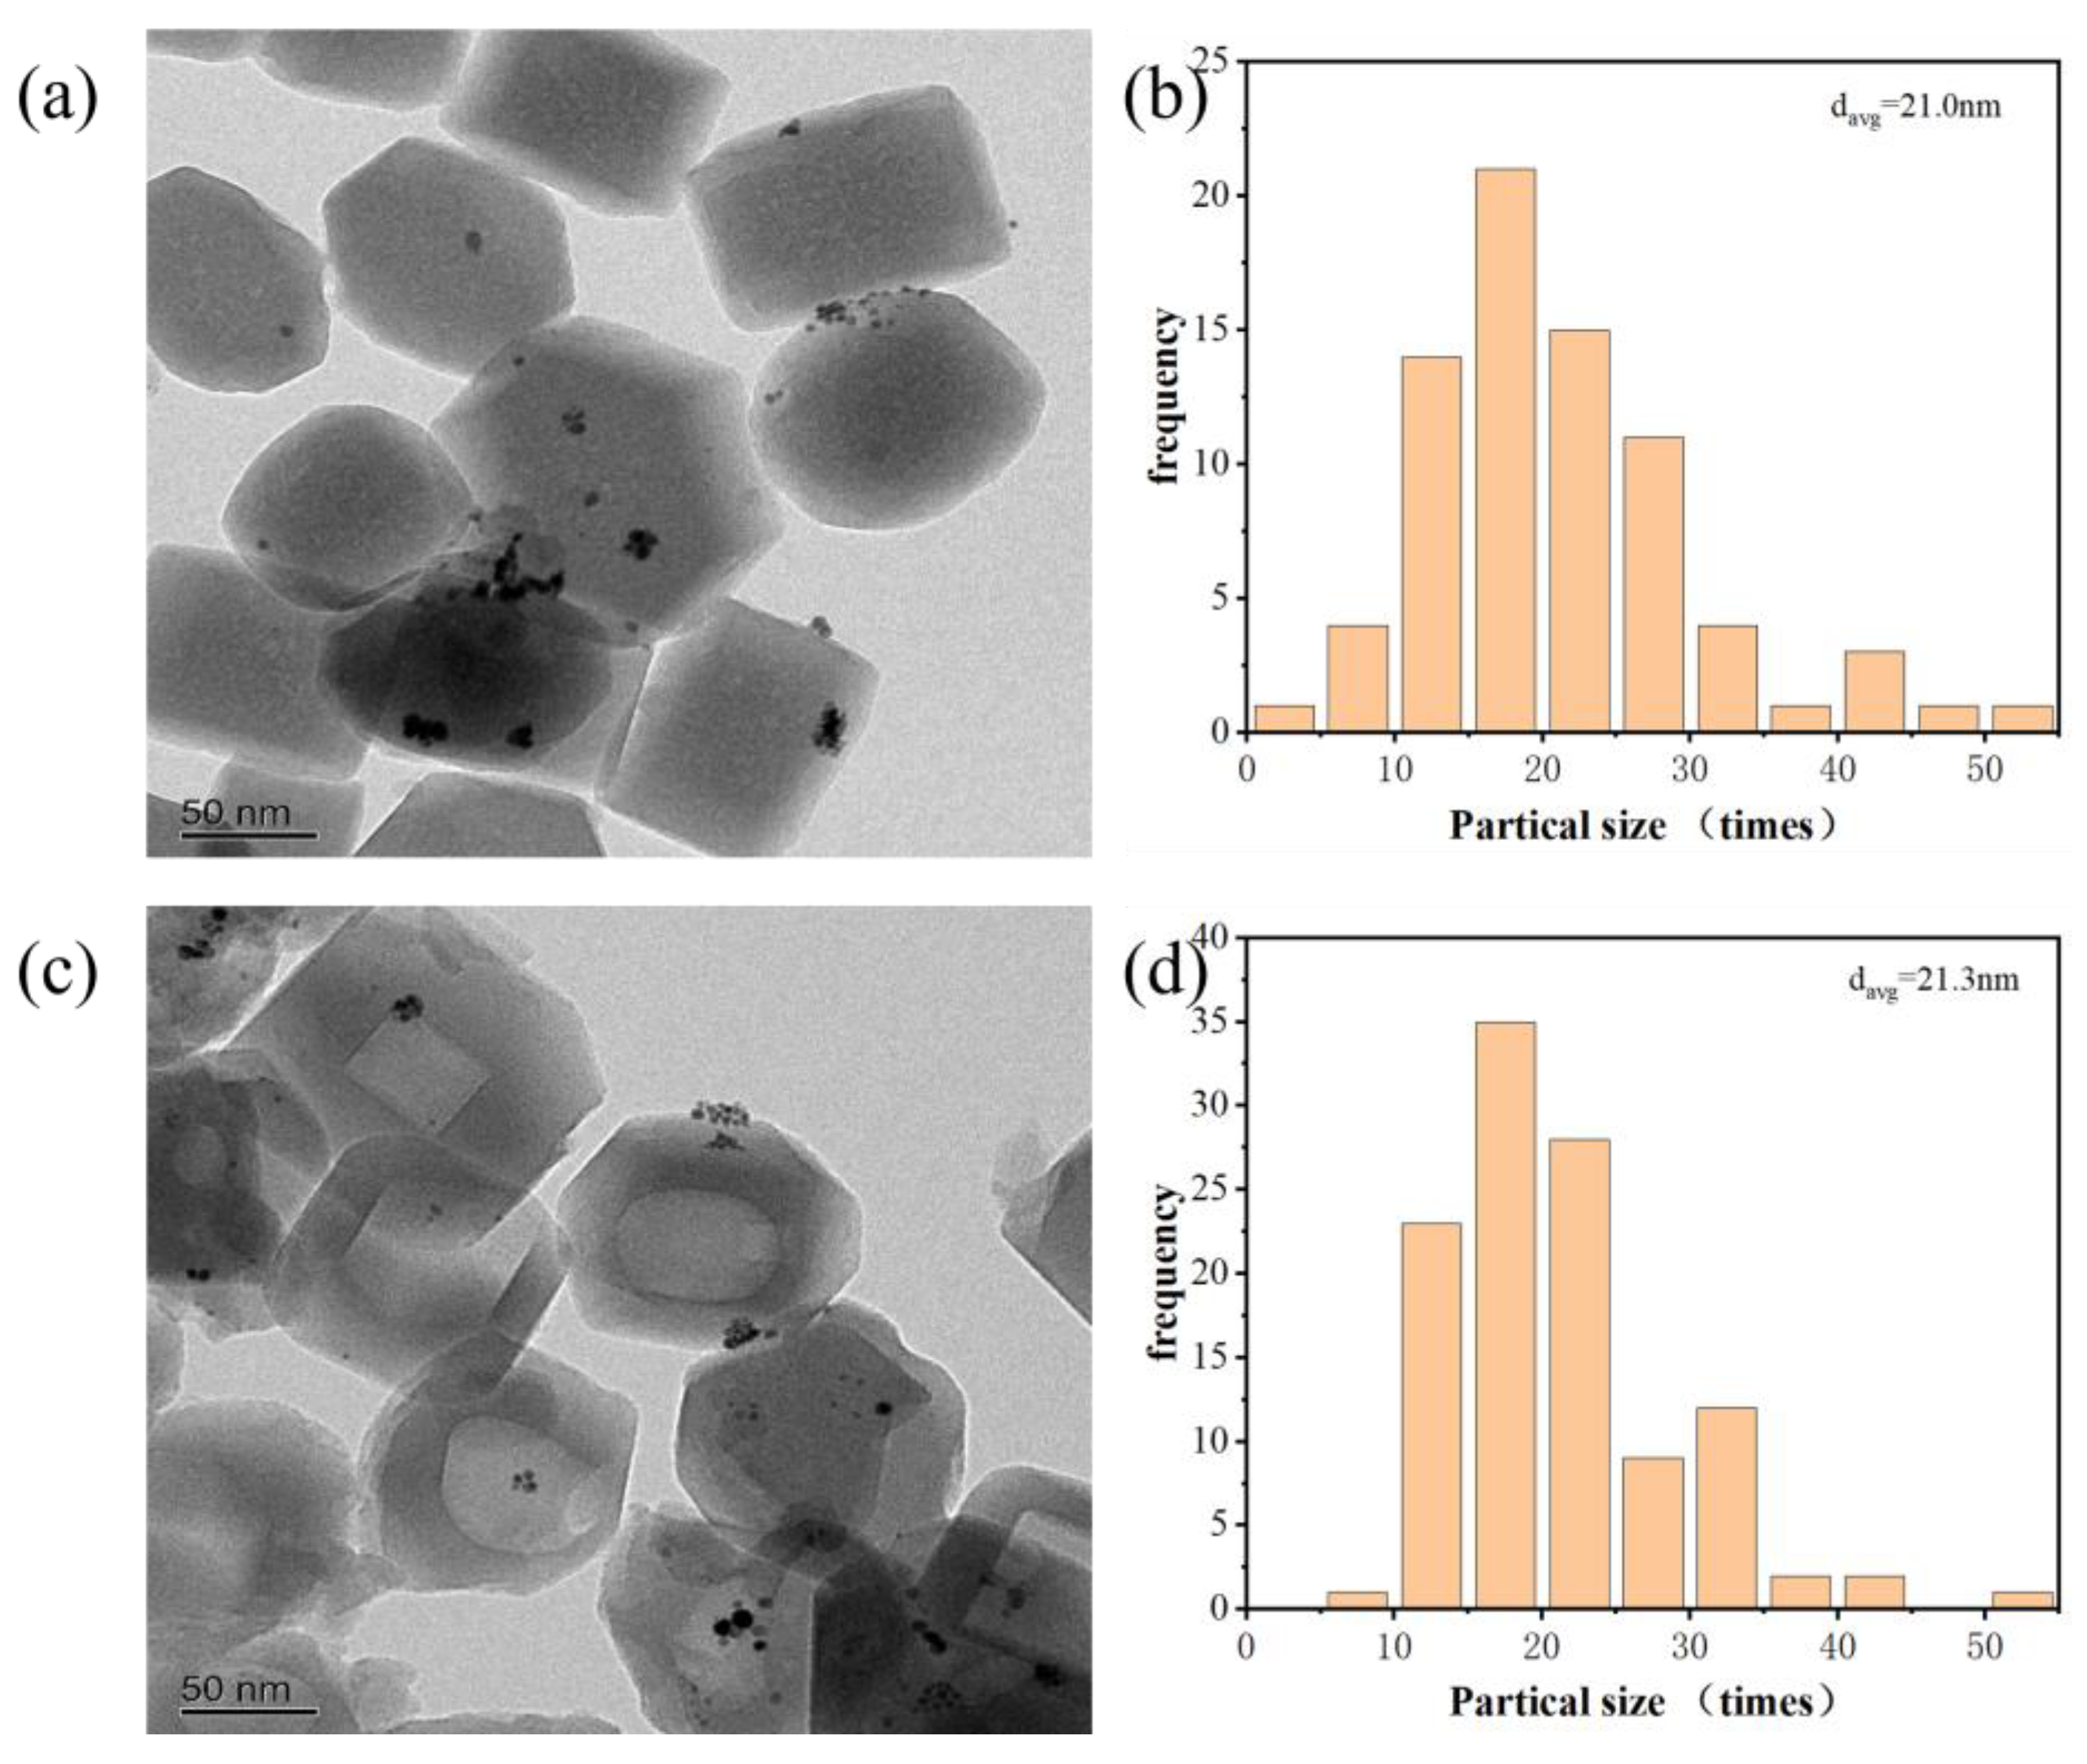
Figure 9.
Hydrogen oxidation activity for Pt/sil-s and Pt/sil in the dry and wet conditions (saturated with water vapor) at 25 °C.
Figure 9.
Hydrogen oxidation activity for Pt/sil-s and Pt/sil in the dry and wet conditions (saturated with water vapor) at 25 °C.
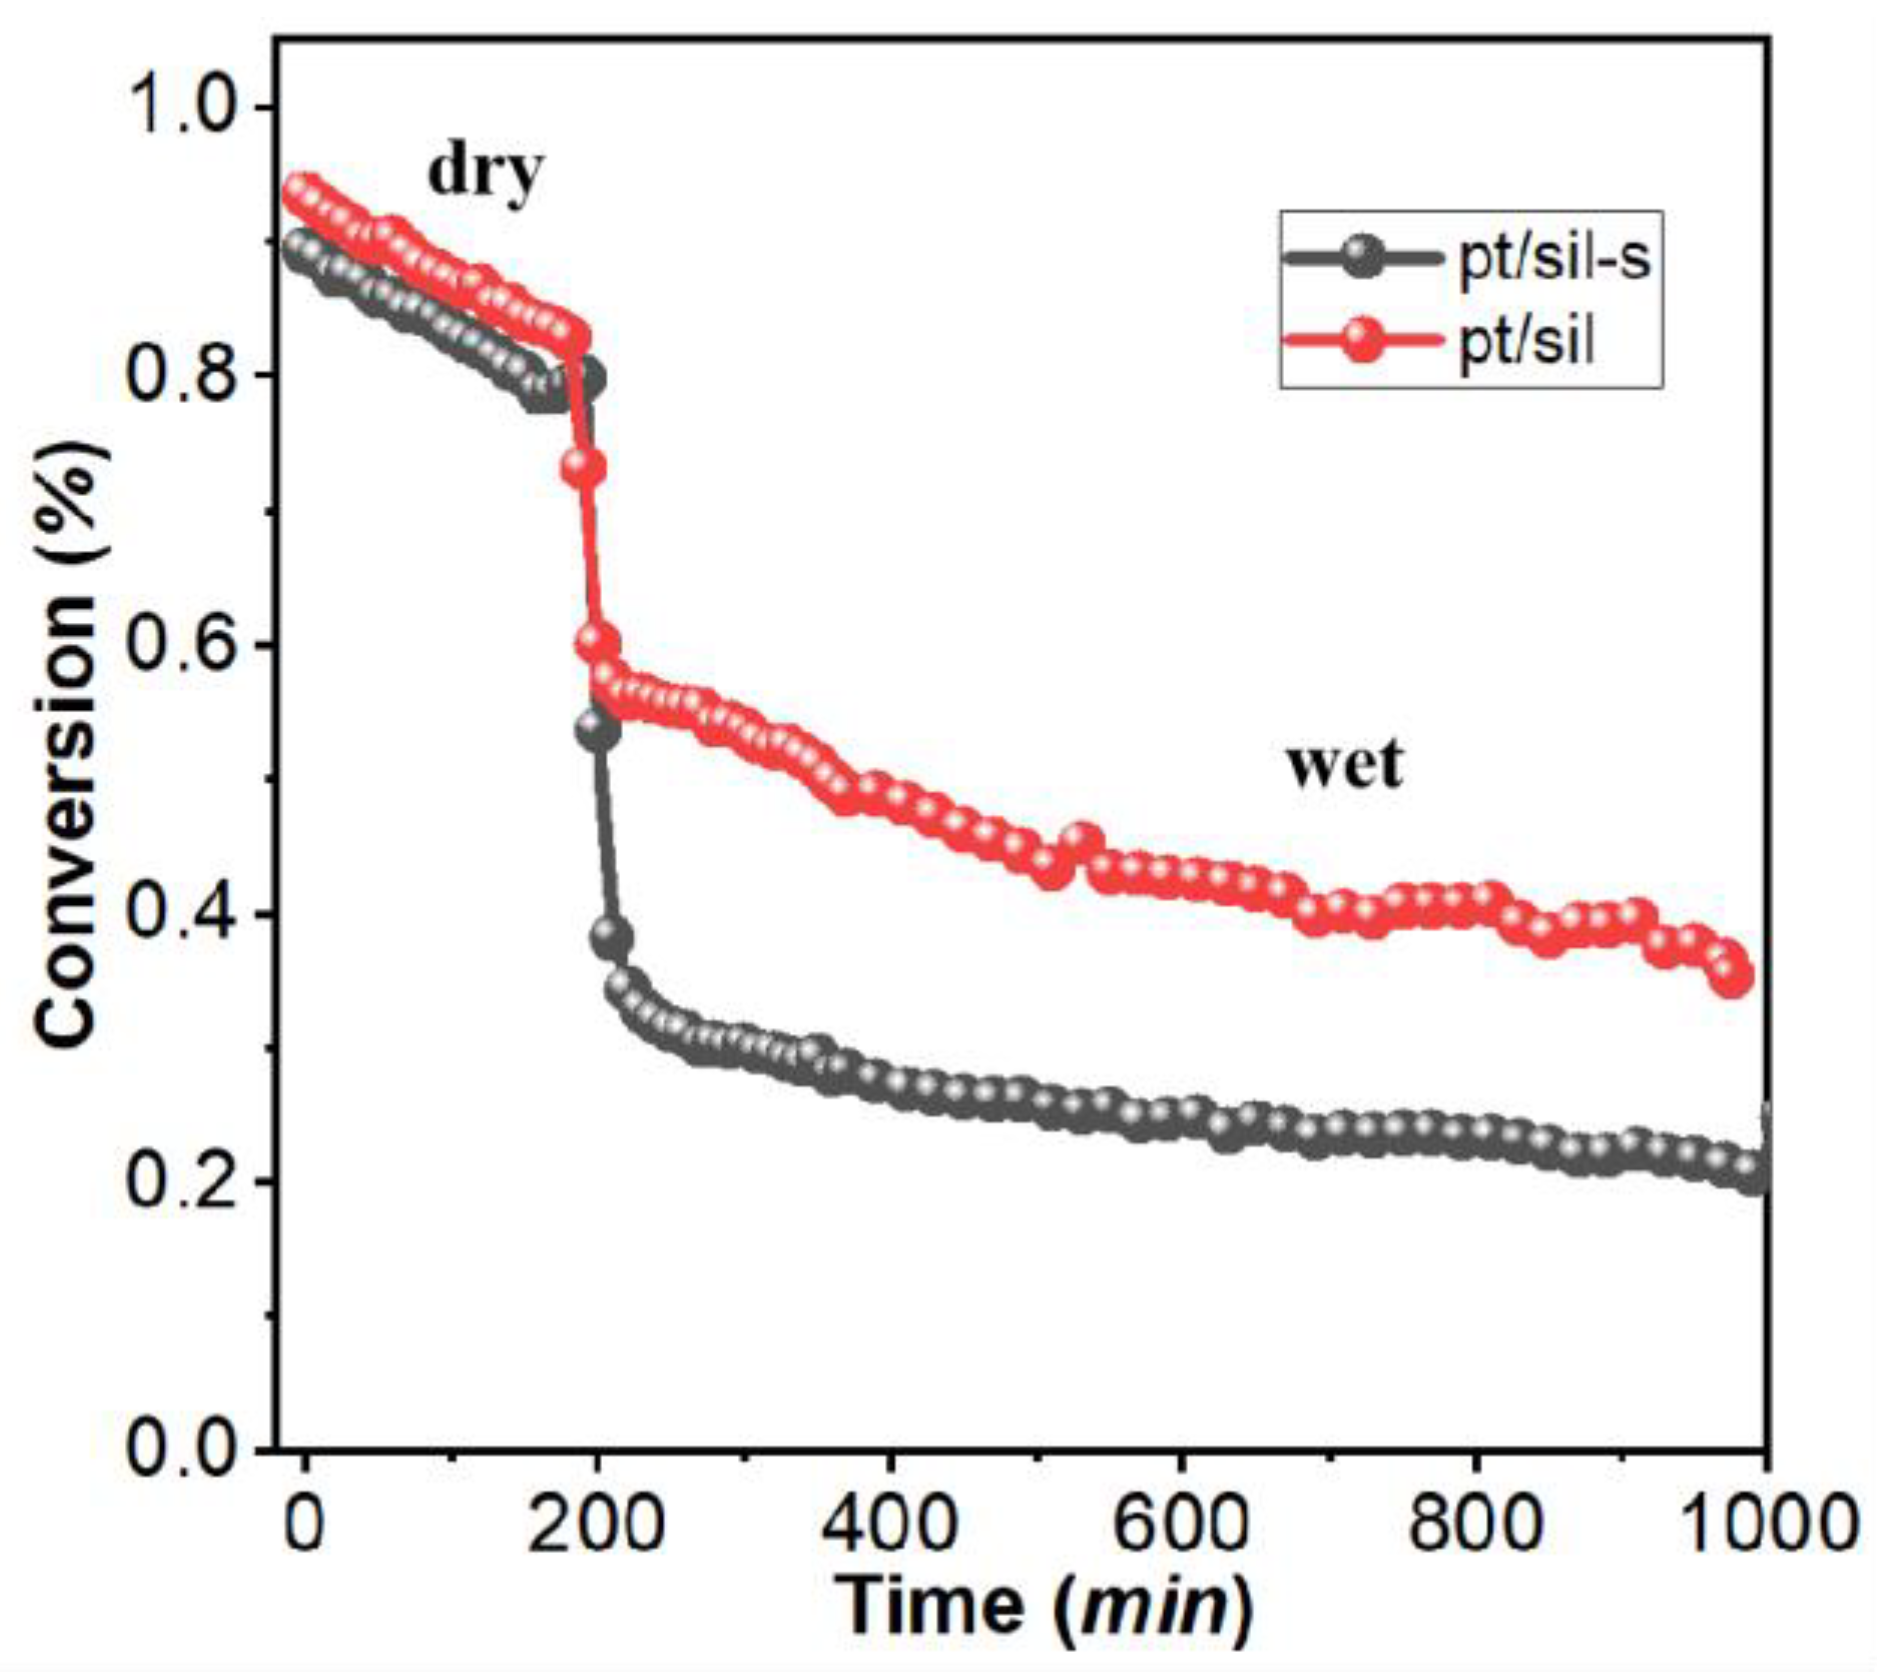
Figure 10.
Structural evolution of monolithic silicalite-1 synthesized via in situ crystallization with varying amorphous silica mass fractions (18%, 24%, 30%).
Figure 10.
Structural evolution of monolithic silicalite-1 synthesized via in situ crystallization with varying amorphous silica mass fractions (18%, 24%, 30%).
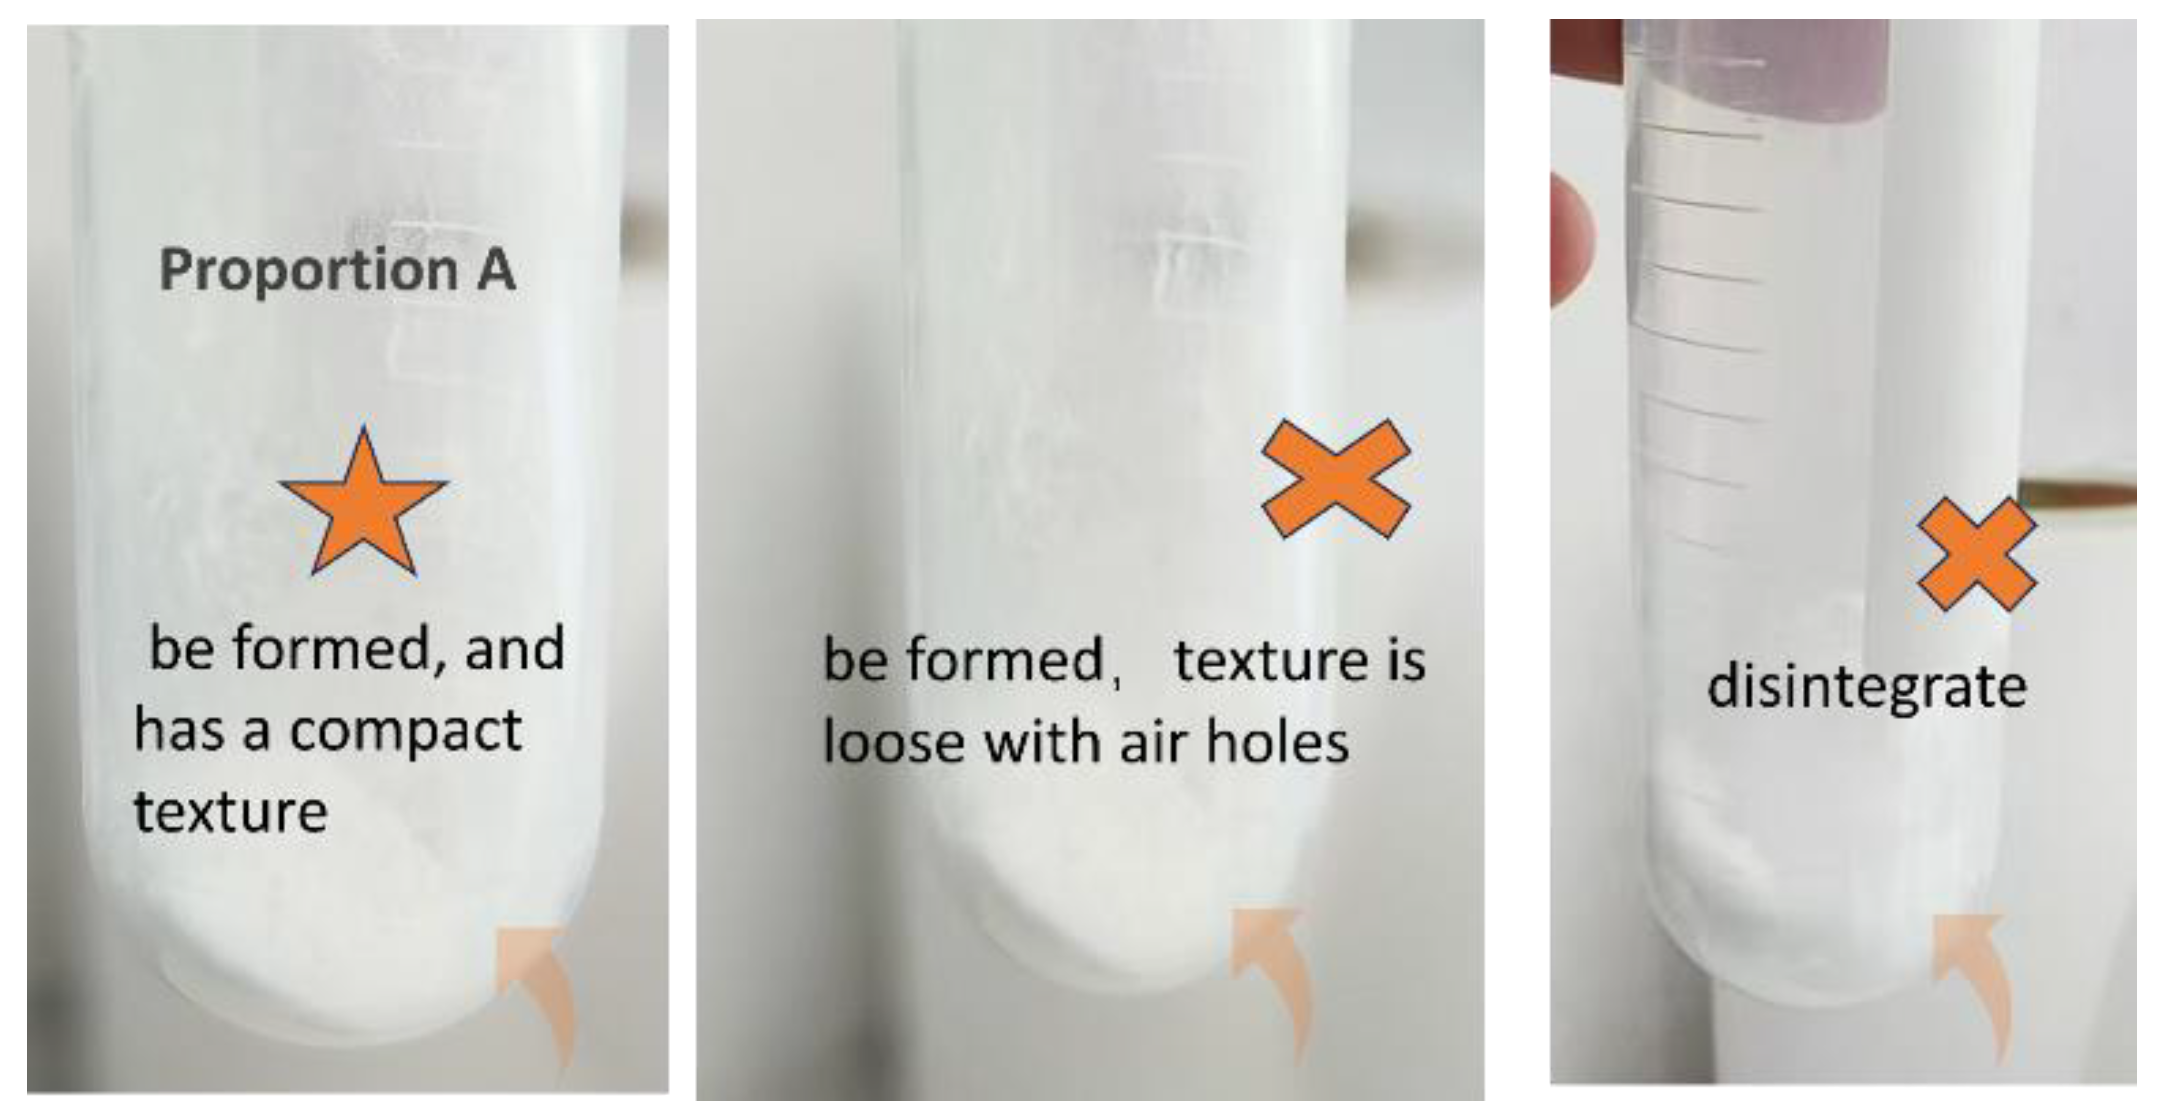

Table 1.
Specific surface area of Pt/sil-s vs Pt/sil catalysts and pore volume, microporous pore volume, mesoporous pore volume.
Table 1.
Specific surface area of Pt/sil-s vs Pt/sil catalysts and pore volume, microporous pore volume, mesoporous pore volume.
| Sample |
SBET (m2/g) |
Vt (cm3/g) |
Vmic (cm3/g) |
Vmeso (cm3/g) |
ravg (nm) |
|---|---|---|---|---|---|
| Pt/sil | 465.68 | 0.314 | 0.116 | 0.272 | 7.63 |
| Pt/sil-s | 416.93 | 0.285 | 0.115 | 0.320 | 4.72 |
Table 2.
Pt/sil vs. Pt/sil-s catalyst dispersion (CO TPD).
| Cat. | Percent of Sample Mass (%) | Metal dispersion (%) |
Crystallite size (cube nm) |
|---|---|---|---|
| Pt/sil | 2% | 6.96% | 13.56 |
| Pt/sil-s | 2% | 7.43% | 12.71 |
Table 3.
Table 3. Proportion of molecular sieve molding.
| Proportions (sil/SiO2) | Sil/g | silica sol/g | TPAOH/g (nTPAOH/nSiO2=0.1) |
|---|---|---|---|
| A(18%) | 1.6 | 0.72 | 0.244 |
| B(24%) | 1.6 | 0.96 | 0.325 |
| C(30%) | 1.6 | 1.20 | 0.407 |
Disclaimer/Publisher’s Note: The statements, opinions and data contained in all publications are solely those of the individual author(s) and contributor(s) and not of MDPI and/or the editor(s). MDPI and/or the editor(s) disclaim responsibility for any injury to people or property resulting from any ideas, methods, instructions or products referred to in the content. |
© 2025 by the authors. Licensee MDPI, Basel, Switzerland. This article is an open access article distributed under the terms and conditions of the Creative Commons Attribution (CC BY) license (http://creativecommons.org/licenses/by/4.0/).
Copyright: This open access article is published under a Creative Commons CC BY 4.0 license, which permit the free download, distribution, and reuse, provided that the author and preprint are cited in any reuse.


