
Submitted:
27 May 2025
Posted:
28 May 2025
You are already at the latest version
Abstract
The ongoing digitalization of industrial companies requires a structured, strategic in-tegration of digital concepts into business processes. Digital transformation (DT) re-quires clearly defined roadmaps that align digital technologies with business objec-tives. Although there are many digital maturity models (DMMs), most are indus-try-specific and do not address the unique characteristics of individual companies. Even SME-focused models often struggle to close the gap between current and target maturity levels, hindering effective DT implementation. This study examines the ex-isting academic and professional literature on DMMs for SMEs and assesses digital readiness in an industrial context. From these findings, the Dynamic Adaptive Ma-turity Assessment Model (DAMA-AHP) was developed. It comprises 66 DT elements in six dimensions: People and Expertise, Operability, Organization, Products and Pro-duction Processes, Strategy and Technology. DAMA-AHP incorporates the Analytic Hierarchy Process (AHP), which has been enhanced with customizable weighting at both the dimension and element levels. This enables precise alignment with the com-pany's priorities and the definition of customized target maturity levels that form the basis for a tailored transformation roadmap. Validation through a case study con-firmed the practical value of DAMA-AHP in measuring digital maturity and defining strategic DT priorities. It provides a comprehensive, adaptable and dynamic frame-work that promotes continuous improvement and sustainable competitiveness of SMEs in the evolving digital economy.
Keywords:
digital transformation
; digital maturity model
; customizable maturity assessment
; AHP
; strategic prioritization
; manufacturing
; Industry 4.0
; SMEs
1. Introduction
In recent decades, industrial companies have been confronted with significant changes in their operating landscape. On the one hand, global market disruptions caused by pandemics, energy crises and unstable trade have challenged established business models. On the other hand, the need for internal transformation has increased in order to maintain and improve competitiveness. Digital transformation (DT) has therefore become a strategic pillar in the long-term development of industrial companies, enabling the use of digital technologies to drive innovation and optimize business processes. Given the complexity of digital communication, a deep understanding of its meaning, scope and potential benefits is essential to fully exploit the possibilities of digital technologies. When used strategically, digital technologies can facilitate the creation of new business models and value propositions. Successful DT requires not only the introduction of technologies, but also the comprehensive restructuring of traditional organizational models and operations towards digital paradigms.
Digitalization and the resulting innovations are changing organizations, institutions and society as a whole [1]. Within companies, digitalization initiatives are leading to disruptive changes that are making traditional business models obsolete [2]. Digital technologies are therefore a major disruptor in both industry and societal structures, forcing companies to develop strategic responses in order to maintain their long-term competitiveness [3]. To achieve this, companies need to make structural changes while overcoming significant barriers to DT [4]. Technologies such as Social, Mobile, Analytics and Cloud (SMAC) solutions have proven to be capable of radically transforming existing business operations [3]. However, the mere availability of these technologies is not enough; a real competitive advantage comes from their integration into innovative business models [5]. Small and medium-sized enterprises (SMEs) play a central role in industry and form the backbone of economies worldwide, including in Europe and Croatia [6,7,8]. Nevertheless, SMEs often face greater challenges than larger companies when it comes to achieving effective DT. A crucial aspect of successful DT is the clear conceptual distinction between digitization, digitalization, and digital transformation. Unfortunately, linguistic ambiguities in languages such as German, Spanish, Japanese and Croatian blur these terms, even though they are fundamentally different. Digitization refers to the conversion of analog content into digital formats [9]. Digitalization, on the other hand, refers to the use of digitized data to optimize and automate business processes. For example, a digitized PDF document becomes part of a broader digitized document management system that ensures real-time access and updates [10].
DT, however, involves a more profound organizational transformation in which digital technologies are used not only to optimize but also to reinvent business models and strategies [11]. It encompasses technologies such as big data, artificial intelligence (AI), the Internet of Things (IoT) and cloud computing to enhance operational performance, improve customer experience and create new revenue streams. It is important to understand these distinctions, as digitization is a hallmark of the third industrial revolution, while digitalization and digital transformation characterize the ongoing fourth industrial revolution or Industry 4.0. DT supports the development and selection of customized solutions by combining existing tools to achieve greater value and leverage the universality of digital elements that encompass both content and its contextual ecosystem [12].
Research by Wen et al. [13] has shown that manufacturing companies with higher levels of sustainability are better able to adapt to DT and more easily pursue differentiated competitive strategies. These companies show a stronger innovation response, suggesting that sustainability increases the transformative potential of DT initiatives. In addition, the antecedents of DT such as digital orientation, digital intensity and digital maturity, were examined for their impact on companies' financial performance [14]. The results show that digital orientation and digital intensity alone have no direct impact on financial performance, while digital maturity acts as a mediating factor in the realization of these factors.
Thus, DT offers significant opportunities not only for established companies but also for entrepreneurial ventures. In addition, DT is being shaped by consumer behavior, particularly the evolving demands of digital-native users. Consumers increasingly rely on digital technologies for their daily interactions and expect seamless, ubiquitous access to digital services and resources [15,16]. Such behavioral patterns enable companies to make their services more effective and increase both customer satisfaction and operational competitiveness. For example, some companies are using social media platforms not only for customer service, but also to capture feedback and data in real time, which is then used to refine marketing strategies and improve responsiveness [17]. The DT of industry — commonly referred to as the fourth industrial revolution or Industry 4.0 - represents a paradigmatic shift from centralized, hyper-connected production ecosystems to decentralized, intelligent production environments [18]. In this context, intelligent physical entities, distributed subsystems and human actors are seamlessly integrated into interoperable and autonomous production systems [19]. Recent literature emphasizes that the COVID-19 pandemic has accelerated the adoption of digital technologies and the transformation of business models. Recent studies have identified key dimensions of DT, including technological, organizational, cultural, customer-centric and strategic aspects [20,21,22,23,24,25,26].
To support the assessment and monitoring of digital progress, Digital Transformation Indices (DTIs) have been developed as quantitative tools to assess digital maturity, progress and performance at an organizational, regional or national level. DTIs typically relate to areas such as technological infrastructure, human capital, innovation capacity, business agility and competitiveness. The most well-known indices include the Digital Economy and Society Index (DESI) [27], the ICT Development Index (IDI) [28], and the Digital Transformation Index (DII) [29]. Recent research has highlighted the strategic utility of DTIs in tracking digital progress, identifying vulnerabilities and informing policy and strategy development [30]. These indices provide valuable data on technological readiness, digital capabilities and innovation potential, helping decision makers to allocate resources to areas of greatest impact [20]. However, despite their relevance, DTIs also have their limitations, namely limited adaptability to specific sectors or industries and an overemphasis on technical dimensions while neglecting critical factors such as leadership and organizational culture. Given the structural and operational heterogeneity of companies within the same industry, there is a need for customized approaches to assess DT. Customized frameworks and index adjustments are necessary to account for the unique characteristics of individual companies. While national or sectoral indices provide a macro-level perspective, the practical implementation of DT must be based on company-specific circumstances and maturity levels. Therefore, indices are best used as complementary tools to identify sectoral trends and guide investment in digital infrastructure and skills development.
DMMs are a framework for assessing an organization’s internal readiness to implement DT. Their main objective is to provide insight into an organization’s ability to adopt digital technologies and respond to changes in the digital business environment. Although DMMs and DTIs differ in scope and application, they complement each other in their function. DMMs provide granular assessments of internal capabilities, culture and strategy, while DTIs provide a broader, often macro perspective on digital progress at a regional, national or global level. Together, they serve as strategic tools to improve digital maturity and competitiveness in an increasingly digitized economy. Before formulating a DT strategy, it is important to assess the current state of digital readiness. In this context, DMMs are often recommended as a diagnostic tool [31]. These models often divide organizations into maturity levels (e.g. initial, developing, advanced) that allow them to identify strengths and weaknesses and define targeted steps for improvement. DMMs typically focus on internal aspects such as culture, organizational capacity and digital leadership. Their structure is often adapted to the specific characteristics of industries, company sizes and market maturity. Despite different methodological approaches, most models converge around core dimensions such as strategy, technology, human capital and organizational culture. Prominent general-purpose models such as the Deloitte Digital Maturity Model (DMM) [32] are applicable to industrial companies, with contextual adjustments for industry-specific requirements.
SMEs often face additional challenges when it comes to digitalization, as they are dependent on production systems, outdated infrastructures and regulatory restrictions. For example, SMEs in industry are more likely to encounter obstacles in the integration of automation and robotics, in the networking of machines (Industrial Internet of Things – IIoT) and in cyber security. In such contexts, indices such as the DESI or the Smart Industry Readiness Index (SIRI) [33] are used to assess technological readiness, focusing on industrially relevant areas such as smart manufacturing and digital production systems. The SIRI is specifically tailored to manufacturing companies and helps SMEs assess their progress in the areas of automation, IIoT adoption and operational excellence [34]. DMMs such as the Industry 4.0 Maturity Index (Acatech) [12] or PwC’s Digital Operations Maturity Model (DOMM) [35], provide comprehensive assessments of key operational and technological areas that are critical for manufacturing companies. These models help industrial SMEs to evaluate their processes based on the principles of Industry 4.0, identify key enabling technologies (e.g. artificial intelligence, digital twins) and optimize supply chains through digital integration. An important step on the path to digital success is the alignment of digital strategies with the overall corporate strategy. DMMs provide a measurable basis for defining these strategies and tracking progress on DT. Tools such as PwC’s online self-assessment platform not only assess the maturity level of Industry 4.0, but also create actionable roadmaps to achieve a high level of readiness [35,36].
The first important step on the road to DT is therefore the assessment of a company’s current digital maturity level. This assessment is critical to understanding the company’s readiness, recognizing opportunities and threats, and setting strategic priorities for future development. A solid digital maturity assessment typically includes the following steps: Goal and scope definition, model selection, data collection, analysis, evaluation, reporting, recommendations, action planning, and continuous monitoring and refinement [23,37,38,39,40,41]. Most DMMs define logical progression paths, from ad hoc and fragmented digital initiatives to fully integrated and innovation-driven digital ecosystems. Commonly used maturity levels include: Ad hoc, Emerging, Defined, Managed and Innovative, each corresponding to increasing levels of digital integration and strategic alignment [23], [39,40,41].
Despite the existence of numerous models, there remains a significant gap in tools that are both user-customizable and tailored to industrial SMEs. The development of a scalable, flexible and domain-specific DMM is therefore an important goal of this study.
2. Methodology and Methods
The following approach was chosen in this study:
- Literature review of existing digital maturity assessment models with a focus on SMEs.
- Definition of guidelines and objectives for the development of a new model tailored to industrial SMEs in the given environment.
- Conceptual design of the model.
- Development and refinement of the model with the involvement of relevant academic and industry experts.
- Validation of the model using a case study.
- Analysis of the results obtained and recommendations for future research.
2.1. Systematic Literature Review (SLR)
To effectively meet the challenges of the digital age, organizations need to develop specific digital capabilities that enable efficient management of DT processes. Previous studies have found a correlation between the development of such capabilities and the achievement of higher levels of digital maturity. However, early research often lacked clearly defined models for measuring digital maturity [42]. To address this gap, Rossmann focused on developing a conceptual framework that defines a DMM along with an instrument to measure it. The resulting framework includes eight dimensions and 32 indicators covering strategy, leadership, business model, operating model, human resources, organizational culture, management systems and technology. This work makes an important contribution to theoretical understanding by conceptualizing and operationalizing digital maturity, building on and extending previous studies.
Numerous subsequent studies have produced a variety of new DMMs, largely motivated by the perceived inadequacies of existing models [43,44]. These shortcomings are primarily due to the difficulty of creating a universal model that can adequately capture the diversity of company size, industry, technological development, organizational culture, product variability, and customer differences. As a result, no single model can fully account for the specific characteristics of each organization.
Thordsen and Bick [45], in their analysis of the developments of DMMs over the past decade, found that there is a lack of empirical data to support the proposed relationships between digital maturity and organizational performance. Due to their simplicity and practicality, many models have been developed for general business areas and the manufacturing sector. Their analysis also revealed discrepancies between academics and practitioners on certain dimensions, highlighting areas for further research to reduce inconsistencies. Furthermore, the study was limited to a specific time period, as DMMs are constantly evolving and new versions are emerging for different use cases.
Kruljac [46], analyzed 21 DMMs (out of over 150 identified in the literature) and concluded that the models primarily serve as analytical tools to assess digital maturity based on their own criteria. This is mainly due to the lack of empirical validation of the most important model elements and the predominantly commercial and non-academic application of the models. The development of a high-quality DMM requires a documented approach that includes all critical development steps and aims to improve the modeling process and contribute to model standardization. It is important to apply a well-formulated process theory and clearly define the maturity path to avoid misinterpretation of an organization’s current maturity level. In addition, empirical validation is required to ensure the reliability and credibility of the model. Analyzes of common models such as IMPULS [47], and the PwC framework have shown that they have limited applicability to SMEs due to the lack of specific relevant categories and practical guidelines that need to be clearly defined and understandable [48]. A systematic review of the dimensions of the DMM revealed six commonly used dimensions: technology, people, strategy, leadership, process and innovation. Technology was found to be the most dominant and decisive for improving the competitive advantage of companies [49]. However, no existing DMM fulfills all the defined criteria, such as a detailed description of the model components and universal applicability across all industries [50]. The Digital Transformation Capability Maturity Model (DX-CMM) was developed as a holistic and integrated framework that is applicable across different industries. The model provides a detailed assessment of the current digital maturity level, actionable guidance for further development and the ability to benchmark organizations that have been assessed using the same approach. It was developed based on the SPICE process DMM and the framework proposed by De Bruin et al. [47]. The review focused on SMEs in the manufacturing and logistics sectors, which are key areas of research in large companies, including technological infrastructure, organizational strategy, data processing and analysis, and digitalization of products and services [51]. The review also identified a significant lack of research focusing specifically on SMEs, with only two studies addressing logistics in SMEs. Key topic areas included manufacturing processes, product development, digital data capture and analysis, technology infrastructure, logistics, performance evaluation and employee engagement. The findings point to numerous opportunities for future research, particularly in areas such as digital manufacturing, while emphasizing the need to consider the specific requirements of SMEs in developing countries to facilitate the adoption of Industry 4.0.
Spaltini et al. [52] have developed the 6P DMM for SMEs to support them in their DT. The 6P model comprises six primary socio-economic and technical dimensions: product-service, processes, platform, people, partnership and performance and covers 36 areas related to Industry 4.0 areas in five maturity levels. Despite the comprehensive approach, validation with manufacturing SMEs revealed that the initial maturity level was perceived by some experts as too advanced compared to the actual state of certain companies. Future iterations of the model could include a "level 0" to better describe the initial maturity of such companies.
Recent research shows the importance of distinguishing between assessing the maturity of organizations and processes [53]. Tubis, [54] has proposed a framework for maturity assessment that considers two dimensions: the organizational and the process dimension. The organizational dimension reflects the overall level of DT implementation, while the process dimension focuses on the operational departments. The Digital Maturity Assessment Model (DMAM) was developed through extensive research to address the specific needs of SMEs when assessing digital maturity. By identifying key business challenges and developing a comparative analytical framework based on resource dependency theory (RDT), the DMAM provides a practical, applicable tool for SMEs. The DMAM is based on a positivist foundation and is supported by Design Science Research (DSR) and Capability Maturity Model Integration (CMMI) methods. It offers clearly defined criteria and tailored recommendations for digitization processes in SMEs. In contrast to existing models, DMAM addresses key shortcomings and lays the foundation for future research while serving as an important resource for supporting SMEs in their DT efforts. Comparative analyzes of existing models provide valuable insights into current business environments and model requirements and facilitate the development of new approaches [55]. Future research could investigate the application of DMMs in different industries or explore how cultural, regulatory, and economic factors influence the adoption and adaptation of models in different countries and regions.
Finally, Ustundag et al. [56] analyzed several established DMMs for industrial companies and proposed an alternative model that includes 13 relevant domains grouped into three dimensions: smart products and services, smart business processes, and strategy and organization. The applicability of the model was confirmed by tests in a retail company. The authors recommend further improvements by prioritizing industry-specific areas and developing activity plans tailored to the current maturity level of each company.
Due to rapid technological progress and increasing competitive pressure, DTIs and DMMs are becoming increasingly important for SMEs. These tools help companies to determine their current digital capabilities, formulate DT strategies and adapt to the challenges of modern markets. The indices serve as strategic guides for SMEs and help identify areas where they are lagging behind their competitors or where additional efforts and investments are needed. DESI, for example, enables EU Member States to identify digital disparities between SMEs and allocate resources to the specific needs of different sectors. While DTIs provide a broad, quantitative overview of companies' digitalization levels, DMMs offer deeper, more detailed analyzes of specific areas within a company's DT. Companies use these models to assess their current status, set strategic goals and compare their progress with that of their competitors. The link between DTIs and DMMs is crucial throughout the DT process. Indices provide a macro perspective on a company's market position in relation to digitalization, while models facilitate internal assessment and strategic planning. Their complementarity enables companies to gain a holistic understanding of their digital readiness and optimize resource allocation. By using both tools, SMEs can better prioritize their investments in technology and digital processes. This is particularly important as many SMEs are working with limited resources for business development and the sustainability of their competitiveness. In order to maximize the impact of available resources on improving business processes, it is important to make informed strategic decisions. DTIs and DMMs therefore provide important guidance in navigating the complexities of DT. While indices provide information on competitive position, DMMs help to assess internal capabilities, set priorities and implement digital strategies. The integration of both approaches enables companies to improve their digital maturity, increase their ability to innovate and achieve sustainable growth in the digital age. In addition, DMMs serve as valuable tools for the ongoing evaluation of digitalization efforts. They allow companies to track their progress using multidimensional criteria functions that reflect the key elements of digitalization and support continuous improvement and strategic agility [46].
Numerous studies in the literature confirm both the applicability and the necessity of using digital maturity assessment tools and DT indices. Verhoef et al. [20] emphasize that SMEs using digital maturity frameworks are better able to develop sustainable strategies, reduce operating costs and increase productivity. The authors claim that digital maturity is a crucial factor for the long-term growth and competitiveness of SMEs. Similarly, Westerman et al. [23] emphasize the importance of applying DMMs, especially in resource-constrained environments typical of SMEs. They note that companies using maturity assessment tools tend to achieve faster results and show greater resilience to market fluctuations. Although the basic principles underlying the use of DTIs and DMMs are applicable to a wide range of business types, industrial SMEs face particular challenges. These challenges are often technical in nature and include automation, the integration of IoT technologies and the redesign of production processes. Tools such as the SIRI, the Industry 4.0 Maturity Index and the DOMM provide a structured framework for industrial SMEs to better understand their technological requirements and competitive advantages in the context of DT [35].
The literature review has provided essential insights and knowledge necessary for understanding the specifics of DT processes and their application in different contexts. Given the variety of models that have been developed for different industries and use cases, it is important to identify and select the most appropriate model that provides the most value for a particular company’s digitalization journey. Most existing DMMs have been developed for specific industries, company sizes or geographic regions. These models are often proprietary or "closed"," meaning that end users are usually unable to customize the evaluation criteria to their own strategic priorities or the relevance of certain factors that are critical to a successful DT implementation. The limited transparency and complexity of the methods used make it difficult for users to understand the underlying model mechanisms. This can lead to uncertainty in the interpretation of results, complicate the process of defining actionable steps and priorities for further development, and ultimately weaken motivation or even lead to DT initiatives being abandoned, missing crucial opportunities to improve competitive advantage [57].
Recent analyzes of industrial practice show that the level of digital maturity in the region, which is often equated with the level of implementation of Industry 4.0, is still in its infancy. The Croatian Digital Index (HDI) developed by Apsolon, for example, assesses the readiness of Croatian companies to face the challenges of the digital economy. In a study from 2021, in which 273 companies (20% large companies and 80% medium-sized companies) participated, the average digitalization score was 2.59, compared to 2.52 in 2020 [58]. The average level of readiness for DT was estimated at 3.26 on a scale of 1-5. Given the significantly greater ability of larger companies to implement DT, it can be assumed that the actual digital maturity level of SMEs is below 3.0.
Further longitudinal studies on the digital maturity of Croatian manufacturing companies have been conducted for over a decade by a research team led by Mladineo [59]. This ongoing analysis focuses on different sectors of the manufacturing industry with the exception of industries that are inherently highly automated, such as food processing, pharmaceuticals and mineral processing. In the most recent study from 2022, in which large companies accounted for 8%, medium-sized companies 49% and the rest small and micro companies, the average digital maturity level was 2.45. This is a slight increase from 2.15 in 2015. Overall, however, progress remains exceptionally slow. Of particular concern is the technology dimension, which serves as the foundation for DT but has shown little to no improvement in the period observed. Conversely, progress in IT systems and standardization can be attributed to relatively accessible investments. Nevertheless, the impact of these improvements has been limited by the lack of synergistic development in other critical areas, such as human resources and organizational structure.
Palčić et al. [60,61] investigated the adoption of digital technologies in manufacturing companies in Slovenia, Croatia and Serbia. Their study showed the limitations of cross-national comparisons due to inconsistencies in model definitions, dimensions and data collection methods. The results showed significant differences in readiness levels, with Slovenia outperforming its neighbors — likely due to Slovenian companies' participation in global supply chains with advanced markets such as Germany, Austria and Switzerland. The share of companies using digital technologies at the three highest levels was 39.9% in Slovenia, compared to 28.5% in Croatia and 24.1% in Serbia.
Trstenjak et al. [62] assessed the Industry 4.0 readiness of Croatian companies using a simplified self-assessment approach. The results showed a low level of implementation, but a high awareness and understanding of the need for DT. Digitization of business processes and automation were ranked as a priority, although progress over the last decade has been negligible. The authors emphasized the need for increased efforts by government, academia and industry to accelerate the DT process.
Comparative analyzes of Industry 4.0 readiness in Bosnia and Herzegovina and Croatia also showed a low level of maturity in both countries. Bajrić et al. [63] emphasized the need to develop methods to support SMEs in their DT efforts. Further studies and projects in the Western Balkans have confirmed that awareness of the importance of digital communication is high, but implementation is limited due to cost, lack of expertise and technological complexity. It is recommended to continue investing in education, infrastructure and digital skills to help SMEs realize the full potential of DT [64,65,66].
These findings highlight the significant gap between current and desired levels of digital maturity and the urgency to accelerate DT, particularly in the manufacturing industry. Effective transformation requires a clear strategy and well-defined guidelines to guide the process. DMMs are indispensable tools that provide objective assessments of the current state and roadmaps aligned with business goals [67]. However, most existing models are based on assumptions about the industry, company size or market environment, which limits their universal applicability. Greater model specificity often increases the risk of miscalculation and makes it more difficult to prioritize activities. In addition, many models contain extensive sets of dimensions aimed at reaching Industry 4.0 or even Industry 5.0 maturity levels. For companies with a lower maturity level, this can lead to demotivation. Given the current average maturity level of 2.45, the transition to advanced levels requires significant investment and time. One solution is to adopt a continuous improvement approach based on small, achievable milestones. Customizable DMMs provide additional value as they allow for user-defined weighting of dimensions and priorities that reflect the specific context of each organization [57].
2.2. Definition of the Basic DMM
Based on the principles of flexibility, simplicity and modularity, a new digital DMM has been developed that is specifically tailored to micro-enterprises and SMEs. The model has been designed to meet the real needs of users and the different industrial and organizational contexts. The model was developed in two main phases. In the first phase, a basic structure was defined to identify and organize the key DT elements and enable initial maturity assessments. After iterative improvements, customization features were introduced in the second phase to allow users to adapt the model to their specific status and requirements based on actual digital maturity. This enhanced functionality facilitates the identification of priority goals and actions and significantly increases the practical usability of the model.
The final version represents a comprehensive and applicable tool for effectively planning, defining and monitoring DT strategies and provides valuable support to organizations aiming for a higher level of digital maturity. This can significantly accelerate the improvement of digital maturity.
Before defining the model structure, the following objectives and guidelines were established to ensure the development of a DMM specifically tailored to manufacturing SMEs in the local context:
- Complete comprehensibility for the user in both descriptions and calculations of the DMM.
- A set of dimensions corresponding to the current state of digital maturity in Croatia and the Balkan region.
- Maturity levels adapted to the regional digital maturity landscape.
- The number and content of elements per dimension correlated with the findings from the literature and the current maturity levels.
- The total number of dimension items was limited to 70 to ensure that the assessments could be completed within 90 minutes.
- Simple determination of the importance of the dimensions using a multi-criteria decision making method (MCDM).
- Possibility to assign differentiated importance to items within a dimension.
- Easy scalability, allowing the addition of new dimensions and items.
- Use of commonly available tools (MS Office) in the initial development phase.
- Potential for future upgrades to a web-based interface.
The first step in defining the base model was to determine its structure, including the selection of dimensions, associated items, a method for determining the meaning of the dimensions and the number and definition of maturity levels. The conclusions from the literature review [12], [31,32], [42,43], [50,51], [53], [56], [68] the current digital readiness levels [64,65] and the maturity levels [58,59] are the main generators for the definition of the model structure. This fact and the author's professional experience led to the selection of six dimensions (in alphabetical order): People and Expertise, Operability, Organization, Products/Production processes, Strategy and Technology.
Taking into account the average level of digital maturity in the Balkan region, the model was defined with four maturity levels. The usually used fifth level - innovation maturity - was deliberately not considered in this phase. This decision reflects the significant gap between the current maturity level and the desired fifth level, which is associated with readiness for Industry 4.0. The exclusion helps to avoid user discomfort, demotivation and unnecessary spending on unachievable goals in the early stages of DT. The four-level structure is designed to maintain motivation and ensure that maturity assessments remain both realistic and practical.
Once the maturity level of Managed is reached in certain dimensions, the model can be flexibly extended. Additional dimensions, such as innovation and other elements within existing or newly introduced dimensions, can be seamlessly integrated. This scalability ensures that the model can be adapted to the company's evolving DT goals and technological progress.

Table 1.
Definition of digital maturity levels for DT.
| Maturity level | Description |
|---|---|
|
The company has no or only a minimal strategy for DT. Digitalization activities are carried out on an ad hoc basis, without a clear structure or alignment with the company’s goals. This phase is characterized by a lack of planning, informal processes and limited or non-existent digital resources. |
|
Fundamental digital initiatives are underway. There is an organizational interest in digitalization, but the activities are not yet fully integrated into the corporate strategy. In this phase, there are initial digital strategies, isolated projects and a low level of digital competence among employees. |
|
There are structured digital initiatives with clear strategies for the introduction of technology. Business processes and digital tools are gradually integrated, supported by clearly defined digitalization goals and targeted investments in technology. Formal processes are in place for the development of digital capabilities and the company aligns its digital strategies with overall business objectives, creating a solid foundation for the further development of DT. |
|
Digital strategies and technologies are fully integrated into the business processes. The company uses data and technology to optimize business performance. Leadership plays a central role in driving DT, which is characterized by a high degree of technology integration, extensive use of analytics and data-driven decisions, and a robust digital infrastructure to support business processes. |
|
Given the current average maturity level of SMEs and the significant gap between existing capabilities and the skills required for advanced Industry 4.0 maturity, this stage is intentionally omitted at this stage. |
3. Results
The core components of the developed DMM are the result of a synthesis of relevant findings from the literature and validated models previously developed by Rossmann [42], Schumacher et al. [36] Lichtblau et al. [68], and Ustundag et al. [56]. Selected elements of these models were further reviewed and adapted to the specific conditions of industrial practice. The authors’ extensive professional experience and systematic consultations with industry experts as part of a structured Delphi process were taken into account.
In the initial phase, a total of 86 DT elements were identified. After a comprehensive assessment and several rounds of expert consultations, this number was reduced to 66 elements spread across six key dimensions of the model. The number of elements within the dimensions varies, from five in the Products and Processes dimension to fifteen in the Technology dimension, which was recognized as the most sensitive and influential component for the successful implementation of DT initiatives [57].
3.1. Determination of Dimension Weights
Most of the models analyzed determine the weighting values of each dimension based on the opinions of leading experts and academics by drawing on their experience or adopting generally accepted guidelines. However, since each company differs in its strategy, resources, market, products and organizational structure, it is obvious that any significant deviation in these aspects requires corresponding adjustments to the model.
To determine the relative importance of each dimension, an additional analysis was conducted in collaboration with practitioners and academics in the field using multi-criteria decision making (MCDM) methods. The Analytic Hierarchy Process (AHP) developed by Saaty was selected as one of the most effective methods for structured decision making in complex systems. AHP incorporates both subjective and objective elements in the evaluation of importance. The method is based on pairwise comparisons, where the weighting coefficients are determined by calculating the most important right eigenvector of a positive reciprocal matrix [69]. In addition to determining the importance of the dimensions, pairwise comparisons were also performed to evaluate the relative importance of each alternative within each dimension. The detailed concept, calculations and reasons for choosing the AHP method are explained in a previous publication by the authors [70].
In order to evaluate the current status of the individual element within the dimensions, a five-point rating scale was defined as follows:
0 – Not applicable
1 – Statement completely negative
2 – Statement predominantly negative
3 – Statement predominantly positive
4 – Statement completely positive
The first version of the model was developed using Microsoft Excel to ensure accessibility for a wide range of users and to allow autonomous management of weights and scores. All relevant mathematical calculations and dependencies were implemented in this solution and form the basis for the future development of a web-based application. The model, as defined, largely fulfills the core requirements and objectives set during its development, in particular by providing functionality to assess the digital maturity level of an company. The only limitation identified relates to the limited ability of users to distinguish the importance of individual elements within the same dimension of DT. This limitation is in contrast to guideline no. 7, which was established during the development of the model. Empirical tests of the model with a representative sample of micro, SMEs have shown that the basic version is perfectly adequate for companies with a lower level of digital maturity. In such cases, the model enables a structured and effective approach to developing an initial digital strategy and thus fulfills its main function as the first step in the DT process.
3.2. Definition of the Extended Maturity Assessment Model
For companies with a higher level of digital maturity, a need for additional functionality was identified, particularly in prioritizing activities and refining the ability to differentiate the importance of intra-dimensional elements. To this end, an extended version of the base model was developed, which includes tools for prioritizing and further weighting individual elements within each dimension. In the basic model, the weightings of the dimensions were determined using the AHP method and kept consistent across all dimensions to ensure a time-efficient assessment (maximum 90 minutes). With the extended model, the Dynamic Adaptive Maturity Assessment Model (DAMA-AHP), users can differentiate the importance of the elements within the dimensions. They can define a (desired) maturity level for each element, which enables more precise planning of transformation activities. Users can adjust the impact of each weighting using predefined correction factors between -20% and +20% (available gradations: ±4%, ±8%, ±12%, ±16% and ±20%). These corrections dynamically adjust the weighting of the elements within a dimension and thus enable a personalized adaptation of the model to the strategy and the current state of the company. This functionality enables the strategic improvement of selected areas in line with the company's defined priorities.
Given the current digital maturity level of Croatian SMEs, it is crucial to accurately identify and prioritize transformation activities, as comprehensive digitalization strategies are often impractical due to resource constraints. To support realistic planning, the model introduces a “desired maturity level” category, expressed as discrete values between 1 and 4. Companies can initially set level 3 as the default target, which is justified by the motivational benefits and the average maturity level observed in initial assessments. However, the target levels can be freely adjusted after analyzing the assessment results. By incorporating the desired maturity levels and weight corrections, a prioritized list of activities emerges, providing a structured hierarchy of improvements and a clear sequence of actions to improve individual elements, dimensions and the overall digital maturity level of the company. This process establishes a direct link between the current maturity level, the strategic goals and the operational steps in the DT process.
The model thus enables precise prioritization of activities to improve digital maturity both at the level of individual elements within the dimensions and across the company, while also including a dynamic component to track the progress of DT initiatives.
3.3. Workflow for the Application of the DAMA-AHP Model
The effective implementation of the developed digital maturity model requires the formation of a qualified interdisciplinary team within the organization. The team should consist of experts who have sufficient knowledge of DT. This includes basic knowledges of concepts, principles, relevant technologies as well as organizational and administrative practices. Beyond technical expertise, team members must have a comprehensive understanding of business processes at all organizational levels — from strategic planning and operational execution to systematic monitoring and performance reporting. The size and structure of the team should be appropriate to the size of the company and the complexity of its business activities.
In practice, especially in micro, small and medium-sized enterprises (SMEs), there is often a lack of personnel with the necessary skills for DT processes. This deficit can significantly impact the effectiveness of model implementation without visible improvements in digital transformation. It is therefore crucial to identify the need for additional staff training at an early stage, as this is an important prerequisite for the successful assessment and implementation of digital strategies.
The digital maturity assessment process comprises four main steps:
1. Determining the weighting values for individual dimensions of digital maturity
2. Assessing the maturity level of the individual DT elements
3. Adjusting the desired maturity level for each DT element
4. Adjusting the weighting values for the individual DT elements
A detailed flow of the assessment process is shown in Figure 1.
In the first phase, the weighting values are determined for each of the six defined DT dimensions. AHP method was used to enable a structured and transparent determination of the relative importance of the dimensions based on pairwise comparisons. The method involves a two-step process: first, users indicate the relative importance between two dimensions; then they quantify the preference intensity using a Likert scale from 1 to 9. If the resulting matrix has a consistency ratio of less than 10%, no further adjustments are required. Should this threshold be exceeded, the second step is to review and revise the ratings to achieve an acceptable level of consistency. The implemented software tool contains functions that automatically guide the user through the adjustment of the weighting factors, thus ensuring objectivity as well as mathematical and logical consistency of the final results.
The approach used is based on an open version of the AHP method, which has proven to be particularly suitable in previous studies conducted in collaboration with industry experts due to its transparency, ease of implementation and adaptability [69,70]. An example of practical results illustrating the weighting factors assigned to each dimension can be found in Figure 2.
Next, each DT element is evaluated via a drop-down menu with predefined scores from 0 to 4, and the selection of a desired maturity level. Given the representative number of DT elements, each is assigned a unique identifier reflecting the corresponding dimension. Once the current and desired maturity levels are entered, the model automatically calculates a composite maturity level for each dimension using the mathematical formula (1) adopted from Schumacher et al. [36]:
where:
MDi = composite maturity score for dimension i
MrDEi = assigned score for element i
gDEi = weighting factor for element i
n = total number of elements in the dimension
The overall maturity level of the organization is defined by formula (2):
The average maturity level is calculated by formula (3):
The results for both the overall digital maturity score and the individual dimensions are presented in tabular form and illustrated by a radar chart, as shown in Figure 3. To improve visual clarity, a traffic light color scheme is used to indicate the current level of digital maturity.
The next step is to customize the desired maturity levels and weighting factors for each DT element. The result of these adjustments is the creation of a prioritized list of improvement actions based on the calculated gaps between the current and desired state and the adjusted weighting factors (within a predefined range of ±20%).
The user interface for assessing, analyzing and adjusting the individual DT elements is designed to be intuitive to use. An example of the Strategy dimension can be found in Figure 4. All other dimensions follow the same structure. In addition, the ranking column contains a traffic light visualization function that helps to clearly identify the elements that need to be improved as a priority.
The correction factor selected for each element affects both the increase or decrease of the original dimension weight (determined by the AHP method) and the calculation of the GAP. The Action Priority assessment depends on the gap between the target and current maturity level and the applied correction of the weighting factor for each DT element, based on the strategic importance of the respective aspect.
The GAP is calculated according to (4):
Where:
DML = Desired Maturity Level
CML = Current Maturity Level
The weighting factor for each DT element (TfDEi) is calculated as the product of the AHP weight of the dimension and the correction factor of the element, as shown in equation (5):
Where:
TfD(AHP)i = weight of the dimension from the AHP analysis
KfDEi = correction factor for the DT element
The priority value for each element PS DEi is determined by equation (6):
All priority values are normalized to relative ratios using equation (7):
A sunburst diagram visually represents the distance between the current and desired maturity level for each DT element in Figure 5. For example, within the Strategy dimension, the distance is largest for element 12 and smallest for element 13. DT elements where the current maturity level meets or exceeds the desired maturity level are excluded from the diagram as they do not represent immediate priorities for improvement. As the company’s digital maturity evolves and new assessments are carried out, these elements may reappear in the diagram.
Given the generally low initial maturity level and the clear need for improvement in most DT elements, the model produces a final prioritized list of elements, Table 2. This list results from all evaluation steps, including determining the dimension weighting, scoring the elements, adjusting the desired maturity level, and correcting the weighting within the dimensions.
As DT is a complex and resource-intensive process, a precise definition of the priorities for action is essential. The prioritized list provides a clear overview of the priority elements, regardless of their dimension, and serves as a solid basis for the detailed planning of activities to improve the digital maturity of each element. The resulting priority list for improving the digital maturity level serves as the basis for the detailed development of the digital strategy and its integration into the company’s existing business strategy. This provides each company with an operational tool for defining, implementing and regularly reviewing the progress of its DT efforts. The workflow shown in Figure 1 is repeated in defined cycles until the desired maturity level is achieved in all dimensions and DT elements.
4. Model validation through Case Study
During the planning phase of model development, the final phase consisted of validating the model in real manufacturing SMEs. Six companies were selected: three whose experts were involved in the development phase and three other companies. The selected companies represented the full spectrum of SMEs and were active in various industries, including metal processing, automotive manufacturing, glass manufacturing and engine maintenance. All participating companies recognized the importance of DT for business sustainability and were at different stages of DT implementation. Prior to the assessment, all participants received comprehensive training on the fundamentals of DT and how to apply the model to ensure competency in both the business and digital domains.
After the model assessments were completed, the individual and collective results were analyzed. Table 3 shows the final maturity levels for each dimension, while Table 4 summarizes the established weighting factors for each dimension. The average digital maturity level of the six companies was 1.65. The highest values were observed in the Products/Processes dimension (2.42) and the lowest in the Technology dimension (1.85). The low variability between the companies (standard deviation ~0.31) indicates similar but generally low maturity levels, which is consistent with previous studies. The radar chart illustrates the differences between the companies in the different dimensions, which are influenced by different DT element scores and weighting factor definitions, Figure 6. The weighting distribution chart shows that the Strategy and People and Expertise dimensions were weighted highest on average (~25%), while the Technology and Operability dimensions were consistently weighted lower (~10%), Figure 7. Significant differences in weighting between companies reflect different strategic priorities and organizational contexts.
The high priority dimensions (Strategy and People and Expertise) show only a moderate level of maturity, indicating that further investment in these areas is required to achieve the company’s strategic goals. Although the Technology dimension has the lowest maturity level, it was assigned a relatively low weighting, suggesting that the participating companies currently view technology as a supporting function rather than a primary driver of change. The dimensions of Strategy and People and Expertise were weighted higher due to their low level of maturity.
The dimensions of Organization and Products/Processes dimensions show a more stable development, although their strategic importance varies greatly from company to company. The wide range of weighting factors in the dimensions of Strategy, Products/Processes. and People and Expertise reflects the different strategic orientations, which are probably influenced by differences in company size, industry sector and the degree of DT that has already taken place. These differences highlight the adaptability of the DAMA-AHP model in aligning with the specific strategic priorities of individual companies.
The analysis of the applicability of the model clearly shows that the strategic priorities and digital maturity level match in some dimensions, while critical gaps can be identified in others. This is particularly true for the People and Expertise dimension, whose importance has been recognized but whose maturity level lags behind. This combination of maturity assessments and weighting factors enables the accurate identification of priority dimensions for targeted investment and development. Companies are advised to focus their resources on dimensions that are simultaneously high priority but low maturity to maximize the effectiveness of their DT efforts. An additional value of the DAMA-AHP model lies in its functionality to adjust both the desired maturity levels and the weighting of individual DT elements within each dimension, thus clearly defining the priorities for organizational improvement.
The validation results confirm that the model fulfills all predefined conceptual requirements. The DAMA-AHP model provides the user with considerable customization capabilities in assigning weights to the dimensions and adjusting the weighting of each DT element to align with the business and digital strategies and current maturity level of each company. The model provides clear, actionable priorities for improving specific DT elements and dimensions, making it a valuable management tool for steering DT activities.
A notable limitation of the model is the relatively small number of companies involved in the validation, which limits the generalizability of the results.
5. Conclusions
The process of digital transformation (DT) has been omnipresent in all industries for some time now. Over the last decade, there has been a rapid development of tools and methods to help stakeholders approach DT through strategic planning. Digital Maturity Models (DMMs) have proven to be highly effective tools for assessing the current state of digital maturity and identifying the gap between current and desired maturity levels.
Given the considerable diversity of industries, organizational structures and specific business processes, there was a clear need for continuous adaptation of DMMs to different contexts. The Dynamic Adaptive Maturity Assessment Model (DAMA-AHP) was developed based on critical dimensions identified in previously analyzed models, with specific adjustments to reflect the state of DT in the regional context. The model explicitly highlights the differences in the development of each dimension, allowing for a targeted approach to address specific weaknesses.
The DAMA-AHP model was primarily developed to accelerate DT in regional companies, but can also be used more broadly. It is user-centric and aims to increase motivation during the improvement process and define clear priorities for aligning business and digital strategies. Users can customize the weighting to reflect industry specifics or strategic objectives within each dimension by using a classification based on the criticality of individual DT elements.
Validation results show that the model ensures sufficient consistency while maintaining adequate resolution to clearly classify the details of the different DT elements. The DAMA-AHP model allows for extensive customization of the weighting of the dimensions by the user and allows the weighting of the individual DT elements to be adjusted in accordance with the company’s business and digital strategies as well as the current level of digital maturity.
Future developments of the DMM are foreseeable, in particular the introduction of a fifth maturity level as companies approach the desired fourth maturity level. This development will involve the addition of new dimensions and elements, while keeping the number of assessment elements manageable. Further research could lead to the development of a final model that dynamically adapts to an organization’s evolving digital maturity level. To maintain optimal complexity and a reasonable timeframe for conducting the assessments, new elements or dimensions would be activated based on preliminary assessments of individual elements.
Author Contributions
Conceptualization, E.K. and D.P.; methodology, E.K.; validation, E.K., S.D. and D.P.; formal analysis, E.K. and I.Č.; investigation, E.K, S.D., D.P. and I.Č.; data curation, S.D.; writing—original draft preparation, E.K.; writing—review and editing, S.D. and D.P.; visualization, S.D.; supervision, D.P.; project administration, D.P and I.Č. All authors have read and agreed to the published version of the manuscript.
Institutional Review Board Statement
Not applicable
Informed Consent Statement
Not applicable
Data Availability Statement
Data available upon request from the first author.
Acknowledgments
This work has been fully supported by the University of Rijeka (contract no. uniri-iskusni-tehnic-23-255 & uniri-iskusni-tehnic-23-260).
Conflicts of Interest
The authors declare no conflicts of interest.
References
- Kraus, S.; Jones, P.; Kailer, N.; Weinmann, A.; Chaparro-Banegas, N.; Roig-Tierno, N. Digital Transformation: An Overview of the Current State of the Art of Research. Sage Open 2021, 11. [Google Scholar] [CrossRef]
- Wirtz, B.W.; Weyerer, J.C.; Heckeroth, J.K. Digital Disruption and Digital Transformation: A Strategic Integrative Framework. International Journal of Innovation Management 2022, 26. [Google Scholar] [CrossRef]
- Åström, J.; Reim, W.; Parida, V. Value Creation and Value Capture for AI Business Model Innovation: A Three-Phase Process Framework. Review of Managerial Science 2022, 16, 2111–2133. [Google Scholar] [CrossRef]
- Hess, T.; Matt, C.; Benlian, A.; Wiesböck, F. Options for Formulating a Digital Transformation Strategy. MIS Quarterly Executive 2016, 15, 123–139. [Google Scholar]
- Chan, Y.E.; Krishnamurthy, R.; Sadreddin, A. Digitally-Enabled University Incubation Processes. Technovation 2022, 118. [Google Scholar] [CrossRef]
- Small and Medium Enterprises (SMEs) Finance. Available online: https://www.worldbank.org/en/topic/smefinance? (accessed on 18 April 2025).
- Di Bella, L..; Katsinis, A..; Lagüera-González, J..; Odenthal, L..; Hell, M..; Lozar, B.. Annual Report on European SMEs 2022/2023 : SME Performance Review 2022/2023; Publications Office of the European Union, 2023; ISBN 9789268061749.
- Nimac, P.; Boroš, S.; Bašadur, A. Structural Business Indicators of Enterprises, 2020; Zagreb, 2022;
- Meyendorf, N.; Ida, N.; Singh, R.; Vrana, J. Handbook of Nondestructive Evaluation 4.0. In; Springer Nature Switzerland, 2021; pp. 107–125 ISBN 978-3-30-73205-9.
- Lang, V. Digitalization and Digital Transformation. In: Digital Fluency. In Digital Fluency; APress Media, LLC, part of Springer Nature, 2021; pp. 1–50.
- Reis, J.; Amorim, M.; Melão, N.; Cohen, Y.; Rodrigues, M. Digitalization: A Literature Review and Research Agenda. In Proceedings of the Proceedings on 25th International Joint Conference on Industrial Engineering and Operations Management – IJCIEOM. IJCIEOM 2019. Lecture Notes on Multidisciplinary Industrial Engineering; Springer, 2020.
- Schumacher, A.; Erol, S.; Sihn, W. A Maturity Model for Assessing Industry 4.0 Readiness and Maturity of Manufacturing Enterprises. In Proceedings of the Procedia CIRP; Elsevier B.V., 2016; Vol. 52, pp. 161–166.
- Wen, H.; Zhong, Q. ; Chien-Chiang Digitalization, Competition Strategy and Corporate Innovation: Evidence from Chinese Manufacturing Listed Companies. International Review of Financial Analysis 2022, 82. [Google Scholar] [CrossRef]
- Nasiri, M.; Saunila, M.; Ukko, J. Digital Orientation, Digital Maturity, and Digital Intensity: Determinants of Financial Success in Digital Transformation Settings. International Journal of Operations and Production Management 2022, 42, 274–298. [Google Scholar] [CrossRef]
- Brynjolfsson, E.; Rahman, M. Competing in the Age of Omnichannel Retailing. MIT Sloan Manag Rev 2013, 54. [Google Scholar]
- Benlian, A.; Kettinger, W.J.; Sunyaev, A.; Winkler, T.J. Special Section: The Transformative Value of Cloud Computing: A Decoupling, Platformization, and Recombination Theoretical Framework. Journal of Management Information Systems 2018, 35, 719–739. [Google Scholar] [CrossRef]
- Santos, S.; Gonçalves, H.M.; Teles, M. Social Media Engagement and Real-Time Marketing: Using Net-Effects and Set-Theoretic Approaches to Understand Audience and Content-Related Effects. Psychol Mark 2023, 40, 497–515. [Google Scholar] [CrossRef]
- Li, D.; Fast-Berglund, Å.; Paulin, D. Current and Future Industry 4.0 Capabilities for Information and Knowledge Sharing: Case of Two Swedish SMEs. International Journal of Advanced Manufacturing Technology 2019, 105, 3951–3963. [Google Scholar] [CrossRef]
- Hodapp, D.; Hanelt, A. Interoperability in the Era of Digital Innovation: An Information Systems Research Agenda. Journal of Information Technology 2022, 37, 1–21. [Google Scholar] [CrossRef]
- Verhoef, P.C.; Broekhuizen, T.; Bart, Y.; Bhattacharya, A.; Qi Dong, J.; Fabian, N.; Haenlein, M. Digital Transformation: A Multidisciplinary Reflection and Research Agenda. J Bus Res 2021, 122, 889–901. [Google Scholar] [CrossRef]
- Grufman, N.; Lyons, S. Exploring Industry 4.0 A Readiness Assessment for SMEs, Stockholm Umiversity, 2020.
- Schoemaker, P.J.; Heaton, S.; Teece, D. Innovation, Dynamic Capabilities, and Leadership. Calif Manage Rev 2018, 61, 15–42. [Google Scholar] [CrossRef]
- Westerman, G.; Bonnet, D.; McAfee, A. Leading Digital: Turning Technology into Business Transformation; Harvard Business Review Press: Boston, 2014; Vol. 61; ISBN 978-1-62527-247-8.
- Nambisan, S.; Wright, M.; Feldman, M. The Digital Transformation of Innovation and Entrepreneurship: Progress, Challenges and Key Themes. Res Policy 2019, 48. [Google Scholar] [CrossRef]
- Hanelt, A.; Bohnsack, R.; Marz, D.; Antunes Marante, C. A Systematic Review of the Literature on Digital Transformation: Insights and Implications for Strategy and Organizational Change. Journal of Management Studies 2021, 58, 1159–1197. [Google Scholar] [CrossRef]
- Marcos, S.; Reis, J.L.; Pereira, R.H. Digital Maturity Model for Industries SMEs: A Systematic Digital Maturity Model for Industries SMEs: A Systematic Literature Review. In Proceedings of the CAPSI 2024 Proceedings Portugal (CAPSI); AIS Electronic Library (AISeL), 2024; pp. 41–55.
- European Commision Digital Economy and Society Index (DESI). Available online: https://digital-strategy.ec.europa.eu/en/library/digital-economy-and-society-index-desi-2021 (accessed on 2 March 2025).
- Telecommunication Union, I. Measuring Digital Development - Facts and Figures 2021; 2021; ISBN 9789261354015.
- Dell Technologies Digital Transformation Index 2020 Executive Summary; 2020.
- Georgescu, I.; Kinnunen, J. The Digital Effectiveness on Economic Inequality: A Computational Approach. In Proceedings of the Springer Proceedings in Business and Economics ((SPBE)); Springer Proceedings in Business and Economics. Springer, Cham., 2021.
- Chanias, S.; Hess, T. How Digital Are We? Maturity Models for the Assessment of a Company’s Status in the Digital Transformation. Management report 2016, 1–14. [Google Scholar]
- Rogers, D.; de Pablo, S. Digital Maturity Model. Available online: https://www2.deloitte.com/insights/us/en/focus/digital-maturity (accessed on 6 March 2025).
- EBD Core Development Team The Smart Industry Readiness Index Catalysing the Transformation of Manufacturing The Smart Industry Readiness Framework The LEAD Framework Available online: www.edb.gov.sg.
- Gill, M.; Vanboskirk, S. The Digital Maturity Model 4.0 Benchmarks: Digital Business Transformation Playbook. Available online: http://forrester.nitro-digital.com/pdf/Forrester-s%20Digital%20Maturity%20Model%204.0.pdf (accessed on 6 March 2025).
- Geissbauer, R.; Vedso, J.; Schrauf, S. 2016 Global Industry 4.0 Survey: Industry 4.0: Building the Digital Enterprise. Available online: www.pwc.com/industry40.
- Schumacher, A.; Erol, S.; Sihn, W. A Maturity Model for Assessing Industry 4.0 Readiness and Maturity of Manufacturing Enterprises. In Proceedings of the Procedia CIRP; Elsevier B.V., 2016; Vol. 52, pp. 161–166.
- Schuh, G.; Anderl, R.; Dumitrescu, R.; Krüger, A.; Ten Hompel, M. Using the Industrie 4.0 Maturity Index in Industry. Available online: https://en.acatech.de/publication/using-the-industrie-4-0-maturity-index-in-industry-case-studies/ (accessed on 10 March 2025).
- Kane, G.C.; Palmer, D.; Phillips, A.N.; Kiron, D.; Buckley, N. Strategy, Not Technology, Drives Digital Transformation Available online:. Available online: https://sloanreview.mit.edu/projects/strategy-not-technology-drives-digital-transformation (accessed on 11 March 2025).
- Fitzgerald, M.; Kruschwitz, N.; Bonnet, D.; Welch, M. Embracing Digital Technology, A New Strategic Imperative. Available online: http://sloanreview.mit.edu/faq/.
- Valdez-De-Leon, O. A Digital Maturity Model for Telecommunications Service Providers. Available online: www.timreview.ca.
- Ochoa-Urrego, RL.; Peña-Reyes, JI. Digital Maturity Models: A Systematic Literature Review. In Digitalization; Schallmo, D.R.A., Tidd, J., Eds.; Springer, Cham, 2021; pp. 71–85.
- Rossmann, A. Rossmann, A. Digital Maturity: Conceptualization and Measurement Model. In Proceedings of the 39th International Conference on Information Systems; ICIS 2018: San Francisco, 2019.
- De Carolis, A.; Macchi, M.; Negri, E.; Terzi, S. A Maturity Model for Assessing the Digital Readiness of Manufacturing Companies. In Proceedings of the IFIP Advances in Information and Communication Technology; Springer New York LLC, 2017; Vol. 513, pp. 13–20.
- Haryanti, T.; Rakhmawati, N.A.; Subriadi, A.P. The Extended Digital Maturity Model. Big Data and Cognitive Computing 2023, 7. [Google Scholar] [CrossRef]
- Thordsen, T.; Bick, M. A Decade of Digital Maturity Models: Much Ado about Nothing? Information Systems and e-Business Management 2023, 21, 947–976. [Google Scholar] [CrossRef]
- Kruljac, Ž. Modeli Digitalne Zrelosti Poduzeća-Objašnjenje, Pregled Literature i Analiza. Obrazovanje za poduzetništvo-E4E: znanstveno stručni časopis o obrazovanju za poduzetništvo 2019, 9, 72–83. [Google Scholar]
- De Bruin, T.; Health, Q.; Rosemann, M. Understanding the Main Phases of Developing a Maturity Assessment Model. Available online: http://www.efqm.org/Default.
- Axmann, B.; Harmoko, H. Industry 4.0 Readiness Assessment. Tehnički glasnik 2020, 14, 212–217. [Google Scholar] [CrossRef]
- Hizam-Hanafiah, M.; Soomro, M.A.; Abdullah, N.L. Industry 4.0 Readiness Models: A Systematic Literature Review of Model Dimensions. Information (Switzerland) 2020, 11, 1–13. [Google Scholar] [CrossRef]
- Gökalp, E.; Martinez, V. Digital Transformation Capability Maturity Model Enabling the Assessment of Industrial Manufacturers. Comput Ind 2021, 132. [Google Scholar] [CrossRef]
- Elhusseiny, H.M.; Crispim, J. A Review of Industry 4.0 Maturity Models: Adoption of SMEs in the Manufacturing and Logistics Sectors. In Proceedings of the Procedia Computer Science; Elsevier B.V., 2023; Vol. 219, pp. 236–243.
- Spaltini, M.; Acerbi, F.; Pinzone, M.; Gusmeroli, S.; Taisch, M. Defining the Roadmap towards Industry 4.0: The 6Ps Maturity Model for Manufacturing SMEs. In Proceedings of the Procedia CIRP; Elsevier B.V., 2022; Vol. 105, pp. 631–636.
- Omol, E.J.; Mburu, L.W.; Abuonji, P.A. Digital Maturity Assessment Model (DMAM): Assimilation of Design Science Research (DSR) and Capability Maturity Model Integration (CMMI). Digital Transformation and Society 2024. [Google Scholar] [CrossRef]
- Tubis, A.A. Digital Maturity Assessment Model for the Organizational and Process Dimensions. Sustainability (Switzerland) 2023, 15. [Google Scholar] [CrossRef]
- Kalender, Z.T.; Žilka, M. A Comparative Analysis of Digital Maturity Models to Determine Future Steps in the Way of Digital Transformation. In Proceedings of the Procedia Computer Science; Elsevier B.V., 2024; Vol. 232, pp. 903–912.
- Ustundag, A.; Cevikcan, E. Industry 4.0: Managing The Digital Transformation; Springer Series in Advanced Manufacturing; Springer International Publishing: Cham, 2018; ISBN 978-3-319-57869-9.
- Krulčić, E.; Doboviček, S.; Pavletić, D.; Čabrijan, I. A MCDA Based Model for Assessing Digital Maturity in Manufacturing SMEs. TEHNIČKI GLASNIK 2025, 19, 37–42. [CrossRef]
- Martinčević, N.Ć.; Salihić, A.; Novoselec, S.M.; Parić, A.; Jakopović, F.; Galijan, V.; Sandalić, D.; Nahić, E.; Perić, M.; Mikulaš, D.; et al. Digitalna Transformacija u Hrvatskoj. Available online: www.apsolon.com.
- Mladineo, M.; Celent, L.; Milković, V.; Veža, I. Current State Analysis of Croatian Manufacturing Industry with Regard to Industry 4.0/5.0. Machines 2024, 12. [Google Scholar] [CrossRef]
- Palčić, I.; Buchmeister, B.; Ojsteršek, R.; Kovič, K. Manufacturing Company Industry 4.0 Readiness: Case from Slovenia, Croatia and Serbia.; Academy of Sciences and Arts of Bosnia and Herzegovina, April 13 2022; pp. 25–34.
- Palcic, I.; Ojstersek, R.; Buchmeister, B.; Kovic, K. Industry 4.0 Readiness of Slovenian Manufacturing Companies. In Proceedings of the DAAAM International Scientific Book; 2022; pp. 001–016.
- Trstenjak, M.; Opetuk, T.; Pavković, D.; Zorc, D. Industry 4.0 in Croatia– Perspective and Industrial Familiarity with the (New) Digital Concept. In Proceedings of the Proceedings of 5th International Conference on the Industry 4.0 Model for Advanced Manufacturing; Wang, L., Majstorovic, V.D., Mourtzis, D., Carpanzano, E., Moroni, G., Galantucci, L.M., Eds.; Springer International Publishing: Cham, 2020.
- Bajrić, H.; Vučijak, B.; Kadrić, E.; Anđelić, A. Benchmarking of Bosnia and Herzegovina to Croatia Manufacturing Industry and Industry 4.0. TEM Journal 2021, 10, 1064–1071. [Google Scholar] [CrossRef]
- Gavrić, T.; Cosic, M. Challenges of The Fourth Industrial Revolution: A Case Study of Bosnia and Herzegovina. International Journal of Sales Retailing and Marketing 2021, 10, 51–60. [Google Scholar]
- Rakic, S.; Pavlovic, M.; Marjanovic, U. A Precondition of Sustainability: Industry 4.0 Readiness. Sustainability (Switzerland) 2021, 13. [Google Scholar] [CrossRef]
- Joković, J. Primena Koncepta Industrija 4.0 u Republici Srbiji. Zbornik radova Fakulteta tehničkih nauka u Novom Sadu 2020, 35, 1782–1785. [Google Scholar] [CrossRef]
- Aras, A.; Büyüközkan, G. Digital Transformation Journey Guidance: A Holistic Digital Maturity Model Based on a Systematic Literature Review. Systems 2023, 11. [Google Scholar] [CrossRef]
- Lichtblau, K.; Stich, V.; Bertenrath, R.; Blum, M.; Bleider, M.; Millack, A.; Schmitt, K.; Schmitz, E.; Schröter, M. Industrie 4.0 Readiness. Available online: https://industrie40.vdma.org/documents/4214230/26342484/Industrie_40_Readiness_Study_1529498007918.pdf/0b5fd521-9ee2-2de0-f377-93bdd01ed1c8 (accessed on 7 March 2025).
- Saaty, T., L. The Analitic Hierarchy Process. New York McGraw-Hill 1980, 324. [Google Scholar]
- Krulčić, E.; Pavletić, D.; Doboviček, S.; Žic, S. Multi-Criteria Model for the Selection of New Process Equipment in Casting Manufacturing: A Case Study. In Proceedings of the Tehnicki Glasnik; University North, May 8 2022; Vol. 16, pp. 170–177.
Figure 1.
Workflow of the digital maturity assessment model.
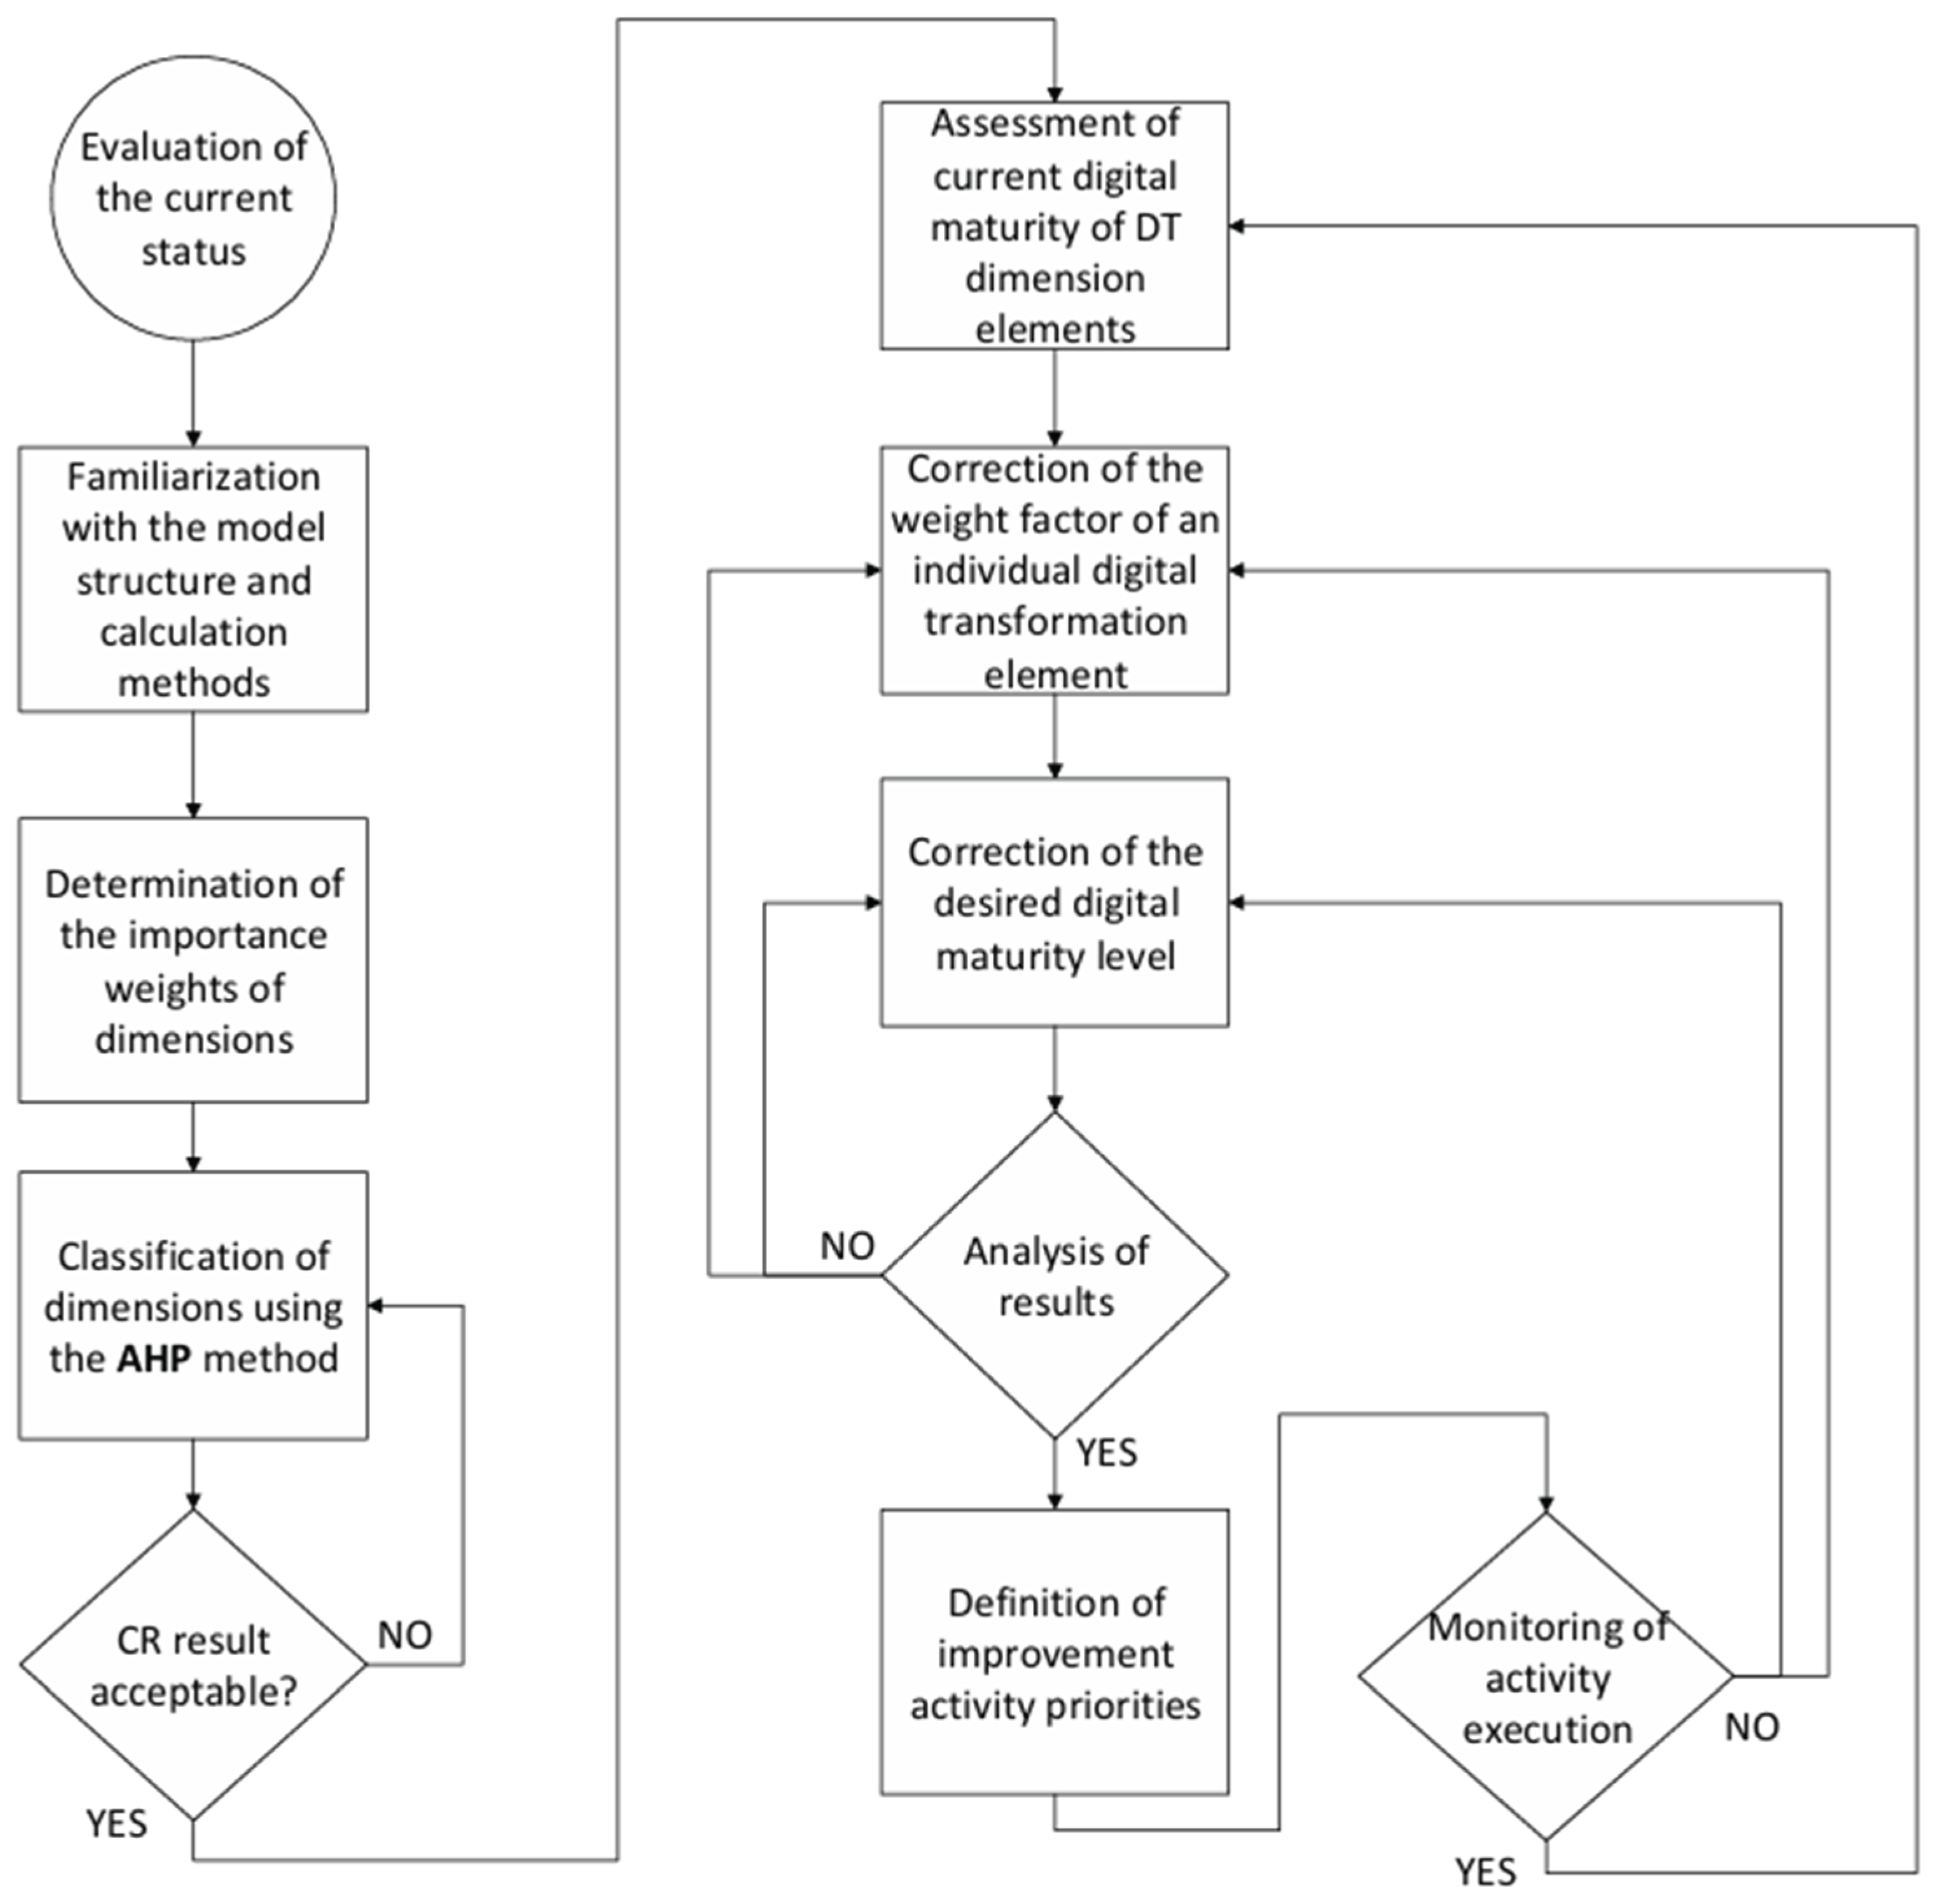
Figure 2.
Example of dimension weighting results.
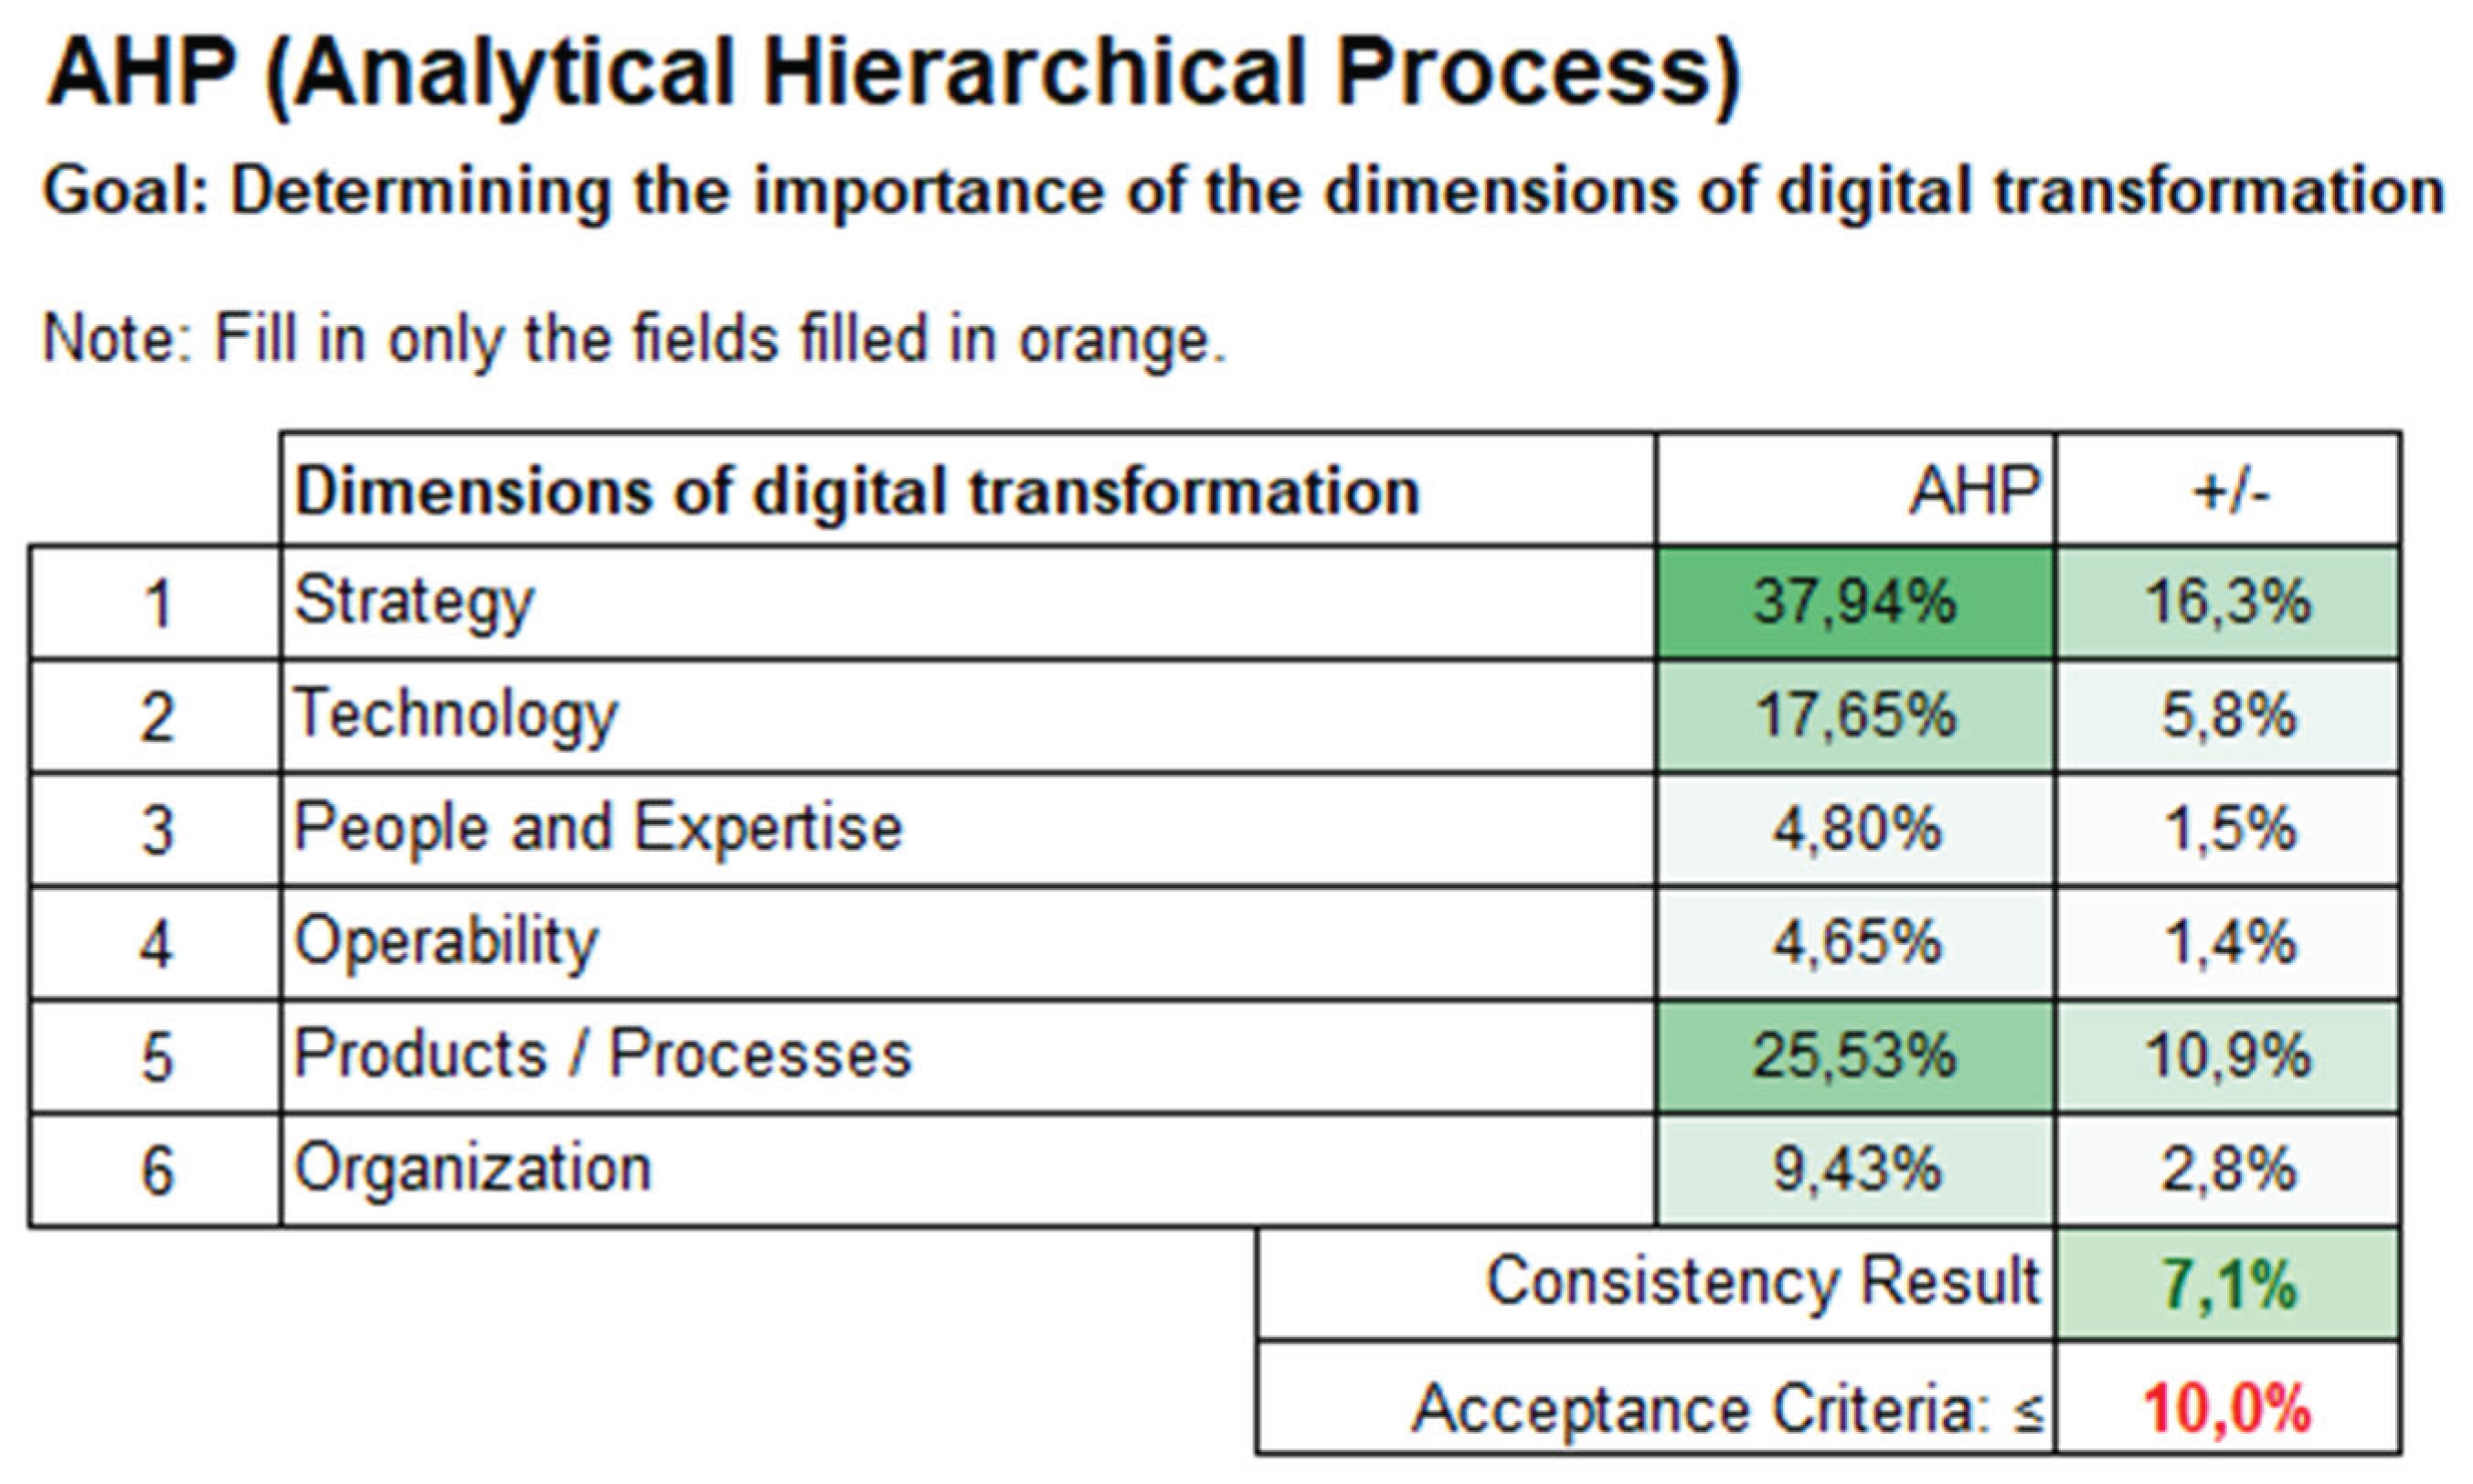
Figure 3.
Results of the digital maturity assessment.
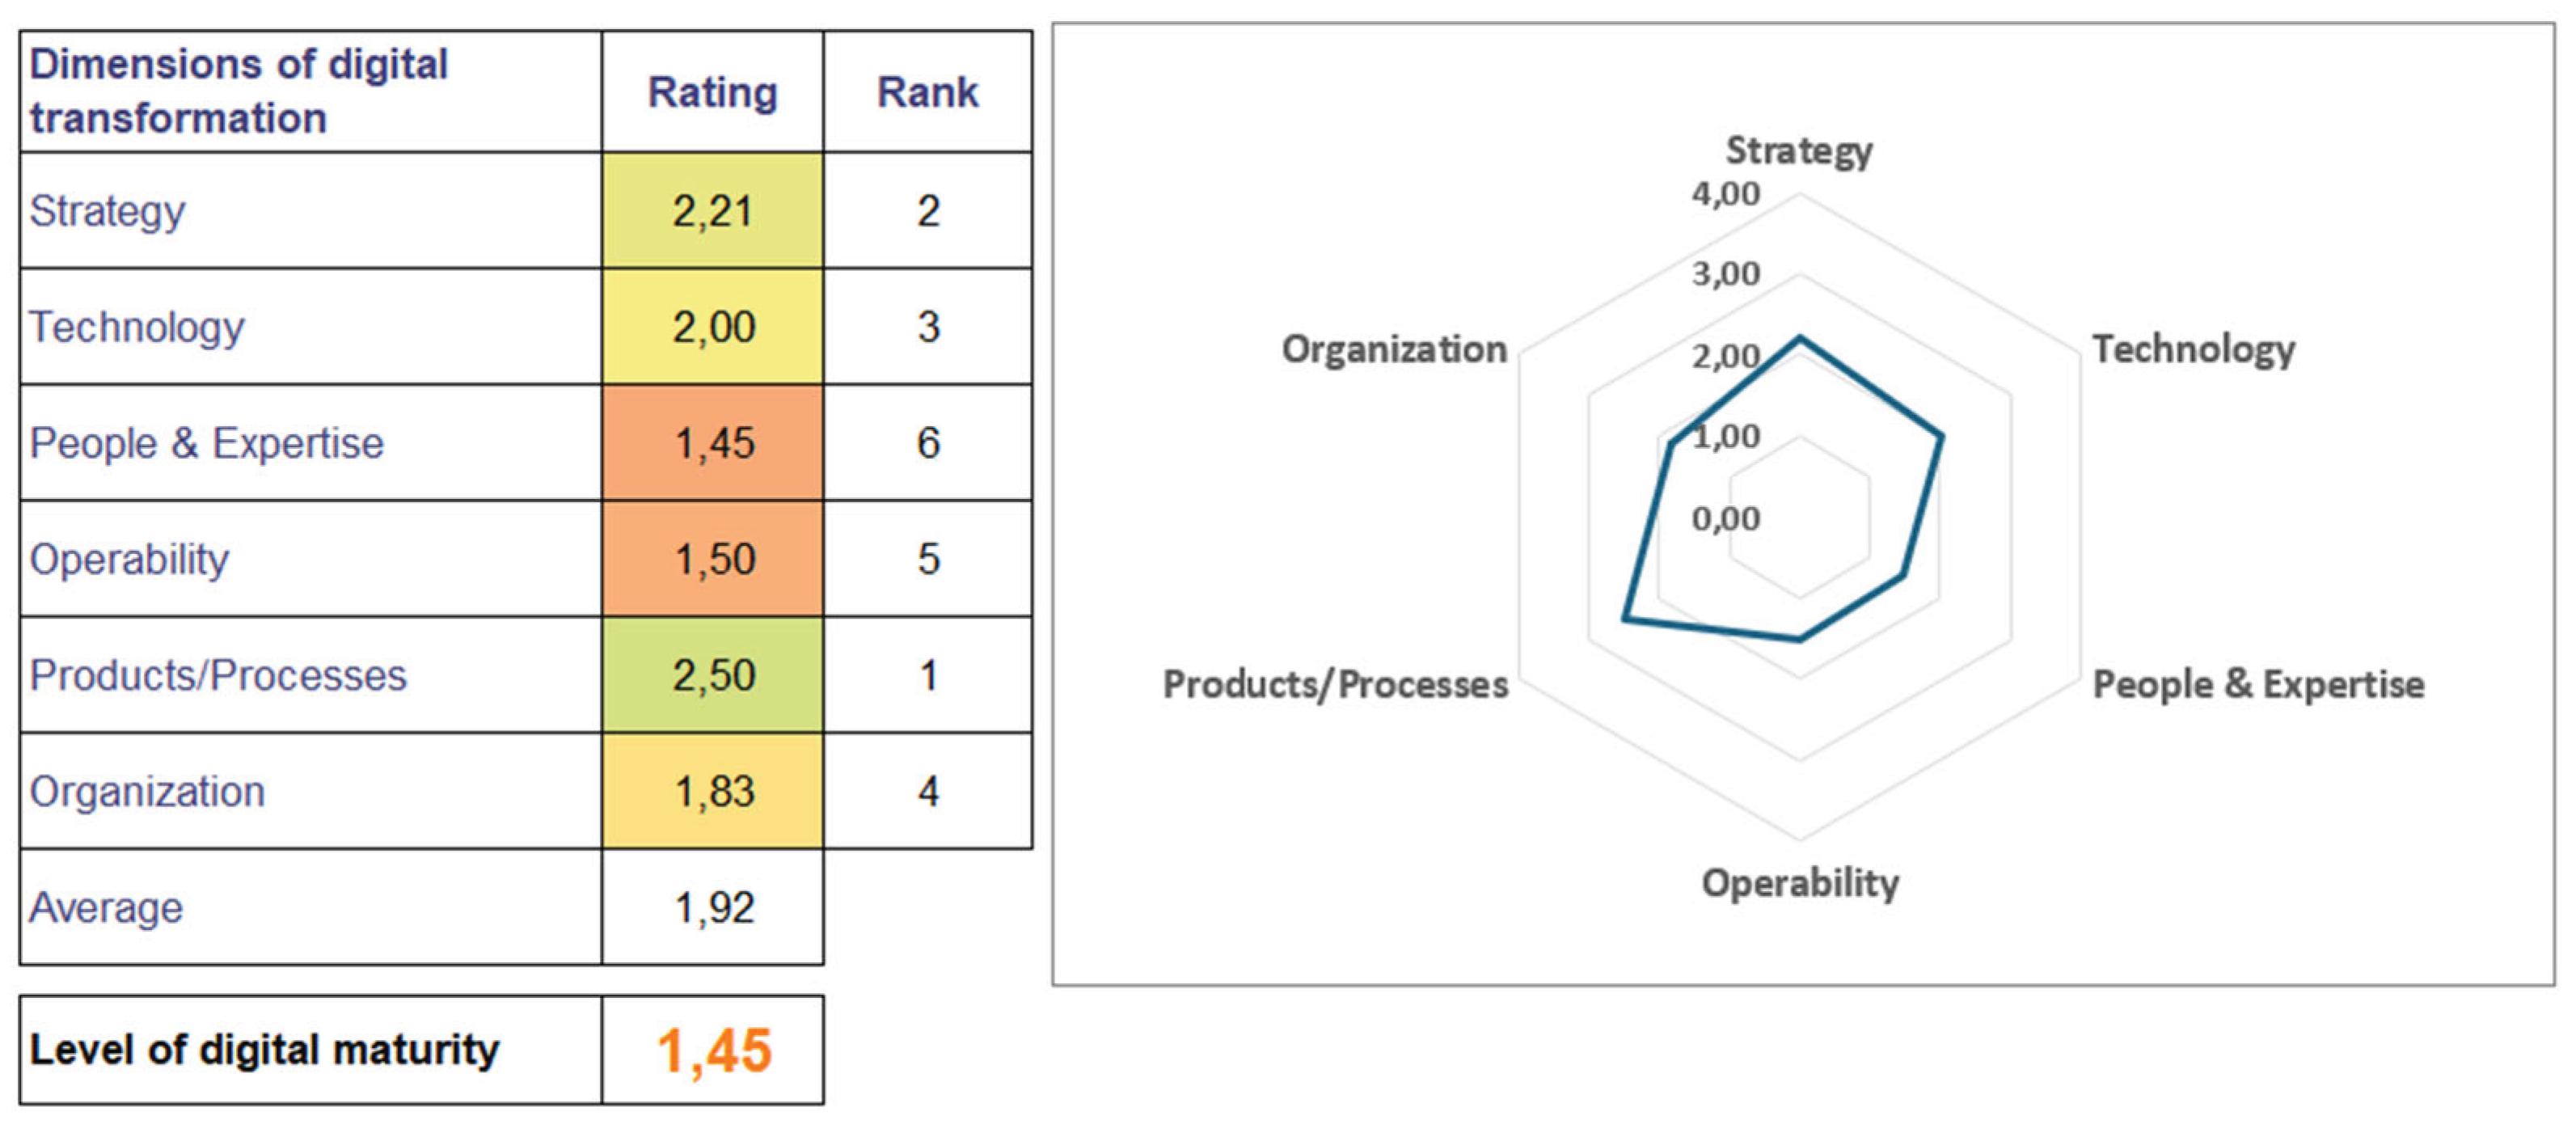
Figure 4.
User interface for the evaluation and prioritization of DT elements (Strategy dimension).
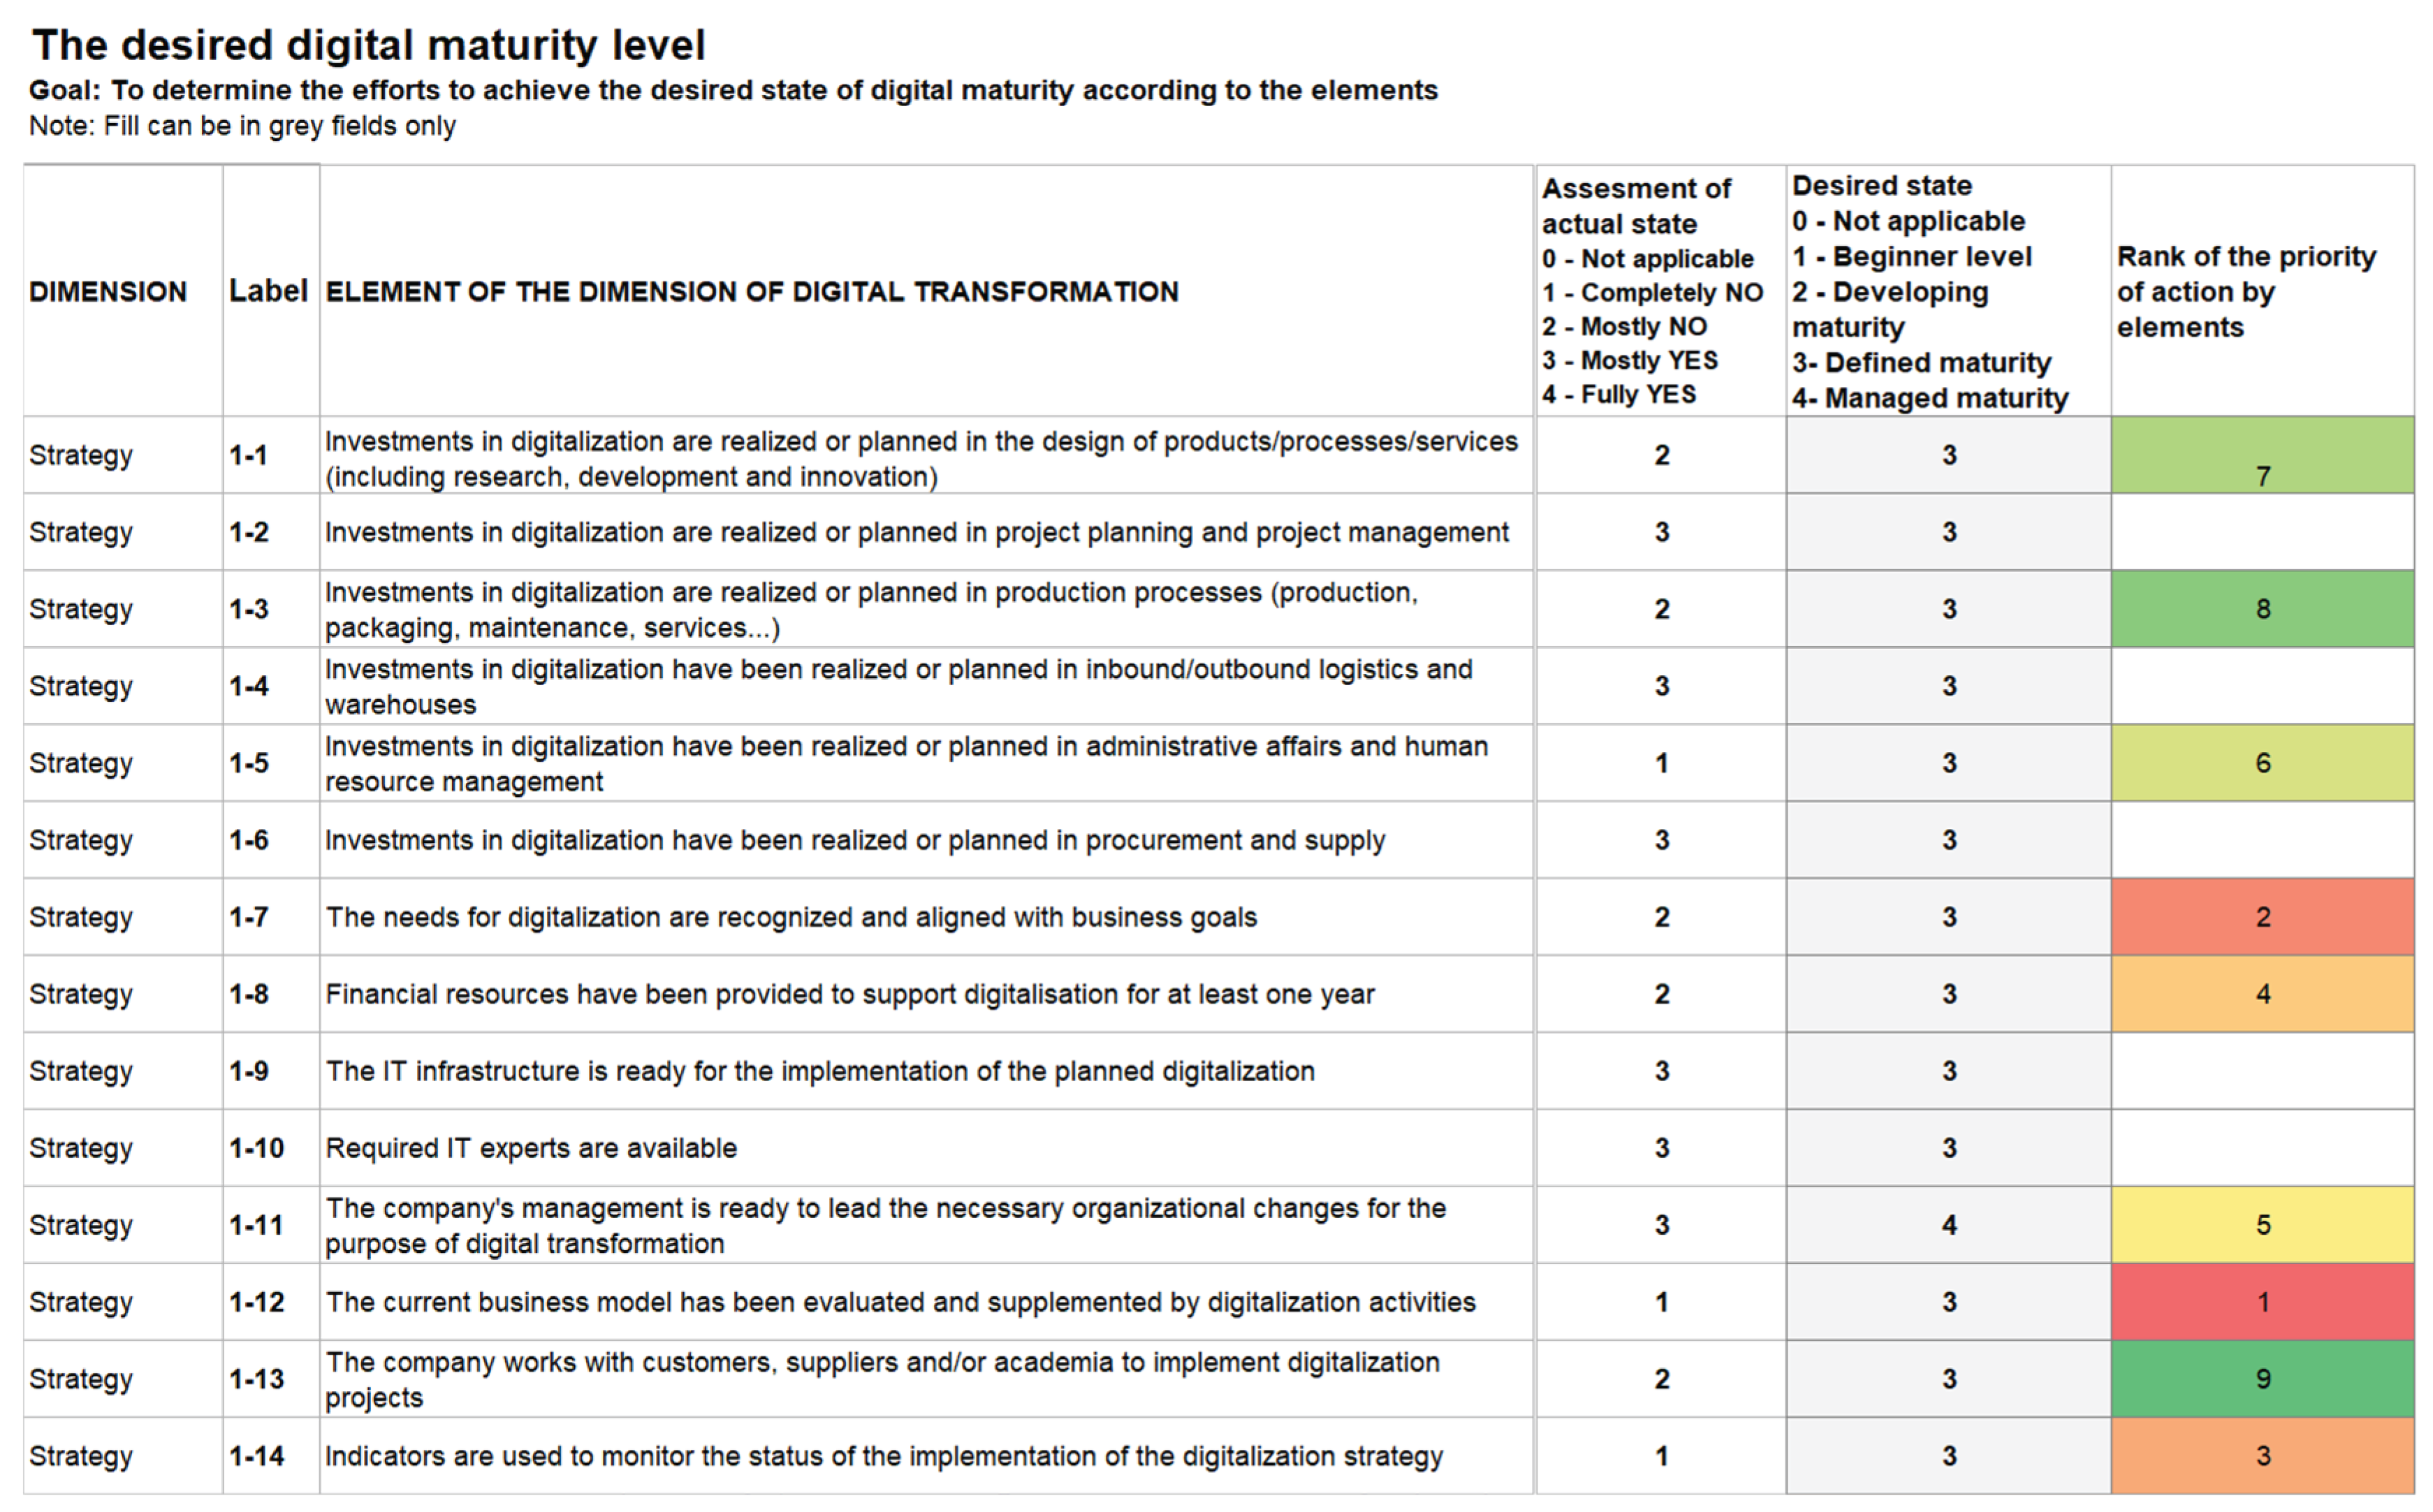
Figure 5.
Sunburst diagram showing the gap between the current and target maturity level by DT element.
Figure 5.
Sunburst diagram showing the gap between the current and target maturity level by DT element.
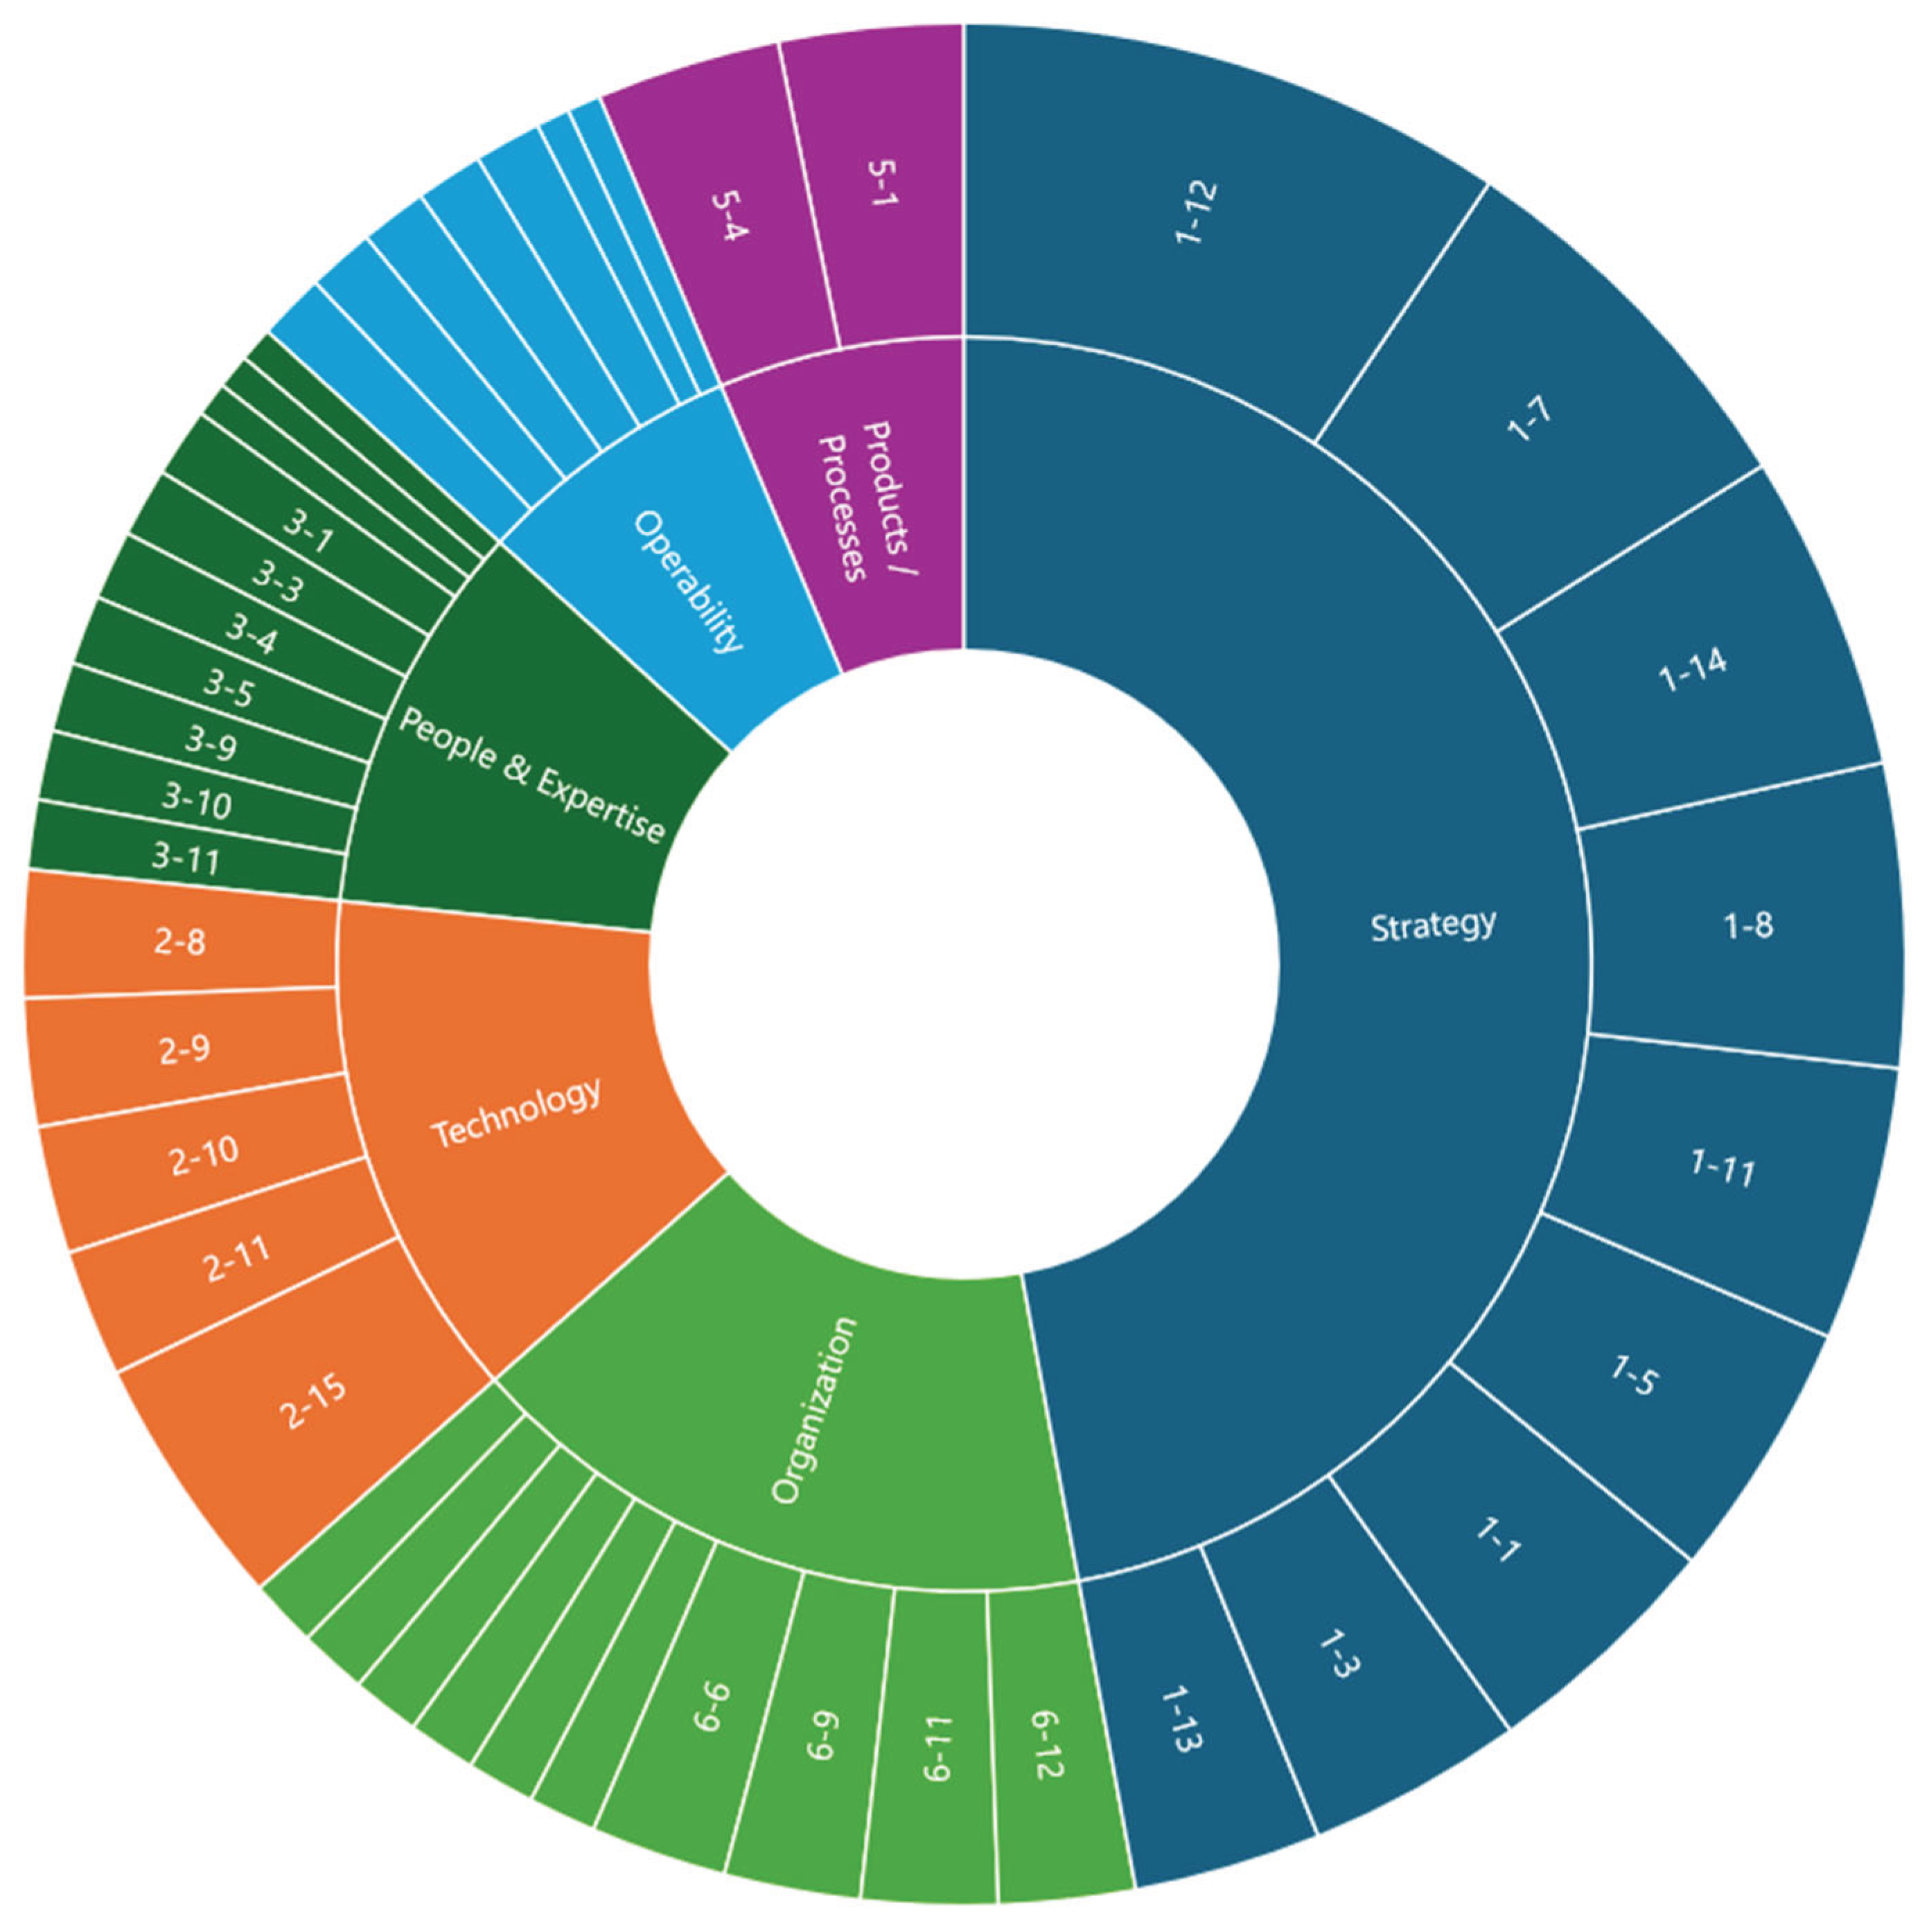
Figure 6.
Radar chart of the maturity levels of the dimensions in the different companies.
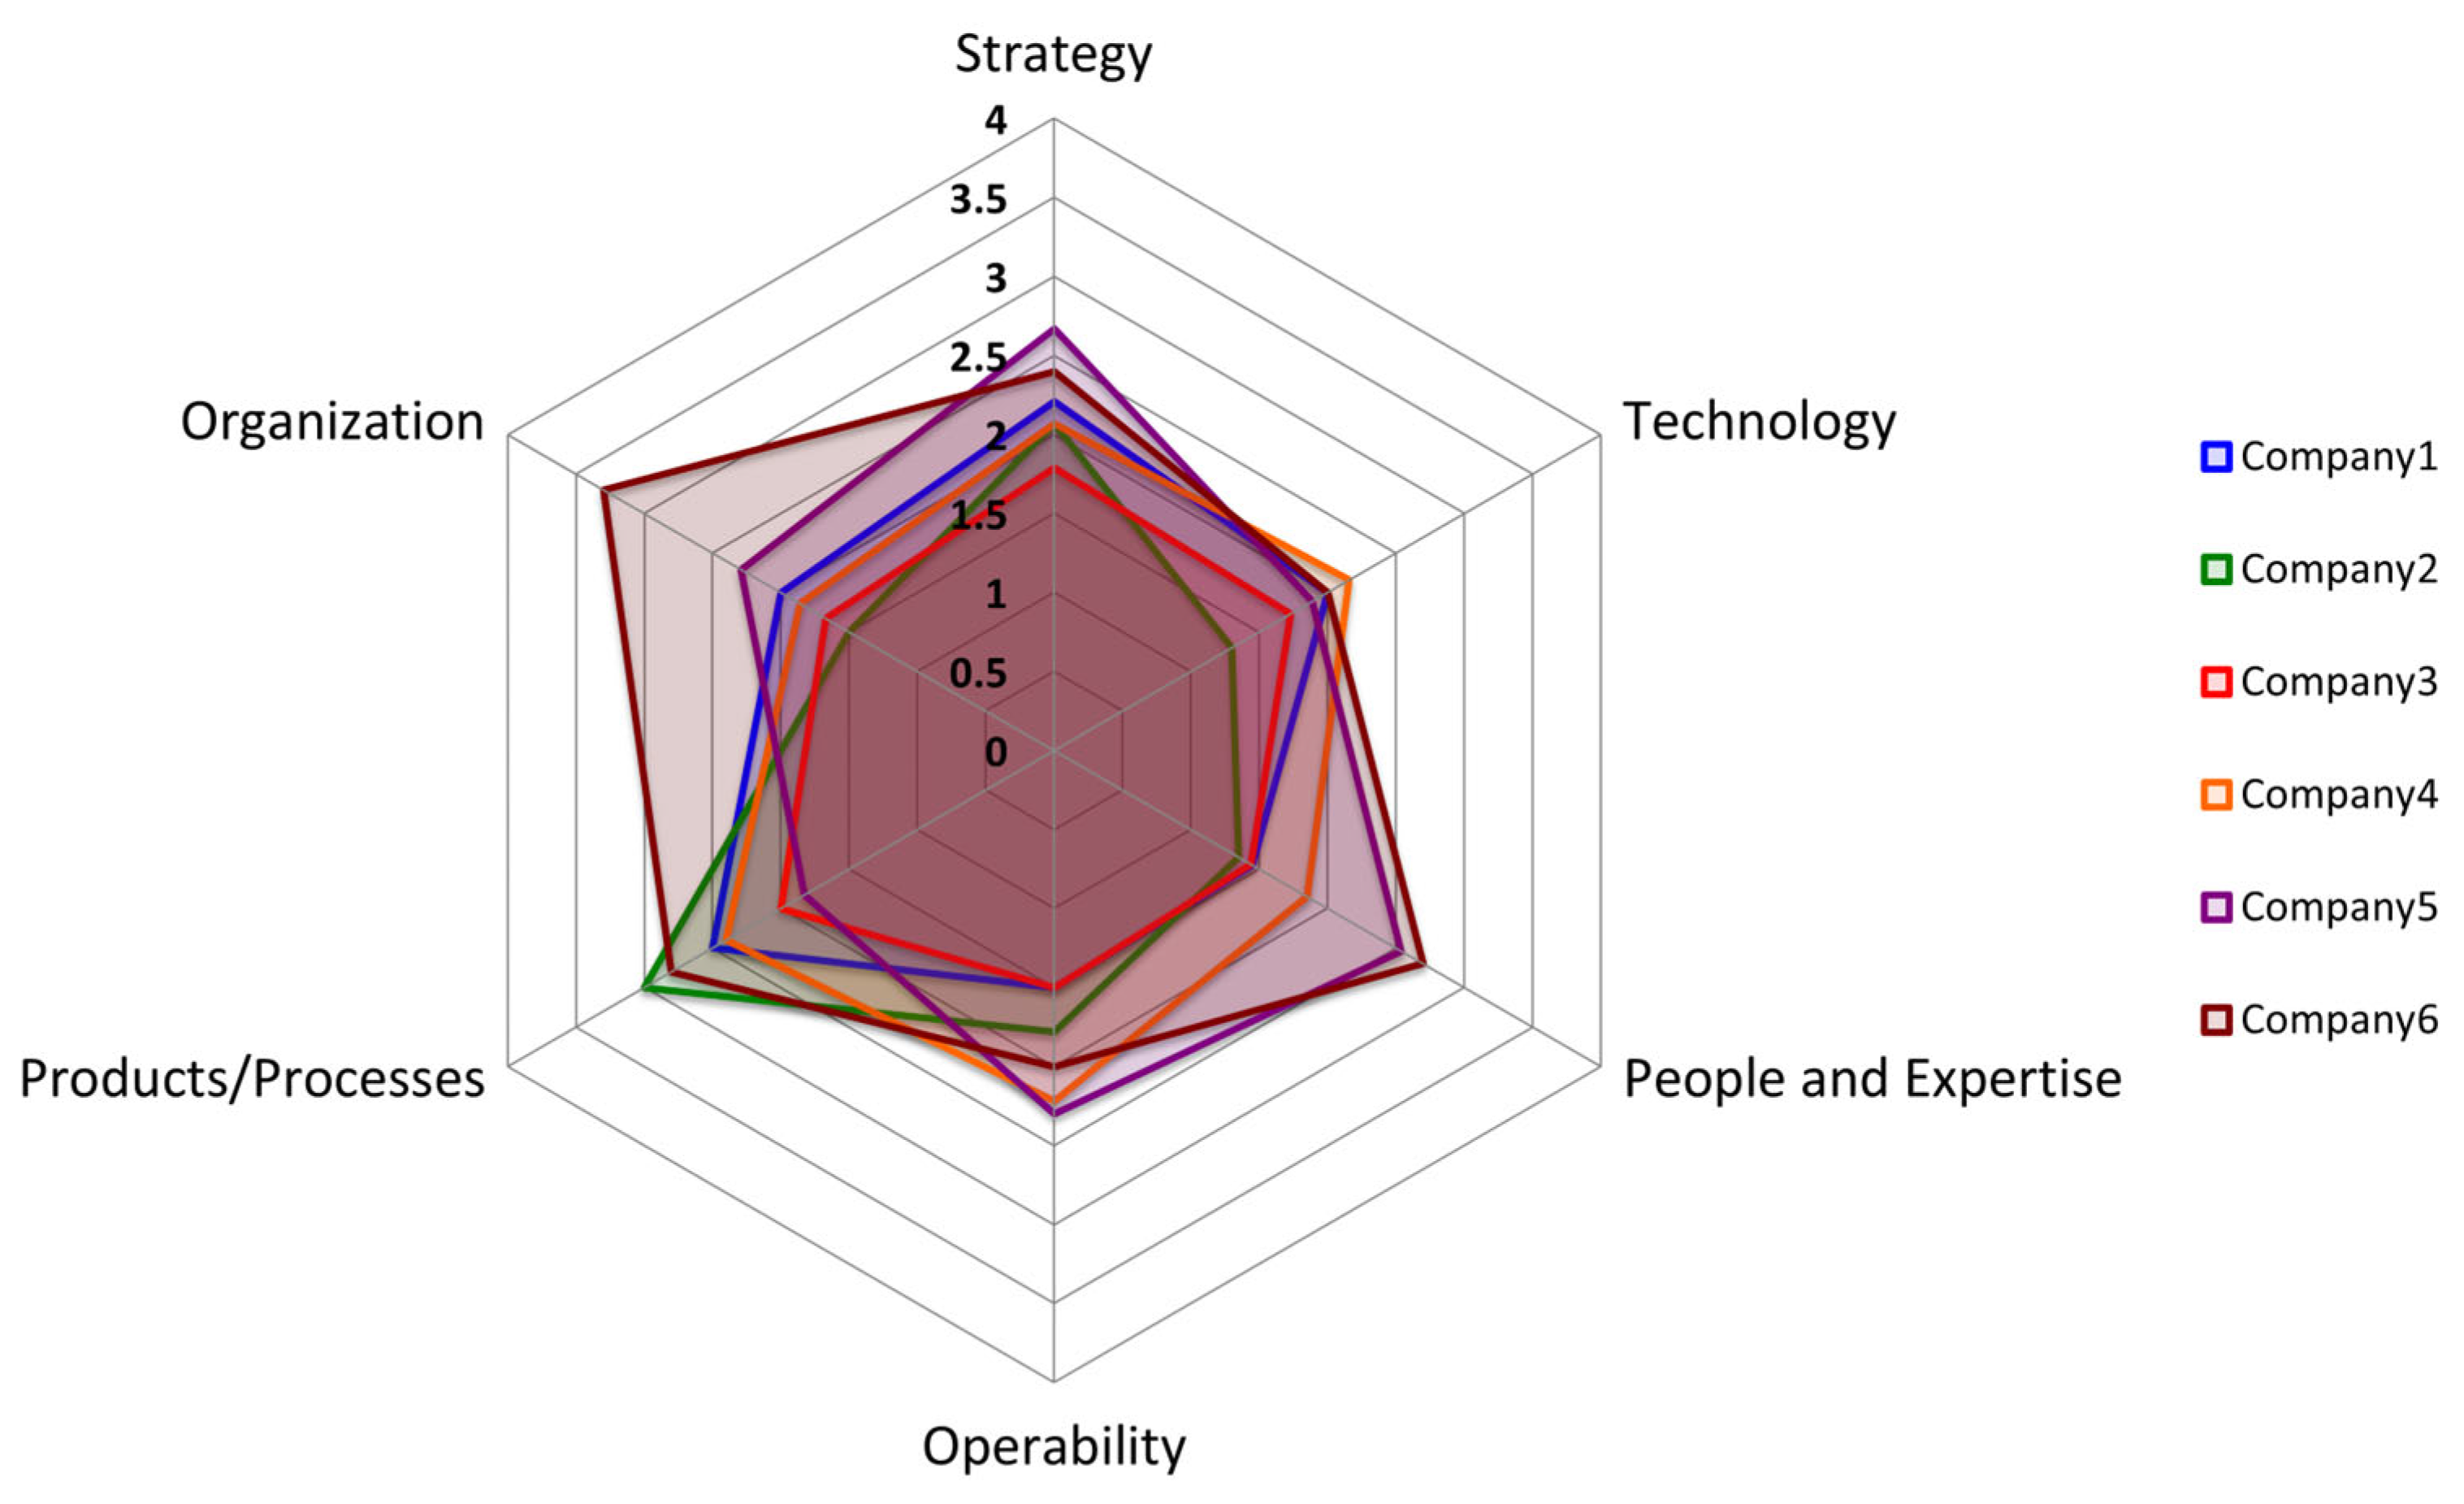
Figure 7.
Distribution of the weighting of the dimensions by companies.
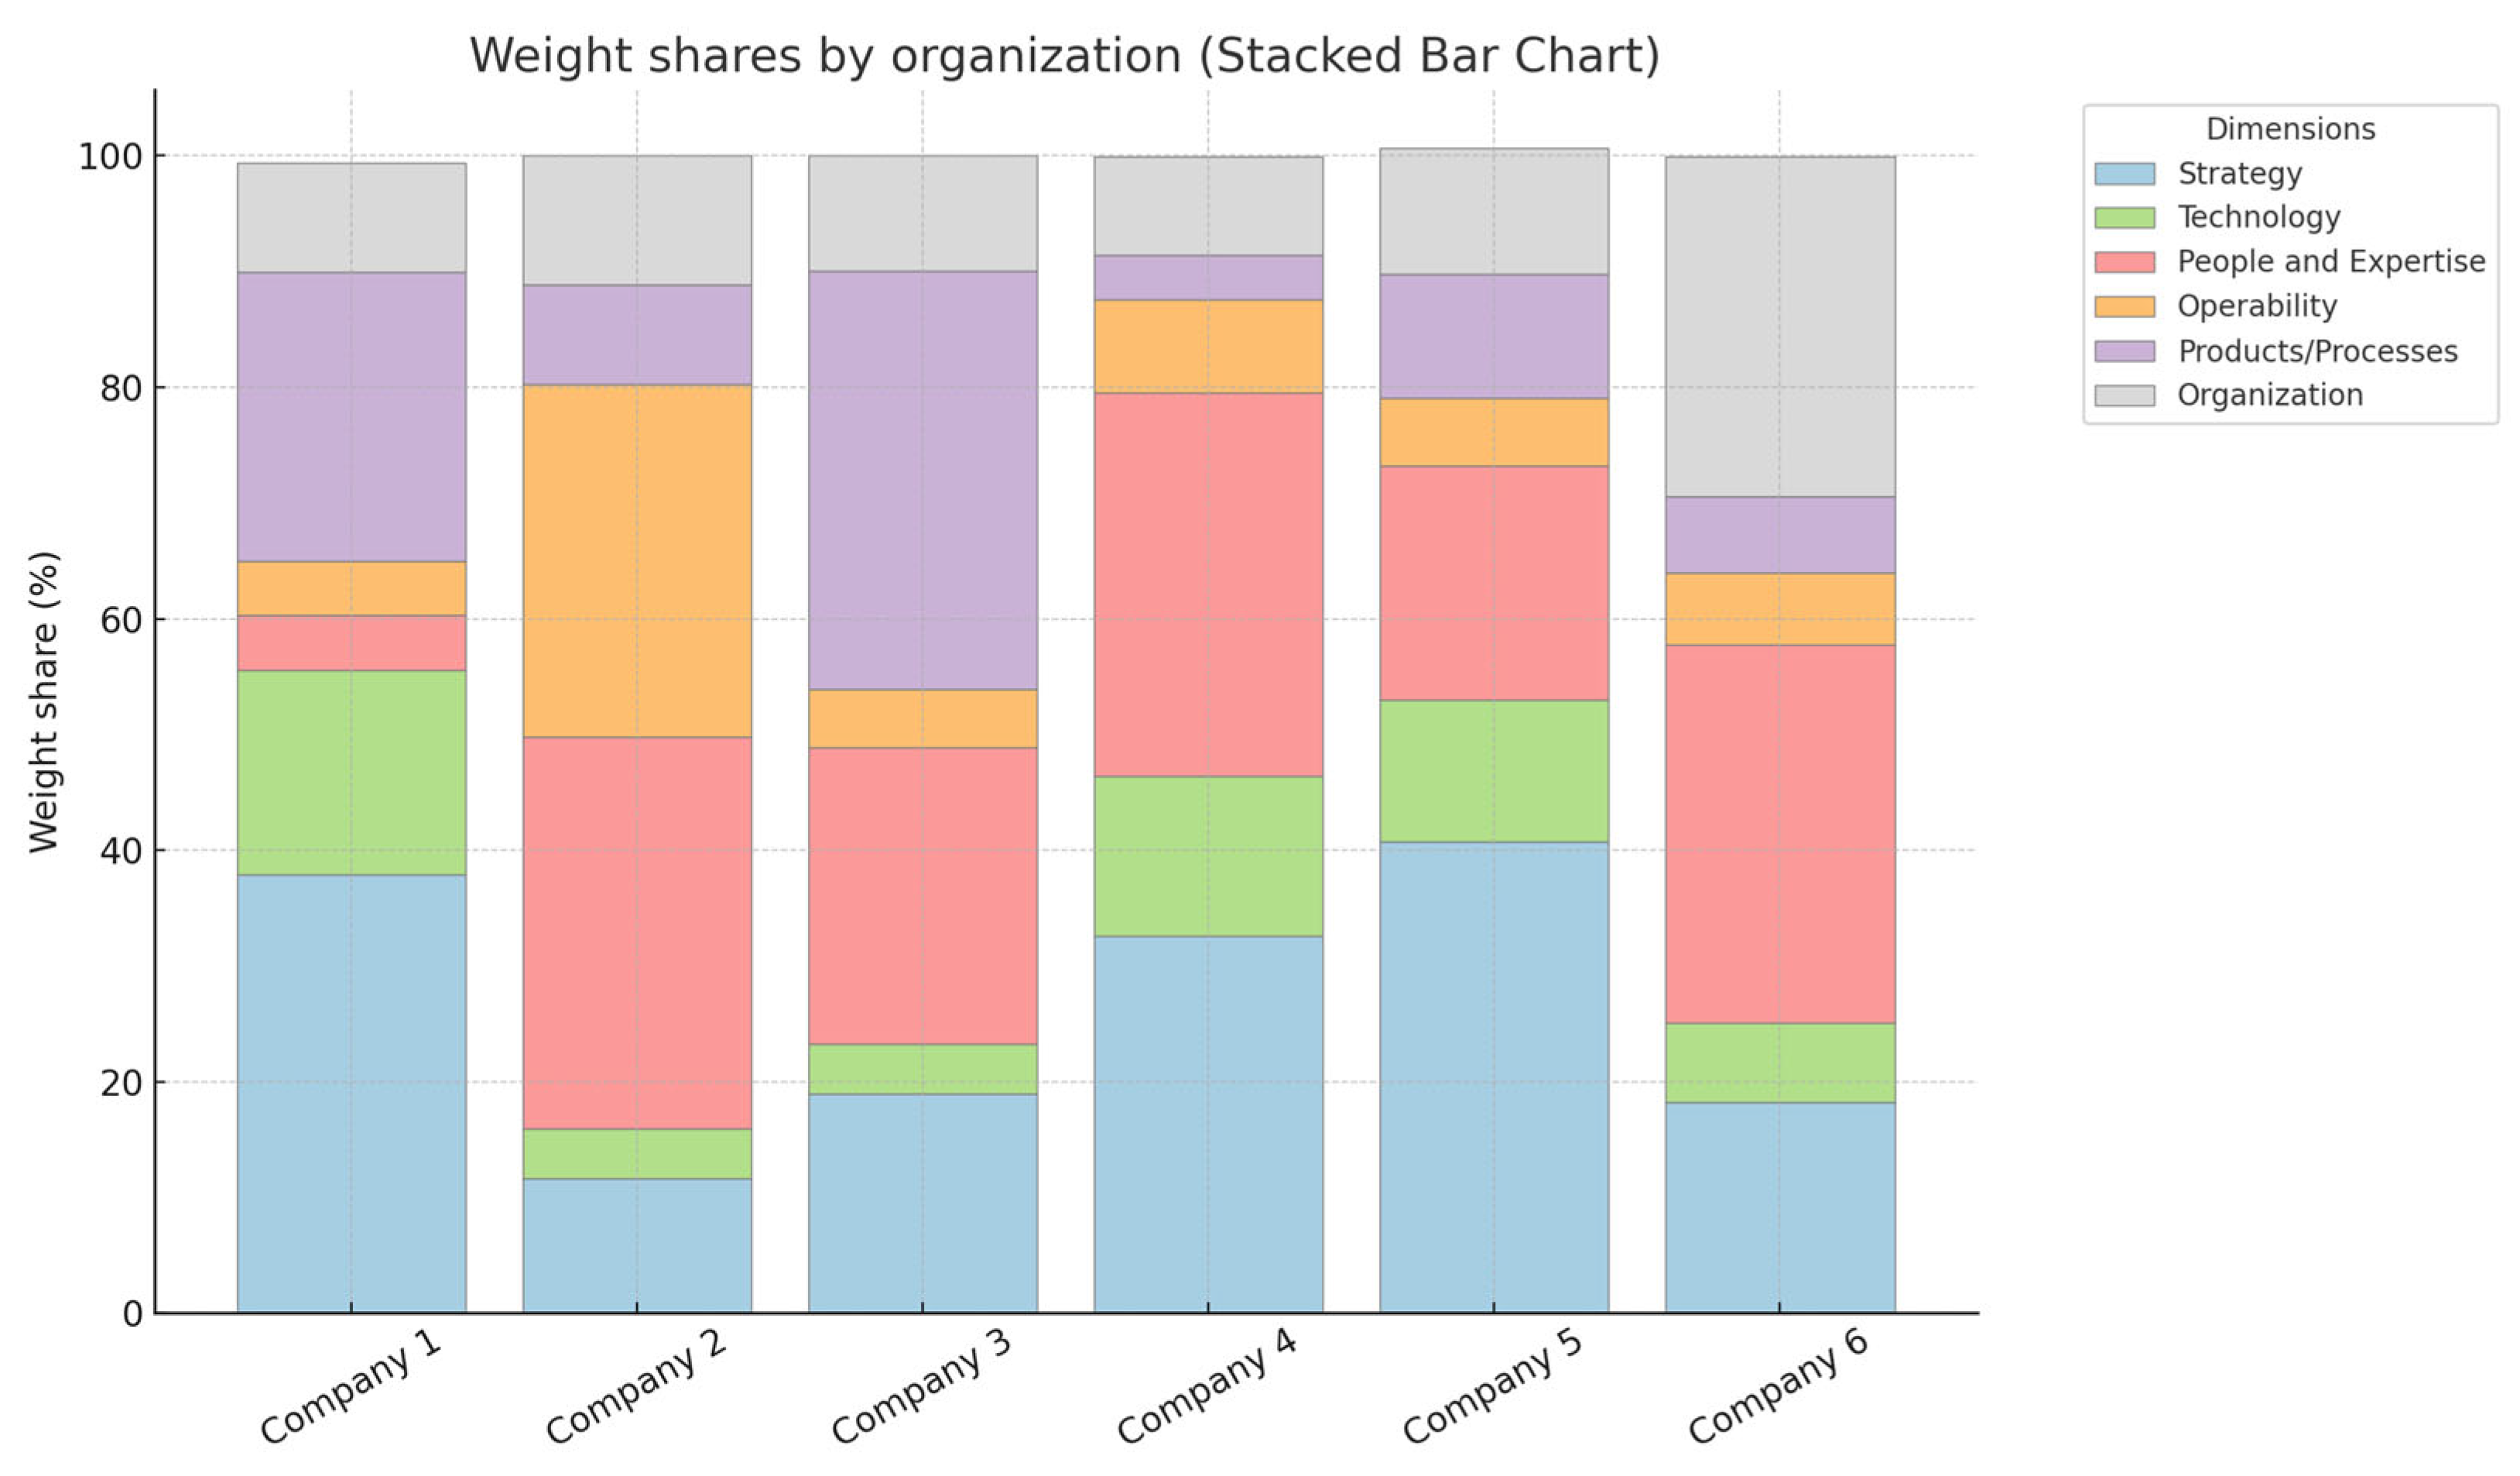
Table 2.
Automatically generated priority list for improvements according to DT elements.
| Ranking of measures by element | Element of the digital transformation dimension | Dimension | Label |
|---|---|---|---|
| 1 | The current business model was evaluated and supplemented by digitalization activities | Strategy | 1-12 |
| 2 | The need for digitalization was determined and aligned with the company's goals | Strategy | 1-7 |
| 3 | Indicators are used to monitor the implementation status of the digitalization strategy | Strategy | 1-14 |
| 4 | Funding has been made available to support digitization for at least one year | Strategy | 1-8 |
| 5 | The company's management is prepared to make the necessary organizational changes for the purpose of digitalization, the management is prepared to make the necessary organizational changes for the purpose of DT | Strategy | 1-11 |
| 6 | Investments in digitalization have been made or are planned in administration and human resources | Strategy | 1-5 |
| 7 | Technologies for big data analysis and decision support systems are used | Technology | 2-15 |
| 8 | Investments in digitalization have been made or are planned in the design of products/processes/services (including research, development and innovation) | Strategy | 1-1 |
| 9 | Investments in digitalization are made or planned in production processes (production, packaging, maintenance, services ...) | Strategy | 1-3 |
| 10 | The company works with customers, suppliers and/or academia to implement digitalization projects | Strategy | 1-13 |
Table 3.
Final digital maturity scores using the DAMA-AHP model.
| Maturity dimensions | C1 | C2 | C3 | C4 | C5 | C6 | Avg | Std | R |
|---|---|---|---|---|---|---|---|---|---|
| Strategy | 2.21 | 2.07 | 1.79 | 2.07 | 2.67 | 2.40 | 2.20 | 0.30 | 0.88 |
| Technology | 2.00 | 1.30 | 1.73 | 2.16 | 1.89 | 2.00 | 1.85 | 0.30 | 0.86 |
| People and Expertise | 1.45 | 1.35 | 1.44 | 1.85 | 2.54 | 2.70 | 1.89 | 0.59 | 1.35 |
| Operability | 1.50 | 1.78 | 1.50 | 2.22 | 2.30 | 2.00 | 1.88 | 0.35 | 0.80 |
| Products / Processes | 2.50 | 3.00 | 2.00 | 2.40 | 1.83 | 2.80 | 2.42 | 0.45 | 1.17 |
| Organization | 2.00 | 1.50 | 1.67 | 1.86 | 2.29 | 3.30 | 2.10 | 0.65 | 1.80 |
| Std | 0.37 | 0.58 | 0.19 | 0.20 | 0.31 | 0.46 | 0.35 | 0.16 | 0.40 |
| Average value | 1.94 | 1.83 | 1.69 | 2.09 | 2.25 | 2.55 | 2.06 | 0.31 | 0.86 |
| Level of digital maturity | 1.45 | 1.30 | 1.44 | 1.85 | 1.83 | 2.00 | 1.65 | 0.28 | 0.70 |
| Cx-companies; Avg-average; Std-standard deviation; R-ratio | |||||||||
Table 4.
Factors for dimension weighting with the DAMA-AHP model.
| Maturity dimensions | C1 | C2 | C3 | C4 | C5 | C6 | Avg | Std | R |
|---|---|---|---|---|---|---|---|---|---|
| Strategy | 37.90 | 11.62 | 18.95 | 32.60 | 40.70 | 18.20 | 26.66 | 11.97 | 29.08 |
| Technology | 17.65 | 4.32 | 4.35 | 13.80 | 12.30 | 6.90 | 9.89 | 5.51 | 13.33 |
| People and Expertise | 4.80 | 33.84 | 25.54 | 33.10 | 20.20 | 32.70 | 25.03 | 11.26 | 29.04 |
| Operability | 4.65 | 30.45 | 5.06 | 8.10 | 5.90 | 6.20 | 10.06 | 10.06 | 25.80 |
| Products / Processes | 25.00 | 8.68 | 36.18 | 3.80 | 10.70 | 6.60 | 15.16 | 12.67 | 32.38 |
| Organization | 9.43 | 11.09 | 9.91 | 8.50 | 10.90 | 29.30 | 13.19 | 7.95 | 20.80 |
| Cx-companies; Avg-average; Std-standard deviation; R-ratio | |||||||||
Disclaimer/Publisher’s Note: The statements, opinions and data contained in all publications are solely those of the individual author(s) and contributor(s) and not of MDPI and/or the editor(s). MDPI and/or the editor(s) disclaim responsibility for any injury to people or property resulting from any ideas, methods, instructions or products referred to in the content. |
© 2025 by the authors. Licensee MDPI, Basel, Switzerland. This article is an open access article distributed under the terms and conditions of the Creative Commons Attribution (CC BY) license (http://creativecommons.org/licenses/by/4.0/).
Copyright: This open access article is published under a Creative Commons CC BY 4.0 license, which permit the free download, distribution, and reuse, provided that the author and preprint are cited in any reuse.


