
Submitted:
27 October 2025
Posted:
29 October 2025
You are already at the latest version
Abstract
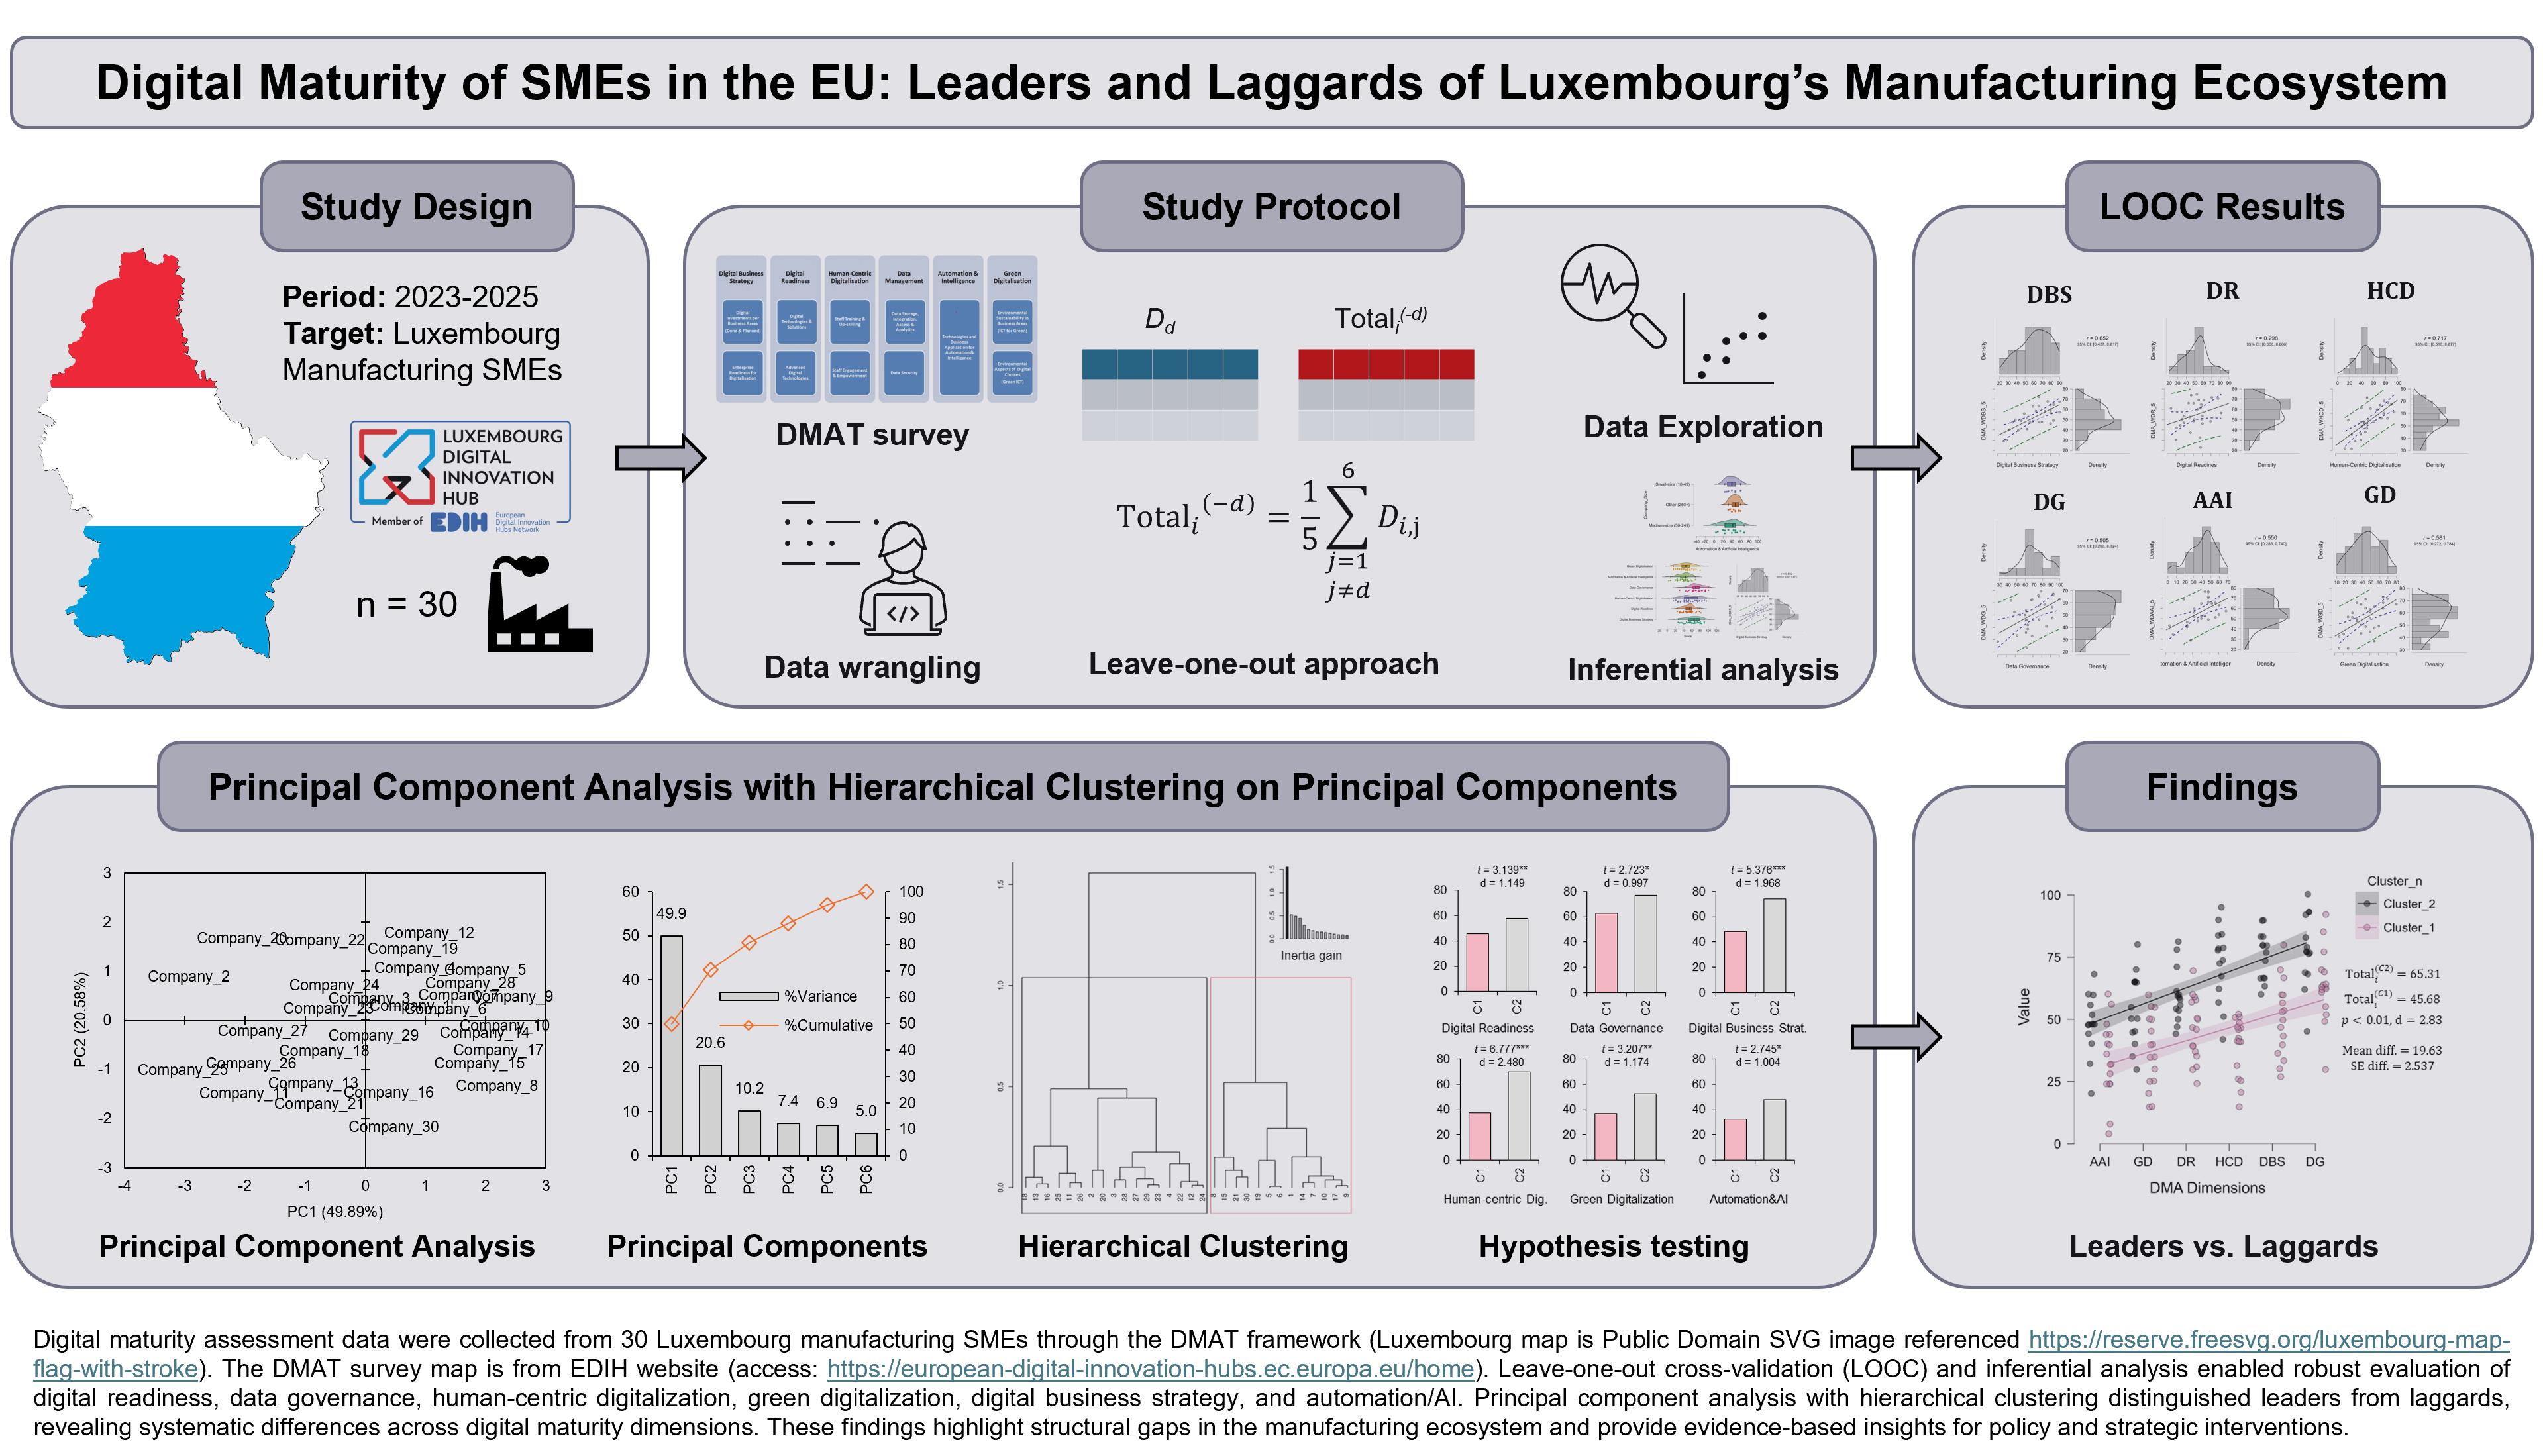
Digital maturity is increasingly recognised as a determinant of competitiveness for small and medium-sized enterprises (SMEs), yet empirical evidence from advanced economies remains limited. Here, we evaluate a sample of Luxembourgish manufac-turing SMEs across six dimensions of the Digital Maturity Assessment Tool (DMAT)—Digital Business Strategy (DBS), Digital Readiness (DR), Human-Centric Digitalisation (HCD), Data Governance/Connectedness (DG), Automation & AI (AAI), and Green Digitalisation (GD)—to quantify their overall maturity. To avoid composi-tional artefacts, given that we rely on the EU’s DMAT, we introduce leave-one-out correlation (LOOC) to assess the association between DMA score and each focal di-mension; within-firm disparities were tested via repeated-measures ANOVA; sample profiles were examined using Principal Component Analysis (PCA) followed by hier-archical clustering (HCPC). Respectively, the results converged across methods: HCD (r = 0.717) and DBS (r = 0.652) exhibited the strongest links to maturity, DG/AAI/GD were moderate contributors (r ≈ 0.50–0.58), and DR was weak (r = 0.298). The ANOVA analysis indicated substantial between-dimension differences (partial η² ≈ 0.41), with DG and DBS leading and AAI and GD lagging. PCA–HCPC revealed two coherent cluster pro-files—Leaders and Laggards—arrayed along a general maturity axis, with the most significant gaps in DBS and HCD. Practically, firms that prioritise DBS and HCD exhibit a higher DMA score, which creates a foundation for industrialising and automatising manufacturing processes. Given the small, single-country, cross-sectional design, lon-gitudinal and adequately powered studies with objective performance outcomes are warranted to validate and generalise these findings.
Keywords:
digital maturity assessment tool
; human-centric digitalisation
; digital business strategy
; manufacturing SMEs
; principal component analysis
; hierarchical clustering
1. Introduction
1.1. Background and Contextual Settings
Digital transformation has become a cornerstone of industrial competitiveness in the era of Industry 4.0 [1,2,3,4,5]. Across Europe, policymakers have set ambitious targets for technology adoption, aiming for 75% of enterprises to use advanced digital technologies by 2030 [6]. Manufacturing small- and medium-sized enterprises (SMEs) are a particular focus [7,8], as their digital uptake is crucial for economic resilience and innovation. As a consequence, the European Commission and Member States have launched numerous initiatives to boost SME digital maturity. The Digital Europe Programme (2021–2027) is investing over €8 billion to strengthen Europe’s digital capacity, infrastructure (e.g., supercomputing, AI, cybersecurity) and enabling the wide use of digital technologies [9,10]. A key element is the establishment of European Digital Innovation Hubs (EDIHs)—a network of 200+ one-stop shops [11,12] that provide SMEs with access to expertise, testbeds, and funding for digital projects [13,14,15,16]. Within this framework, a Digital Maturity Assessment Tool (DMAT) [17,18] has been rolled out to help SMEs assess their digital readiness, raise awareness and benchmark against peers [19].
In digitally advanced countries, significant gaps persist between “leader” and “laggard” firms. This disparity is evident in Luxembourg: the country boasts world-class digital infrastructure, yet it faces persistent challenges in SME digital uptake [20]. This is particularly due to skill shortages, data portability and interoperability [21]. According to the latest Digital Intensity Index data [22] about 57.8% of Luxembourg’s SMEs have attained a basic level of digital intensity—on par with the EU average (57.7%). The moderate performance suggests that Luxembourg has yet to translate its potential into broad uptake by SMEs fully. Indeed, Luxembourg currently trails the EU’s frontrunners, for instance, around 90-93% of SMEs in Denmark and Finland have a basic level of digital intensity, while some lagging countries stand around 50% [23]. Recognising the gap, the European Commission cautions that at the current pace, neither Luxembourg nor the EU overall will reach the ambitious goal of 90% SME digital adoption by 2030 [22]. Apart from launching its own national initiatives and strategies [21,24,25,26], a central conduit to implement these strategies in the industrial sector is the Luxembourg Digital Innovation Hub (L-DIH).
Against this backdrop, systematic evidence on the digital maturity of Luxembourgish SMEs remains scarce. While policy instruments such as the DMAT are widely promoted across the EU, most existing analyses are either cross-country comparisons or conceptual discussions, leaving a gap in sector-specific and empirically grounded assessments. This absence is problematic given Luxembourg’s dual ambition: to close the adoption gap between frontrunners and laggards, and to harness digitalisation as a lever for sustainability within the twin transition. A timely, targeted study is therefore needed to quantify SMEs’ maturity profiles, identify the organisational levers that most strongly drive advancement, and generate actionable insights for both national and European initiatives. By providing empirical evidence at the manufacturing SME level, this study aims to inform the policy agenda and support the practical mission of L-DIH as Luxembourg’s conduit for accelerating digital transformation.
1.2. Literature Review
The concept of digital maturity has become a recurrent theme in European policy and research discourse, especially in relation to the competitiveness and resilience of SMEs. Despite this, the literature and empirical evidence remain fragmented and often misaligned with the needs of policymakers and practitioners. Our rationale stems from an exhaustive systematic review of existing literature using search strings (“european digital innovation hub”) in the first run, and in the second run (“digital maturity assessment” AND SMEs), as we are primarily interested in identifying studies resulting from the DIH network. From the eligibility criteria (manufacturing SMEs and practical (empirical) studies), we identified only two closely related studies in the initial run and 18 additional studies from the second run and snowballing search. Based on the results, three main limitations were identified: (i) methodological drift, (ii) lack of empirical studies, and (iii) the scope of SMEs.
The methodological drift characterises much of the existing work. Numerous studies invoke digital maturity yet operationalise it through highly diverse and alternative frameworks, producing incompatible results. For instance, Sobczak [27] assess the digital maturity of SMEs across countries by using EU indicators. Tanhua et al. [28] proposes a digital maturity scan leveraging open-ended questions, while Kljajic-Borstnar et al. [29] test the multi-attribute model approach in Slovenia. Similarly, Volf et al. [30] propose the SBRI (Small Business Digital Maturity Assessment and Road to Industry 4.0) methodology to assess the digital maturity of Czech manufacturing SMEs. Others turn towards reinventing existing concepts, or offer customised non-validated solutions of digital maturity [31,32,33]. Although extensive DMA tools are proposed, they either overlap or fragment the landscape, preventing compatibility. Such models often highlight the problem that the EU sought to solve with DMAT: proliferation of bespoke tools lacking interoperability.
Secondly, there are more conceptual rather than empirical studies. A considerable share of the literature remains review-based, descriptive, or conceptual [34,35]. While these works clarify frameworks and ecosystems, they do not provide empirical assessments of SME maturity in practice. Such studies add little evidence on the actual state of manufacturing SMEs. Considering loosely related studies, some address digital transformation broadly but without performing maturity assessments. For instance, Crupi et al. [36] investigate the DIH’s role as knowledge brokers; Kääriäinen et al. [37] examine how “digital evangelists” support SMEs’ positioning, while Rahamaddulla et al. [32] investigate the value of digital transformation initiatives. Evidently, there is a lack of empirical studies to ensure validity [27,38]. While valuable, these perspectives remain adjacent rather than direct assessments of digital maturity, and some even lean towards AI capability assessments [39].
Lastly, there is a misalignment with the manufacturing scope. Many empirical studies extend to public institutions [40], service firms [41], or generic “businesses” [42], as in the DMAT adaptation [18], or Sobczak [27] EU-level employment analyses. Such inclusions dilute the manufacturing focus and overlook the sector-specific challenges of production-oriented SMEs [43]. Even where DMAT itself is mentioned, it is often positioned instrumentally rather than as the object of the study. For instance, Mazgajczyk et al. [44] illustrate how DMAT results feed into EDIH service mapping, and Lorencin et al. [45] report “Test Before Invest” case studies in Croatia. These studies underscore DMAT’s institutional role but do not interrogate its empirical outcomes for manufacturing SMEs themselves.
The clearest point of reference is Krcelic et al. [40], who applied EU DMAT within private and public organisations in Croatia. Yet even here, the sample spans multiple organisation types, diluting insights specific to manufacturing SMEs. This underlines the core gap: there is still no focused empirical body of evidence applying DMAT systematically to manufacturing SMEs. Given that only two related studies were identified from the systematic review, a backward and forward snowballing search was performed to locate additional DMA studies. Identified studies are reported in Table 1.
Furthermore, it should be noted that the primary focus is exclusively on DMA models as they offer a comprehensive, strategy-driven and SME-relevant assessment of digital readiness, whereas Industry 4.0 models (e.g., Acatech I4.0 Model [56]), while important, they are primarily technology-centric, process-specific and less aligned with the broader organisational challenges SMEs face in digital transformation. Also, some DMA tools, like PwC DMA, provide reports for the Oil and Gas sector [57], instead of manufacturing, while others only have one case study, as Deloitte-TM Forum DMA [58]. Thus, as we primarily focus on empirical studies demonstrating the applicability of DMA in SMEs, a more exhaustive and comparative analysis of specific DMA tools is described elsewhere [59,60,61].
Taken altogether, the literature paints a paradoxical picture. On the one hand, there is a proliferation of models, frameworks and ecosystem analyses surrounding SME digitalisation; on the other hand, there is a myriad of incomparable DMA-based assessments of manufacturing SMEs. This inconsistency creates three gaps: (i) empirical scarcity (very few studies directly apply EU DMAT in manufacturing context, and even fewer offer sector-specific analysis), (ii) fragmentation (alternative models proliferate without alignment, undermining comparability), and (iii) ecosystem bias (much of the literature examines DIHs, AI adoption, or transformation enablers, but falls short of measuring SMEs baseline maturity with validated instruments). The present study addresses these shortcomings by applying the official EU DMAT survey systematically within Luxembourg’s manufacturing ecosystem. By doing so, it contributes evidence where the literature is weakest: sector-specific, comparable, and policy-relevant assessments of SME digital maturity.
1.3. Questions, Aims and Objectives
Building on contextual challenges and identified literature gaps, this study formulates a set of research questions and objectives. Namely, we set the core research question as:
RQ1: What is the current state of digital maturity among Luxembourgish manufacturing SMEs, and how do its dimensions interrelate in shaping overall maturity?
The overarching question is further broken down into the following sub-questions and rationale:
SQ1: Which dimensions represent the strongest predictors of overall digital maturity?
Strategy and human-centric capabilities often function as “meta-capabilities” that shape prioritisation, change readiness, and absorptive capacity. In contrast, technical and sustainability pillars typically realise their value once these foundations are in place [62]. To avoid compositional inflation when relating a dimension to the overall DMA score, we introduce leave-one-out correlation (LOOC) analysis to reduce bias in assessing predictors of DMA by excluding the focal dimension.
SQ2: Do firm characteristics such as sector, size, or age moderate digital maturity levels?
Prior studies often highlight that firm characteristics, such as firms’ age and size, tend to exhibit greater flexibility and likelihood of adopting digital technologies. These firms are more compatible with emerging innovations [63], since they were established in a digitally intensive environment, so-called “born digital” [64] companies, while older firms tend to be persistently non-digital [65]. Also, younger managers are more likely to advocate for digital adoption [66], with top management support being crucial in the transformation [67]. Lastly, larger firms have higher rates of digital adoption than smaller firms [65]. In a small, advanced economy, scale and longevity may be proxies for capability; conversely, legacy systems could burden data practices in older firms. Hence, we consider that characteristics, such as age and size, may skew our findings [68].
SQ3: Do specific digital maturity dimensions systematically lag or lead compared to others?
Within firms, capabilities are unlikely to develop uniformly. We expect DG and DBS to lead (reflecting data foundations and strategic alignment), while AAI to lag (given the weak adoption of advanced technologies) due to complexity, lack of staff and resource constraints that often hold back smaller firms [65]. To test these patterns, we treat the six DMAT dimensions as repeated measures within the sample, allowing us to compare whether specific dimensions advanced more than others or remained underdeveloped.
SQ4: Are there natural clusters of SMEs based on their maturity profiles?
Digital transformation pathways are rarely uniform, and SMEs often exhibit different strengths and weaknesses across maturity dimensions. From the systematic review, some suggest that firms advance strategically while lagging operationally, whereas others selectively prioritise automation, data, or human-centric practices. Although the DMAT report translates the DMA score into linear maturity levels (e.g., basic, average, moderately advanced, advanced), SMEs are rarely distributed by a purely linear scoring system. To capture these nuances, we adopt an unsupervised clustering approach to explore natural clusters of SMEs. This allowed us to move beyond predefined score brackets and identify empirically grounded clusters of SMEs.
From these questions, the main aim of the study is to generate robust, sector-specific, and policy-relevant evidence on the digital maturity of Luxembourgish SMEs using the official EU DMAT framework. Hence, in support of the aim of the study, we set the following objectives: (1) conduct DMAT-based survey analysis of Luxembourgish manufacturing SMEs, producing dimension-level and overall maturity profiles; (2) conduct rigor hypothesis testing to identify structural patterns and provide robust evidence of inferential findings; (3) interpret the results in light of EU and national digitalisation agendas regarding existing state of manufacturing SMEs in Luxembourg.
The rest of the manuscript is structured as follows. Section 2 outlines the methodology, including the study protocol, survey instrument, scoring system, and analytical strategy for performing statistical and multivariate data analysis. Section 3 presents and discusses strictly statistical results, covering descriptives, dimension-level predictors, moderator effect analysis, within-firm disparities, and identified clusters. Section 4 discusses the findings in light of existing literature, highlighting the importance of strategic and human-centric enablers, dimension-specific imbalances, and the clustering of SMEs into distinct maturity profiles. Lastly, we conclude the study by highlighting key implications for policy and practice, acknowledging the study’s limitations, and outlining future research directions.
2. Methodology
2.1. Study Protocol
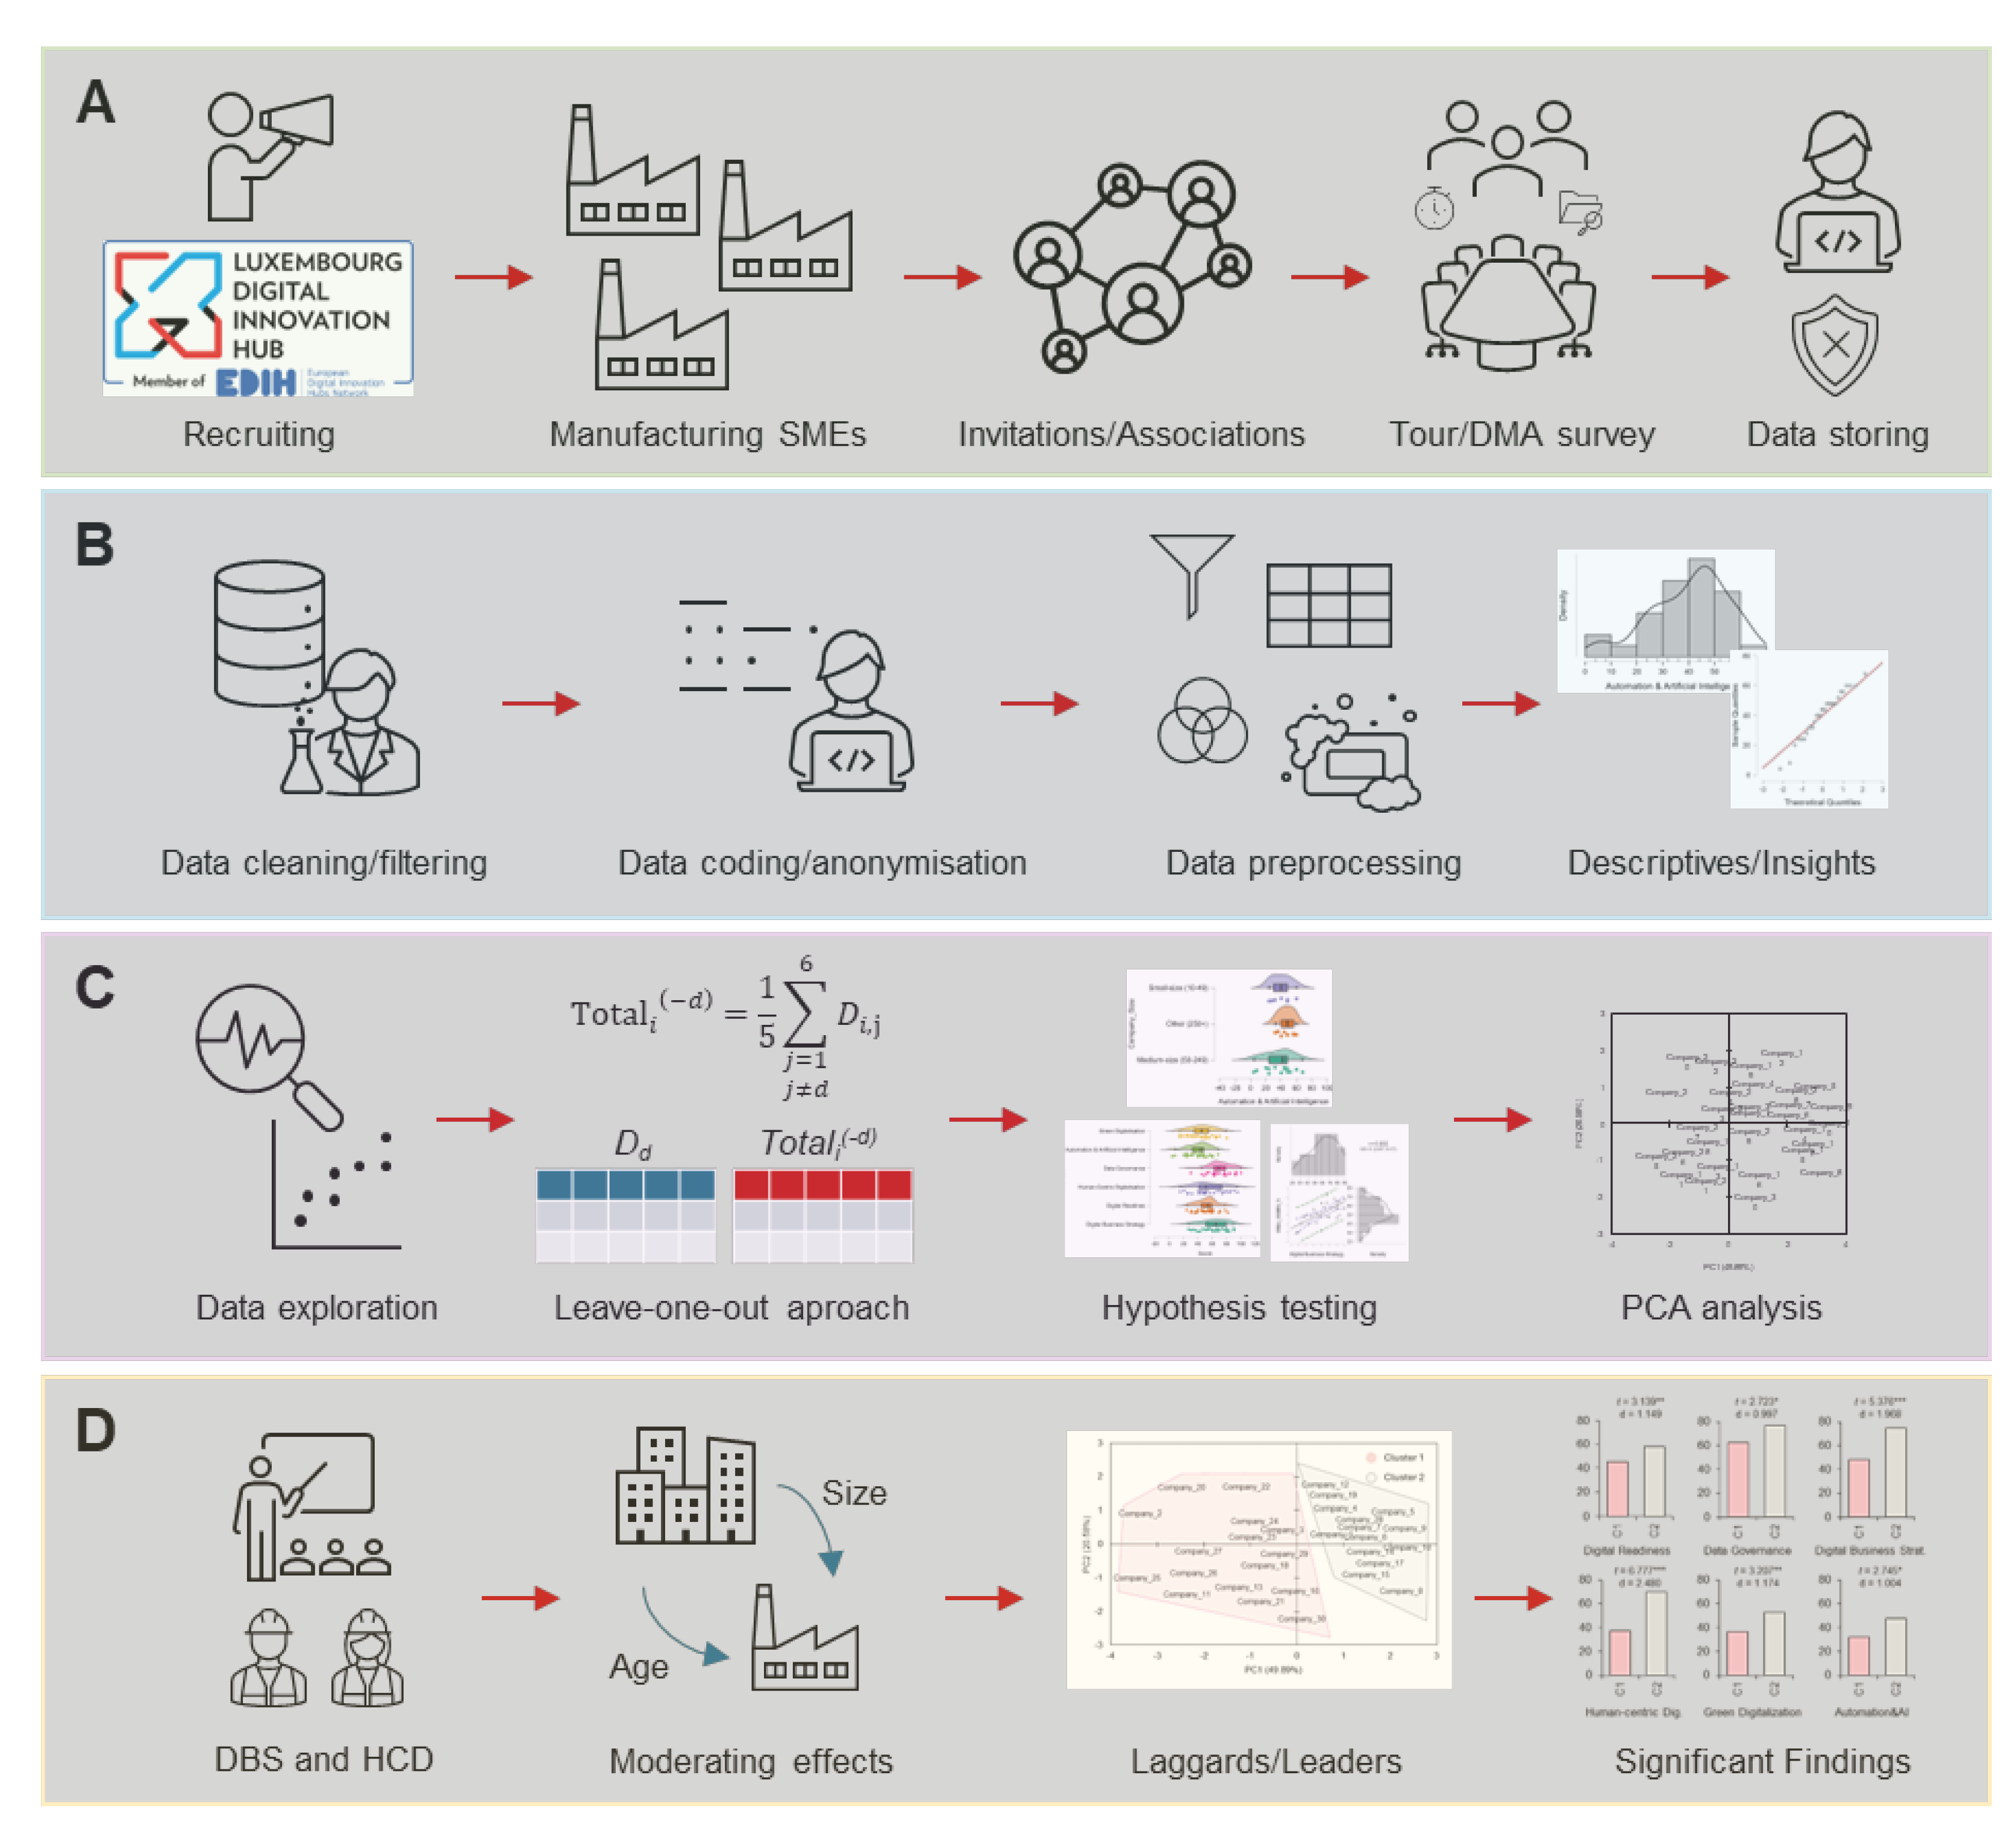
The study implements a four-module research protocol. Module A operationalises the DMAT through firm-level data collection. This stage encompasses SME recruitment, association invitations, on-site tours, and structured survey administration, followed by secure data storage. Module B addresses data integrity and preparation, comprising cleaning, coding and anonymisation, preprocessing, and descriptive statistics. Module C focuses on analytical procedures, including exploratory analysis, a leave-one-out approach, and hypothesis testing to identify the most influential predictors. Subsequently, PCA–HCPC (Principal Component Analysis with Hierarchical Clustering on Principal Components) is applied to delineate distinct SME cluster profiles. Module D extends the analysis by interpreting statistically significant results, assessing moderating effects, differentiating between digital leaders and laggards, and evaluating the relative importance of DMA dimensions across clusters.
Figure 1.
Data analysis protocol. SMEs were recruited via the L-DIH and assessed with the EU’s DMAT (A). Survey data were anonymised, cleaned, and preprocessed before descriptive profiling (B). Analytical steps included leave-one-out correlations, hypothesis testing, and PCA–HCPC clustering to identify natural firm profiles (C). Findings revealed a pivotal role that strategy and human resources play in digital maturity; moderator analysis revealed limited effects of firm size and age; clustering distinguished Leaders from Laggards (D).
The data collection centred on the DMAT administered to manufacturing companies in Luxembourg. Participating firms were recruited through the L-DIH’s outreach channels – including direct invitations to companies that had engaged with L-DIH events and an open call via industry associations (e.g., FEDIL – Fédération entrepreneuriale multisectorielle) – aiming for a broad cross-section of the manufacturing ecosystem (from small family-owned businesses to larger industrial players). Participation was voluntary and free of charge, as the assessments were subsidised under the EDIH framework. To encourage busy SME owners and managers to participate, the L-DIH offered facilitated sessions. In many cases, an L-DIH expert worked with the company’s representative (typically a production manager, technical director, or CEO) to guide them through the DMAT questionnaire, either in person or via a video meeting. This approach ensured clarity in understanding the questions and maintained consistency in how responses were interpreted across. Each company was assured of confidentiality – individual results would be seen only by the company and the L-DIH assessment team, while any data used for research or policy purposes would be anonymised and aggregated.
The assessment procedure was performed in facilitated sessions. Two assessors from L-DIH would typically conduct the DMAT assessment. The session began with a brief interview and a company visit to gain an understanding of the company’s context, followed by a review of the DMAT questions one by one. The assessors ensured that the respondent understood each question in the context of their business (translating any abstract concepts into concrete examples). The respondent then selected the option that best described their company’s current practice, with the assessors recording the answers in the DMAT survey. This process typically took about 1–2 hours per company, depending on the depth of the discussion. Upon completion, the company immediately received a DMAT results report generated by the platform, showing their scores in each dimension and an overall maturity level. The L-DIH experts reviewed the report with the participant, highlighting areas of strength and weakness. For instance, a firm might score high in Automation (having deployed some connected machinery) but low in Data Management (lacking data analytics capabilities). Such feedback not only validated the responses but also provided direct value to the company, which aligns with the “assessment and advice” mission of the EDIH program. From a research perspective, these sessions also served to improve data quality, as the dialogue helped clarify any ambiguities in how questions applied to each firm.
All response data from the DMAT platform were exported to a secure database accessible to the research team. The dataset consisted of the anonymised company profiles and their item-level responses and dimension scores. Before analysis, the data were checked for completeness and consistency. The analysis plan involves both descriptive and comparative techniques. We calculate aggregate maturity scores for each dimension by converting the categorical responses to numeric scores (as defined by the DMAT scoring scheme) and normalising them to a 0–100 scale. Statistical analyses are done in aggregate; individual company identities remain confidential. The European Commission stipulates that DMAT data be used in aggregated form for statistical purposes, a guideline we strictly followed. It should be noted that this protocol was carried out in close collaboration with ongoing L-DIH operations. As such, it benefited from the standardised methodology provided by the EDIH network, while also allowing us to integrate research-specific goals into the data collection process. Any deviations from the standard DMAT usage (for research measurement purposes) were minimal and were communicated transparently to participants. In sum, the study protocol ensured a high level of rigour, combining a validated assessment instrument, consistent implementation with expert support, and careful data management.
2.2. DMAT Survey and Scoring System
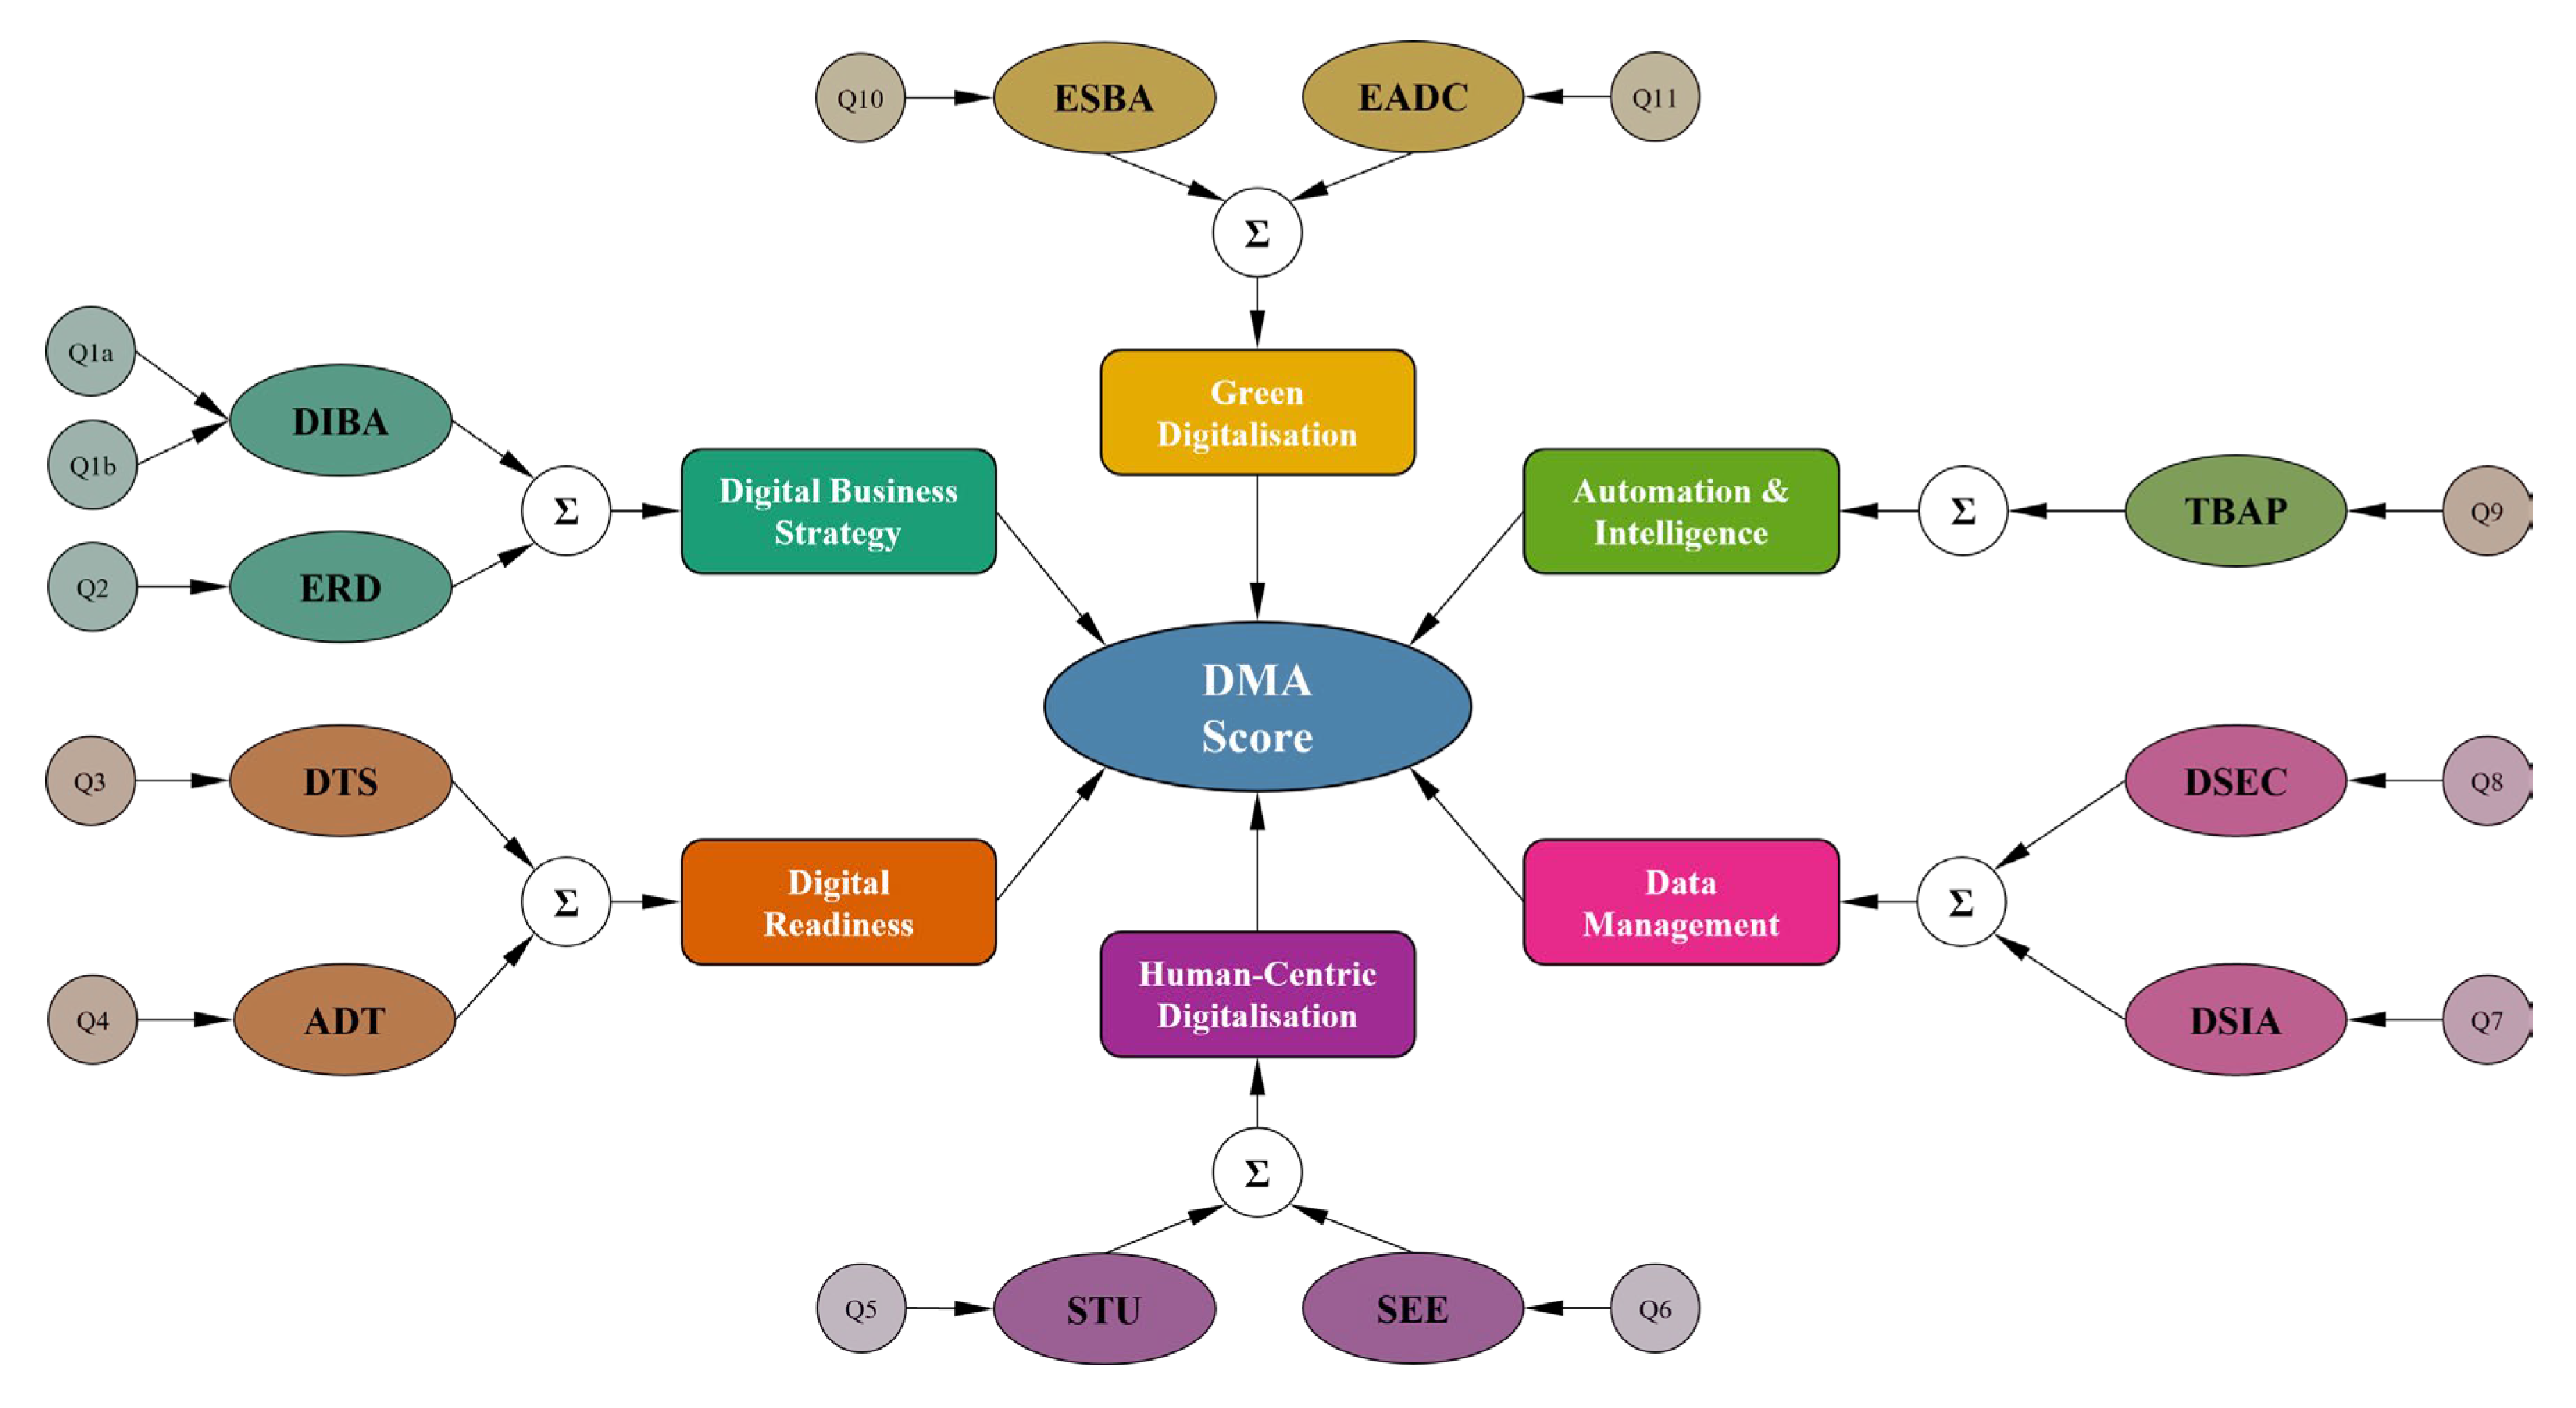
The DMAT survey [69,70] comprised a comprehensive set of questions grouped under the six main dimensions: (1) Digital Strategy, (2) Digital Readiness, (3) Digital Skills, (4) Data Management, (5) Automation/AI, and (6) Green Digitalisation. In total, the survey comprised 11 questions covering DMA dimensions, primarily in a multiple-choice format, where each choice corresponded to a specific maturity level or practice. Companies also provided basic profile information (sector, number of employees, annual turnover range, and respondent’s role) to allow analysis by size class or industry segment. No names or uniquely identifying details of companies were recorded in the dataset – instead, each respondent was assigned an anonymous code.
Figure 2.
DMAT Tool (reworked illustration from [70]). The survey consists of subdimensions: DIBA = Digitalisation pre Business Area; ERD = Enterprise Preparedness for Digitalisation; DTS = Digital Technologies Uptake; ADT = Advanced Digital Technologies used; STU = Staff Upskilling; SEE = Staff Engagement and Empowerment; DSIA = Data Storage, Organisation, Access and Exploitation; DSEC = Data Security; TBAP = Technologies Applied in Business Applications; EADC = Environmental Consideration of Digital Choices; ESBA = Enterprise use of Digital Technologies for Sustainability.
The DMAT scoring system is scored exactly as specified in the survey instrument [17]. For enterprise i, dimension d ϵ {1,…,6} and question q ϵ {1,…, Qd}, each option o within a question carries a weight wd,q,o (points) and a graded response gi,d,q,o ϵ [0, 1], defined by the instrument’s scales:
The raw points accrued by enterprise i on question q in dimension d are determined:
The maximum attainable raw points for a particular question are determined as:
To normalise every question on a 0-10 scale, as defined in the instrument, we apply a transformation:
This formulation ensures 0 ≤ Qi,d,q ≤ 10 across all question types. It also implements the Commission’s requirement that items with fewer than ten possible points are proportionally up-scaled, and items with more than ten points (if present) are proportionally down-scaled, yielding strict commensurability.
Dimension scores are then aggregated on a 0-100 scale, following the official multipliers. For instance, Digital Business Strategy (d = 1), which contains a composite score of three questions (Q1,a, Q1,a, Q2), the score is:
For dimensions with two constituent questions (d ϵ {2, 3, 4, 6}), the score is determined as:
For Dimension 5: Automation & Artificial Intelligence, there is only one question, which determines the score:
Each Di,d is bounded in [0, 100], providing a standardised maturity score per dimension. Lastly, the total digital maturity score is obtained as the overall score of all dimensions, i.e., the six dimension indices are aggregated and rescaled to ensure that the final result lies between 0 and 100:
The summary index is strictly derived from the official DMAT and provides a single measure of enterprise digital maturity that is consistent with the Commission’s framework.
2.3. Analytical Strategy
2.3.1. Correlation and Regression Analysis
The analytical strategy is structured to align directly with the research questions (RQ1–RQ4), progressing from dimension-level associations to multivariate clustering. First, we estimated correlations and performed regressions using a leave-one-out (LOO) approach to identify dimensions that strongly predict overall digital maturity (RQ1). Avoiding the tautology by leaving the focal dimension out of the dependent variable, we defined LOO totals:
for each d, we assess the unique link between dimension Di,d and Totali(-d) using Persons’s correlation r(Dd, Total(-d)), and simple regression Total(-d) ~ Dd with standardised slope and R2. By defining a dependent variable as the average of the remaining five dimensions, we avoid compositional inflation that would otherwise bias correlations. To stabilise inference under the small-sample condition, 2000 bootstrap replications were performed for each correlation, yielding bias-corrected confidence intervals. Model diagnostics include the Shapiro–Wilk (SW) test for residual normality and root mean squared error (RMSE) estimates of predictive accuracy. This approach allowed us to evaluate the unique predictive strength of each dimension relative to the composite maturity index.
2.3.2. Moderator Analysis
After performing LOOC tests, we then test whether maturity levels vary systematically by firm size, age, or sector. Company size was operationalised categorically according to the European Commission’s SME classifications and analysed with one-way ANOVA followed by Holm-adjusted pairwise comparisons. Organisational age (years since foundation) was treated as continuous and examined via Pearson’s correlation against maturity scores. Lastly, sectoral moderation was not pursued because several subsectors contained only a single representative, violating assumptions of both parametric and non-parametric group comparisons; inclusion under such conditions would risk spurious inference.
2.3.3. Within-Subject Comparisons Across Dimensions
To test whether specific dimensions systematically lag or lead, we performed a repeated-measures ANOVA treating the dimensions as a within-subject factor. This approach leverages the paired design, as each enterprise contributes scores for all dimensions. Assumptions were verified using Mauchly’s test of sphericity, with Greenhouse–Geisser correction applied if violated. QQ-plots of standardised residuals were inspected to confirm normality. Post-hoc contrasts between dimension means were performed with Holm–Bonferroni correction. Effect sizes were reported as partial η2 for omnibus tests and Cohen’s d for pairwise comparisons. This analysis examines whether baseline maturity systematically varies across conceptual domains and quantifies the magnitude of such differences.
2.3.4. PCA with Agglomerative Hierarchical Clustering
Given that classical inferential statistics (e.g., correlation, ANOVA) methods are standardised and extensively documented in the literature, reporting their results does not require formal derivations, as readers are generally familiar with their mechanisms and assumptions. However, PCA combined with hierarchical clustering is the core modelling framework of this study, transforming the six dimensions into a lower-dimensional space and partitioning SMEs into clusters. Because this process involves several successive mathematical transformations—data standardisation, eigen decomposition, and distance metrics used—explicit equations were introduced to make the process transparent and reproducible. We rely on mathematical formulation and assumptions described by [71,72], as the analysis is performed in RStudio (v.R-4.5.1), package FactoMineR (v.2.12) [73]. Formally, we start by expressing the dataset as:
where i = 1,…,n indexes enterprises, and d = 1,…,6 indexes the six DMA dimensions (each Di,d ϵ [0, 100]). Each dimension is standardised:
with as the mean and s as the standard deviation of dimensions d. The standardised data matrix is then:
The covariance matrix is:
Eigen decomposition gives:
where λk is the eigenvalue and vk is the eigenvector of the k-th component. The principal component scores for enterprise i on component k are:
Next, we perform agglomerative hierarchical clustering on principal components k. To do so, let F = (fi,k)n×K be the score matrix for the K retained components. The squared Euclidean distance between enterprises i and j is:
Ward’s agglomerative clustering merges clusters A and B by minimising the increase in within-cluster intertia:
where |A| and |B| are cluster sizes, and , cluster centroids are located in the K-dimensional component space.
Cluster interpretation was based on quality measures defined in FactoMineR [73]. The quality of representation of individuals on PCs was assessed using squared cosane (cos2), which quantifies the proportion of an individual’s variance explained by a given PC axis. The contribution (ctr%) was used to evaluate the extent to which each individual contributed to the inertia of an axis, defined as the proportion of the axis variance attributable to a particular enterprise. Analytically, the squared cosine is defined as:
Here, the numerator fi,k provides the squared projection coordinate of enterprise i on axis k. At the same time, the denominator is the squared distance of the point to the origin in the K-dimensional PCA space. High values indicates that k provides an accurate representation of i on that particular dimension, i.e., axes k. The contribution (ctr%) is:
where n is the number of enterprises and λk is the eigenvalue of the axis k. This represents the proportion of the variance of axis k explained by enterprise i. Cluster characterisation is performed using the t-test statistic, which compares whether the mean in cluster A differs significantly from the global mean. The ttest statistic is:
where is the cluster mean, is the global mean, s is the standard deviation, and nA is the cluster size. The cluster representation is used to introduce digital maturity levels by characterising clusters by their score. Namely, we determine a cluster by individuals specific to that class. Two different kinds of specific individuals are suggested: paragons (individuals closest to the centre of the class) and specificity (those furthest from the centres of other classes [71]. Thus, we rely on both paragon and specificity metrics for cluster(s) characterisation.
2.3.5. Post-hoc Power Analysis
To assess the statistical power of the correlation performed between dimensions Dd and the LOO overall score (Totali(-d)), we first applied Fisher’s z-transformation to the correlation coefficient [74,75]. This approach provides an accurate approximation to the sampling distribution of correlation coefficients. Let δ denote the true population correlation, and r the sample correlation. The Fisher z-transformation is defined as:
which stabilises the variance of the correlation coefficient. Under the null hypothesis H0: δ = 0, the transformed statistic follows a normal distribution with mean zero and variance 1/n-3, where n is the sample size. Under the alternative H1 : δ ≠ 0, the distribution is shifted by:
For a two-sided test with significance level α, the critical value is z1-α/2. The statistical power is obtained as:
where (·) is the standard normal cumulative distribution function. Note that atanh(δ) is the inverse hyperbolic tangent of the sample correlation coefficient, which is exactly as Fisher’s z transformation (atanh(r) ≡ z). Accordingly, with our sample of n = 30 SME enterprises, the analysis shows that, at the conventional α = 0.05 threshold, correlation of magnitude |δ| ≥ 0.50 can be detected with approximately 80% power, while |δ| ≥ 0.55 achieves ~ 90% power. When applying Bonferroni adjustments for six simultaneous tests (α* = 0.05/6 ≈ 0.0083), the minimum detectable effect size increases: achieving 80% requires |δ| ≈ 0.59, and 90% requires |δ| ≈ 0.64. We are sufficiently powered to detect only moderate-to-large effect size correlations [74,75] between dimensions and the LOO-DMA score, but underpowered to identify smaller effects in correlations. Consequently, non-significant results are interpreted cautiously, as they may reflect limited sensitivity rather than the absence of effect. The calculation was cross-validated using G*Power software (v3.1.9.7) [75].
3. Results
3.1. Descriptive Analysis
The sample consisted of 30 manufacturing SMEs located in Luxembourg, spanning multiple subsectors of the NACE Rev. 2 classification [76]. In terms of size distribution, 23.3% were classified as small (10-49), 46.6% as medium (50–249), and 30% as other (>250 but ranked as SME due to balance sheet), consistent with European Commission SME definitions [77]. The mean organisational age was 29.86 years (SD = 16.23, range = 4–64 years). Table 2 presents descriptive statistics for the six dimensions and the overall maturity score.
Across enterprises, mean scores were highest for Data Governance (M = 70.3, SD = 15.9), Digital Business Strategy (M = 62.2, SD = 18.0), and Human-Centric Digitalisation (M = 54.6, SD = 21.4), while Automation and Artificial Intelligence showed the lowest mean maturity level (M = 40.5, SD = 15.4). Variability was moderate across dimensions, with standard deviations ranging from 13.6 to 21.4. There was no violation of normality based on the Shapiro-Wilk test (p > 0.05). These descriptive statistics provide an overview of baseline maturity patterns, setting the foundation for subsequent inferential analyses.
3.2. Predictive Strength of Maturity Dimensions
To examine the dimensions’ effect in predicting the overall maturity score, we first compute leave-one-out (LOO) indices for each dimension, i.e., the average of the five remaining excluding the one being tested (Totali-(d)). This was done to avoid compositional bias that would otherwise inflate correlations. For estimating 95% confidence intervals (CI), 2000 bootstrap samples are performed to stabilise the inference of a small sample. For each dimension Dd, a correlation (r) and a simple linear regression (R) are computed with Total(-d) as the dependent variable. This way, we remove the mechanical overlap between Dd and the dependent variable. Results are summarised in Table 3.
The HCD exhibits the strongest correlation with overall maturity (r = 0.717 with 95%CI [0.51, 0.88], R2 = 0.514), followed by DBS (r = 0.652 with 95%CI [0.43, 0.82], R2 = 0.425), and GD (r = 0.581 with 95%CI [0.27, 0.78], R2 = 0.337), showing strong effect sizes (Fisher’s z(HCD) = 0.901, z(DBS) = 0.779, z(GD) = 0.664). The AAI dimension showed moderate predictive power (r = 0.550 with 95%CI [0.28, 0.74]) along with DG (r = 0.505 with 95%CI [0.21, 0.72]). In contrast, the DR dimension displayed only a weak correlation with the maturity score (r = 0.298, p = 0.110), indicating the absence of a significant correlation. The Shapiro-Wilk tests for bivariate normality were all nonsignificant (p > 0.2), suggesting that normality is not violated.
Furthermore, for illustrative purposes, we demonstrate the linear dependency between each dimension Di,d and Totali(-d) via correlation scatter plots, including marginal densities, confidence and prediction intervals (Figure 3). The scatterplots visually reaffirm the results presented in Table 3. HCD and DBS dimensions display a strong linear dependency, with narrow 95% confidence intervals and relatively small prediction intervals, indicating both a strong correlation and a stable prediction capacity. In contrast, the DR shows wide dispersion of points, a shallow slope, and a broad prediction region, consistent with its nonsignificant estimate (r = 0.298). The density plot further illustrates that enterprises exhibit broad variation, which weakens their alignment with the overall maturity score.
The technical enablers—DG, AAI, GD—occupy an intermediate position. Scatterplots exhibit moderate slopes with visible dispersion, as reflected in correlations ranging from r = 0.50 to r = 0.58. The density curves suggest a relatively balanced distribution across SMEs, but with greater variability compared to HCD and DBS. The variability presumably contributes to wider confidence intervals in the regression fits. Ultimately, the visual description reinforces the conclusions: human- and strategy-oriented capabilities drive maturity, while technical and sustainability dimensions contribute moderately, and basic readiness exerts little independent effect.
3.3. Structural Moderators of Maturity
To examine whether companies’ characteristics have a moderating effect on the overall maturity, we focused on company size and organisational age. Company size was operationalised categorically (small, medium, and other) following the European Commission classification and tested using one-way ANOVA. Organisational age, measured continuously in years, was analysed using Pearson’s correlation and linear regression to estimate whether maturity scores vary systematically with age. Sectoral analysis was not pursued as a moderator for two reasons. Firstly, the sample distribution was highly unbalanced across sectors. Although more than seven sectors were represented, several categories included only one to three companies, rendering both parametric and non-parametric group comparisons statistically unreliable. Secondly, given the limited national context (30 SMEs in Luxembourg), reporting sectoral breakdowns would compromise confidentiality obligations, since the identification of companies within niche sectors could lead to indirect disclosure of individual respondents. For both methodological and ethical reasons, the sector was excluded from testing.
The ANOVA results are discussed, and group comparison is illustrated in Figure 4. Namely, none of the cases showed statistically significant differences in the comparison of company size. In fact, only the group comparison of company size, considering DBS, showed slight skewness, but without any significant moderating effect (p < 0.05). Hence, we conclude that company size has no moderating effect on dimensions or the overall DMA score.
The moderating role of organisational age on digital maturity was tested using both Pearson’s correlation coefficient (r) and Spearman’s rank correlation (ρ) to account for potential linear and monotonic relationships, respectively. As shown in Table 4, organisational age showed a lack of significant effect on overall maturity score (r = -0.04, p = 0.832, ρ = -0.081, p = 0.669). Similarly, none of the six dimensions displayed correlations with age. Some effect was observed for data governance, with a negative and nonsignificant trend (r = -0.263, p = 0.16; ρ = -0.310, p = 0.095), suggesting the existence of a tendency of older SMEs to have lower scores on this dimension; however, there was no significant evidence to support the effect.
In summary, neither company size nor organisational age emerged as a significant moderator of digital maturity in this sample of Luxembourgish SMEs. The absence of statistical differences across size categories suggests that the resource availability associated with firm scale does not directly translate into higher maturity levels. Likewise, the lack of correlation with organisational age indicates that digital maturity is not a function of firm longevity in this sample, although it has been previously reported [63]. The slight negative trend observed for the data governance dimension in older firms may reflect challenges in modernising legacy infrastructures, though this pattern remains inconclusive. Taken together, these findings support the view that structural attributes, such as size and age, exert a limited influence on digital maturity outcomes, reinforcing the central role of strategic orientation and human-centric practices as identified in RQ1.
3.4. Dimension-Specific Performance
We performed repeated-measures ANOVA (within-subject comparison) to test whether dimensions’ mean scores differ (Figure 5). Mauchly’s test was non-significant (WM = 0.651, p = 0.636), showing that the sphericity assumption holds; QQ-plots of standardised residuals did not suggest deviations from normality. The repeated measures ANOVA revealed a significant effect of dimensions on digital maturity (F = 20.36, p < 0.001, η2 = 0.413), indicating that maturity levels differed substantially across the six dimensions.
Post-hoc pairwise comparisons with Holm–Bonferroni correction (Table 5) indicate several robust differences. DG had, on average, the highest mean score and demonstrated consistently higher scores than DR (mean difference = 18.16, d = −1.07, pholm < 0.001); HCD (mean difference = 15.65, d = −0.92, pholm < 0.001); AAI (mean difference = 29.77, d = 1.75, pholm < 0.001), and GD (mean difference = 25.13, d = 1.48, pholm < 0.001). DBS scored higher compared to dimensions: DR (difference = 10.02, 95%CI [0.43, 19.60], t = 3.34, d = 0.59, pholm = 0.018); AAI (difference = 21.63, 95%CI [10.56, 32.70], t = 6.25, d = 1.27, pholm = 0.001); and GD (difference = 16.99, 95%CI [5.86, 28.13], t = 4.88, d = 1.00, pholm < 0.001). The pattern confirms that data foundations and strategic alignment, i.e., DG and DBS dimensions, reflect the importance of digital maturity.
DR consistently lagged, with lower scores than DBS, DG, and AAI. AAI itself scored significantly lower than DBS (mean difference = 21.63, d = 1.27) and DG (mean difference = 29.77, d = 1.75). Similarly, HCD occupied a middle ground: it outperformed AAI but fell behind DG (mean difference = -15.65, d = -0.920, pholm < 0.001). GD also yielded intermediate scores, significantly lower than DBS and DG, but not different from HCD or AAI after correction. Taken together, the post-hoc analyses indicate a clear ranking of dimensions. DG and DBS emerged as the strongest performers, GD and AAI as the weakest, and HCD and DR in an intermediate position.
Regarding the pairwise comparison of dimensions, the large effects (e.g., DG-AAI, DBS-AAI, DG-GD, DBS-GD) are well-powered, and their Cohen’s d values exclude small effects, so we consider these findings robust. Moderate effects (e.g., HCD-AAI, HCD-DG, DR-DG, DBS-DR, DR-AAI) are statistically significant after Holm, but have wider CIs (some even without effect – DBS-DR = -0.03), which makes them reliable but less precisely estimated. For the non-significant pairs, effects are likely to be small and/or the design is underpowered to detect the effect after multiplicity control, which makes these results inconclusive rather than suggesting that there is no evidence of difference. Hence, a larger sample size is required to increase the probability of detecting significant differences.
Given the observed omnibus effect (partial η2 ≈ 0.41; f ≈ 0.84), achieved power for the global test was ≥ 0.99 at α = 0.05, whereas pairwise power depended on the contrast magnitude: large effects were well-powered and precise; moderate effects (e.g., DBS–DR, DR–AAI) were significant but less precisely estimated. In repeated-measures settings, such sensitivity is expected to vary with the correlation structure among measurements [78], so future work with larger samples and theory-driven contrasts is warranted to refine estimates for the borderline pairs.
3.5. Emergence of Maturity Profiles Through Clustering
To explore whether Luxembourgish manufacturing SMEs form natural profiles based on their digital maturity, a Principal Component Analysis (PCA) followed by Hierarchical Clustering on Principal Components (HCPC) was performed. The PCA factor map (Figure 6A) revealed two distinct clusters of SMEs distributed along the first two PCs. The PCA factor and correlation map (Figure 6A, C) revealed a general maturity gradient on PC1: all dimensions loaded positively (Figure 6C), indicating that a higher score on any dimension tends to co-occur. Together, PC1 (49.9%) and PC2 (20.6%) accounted for 70.5% of the total variance (Figure 6B), suggesting that the projection adequately captures the major structure in the data.
Agglomerative hierarchical clustering (Ward’s method on Euclidean distances) confirmed a two-cluster solution, consistent with the inertia gain (Figure 6D): Cluster 1 (n = 16 SMEs) exhibits systematically lower maturity scores across dimensions, whereas Cluster 2 (n = 14) performs consistently higher. Between-cluster comparison (Figure 6E) were large and robust across dimensions: DBS (t = 5.38, d = 1.97, p < 0.001) and HCD (t = 6.78, d = 2.48, p < 0.001), both exhibiting large effect sizes. Significant differences were also observed for DR (t = 3.14, d = 1.15, p < 0.01) and GD (t = 3.21, d = 1.17, p < 0.01). A smaller yet significant difference was found for AAI (t = 2.75, d = 1.00, p < 0.05) and DG (t = 2.72, d = 0.99, p < 0.05).
The overall DMA scores across the two clusters (Figure 6F) revealed a highly significant gap, with Cluster 2 averaging 65.31 compared to 45.68 in Cluster 1 (p < 0.001, d = 2.83, mean difference = 19.63, SE = 2.54). This reinforces the cluster solution, highlighting that SMEs in Cluster 2 consistently outperform those in Cluster 1 across digital maturity measures. In sum, from the interpretation of the PCA-HCPC, we infer that DG and DBS act as core strengths of the more mature digital profiles, while HCD emerges as a pivotal lever in differentiating clusters nearly as strongly as DBS. Because clustering is performed on the same information later compared between clusters, we treat p-values as descriptive confirmation of the profiles, rather than independent hypothesis tests.
4. Discussion
4.1. Strategic and Human-Centric Enablers as Core Maturity Drivers
The findings provide evidence that strategy (DBS) and people (HCD) act as the primary drivers of digital maturity in Luxembourgish manufacturing SMEs. Relying on the proposed leave-one-out approach that removes mechanical overlap between each dimension and the overall digital maturity score, Human-Centric Digitalisation shows the strongest association with overall maturity (r = 0.717, R2 = 0.514), followed by Digital Business Strategy (r = 0.652, R2 = 0.425). Bootstrap confidence intervals (HCD 95%CI [0.51, 0.88]; DBS 95%CI [0.43, 0.82]), and diagnostic checks confirm that there are no deviations from normality. These “meta-capabilities” appear to shape how SMEs prioritise, absorb, and scale digital initiatives. This pattern is corroborated by cluster analysis and repeated-measures results: the higher-maturity profile outperforms sharply on DBS and HCD.
Substantively, this implies a sequencing logic. Clear digital strategy (e.g., digital priorities, data governance) and human enablement (e.g., digital upskilling, data-driven decision-making) form the core on which digital progress compounds. In other words, the maturity “engine” is organisational rather than purely technological, which is confirmed, on one side, by our in-person SME shop-floor inspections, and on the other, statistically with the lack of strong correlation of digital readiness and overall DMA (r = 0.298, p = 0.110). Consequently, a practical roadmap for practice would be: (i) to consolidate DBS and HCD as foundations, and (ii) to scale data governance (connectedness and digitisation) and Automation & AI, where bottlenecks and value pools are clearest. Overall, our findings suggest that soft dimensions of maturity (human-centric practices, digital business strategy) are more decisive predictors than purely technical readiness measures.
4.2. Limited Influence of Structural SME Attributes
Neither company size nor organisational age moderated maturity in our SME sample. Size groups showed no reliable differences in any dimension or in the overall score, and age was uncorrelated with maturity (r < 0.20). The absence of size effects suggests that access to capabilities—not scale per se—differentiates maturity in the Luxembourg context. Similarly, longevity does not automatically translate into digital advantage; if anything, the (non-significant) negative tendency for DG in older firms hints at legacy-system drag. These nulls should be interpreted as non-differentiating within this sample, rather than as universal claims; with n = 30, tests are well-powered for large effects but less so for small ones. Still, the pattern reinforces the conclusion that what firms do (strategy and people systems) matters more than what they are (size and age) for digital advancement.
4.3. Internal Disparities Between Maturity Dimensions
Within firms, dimensions differ meaningfully. Repeated-measures ANOVA shows a strong effect (partial η2 ≈ 0.413), and post-hoc contrasts consistently rank DG and DBS at the top, while AAI and GD lag; HCD and DR occupy the middle. The most significant gaps (e.g., DG–AAI, DBS–AAI, DG–GD) have large effect sizes whose CIs exclude minor effects, implying robust, actionable disparities. Moderate effects (e.g., HCD–AAI, DBS–DR) are significant but estimated with wider CIs and should be interpreted cautiously. As expected in repeated-measures designs, sensitivity depends on the correlation structure among measures; thus, some borderline contrasts may require larger samples or pre-specified contrasts to sharpen estimates.
Managerially, these within-firm gaps reveal priority imbalances: many SMEs have comparatively stronger data foundations and strategic alignment than, for instance, in Automation & AI and Green Digitalisation capabilities. Closing these gaps likely requires integrated programmes that connect use-cases to strategy, couple human-centred work redesign with automation, and embed energy/resource performance indicators into digital operating models.
4.4. Divergen SME Maturity Profiles
PCA-HCPC reveals two coherent maturity profiles: leaders and laggards. PC1 captures a general maturity gradient (all dimensions load positively), while PC2 differentiates firms by Digital Readiness relative to their overall level. Ward clustering on retained PCs yields a lower-maturity Cluster 1 and a higher-maturity Cluster 2, with significant between-cluster differences—especially in DBS and HCD—and a substantial overall-score gap (~20 points, see Figure 6E). We would again remind that here p-values are treated as descriptive confirmation rather than hypothesis tests; nevertheless, the PCA separation, effect sizes, and consistency across dimensions indicated a stable segmentation.
The two-profile segmentation supports differentiated capability-building pathways tailored to each starting point. Given that our future project objectives consider working alongside SMEs to increase digitalisation level proactively, for Cluster 1 (Laggards), we consider prioritising DBS/HCD dimensions—strategy deployment, portfolio selection, and workforce upskilling—paired with data basics (e.g., data governance and interoperability) and targeted AAI pilots linked to pain points and measurable value. For Cluster 2 (Leaders), the focus shifts from experimentation to industrialisation of AAI (scaling beyond pilots with model operations), advancing DG (semantic integration and real-time analytics), and operational GD (e.g., energy and resource optimisation). Lastly, for both clusters, we believe that instituting a measurement discipline with clear KPIs will help determine which interventions are effective in closing internal disparities between dimensions.
The identification of divergent SME maturity profiles offers not only a diagnostic classification but also a forward-looking pathway for national initiatives such as the Luxembourg AI Factory. For Laggards, the findings highlight the necessity of targeted support that builds strategic alignment and human-centric capabilities before AI-driven solutions can be effectively adopted. For Leaders, the results underscore the potential to scale advanced analytics and AI applications, transforming isolated use cases into systematic productivity and sustainability gains. At the policy level, this segmentation provides evidence to inform differentiated instruments—where foundational interventions address structural deficits in weaker firms, while advanced firms are incentivised to become AI frontrunners. Thus, the clustering analysis does not merely describe heterogeneity; it provides a roadmap for aligning AI adoption trajectories with the twin transition agenda, ensuring that Luxembourg’s SMEs can simultaneously enhance competitiveness and contribute to the EU’s broader digital and sustainability targets.
5. Conclusions
5.1. Concluding Remarks
This study assessed digital maturity within Luxembourgish manufacturing SMEs across six dimensions: Digital Business Strategy, Digital Readiness, Human-Centric Digitalisation, Data Governance, Automation & Artificial Intelligence, and Green Digitalization to (i) identify which dimensions most strongly predict overall maturity and (ii) determine whether SMEs form maturity profiles. We performed leave-one-out correlations to avoid compositional bias, repeated-measures ANOVA with Holm-adjusted post-hoc tests to examine within-firm disparities, and finally performed Principal Component Analysis followed by Agglomerative Hierarchical Clustering to uncover profiles. Assumption checks were satisfactory, as multiplicity was controlled and small-sample size robustness was addressed through bootstrapping and achieved-power diagnostics.
Two coherent SME profiles emerge along a dominant “overall maturity” axis—Leaders and Laggards—with secondary contrasts driven by DR. Across analytic lenses (leave-one-out regressions, repeated-measures contrasts, and cluster analysis), the higher-maturity profile is distinguished most strongly by strategy and people—Digital Business Strategy and Human-Centric Digitalization—while Automation & AI and Green Digitalization mark salient upgrade opportunities in lower-maturity SMEs. Data Governance is consistently strong but, like AAI and GD, is amplified when DBS/HCD foundations are in place. The principal effects are large in magnitude, remain significant under multiplicity control, and align with the clustering solution, yielding a convergent conclusion: strategy and people are the core drivers of digital maturity; technology and sustainability act as accelerators once those organisational foundations are established.
5.2. Implications and Limitations
Considering managerial and policy implications, the evidence points to a clear sequencing logic: build organisational foundations, then scale technology, and target support by maturity profile. Concretely, SMEs should prioritise Digital Business Strategy—clarifying roadmaps, governance, and investments—together with Human-Centric Digitalisation—skills development, participatory change, and empowered work design—because these identified “meta-capabilities” will presumably raise the return on downstream technical initiatives. Once these foundations are set, organisations can industrialise Data Governance and Automation & AI by moving beyond pilots and instituting MLOps (Machine Learning Operations). Green Digitalization should be embedded into day-to-day operations by tying energy/resource KPIs to digital workflows so efficiency and sustainability co-evolve, i.e., adapt “circularity analytics” [79]. The two-profile segmentation provides a practical targeting mechanism: Cluster 1 (lower maturity) benefits from DBS/HCD plus data basics and tightly scoped value-linked AAI pilots; Cluster 2 (higher maturity) requires scale-up—industrialised AAI, advanced DG (real-time analytics), and operational GD (energy/resource optimisation). Across both profiles, SMEs should strengthen measurement control (by using compact KPIs) to ensure that maturity gains translate into operational and effective outcomes.
From the study, we identified several limitations. Namely, interpretation should be tempered by methodological and contextual constraints. Findings derived from 30 Luxembourgish SMEs limit external validity beyond these settings; the cross-sectional design precludes causal claims, so the proposed path ordering (DBS/HCD → DG/AAI/GD → outcomes) remains theoretical. Despite a leave-one-out approach to reduce compositional overlap, measurement commonality may persist among dimensions; reliance on a single instrument also introduces potential self-report bias. Power is asymmetric—high for large effects but limited for small-to-moderate contrasts—so non-significant results are best treated as inconclusive rather than evidence of equivalence. The clustering is exploratory and sample-dependent. Moderator coverage is incomplete because sector effects were not analysed due to privacy constraints and a severe imbalance, which leaves potential sector idiosyncrasies untested. Finally, the overall maturity index used is a methodological construct; stronger external validity would be achieved by complementing it with objective performance outcomes not used in its development (e.g., productivity growth, on-time delivery, defect rates, energy intensity), and by estimating a dimension-to-outcome regression that demonstrates predictive validity in practice. Considering that we have an outlier of 382 SMEs (Table 1), the average number of SMEs varies between Mean ± STD = 29.19 ± 27.53 and 49.94 ± 89.63, with the outlier included. Hence, we consider the sample of 30 SMEs somewhat satisfactory, given that the majority of studies demonstrate results on a much smaller sample.
5.3. Future Research
Future work should move from descriptive mapping to causally credible evaluation of maturity pathways. Given that our obtained data covered only exploratory assessment at T0 period (T1 and T2 to follow), our priority directions primarily include longitudinal and quasi-experiment designs (e.g., stepped-wedge, difference-in-differences) to test whether strengthening DBS/HCD catalyses gains in DG/AAI/GD and, in turn, improves objective outcomes, for instance, productivity, defect rates, etc. Secondly, we consider a larger and multi-sector sample with a priori power and sensitivity analyses to detect small to moderate effects, as we believe that some differences may be omitted in our sample of SMEs, especially considering question items underpinning the dimensions being tested. Lastly, perform causal modelling using factor analysis, such as structural equation modelling or Bayesian mediation, and dynamic cross-lagged panel models, which would be particularly suitable for our contextual sceneries in identifying mechanisms and boundary conditions (e.g., whether digital readiness acts as a moderator or early-warning indicator). Collectively, we believe that these steps will convert maturity diagnostics into actionable, predictive guidance for policy and management, while strengthening generalisability beyond the Luxembourg SME settings.
Author Contributions
Conceptualization, O. M. and S.K.; methodology, O.M. and M.D.; validation, O.M., S.K. and M.D.; formal analysis, O.M.; investigation, O.M. and M.D.; resources, M.D. and S.K.; data curation, M.O. and M.D.; writing—original draft preparation, O.M, S.K. and M.D.; writing—review and editing, O.M.m S.K. and M.D.; visualization, O.M.; supervision, S.K. and M.D.; project administration, M.D. and S.K.; funding acquisition, M.D. and S.K. All authors have read and agreed to the published version of the manuscript.
Funding
This research has been carried out in the framework of the L-DIH (Luxembourg Digital Innovation Hub) project (Grant Agreement No. 101120714) funded by the European Union’s Digital Europe Programme (DIGITAL) under the topic DIGITAL-2022-EDIH-03-INITIAL.
Institutional Review Board Statement
Not applicable.
Informed Consent Statement
Not applicable.
Data Availability Statement
Data can be available upon request.
Acknowledgments
The large language models are used in the manuscript writing process for language editing assistance only. Grammarly was used for spelling, grammar, and style checks, while OpenAI’s GPT-5 was employed to refine phrasing and improve clarity. These tools were used solely as writing aids and were not intended to generate ideas, analyses, interpretations, or original intellectual content. All concepts, study design, results, conclusions, figures, and tables originate and are solely the work of the authors of this manuscript. All suggested edits were reviewed, revised where necessary, and approved by the authors, who take full responsibility for the accuracy and integrity of the work.
Conflicts of Interest
The authors declare no conflicts of interest.
Equations and Abbreviations
The following notatiosn and abbreviations are used in this manuscript:
| i | index for enterprises |
| n | index for sample size |
| d | index for dimensions of digital maturity (d = 1,…,6) |
| q | index for questions within a dimension (q = 1,…,Qd) |
| o | index for response options within a question q |
| k | index for principal component axis |
| wd,q,o | weight assigned to option o of question q in dimension d |
| gi,d,q,o | graded response value for enterprise i for option o of question q in dimension d |
| Ri,d,q | raw points accrued by enterprise i on question q in dimension d |
| Wd,q | maximum attainable points for question q in dimension d |
| Qi,d,q | normalised score of enterprise i on question q in dimension d, from 0-10 scale |
| Di,d | score of enterprise i in dimension d, expressed on 0-100 scale |
| Totali | total digital maturity score of enterprise i, expressed on 0-100 scale |
| X | data matrix of size n × d (30 × 6 for samples and dimensions) used in PCA |
| Z | standardised data matrix used in PCA |
| zi,d | standardised score of enterprise i on dimension d |
| C | correlation matrix in PCA |
| λk | eigenvalue of axis k, representing the variance explained by the component k |
| vk | eigenvector (loading) associated with axis k |
| fi,k | principal component score of enterprise i on axis k |
| cosi,k2 | squared cosine (quality of representation) of enterprise i on axis k |
| ctri,k | contribution of enterprise i to axis k |
| ttest | independent Student’s t-test statistic |
| s | sample standard deviation |
| r | Pearson’s sample correlation coefficient |
| δ | Pearson’s population correlation coefficient |
| R | Regression coefficient |
| β | Regression weight coefficient |
| SE | Standard error |
| Δ(A,B) | Within-cluster inertia |
| WM | Mauchly’s test of sphericity |
| AAI | Automation & Artificial Intelligence |
| ANOVA | Analysis of Variance |
| CEO | Chief Executive Officer |
| CoV | Coefficient of Variation |
| DBS | Digital Business Strategy |
| DG | Data Governance / Data Management and Connectedness |
| DMA | Digital Maturity Assessment |
| DMAM | Digital Maturity Assessment Model |
| DMAT | Digital Maturity Assessment Tool |
| DR | Digital Readiness |
| EC | European Commission |
| EDIH | European Digital Innovation Hub |
| EIB | European Investment Bank |
| EU | European Union |
| GD | Green Digitalisation |
| GDPR | General Data Protection Regulation |
| HCPC | Hierarchical Clustering on Principal Components |
| HCD | Human-Centric Digitalisation |
| IT | Information Technology |
| KPI | Key Performance Indicator |
| L-DIH | Luxembourg Digital Innovation Hub |
| LNDS | Luxembourg National Data Service |
| LOO / LOOC | Leave-One-Out Correlation |
| MADM | Multi-Attribute Decision-Making |
| ML | Machine Learning |
| MLOps | Machine Learning Operations |
| NACE | Statistical Classification of Economic Activities in the European Community |
| NR | Non-Related (NR1 / NR2 in context) |
| PCA | Principal Component Analysis |
| PSO | Public Sector Organisation |
| RMSE | Root Mean Square Error |
| RQ | Research Question |
| SD | Standard Deviation |
| SE | Standard Error |
| SME | Small and Medium-Sized Enterprise |
| SW | Shapiro–Wilk test |
| SLR | Systematic Literature Review |
| TBI | Test Before Invest |
References
- Milošević, I.M.; Plotnic, O.; Tick, A.; Stanković, Z.; Buzdugan, A. Digital Transformation in Manufacturing: Enhancing Competitiveness Through Industry 4.0 Technologies. Precision Mechanics & Digital Fabrication 2024, 1, 31–40. [Google Scholar] [CrossRef]
- Ghobakhloo, M.; Iranmanesh, M. Digital Transformation Success under Industry 4.0: A Strategic Guideline for Manufacturing SMEs. Journal of Manufacturing Technology Management 2021, 32, 1533–1556. [Google Scholar] [CrossRef]
- Yaqub, M.Z.; Alsabban, A. Industry-4.0-Enabled Digital Transformation: Prospects, Instruments, Challenges, and Implications for Business Strategies. Sustainability 2023, 15, 8553. [Google Scholar] [CrossRef]
- Sharma, M.; Paliwal, T.; Baniwal, P. Challenges in Digital Transformation and Automation for Industry 4.0. In AI-Driven IoT Systems for Industry 4.0; CRC Press: Boca Raton, 2024; pp. 143–163. [Google Scholar]
- Agustian, K.; Mubarok, E.S.; Zen, A.; Wiwin, W.; Malik, A.J. The Impact of Digital Transformation on Business Models and Competitive Advantage. Technology and Society Perspectives (TACIT) 2023, 1, 79–93. [Google Scholar] [CrossRef]
- European Commission 2030 Digital Compass: The European Way for the Digital Decade; Brussels, 2021;
- Brodny, J.; Tutak, M. Digitalization of Small and Medium-Sized Enterprises and Economic Growth: Evidence for the EU-27 Countries. Journal of Open Innovation: Technology, Market, and Complexity 2022, 8, 67. [Google Scholar] [CrossRef]
- Strilets, V.; Frolov, S.; Datsenko, V.; Tymoshenko, O.; Yatsko, M. State Support for the Digitalization of SMEs in European Countries. Problems and Perspectives in Management 2022, 20, 290–305. [Google Scholar] [CrossRef]
- European Commission The Digital Europe Programme. Available online: https://digital-strategy.ec.europa.eu/en/activities/digital-programme#:~:text=The%20Digital%20Europe%20Programme%20,EDIH (accessed on 19 September 2025).
- Belciu, A.-C. Performance in Accessing Funding through Digital Europe Programme. Eastern European Journal for Regional Studies 2025, 11, 45–62. [Google Scholar] [CrossRef]
- Kanellopoulou, D.; Giannakopoulos, G.; Terlixidis, P.; Karkaletsis, V. Smart Attica EDIH: A Paradigm for DIH Governance and a Novel Methodology for AI-Powered One-Stop-Shop Projects Design. In Proceedings of the Springer Proceedings in Business and Economics; Springer Nature; 2025; pp. 151–159. [Google Scholar]
- Rudawska, J. THE ONE STOP SHOP MODEL – A CASE STUDY OF A DIGITAL INNOVATION HUB. Zeszyty Naukowe Politechniki Częstochowskiej. Zarządzanie 2022, 47, 31–42. [Google Scholar] [CrossRef]
- Carpentier, E.; D’Adda, D.; Nepelski, D.; Stake, J. European Digital Innovation Hubs Network’s Activities and Customers; Luxembourg, 2025.
- Maurer, F. Business Intelligence and Innovation: A Digital Innovation Hub as Intermediate for Service Interaction and System Innovation for Small and Medium-Sized Enterprises. In IFIP advances in information and communication technology; Springer Science+Business Media, 2021; pp. 449–459 ISBN 1868-4238.
- Sassanelli, C.; Terzi, S. The D-BEST Based Digital Innovation Hub Customer Journey Analysis Method: Configuring DIHs Unique Value Proposition. International Journal of Engineering Business Management 2022, 14. [Google Scholar] [CrossRef]
- Gyulai, T.; Nagy, M.; Cibu-Buzac, R. Smart Development with Digital Intelligent Cities in Cross-Border Regions. In Pandémia – fenntartható gazdálkodás – környezettudatosság; Soproni Egyetem Kiadó, 2022; pp. 264–677.
- Kalpaka, A.; Rissola, G.; De Nigris, S.; Nepelski, D. Digital Maturity Assessment (DMA) Framework & Qustionnaires for SMEs/PSOs: A Guidence Document for EDIHs; Seville, 2023;
- Kulchytsky, О. Assessment of Digital Maturity of Business Companies According to the Methodology of European Digital Innovation Hubs. Economics time realities 2024, 5, 117–122. [Google Scholar] [CrossRef]
- European Commission Commission Unveils New Tool to Help SMEs Self-Assess Their Digital Maturity. Available online: https://digital-strategy.ec.europa.eu/en/news/commission-unveils-new-tool-help-smes-self-assess-their-digital-maturity (accessed on 19 September 2025).
- European Commission Luxembourg 2025 Digital Decade Country Report. Available online: https://digital-strategy.ec.europa.eu/en/factpages/luxembourg-2025-digital-decade-country-report (accessed on 19 September 2025).
- The Government of the Grand Duchy of Luxembourg Digital Decade: National Strategic Roadmap for Luxembourg 2.0; Luxembourg, 2024;
- European Commission State of the Digital Decade 2024; Brussels, 2024.
- Eurostat Digitalisation in Europe – 2025 Edition. Available online: https://ec.europa.eu/eurostat/web/interactive-publications/digitalisation-2025#:~:text=The%20proportion%20of%20SMEs%20with,in%20Finland (accessed on 25 September 2025).
- Ministry of the Economy Ons Wirtschaft vu Muer: Roadmap for a Competitive and Sustainable Economy 2025; Luxembourg, 2021.
- The Government of the Grand Duchy of Luxembourg Luxembourg’s AI Strategy: Accelerating Digital Sovereignty 2030; Luxembourg, 2025;
- LNDS Annual Report 2024; Esch-sur-Alzette, 2024;
- Sobczak, E. Digital Transformation of Enterprises and Employment in Technologically Advanced and Knowledge-Intensive Sectors in the European Union Countries. Sustainability 2025, 17, 5868. [Google Scholar] [CrossRef]
- Tanhua, D.; Tuomi, E.O.; Kesti, K.; Ogilvie, B.; Delgado Sahagún, C.; Nicolas, J.; Rodríguez, A.; Pajares, J.; Banville, L.; Arcusin, L.; et al. DIGITAL MATURITY OF THE COMPANIES IN SMART INDUSTRY ERA. Scientific Papers Series Management, Economic Engineering in Agriculture and Rural Development 2024, 24, 855–876. [Google Scholar]
- Kljajić Borštnar, M.; Pucihar, A. Multi-Attribute Assessment of Digital Maturity of SMEs. Electronics (Basel) 2021, 10, 885. [Google Scholar] [CrossRef]
- Volf, L.; Dohnal, G.; Beranek, L.; Kyncl, J. Navigating the Fourth Industrial Revolution: SBRI - A Comprehensive Digital Maturity Assessment Tool and Road to Industry 4.0 for Small Manufacturing Enterprises. Manufacturing Technology 2024, 24, 668–680. [Google Scholar] [CrossRef]
- Novoa, R. Training Needs in Digital Technologies in Companies in the Valencian Region: An Empirical Study Carried out in the Framework of the European Network of EDIHs (European Digital Innovation Hubs). Research Square (Research Square) 2024. [Google Scholar] [CrossRef]
- Rahamaddulla, S.R. Bin; Leman, Z.; Baharudin, B.T.H.T. Bin; Ahmad, S.A. Conceptualizing Smart Manufacturing Readiness-Maturity Model for Small and Medium Enterprise (Sme) in Malaysia. Sustainability (Switzerland) 2021, 13. [Google Scholar] [CrossRef]
- Semrádová Zvolánková, S.; Krajčík, V. Digital Maturity of Czech SMEs Concerning the Demographic Characteristics of Entrepreneurs and Enterprises. Equilibrium. Quarterly Journal of Economics and Economic Policy 2024, 19, 1363–1404. [Google Scholar] [CrossRef]
- Di Felice, P.; Paolone, G.; Di Valerio, D.; Pilotti, F.; Sciamanna, M. Transforming DIGROW into a Multi-Attribute Digital Maturity Model. Formalization and Implementation of the Proposal. In Proceedings of the Lecture Notes in Computer Science; Springer Science and Business Media Deutschland GmbH, 2022; Vol. 13378 LNCS; pp. 541–557. [Google Scholar]
- Serrano-Ruiz, J.C.; Ferreira, J.; Jardim-Gonçalves, R.; Ortiz Bas, Á. Relational Network of Innovation Ecosystems Generated by Digital Innovation Hubs: A Conceptual Framework for the Interaction Processes of DIHs from the Perspective of Collaboration within and between Their Relationship Levels. J Intell Manuf 2025, 36, 1505–1545. [Google Scholar] [CrossRef]
- Crupi, A.; del Sarto, N.; Di Minin, A.; Gregori, G.L.; Lepore, D.; Marinelli, L.; Spigarelli, F. The Digital Transformation of SMEs – a New Knowledge Broker Called the Digital Innovation Hub. Journal of Knowledge Management 2020, 24, 1263–1288. [Google Scholar] [CrossRef]
- Kääriäinen, J.; Perätalo, S.; Saari, L.; Koivumäki, T.; Tihinen, M. Supporting the Digital Transformation of SMEs — Trained Digital Evangelists Facilitating the Positioning Phase. International Journal of Information Systems and Project Management 2023, 11, 5–27. [Google Scholar] [CrossRef]
- Leino, S.-P.; Kuusisot, O.; Paasi, J.; Tihinen, M. VTT Model of Digimaturity. In Towards a new era in manufacturing: Final report of VTT’s for industry spearhead programme; 2017; pp. 1–186.
- Kudryavtsev, D.; Moilanen, T.; Laatikainen, E.; Ali Khan, U. Towards Actionable AI Implementation Capability Maturity Assessment for SMEs. In Herman Hollerith Conference 2024; 2025; pp. 7–17.
- Krčelić, G.; Lorencin, I.; Tanković, N. Digital Maturity of Private and Public Organizations in RH. In Proceedings of the 2025 MIPRO 48th ICT and Electronics Convention; 2025; pp. 1857–1861. [Google Scholar]
- Shirwa, A.M.; Hassan, A.M.; Hassan, A.Q.; Kilinc, M. A Cooperative Governance Framework for Sustainable Digital Transformation in Construction: The Role of Digital Enablement and Digital Strategy. Results in Engineering 2025, 25, 104139. [Google Scholar] [CrossRef]
- Grigorescu, A.; Lincaru, C.; Ciuca, V.; Priciog, S. Trajectories toward Digital Transformation of Business Post 2027 in Romania. In Proceedings of the Managing Business Transformations during Uncertain Times; Bucharest, October 26 2023; pp. 244–259. [Google Scholar]
- Zare, L.; Ali, M. Ben; Rauch, E.; Matt, D.T. Navigating Challenges of Small and Medium-Sized Enterprises in the Era of Industry 5.0. Results in Engineering 2025, 27, 106457. [Google Scholar] [CrossRef]
- Mazgajczyk, E.; Pietrusewicz, K.; Kujawski, K. Digital Maturity in Mapping the European Digital Innovation Hub Services. Pomiary Automatyka Robotyka 2024, 28, 125–140. [Google Scholar] [CrossRef]
- Lorencin, I.; Krčelić, G.; Blašković, L.; Žužić, A.; Licardo, J.T.; Babić, S.; Etinger, D.; Tanković, N. From Innovation to Impact: Case Studies of EDIH Adria TBI Projects. In Proceedings of the 2025 MIPRO 48th ICT and Electronics Convention; 2025; pp. 1851–1856. [Google Scholar]
- Quenum, G.G.Y.; Vallée, S.; Ertz, M. The Digital Maturity of Small- and Medium-Sized Enterprises in the Saguenay-Lac-Saint-Jean Region. Machines 2025, 13, 835. [Google Scholar] [CrossRef]
- Yezhebay, A.; Sengirova, V.; Igali, D.; Abdallah, Y.O.; Shehab, E. Digital Maturity and Readiness Model for Kazakhstan SMEs. In Proceedings of the SIST 2021 - 2021 IEEE International Conference on Smart Information Systems and Technologies; Institute of Electrical and Electronics Engineers Inc., April 28 2021. [Google Scholar]
- Omol, E.J.; Mburu, L.W.; Abuonji, P.A. Digital Maturity Assessment Model (DMAM): Assimilation of Design Science Research (DSR) and Capability Maturity Model Integration (CMMI). Digital Transformation and Society 2025, 4, 128–152. [Google Scholar] [CrossRef]
- Alqoud, A.; Milisavljevic-Syed, J.; Salonitis, K. Self-Assessment Model for Digital Retrofitting of Legacy Manufacturing Systems in the Context of Industry 4.0. International Journal of Industrial Engineering and Management 2025, 16, 316–336. [Google Scholar] [CrossRef]
- M. Saari, L.; K滗ri鋓nen, J.; Yliker鋖�, M. Maturity Model for the Manufacturing Industry with Case Experiences. Intelligent and Sustainable Manufacturing 2024, 1, 10010–10010. [Google Scholar] [CrossRef]
- Spaltini, M.; Acerbi, F.; Pinzone, M.; Gusmeroli, S.; Taisch, M. Defining the Roadmap towards Industry 4.0: The 6Ps Maturity Model for Manufacturing SMEs. In Proceedings of the Procedia CIRP; Elsevier B.V., 2022; Vol. 105; pp. 631–636. [Google Scholar]
- Krulčić, E.; Doboviček, S.; Pavletić, D.; Čabrijan, I. A MCDA Based Model for Assessing Digital Maturity in Manufacturing SMEs. Tehnicki Glasnik 2025, 19, 37–42. [Google Scholar] [CrossRef]
- Krulčić, E.; Doboviček, S.; Pavletić, D.; Čabrijan, I. A Dynamic Assessment of Digital Maturity in Industrial SMEs: An Adaptive AHP-Based Digital Maturity Model (DMM) with Customizable Weighting and Multidimensional Classification (DAMA-AHP). Technologies (Basel) 2025, 13. [Google Scholar] [CrossRef]
- Almeida, F. The Value of Digital Transformation Initiatives in Manufacturing Firms. Master Thesis, NOVA Information Management School, 2024.
- De Carolis, A.; Sassanelli, C.; Acerbi, F.; Macchi, M.; Terzi, S.; Taisch, M. The Digital REadiness Assessment MaturitY (DREAMY) Framework to Guide Manufacturing Companies towards a Digitalisation Roadmap. Int J Prod Res 2025, 63, 5555–5581. [Google Scholar] [CrossRef]
- Schuh, G.; Anderl, R.; Dumitrescu, R.; Kruger, A.; ten Hompel, M. Industrie 4.0 Maturity Index: Managing the Digital Transformation of Companies. Available online: https://en.acatech.de/publication/industrie-4-0-maturity-index-update-2020/ (accessed on 23 September 2025).
- Pandey, A.; Branson, D. 2020 Digital Operations Study for Energy: Oil and Gas. Available online: https://www.strategyand.pwc.com/gx/en/insights/2020/digital-operations-study-for-oil-and-gas/2020-digital-operations-study-for-energy-oil-and-gas.pdf (accessed on 23 September 2025).
- Deloitte Digital Maturity Model: Achieving Digital Maturity to Drive Growth. Available online: https://www.readkong.com/page/digital-maturity-model-achieving-digital-maturity-to-8032400 (accessed on 23 September 2025).
- van Tonder, C.; Bossink, B.; Schachtebeck, C.; Nieuwenhuizen, C. Key Dimensions That Measure the Digital Maturity Levels of Small and Medium-Sized Enterprises (SMEs). Journal of technology management & innovation 2024, 19, 110–130. [Google Scholar] [CrossRef]
- Durst, S.; Eðvarðsson, I.; Foli, S. Knowledge Management in SMEs: A Follow-up Literature Review. Journal of Knowledge Management 2023, 27, 25–58. [Google Scholar] [CrossRef]
- Cognet, B.; Pernot, J.-P.; Rivest, L.; Danjou, C. Systematic Comparison of Digital Maturity Assessment Models. Journal of Industrial and Production Engineering 2023, 40, 519–537. [Google Scholar] [CrossRef]
- Orošnjak, M.; Brkljač, N.; Ristić, K. Fostering Cleaner Production through the Adoption of Sustainable Maintenance: An Umbrella Review with a Questionnaire-Based Survey Analysis. Cleaner Production Letters 2025, 8, 100095. [Google Scholar] [CrossRef]
- Shi, Q.; Shen, L. Advancing Firm-Level Digital Technology Diffusion: A Hybrid Bibliometric and Framework-Based Systematic Literature Review. Systems 2025, 13, 262. [Google Scholar] [CrossRef]
- Vadana, I.-I.; Kuivalainen, O.; Torkkeli, L.; Saarenketo, S. The Role of Digitalization on the Internationalization Strategy of Born-Digital Companies. Sustainability 2021, 13, 14002. [Google Scholar] [CrossRef]
- EIB Who Is Prepared for the New Digital Age? 2019.
- McElheran, K.; Li, J.F.; Brynjolfsson, E.; Kroff, Z.; Dinlersoz, E.; Foster, L.; Zolas, N. AI Adoption in America: Who, What, and Where. J Econ Manag Strategy 2024, 33, 375–415. [Google Scholar] [CrossRef]
- Steiber, A.; Alänge, S.; Ghosh, S.; Goncalves, D. Digital Transformation of Industrial Firms: An Innovation Diffusion Perspective. European Journal of Innovation Management 2021, 24, 799–819. [Google Scholar] [CrossRef]
- Marin, R.; Santos-Arteaga, F.J.; Tavana, M.; Di Caprio, D. Value Chain Digitalization and Technological Development as Innovation Catalysts in Small and Medium-Sized Enterprises. JOURNAL OF INNOVATION & KNOWLEDGE 2023, 8. [Google Scholar] [CrossRef]
- Kalpaka, A. A Deep Dive into the Digital Maturity Assessment Tool. Available online: https://european-digital-innovation-hubs.ec.europa.eu/system/files/2023-02/dma_tool_16.02.2023_presentation.pdf (accessed on 25 September 2025).
- European Commission Digital Maturity Assessment Questionnaire for SMEs. Available online: https://european-digital-innovation-hubs.ec.europa.eu/system/files/2024-02/DMA%20Questionnaire%20for%20SMEs_EDIH_network_EN_v2.1.pdf (accessed on 25 September 2025).
- Husson, F.; Le, S.; Pages, J. Exploratory Multivariate Analysis by Example Using R; 2nd ed.; Chapman & Hall/CRC Taylor and Francis Group: Milton Park Abingdon, OX, UK, 2017.
- Husson, F.; Josse, J.; Pages, J. Principal Component Methods- Hierarchical Clustering- Partitional Clustering: Why Would We Need to Choose for Visualizing Data? 2010. [Google Scholar]
- Husson, F.; Josse, J.; Le, S.; Mazet, J. FactoMineR: Multivariate Exploratory Data Analysis and Data Mining 2024.
- Cohen, J. Statistical Power Analysis for the Behavioral Sciences; Routledge, 2013; ISBN 9781134742707.
- Faul, F.; Erdfelder, E.; Lang, A.-G.; Buchner, A. G*Power 3: A Flexible Statistical Power Analysis Program for the Social, Behavioral, and Biomedical Sciences. Behav Res Methods 2007, 39, 175–191. [Google Scholar] [CrossRef]
- Eurostat NACE Rev. 2: Statistical Classification of Economic Activities in the European Community; Luxembourg: Office for Official Publications of the European Communities, 2008. [Google Scholar]
- European Commission Commission Recommendation 2003/361/EC of 6 May 2003 Concerning the Definition of Micro, Small and Medium-Sized Enterprises. Official Journal of the European Union 2003, 124, 36–41.
- Potvin, P.J.; Schutz, R.W. Statistical Power for the Two-Factor Repeated Measures ANOVA. Behavior Research Methods, Instruments, & Computers 2000, 32, 347–356. [Google Scholar] [CrossRef]
- Boral, S.; Black, L.; Velis, C. Conceptualizing Systems Thinking and Complexity Modelling for Circular Economy Quantification: A Systematic Review and Critical Analysis 2025.
Figure 3.
Correlation Scatterplot analysis between Light DMA dimensions (Dd) and Full DMA (Totali(-d)) scores.
Figure 3.
Correlation Scatterplot analysis between Light DMA dimensions (Dd) and Full DMA (Totali(-d)) scores.
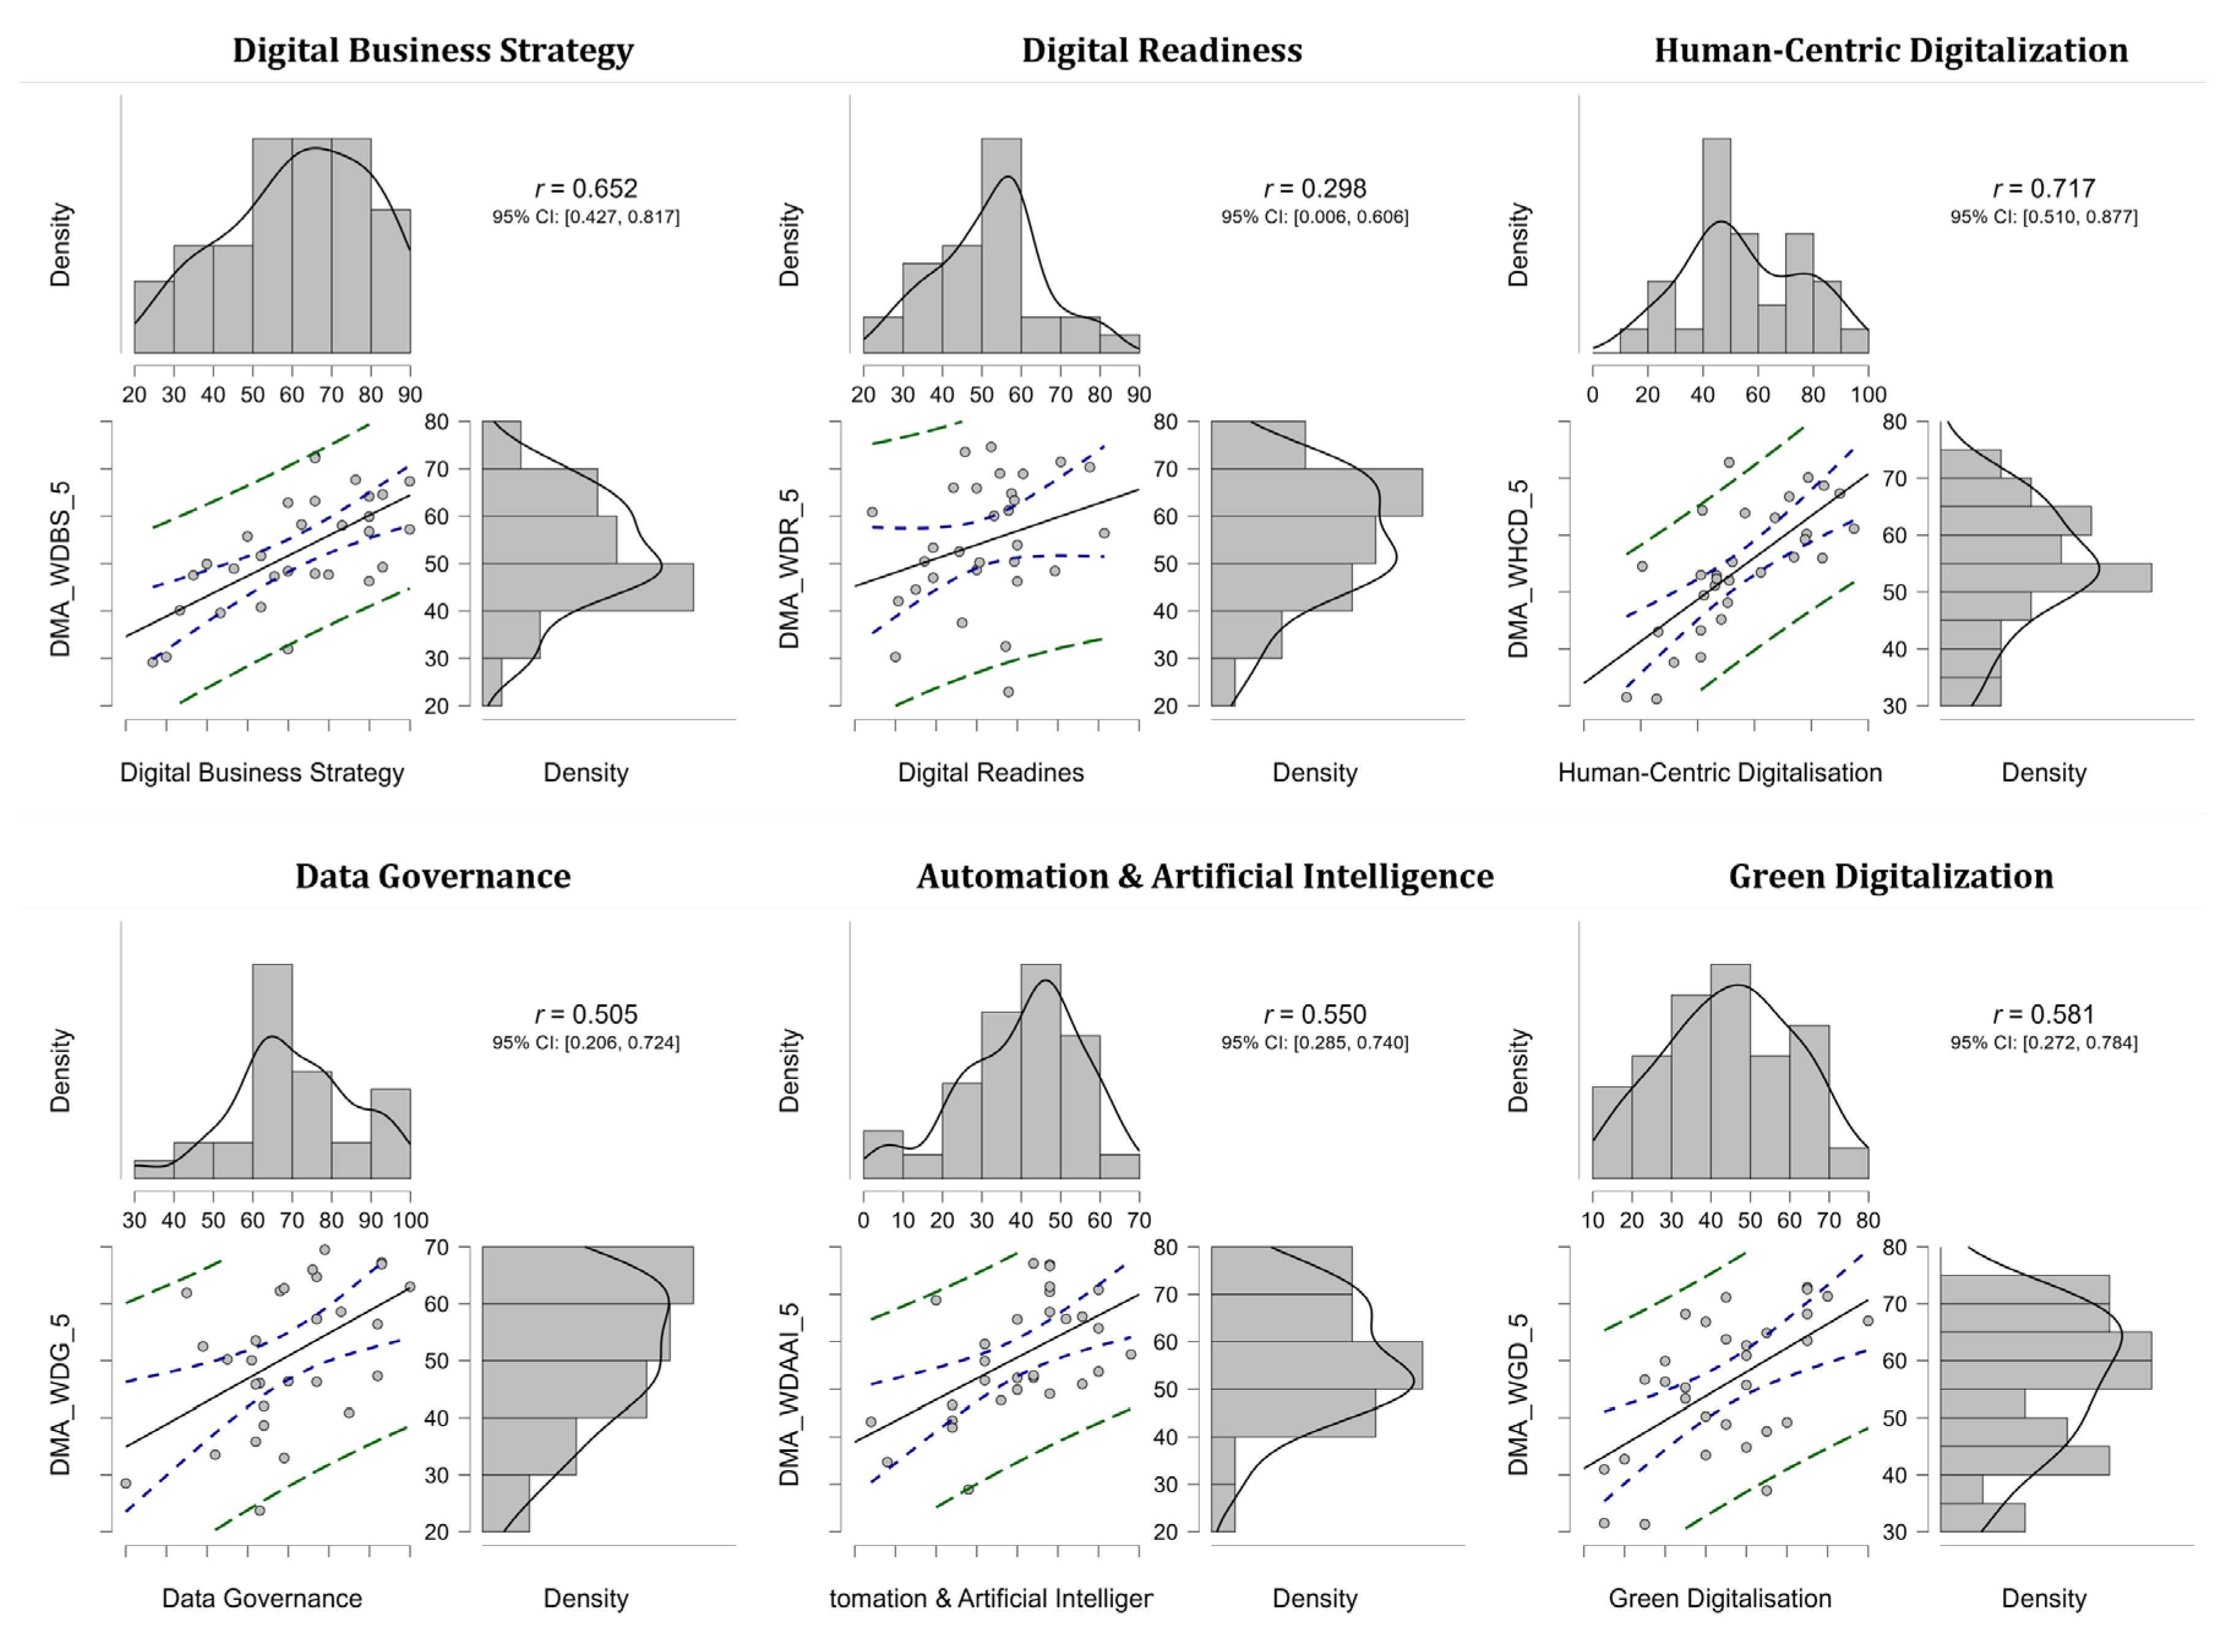
Figure 4.
Visual representation of company size comparison (y-axis), individual dimensions (x-axis).
Figure 4.
Visual representation of company size comparison (y-axis), individual dimensions (x-axis).
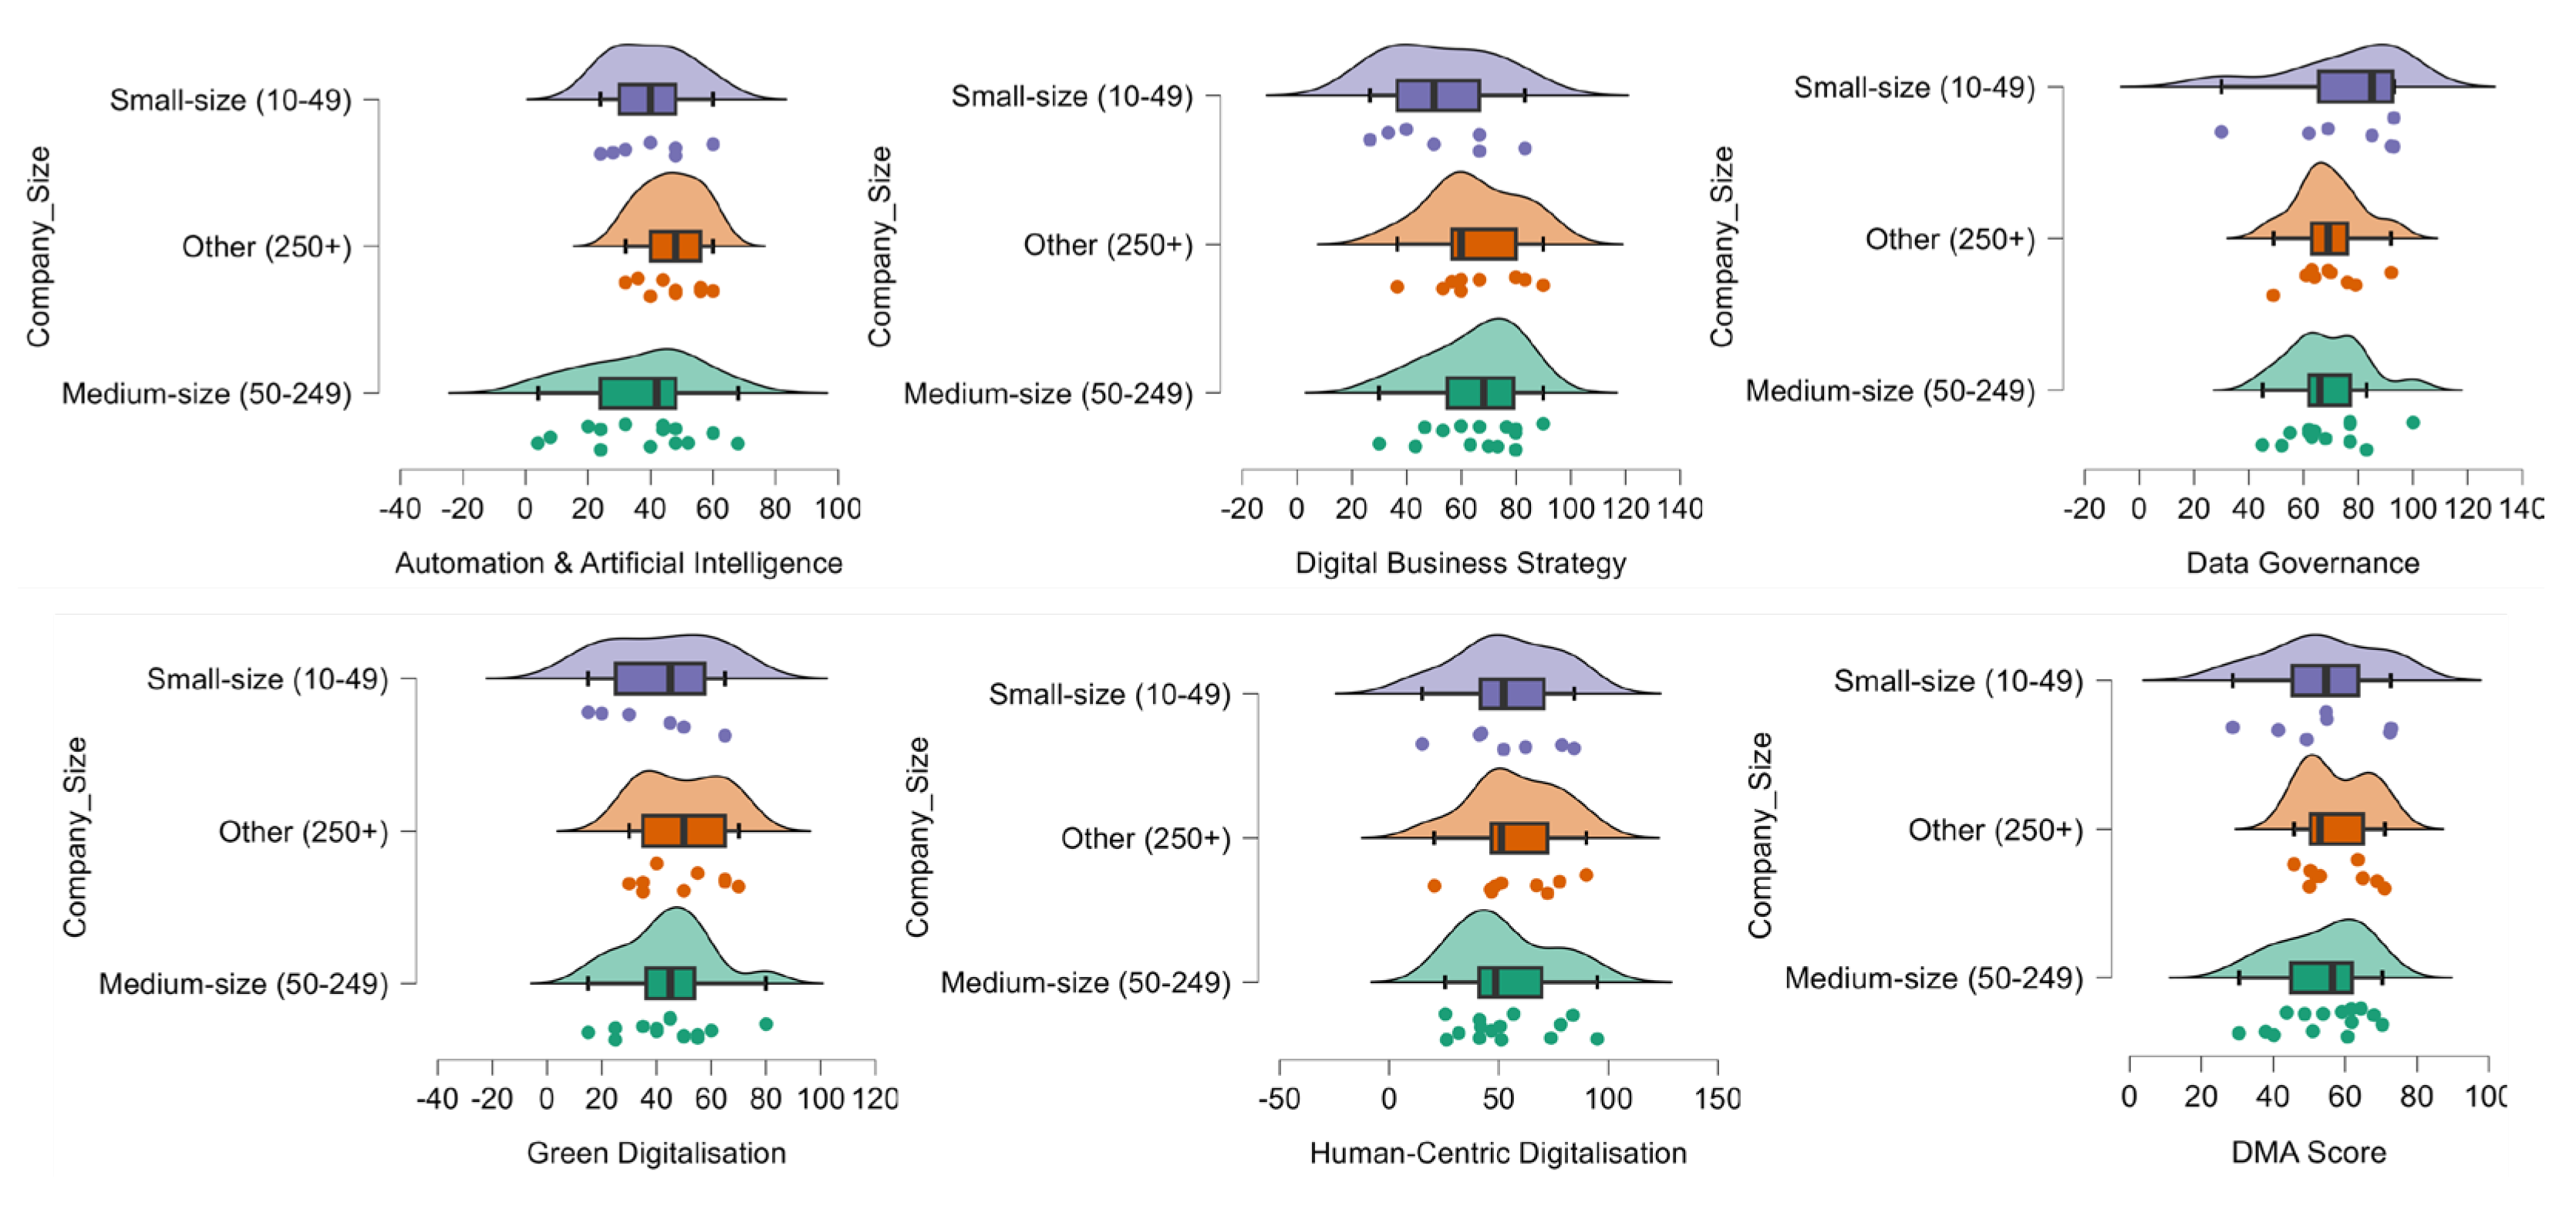
Figure 5.
Raincloud plot of repeated measures ANOVA test for within-subject comparison used on DMA dimensions (left), and QQ plot of standardised residuals vs theoretical quantiles (mid), including Mauchly’s test WM of sphericity score. Dimensions’ average scores are presented from the highest to the lowest mean score, along with the standard error (right).
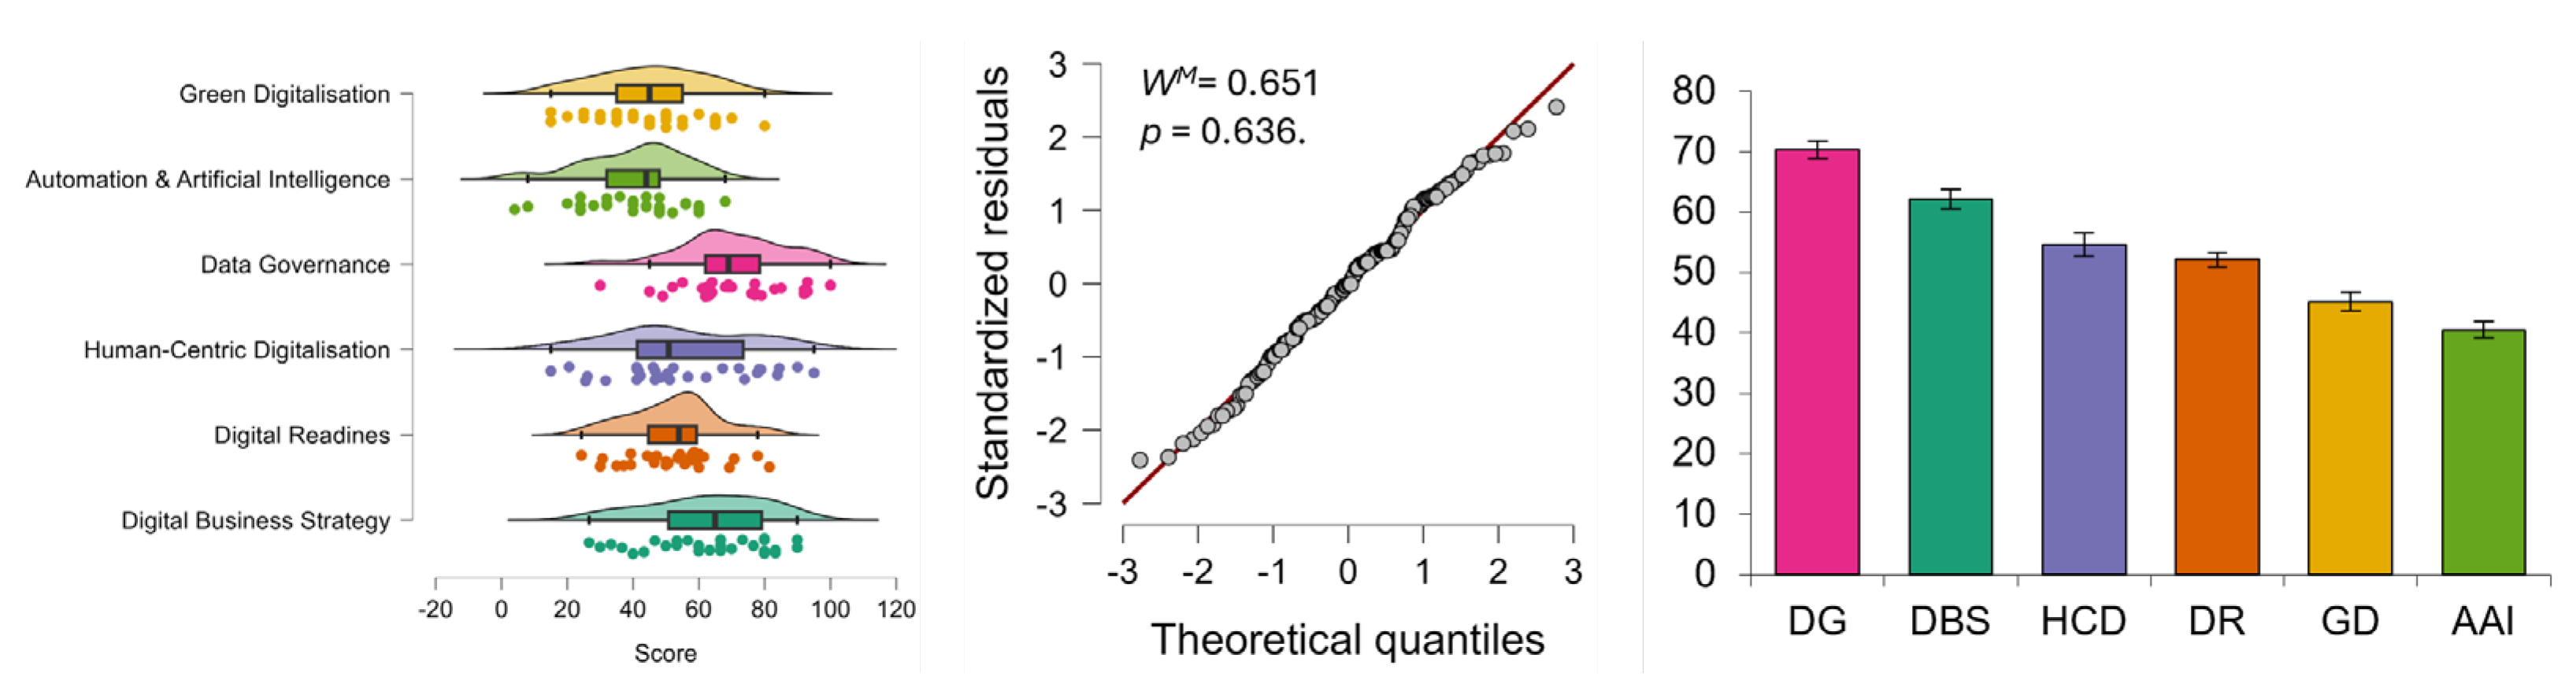
Figure 6.
Principal component with hierarchical clustering of digital maturity dimensions in Luxembourgish SMEs. PCA factor map (A) identified two cluster profiles of SMEs. The PCA scree plot (B) shows that the first two PCs account for 70.5% of the variance. The correlation map (C) reflects the projections of DMA dimensions (loadings) in the first two PCs. Dendrogram (D) illustrates the results of agglomerative hierarchical clustering (Euclidean distance and Ward clustering). Comparative analysis (E) indicated that differences (*p<0.05, **p<0.01, ***p<0.001) between clusters were most pronounced in Digital Business Strategy and Human-centric Digitalisation, positioning these as pivotal levers for advancing SME digital maturity. The overall DMA score difference (F) showed significant mean differences (Totali(C1) = 45.68; Totali(C2) = 65.31; p < 0.001).
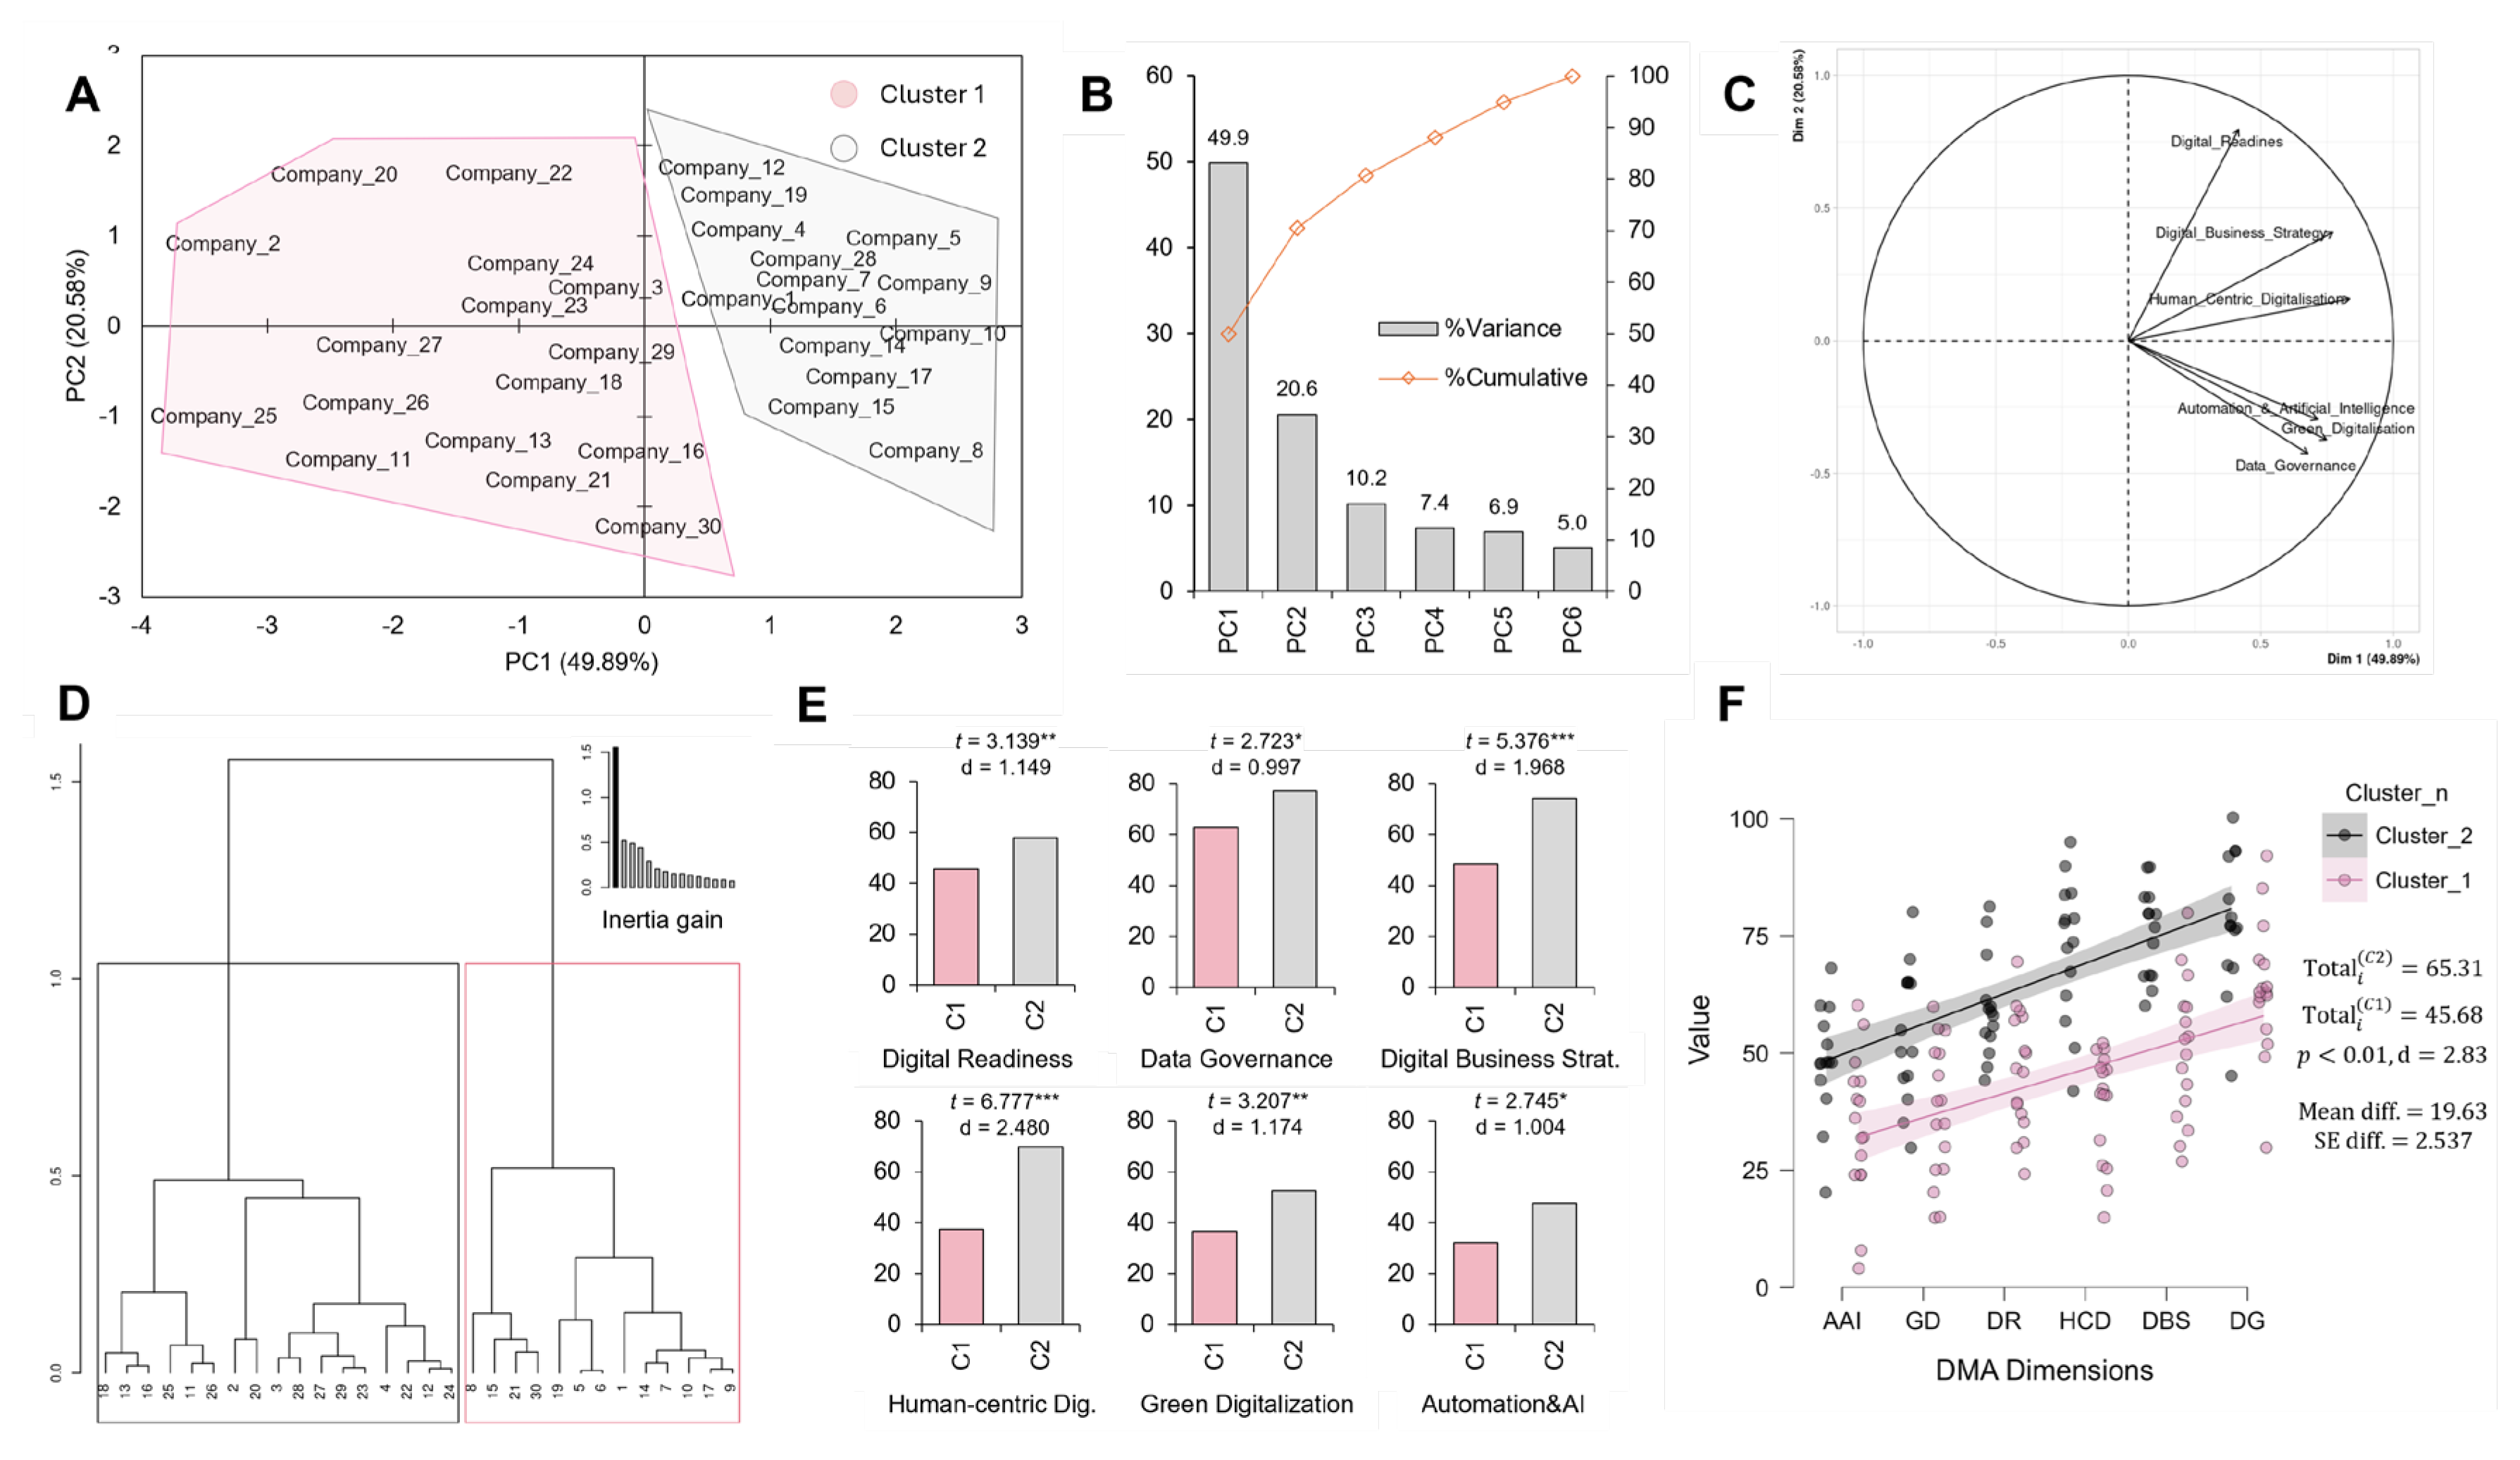

Table 1.
Meta-data of studies from the systematic review.
| Reference | Survey tool | Region | Sample pool | Sample size |
|---|---|---|---|---|
| [46] | Custom DM tool | Canada | SMEs | 30 |
| [39] | FAIR EDIH AI | Finland | SMEs | >60 |
| [29] | MADM model | Slovenia | SMEs | 7 |
| [47] | DM and Readiness | Kazakhstan | SMEs | 12 (managers) |
| [30] | SBRI DMA | Czech | SMEs | 23 |
| [48] | DMAM | Kenya | SMEs | 382 |
| [49] | Digital retrofitting | UK | SMEs | 32 |
| [50] | OSME Tool | Finland | SMEs+Large | 9 |
| [28] | DM Scan | EU (Mixed) | SMEs+Large | 70 |
| [33] | Custom DM tool | Czech | SMEs | >100 |
| [51] | 6P Maturity Model | Italy | SMEs | 9 |
| [52] | MCDA DMA | Croatia | SMEs | 3 |
| [53] | Custom DMA | Croatia | SMEs | 6 |
| [32] | Smart Readiness | Global | SMEs | Concept* |
| [54] | TOE-based survey | Portugal | SMEs+Large | 9 |
| [27] | EU indicators | EU | Enterprises | Countries† |
| [55] | DREAMY | Italy | SME+Large | 1 (380 test) |
| [37] | VTT’s VMoD | Finland | SMEs | 19 |
| [38] | VTT’s VMoD | Finland | SMEs | Concept* |
| [31] | Custom DM tool | Spain | SMEs+Large | 30 SMEs (72) |
| [40] | EU DMAT | Croatia | SMEs/PSOs | 48 SMEs/62 PSOs |
| This study | EU DMAT | Luxembourg | SMEs | 30 |
| *The survey tool is not demonstrated on a sample of studies or provides only data without stating the sample size. †The DMA analysis is performed on a sample of EU countries. | ||||
Table 2.
Descriptive statistics of the sample.
| Dimension | Med | Mean | SE | 95%CI Mean | SD | CoV | IQR | p(SW) | Range | Min | Max |
|---|---|---|---|---|---|---|---|---|---|---|---|
| DBS | 64.94 | 62.16 | 3.29 | [55.44, 68.88] | 17.99 | 0.29 | 28.31 | 0.29 | 63.27 | 26.00 | 89.00 |
| DR | 53.93 | 52.14 | 2.48 | [47.06, 57.22] | 13.60 | 0.26 | 14.64 | 0.78 | 57.14 | 24.00 | 81.00 |
| HCD | 50.83 | 54.65 | 3.91 | [46.66, 62.64] | 21.40 | 0.39 | 32.22 | 0.35 | 80.00 | 15.00 | 95.00 |
| DG | 69.00 | 70.30 | 2.90 | [64.38, 76.22] | 15.86 | 0.23 | 16.50 | 0.63 | 70.00 | 30.00 | 100.00 |
| AAI | 44.00 | 40.53 | 2.82 | [34.77, 46.29] | 15.43 | 0.38 | 16.00 | 0.37 | 64.00 | 4.00 | 68.00 |
| GD | 45.00 | 45.17 | 3.06 | [38.92, 51.42] | 16.74 | 0.37 | 20.00 | 0.78 | 65.00 | 15.00 | 80.00 |
| DMA Totali | 54.26 | 54.84 | 2.20 | [50.34, 59.35] | 12.07 | 0.22 | 15.28 | 0.96 | 44.01 | 28.00 | 72.00 |
Table 3.
Results of leave-one-out correlation and single-model regression coefficients.
| Dimension | r (β coeff.) | 95% CI [r] | R2 | adj.R2 | RMSE | SW test | p(SW) |
|---|---|---|---|---|---|---|---|
| DBS | 0.652*** | [0.43, 0.82] | 0.425 | 0.405 | 9.07 | 0.971 | 0.643 |
| DR | 0.298 | [0.01, 0.61] | 0.089 | 0.056 | 12.94 | 0.974 | 0.768 |
| HCD | 0.717*** | [0.51, 0.88] | 0.514 | 0.497 | 7.79 | 0.978 | 0.885 |
| DG | 0.505** | [0.21, 0,72] | 0.255 | 0.229 | 10.98 | 0.966 | 0.458 |
| AAI | 0.550** | [0.28, 0.74] | 0.302 | 0.277 | 10.57 | 0.965 | 0.437 |
| GD | 0.581*** | [0.27, 0.78] | 0.337 | 0.314 | 10.07 | 0.957 | 0.234 |
| *p < 0.05, **p < 0.01, ***p <0.001. | |||||||
Table 4.
Evaluating potential moderating effect of age on dimensions and overall DMA score.
| Moderator | Dimension | Pearson’s r | p value | Spearman’s ρ | p value |
|---|---|---|---|---|---|
| Age | Totali | -0.040 | 0.832 | -0.081 | 0.669 |
| Age | DBS | 0.193 | 0.306 | 0.198 | 0.295 |
| Age | DR | 0.086 | 0.650 | -0.016 | 0.933 |
| Age | HCD | -0.182 | 0.335 | -0.191 | 0.312 |
| Age | DG | -0.263 | 0.160 | -0.310 | 0.095 |
| Age | AAI | 0.068 | 0.723 | -0.006 | 0.998 |
| Age | GD | 0.025 | 0.894 | 0.060 | 0.751 |
Table 5.
Post-hoc comparison test between individual dimensions.
| Testing | Mean diff. | 95%CI Mean | SE | df | t | Cohen’s d | 95%CI Cohen d | pbonf | pholm |
|---|---|---|---|---|---|---|---|---|---|
| DBS-DR | 10.02 | [0.43, 19.60] | 2.996 | 29 | 3.343 | 0.589 | [-0.03, 1.20] | 0.034 | 0.018 |
| DBS-HCD | 7.51 | [-2.15, 17.2] | 3.022 | 29 | 2.485 | 0.442 | [-0.16, 1.04] | 0.284 | 0.095 |
| DBS-DG | -8.14 | [-19.6, 3.33] | 3.587 | 29 | -2.269 | -0.478 | [-1.18, 0.22] | 0.463 | 0.123 |
| DBS-AAI | 21.63 | [10.56, 32.7] | 3.461 | 29 | 6.248 | 1.271 | [0.43, 2.11] | < 0.001 | < 0.001 |
| DBS-GD | 16.99 | [5.86, 28.13] | 3.481 | 29 | 4.882 | 0.999 | [0.22, 1.78] | < 0.001 | < 0.001 |
| DR-HCD | -2.50 | [-14.68, 9.67] | 3.807 | 29 | -0.658 | -0.147 | [-0.87, 0.57] | 1.000 | 0.516 |
| DR-DG | -18.16 | [-30.3, -5.99] | 3.803 | 29 | -4.775 | -1.067 | [-1.91, 0.22] | < 0.001 | < 0.001 |
| DR-AAI | 11.61 | [0.35, 22.87] | 3.521 | 29 | 3.297 | 0.682 | [-0.04, 1.40] | 0.039 | 0.018 |
| DR-GD | 6.976 | [-5.10, 19.06] | 3.777 | 29 | 1.847 | 0.410 | [-0.32, 1.14] | 1.000 | 0.225 |
| HCD-DG | -15.65 | [-27.04, -4.27] | 3.559 | 29 | -4.397 | -0.920 | [-1.69, 0.15] | 0.002 | 0.001 |
| HCD-AAI | 14.11 | [2.55, 25.67] | 3.614 | 29 | 3.905 | 0.830 | [0.07, 1.59] | 0.008 | 0.005 |
| HCD-GD | 9.481 | [-2.25, 21.21] | 3.667 | 29 | 2.585 | 0.557 | [-0.17, 1.28] | 0.225 | 0.090 |
| DG-AAI | 29.77 | [19.89, 39.65] | 3.089 | 29 | 9.635 | 1.750 | [0.81, 2.69] | < 0.001 | < 0.001 |
| DG-GD | 25.13 | [15.81, 34.46] | 2.917 | 29 | 8.617 | 1.477 | [0.65, 2.30] | < 0.001 | < 0.001 |
| AAI-GD | -4.63 | [-13.38, 4.11] | 2.736 | 29 | -1.693 | -0.272 | [-0.80, 0.25] | 1.000 | 0.225 |
Disclaimer/Publisher’s Note: The statements, opinions and data contained in all publications are solely those of the individual author(s) and contributor(s) and not of MDPI and/or the editor(s). MDPI and/or the editor(s) disclaim responsibility for any injury to people or property resulting from any ideas, methods, instructions or products referred to in the content. |
© 2025 by the authors. Licensee MDPI, Basel, Switzerland. This article is an open access article distributed under the terms and conditions of the Creative Commons Attribution (CC BY) license (http://creativecommons.org/licenses/by/4.0/).
Copyright: This open access article is published under a Creative Commons CC BY 4.0 license, which permit the free download, distribution, and reuse, provided that the author and preprint are cited in any reuse.


