Submitted:
27 May 2025
Posted:
28 May 2025
You are already at the latest version
Abstract
Widespread drought conditions have increasingly affected agricultural productivity, requiring the exploration of alternative approaches for improving crop resilience, yield and quality, since plants adopt many physiological strategies to cope with challenging environments. This study evaluated the effects of a vegetal-derived protein hydrolysate (PH) applied via foliar spray or root drench on tomato plants under two irrigation levels (well-watered and stressed). Dry biomass accumulation, fruit yield, quality traits (°Brix, pH, titratable acidity, firmness, sugars), and metabolic alterations were investigated as a result of irrigation and PH treatments. Overall, sub-optimal irrigation significantly decreased plant dry biomass (-55.3 %) and fruit production (-68.8% marketable yield), and enhanced fruit quality in terms of sugar concentration and antioxidant levels. PH treatments, regardless of the application method, did not notably influence above-ground dry biomass, yield, or fruit quality, suggesting that the intensity of drought might have limited PH effectiveness. Metabolomic analysis showed higher concentrations of stress- and quality-related metabolites in tomato fruits from plants under stress, with PH not exerting significant metabolic changes in the fruits. These findings revealed the diminished effectiveness of PHs under severe drought conditions, suggesting that drought stress level needs to be taken into consideration for optimizing biostimulant efficacy.
Keywords:
water stress
; Solanum lycopersicum L.
; metabolites
; antioxidants
; fruit quality
1. Introduction
Widespread climate change has worsened the frequency and extent of drought conditions which are the cause for the reduction in agricultural productivity worldwide [1]. Limited rainfall and high temperatures often occur during key plant growing stages, exacerbating water supply issues in many agricultural regions, where irrigation resources are frequently insufficient. This is the reason why optimizing water use through improved irrigation strategies has become essential to mitigate the effects of prolonged drought periods [2].
Plants primarily suffer drought stress when subjected to prolonged low soil moisture, triggering many physiological and biochemical responses aimed at reducing oxidative damage and preserving vital functions [3,4]. Water scarcity reduces plant water use efficiency, mainly by inducing stomatal closure to limit transpiration and prevent water loss, thereby altering photosynthetic efficiency and carbon metabolism, leading to a reduction in overall plant biomass [5]. Imbalances related to photosynthesis cause a downregulation of photosystem II (PSII), resulting in an accumulation of unused electrons that are converted into reactive oxygen species (ROS), potentially damaging cellular structures [6]. Furthermore, drought stress speed up pigment degradation, especially chlorophyll [5], while other pigments such as carotenoids and antioxidants – including phenolic compounds and flavonoids – act as non-enzymatic defence mechanisms to cope with oxidative stress and enhance plant stress tolerance [7,8].
These alterations – which occur in all plants – are particularly significant when they impact horticultural crops such as tomato (Solanum lycopersicum L.), which is one of the most economically important vegetables cultivated around the world [9]. The growing demand for fresh and processed tomatoes in recent decades is driven by consumer interest in high-quality products with enhanced organoleptic and functional properties beneficial to human health [10]. Together with quality considerations, an increased concern is also related to the environmental consequences of crops cultivation, especially regarding water consumption. This is the reason for implementing efficient water supply for the growth, flowering and fruit set of tomato plants, which is essential as it impacts biomass accumulation, leaf expansion, transpiration and photosynthesis. As a matter of fact, scarce water availability can alter the architecture of roots and nutrient uptake impairing transport of essential macro- and micronutrients to fruit tissues as well [11]. Furthermore, water shortage reduces cell growth and water content in fruit, thus reducing their size and weight, putting them at risk for physiological disorders such as blossom-end rot [12]. Conversely, fruit firmness can be enhanced by lower water content because it has a direct relation with increased dry matter accumulation and tissue density that influences the mechanical resistance of the fruit. Drought affects fruit composition by altering photosynthetic activity, sugar metabolism, and carbohydrate translocation, frequently resulting in increased concentration of sugars including glucose, fructose, and sucrose - which act as osmolytes - due to decreased water content of the fruit, enhancing sweetness, flavour, and promoting increased total soluble solids (TSS), a critical quality trait in tomato [13,14]. Aside from sugar accumulation, drought stress may also enhance the accumulation of antioxidant secondary metabolites including polyphenols, flavonoids, and carotenoid pigments such as lycopene. These compounds have a protective role against oxidative stress by stabilizing reactive oxygen species (ROS) in plants and are also recognized for their health-promoting effects in human nutrition [13,14].
Considering the necessity to balance water-use efficiency, yield, and fruit quality, sustainable alternatives such as biostimulants have gained attention for their potential to promote plant tolerance to drought stress. Among biostimulants, vegetal-derived protein hydrolysates (V-PHs) have been shown to be beneficial in enhancing crop performance, especially in suboptimal growing conditions, thanks to the bioactive peptides and amino acids which are made of [15]. When applied to plants, these compounds trigger many molecular and physiological responses under water stress conditions. For example, in a tomato experiment [16], a plant-derived protein hydrolysate improved water status and pollen viability under drought conditions, resulting in higher yields compared to untreated plants. Furthermore, V-PH modulated antioxidants in both leaves and fruits, depending on the irrigation level used. Agliassa et al. [17] found that applying a V-PH to Capsicum annum L., which belongs to Solanaceae family, resulted in faster drought recovery, increased antioxidants, and a higher relative growth rate and fruit yield. Nevertheless, the efficacy of V-PHs in enhancing drought tolerance can vary in function of drought severity and duration. In a short-term experiment on tomato, the application of a Malvaceae-derived PH resulted in faster recovery after multiple water stress events, while the plant biomass, even if not significantly affected, showed a tendency to higher accumulation under stress conditions when the V-PH was applied [18]. However, such findings must be validated in long-term experiments because the ultimate target is tomato production, and under prolonged severe drought, the damage to plant metabolism and structure may be beyond a recovery point through biostimulants, resulting in significant yield loss. In terms of application method, a short-term experiment considering only the vegetative phase of tomato plants demonstrated that root drenching was more effective than foliar spraying for PHs treatments under water stress conditions [19]. However, the optimal timing and method of application – whether foliar spray or root drench – requires further investigation, particularly in the context of long-term experiments. These knowledge gaps need to be addressed for developing targeted recommendations that can maximize the benefits of biostimulants in commercial tomato production.
Given its demonstrated efficacy in a short-term experiment on tomato under water stress [18], a Malvaceae-derived protein hydrolysate (PH) was considered for this long-term study. Taking these aspects into consideration, this study aimed to assess the effect of the PH applied through foliar application or soil drenching on tomato plants grown under optimal and sub-optimal water availability conditions. The main interest was to characterize any positive effects from the biostimulant application on the yield and fruit quality for understanding how the PH and its mode of application influences plant resilience, growth, productivity and if it would influence the plant’s capacity to cope and perform under water stress.
2. Results
2.1. Fruit Yields and Harvest
Biometric measurements recorded at harvest on the dry weight (DW) of leaves, stems, fruits and above-ground biomass (Supplementary Table 1) showed that only irrigation significantly influenced these traits, as stressed plants showed reduced DW of all plant components and total biomass than those well-watered. In stressed plants, DW decreased by 56.1% in leaves, 49.8% in stems, 58.3% in fruits, and 57.2% in the above-ground biomass when compared to well-watered plants. The application of protein hydrolysate (PH) either foliarly (PH-F) or at the root level (PH-R) did not reveal a statistically significant effect on biomass accumulation when compared to the untreated plants (U) (avg. DW g/plant: leaves 123.51, stem 68.83, fruits 203.33, and above-ground biomass 396.36), nor was there any significant interaction between irrigation and biostimulant treatments.
Concerning plant yield (Table 1), stressed plants exhibited significantly lower fruit production compared to the well-watered ones, as shown in Table 1: -68.8% for marketable yield, -67.5% for total yield, -47.1% of number of marketable fruits, and -14.0% for fruit weight. Unmarketable fruits, which included rotten and underdeveloped fruits, observed a decrease of 43.3% in stressed plants. The PH treatments had no significant impact on any of the assessed parameters, nor on the interaction between irrigation and biostimulant. By averaging the results of yield indicators for treatments, marketable yield reached 2147.36 g/plant, with a total yield of 2467.19 g/plant, number of marketable fruits 129.10, fruit weight 16.27 g/fruit, and not marketable yield 319.83 g/plant.
2.2. Leaf Non-Destructive and Destructive Pigments Measurements
Except at 20 days after transplanting (DAT), chlorophyll index (Supplementary Table 2) was always significantly modulated by irrigation level, with higher chlorophyll content in stressed plants compared to well-watered plants. The interaction between irrigation and biostimulants was significant at 20, 55, and 133 DAT. Watered plants (W) treated with PH-R showed greater chlorophyll levels at 20 DAT, whereas in the other two cases (55 and 133 DAT), higher values were observed in stressed plants (S). At 55 DAT, the highest chlorophyll content was found in untreated (U) stressed plants (S*U, 0.906), followed by S*PH-R, W*U, W*PH-F, and S*PH-F (0.904, 0.861, 0.857, and 0.849, respectively). W*PH-R treated plants exhibited the lowest values (0.793). The situation evolved in the following measurements, showing a tendency for increased chlorophyll index in PH-treated plants under stress, especially with significant higher chlorophyll for S*PH-F treated plants at 133 DAT (1.253 vs 1.140 and 1.129 for S*U and S*PH-R, respectively), whereas watered treatments consistently exhibited lower values.
The mid-crop cycle pigment assessment of chlorophyll a, chlorophyll b, total chlorophyll, and carotenoids content revealed significantly higher values for all pigments in stressed plants compared to well-watered plants (Table 2). Among biostimulant treatments, plants treated with PH-R exhibited significantly increased levels of chlorophyll a, chlorophyll b, and total chlorophyll, while carotenoid values remained consistent among treatments. When combined with irrigation levels, PH-R significantly altered chlorophyll, particularly chlorophyll a and total chlorophyll in stressed plants, resulting in the highest pigment content among the treatments. A similar pattern was observed in chlorophyll b and carotenoids, although they were not significantly affected.
2.3. Fruit Quality Assessment
In Table 3 statistical analysis for fruit quality parameters (°Brix, pH, titratable acidity, dry matter, and firmness assessed at the IV truss) is shown. Irrigation had a significant impact on all measured fruit quality indicators, while PH application and its interaction with irrigation showed no significant effects. Fruits grown under water stress (S) showed higher °Brix, titratable acidity, dry matter content and firmness than fruits grown under well-watered conditions (W). The only parameter with the opposite trend was pH, which had a lower value under water stress conditions.
The diameter of tomato fruits measured on marketable fruits from the first to the last truss (I-VIII) (Supplementary Table 3) was significantly higher in watered plants than in stressed plants. The results for the biostimulant factor revealed that the PH had a significant effect on the fruit diameter only on the IV truss, with bigger fruits in plants treated with PH-R. The interaction between irrigation and biostimulant was never significant and followed the same trends as the irrigation factor.
2.4. Fruit Nutrient Content
Potassium (K), among macronutrients, and micronutrients (manganese (Mn), zinc (Zn), and copper (Cu)) were significantly affected by irrigation (Table 4). The nitrogen (N) and phosphorus (P) concentrations remained unaffected by irrigation. Fruits under well-watered conditions had higher K (50.64 g/kg DW), Mn (62.74 mg/kg DW), Zn (25.44 mg/kg DW), and Cu (5.63 mg/kg DW) compared to those grown under stress conditions, which showed reduced levels in all nutrients mentioned. The application of the protein hydrolysate (PH) significantly affected only iron (Fe), reaching the highest levels in the foliar treatment (PH-F, 325.85 mg/kg DW), while the untreated control (U) and PH applied as root drench (PH-R) showed lower concentrations (250.01 and 303.05 mg/kg DW, respectively). No statistical differences were observed in the interactions between irrigation and biostimulant treatments for any of the nutrients analyzed.
2.5. Fruit Antioxidants
The antioxidant capacity of tomato fruits was determined at mid-crop cycle by assessing the Ferric Reducing Antioxidant Power (FRAP), 2,2-diphenyl-1-picrylhydrazyl (DPPH), as well as polyphenols and flavonoids concentrations (Table 5).
FRAP resulted significantly altered both by irrigation and biostimulants, but not by their combination. FRAP was increased in stressed plants compared to well-watered plants (+14.7%), while in the case of PH treatments, foliarly-treated plants (PH-F) resulted in higher FRAP content, followed by root drench (PH-R) and untreated (U) plants (+14.4% in PH-F vs U, and +8.9% in PH-F vs PH-R). In contrast, neither of the main factors (irrigation, biostimulants) or their interaction (irrigation x biostimulant) had a significant effect on DPPH.
Polyphenols and flavonoids were significantly affected by irrigation levels, showing higher values in stressed plants. In stressed plants, polyphenols concentration in fruits increased by 6.6% and flavonoids by 17.1% when compared to well-watered plants.
Neither irrigation nor biostimulant treatment significantly altered the lycopene content, with an average value of 31.6 mg/100 g FW.
2.6. Fruit Carbohydrates
Table 6 reported the fruit concentration of soluble carbohydrates (glucose, sucrose, fructose, and their sum) and amid. Among soluble sugars, only glucose and sucrose were significantly affected by irrigation, showing different trends: glucose increased in stressed plants compared to well-watered plants (+13.9%), conversely, sucrose decreased (-34.8%). Protein hydrolysate (PH) treatments combined with irrigations levels modified glucose content, with stressed plants (S) treated with root drench (S*PH-R) showing an increase in comparison with the other combinations. Specifically, watered untreated plants (W*U) or treated with PH-R, S*U, and S*PH-F exhibited intermediate behaviour between S*PH-R (296.21 mg/g DW) and W*PH-F (208.40 mg/g DW), which had the highest and lowest glucose values. The average amid content was 5.3 mg/g DW.
2.7. Fruit Metabolomics
Metabolomics analysis was performed on marketable fruits of different treatment combinations. The analysis revealed the modulation of 278 metabolites associated with pathways involved in the development of stress resilience and fruit quality.
A first comparison was made between untreated plants under sub-optimal irrigation and untreated well-watered plants. In Figure 1 the main metabolites classes identified are shown. Amino acids such as L-proline, L-2,3-dihydrodipicolinate, and DL-Arginine increased under stress, particularly proline with a Fold Change (FC) of 1.79. Many pigments and their derivatives were also modified under stress conditions. Anthocyanins such as cyanidin 3-O-(6-O-β-D-glucosyl-2-O-β-D-xylosyl-β-D-galactoside) and apocarotenoids like 5,6-epoxy-3-hydroxy-β-ionone and β-D-glucopyranosyl abscisate (FC 1.21, 1.65, and 1.20) were significantly upregulated. Stress also increased flavonoids and flavonoid-related compounds. For example, chalcones like phlorizin, butein, and 3',5'-di-C-glucosylphloretin increased. Dihydroflavonols, such as dihydromyricetin, and flavonones, such as hesperetin-7-O-β-D-glucoside and naringin, were also upregulated. In terms of phenolic compounds, cinnamic acids and derivatives such as 1-O-feruloylglucose and 1-O-cinnamoylglucose increased significantly. Many gibberellins (A24, A34, and methyl gibberellin A9) were more abundant in stressed plants, as was jasmonic acid. Other compounds like serotonin (an indole alkaloid), phenethylamine, and 2-phenylethyl β-D-glucopyranoside (among benzene derivatives and organooxygen compounds, respectively) increased, while wax monoesters such as 2,3-dioctanoylglycerylceramide decreased.
When the metabolites of fruits of plants treated with PH both foliarly (PH-F) or as root drench (PH-R) are compared to untreated stressed fruits, no significant differences emerge on metabolic profile, as well as when watered fruits treated with PH-F or PH-R were compared to untreated watered fruits (data not shown).
3. Discussion
In the current trial, irrigation was the most important factor influencing plant biomass accumulation, both in terms of vegetal biomass and fruit production, with stressed plants producing lower dry weights of leaves, stems, fruits, and total above-ground biomass than stressed plants. Overall, the decrease in dry weight across all parameters in stressed plants confirmed that the plant growth was strongly dependent on adequate water supply. Furthermore, there was no significant difference between the biomass accumulation of the plants treated with the protein hydrolysate (PH), applied either foliarly (PH-F) or as root drench (PH-R), and the untreated control (U), suggesting that water stress impaired severely plant metabolism limiting the PH-mediated stress mitigation activity. Similarly, Patanè et al. [20] demonstrated a significant drop of total dry biomass in tomato plants (-56.3%) when a severe water deficit was imposed from early development stages, as in the current experiment, whereas the results obtained with a 50% reduced water rate from early stages or from flowering were comparable to 100% watered plants. These findings were also reflected in fruit yields.
Tomato yield showed a similar trend of plant biomass accumulation, clearly supporting the dominant effect of irrigation level on crop growth and productivity. All yield parameters were significantly reduced under water stress conditions, with an approximate 70% decrease in both marketable yield and total yield, indicating the importance of adequate water supply for fruit growth and development. The halving of the number of marketable fruits indicated a limited fruit set; additionally, while the average fruit weight decreased moderately, this was consistent with the observed improvement in fruit size and, as a result, higher fruit marketability under well-watered conditions. The protein hydrolysate (PH) used in this experiment was selected based on a previous study that demonstrated its efficacy in promoting recovery from water stress in a short-term trial on tomato [18]. Additionally, other studies have shown that biostimulant products derived from vegetal sources can help plants to mitigate the negative effects of drought. For example, protein hydrolysate-based biostimulants improved tomato yield under limited water availability (50% irrigation compared to 100% irrigation) [16], and seaweed extract from Ascophyllum nodosum applied at 50% irrigation also enhanced tomato crop performance (higher yields when compared to untreated plants) under reduced water conditions [21]. However, in the present experiment the expected improvements in tomato yield were not observed. This outcome could be attributed to the intensity of the water stress applied, which likely exceeded the PH’s capacity to enhance plant resilience under such severe conditions, despite the well-established potential of plant protein hydrolysates to improve water stress tolerance. [18,22,23]. Undeniably, under extreme drought conditions, plant functions like photosynthesis and transpiration may be seriously hindered [24], consequently affecting the plant’s ability to respond to biostimulants signals or properly uptake the bioactive compounds and distribute them for an effective use.
The dynamics of chlorophyll content measured non-destructively throughout the tomato crop cycle provided valuable insight into the physiological responses to both water availability and biostimulant treatments. At 20 days after transplanting (DAT), the significant interaction between irrigation and PH treatments had limited physiological relevance, as the effects of only two PH applications can be considered minimal. The higher chlorophyll content in watered plants treated with PH-R at this stage may have simply reflected initial variability rather than a meaningful biostimulant impact. At 55 DAT, stressed plants had higher chlorophyll levels than watered plants, which could be attributed to a compensatory response or to higher concentration in smaller leaves, as demonstrated by Rosa et al. [25], who used a handheld spectroradiometer to observe changes in tomato leaf reflectance related to chlorophyll during water scarcity. PH-F-treated stressed plants showed encouraging results, suggesting that the PH-F may have started enhancing stress tolerance mechanisms at a time when water stress had not yet imposed irreversible damage to the photosynthetic system, helping to preserve chlorophyll and reduce oxidative degradation. By the end of the trial (133 DAT), the shift to lower chlorophyll content in PH-R treated plants under stress in comparison with PH-F – which resulted in the highest chlorophyll content – suggests that foliar-applied PH may have initially supported photosynthetic pigment maintenance, but was ultimately unable to prevent stress-induced damage as drought became more severe and prolonged, in favor of a slightly better response in plant treated with root drench. Destructive measurements of chlorophyll a, chlorophyll b, total chlorophyll, and carotenoids in samples harvested at the mid-crop cycle validated non-destructive measurements made during the same period. Pigments increased significantly in water-stressed plants [26] possibly due to their higher concentrations compared to watered and more developed plants. Furthermore, among biostimulants, PH-R significantly increased levels of chlorophyll a and total chlorophyll, whereas PH-F showed lower chlorophyll content under stress, closer to levels found in watered plants. This could indicate that PH-F treated plants had a less pronounced stress response and better stress mitigation. Nevertheless, these moderate differences in chlorophyll dynamics did not translate into significant improvements in biomass accumulation or yield, further supporting that under severe and extended water stress, neither application method of PH provided a strong enough protective effect to maintain productivity.
In terms of fruit quality traits, fruits grown under water stress exhibited higher °Brix values (8.83), suggesting greater soluble sugar content due to the reduced water uptake and smaller fruit size, which typically results in enhanced fruit sweetness and flavor. Similarly, the increase in titratable acidity (4.78 vs 4.59 g L⁻¹ citric acid) in stressed fruits likely corresponded to a greater presence of organic acids, which, combined with the higher °Brix, can further improve the taste of the fruits. The lower pH in stressed fruits (4.29 vs. 4.32) was also consistent with the higher acidity, implying a higher concentration of acidic metabolites. Dry matter content, which was significantly higher under drought (9.72% vs. 9.30%), indicates a higher proportion of solids in relation to water, often associated with improved nutritional value and extended shelf life. Firmness, which is critical for transportation and shelf-life, was also higher in drought-stressed fruits (1.09 N vs. 0.95 N), likely due to reduced cell expansion and water content, which increase tissue density and resistance to deformation. These results are consistent with many studies on tomatoes, where improved quality characteristics were observed when subjected to water shortage [12,27,28]. Fruit diameter observed an isolated increase for PH-R treated plants, suggesting a potential transient benefit of root drenching. However, this effect was not sustained across trusses. The lack of significant interaction between irrigation and PH treatments supports that PH applications were not sufficient to modify fruit quality outcomes under the imposed stress conditions. Overall, while drought stress reduced fruit size, it enhanced several quality traits such as sugar content, acidity, and firmness—parameters that are particularly relevant for cherry tomato market value and consumer preferences.
On the other hand, drought stress negatively affected the nutrient composition of tomato fruits, particularly potassium (K), manganese (Mn), zinc (Zn), and copper (Cu), which were all significantly reduced under limited water availability, potentially impacting the nutritional value of tomato fruits as source of micronutrients for human diet [29]. This decline could be attributed to the constant low soil moisture during the crop cycle and reduced transpiration rates that may have impaired nutrient mobility and root structure and uptake, as well as compromised internal transport within the plant and to the fruits. For example, Mitchell et al. [30] discovered that tomato fruit K levels were significantly reduced in response to soil water deficit, affecting sugar balance in sink organs rather than net carbon accumulation, while reduced Mn, Zn, and Cu concentrations may relate more to lower yields in stressed plants that likely influenced their fruit concentrations as well [31]. This micronutrient imbalance towards lower values may have affected Fe concentration [32], which was significantly increased by the application of PH-F in comparison with untreated or root-drenched plants (PH-R). This suggest that while water deficit can disrupt the assimilation of many essential nutrients, specific biostimulant strategies (e.g. molecular signalling) may have bypassed root-related limitations, promoting direct Fe assimilation or remobilization by the leaves and old tissues, facilitating systemic translocation to developing fruits, which function as plant sink.
The results demonstrated that drought stress significantly enhanced the antioxidant potential of tomato fruits, particularly as measured by FRAP, polyphenol, and flavonoid content. The increased FRAP values in stressed plants suggest an up-regulation of antioxidant defence mechanisms in response to oxidative stress caused by limited water availability. FRAP was also significantly stimulated in plants treated with PH-F, indicating that foliar application may have further increased antioxidant capacity, possibly by promoting the synthesis of non-enzymatic antioxidants or enhancing redox homeostasis [16]. The increase in total polyphenols and flavonoids in fruits from stressed plants is in line with the higher FRAP values and reflects a typical biochemical response to the water deficit [14]. These secondary metabolites are directly involved in tomato fruit nutritional and functional quality, thereby their enhancement under water stress suggests that, despite a yield reduction, fruit quality in terms of antioxidants richness can be improved.
The carbohydrate profile of tomato fruits under water stress revealed a metabolic adjustment for enhancing osmotic regulation and stress tolerance. The higher accumulation of glucose and fructose in comparison with sucrose content suggests an active conversion of sucrose in its constituents (glucose and fructose) through enzymatic processes, with a crucial role in maintaining fruit cellular turgor and protecting cells from dehydration [33]. In particular, when observing the interaction between irrigation and PH, PH-R under stress recorded the higher values of glucose, suggesting that root drenching may further stimulate sugar metabolism, potentially influencing the expression of carbohydrate-related enzymes and enhancing the adaptive response under stress. Although fructose was not significantly affected by treatments or their combination with irrigation levels, it stayed the predominant sugar, supporting the typical sweetness profile of cherry tomato. Still, the increased levels of glucose and fructose under drought conditions may have enhanced the organoleptic quality of tomato fruits, despite the decreased yield observed in this experiment; this also indicates an adaptive response that supports the production of health-promoting antioxidants, thereby positively affecting overall fruit quality.
In terms of metabolic profiling, the comparison of untreated stressed fruits and well-watered fruits revealed the accumulation of key metabolite classes in the plant's adaptive response to drought and fruit quality. For instance, the increased levels of amino acids in stressed fruits suggest the activation of osmotic adjustments, reactive oxygen species (ROS) detoxification, and nitrogen storage, aiding to maintain the integrity of proteins and membranes during dehydration, while also serving as signalling molecules [34,35]. Among amino acids, proline notably increased, likely playing a role in stabilizing cell membranes and proteins, while also functioning as an antioxidant and signalling molecule that offers additional defence against water loss [36]. L-2,3-dihydrodipicolinate was found to participates in lysine biosynthesis, which is another compound directly involved in plant stress response and development [37]. L-arginine, one of the most versatile amino acids, was probably involved in maintaining fruit cell functions [38] or acted as a precursor of compounds such as polyamines, which actively contribute in fruit development and ripening by indirectly affecting firmness, sugar metabolism, and antioxidant capacity [39]. Notably, whereas anthocyanins such as cyanidin 3-O-(6-O-β-D-glucosyl-2-O-β-D-xylosyl-β-D-galactoside) may play a role in mechanisms of stress tolerance [40], apocarotenoids like 5,6-epoxy-3-hydroxy-β-ionone and β-D-glucopyranosyl abscisate are more closely associated with the flavor and aroma of tomato fruits, in addition to acting as signal molecules in stress responses [41,42]. The physiological function of phlorizin, classified as a dihydrochalcone, remains not completely understood; however, it is acknowledged for its positive impact on human health [43]. Interestingly, the increase in butein could be linked not only to higher cuticular wax production, which improves fruit protection, but also because as flavonoid-related compound may represent a beneficial phytochemical substance [44]. Upregulation of dihydromyricetin (a dihydroflavonol), hesperetin-7-O-β-D-glucoside, and naringin (flavonones) may indicate wider flavonoid pathway activation. 1-O-feruloylglucose and 1-O-cinnamoylglucose are glycoside derivatives of ferulic and cinnamic acids, and as part of the larger class of polyphenols [45] –together with flavonoids derivatives – further corroborate the nutritional value of tomato fruits, which may resulted improved under water deficit [46]. Other compounds possibly contributing to tomato fruit quality included serotonin, acknowledged as a beneficial compound for human health and found to accumulate particularly in fresh tomatoes [47]; vitamin C, which was also reported to increase under water stress by Conti et al. [48], is known for its beneficial role in human nutrition, while phenethylamine and 2-phenylethyl β-D-glucopyranoside play a key role in flavor volatile synthesis [49]. Conversely, the reduction of 2,3-dioctanoylglycerylceramide, a type of wax monoester, might just be linked to a transition to alternative protective mechanisms in the fruits. Some gibberellins (A23 and A34) were found to be increased, even though their reduction is usually associated with a rapid response to water stress [50], and it could be associated to the regulation of fruit ripening [51] and homeostasis with methylated forms (methyl gibberellin A9), which are known to play a direct role in stress tolerance [52], along with jasmonic acid [53]. In summary, all these metabolites highlight the potential of taking advantage from water stress to improve nutritional and organoleptic traits of tomato fruits. However, the lack of significant differences in the metabolite profiles of tomato fruits treated with PH – regardless of the application method – and untreated plants both under well-watered and stressful conditions, suggest that the PH treatments did not induce measurable metabolic changes in the fruit tissue at the time of analysis. This could relate to compromised root function which altered PH-R's potential efficacy related to overall plant stress response, while PH-F may have triggered transient changes in the plant that were not able to be captured at the fruit maturity stage. Overall, these data indicate that while PHs may change plant metabolism, the direct effects on tomato fruit biochemistry were limited under the present experimental conditions. This result reinforces the notion that sampling time and stress intensity are important factors to consider when trying to interpret the application of biostimulants, including potential changes in metabolomic analysis.
4. Materials and Methods
4.1. Plant Materials and Growth Conditions
The experiment took place in a polymethyl greenhouse at the University of Tuscia's Experimental Farm (Viterbo, Italy, 42° 25' N; 12° 08' E; 310 m a.s.l.) from February 20 to July 5, 2024. During the first month, a heating system was used to keep the temperature above 20°C at night, reducing cold stress after transplantation, while a ventilation system and side openings were automatically activated to regulate the daily air temperature when it exceeded 27° C. A sensor from Toro Company (Tempus Air MS, Bloomington, Minnesota, United States) recorded temperature trends throughout the trial, as show in the Figure 2.
Tomato seeds (Solanum lycopersicum L. - cv Pralyna, SAIS Sementi, Cesena, Italy) have been sown in trays (170 holes/tray) filled with a commercial substrate containing primarily peat moss (Brill, Georgsdorf, Germany) and grown in a glass greenhouse at 25°C with regular watering until the second true leaf reached full expansion. After one week, the seedlings were fertigated with NPK (20% N - 8.8% P - 16.6% K) at a rate of 1 g L-1. When the plants had two fully expanded leaves, they were transplanted into 9-liter pots filled with sandy loam soil (70% sand, 30% soil). Ninety-six plants were distributed using a randomized complete block design, with 8 replicates per treatment, and were pruned at the eighth truss stage. The pots were arranged in double rows, two for the stressed sector and two for the well-watered sector, with a plant density of 3.5 plant/m².
Water soil sensors (Tempus Air MS, Toro Company, Bloomington, Minnesota, United States) were placed in pots corresponding to each irrigation sector and connected to a remote platform. The substrate's water content reading ranged from 50-80% in the well-watered sector and 30-50% in the water-stressed sector. Probe reading of 80% corresponded to water container capacity whereas 30% probe reading to the temporary wilting point.
The nutrient solution (EC of 2.0 dS m-1 and a pH of 6.0), supplied through a drip irrigation system with 4 L h-1 emitters and managed through the sensors system, consisted of: N-NO3 (10 mM), P (1m M), S (1.25 mM), K (3.5 mM), Ca (3.5 mM), Mg (1.0 mM), Fe (17.1 μM), Mn (17.4 μM), Zn (3.7 μM), B (11 μM), Cu (1.9 μM), Mo (0.5 μM).
4.2. Biostimulant Application
A Malvaceae-derived protein hydrolysate (PH) was applied to plants either foliarly (PH-F) or at the root level (PH-R), and it was compared to an untreated control in both well-irrigated and stressed sectors, for a total of six treatments. The PH contained 16.9% carbon and 4.67% nitrogen as free amino acids and peptides, as reported in the aminogram by El-Nakhel et al. [54]. Regarding foliar applications, PH was applied by uniformly spraying leaves or drenching the soil with a diluted solution at a dose of 3 ml L-1, whereas the control treatment was sprayed with distilled water or manually supplied in the pots. Treatments were given every 10 days starting 20 days after transplanting (DAT) and continuing until the end of the trial.
4.3. Fruit Yields and Harvest
Tomato fruits were harvested on all plants between May 27 (97 DAT) and July 3 (134 DAT) due to scalar ripening of the tomato trusses. The yield was measured as total yield, marketable yield, number and average weight of marketable fruits, and not marketable yield (rot and underdeveloped fruits). At the end of the trial, the harvested fresh biomass (leaves and stems) was recorded and oven-dried at 65°C until it reached a constant weight for dry biomass measurement.
4.4. Leaf Non-Destructive and Destructive Pigments Measurements
Throughout the crop cycle, chlorophyll was non-destructively measured using a multi-pigment meter (MPM-100, ADC BioScientific Ltd, United Kingdom), which has an integrated clip that emits a flashing light to record pigment values as absolute units.
At mid-crop cycle and immediately before pruning (86 DAT), the fourth leaf from 8 plants per treatment was sampled, frozen in liquid nitrogen, and stored at -80°C to determine total chlorophyll, chlorophyll a, b, and carotenoids as described by Wellburn [55]. 0.1g of frozen leaf samples were extracted in acetone 80% (1:200 p/v) and homogenised using a homogenizer (IKA T10 basic UltraTurrax, IKA-Werke GmbH & Co. KG, Staufen, Germany). The extracts were centrifuged at 4800 g for 20 min. A spectrophotometer (Helios β, Thermo Fisher Scientific, Massachusetts, United States) measured the absorbance solution at 663, 647, and 470 nm to determine the concentration of chlorophyll a, b, and carotenoids expressed as mg g-1 of fresh weight (FW). Total chlorophyll was calculated as the sum of chlorophyll a and b.
4.5. Fruit Quality Assessment
Subsamples of marketable fruits of the fourth truss were selected from each treatment to evaluate fruit quality parameters. Fruit firmness was measured on the equatorial zone of three fruits per plant (8 plants/treatment) using an automatic force transducer set to 3N for tomato fruits (Instron, Pianezza, Torino, Italy), obtaining values expressed as newtons (N). On the same fruits, dry matter (DM) content was determined by oven-drying the samples at 65 °C until constant weight. Centrifuged and filtered subsamples were used for the determination of the soluble solid content (°Brix), pH and titratable acidity (TA). °Brix were assessed on the filtered juice using a digital refractometer (Atago N1, Atago Co. Ltd., Tokyo, Japan). The pH was measured with a digital pH-meter (HI-9023, Hanna Instruments, Padova, Italy), then the juice was titrated with Stadtman et al.’s method [56] using 0.1 N NaOH to reach pH 8.1.
4.6. Fruit Nutrient Content
Dried fruits samples of the third truss were used for the total nitrogen determination according to Kjeldahl method [57]. 0.25 g of each treatment replicate was digested in 10 mL of 96% sulfuric acid adding Kjeldahl catalyst tablet in Pyrex tubes. The digestion was carried out for 30 minutes at 420°C in a digestor (DK6 Velp Scientifica, Usmate Velate, Italy). The distillation was then performed using the Kjeltec 2100 (Foss Analytics), adding 50 mL of 40% NaOH. Titration was conducted with 0.1N HCl, using methyl red + bromocresol green as indicator, and the titration volume was used to calculate the nitrogen percentage, which was then converted to g kg-1 of dry weight (DW). Dried samples were also used for the elemental analysis process. Six replicates from each treatment were placed in tubes along with 65% HNO3 and MilliQ water, then digested for 40 minutes (Multiwave GO Plus, Anton Paar GmbH, Rivoli, Torino, Italy). Following digestion, the samples were thinned with 1% HNO3 and examined using an atomic emission spectrometer (4210 MP-AES, Agilent Technologies, Santa Clara, CA, United States) connected with SPS 4 Autosampler (Agilent Technologies, Santa Clara, CA, United States). A standard sample was always prepared as a reference for the elemental analysis.
4.7. Fruit Antioxidants
Subsamples of tomato fruits were collected, immediately frozen in liquid nitrogen and stored at -80°C to determine antioxidant activity through Ferric Reducing Antioxidant Power (FRAP), 2,2-diphenyl-1-picrylhydrazyl (DPPH), polyphenols and flavonoids assessment. The antioxidant capacity through FRAP and DPPH assays was evaluated through spectrophotometric measurements (Helios β, Thermo Fisher Scientific, Massachusetts, United States) extracting 0.5 g of fresh tomato samples with 5 mL of 80% methanol homogenizing with UltraTurrax (IKA T10 basic UltraTurrax, IKA-Werke GmbH & Co. KG, Staufen, Germany).
The FRAP determination [58] was adapted and consisted in the incubation of 30 μL of tomato extract with 900 μL of FRAP working solution (0.3 M acetate buffer pH 3.6, 10mM 2,4,6-tris(2-pyridyl)-s-triazine (TPTZ) in 40 mM HCl, 20 mM FeCl3 in distilled water) at 37°C for 30 minutes. The samples’ absorbance was read at a wavelength of 593 nm based on the reduction of the ferric salt (Fe3+-TPTZ (2,4,6-tripyridyl-s-triazine)) to ferrous (Fe2+-TPTZ) under acidic conditions. The DPPH determination [59] consisted in the incubation of 100 μL of extract with 800 μL of 75 mM DPPH (15 mg in 50ml 80% methanol) at room temperature for 30 minutes, and reading the extracts’ absorbance at 517 nm. For both methods the antioxidant activity was expressed as mg Trolox equivalents (TE) g−1 FW.
The extraction for polyphenols and flavonoids was carried out on 0.5g each sample in 80% ethanol for spectrophotometric measurements. Polyphenols method ([60] with modifications) involved the incubation of 200 μL of extract with 1 mL Folin and Ciocalteau’s reagent (1:5), 800 μL of 7.5% Na2CO3 at room temperature for 1h. The absorbance was recorded at 765 nm. For flavonoids quantification [61], 700 μL of extract were mixed with 150 μL of 5% NaNO2, 150 μL of 10% AlCl3 and 1 mL of 1M NaOH. Samples were centrifuged due to the formation of colloids in suspension. The supernatant was read at 510 nm. In the case of polyphenols and flavonoids the results were expressed as mg of gallic acid equivalents (GAE) g-1 FW and mg of quercetin equivalents (QE) g-1 FW, respectively.
Lycopene determination was performed as described by Adsule and Dan [62] with modifications on 8 mg of freeze-dried samples of each treatment ground with mortar and pestle and mixed with 2 mL 100% acetone. Samples were incubated at room temperature for 30 minutes, centrifuged and diluted at 1:5, then their absorbance was read at 505 nm with a spectrophotometer (Beckman DU-50 UV-visible; Beckman Instruments, Inc., Fullerton, CA, USA). Lycopene molar extinction coefficient was used to calculate samples’ lycopene content expressed as mg 100 g−1 FW.
4.8. Fruit Carbohydrates Composition
Non-structural carbohydrates (NSC) were measured using 10 mg of freeze-dried powder extracted in 50% ethanol maintained at 80 °C for 45 minutes under continuous shaking. After centrifugation, soluble sugars (glucose, fructose, and sucrose) were recovered in the supernatant, and starch remained in the pellet. The pellet was washed four times with 50 mM Na acetate buffer (pH 4.5), suspended and autoclaved at 120 °C for 45 minutes in 1 mL of the same buffer. Samples were then incubated at 50 °C for 1 h with amyloglucosidase (70 U) and α-amylase (4U) to hydrolyze the starch to glucose. A spectrophotometric coupled enzymatic assay measured the glucose produced by starch hydrolysis. The supernatant containing soluble sugars was filtered through a nylon 0.2 µm PPII syringe filter (Whatman Inc., Maidstone, UK), then analyzed through high-performance anion exchange chromatography, with pulsed amperometric detection (HPAEC-PAD), using an ICS-6000 with a dual eluent generator cartridge (EGC) module and an analytical CarboPac™ PA200 IC column for Dual EGC Mode (all equipment was ThermoFisher Scientific Dionex™, Waltham, MA, USA). Sucrose, glucose, and fructose were quantified against a carbohydrate standard curve prepared using HPLC-grade reagents (Sigma, Steinheim, Germany).
4.9. Fruit Metabolomics
Subsamples of tomato fruits at the third truss stage were frozen in liquid nitrogen and kept at -80°C for metabolomics analysis. After homogenising with UltraTurrax (IKA T25, IKA-Werke GmbH & Co. KG, Staufen, Germany), 250 mg of each treatment's samples were extracted in acidified 80% methanol for metabolites suspension, centrifuged, and filtered through a 0.22 μm cellulose membrane into vials for analysis. Untargeted metabolomic analysis and metabolite identification in sample extracts were carried out at oloBion Laboratory (Barcelona, Spain) using an ultra-high performance liquid chromatograph (UHPLC) coupled to a quadrupole-time-of-flight mass spectrometer (UHPLC/QTOF-MS) (Agilent Technologies, Santa Clara, CA, United States) according with the procedure described by Bonini et al. [63]. The detected compounds were identified and classified using the PlantCyc 16.0.2 database (Plant Metabolic Network, Michigan State University).
4.10. Statistical Analysis
A two-way analysis of variance (ANOVA) and Tukey’s post-hoc test were per-formed with R packages (RStudio Team, Wien, Austria) to assess the significance of the effects and interactions between irrigation and biostimulant treatments.
Metabolic data was processed using oloMAP 2.02 developed at the oloBion Com-pany [63].
5. Conclusions
Well-watered enhanced biomass accumulation and fruit yield as compared to stressed plants. However, water stress improved certain fruit quality traits such as sugar content, antioxidant capacity, and firmness. While previous studies with vegetal-derived protein hydrolysates (PH) proved enhanced plant resilience to drought, their application in this experiment did not produce significant improvements in biomass or fruit yield, possibly due to the severity of drought conditions that exceeded the threshold for effective biostimulant action. The PH application method (foliar or root drench) had only transient effects on physiological responses, without alleviating the effects of prolonged drought. Metabolomics analysis unravelled the increase of key metabolites involved in stress response and fruit quality, such as amino acids, antioxidants, and carotenoids-derivatives. However, PH - either foliarly or through root drenching - did not induce significant metabolic changes in fruit composition. These findings emphasize the necessity for optimizing water usage, as moderate stress conditions can enhance tomato fruit quality, additionally requiring better optimization and further exploration of PH application to fully leverage their biostimulant benefits.
Supplementary Materials
The following supporting information can be downloaded at the website of this paper posted on Preprints.org. Supplementary Table 1 Dry weight (DW) of leaves, stems, fruits and above-ground biomass of tomato plants in response to irrigation and biostimulant treatments. Above-ground biomass is the sum of leaves, stems, and fruit DW. W = watered; S = stressed; U = untreated; PH-F = foliar; PH-R = root. ns, ***, non-significant or significant at P ≤ 0.001. Values are presented as mean ± standard error. Supplementary Table 2 Non-destructive measurements of chlorophyll index with MPM100 on tomato leaves in response to irrigation and biostimulant treatments. DAT = days after transplanting; W = watered; S = stressed; U = untreated; PH-F = foliar; PH-R = root. ns, *, ***, non-significant or significant at P ≤ 0.05 or 0.001. Values are presented as mean ± standard error. Supplementary Table 3 Diameter measured on marketable fruits for all stages (I-VIII truss). W = watered; S = stressed; U = untreated; PH-F = foliar; PH-R = root. ns, **, ***, non-significant or significant at P ≤ 0.01 or 0.001. Values are presented as mean ± standard error.
Author Contributions
M.L.: Writing – review & editing, Writing – original draft, Visualization, Validation, Software, Methodology, Investigation, Formal analysis, Data curation. M.C.: Writing – review & editing, Visualization, Validation, Software, Methodology, Investigation, Formal analysis, Data curation. P.B.: Writing – review & editing, Visualization, Validation, Software, Methodology. S.P.: Writing – review & editing, Visualization, Validation, Software, Methodology, Investigation. S.M.: Writing – review & editing, Visualization, Validation, Software, Methodology, Investigation. G.C.: Writing – review & editing, Visualization, Validation, Supervision, Software, Resources, Project administration, Methodology, Investigation, Funding acquisition, Formal analysis, Data curation, Conceptualization.
Funding
The research was supported by the Ministry of University and Research (MUR) in the framework of DM 1061/2021 (PON research and innovation). This research is part of the Ph.D thesis of Marzia Leporino. The research was also partially supported by 'D.I.Ver.So.' Project of DAFNE, University of Tuscia.
Data Availability Statement
Data will be made available on request.
Conflicts of Interest
The authors declare no conflicts of interest.
References
- Furtak, K.; Wolińska, A. The Impact of Extreme Weather Events as a Consequence of Climate Change on the Soil Moisture and on the Quality of the Soil Environment and Agriculture – A Review. Catena 2023, 231. [Google Scholar] [CrossRef]
- Nikolaou, G.; Neocleous, D.; Christou, A.; Kitta, E.; Katsoulas, N. Implementing Sustainable Irrigation in Water-Scarce Regions under the Impact of Climate Change. Agronomy 2020, 10, 1–33. [Google Scholar] [CrossRef]
- Du, Y.; Zhao, Q.; Chen, L.; Yao, X.; Zhang, W.; Zhang, B.; Xie, F. Effect of Drought Stress on Sugar Metabolism in Leaves and Roots of Soybean Seedlings. Plant Physiol. Biochem. 2020, 146, 1–12. [Google Scholar] [CrossRef]
- Wahab, A.; Abdi, G.; Saleem, M.H.; Ali, B.; Ullah, S.; Shah, W.; Mumtaz, S.; Yasin, G.; Muresan, C.C.; Marc, R.A. Alleviate the Adverse Effects of Drought Stress: A Comprehensive Review. Plants 2022, 11, 1620. [Google Scholar] [CrossRef] [PubMed]
- Razi, K.; Muneer, S. Drought Stress-Induced Physiological Mechanisms, Signaling Pathways and Molecular Response of Chloroplasts in Common Vegetable Crops. Crit. Rev. Biotechnol. 2021, 41, 669–691. [Google Scholar] [CrossRef]
- Apel, K.; Hirt, H. Reactive Oxygen Species: Metabolism, Oxidative Stress, and Signal Transduction. Annu. Rev. Plant Biol. 2004, 55, 373–399. [Google Scholar] [CrossRef]
- Triantaphylidès, C.; Havaux, M. Singlet Oxygen in Plants: Production, Detoxification and Signaling. Trends Plant Sci. 2009, 14, 219–228. [Google Scholar] [CrossRef] [PubMed]
- Beveridge, T.; Loubert, E.; Harrison, J.E. Simple Measurement of Phenolic Esters in Plant Cell Walls. Food Res. Int. 2000, 33, 775–783. [Google Scholar] [CrossRef]
- Panno, S.; Davino, S.; Caruso, A.G.; Bertacca, S.; Crnogorac, A.; Mandić, A.; Noris, E.; Matić, S. A Review of the Most Common and Economically Important Diseases That Undermine the Cultivation of Tomato Crop in the Mediterranean Basin. Agronomy 2021, 11, 1–45. [Google Scholar] [CrossRef]
- Collins, E.J.; Bowyer, C.; Tsouza, A.; Chopra, M. Tomatoes : An Extensive Review of the Associated Health Their Cultivation. Biology (Basel). 2022, 11, 239. [Google Scholar]
- Kalra, A.; Goel, S.; Elias, A.A. Understanding Role of Roots in Plant Response to Drought: Way Forward to Climate-Resilient Crops. Plant Genome 2024, 17, 1–31. [Google Scholar] [CrossRef] [PubMed]
- Hou, X.; Zhang, W.; Du, T.; Kang, S.; Davies, W.J. Responses of Water Accumulation and Solute Metabolism in Tomato Fruit to Water Scarcity and Implications for Main Fruit Quality Variables. J. Exp. Bot. 2020, 71, 1249–1264. [Google Scholar] [CrossRef] [PubMed]
- Barbagallo, R.N.; Di Silvestro, I.; Patanè, C. Yield, Physicochemical Traits, Antioxidant Pattern, Polyphenol Oxidase Activity and Total Visual Quality of Field-Grown Processing Tomato Cv. Brigade as Affected by Water Stress in Mediterranean Climate. J. Sci. Food Agric. 2013, 93, 1449–1457. [Google Scholar] [CrossRef]
- Jin, N.; Jin, L.; Wang, S.; Meng, X.; Ma, X.; He, X.; Zhang, G.; Luo, S.; Lyu, J.; Yu, J. A Comprehensive Evaluation of Effects on Water-Level Deficits on Tomato Polyphenol Composition, Nutritional Quality and Antioxidant Capacity. Antioxidants 2022, 11. [Google Scholar] [CrossRef]
- Colla, G.; Rouphael, Y.; Canaguier, R.; Svecova, E.; Cardarelli, M. Biostimulant Action of a Plant-Derived Protein Hydrolysate Produced through Enzymatic Hydrolysis. Front. Plant Sci. 2014, 5, 1–6. [Google Scholar] [CrossRef]
- Francesca, S.; Cirillo, V.; Raimondi, G.; Maggio, A.; Barone, A.; Rigano, M.M. A Novel Protein Hydrolysate-Based Biostimulant Improves Tomato Performances under Drought Stress. Plants 2021, 10, 1–6. [Google Scholar] [CrossRef]
- Agliassa, C.; Mannino, G.; Molino, D.; Cavalletto, S.; Contartese, V.; Margherita, C.; Secchi, F. A New Protein Hydrolysate-Based Biostimulant Applied by Fertigation Promotes Relief from Drought Stress in Capsicum Annuum L. Plant Physiol. Biochem. 2021, 166, 1076–1086. [Google Scholar] [CrossRef] [PubMed]
- Leporino, M.; Rouphael, Y.; Bonini, P.; Colla, G.; Cardarelli, M. Protein Hydrolysates Enhance Recovery from Drought Stress in Tomato Plants: Phenomic and Metabolomic Insights. Front. Plant Sci. 2024, 15, 1–13. [Google Scholar] [CrossRef]
- Paul, K.; Sorrentino, M.; Lucini, L.; Rouphael, Y.; Cardarelli, M.; Bonini, P.; Miras Moreno, M.B.; Reynaud, H.; Canaguier, R.; Trtílek, M.; et al. A Combined Phenotypic and Metabolomic Approach for Elucidating the Biostimulant Action of a Plant-Derived Protein Hydrolysate on Tomato Grown under Limited Water Availability. Front. Plant Sci. 2019, 10. [Google Scholar] [CrossRef]
- Patanè, C.; Tringali, S.; Sortino, O. Effects of Deficit Irrigation on Biomass, Yield, Water Productivity and Fruit Quality of Processing Tomato under Semi-Arid Mediterranean Climate Conditions. Sci. Hortic. (Amsterdam). 2011, 129, 590–596. [Google Scholar] [CrossRef]
- Ahmed, M.; Ullah, H.; Piromsri, K.; Tisarum, R.; Cha-um, S.; Datta, A. Effects of an Ascophyllum Nodosum Seaweed Extract Application Dose and Method on Growth, Fruit Yield, Quality, and Water Productivity of Tomato under Water-Deficit Stress. South African J. Bot. 2022, 151, 95–107. [Google Scholar] [CrossRef]
- Colla, G.; Nardi, S.; Cardarelli, M.; Ertani, A.; Lucini, L.; Canaguier, R.; Rouphael, Y. Protein Hydrolysates as Biostimulants in Horticulture. Sci. Hortic. (Amsterdam). 2015, 196, 28–38. [Google Scholar] [CrossRef]
- Petrozza, A.; Santaniello, A.; Summerer, S.; Di, G.; Di, D.; Paparelli, E.; Piaggesi, A.; Perata, P.; Cellini, F. Physiological Responses to Megafol ® Treatments in Tomato Plants under Drought Stress : A Phenomic and Molecular Approach. Sci. Hortic. (Amsterdam). 2014, 174, 185–192. [Google Scholar] [CrossRef]
- Zhao, W.; Liu, L.; Shen, Q.; Yang, J.; Han, X.; Tian, F.; Wu, J. Effects of Water Stress on Photosynthesis, Yield, and Water Use Efficiency in Winter Wheat. Water (Switzerland) 2020, 12, 1–19. [Google Scholar] [CrossRef]
- Rosa, A.P.; Barão, L.; Chambel, L.; Cruz, C.; Santana, M.M. Early Identification of Plant Drought Stress Responses: Changes in Leaf Reflectance and Plant Growth Promoting Rhizobacteria Selection-The Case Study of Tomato Plants. Agronomy 2023, 13. [Google Scholar] [CrossRef]
- Makela, P.; Karkkainen, J.; Somersalo, S. Effect of Glycinebetaine on Chloroplast Ultrastructure, Chlorophyll and Protein Content, and RuBPCO Activities in Tomato Grown under Drought or Salinity. Biol. Plant. 2000, 43, 471–475. [Google Scholar] [CrossRef]
- Ripoll, J.; Urban, L.; Brunel, B.; Bertin, N. Water Deficit Effects on Tomato Quality Depend on Fruit Developmental Stage and Genotype. J. Plant Physiol. 2016, 190, 26–35. [Google Scholar] [CrossRef]
- Mitchell, J.P.; Shennan, C.; Grattan, S.R.; May, D.M. Tomato Fruit Yields and Quality under Water Deficit and Salinity. J. Am. Soc. Hortic. Sci. 2019, 116, 215–221. [Google Scholar] [CrossRef]
- Levander, O.A. Fruit and Vegetable Contributions to Dietary Mineral Intake in Human Health and Disease. HortScience 1990, 25, 1486–1488. [Google Scholar] [CrossRef]
- Mitchell, J.P.; Shennan, C.; Grattan, S.R. Developmental Changes in Tomato Fruit Composition in Response to Water Deficit and Salinity. Physiol. Plant. 1991, 83, 177–185. [Google Scholar] [CrossRef]
- Ahmed, N.; Zhang, B.; Chachar, Z.; Li, J.; Xiao, G.; Wang, Q.; Hayat, F.; Deng, L.; Narejo, M. un N.; Bozdar, B.; et al. Micronutrients and Their Effects on Horticultural Crop Quality, Productivity and Sustainability. Sci. Hortic. (Amsterdam). 2024, 323, 112512. [Google Scholar] [CrossRef]
- Rai, S.; Singh, P.K.; Mankotia, S.; Swain, J.; Satbhai, S.B. Iron Homeostasis in Plants and Its Crosstalk with Copper, Zinc, and Manganese. Plant Stress 2021, 1, 100008. [Google Scholar] [CrossRef]
- Luo, A.; Zhou, C.; Chen, J. The Associated With Carbon Conversion Rate and Source–Sink Enzyme Activity in Tomato Fruit Subjected to Water Stress and Potassium Application. Front. Plant Sci. 2021, 12, 1–18. [Google Scholar] [CrossRef]
- Singh, P.; Choudhary, K.K.; Chaudhary, N.; Gupta, S.; Sahu, M.; Tejaswini, B.; Sarkar, S. Salt Stress Resilience in Plants Mediated through Osmolyte Accumulation and Its Crosstalk Mechanism with Phytohormones. Front. Plant Sci. 2022, 13. [Google Scholar] [CrossRef]
- Rai, V.K. Role of Amino Acids in Plant Responses to Stress. Biol. Plant. 2002, 45, 481–487. [Google Scholar] [CrossRef]
- Kishor, P.B.K.; Hima Kumari, P.; Sunita, M.S.L.; Sreenivasulu, N. Role of Proline in Cell Wall Synthesis and Plant Development and Its Implications in Plant Ontogeny. Front. Plant Sci. 2015, 6, 1–17. [Google Scholar] [CrossRef] [PubMed]
- Galili, G.; Tang, G.; Zhu, X.; Gakiere, B. Lysine Catabolism: A Stress and Development Super-Regulated Metabolic Pathway. Curr. Opin. Plant Biol. 2001, 261–266. [Google Scholar] [CrossRef]
- Zhang, X.; Ji, N.; Zhen, F.; Ren, P.; Li, F. Metabolism of Endogenous Arginine in Tomato Fruit Harvested at Different Ripening Stages. Sci. Hortic. (Amsterdam). 2014, 179, 349–355. [Google Scholar] [CrossRef]
- Gao, F.; Mei, X.; Li, Y.; Guo, J.; Shen, Y. Update on the Roles of Polyamines in Fleshy Fruit Ripening, Senescence, and Quality. Front. Plant Sci. 2021, 12, 1–10. [Google Scholar] [CrossRef]
- Dabravolski, S.A.; Isayenkov, S.V. The Role of Anthocyanins in Plant Tolerance to Drought and Salt Stresses. Plants 2023, 12. [Google Scholar] [CrossRef]
- Hou, X.; Rivers, J.; León, P.; McQuinn, R.P.; Pogson, B.J. Synthesis and Function of Apocarotenoid Signals in Plants. Trends Plant Sci. 2016, 21, 792–803. [Google Scholar] [CrossRef] [PubMed]
- Simkin, A.J. Carotenoids and Apocarotenoids in Planta: Their Role in Plant Development, Contribution to the Flavour and Aroma of Fruits and Flowers, and Their Nutraceutical Benefits. Plants 2021, 10. [Google Scholar] [CrossRef]
- Gosch, C.; Halbwirth, H.; Stich, K. Phloridzin: Biosynthesis, Distribution and Physiological Relevance in Plants. Phytochemistry 2010, 71, 838–843. [Google Scholar] [CrossRef]
- Schijlen, E.; Ric De Vos, C.H.; Jonker, H.; Van Den Broeck, H.; Molthoff, J.; Van Tunen, A.; Martens, S.; Bovy, A. Pathway Engineering for Healthy Phytochemicals Leading to the Production of Novel Flavonoids in Tomato Fruit. Plant Biotechnol. J. 2006, 4, 433–444. [Google Scholar] [CrossRef]
- Tohge, T.; Scossa, F.; Wendenburg, R.; Frasse, P.; Balbo, I.; Watanabe, M.; Alseekh, S.; Jadhav, S.S.; Delfin, J.C.; Lohse, M.; et al. Exploiting Natural Variation in Tomato to Define Pathway Structure and Metabolic Regulation of Fruit Polyphenolics in the Lycopersicum Complex. Mol. Plant 2020, 13, 1027–1046. [Google Scholar] [CrossRef]
- Dere, S.; Kusvuran, S.; Dasgan, H.Y. Does Drought Increase the Antioxidant Nutrient Capacity of Tomatoes? Int. J. Food Sci. Technol. 2022, 6633–6645. [Google Scholar] [CrossRef]
- Hano, S.; Shibuya, T.; Imoto, N.; Ito, A.; Imanishi, S.; Aso, H.; Kanayama, Y. Scientia Horticulturae Serotonin Content in Fresh and Processed Tomatoes and Its Accumulation during Fruit Development. Sci. Hortic. (Amsterdam). 2017, 214, 107–113. [Google Scholar] [CrossRef]
- Conti, V.; Romi, M.; Guarnieri, M.; Cantini, C.; Cai, G. Italian Tomato Cultivars under Drought Stress Show Different Content of Bioactives in Pulp and Peel of Fruits. Foods 2022, 11. [Google Scholar] [CrossRef] [PubMed]
- Tieman, D.; Taylor, M.; Schauer, N.; Fernie, A.R.; Hanson, A.D.; Klee, H.J. Tomato Aromatic Amino Acid Decarboxylases Participate in Synthesis of the Flavor Volatiles 2-Phenylethanol and 2-Phenylacetaldehyde. Proc. Natl. Acad. Sci. U. S. A. 2006, 103, 8287–8292. [Google Scholar] [CrossRef]
- Shohat, H.; Eliaz, N.I.; Weiss, D. Gibberellin in Tomato : Metabolism, Signaling and Role in Drought Responses. Mol. Hortic. 2021, 1–12. [Google Scholar] [CrossRef]
- Park, M.; Malka, S.K. Gibberellin Delays Metabolic Shift during Tomato Ripening by Inducing Auxin Signaling. Front. Plant Sci. 2022, 1–14. [Google Scholar] [CrossRef] [PubMed]
- Nir, I.; Moshelion, M.; Weiss, D.; Transferase, M. The Arabidopsis GIBBERELLIN METHYL TRANSFERASE 1 Suppresses Gibberellin Activity, Reduces Whole-Plant Transpiration and Promotes Drought Tolerance in Transgenic Tomato. Plant, Cell Environ. 2014, 113–123. [Google Scholar] [CrossRef] [PubMed]
- Zhao, W.; Huang, H.; Jingjing, W.; Xiaoyun, W.; Bingqin, X.; Xuehui, Y.; Lulu, S.; Rui, Y.; Jianli, W.; Aidong, S.; et al. Jasmonic Acid Enhances Osmotic Stress Responses by MYC2- Mediated Inhibition of Protein Phosphatase 2C1 and Response Regulators 26 Transcription Factor in Tomato. Plant J. 2023, 546–561. [Google Scholar] [CrossRef]
- El-Nakhel, C.; Cristofano, F.; Colla, G.; Pii, Y.; Secomandi, E.; De Gregorio, M.; Buffagni, V.; Garcia-Perez, P.; Lucini, L.; Rouphael, Y. Vegetal-Derived Biostimulants Distinctively Command the Physiological and Metabolomic Signatures of Lettuce Grown in Depleted Nitrogen Conditions. Sci. Hortic. (Amsterdam). 2023, 317, 112057. [Google Scholar] [CrossRef]
- Wellburn, A.R. The Spectral Determination of Chlorophylls a and b, as Well as Total Carotenoids, Using Various Solvents with Spectrophotometers of Different Resolution. J. Plant Physiol. 1994, 144, 307–313. [Google Scholar] [CrossRef]
- Stadtman, F.H.; Buhlert, J.E.; Marsh, G.L. Titratable Acidity of Tomato Juice As Affected By Break Procedure. J. Food Sci. 1977, 42, 379–382. [Google Scholar] [CrossRef]
- Bremner, J.M. Total Nitrogen. Am. Soc. Agron. 1965, 1049–1178. [Google Scholar]
- Benzie, I.F.F.; Strain, J.J. The Ferric Reducing Ability of Plasma (FRAP) as a Measure of ‘“Antioxidant Power”’: The FRAP Assay. Verh. Dtsch. Ges. Inn. Med. 1967, 73, 366–369. [Google Scholar] [CrossRef]
- Brand-Williams, W.; Cuvelier, M.E.; Berset, C. Use of a Free Radical Method to Evaluate Antioxidant Activity. LWT - Food Sci. Technol. 1995, 28, 25–30. [Google Scholar] [CrossRef]
- Lombardo, S.; Pandino, G.; Ierna, A.; Mauromicale, G. Variation of Polyphenols in a Germplasm Collection of Globe Artichoke. Food Res. Int. 2012, 46, 544–551. [Google Scholar] [CrossRef]
- Zhishen, J.; Mengcheng, T.; Jianming, W. The Determination of Flavonoid Contents in Mulberry and Their Scavenging Effects on Superoxide Radicals. Food Chem. 1999, 64, 555–559. [Google Scholar] [CrossRef]
- Adsule, P.; Dan, A. Simplified Extraction Procedure in the Rapid Spectrophotometric Method for Lycopene Estimation in Tomato. J. Food Sci. Technol. 1979, 16. [Google Scholar]
- Bonini, P.; Kind, T.; Tsugawa, H.; Barupal, D.K.; Fiehn, O. Retip: Retention Time Prediction for Compound Annotation in Untargeted Metabolomics. Anal. Chem. 2020, 92, 7515–7522. [Google Scholar] [CrossRef] [PubMed]
Figure 1.
Metabolites classes identified through chemical enrichment in the comparison between untreated stressed and watered tomato fruits. The figure displays the log2(FC) mean and the -log10(p-value) mean of the metabolites grouped by class. Each dot's size represents the sum of the fold change (FC) of the class. A log2(FC) mean greater than 0 indicates up-regulation of the class, while a value lower than 0 indicates down-regulation. Moving to the right on the x-axis, the -log10(p-value) mean corresponds to a higher significance in metabolite changes.
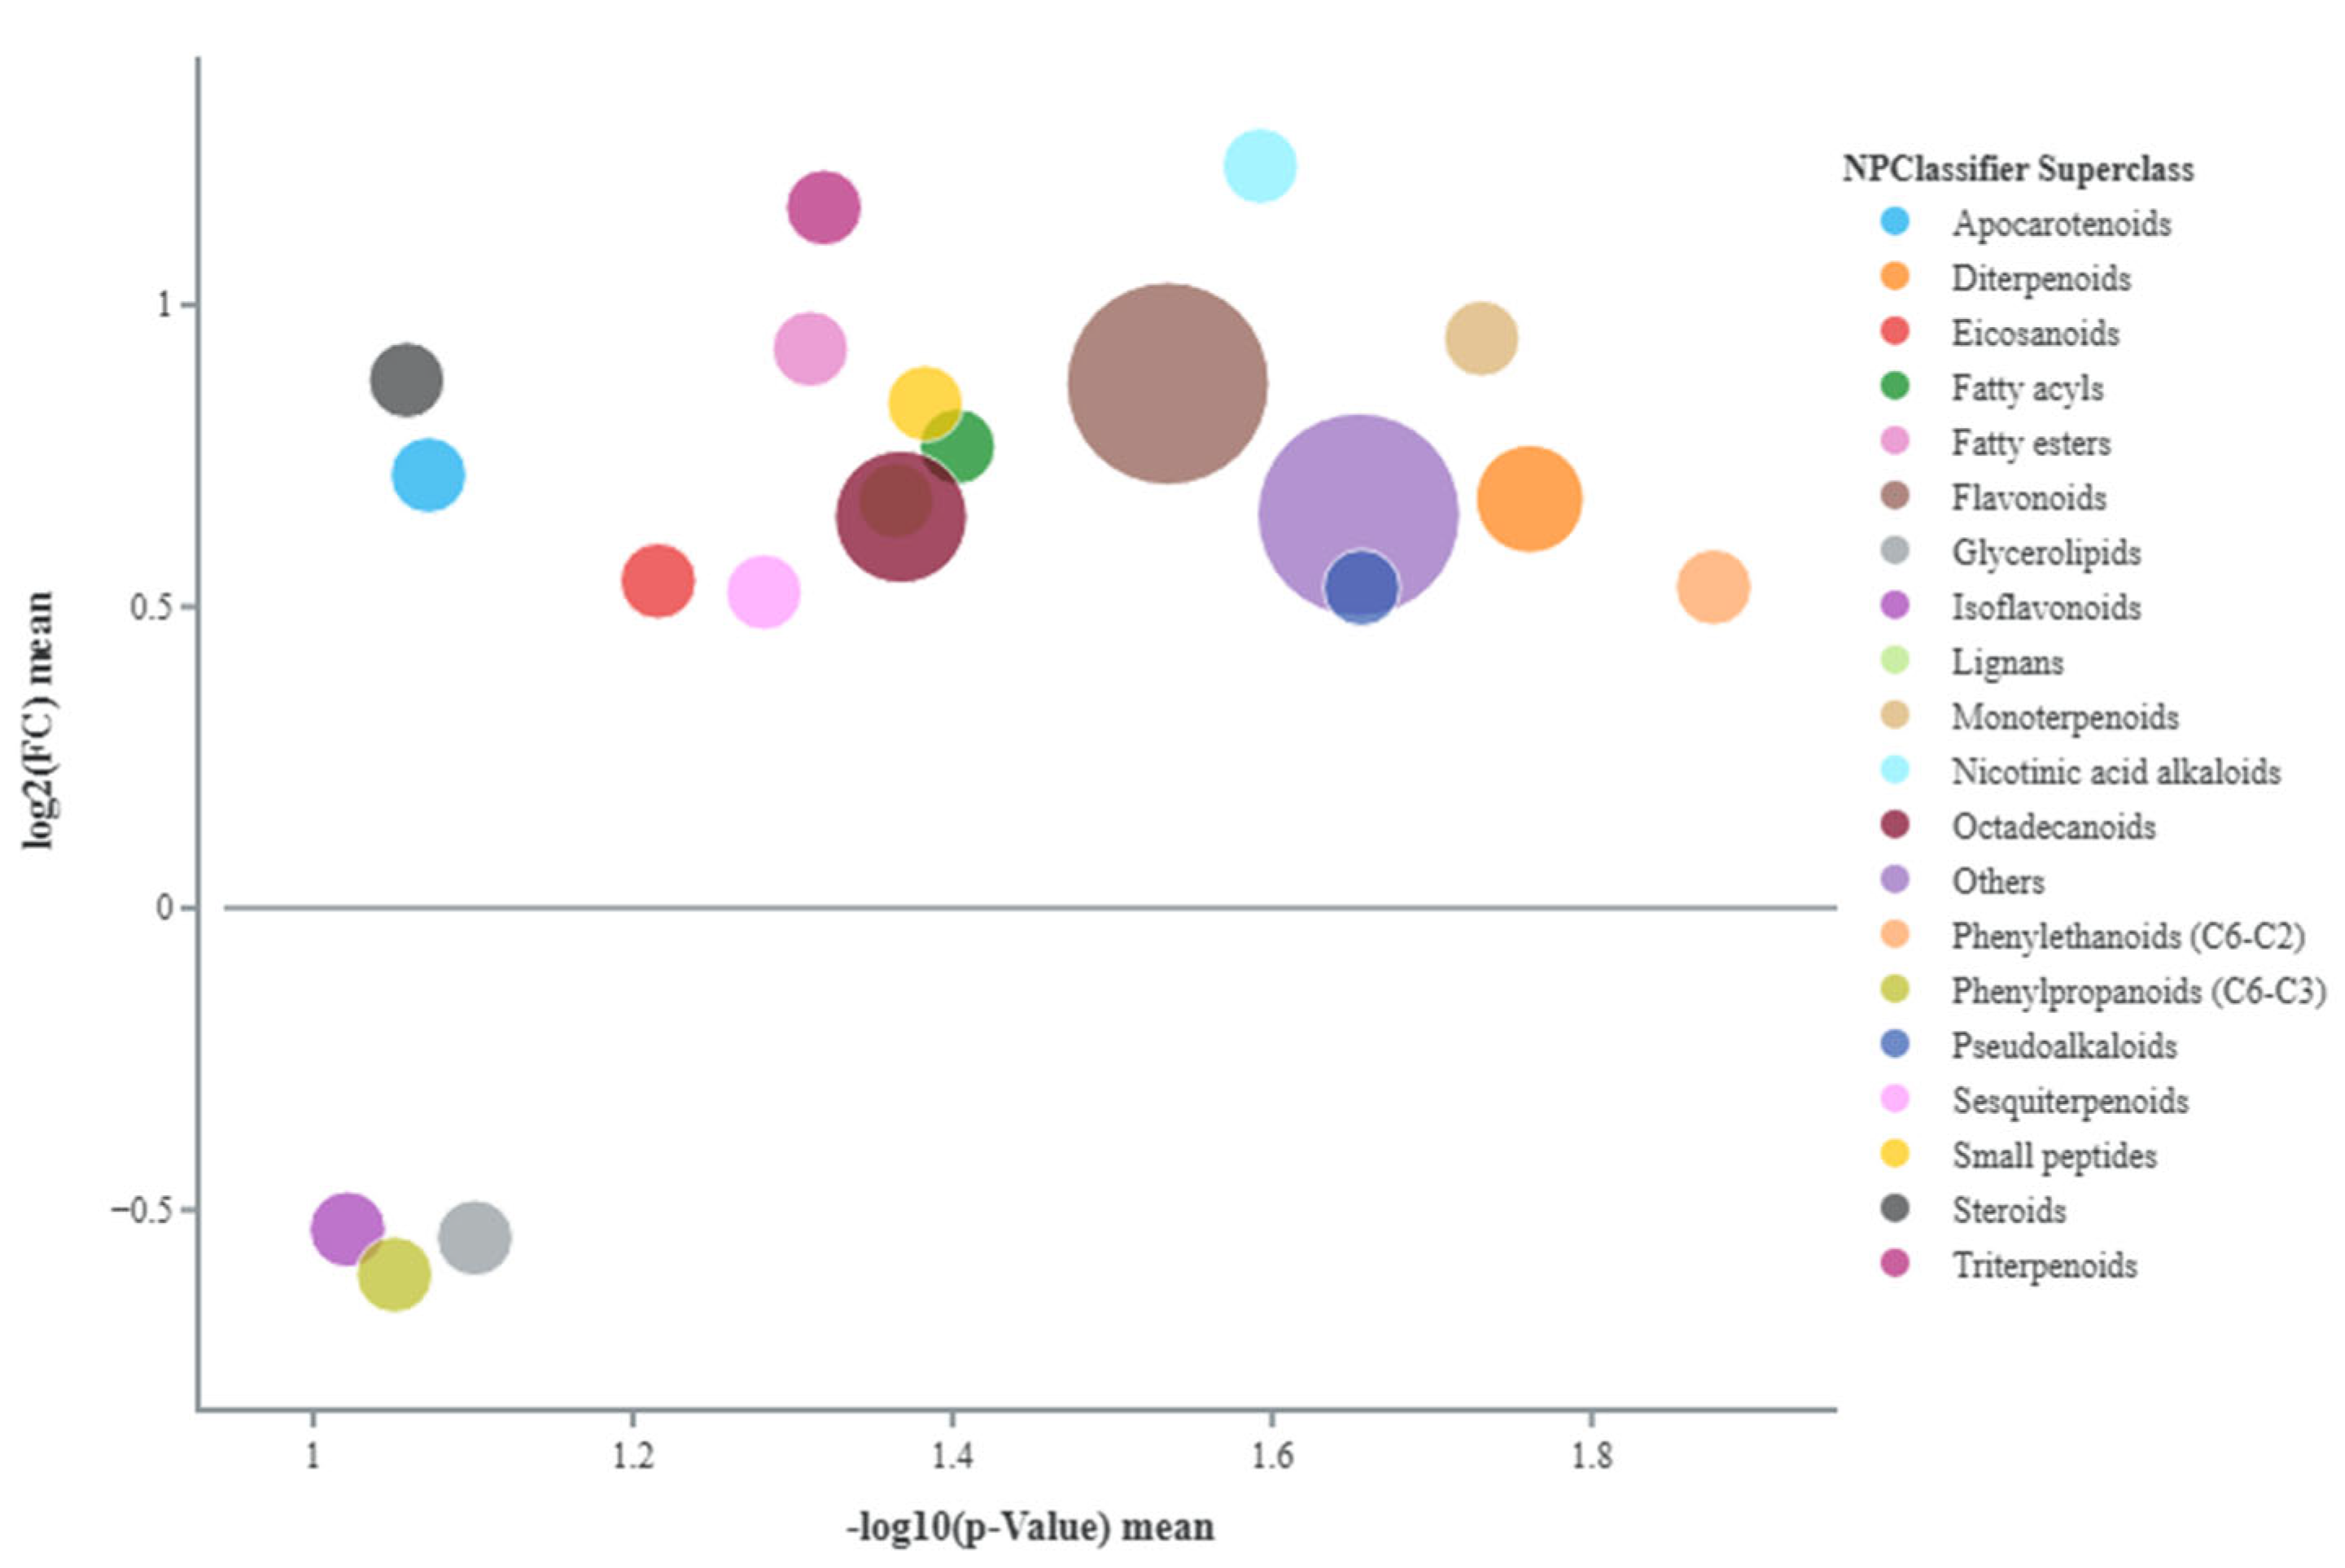
Figure 2.
Temperature (°C) mesaured during the crop cycle. The grey line represents the raw temperature readings, while the red line illustrates a smoothed trend calculated as LOESS (Locally Estimated Scatterplot Smoothing) by using local regression on the daily temperature recordings.
Figure 2.
Temperature (°C) mesaured during the crop cycle. The grey line represents the raw temperature readings, while the red line illustrates a smoothed trend calculated as LOESS (Locally Estimated Scatterplot Smoothing) by using local regression on the daily temperature recordings.
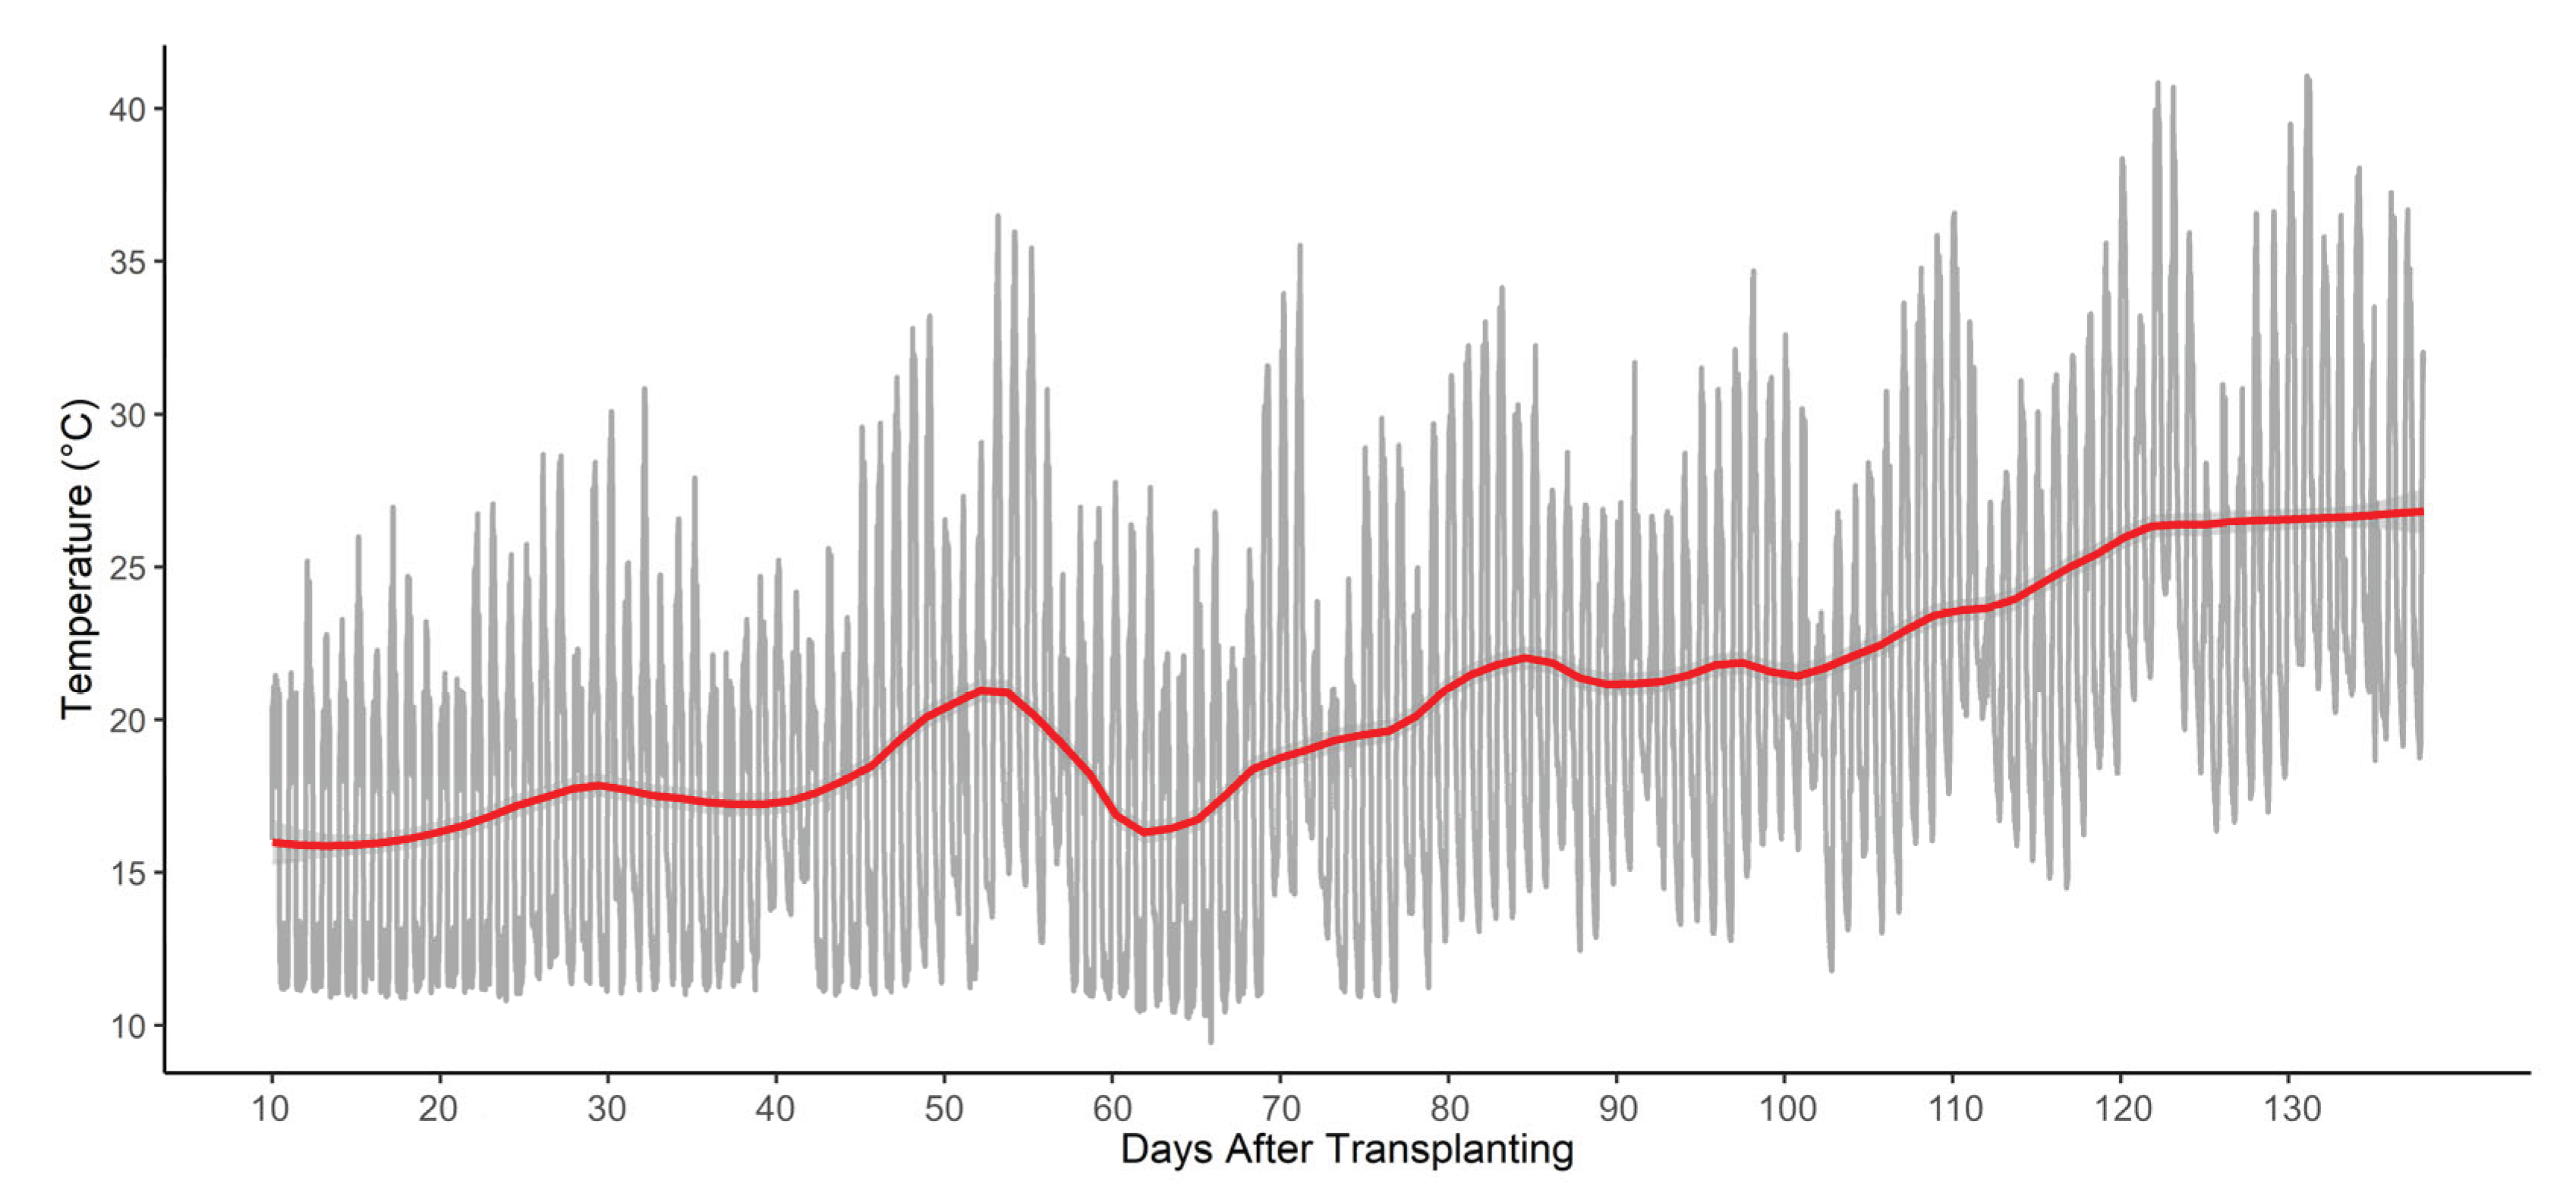

Table 1.
Yield indicators (g/plant: marketable, not-marketable fruits and total yield; number and weight of marketable fruits) of tomato plants in response to irrigation and biostimulant treatments. W = watered; S = stressed; U = untreated; PH-F = foliar; PH-R = root. Ns, ***, non-significant or significant at P ≤ 0.001. Values are presented as mean ± standard error.
| Source of variation | Yield (g/plant) | Marketable fruits | |||
| Marketable | Not marketable | Total | Number (n./plant) | Mean weight (g/fruit) | |
| Irrigation | |||||
| W | 2484.32 ± 40.49 | 528.60 ± 22.26 | 3012.35 ± 51.37 | 152.98 ± 2.65 | 16.41 ± 0.16 |
| S | 1471.79 ± 23.49 | 368.83 ± 11.18 | 1798.64 ± 23.32 | 103.98 ± 1.49 | 14.39 ± 0.13 |
| Biostimulant | |||||
| U | 2078.02 ± 121.57 | 434.48 ± 19.60 | 2454.01 ± 124.56 | 131.83 ± 6.00 | 15.41 ± 0.24 |
| PH-F | 1971.25 ± 94.03 | 462.10 ± 27.88 | 2345.24 ± 106.5 | 129.41 ± 4.57 | 15.25 ± 0.23 |
| PH-R | 1915.33 ± 97.02 | 447.02 ± 29.24 | 2436.41 ± 133.11 | 125.06 ± 4.95 | 15.55 ± 0.30 |
| Irrigation*Biostimulant | |||||
| W*U | 2614.52 ± 66.40 | 471.52 ± 29.99 | 3031.71 ± 86.46 | 157.94 ± 5.40 | 16.49 ± 0.20 |
| W*PH-F | 2420.29 ± 71.90 | 567.67 ± 38.49 | 2932.55 ± 49.57 | 150.75 ± 4.44 | 16.09 ± 0.28 |
| W*PH-R | 2427.31 ± 62.47 | 547.81 ± 44.61 | 3062.80 ± 113.39 | 150.07 ± 3.66 | 16.64 ± 0.33 |
| S*U | 1452.11 ± 23.46 | 397.44 ± 22.47 | 1793.79 ± 37.98 | 102.00 ± 2.34 | 14.40 ± 0.20 |
| S*PH-F | 1492.28 ± 38.69 | 356.53 ± 15.70 | 1831.35 ± 39.04 | 108.06 ± 2.39 | 14.30 ± 0.11 |
| S*PH-R | 1467.34 ± 49.93 | 352.54 ± 18.48 | 1768.27 ± 44.58 | 101.63 ± 2.76 | 14.45 ± 0.33 |
| Significance | |||||
| Irrigation | *** | *** | *** | *** | *** |
| Biostimulant | ns | ns | ns | ns | ns |
| Irrigation*Biostimulant | ns | ns | ns | ns | ns |
Table 2.
Leaf pigment concentration for chlorophyll a, chlorophyll b, total chlorophyll, and carotenoids content in tomato leaves sampled at mid-crop cycle. DAT = days after transplanting; W = watered; S = stressed; U = untreated; PH-F = foliar; PH-R = root. Ns, *, ***, non-significant or significant at P ≤ 0.05 or 0.001. Values are presented as mean ± standard error.
| Source of variation | Pigment concentration (mg/g FW) | |||
| Clorophyll a | Clorophyll b | Total Chlorophyll | Carotenoids | |
| Irrigation | ||||
| W | 1.188 ± 0.013 | 0.450 ± 0.004 | 1.637 ± 0.017 | 0.333 ± 0.004 |
| S | 1.359 ± 0.021 | 0.500 ± 0.005 | 1.858 ± 0.027 | 0.365 ± 0.005 |
| Biostimulant | ||||
| U | 1.285 ± 0.022 ab | 0.479 ± 0.006 ab | 1.764 ± 0.027 ab | 0.351 ± 0.005 |
| PH-F | 1.227 ± 0.017 b | 0.462 ± 0.005 b | 1.688 ± 0.022 b | 0.341 ± 0.005 |
| PH-R | 1.305 ± 0.030 a | 0.483 ± 0.008 a | 1.788 ± 0.039 a | 0.355 ± 0.007 |
| Irrigation*Biostimulant | ||||
| W*U | 1.232 ± 0.023 bc | 0.463 ± 0.007 | 1.695 ± 0.030 bc | 0.342 ± 0.006 |
| W*PH-F | 1.151 ± 0.019 c | 0.438 ± 0.005 | 1.589 ± 0.023 c | 0.325 ± 0.006 |
| W*PH-R | 1.181 ± 0.023 c | 0.447 ± 0.007 | 1.628 ± 0.030 c | 0.332 ± 0.006 |
| S*U | 1.337 ± 0.034 ab | 0.494 ± 0.009 | 1.831 ± 0.043 ab | 0.359 ± 0.007 |
| S*PH-F | 1.306 ± 0.022b | 0.486 ± 0.006 | 1.790 ± 0.028 b | 0.357 ± 0.006 |
| S*PH-R | 1.430 ± 0.046 a | 0.518 ± 0.013 | 1.948 ± 0.059 a | 0.378 ± 0.010 |
| Significance | ||||
| Irrigation | *** | *** | *** | *** |
| Biostimulant | * | * | * | ns |
| Irrigation*Biostimulant | * | ns | * | ns |
Table 3.
Quality parameters (Total soluble solids - TSS, pH, titratable acidity - TA, dry matter – DM, and firmness) of marketable fruits measured at the IV truss in response to irrigation (watered vs. stressed) and biostimulant (untreated, foliar, root) treatments. W = watered; S = stressed; U = untreated; PH-F = foliar; PH-R = root. Ns, *, **, ***, non-significant or significant at P ≤ 0.05, 0.01 or 0.001. Values are presented as mean ± standard error.
| Source of variation |
TSS (°Brix) |
pH |
TA (g/l citric acid) |
DM (%) |
Firmness (N) |
| Irrigation | |||||
| W | 8.55 ± 0.05 | 4.32 ± 0.01 | 4.59 ± 0.06 | 9.30 ± 0.08 | 0.95 ± 0.02 |
| S | 8.83 ± 0.04 | 4.29 ± 0.01 | 4.78 ± 0.08 | 9.72 ± 0.07 | 1.09 ± 0.02 |
| Biostimulant | |||||
| U | 8.65 ± 0.06 | 4.31 ± 0.01 | 4.61 ± 0.09 | 9.49 ± 0.08 | 1.02 ± 0.02 |
| PH-F | 8.76 ± 0.06 | 4.30 ± 0.01 | 4.78 ± 0.08 | 9.54 ± 0.10 | 1.00 ± 0.03 |
| PH-R | 8.66 ± 0.07 | 4.32 ± 0.01 | 4.66 ± 0.08 | 9.38 ± 0.12 | 1.02 ± 0.03 |
| Irrigation*Biostimulant | |||||
| W*U | 8.49 ± 0.11 | 4.34 ± 0.02 | 4.56 ± 0.13 | 9.37 ± 0.10 | 0.99 ± 0.04 |
| W*PH-F | 8.58 ± 0.07 | 4.31 ± 0.02 | 4.54 ± 0.08 | 9.39 ± 0.14 | 0.91 ± 0.04 |
| W*PH-R | 8.58 ± 0.09 | 4.33 ± 0.01 | 4.67 ± 0.09 | 9.14 ± 0.16 | 0.95 ± 0.02 |
| S*U | 8.79 ± 0.05 | 4.27 ± 0.02 | 4.65 ± 0.13 | 9.64 ± 0.13 | 1.05 ± 0.02 |
| S*PH-F | 8.94 ± 0.08 | 4.29 ± 0.02 | 5.02 ± 0.11 | 9.78 ± 0.07 | 1.12 ± 0.02 |
| S*PH-R | 8.77 ± 0.09 | 4.30 ± 0.02 | 4.66 ± 0.14 | 9.76 ± 0.13 | 1.09 ± 0.04 |
| Significance | |||||
| Irrigation | *** | * | * | *** | *** |
| Biostimulant | ns | ns | ns | ns | ns |
| Irrigation*Biostimulant | ns | ns | ns | ns | ns |
Table 4.
Concentrations of macronutrients (N, P, K; g/kg fruit dry weight - DW) and micronutrients (Fe, Mn, Zn, Cu; mg/kg DW) in tomato fruits in response to irrigation (watered vs. stressed) and biostimulant (untreated, foliar, root) treatments. W = watered; S = stressed; U = untreated; PH-F = foliar; PH-R = root. ns, *, ***, non-significant or significant at P ≤ 0.05, or 0.001. Values are presented as mean ± standard error.
| Source of variation | Macronutrient concentration (g/kg DW) | Micronutrient concentration (mg/kg DW) | ||||||
| N | P | K | Fe | Mn | Zn | Cu | ||
| Irrigation | ||||||||
| W | 21.85 ± 0.32 | 7.86 ± 0.43 | 50.64 ± 0.86 | 304.53 ± 10.53 | 62.74 ± 2.61 | 25.44 ± 0.83 | 5.63 ± 0.15 | |
| S | 21.62 ± 0.30 | 6.85 ± 0.63 | 40.75 ± 1.26 | 280.66 ± 18.75 | 42.81 ± 1.45 | 18.17 ± 0.51 | 5.07 ± 0.16 | |
| Biostimulant | ||||||||
| U | 21.49 ± 0.36 | 8.03 ± 0.64 | 43.93 ± 1.90 | 250.01 ± 14.36 b | 52.77 ± 3.84 | 21.93 ± 1.61 | 5.52 ± 0.24 | |
| PH-F | 21.86 ± 0.44 | 7.21 ± 0.76 | 47.59 ± 2.17 | 325.85 ± 13.38 a | 57.71 ± 4.82 | 22.21 ± 1.49 | 5.23 ± 0.27 | |
| PH-R | 21.85 ± 0.34 | 6.68 ± 0.65 | 44.98 ± 1.97 | 303.05 ± 19.52 ab | 51.57 ± 3.84 | 21.63 ± 1.17 | 5.25 ± 0.11 | |
| Irrigation*Biostimulant | ||||||||
| W*U | 21.82 ± 0.59 | 8.15 ± 0.76 | 49.55 ± 1.38 | 266.78 ± 14.98 | 61.95 ± 4.38 | 25.15 ± 2.21 | 6.02 ± 0.13 | |
| W*PH-F | 21.48 ± 0.63 | 7.83 ± 0.88 | 52.90 ± 0.48 | 314.57 ± 16.91 | 64.59 ± 5.20 | 25.99 ± 1.02 | 5.52 ± 0.36 | |
| W*PH-R | 22.14 ± 0.56 | 7.48 ± 0.49 | 49.67 ± 1.81 | 325.95 ± 14.82 | 61.69 ± 4.73 | 25.19 ± 1.03 | 5.46 ± 0.09 | |
| S*U | 21.15 ± 0.41 | 7.90 ± 1.09 | 39.25 ± 1.51 | 236.03 ± 22.81 | 43.60 ± 3.49 | 18.07 ± 0.26 | 5.19 ± 0.33 | |
| S*PH-F | 22.15 ± 0.67 | 6.47 ± 1.32 | 42.28 ± 2.61 | 342.77 ± 21.66 | 43.95 ± 1.21 | 17.67 ± 1.09 | 4.90 ± 0.38 | |
| S*PH-R | 21.57 ± 0.42 | 6.22 ± 0.96 | 40.95 ± 2.48 | 283.41 ± 33.44 | 41.46 ± 1.23 | 18.59 ± 1.00 | 5.10 ± 0.17 | |
| Significance | ||||||||
| Irrigation | ns | ns | *** | ns | *** | *** | * | |
| Biostimulant | ns | ns | ns | * | ns | ns | ns | |
| Irrigation*Biostimulant | ns | ns | ns | ns | ns | ns | ns | |
Table 5.
Antioxidant capacity of tomato fruits tissues expressed as Ferric Reducing Antioxidant Power (FRAP), 2,2-diphenyl-1-picrylhydrazyl (DPPH) in mg Trolox equivalents/g fruit fresh weight – FW, total polyphenols as mg gallic acid equivalents – GAE/g FW, and flavonoids as mg quercetin equivalents – QE/g FW. W = watered; S = stressed; U = untreated; PH-F = foliar; PH-R = root. ns, *, ***, non-significant or significant at P ≤ 0.05 or 0.001. Values are presented as mean ± standard error.
| Source of variation | mg Trolox eq./g FW | mg GAE eq./g FW | mg QE eq./g FW | |
| FRAP | DPPH | Polyphenols | Flavonoids | |
| Irrigation | ||||
| W | 22.106 ± 0.593 | 11.742 ± 0.077 | 31.576 ± 0.646 | 0.252 ± 0.016 |
| S | 25.935 ± 0.437 | 11.519 ± 0.109 | 33.817 ± 0.657 | 0.304 ± 0.016 |
| Biostimulant | ||||
| U | 22.293 ± 0.582 b | 11.657 ± 0.128 | 32.141 ± 0.921 | 0.254 ± 0.021 |
| PH-F | 26.034 ± 0.891 a | 11.699 ± 0.136 | 32.844 ± 0.785 | 0.278 ± 0.025 |
| PH-R | 23.706 ± 0.496 b | 11.516 ± 0.072 | 33.104 ± 0.897 | 0.311 ± 0.011 |
| Irrigation*Biostimulant | ||||
| W*U | 19.622 ± 0.414 | 11.797 ± 0.116 | 30.864 ± 1.184 | 0.247 ± 0.039 |
| W*PH-F | 23.779 ± 1.304 | 11.753 ± 0.173 | 31.701 ± 1.014 | 0.243 ± 0.026 |
| W*PH-R | 22.581 ± 0.690 | 11.662 ± 0.106 | 32.162 ± 1.294 | 0.271 ± 0.008 |
| S*U | 24.519 ± 0.406 | 11.518 ± 0.228 | 33.418 ± 1.297 | 0.261 ± 0.020 |
| S*PH-F | 28.740 ± 0.618 | 11.645 ± 0.216 | 33.987 ± 1.078 | 0.313 ± 0.040 |
| S*PH-R | 24.831 ± 0.574 | 11.371 ± 0.082 | 34.047 ± 1.229 | 0.338 ± 0.006 |
| Significance | ||||
| Irrigation | *** | ns | * | * |
| Biostimulant | *** | ns | ns | ns |
| Irrigation*Biostimulant | ns | ns | ns | ns |
Table 6.
Concentration of glucose, sucrose, fructose, total soluble carbohydrates (mg/g DW) in tomato fruits in response to irrigation (watered vs. stressed) and biostimulant (untreated, foliar, root) treatments. W = watered; S = stressed; U = untreated; PH-F = foliar; PH-R = root. ns, *, **, non-significant or significant at P ≤ 0.05, or 0.01. Values are presented as mean ± standard error.
| Source of variation |
Soluble carbohydrates (mg/g DW) |
Non-structural carbohydrates (mg/g DW) |
||||
| Glucose | Sucrose | Fructose | Total | Amid | ||
| Irrigation | ||||||
| W | 233.62 ± 12.82 | 27.22 ± 2.30 | 296.91 ± 22.13 | 557.76 ± 34.13 | 6.03 ± 1.40 | |
| S | 271.47 ± 7.44 | 20.20 ± 2.50 | 325.04 ± 16.22 | 616.71 ± 23.37 | 4.88 ± 0.58 | |
| Biostimulant | ||||||
| U | 266.25 ± 10.88 | 18.48 ± 3.68 | 312.66 ± 24.18 | 597.34 ± 35.04 | 4.18 ± 0.72 | |
| PH-F | 233.52 ± 12.63 | 25.50 ± 2.20 | 298.60 ± 17.56 | 557.62 ± 26.98 | 6.26 ± 2.10 | |
| PH-R | 257.87 ± 18.68 | 27.16 ± 2.86 | 321.67 ± 31.28 | 606.69 ± 49.00 | 5.92 ± 0.50 | |
| Irrigation*Biostimulant | ||||||
| W*U | 272.94 ± 20.66 ab | 23.74 ± 3.52 | 331.04 ± 50.30 | 627.71 ± 71.98 | 3.42 ± 0.07 | |
| W*PH-F | 208.40 ± 12.81 c | 27.98 ± 3.58 | 291.28 ± 34.69 | 527.65 ± 49.70 | 8.67 ± 3.99 | |
| W*PH-R | 219.53 ± 13.80 bc | 29.97 ± 5.32 | 268.41 ± 33.74 | 517.91 ± 51.34 | 5.10 ± 0.79 | |
| S*U | 259.57 ± 10.95 abc | 13.22 ± 5.27 | 294.29 ± 7.54 | 567.08 ± 6.31 | 4.95 ± 1.42 | |
| S*PH-F | 258.65 ± 1.48 abc | 23.03 ± 2.29 | 305.92 ± 16.87 | 587.59 ± 16.49 | 3.85 ± 0.61 | |
| S*PH-R | 296.21 ± 9.14 a | 24.34 ± 2.19 | 374.92 ± 30.28 | 695.47 ± 38.54 | 5.83 ± 0.77 | |
| Significance | ||||||
| Irrigation | ** | * | ns | ns | ns | |
| Biostimulant | ns | ns | ns | ns | ns | |
| Irrigation*Biostimulant | * | ns | ns | ns | ns | |
Disclaimer/Publisher’s Note: The statements, opinions and data contained in all publications are solely those of the individual author(s) and contributor(s) and not of MDPI and/or the editor(s). MDPI and/or the editor(s) disclaim responsibility for any injury to people or property resulting from any ideas, methods, instructions or products referred to in the content. |
© 2025 by the authors. Licensee MDPI, Basel, Switzerland. This article is an open access article distributed under the terms and conditions of the Creative Commons Attribution (CC BY) license (http://creativecommons.org/licenses/by/4.0/).
Copyright: This open access article is published under a Creative Commons CC BY 4.0 license, which permit the free download, distribution, and reuse, provided that the author and preprint are cited in any reuse.


