
Submitted:
26 May 2025
Posted:
28 May 2025
You are already at the latest version
Abstract
To investigate the effects of regulated deficit irrigation (RDI) on tomato fruit quality and flavor, a study was conducted using the tomato cultivar 'Gaotang No. 1' under three irrigation treatments: CK (conventional irrigation, 16 m³/mu per session), T1 (50% reduction, 8 m³/mu), and T2 (25% reduction, 12 m³/mu). The impact on plant growth, yield, fruit quality, and volatile organic compounds (VOCs) was evaluated. Results showed that the T2 treatment significantly reduced yield (−26.55%) but enhanced fruit firmness (35.57% increase in shoulder hardness), soluble solids (14.56%), vitamin C content (44.19%), and the sugar-to-acid ratio (2.25%). Volatile analysis revealed that T2 markedly increased the concentration of key aroma compounds with odor activity values (OAV) >10, including 2-pentyl furan (24.71%), (Z)-3,7-dimethyl-1,3,6-octadecatriene (128.49%) contributing to floral aroma, 2-ethyl-5-methylpyrazine (204.10%) associated with fruity aroma, and 4- isopropyltoluene (125.79%) contributing to citrus aroma. These compounds significantly shaped the overall aroma profile, resulting in a richer flavor. The findings confirm that moderate RDI (25% reduction) effectively balances yield and fruit quality by improving texture, nutritional value, and aroma complexity, offering a promising strategy for water-efficient, quality-focused tomato production.
Keywords:
tomato
; Solanum lycopersicum
; regulated deficit irrigation
; fruit quality
; aroma-active compounds
1. Introduction
Tomato (Solanum lycopersicum L.), a globally cultivated and economically important crop, is highly valued for its nutritional richness—including amino acids, vitamins, and minerals—and is widely consumed both fresh and cooked. Due to evolving consumer preferences, there is increasing demand for tomatoes with improved nutritional value and flavor, surpassing traditional breeding priorities such as disease resistance, yield, and storability (Wang et al., 2016; Li et al., 2023).
Tomato flavor is a complex combination of aroma, taste, and texture. Sugars, organic acids, and bitter compounds primarily determine taste (Klee & Tieman, 2018), while volatile organic compounds (VOCs) are essential for aroma (Yury et al., 2020). As secondary metabolites, VOCs impart distinctive floral, fruity, grassy, fatty, malty, roasted, sweet, and pungent notes that significantly influence sensory perception (Hadi et al., 2013; Amal et al., 2020). Together with sugars and acids, VOCs play a crucial role in consumer preference and product classification (Ning et al., 2023).
Tomato quality is influenced by genetic background, cultivation practices, and harvest maturity (Cheng et al., 2020; Li et al., 2024; Liu et al., 2024). Adjusting cultivation conditions can greatly improve fruit quality. Strategies such as soilless cultivation (Jinghua et al., 2022), grafting (Rivelli et al., 2024), compost leachate application (Li et al., 2024), and the use of plant growth regulators (Ruirui et al., 2023) have shown beneficial effects. Recently, regulated deficit irrigation (RDI) has gained interest as an effective water-saving technique (Silvia et al., 2024). Studies indicate that RDI reduces water and fertilizer input while improving fruit quality, though it may reduce fruit weight and yield (Costa et al., 2007; Kumar et al., 2015; Lahoz et al., 2016; Nangare et al., 2016; Ning et al., 2023; Zegbe-Domínguez et al., 2003). Despite concerns about yield, some studies have shown that a 50% reduction in irrigation during flowering and fruit set reduced yield by only 13%, while maintaining a high percentage of marketable fruit (Cui et al., 2020; Lahoz et al., 2016). Thus, moderate yield trade-offs may be acceptable to growers when fruit quality improves.
Interestingly, soluble sugar content is often inversely related to fruit size, whereas VOC levels are generally independent of fruit weight (Klee & Tieman, 2018). Furthermore, VOCs influence the perceived sweetness and acidity of fruit, contributing to flavor independently of sugar concentration (Tieman et al., 2012; L et al., 2014). This suggests that flavor can be enhanced without compromising yield or drastically altering sugar levels.
In this study, we applied two levels of regulated deficit irrigation during the first fruit-setting stage of tomatoes and evaluated plant growth, fruit yield, nutrient content, and VOC profiles. The goal was to determine whether tomato fruit quality and flavor could be improved under RDI with minimal yield loss, providing a scientific basis for flavor-oriented, water-efficient cultivation practices.
2. Materials and Methods
2.1. Experimental Basics
The study was conducted from January to June 2022 in a greenhouse (6 m wide, 30 m long, and 3 m high) located at the Hebei Modern Agricultural Experimental Park, Shijiazhuang City, Hebei Province, China. The experimental plots measured 2 m × 10 m and were arranged in a randomized design with three replications.
Tomatoes were cultivated on north–south-oriented ridges. A drip irrigation line was installed in the center of each row, with emitters spaced 30 cm apart and a flow rate of 3 L/h. After laying the drip irrigation lines, a transparent polyethylene mulch film was applied. Planting holes were created through the film, and seedlings were transplanted accordingly.
Each plot was equipped with an independent irrigation system, consisting of a main water supply pipe with an installed water meter. Water from the main pipe flowed into sub-pipes connected to individual drip lines. A separate valve per plot allowed precise control over irrigation volume.
The tomato cultivar ‘Gaotang No. 1’ was used. Seeds were sown in 72-cell seedling trays under greenhouse conditions on January 3, 2022. Uniform seedlings were transplanted on March 8 at a spacing of 1.0 m between rows and 0.33 m between plants. Single-stem pruning was applied throughout the growing season. The plants were terminated on June 22.
The soil at the site was classified as calcareous cinnamon soil. Before planting, the soil was amended with 2,400 kg·mu⁻¹ of cattle manure, 800 kg·mu⁻¹ of poultry manure, and 20 kg·mu⁻¹ of compound fertilizer (N–P₂O₅–K₂O: 18–12–20). During the reproductive stage, fertigation was performed at each fruit-setting stage using a high-potassium fertilizer (N–P₂O₅–K₂O: 18–6–39).
2.2. Irrigation Treatments
Initial irrigation (18 m³·mu⁻¹) and seedling recovery irrigation (12 m³·mu⁻¹) were applied on March 8 and March 15, respectively. The main irrigation treatments began on April 25, 2022, after the first fruit cluster had set. Three irrigation regimes were applied:
- CK (control): Conventional irrigation, 16 m³·mu⁻¹ per application
- T1: 50% reduction, 8 m³·mu⁻¹ per application
- T2: 25% reduction, 12 m³·mu⁻¹ per application
Each treatment was irrigated 10 times throughout the growing period.
2.3. Measurement Indexes and Methods
2.3.1. Plant Growth and Yield
Plant height and stem diameter were measured on March 31, May 6, and June 7, 2022. Ten plants were randomly selected from each plot. Plant height was measured using a telescopic ruler, while stem diameter (1 cm below the first, second, and third fruit clusters) was measured using a digital caliper.
Harvesting began on June 24 and continued until plant termination. Total yield was calculated as grams per square meter (g/m²). The fruit cracking rate (%) was also recorded.
2.3.2. Fruit Quality Analysis
Fifteen fruits at uniform maturity were harvested from the second fruit cluster on May 14 for quality evaluation:
- Single fruit weight: Measured using a precision balance (±0.01 g).
- Fruit firmness: Measured at the shoulder, equator, and blossom end using a GY-4 digital fruit firmness tester.
- Moisture and dry weight: Five fruits per replicate were weighed fresh, oven-dried at 120 °C for 20 minutes (enzyme inactivation), then further dried at 80 °C to a constant weight. Moisture content (%) was calculated as:
-
Nutritional quality (based on Hesheng, 2004):
- o
- Soluble solids: TD-45 refractometer
- o
- Titratable acidity: Standard titration method
- o
- Vitamin C: 2,6-dichlorophenolindophenol titration
- o
- Soluble sugars: Anthrone colorimetry
- o
- Lycopene: Spectrophotometry
The sugar-to-acid ratio was calculated using soluble sugar and titratable acidity values.
2.3.4. VOCs Analysis
Fruits were frozen at –80 °C, ground in liquid nitrogen, and homogenized. A 500 mg sample was transferred to a headspace vial containing saturated NaCl solution and 10 μL of internal standard solution (50 μg·mL⁻¹). Volatile organic compounds (VOCs) were extracted using automated headspace solid-phase microextraction (HS-SPME) and analyzed by gas chromatography–mass spectrometry (GC-MS) using the NIST17 spectral library.
- Qualitative analysis: Conducted using the GC-MS workstation with the following parameters: initial area cut-off = 10,000; initial peak width = 0.1; shoulder peak detection = OFF; initial threshold = 5.0. Identification was based on matches from the NIST17S library.
- Quantitative analysis: n-Hexane was used as an internal standard. VOC concentrations (μg·kg⁻¹) were calculated as:
2.4. Data Analysis
Orthogonal Partial Least Squares Discriminant Analysis (OPLS-DA) was performed using Origin 2024 to differentiate VOC profiles. Variables with VIP ≥ 1 and p < 0.05 were considered significant. Aroma classifications were referenced from the Flavor Extract Manufacturers Association (FEMA) Flavor Ingredient Library (1999). Odor activity values (OAVs) were calculated using the following formula:
Odor thresholds were obtained from Zeist (2011).
3. Results and Analysis
3.1. Plant Height and Stem Diameter
Both T1 and T2 treatments significantly reduced plant height compared to the control (CK) (Figure 1). On May 6, T1 and T2 decreased plant height by 8.24% and 9.22%, respectively. By June 7, the reductions reached 13.10% (T1) and 10.83% (T2). However, no significant difference in plant height was observed between T1 and T2 at either time point. Regarding stem diameter, T2 showed a significant increase of 13.71% (p < 0.05) on May 6, whereas T1 did not differ significantly from CK. By June 7, T2 maintained the largest stem diameter, although the difference from CK was not statistically significant, while T1 exhibited a significant reduction of 16.48% (p < 0.05).
3.2. Fruiting Characteristics, Yield, and Fruit Cracking Rate of Tomatoes
As shown in Table 1, compared with the control (CK), the number of fruiting ears per plant under the T1 treatment was significantly reduced by 13.11% (p < 0.05), while no significant reduction was observed under T2. The number of fruits per plant was significantly decreased by 19.16% and 13.76% under T1 and T2, respectively, with no significant difference between the two treatments. Tomato yield was significantly reduced by 37.03% under T1 and 26.55% under T2, with T2 showing a significantly higher yield than T1 (p < 0.05). Notably, the fruit cracking rate was significantly reduced by 57.05% in T2 (p < 0.05), whereas T1 had no significant effect on cracking compared to CK.
3.3. Fruit Weight, Moisture, and Dry Weight of Tomato Fruits
As illustrated in Figure 2, compared with the control (CK), the single fruit weight was significantly reduced by 16.14% under the T1 treatment (p < 0.05), while T2 showed a non-significant reduction of 5.45%. No significant differences were observed among treatments in fruit moisture content. However, dry weight was significantly reduced by 16.56% under T1, whereas T2 showed no significant change compared to CK.
3.4. Hardness of Tomato Fruit
As shown in Table 2, compared with CK, fruit shoulder hardness significantly increased by 23.71% under T1 and by 35.57% under T2 (p < 0.05). Similarly, fruit equatorial hardness was significantly enhanced by 25.85% in T1 and 19.39% in T2. In contrast, fruit umbilical hardness was significantly reduced by 20.36% under T2, while no significant difference was observed in T1 compared to CK.
3.5. Nutritional Quality of Tomato Fruits
As shown in Table 3, compared with CK, lycopene content decreased by 23.45% in T1 (p < 0.05), while it increased by 6.70% in T2 (p < 0.05). Vitamin C content increased by 9.24% in T1 and by 44.19% in T2 (p < 0.05). Soluble solids content rose by 4.43% and 14.56% in T1 and T2, respectively (p < 0.05). Soluble sugar content significantly increased by 8.12% in T2 (p < 0.05), with no significant change in T1. Titratable acid increased by 8.82% in T1 and 5.88% in T2 (p < 0.05). The sugar-to-acid ratio significantly decreased by 9.71% in T1 and increased by 2.25% in T2 (p < 0.05).
3.6. Volatile Organic Compounds
3.6.1. Composition and Abundance of VOCs
GC-MS detected a total of 526 volatile organic compounds (VOCs) in both CK and T2 treatments. Data analysis using Orthogonal Partial Least Squares Discriminant Analysis (OPLS-DA) revealed a significant separation between the groups, as shown in the score plot (Figure 3A) (A et al., 2015). The OPLS-DA model (Q² > 0.5, p < 0.05) identified 131 differential metabolites with Variable Importance in the Projection (VIP) scores ≥ 1 and p-values ≤ 0.05. These metabolites were classified into nine groups: alcohols, aromatics, phenols, aldehydes, terpenes, hydrocarbons, ketones, esters, and heterocyclic compounds. As illustrated in Figure 3B, terpenes were the dominant class in CK (23.25%), followed by heterocyclics (16.04%) and aromatics (13.39%). In T2, terpenes remained predominant (21.24%), but heterocyclics (17.69%) and phenols (13.96%) increased. T2 showed a reduction in the proportions of terpenes, ketones, and heterocyclics, while alcohols, aromatics, phenols, aldehydes, hydrocarbons, and esters were elevated, indicating a reconfiguration of the VOC profile without a change in overall diversity.
3.6.2. Key Aroma-Active Compounds
Among the 44 flavor-impacting VOCs listed in Table 4, T2 significantly reduced the levels of 3-methyl-2-cyclohexen-1-one (−4.85%), 2-acetylpyrrole (−6.15%), benzaldehyde (−20.36%), eugenol (−29.73%), 2-isobutylthiazole (−29.90%), benzyl benzoate (−36.12%), and trans-β-farnesene (−37.83%). Conversely, T2 markedly increased compounds such as 4-propylphenol (+275.37%), 2-ethyl-5-methylpyrazine (+204.10%), undecanol (+188.72%), nerol acetate (+178.50%), 2-undecenal (+178.45%), (E)-2-undecenal (+173.52%), 4-hydroxybenzaldehyde (+162.06%), ocimene (+142.67%), phellandrene (+135.07%), (Z)-3,7-dimethyl-1,3,6-octadecatriene (+128.49%), 4-isopropyltoluene (+125.79%), and trans-2-decenal (+103.63%), with other compounds increasing by 11.88–97.53%. Overall, the total content of aroma-active compounds was higher in T2 than in CK.
The contribution of volatile compounds to aroma depends not only on their concentration but also on their odor thresholds. Odor Activity Value (OAV) analysis, a widely accepted approach for identifying key aroma-active compounds in foods, accurately evaluates the individual impact of volatiles on the overall aroma profile (L et al., 2014; Shewmaker et al., 2000). Generally, compounds with OAV > 1 are considered aroma contributors, while those with OAV > 10 play critical roles in defining the aroma profile (Gong et al., 2024). As shown in Table 5, CK and T2 contained 22 and 23 compounds with OAV > 10, respectively. Additionally, five compounds in both treatments exhibited OAVs between 1 and 10, indicating moderate aroma contributions.
Aroma-active compounds (OAV > 1) were grouped into eight categories (Table 5): floral, fruity, green, citrus, oily, baked, lemony, and bitter. Radar plots (Figure 3C) revealed distinct aroma profiles: CK was characterized by dominant green, citrus, and bitter notes, whereas T2 emphasized floral, fruity, green, and citrus attributes with reduced bitterness. This shift suggests that water reduction reconfigured the aroma signature, enhancing desirable sensory characteristics while diminishing off-flavors.
4. Discussion
Appearance quality of tomato fruits—including fruit size, texture, and color—is closely related to consumer preference (Brashlyanova & Ganeva, 2014). Among these traits, hardness is a key textural characteristic directly linked to fruit storability and shelf life (Zhou et al., 2025). Lycopene, a linear carotenoid responsible for the characteristic red pigmentation in ripe tomatoes, is known to be synthesized and accumulated under controlled water regimes (Wang et al., 2025). In this study, moderate water deficit (T2: 25% water reduction) enhanced shoulder firmness by 35.57% and equatorial firmness by 25.85%, reduced fruit cracking by 57.05%, and increased lycopene content by 6.70%. These improvements in fruit mechanical strength and color align with previous reports by Amal et al. (2020) and Lahoz et al. (2016).
T2 also elevated soluble solids by 14.56%, soluble sugars by 8.12%, titratable acid by 5.88%, and sugar-acid ratio by 2.25%, further enhancing the fruit’s sweet-acid balance consistent with consumer flavor preferences (Zhao et al., 2019). Unlike some earlier studies, we observed no significant changes in fruit weight, moisture content, or dry matter under T2, suggesting that the solute accumulation was not simply driven by reduced single-fruit weight (Lahoz et al., 2016) or dilution effects (Nangare et al., 2016). Instead, osmotic regulation mechanisms may prioritize photoassimilate allocation toward sugar and acid accumulation in the fruit (Bertin & Génard, 2018), possibly via upregulated sucrose and organic acid synthesis (Klee & Giovannoni, 2011) or partial suppression of glycolysis (Wu et al., 2024). Further metabolomic and transcriptomic analyses are warranted to elucidate the molecular basis of sugar and acid enhancement.
Enhancing fruit flavor requires understanding the synergistic effects of volatile compound ratios on aroma profiles. In this study, T2 did not alter VOC diversity but significantly increased the relative proportions of floral volatiles such as 2-pentylfuran (+24.71%) and (Z)-3,7-dimethyl-1,3,6-octadecatriene (+128.49%), fruity compounds including 2-ethyl-5-methylpyrazine (+204.10%), and citrus-associated compounds like 4-isopropyltoluene (+125.79%) and undecanol (+188.72%) (Table 6). Concurrently, bitter phenols (eugenol: −29.73%) and aldehydes (benzaldehyde: −20.36%) were reduced, potentially imparting a richer and more desirable flavor profile (Ning et al., 2023; Tieman et al., 2017).
Notably, C9 and C10 volatiles comprised 55.56% of aroma-active compounds (OAV > 1) under T2, likely reflecting upregulated enzymatic activity involved in VOC biosynthesis under water deficit (G et al., 2009). These compounds originate from the lipoxygenase (LOX) and hydroperoxide lyase (HPL) pathways, where 9-LOX and 9-HPL catalyze synthesis of C9 aldehydes with low odor thresholds and significant aroma contribution. LOX-derived aldehydes may be reduced to alcohols by alcohol dehydrogenases (ADHs) or undergo reversible interconversion (L et al., 2014; Jing Zhang et al., 2024; Zhonghui Zhang et al., 2024), followed by esterification mediated by alcohol acyltransferases (AATs) using acyl-CoA, alcohol acceptors, and acid donors (Jing Zhang et al., 2024). Additionally, cinnamaldehyde, derived from phenylalanine, is enzymatically converted to cinnamyl alcohol (C9H10O) (Tieman et al., 2007), while phenylpropanoid pathway metabolites serve as substrates for eugenol (C10H12O2) synthesis (L et al., 2014). These findings suggest that water regulation primarily modulates tomato VOC composition through fatty acid and phenylpropanoid metabolic pathways (César et al., 2023), highlighting the need for future enzymatic assays and genetic validation to confirm these mechanisms.
The improvements in flavor and firmness—two pivotal traits for premium tomato quality (Mathilde et al., 2010)—partially offset the yield reduction observed under T2 (−26.55%), despite a decline in fruit number per plant (−13.76%). This trade-off supports a "quality-first" production strategy for growers, as demonstrated by Nangare et al. (2016), where marketable yield was maintained through flavor and texture optimization under regulated deficit irrigation (RDI). However, this study focused solely on the cultivar ‘Gaotang No. 1’; thus, future research should validate these effects across diverse cultivars and over multiple growing seasons.
5. Conclusion
Regulated deficit irrigation (RDI) at 25% water reduction (T2) effectively optimized tomato quality by enhancing fruit firmness (35.57% increase at the shoulder), soluble solids (14.56%), vitamin C content (44.19%), and sugar-to-acid ratio (2.25%) while incurring a manageable yield loss (−26.55%). The VOC profile shifted toward floral, fruity, and citrus aroma notes through activation of LOX and phenylpropanoid metabolic pathways, enriching flavor complexity. This study provides a theoretical foundation for synergistically optimizing water-saving cultivation and tomato quality, addressing the typical yield-quality trade-off in tomato production. Future work should incorporate metabolomic and transcriptomic analyses to further clarify sugar-acid metabolic dynamics and validate the effectiveness of RDI across diverse tomato cultivars.
Author Contributions
Mingjiao Wang (MW): experiment design and implementation, data analysis, writing—original draft, writing—review & editing; Xuena Liu (XL): investigation, methodology, writing—review & editing; Shikai La (SL): methodology, writing—review & editing; Yingying Zhang (YZ): experiment implementation and assistance; Ainong Shi (AS): writing—review & editing; Jinghua Guo (JG) and Lingdi Dong (LD): validation, funding acquisition, writing—review & editing. All authors have read and approved the final manuscript.
Funding
This work was supported by the HAAFS Science and Technology Innovation Special Project (2022KJCXZX-JZS-7) and the Technical System of Vegetable Industry in Hebei Province, Southern Hebei High Quality Vegetable Technology Promotion Post (HBCT2023100205).
Data Availability Statement
All data generated or analyzed during this study are included in this published article.
Conflicts of Interest
The authors declare that the research was conducted in the absence of any commercial or financial relationships that could be construed as a potential conflict of interest.
Abbreviations
CK, control check; OAV, odor activity values; RDI, regulated deficit irrigation; T1, treatment 1; T2, treatment 2; T3, treatment 3; VOCs, volatile organic compounds.
References
- A Thévenot Etienne, Aurélie Roux, Ying Xu, et al. (2015). Analysis of the Human Adult Urinary Metabolome Variations with Age, Body Mass Index, and Gender by Implementing a Comprehensive Workflow for Univariate and OPLS Statistical Analyses.. Journal of proteome research, 14(8), 3322-3335.
- Amal Ghannem, Imed Ben Aissa, & Rajouene Majdoub. (2020). Effects of regulated deficit irrigation applied at different growth stages of greenhouse grown tomato on substrate moisture, yield, fruit quality, and physiological traits.. Environmental science and pollution research international, 28(34), 46553-46564.
- Bertin Nadia, and Génard Michel. (2018). Tomato quality as influenced by preharvest factors. Scientia Horticulturae, 233(2018), 264-276.
- Brashlyanovabr B, and Ganeva G (2014). Texture quality of tomatoes as affected by different storage temperatures and growth habit. Emirates Journal of Food Agriculture, 26(9), 750-756.
- César Rodrigues Magalhães Hilton, Godoy Alves Filho Elenilson, Letícia Rivero Meza Silvia, et al. (2023). Effect of Methyl Jasmonate on the Biosynthesis of Volatile Compounds Associated with the Ripening of Grape Tomato Fruits.. Journal of agricultural and food chemistry, 71(11).
- Cheng Guoting, Chang Peipei, Shen Yuanbo, et al. (2020). Comparing the Flavor Characteristics of 71 Tomato (Solanum lycopersicum) Accessions in Central Shaanxi Frontiers in Plant Science, 11(2020), 586834-586834.
- Costa J. Miguel, Ortuño Maria F., & Chaves M. Manuela. (2007). Deficit Irrigation as a Strategy to Save Water: Physiology and Potential Application to Horticulture. Journal of Integrative Plant Biology, 49(10), 1421-1434.
- Cui Jintao, Shao Guangcheng, Lu1 Jia, et al. (2020). Yield, quality and drought sensitivity of tomato to water deficit during different growth stages Scientia Agricola, 77(2).
- Flavor Ingredient Library. (1999). https://www.femaflavor.org/flavor-library.
- G Deluc Laurent, R Quilici David, Alain Decendit, et al. (2009). Water deficit alters differentially metabolic pathways affecting important flavor and quality traits in grape berries of Cabernet Sauvignon and Chardonnay.. BMC genomics, 10(1), 212.
- Gong Chengsheng, Guo Guangjun, Pan Baogui, et al. (2024). Integrating transcriptome and metabolome to explore the formation of fruit aroma in different types of pepper Food Bioscience, 62, 105157-105157.
- Hadi Muna El, Zhang Feng-Jie, Wu Fei-Fei, et al. (2013). Advances in Fruit Aroma Volatile Research Molecules, 18(7), 8200-8229.
- Hesheng Li. (2004). Guidelines for Plant Physiology Experiments. Higher Education Press.
- Jinghua Guo, Lingdi Dong, L. Kandel Shyam, et al. (2022). Transcriptomic and Metabolomic Analysis Provides Insights into the Fruit Quality and Yield Improvement in Tomato under Soilless Substrate-Based Cultivation Agronomy, 12(4), 923-923.
- Klee Harry J, and Tieman Denise M. (2018). The genetics of fruit flavour preferences.. Nature reviews. Genetics, 19(6), 347-356.
- Klee Harry J., and Giovannoni James J.. (2011). Genetics and Control of Tomato Fruit Ripening and Quality Attributes. Annual Review of Genetics, 45(1), 41.
- Kumar P. Suresh, Singh Y., Nangare D.D., et al. (2015). Influence of growth stage specific water stress on the yield, physico-chemical quality and functional characteristics of tomato grown in shallow basaltic soils Scientia Horticulturae, 197, 261-271.
- L Rambla José, M Tikunov Yury, J Monforte Antonio, et al. (2014). The expanded tomato fruit volatile landscape.. Journal of experimental botany, 65(16), 4613-4623.
- Lahoz Inmaculada, Pérez-de-Castro Ana, Valcárcel Mercedes, et al. (2016). Effect of water deficit on the agronomical performance and quality of processing tomato Scientia Horticulturae, 200(2016), 55-65.
- Li Tong, Cui Jiaxin, Guo Wei, et al. (2023). The Influence of Organic and Inorganic Fertilizer Applications on Nitrogen Transformation and Yield in Greenhouse Tomato Cultivation with Surface and Drip Irrigation Techniques. Water, 15(20), 3546.
- Li Wenxin, Quan Jiajia, Wen Yongshuai, et al. (2024). Compost tea enhances volatile content in tomato fruits via SlERF.E4-activated SlLOX expression.. Journal of experimental botany.
- Liu Xuena, Guo Jinghua, Chen Zijing, et al. (2024). Detection of Volatile Compounds and Their Contribution to the Nutritional Quality of Chinese and Japanese Welsh Onions ( Allium fistulosumL.). Horticulturae, 10(5), 446.
- Mathilde Causse, Chloé Friguet, Clément Coiret, et al. (2010). Consumer preferences for fresh tomato at the European scale: a common segmentation on taste and firmness. Journal of food science, 75(9), S531-541.
- Nangare D.D., Singh Yogeshwar, Kumar P. Suresh, et al. (2016). Growth, fruit yield and quality of tomato ( Lycopersicon esculentum Mill.) as affected by deficit irrigation regulated on phenological basis Agricultural Water Management, 171, 73-79.
- Ning Jin, Dan Zhang, Li Jin, et al. (2023). Controlling water deficiency as an abiotic stress factor to improve tomato nutritional and flavour quality. Food Chemistry: X, 19(2020), 100756-100756.
- Rivelli Anna Rita, Castronuovo Donato, Gatta Barbara La, et al. (2024). Qualitative Characteristics and Functional Properties of Cherry Tomato under Soilless Culture Depending on Rootstock Variety, Harvesting Time and Bunch Portion Foods, 13(10).
- Ruirui Li, Junwen Wang, Hong Yuan, et al. (2023). Exogenous application of ALA enhanced sugar, acid and aroma qualities in tomato fruit& Frontiers in Plant Science, 14, 1323048-1323048.
- Shewmaker Christine K., Baldwin Elizabeth A., Scott John W., et al. (2000). Flavor Trivia and Tomato Aroma: Biochemistry and Possible Mechanisms for Control of Important Aroma Components HortScience, 35(6), 1013-1022.
- Silvia Locatelli, Wilfredo Barrera, Leonardo Verdi, et al. (2024). Modelling the response of tomato on deficit irrigation under greenhouse conditions Scientia Horticulturae, 326, 112770.
- Tieman Denise, Bliss Peter, McIntyre Lauren M., et al. (2012). The Chemical Interactions Underlying Tomato Flavor Preferences Current Biology, 22(11), 1035-1039.
- Tieman Denise M., Loucas Holly M., Kim Joo Young, et al. (2007). Tomato phenylacetaldehyde reductases catalyze the last step in the synthesis of the aroma volatile 2-phenylethanol Phytochemistry, 68(21), 2660-2669.
- Tieman Denise, Zhu Guangtao, Resende Marcio F. R., et al. (2017). A chemical genetic roadmap to improved tomato flavor Science, 355(6323), 391-394.
- Wang Libin, Baldwin Elizabeth A., & Bai Jinhe. (2016). Recent Advance in Aromatic Volatile Research in Tomato Fruit: The Metabolisms and Regulations. Food and Bioprocess Technology, 9(2), 203-216.
- Wang Peiwen, Ran Siyu, Xu Yuanhang, et al. (2025). Comprehensive metabolome and transcriptome analyses shed light on the regulation of SlNF-YA3b in carotenoid biosynthesis in tomato fruit Postharvest Biology and Technology, 219, 113263-113263.
- Wu Xiaolei, Huo Ruixiao, Yuan Ding, et al. (2024). Exogenous GABA improves tomato fruit quality by contributing to regulation of the metabolism of amino acids, organic acids and sugars Scientia Horticulturae, 338, 113750-113750.
- 36. Yury Tikunov, Raana Roohanitaziani, Fien Meijer-Dekens, et al. (2020). The genetic and functional analysis of flavor in commercial tomato: the FLORAL4 gene underlies a QTL for floral aroma volatiles in tomato fruit. The Plant journal : for cell and molecular biology, 103(3), 1189-1204.
- Zegbe-Domı́nguez J.A, Behboudian M.H, Lang A, et al. (2003). Deficit irrigation and partial rootzone drying maintain fruit dry mass and enhance fruit quality in ‘Petopride’ processing tomato ( Lycopersicon esculentum, Mill.) Scientia Horticulturae, 98(4), 505-510.
- Zeist L.J. van Gemert. (2011). Compilations of odour threshold values in air, water and other media. Oliemans Punter & Partners BV.
- Zhang Jing, Wang Yongxu, Zhang Susu, et al. (2024). ABIOTIC STRESS GENE 1 mediates aroma volatiles accumulation by activating MdLOX1a in apple.. Horticulture research, 11(10), uhae215.
- Zhang Zhonghui, Ye Weizhen, Li Chun, et al. (2024). Volatilomics-Based Discovery of Key Volatiles Affecting Flavor Quality in Tomato. Foods, 13(6).
- Zhao Jiantao, Sauvage Christopher, Zhao Jinghua, et al. (2019). Meta-analysis of genome-wide association studies provides insights into genetic control of tomato flavor. Nature Communications, 10(1).
- Zhou Xinyuan, Zheng Yanyan, Chen Jie, et al. (2025). Multivariate analysis of the effect of deficit irrigation on postharvest storability of tomato Postharvest Biology and Technology, 219, 113245-113245.
Figure 1.
Plant height and stem thickness of tomatoes at different times under regulated deficit irrigation (RDI).
Figure 1.
Plant height and stem thickness of tomatoes at different times under regulated deficit irrigation (RDI).
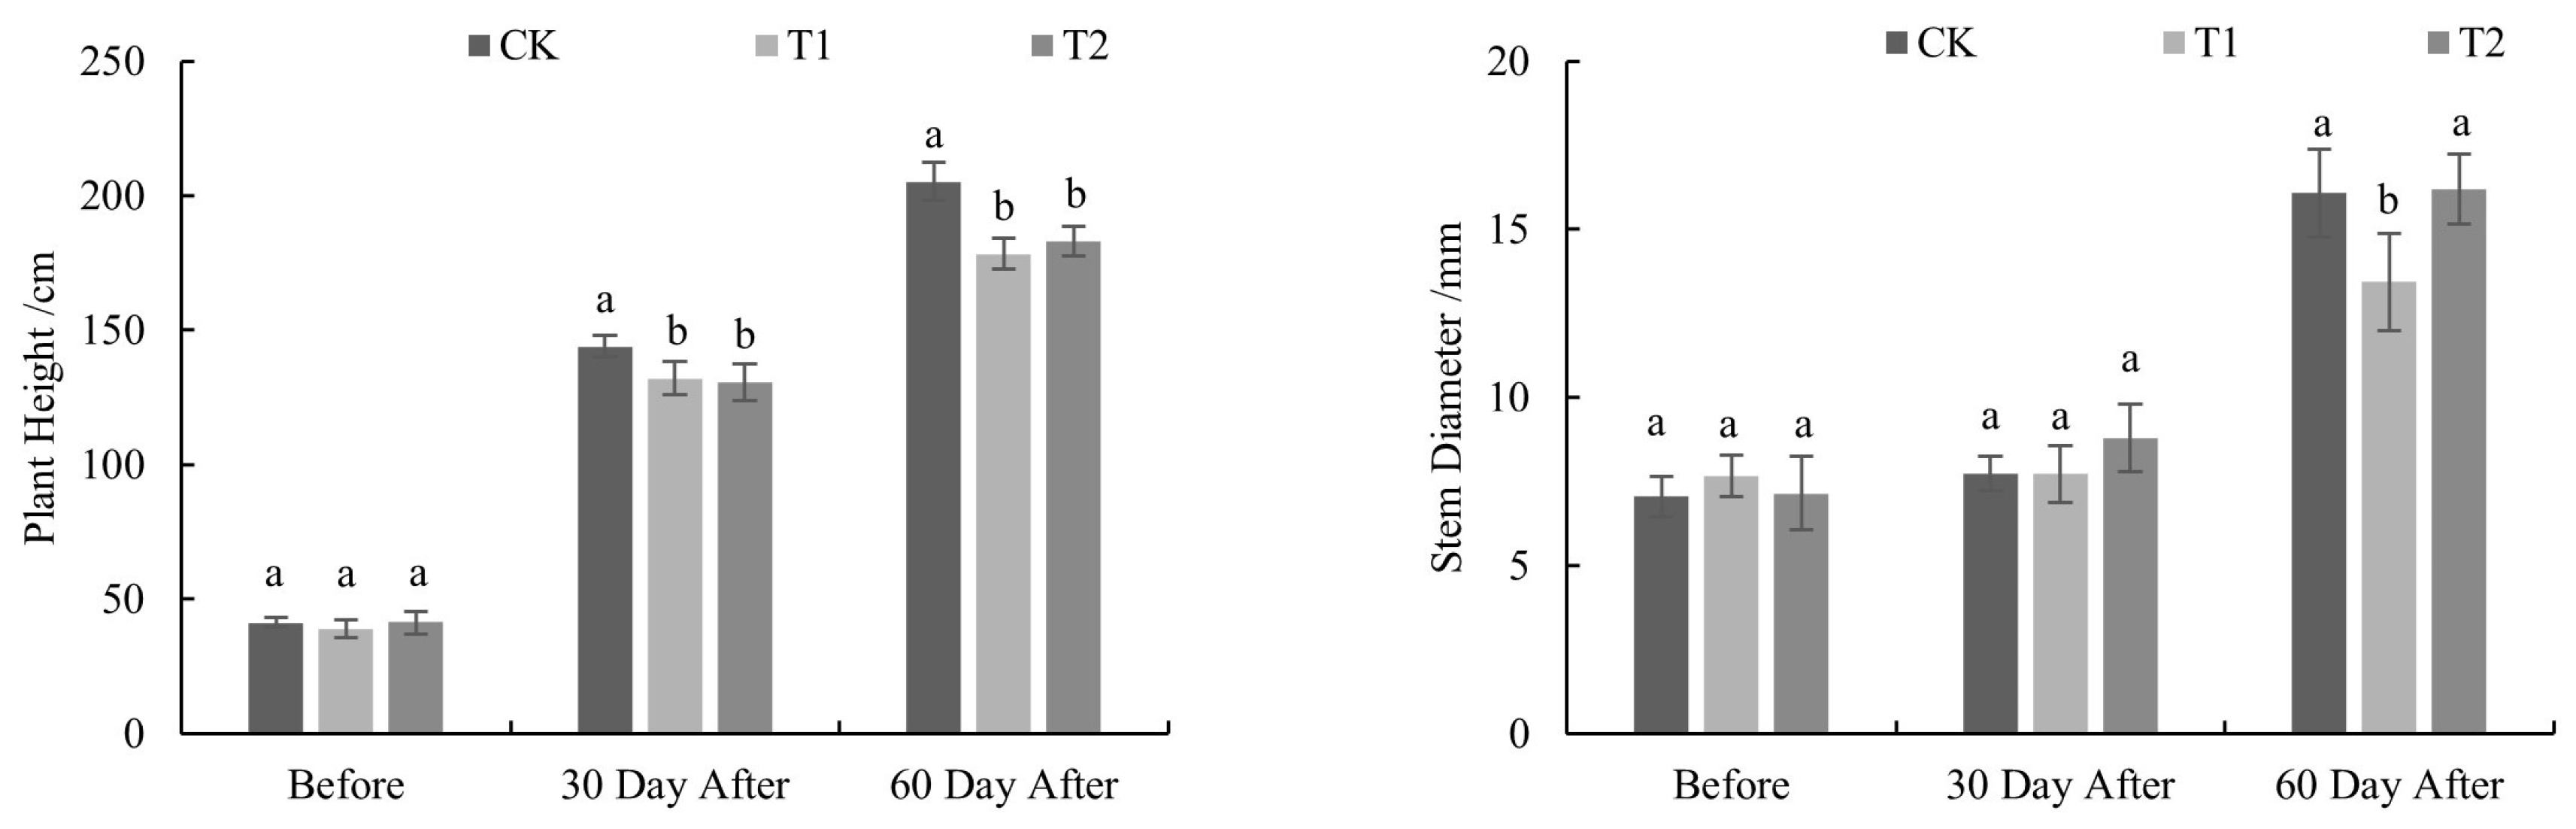
Figure 2.
Single-fruit weight, moisture, and dry weight of tomato fruits under regulated deficit irrigation (RDI).
Figure 2.
Single-fruit weight, moisture, and dry weight of tomato fruits under regulated deficit irrigation (RDI).
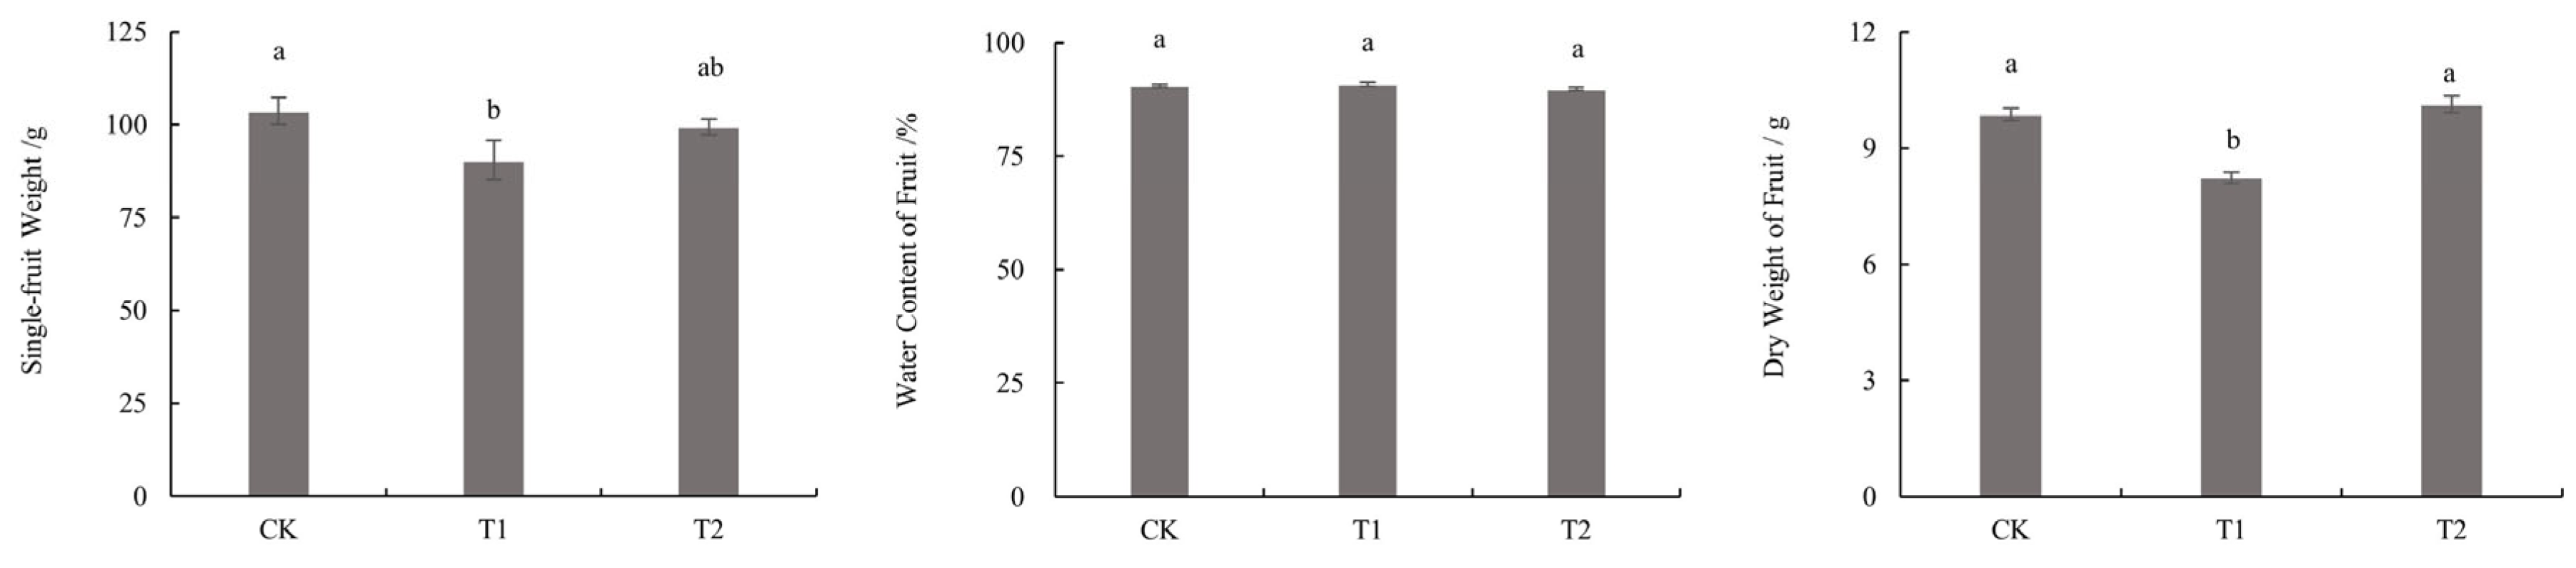
Figure 3.
Effect of RDI on volatile substances in tomato fruits. A: OPLS-DA score plot; B: Percentage of each volatile substance; C: Radar plot of aroma composition; * denotes significant at p< 0.05 for T-test; NS denotes not significant.
Figure 3.
Effect of RDI on volatile substances in tomato fruits. A: OPLS-DA score plot; B: Percentage of each volatile substance; C: Radar plot of aroma composition; * denotes significant at p< 0.05 for T-test; NS denotes not significant.


Table 1.
Fruiting characteristics, yield, and cracking rate of tomato under regulated deficit irrigation (RDI).
Table 1.
Fruiting characteristics, yield, and cracking rate of tomato under regulated deficit irrigation (RDI).
| Treatment | Number of fruitingears | Number of fruits | Yield | Split |
| pcs | g m-2 | % | ||
| CK | 6.33±2.16a | 26.67±0.67a | 5074.68±207.18a | 17.86±3.00a |
| T1 | 5.50±3.98b | 21.56±0.71b | 3195.41±210.86c | 14.74±1.50a |
| T2 | 6.00±2.98ab | 23.00±0.50b | 3727.26±121.59b | 7.67±1.50b |
Table 2.
Determination of hardness of various parts of tomato fruits under different water consumption.
Table 2.
Determination of hardness of various parts of tomato fruits under different water consumption.
| Treatment | Fruit shoulder hardness | Equatorial surface hardness | Navel hardness |
| ——————————N—————————— | |||
| CK | 10.40±0.37b | 8.77±0.24b | 9.17±0.56a |
| T1 | 12.87±0.73a | 11.03±0.40a | 8.43±0.26a |
| T2 | 12.98±0.73a | 10.47±0.29a | 7.20±0.29b |
Table 3.
Determination of nutrient quality of tomato fruits under different water use levels.
| Treatment | Lycopene content | Vitamin C content | SolubleSolids content | SolubleSugar content | TitratableAcid content | Sugar-acidRatio |
| ———mg/100g/FW——— | —————————%/FW————————— | |||||
| CK | 3.88±0.23b | 15.69±0.04c | 7.90±0.04c | 6.65±0.01b | 0.68±0.02c | 9.77±0.05b |
| T1 | 2.97±0.07 c | 17.14±0.12b | 8.25±0.04b | 6.56±0.12b | 0.74±0.01a | 8.85±0.03c |
| T2 | 4.14±0.01 a | 22.62±0.08a | 9.05±0.01a | 7.19±0.06a | 0.72±0.01a | 9.99±0.10a |
Table 4.
Types of volatile substances, aroma description and content of tomato fruits.
| No. | CAS | Class I | Compounds | Aroma Description | Threshold in water,mg kg-1 | OAVa | relative content,μg kg-1 | ||
| CK | T2 | CK | T2 | ||||||
| 1 | 20125-84-2 | Alcohol | 3-Octen-1-ol, (Z)- | Dust, Toasted Nut | - b | - | - | 1125.83±48.95 | 1618.46±57.71 |
| 2 | 18409-18-2 | Alcohol | 2-Decen-1-ol, (E)- | Fruit | - | - | - | 765.87±41.57 | 1559.51±211.56 |
| 3 | 112-42-5 | Alcohol | 1-Undecanol | Mandarin | 0.700000 | 1.10 | 3.18 | 771.46±44.72 | 2227.38±86.01 |
| 4 | 104-54-1 | Alcohol | 2-Propen-1-ol, 3-phenyl- | Floral, Honey, Oil | 0.077000 | 10.82 | 14.23 | 832.92±33.67 | 1095.9±10.03 |
| 5 | 628-99-9 | Alcohol | 2-Nonanol | Cucumber | 0.058000 | 15.78 | 24.21 | 915.07±128.51 | 1403.9±27.54 |
| 6 | 100-51-6 | Alcohol | Benzyl Alcohol | Boiled Cherries, Moss, Roasted Bread, Rose | 2.546210 | 0.55 | 0.73 | 1393.78±166.62 | 1859.25±151.17 |
| 7 | 98-00-0 | Alcohol | 2-Furanmethanol | Burnt, Caramel, Cooked | 4.500500 | 0.33 | 0.38 | 1472.23±49.58 | 1690.18±50.74 |
| 8 | 1195-32-0 | Aromatics | Benzene, 1-methyl-4-(1-methylethenyl)- | Citrus, Pine | 0.085000 | 14.28 | 16.43 | 1213.74±38.85 | 1396.21±13.36 |
| 9 | 99-87-6 | Aromatics | p-Cymene | Citrus, Fresh, Solvent | 0.005010 | 184.81 | 417.29 | 925.9±44.9 | 2090.6±168.78 |
| 10 | 645-56-7 | Phenol | Phenol, 4-propyl- | Additives for fruit ices, jams, chewing gum | 0.107000 | 5.30 | 20.00 | 567.21±117.23 | 2139.79±104.12 |
| 11 | 97-53-0 | Phenol | Eugenol | Burnt, Clove, Spice | 0.002500 | 1625.74 | 1142.38 | 4064.35±265.06 | 2855.95±134.19 |
| 12 | 123-08-0 | Aldehyde | BenzAldehyde, 4-hydroxy- | Roast | - | - | - | 878.27±35.94 | 2301.59±137.88 |
| 13 | 53448-07-0 | Aldehyde | 2-Undecenal, E- | Bakery, Dairy, Meat, Seasoning Pickle Additives | 0.001400 | 601.17 | 1644.30 | 841.64±65.59 | 2302.03±161.4 |
| 14 | 2463-77-6 | Aldehyde | 2-Undecenal | Bakery, Dairy, Meat, Seasoning Pickle Additives | - | - | - | 810.23±30.02 | 2256.06±122.44 |
| 15 | 5910-87-2 | Aldehyde | 2,4-Nonadienal, (E,E)- | Cereal, Deep Fried, Fat, Watermelon, Wet Wool | 0.000100 | 10266.53 | 18183.86 | 1026.65±133.63 | 1818.39±139.21 |
| 16 | 100-52-7 | Aldehyde | BenzAldehyde | Bitter Almond, Burnt Sugar, Cherry, Malt, Roasted Pepper | 0.750890 | 1.48 | 1.18 | 1108.55±21.31 | 882.83±20.73 |
| 17 | 111-71-7 | Aldehyde | Heptanal | Citrus, Fat, Green, Nut | 0.002800 | 381.74 | 537.24 | 1068.87±30.31 | 1504.28±45.59 |
| 18 | 66-25-1 | Aldehyde | Hexanal | Apple, Fat, Fresh, Green, Oil | 0.061500 | 10.85 | 17.19 | 667.37±45.32 | 1057.05±27.89 |
| 19 | 3913-81-3 | Aldehyde | (E)-2-Decenal | Fat, Fish, Orange | 0.002700 | 206.48 | 775.05 | 557.48±99.61 | 2092.64±65.66 |
| 20 | 25152-84-5 | Aldehyde | 2,4-Decadienal, (E,E)- | Coriander, Deep Fried, Fat, Oil, Oxidized | 0.000077 | 16250.31 | 20052.04 | 1251.27±61.5 | 1544.01±51.11 |
| 21 | 35158-25-9 | Aldehyde | 2-Isopropyl-5-methylhex-2-enal | Floral | - | - | - | 822.05±75.88 | 1384.37±128.68 |
| 22 | 13877-91-3 | Terpenoids | .beta.-Ocimene | Floral | - | - | - | 1309.88±400.45 | 3178.73±583.19 |
| 23 | 18794-84-8 | Terpenoids | (E)-.beta.-Famesene | Spice, herb, fresh green, sweet | - | - | - | 1751.63±115.65 | 1088.94±61.17 |
| 24 | 99-85-4 | Terpenoids | .gamma.-Terpinene | Bitter, Citrus | 1.000000 | 1.14 | 1.50 | 1139.89±16.62 | 1495.44±42.78 |
| 25 | 3338-55-4 | Terpenoids | 1,3,6-Octatriene, 3,7-dimethyl-, (Z)- | Floral | 0.034000 | 36.65 | 83.75 | 1246.21±373.83 | 2847.45±491.32 |
| 26 | 99-86-5 | Terpenoids | 1,3-Cyclohexadiene, 1-methyl-4-(1-methylethyl)- | Lemon | 0.080000 | 14.00 | 27.65 | 1119.74±347.31 | 2211.81±382.22 |
| 27 | 99-83-2 | Terpenoids | .alpha.-Phellandrene 1 | Citrus, Fresh, Mint, Pepper, Spice, Wood | 0.040000 | 29.29 | 68.85 | 1171.55±437.16 | 2753.98±478.16 |
| 28 | 1193-18-6 | Ketone | 2-Cyclohexen-1-one, 3-methyl- | Savory | - | - | - | 1027.06±11.1 | 977.3±9.21 |
| 29 | 2497-21-4 | Ketone | 4-Hexen-3-one | Fruit | - | - | - | 1507.44±74.97 | 1728.39±26.55 |
| 30 | 30086-02-3 | Ketone | 3,5-Octadien-2-one, (E,E)- | Green | 0.100000 | 18.45 | 20.64 | 1844.87±46.97 | 2064.1±38.23 |
| 31 | 3796-70-1 | Ketone | 5,9-Undecadien-2-one, 6,10-dimethyl-, (E)- | Fruit | 0.060000 | 29.87 | 18.30 | 1792.31±113.17 | 1097.75±58.19 |
| 32 | 110-93-0 | Ketone | 5-Hepten-2-one, 6-methyl- | Citrus, Mushroom, Pepper, Rubber, Strawberry | 0.068000 | 14.86 | 17.77 | 1010.69±10.07 | 1208.68±28.15 |
| 33 | 1072-83-9 | Heterocyclic compound | Ethanone, 1-(1H-pyrrol-2-yl)- | Bread, Cocoa, Hazelnut, Licorice, Walnut | 58.585250 | 0.02 | 0.02 | 1026.21±6.3 | 963.10±22.23 |
| 34 | 18640-74-9 | Heterocyclic compound | 2-Isobutylthiazole | Green, Tomato, Tomato Leaf, Wine | 0.029000 | 17.46 | 12.24 | 506.47±8.82 | 355.03±8.21 |
| 35 | 13360-64-0 | Heterocyclic compound | Pyrazine, 2-ethyl-5-methyl- | Fruit, Green | 0.016000 | 63.61 | 193.43 | 1017.71±415.87 | 3094.86±519.07 |
| 36 | 3777-69-3 | Heterocyclic compound | Furan, 2-pentyl- | Butter, Floral, Fruit, Green Bean | 0.005800 | 172.68 | 215.36 | 1001.55±61.01 | 1249.09±70.06 |
| 37 | 539-90-2 | Ester | Butanoic acid, 2-methylpropyl ester | Fruit | 0.009400 | 106.84 | 168.83 | 1004.3±64.62 | 1587.03±70.14 |
| 38 | 112-32-3 | Ester | Formic acid, octyl ester | Floral | - | - | - | 894.11±97.05 | 1350.55±89.24 |
| 39 | 112-06-1 | Ester | Acetic acid, heptyl ester | Floral, Fresh | 0.420000 | 2.16 | 3.23 | 905.4±70.49 | 1355.18±79.3 |
| 40 | 122-72-5 | Ester | 3-Phenyl-1-propanol, acetate | Floral | - | - | - | 577.91±184.22 | 1044.9±121.21 |
| 41 | 659-70-1 | Ester | Butanoic acid, 3-methyl-, 3-methylbutyl ester | Green | 0.020000 | 44.41 | 70.85 | 888.23±71.54 | 1416.91±171.11 |
| 42 | 120-51-4 | Ester | Benzyl Benzoate | Balsamic, Herb, Oil | 0.341000 | 3.86 | 2.46 | 1315.52±140.07 | 840.36±55.24 |
| 43 | 141-12-8 | Ester | 2,6-Octadien-1-ol, 3,7-dimethyl-, acetate, (Z)- | Floral, Fruit | 2.000000 | 0.39 | 1.09 | 786.34±60.03 | 2189.92±125.53 |
| 44 | 2311-46-8 | Ester | Hexanoic acid, 1-methylethyl ester | Fresh | - | - | - | 1031.25±126.21 | 1592.28±200.12 |
| total content, μg kg-1 | 48957.05±2716.49 | 74772.15±2672.71 | |||||||
aData sources Flavor Extract Manufacturers Association (FEMA) (femaflavor.org)(Flavor Ingredient Library, 1999)and ODOUR THRESHOLDS(Zeist, 2011). b “-” indicates that no odor threshold was found for the compound.
Table 5.
Classification of Tomato Fruit Aroma Composition.
| Flavor Classification | CAS | Class I | Compounds |
| floral | 3777-69-3 | Heterocyclic compound | Furan, 2-pentyl- |
| 3338-55-4 | Terpenoids | 1,3,6-Octatriene, 3,7-dimethyl-, (Z)- | |
| 104-54-1 | Alcohol | 2-Propen-1-ol, 3-phenyl- | |
| 112-06-1 | Ester | Acetic acid, heptyl ester | |
| 141-12-8 | Ester | 2,6-Octadien-1-ol, 3,7-dimethyl-, acetate, (Z)- | |
| fruity | 539-90-2 | Ester | Butanoic acid, 2-methylpropyl ester |
| 13360-64-0 | Heterocyclic compound | Pyrazine, 2-ethyl-5-methyl- | |
| 3796-70-1 | Ketone | 5,9-Undecadien-2-one, 6,10-dimethyl-, (E)- | |
| 645-56-7 | Phenol | Phenol, 4-propyl- | |
| green | 111-71-7 | Aldehyde | Heptanal |
| 659-70-1 | Ester | Butanoic acid, 3-methyl-, 3-methylbutyl ester | |
| 30086-02-3 | Ketone | 3,5-Octadien-2-one, (E,E)- | |
| 18640-74-9 | Heterocyclic compound | 2-Isobutylthiazole | |
| 628-99-9 | Alcohol | 2-Nonanol | |
| 66-25-1 | Aldehyde | Hexanal | |
| 120-51-4 | Ester | Benzyl Benzoate | |
| Orange | 99-87-6 | Aromatics | p-Cymene |
| 99-83-2 | Terpenoids | .alpha.-Phellandrene 1 | |
| 110-93-0 | Ketone | 5-Hepten-2-one, 6-methyl- | |
| 1195-32-0 | Aromatics | Benzene, 1-methyl-4-(1-methylethenyl)- | |
| 112-42-5 | Alcohol | 1-Undecanol | |
| Oil | 25152-84-5 | Aldehyde | 2,4-Decadienal, (E,E)- |
| 5910-87-2 | Aldehyde | 2,4-Nonadienal, (E,E)- | |
| 3913-81-3 | Aldehyde | (E)-2-Decenal | |
| Bitter | 97-53-0 | Phenol | Eugenol |
| 100-52-7 | Aldehyde | BenzAldehyde | |
| 99-85-4 | Terpenoids | .gamma.-Terpinene | |
| Lemon | 99-86-5 | Terpenoids | 1,3-Cyclohexadiene, 1-methyl-4-(1-methylethyl)- |
| bakery | 53448-07-0 | Aldehyde | 2-Undecenal, E- |
Disclaimer/Publisher’s Note: The statements, opinions and data contained in all publications are solely those of the individual author(s) and contributor(s) and not of MDPI and/or the editor(s). MDPI and/or the editor(s) disclaim responsibility for any injury to people or property resulting from any ideas, methods, instructions or products referred to in the content. |
© 2025 by the authors. Licensee MDPI, Basel, Switzerland. This article is an open access article distributed under the terms and conditions of the Creative Commons Attribution (CC BY) license (http://creativecommons.org/licenses/by/4.0/).
Copyright: This open access article is published under a Creative Commons CC BY 4.0 license, which permit the free download, distribution, and reuse, provided that the author and preprint are cited in any reuse.


