Submitted:
26 May 2025
Posted:
27 May 2025
You are already at the latest version
Abstract
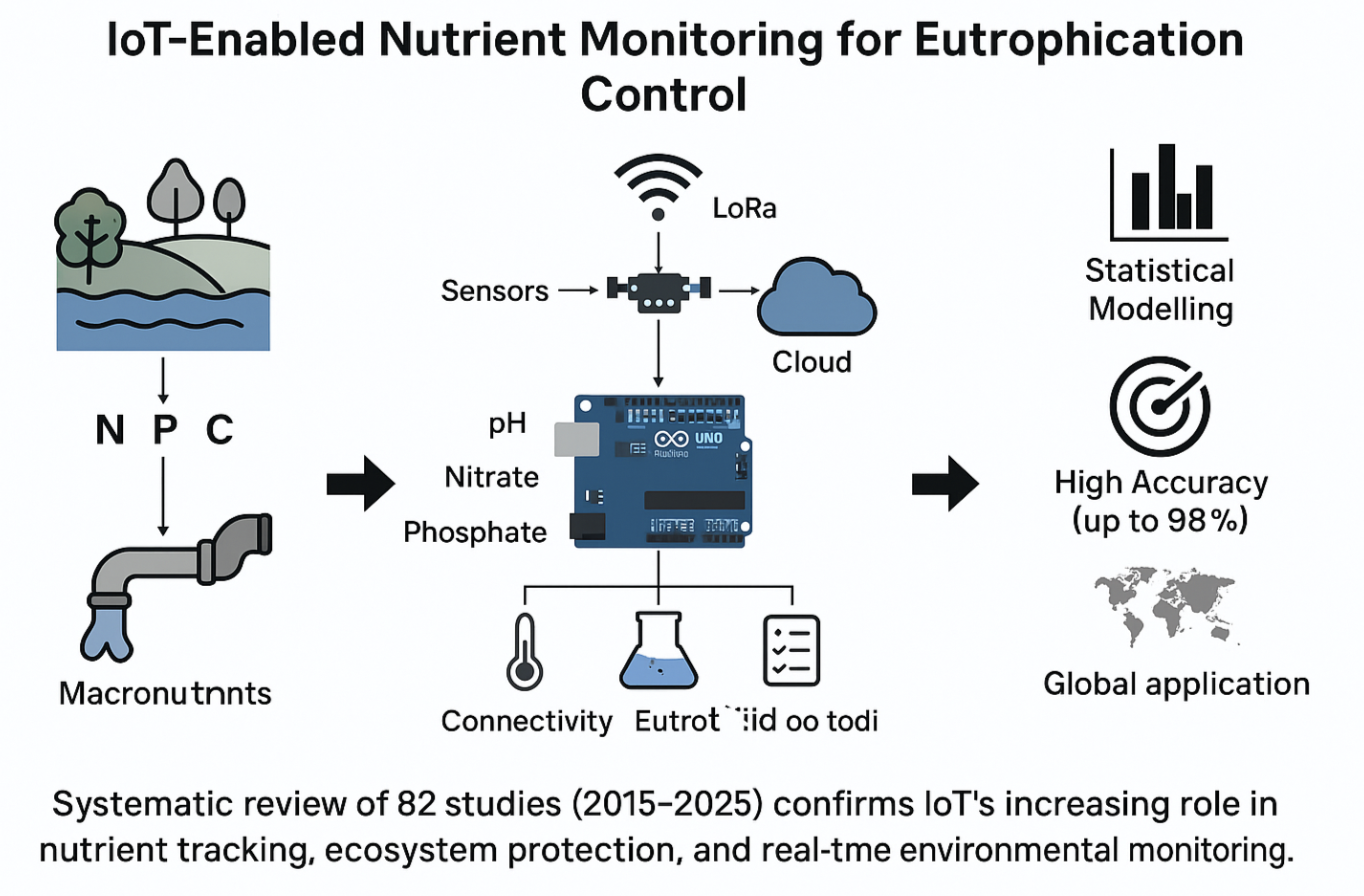
Excessive macronutrients—particularly nitrogen (N), phosphorus (P), and carbon (C)—contribute to eutrophication, algal blooms, and water quality degradation in both aquatic and agricultural ecosystems. Traditional nutrient monitoring methods are time-intensive and often lack real-time responsiveness. The Internet of Things (IoT) presents a transformative opportunity for continuous, precise macronutrient monitoring. This systematic review evaluates the global application of IoT technologies in macronutrient monitoring systems, identifying technological trends, challenges, and opportunities for eutrophication control and sustainable nutrient management. The review followed the PRISMA 2020 guidelines and analyzed studies published between 2015 and 2025 across Scopus, Web of Science, and Google Scholar. Inclusion criteria focused on peer-reviewed English-language studies involving real-time IoT-based monitoring of nitrogen, phosphorus, or carbon in agricultural or aquatic settings. A total of 20,251 records were screened, with 82 studies meeting all eligibility criteria. IoT-based macronutrient monitoring research has grown steadily, with statistical modeling used in 43.90% of studies. Thematic emphasis centered on nutrient pollution/removal (52.38%), algal blooms and eutrophication (25.00%), and water quality modeling (11.90%). China (31.70%) and the United States (18.30%) led in research contributions. Despite promising accuracies (up to 98.67%), major gaps remain in reporting hardware specifications, cloud infrastructure, and connectivity protocols, affecting reproducibility. IoT technologies offer substantial potential for enhancing nutrient tracking, precision agriculture, and water quality management. However, adoption is hindered by technical, infrastructural, and reporting barriers, particularly in developing regions. Greater standardization, improved training, and policy integration are needed to realize the full potential of IoT-enabled nutrient monitoring systems.
Keywords:
internet of things
; macronutrient monitoring
; water quality monitoring
; agriculture
; aquatic ecosystem
; sensor accuracy
; precision nutrition
; statistical modeling
1. Introduction
Macronutrient regulation, such as carbon(C), nitrogen (N), phosphorus (P), and potassium (K), plays a crucial role in ensuring the health of agricultural crops and aquatic food webs. Water bodies are contaminated by human activities such as solid waste disposal, oil spills, sewage discharge, and air-borne contaminants, posing a significant risk to aquatic food webs and sustainable agriculture (Gehlot et al., 2018). In agricultural practice, nutrient deficiency can lead to reduced crop yield, loss of fertile land, and suboptimal manure or fertilizer practice, thereby affecting food security and balance in the food supply chain (Mahapatro et al., 2024). Meanwhile, excessive nutrient runoff into water bodies causes eutrophication, leading to al-gal blooms, oxygen depletion, and aquatic life loss. Therefore, innovative IoT-based methods of monitoring and controlling water pollution are required (Prabu et al., 2023). Traditional methods to monitoring macronutrient in water quality and agriculture heavily depended on hand testing via sample taking (Stubbs, 2016). The process involved sample collection of water or soil to the laboratory for measurement of macronutrient levels, and then used related controlling measures (El-Tohamy et al., 2019). The entire process takes a lot of time, it is costly and less effective with the numerous steps taken to ascertain the pollutants, extent of contaminations, trace the source of the pollutants (Das and Jain, 2017). Long-term, extending knowledge of harmful consequences, e.g., eutrophication, algal bloom, and pollution of water raised a need of innovative solutions for monitoring and precluding water pollution (Ighalo et al., 2021). Such a step marks the ever-increasing role of IoT innovations, where sensors, real-time monitoring systems, auto-mated control and wireless data acquisition mechanism represent a greener way of increasing nutrient utilization, reducing pollution, and maintaining water quality. Water quality in agricultural practices directly affects production of crops yield, soil fertility, and productivity level. Current research towards macro-nutrient sensing is focused on continuous sensing and multi-sensing, and real-time monitoring systems (Ibrahim et al., 2018); this is required since this enables farmers to detect water contamination or macronutrient imbalances in real time. Furthermore, recent innovative technologies such as artificial intelligence (Zulkifli et al., 2022), machine learning (Lalithadevi et al., 2019), deep learning (Thai-Nghe et al., 2020) and fuzzy logic (Nadu, 2020), when combined with IoT systems are referred to as efficient methods for water quality monitoring (Elijah et al., 2018). The key motivation for the use of IoT in macronutrient monitoring is to improve water quality in aquatic systems and increase agricultural production and sustainability. In there, effective management of macronutrients plays an important role in optimizing agricultural production while minimizing environmental effects, such as land degradation and water pollution. However, current use or commercially available real time monitoring systems for macronutrient monitoring on large scale in agriculture does not exist (Postolache et al., 2022). Some of the reasons that contribute to adoption at slower rate include high capital investment needs, technological complexity and resistance to change. Applying IoT systems in macronutrient monitoring requires substantial investment in sensing equipment, network infrastructure and examination tools (Elijah, Rahman, Orikumhi, Leow and Hindia, 2018). In agricultural production it be difficult to justify large scale adoption of IoT systems due to the substantial investment required which can be costly. Moreover, the integration of sensors into the IoT system may require extremely high technical expertise. Inadequate information or capital in some farmers may hinder the adoption of IoT systems, preventing them from becoming widely accepted. The IoT phenomenon has applicability in variety of applications contexts (Zulkifli et al., 2022), such as healthcare and well-being, property and building automation, increasing energy efficiency (Olatinwo and Joubert, 2019), industrial automation, smart metering and smart grid, asset management and logistics, autonomous vehicle and smart transportation, precision precision farming, smart retailing, aquaculture (Boonsong et al., 2020), and monitoring water quality (Oztemel and Gursev, 2020; Zulkifli et al., 2022) . The continuous development of research in macronutrient monitoring, integrated with recent technological advancements in IoT, is a key focus of this study. The aim is to conduct a systematic literature review to examine the latest research trends on macronutrient monitoring. This review offers useful insights into the innovation ecosystem and assists researchers in identifying available solutions for these challenges and issues. A comparative analysis of existing reviews and proposed systematic review is presented in Table 1.
1.1. Research Questions
This review investigates the application of IoT technologies in macronutrient monitoring by assessing current implementations, identifying technical and operational limitations, and exploring opportunities for enhanced nutrient management. The following research questions guided the review:
- What IoT technologies are currently used to monitor nitrogen, phosphorus, and carbon in agricultural and aquatic environments?
- What are the key technical, financial, and infrastructural barriers to successful implementation of IoT-based nutrient monitoring systems?
- How do limitations in reporting, system accuracy, and connectivity affect the performance and scalability of these systems?
- What potential exists for integrating IoT with advanced technologies such as AI, cloud computing, and machine learning to improve nutrient monitoring?
- What factors influence user adoption and long-term sustainability of IoT-enabled macronutrient monitoring solutions, especially in low-resource settings?
1.2. Research Rationale
The fast-paced progress of IoT technologies reshapes traditional methods when handling data acquisition and analysis for health care and agricultural and nutritional domains. The monitoring of macronutrients emerges as a vital operational field which presents substantial advantages for both human healthcare improvement and agricultural production efficiency and nutrition individualization. The technology promises real-time accurate automation of macronutrient tracking yet major operational and technical obstacles block their general use and success implementation. Multiple issues make it difficult to implement IoT systems through data reliability problems and privacy threats and standardization requirements and device interconnection boundaries. The implementation of IoT solutions becomes complicated in practical environments because of resource restrictions as well as user unawareness and insufficient infrastructure. The barriers to adopt IoT-based monitoring for macronutrients do not prevent the potential benefits of innovative solutions for better results. A systematic method is used by this review to investigate present IoT applications in macronutrient monitoring by identifying key challenges together with available untapped prospects. The research analyzes literature from 2015 through 2025 to find IoT technology deficits and successful practices and developing trends which will support upcoming scientific investigations while guiding decision-makers in IoT technology adoption. Such an extensive assessment works to boost overall understanding while supporting strategic growth within IoT-based macronutrient tracking research.
1.3. Research Objectives
The primary objective of this systematic review is to evaluate how Internet of Things (IoT) technologies are being applied to monitor macronutrients—specifically nitrogen (N), phosphorus (P), and carbon (C)—in agricultural and aquatic systems. The review aims to:
- Identify current IoT practices and technologies used in nutrient monitoring;
- Examine implementation barriers such as high costs, limited reporting of system architecture, and lack of standardization;
- Analyze trends in sensor use, connectivity, cloud integration, and data processing techniques;
- Assess how IoT-enabled systems contribute to improving nutrient tracking accuracy and supporting real-time decision-making;
Synthesizing findings from 82 peer-reviewed studies (2015–2025), this review contributes to a clearer understanding of the state of IoT adoption in macronutrient monitoring and offers practical guidance for improving deployment in both developed and developing regions.
1.4. Research Contributions
This review provides a systematic evaluation of 82 studies on the use of IoT technologies for monitoring nitrogen, phosphorus, and carbon in agricultural and aquatic environments. The key contributions are:
- Identified how IoT is used for macronutrient monitoring, with a focus on eutrophication control, water quality, and precision agriculture.
- Found that 75% of studies did not report microcontroller use, and 70.24% omitted connectivity details, highlighting a lack of system transparency.
- Categorized IoT systems into basic (sensor-only), intermediate (cloud-connected), and advanced (AI-integrated) stages based on reported implementations.
- Showed that 42.86% of studies used statistical models, with some reporting accuracies up to 98.67%, despite many lacking performance metrics.
- Provided guidance on standardization, scalability, and policy relevance to support improved implementation of IoT-based nutrient monitoring systems.
1.5. Research Novelty
This review offers a novel contribution by systematically analyzing the use of IoT technologies for monitoring nitrogen, phosphorus, and carbon—an area that remains sparsely addressed in the existing literature. While IoT applications in agriculture and water management are widely reported, few studies examine their role in macronutrient tracking. This work addresses that gap by identifying key challenges such as poor reporting of system components, limited use of advanced analytics, and barriers to adoption in low-resource settings. It also introduces a practical categorization of IoT adoption levels observed in the literature, providing a clearer understanding of the current maturity and limitations of IoT-based nutrient monitoring.
2. Materials and Methods
2.1. Eligibility Criteria
A systematic review of all peer-reviewed and published studies relevant to the application of IoT technologies for monitoring macronutrients was conducted for evaluation. Only research articles published in English between 2015 and 2025 were considered eligible for inclusion. The researcher applied stringent criteria to select studies dedicated to IoT-based macronutrient level measurement and analysis of proteins and carbohydrates and fats. Research about overall health monitoring systems that failed to mention macronutrients was excluded from consideration. Tight selection criteria included both research articles that presented valid empirical frameworks and methodology to guarantee the scientific quality of the included studies. The approach used mirrors those found in recent IoT-related reviews across energy and SME contexts (Msane et al., 2024; Molete et al., 2025; Kgakatsi et al., 2024). Table 2 summarizes the admission and rejection rules for articles incorporated in this assessment.
2.2. Information Sources
An organized research strategy involving different respected online databases enabled the identification of suitable research studies. This research used Scopus, Web of Science and Google Scholar databases because these platforms offer extensive coverage of peer-reviewed technology health science and engineering research (Dladla & Thango, 2025; Thobejane & Thango, 2024). Several targeted keywords including “Internet of Things” and “IoT” and their variations with both “macronutrients” and “nutrient monitoring” together with “food consumption” were used in the search. The researchers conducted extensive searches in each database to retrieve all qualified studies together with appropriate documents from informal literature and conference proceedings. The last search round occurred in April 2025 along with reference list verification from identified articles to guarantee data collection completeness. Duplicate records were carefully removed to avoid repetition and bias in the selection of studies.
2.3. Search Strategy
The research adhered to an organized approach that followed methods outlined in PRISMA 2020 guideline (Khanyi et al., 2024). The research utilized the major academic search engines Google Scholar, Scopus, and Web of Science for database research. Specific keyword bundles served as the foundation to locate academic papers regarding macronutrient monitoring together with water quality assessment. The Web of Science query contained these terms for the search: ("nutrient management" OR "nutrient removal" OR "aquatic systems") AND ("eutrophication" OR "algal bloom") AND ("phosphorus" OR "nitrogen" OR "carbon" OR "dissolved carbon") OR ("IoT" OR "Internet of Things") AND ("water quality" OR "water monitoring"). The search engine at Scopus implemented (nutrient management OR nutrient removal) AND (eutrophication OR algal bloom) AND (phosphorus OR nitrogen) AND IoT as its search keywords. The Google Scholar search employed "nutrient management" OR "nutrient removal" as its search criteria along with "eutrophication" or "algal bloom" and included "phosphorus" OR "nitrogen". The applied search yielded a total of 2,743 articles on Web of Science and 708 articles on Scopus alongside 16,800 articles on Google Scholar. The research utilized information from scientific papers released from 2015 to 2025 for maintaining contemporary relevance throughout the review. The selection of unique timeframes by researchers served to prevent the retrieval of duplicate information. The authors performed methodical steps for filtering out high-quality relevant studies that emerged after completing the retrieval phase, as recommended in previous data-intensive systematic reviews (Pingilili et al., 2025; Kgakatsi et al., 2024). The data source, search string and number of results found are presented in Table 3.
2.4. Selection Process
Four researchers initially screened the first 80 records' titles and abstracts obtained from the search independently. The researchers conducted their selection independently for all records pertaining to their specified eligibility requirements and research aims. The four researchers met for comparison of their selections following their initial independent reviews. A discussion session among the researchers maintained clear understanding of the selection criteria which resulted in improved consistency throughout the remaining assessment stages. Each of the four researchers individually screened all remaining titles and abstracts after the calibration process. Judgment was rendered on studies by individual assessment to achieve both fairness and minimize biased results. The researchers openly exchanged their reasons for disagreements before reaching consensus on whether the study would continue to full-text screening. All four reviewers conducted an independent examination of full-text articles to determine eligibility during the last phase of evaluation. Group discussions served as the method to solve any disagreement that arose between researchers. Such a methodical multi-step screening assured the selection process remained open and dependable in support of research aims (Thobejane & Thango, 2024; Chabalala et al., 2024). The Method for selection process employed are presented in Table 4.
2.5. Data Collection Process
The researchers followed the eligibility screening to participate in the data collection procedures. Researchers utilized a shared Excel platform for accurately documenting essential observations from chosen studies. Each researcher examined separately their designated studies to gather relevant data that included information about IoT systems, macronutrient monitoring practices, used technologies and study scenarios alongside documented challenges. The researchers cross-validated their extracted details about study summaries with an additional team member to confirm precision. Team members discussed findings and settled disagreements by coming to agreement during discussions of unclear interpretation and inconsistencies. This collaborative cross-validation strategy was successfully implemented in previous reviews on transformer condition monitoring and SME data systems (Msane et al., 2024; Ngcobo et al., 2024). The multitier methodology kept the research dataset solid while enabling quality preservation before moving into elaborate stage aggregating in the next phase. The Data collection process is illustrated in Figure 1.
2.6. Data Items
This assessment followed a systematic approach to collect specific data points that allowed for study analysis as well as comparison of IoT applications in macronutrient monitoring. Both technological and contextual study features were recorded through specific data items that enabled effective analysis for synthesis. Data were extracted to reflect critical aspects such as the type of macronutrients monitored (carbon, nitrogen, phosphorus, potassium), the sensing technologies used (sensors), the application environment (agriculture fields or aquatic ecosystems), and the connectivity infrastructure applied (Wi-Fi).Additional elements collected included study outcomes, such as improvement in monitoring efficiency or water quality, major challenges encountered, such as sensor drift or high costs, and any recommendations provided by the authors for future research. The research collected details about manual and machine-learning-driven data processing together with cloud-based data management when such information became available. The gathered data received spreadsheet organization to categorize studies by technology category and result achievements. (Molete et al., 2025; Pingilili et al., 2025).
A methodical organizational system enabled researchers to classify research data while identifying recurring patterns and analyzing system methods and identifying obstacles and potential developments in nutrient monitoring via Internet of Things technology.
2.6.1. Data Collection Method
A straightforward procedure was implemented to collect data used for this review. The Excel table included essential headings which related to the studies. The procedure required the following sequential method: (1) An Excel sheet was prepared with columns such as Paper ID, Paper Title, Citations, Year Published, Research Type, Online Repository, Journal Name, Country of Authors, Water Source, Investigated Water Aspect, Nitrogen (N), Phosphorus (P), Carbon, Sensors Used, Microcontroller, Connection Type, Cloud Used, Software Used, Model Evaluation Metrics, Accuracy, Key Findings, IEEE Reference Format, and Link. (Dladla & Thango 2025; Msaneet al.,2024). (2) Before starting full extraction, reviewers were given time to study and practice the meaning of each heading. Sample papers were used to ensure a common understanding among the team (Khanyi et al., 2024; Pingilili et al., 2025). (3) Each assigned paper was independently read by the reviewer. They extracted the necessary details and entered them into the spreadsheet. Where differences were found, group discussions were held to reach consensus (Ngcobo et al., 2024; Molete et al., 2025). The data collection methods used in this study is illustrated in Figure 2.
2.6.2. Definition of Collected Data Variables
In addition to the outcomes related to nutrient monitoring (nitrogen, phosphorus, and carbon), we systematically extracted a broad set of variables to better understand the context and technological approaches of each study. These variables were defined in advance to ensure consistency during the data extraction process. (Kgakatsi et al., 2024; Thobejane & Thango, 2024). The following data items were collected. The Fields description for the table used to collect data is tabulated in Table 5.
2.7. Study Risk of Bias Assessment
The narrative review method evaluated bias risks in the evaluated studies for this assessment. Professionals reviewed all studies by hand using three core aspects. The first analysis involved verifying that research included comprehensive reporting about its objectives and both IoT setup processes and all nutrient measurement outcomes. Secondly, we evaluated real-world applicability through verifying the IoT systems ran tests in natural agricultural fields or aquatic environments instead of laboratory settings alone. Transparency analysis evaluated the study by identifying and discussing every limitation and weakness and areas for improvement which required addressing. Studies received one of three assessments which included comprehensive reporting and partial reporting and limited reporting. The judges disseminated opinions until they achieved mutual agreement about their ratings (Molete et al., 2025). The study risk bias assessment used in this study is illustrated in Figure 3.
2.8. Effect Measures
Obtained results across different studies appeared transparent and homogeneous through the utilization of simple effect measures. The detection performance of IoT systems used percentage data to reflect sensor accuracy and system reliability in reported studies (Thobejane & Thango, 2024). The main outcome included the identified 85% accuracy rate of nitrogen sensors during testing. The effectiveness of different IoT systems or technologies was represented through visual comparison methods such as graphical presentations. The main method used for comparisons evaluated system performance in detecting macronutrients during real-time operations and their response time to water quality changes. Frequency counts were used to identify the frequency of appearance of specific sensors and methods through multiple studies. The basic effect measures enabled the synthesis process to become simpler for comparing studies despite their diverse data types. The method for effect measures used in this study is tabulated in Table 6.
2.9. Synthesis
The authors describe their approach for analyzing and processing selected research to achieve conclusions regarding IoT applications within macronutrient surveillance. Study evaluation for synthesis took place first followed by data preparation that culminated in building tables for data visualization and interpretation (Dladla & Thango, 2025). The review used both qualitative methods along with fundamental quantitative approaches to generate significant conclusions from the collected data. Additional information regarding the synthesis procedure is detailed in the following subsections.
2.9.1. Eligibility for Synthesis
Studies advanced for synthesis needed to fulfill three requirements: they needed an IoT specific monitoring system for nutrients while also focusing on agricultural or aquatic settings and offering results about nitrogen and phosphorus and carbon detection. Research authors created a table that compared intervention characteristics across different studies relative to established criteria. The analysis included only studies which met every set inclusion requirement. The research excluded informational models when they lacked empirical evidence. The eligibility for synthesis used in this study is tabulated in Table 7.
2.9.2. Data Preparation for Synthesis
Multiple preparation steps were applied to research data after its conclusion to make it suitable for comprehensive synthesis. The research team conducted a review to normalize all terminology found between different studies. Standardization efforts included grouping 'Nitrogen sensors' from previously separate names like 'nitrate sensor' and 'NO3 sensor'. Additionally, the classification terms for water environments were brought together under 'aquatic system' by grouping 'pond' with 'lake'. The process required unit consistency as a main concentration point. A conversion factor linked the different units whenever studies presented nutrients using mg/L versus using ppm. Alternatively, the team added narrative descriptions for unit conversion. Treatment was given to studies without reported units by adding footnotes before their information in the data summary table (Pingilili et al., 2025). The study retained its position in synthesis while a note was added when data included incomplete information (such as sensor accuracy not provided). The team was able to mention absent data points but continued with pertinent qualitative findings. The studies remained in the narrative synthesis instead of being eliminated to maintain an inclusive perspective.
2.9.3. Tabulation and Visual Display of Results
A systematic method was applied to both categorize study information before creating visual displays for data representation as shown in Figure 5. The team undertook a systematic review of all information after data preparation where they organized studies following major variables relating to sensor types and environmental conditions and nutrient monitoring types. The applied group-based organization enabled better identification of recurring patterns and suitable comparison of study outcomes. The team implemented visual display formats after performing the groupings. Bar charts together with pie charts helped present distributions plus frequencies which made reading the results simpler for readers. The visual presentation focused on displaying three elements: research equipment utilization along with specific nutrient assessment methods and geographic distribution of research activities (Kgakatsi et al., 2024).
2.9.4. Synthesis of Results
The research group employed both qualitative and descriptive approaches for synthesizing the selected study results as shown in Figure 6. This research approach enabled the team to perform organized analysis and differentiate different findings because the studies employed divergent approaches and reported different outcomes. The qualitative synthesis method enabled researchers to observe recurring positive effects alongside recurrent challenges which appeared across the investigated studies (Chabalala et al., 2024). The descriptive segment involved basic quantification through counting of studies using specified sensors and research approaches toward particular nutrients. The synthesis approach avoided the implementation of meta-analysis software since the research studies displayed inconsistent research design characteristics. The team used spreadsheet applications to group data manually for creating consistent summaries that maintained easy understanding. The authors chose this mixed methodology because they needed to evaluate research amidst their various data collection techniques.
2.9.5. Exploring Causes of Heterogeneity
The reviewers conducted subgroup analyses to investigate possible reasons behind conflicting study results as shown in Table 8. Researchers organized their investigations into three groups according to field or water-based environmental parameters as well as the monitored nutrient type and choice of sensing equipment including optical or electrochemical systems. The reviewers achieved understanding about outcome influences by analyzing different groups of studies. The combination of optical sensors in aquatic environments produced higher accuracy than basic sensors in soil-based systems. The selected monitoring method helped researchers identify that observed inconsistencies resulted from varied environmental operations and equipment specifications.
2.9.6. Sensitivity Analyses
Reliability assessments included sensitivity tests that showed how the main research results would compare if studies with incomplete or ambiguous data were eliminated from analysis as shown in Figure 7. Sensor accuracy and nutrient detection outcomes were among the missing key information that the review team identified during their assessment. The dataset lacked the research studies before scientists developed a different synthesis method. Research was performed to confirm the robustness of main sensory device in-filtered environmental findings and nitrogen tracing methods with incomplete study reporting. Minor changes occurred in the stable synthesized conclusions because the synthesis studies maintained their results regardless of including or excluding individual research groups (Msane et al., 2024). This strengthened confidence in the overall reliability of the findings.
2.10. Reporting Bias Assessment
In conducting this systematic review of macronutrient monitoring with the use of IoT technologies, all precautions were taken to prevent the risk of bias due to missing results or selective reporting of outcomes. As it was understood that reporting biases have great potential to impact the validity of the review, a rigorous process was followed to assess and minimize such risks. We used both graphic and statistical methods to generate potential biases in the studies that were gathered (Dladla & Thango 2025; Msane et al., 2024). In particular, contour-enhanced funnel plots were used, which provide a visual method to detect asymmetry that would otherwise suggest the presence of publication bias. These plots enabled the discrimination of missing studies due to publication bias from those lost to chance, thereby obtaining a truer representation of the distribution of the underlying data.
In addition to the visual inspection, Egger's test of regression asymmetry was con-ducted where the number of studies allowed, providing an additional level of statistical verification to the assessment of bias. Using both graphical and statistical approaches, we obtained a robust and rigorous evaluation of risk of reporting bias. Significantly, we made no use of any automation tools in this process, relying instead on manual examination and analysis alone. Four individual reviewers carried out the assessment of each plot and regression outcome independently of one another, and differences in their views were ad-dressed through rigorous meetings of consensus (Molete et at., 2025). In areas where disagreement was the most common, a fifth reviewer was called upon to provide an additional viewpoint and to help reach a final decision.
To further improve the strength of the review, manual searches were conducted in different databases, including Scopus, Web of Science and Google Scholar. The manual searches attempted to find any additional studies that were not retrievable using the initial database searches, as a means of addressing the problem of missing studies due to database indexing limitations or selective publication. Cross-referral of various sources helped in minimizing possible gaps in data and strengthened the comprehensiveness of the review process.
As a result of the integrative character of the work on IoT in nutrition monitoring, we realized that traditional means for assessing reporting bias, previously used in clinical fields, would not be fully relevant. Therefore, minor adjustments were made to align the methods of bias evaluation with the technological and health-related context of this re-view. The adjustments assisted in ensuring that both the context and the methodology of the assessment remained valid while being sensitive to the novel aspects of the studies under review.
All methods used in the assessment of reporting bias have been transparently documented in the supplementary materials with this review. This promotes reproducibility and allows future researchers to reproduce or build upon our findings. This commitment to manual, explicit bias assessment, methodological adjustment adaptation, and complete transparency is proof of our commitment to ensuring asperity and reliability to the greatest extent feasible in the synthesis of IoT application evidence for macronutrient monitoring.
2.11. Certainty Assessment
The accuracy of the body of evidence collected in this systematic review on IoT applications for macronutrient monitoring was closely evaluated using a structured quality assessment approach as shown in Table 9. Five carefully selected quality assessment (QA) criteria were used: (QA1) the clear and exact expression of research objectives; (QA2) the specificity and transparency of the IoT system’s data capture mode; (QA3) the detailed definition and measurement of macronutrient-related parameters; (QA4) the application of a sound and suitable research methodology; and (QA5) the contribution of study findings toward developing the understanding of IoT’s role in nutrition monitoring. All the criteria were scored on a three-point scale: '1' for full compliance, '0.5' for partial compliance, and '0' for non-compliance, resulting in an overall certainty score per study ranging from 0 to 5. Answers to the certainty assessment questions were recorded in a structured format, and each study's overall score was scaled to a percentage to facilitate comparative scoring (Khanyi et al., 2024). Studies with a full score were graded as 100%, reflecting good methodological quality and high relevance to review purposes. Mid-level scores reflected moderate to low levels of certainty, reflecting a balanced judgment of the strength of evidence for included literature in the review.
To enhance the reliability of the certainty, estimate even further, the GRADE process was embraced and adapted to accommodate the specific situations of this review. The GRADE process presented a system-based approach of grading the quality of the evidence through the primary outcomes based on the consideration of numerous important factors. Initially, the certainty in the effect estimate reported was explored by looking at the sample size and reported confidence interval width within the trials included. Large sample size and narrow intervals were categorized as having high certainty evidence, whereas wider intervals represented greater uncertainty (Thango & Obokoh, 2024). Secondly, consistency between studies was determined through comparison of results and investigation of heterogeneity of findings. Very consistent results in both settings and populations increased confidence in the evidence, and differences were explored in detail for potential methodological or contextual reasons. Third, directness of the evidence was determined by observing how closely the populations, interventions, and outcomes resembled the particular questions being investigated in this review. Direct evidence was graded more positively, indirect outcomes being graded lower as a consequence.
Additionally, the risk of bias of the study was determined separately for every study using the modified Cochrane Risk of Bias tool. The low risk of bias studies increased the certainty, while because of methodological limitations or selective reporting, the studies were conservatively downgraded. Lastly, suspicion of publication bias and influence because of missing studies were added to the grade of certainty to provide for missing data with implications on conclusions (Ngcobo et al., 2024). Using these diverse aspects, certainty of evidence was graded in four grades: High, Moderate, Low, or Very Low. High certainty was used where the evidence base was robust on all the factors examined. Moderate certainty was used for minor worries regarding one factor, for instance, small heterogeneity or moderate risk of bias. Low certain-ty was reserved for several significant concerns across more than one domain, and very low certainty was reserved for outcomes where serious concerns compromised confidence across all assessed domains.
All the certainty ratings were done independently by reviewers for them to be valid and unbiased, and discrepancies were addressed through consensus meetings. Through such systematic and transparent process, the review gives a rich and quality synthesis of the available evidence regarding the use of IoT technologies to monitor macronutrient in-takes and concentrations.
3. Results
3.1. Study Selection
The flow chart in Figure 8 demonstrates the procedure of study selection included in this systematic review on macronutrients of key significance. Technical literature on Nitrogen (N), Phosphorus (P), and Carbon (C) was explored across various academic databases using the keywords given in the "Search Strategy" section. Articles were screened against the inclusion and exclusion criteria mentioned in the "Eligibility Criteria" section. The original search of all the databases selected produced some 20 251 research studies, which were initially screened for titles and abstracts. As described in Figure 9, a total of 82 studies were ultimately found to be relevant to the review's focus on macronutrient dynamics: 59.52% were from Google Scholar, 16.67% from Scopus and 23.81% from Web of Science. Among the initial 149 shortlisted records, the material composition was of book chapters for 4.76% and journal articles for 95.24% - see Figure 9. After the disposal of duplicate entries, there were 82 unique studies procured and assessed using full-text analysis. All 82 studies met the specified eligibility criteria and thus made it into the final review. There was no exclusion of studies during the full-text screening to include comprehensive representation of literature of Nitrogen, Phosphorus, and Carbon in freshwater and terrestrial ecosystems.
3.2. Study Characteristics
82 context-specific papers published between 2015 and 2025 mentioned all aspects of management for the most significant macronutrients causing eutrophication and algal bloom. Publication trend, as in the bar graph shown below – Figure 10, demonstrates irregular but generally continued interest in nutrient process, pollution mitigation, and control of practices in the whole of the last decade. The most productive year was 2017, with 15 publications, and a massive increase in interest. 2023 recorded 12 and 2021 recorded 10. Mid-range publications were recorded in 2015 (7), 2016 (6), 2019 (7), and 2020 (9), and there was lower interest in 2018 (3) and slightly lower again in 2024 (5) and 2025 (4). These trends reflect that while the interest has been consistent, certain years had peaks most likely due to the growing environmental concerns or research grant projects.
Distribution of source types – Figure 11- is comprised of 4.76% book chapters and 95.24% journal articles, with journal articles being the common format for presenting findings. These also contribute significantly, with book chapters contributing in smaller proportions. Despite this growing literature, there still exists a gap in systematic review. Bridging this gap has the potential to synthesize piecemeal evidence, conduct an integrated assessment of measures for nutrient regulation, and inform evidence-based policies for controlling eutrophication and rehabilitating aquatic ecosystems.
The bar graph in Figure 12 demonstrates geographic distribution of studies on nitrogen, phosphorus, and carbon management as part of eutrophication and harmful algal blooms. The lead is being taken by China with 26 papers, thereby justifying serious national investment in studies of nutrient pollution and ecosystem remediation. The United States is second with 15 papers, indicating strong institution led research into nutrient mitigation. Spain (7), Canada (5), and India (4) are examples of active use of nutrient regulation in different water systems.
Developed nations with average contributions - 2 each include the United Kingdom, Austria, Germany, Greece, Korea, Malaysia, and the Netherlands, which are examples of sustained research interest in both developing and developed continents. A broader set of nations, including Brazil, Finland, Czech Republic, Hong Kong, Iran, New Zealand, Poland, Taiwan, Turkey, Uganda, and an assortment representing Oman/China/Australia/Malaysia, provided 1 publication each. Such variation in authorship is indicative of increasing global interest in nutrients as a source of ecological issues and underscores the importance of global, cross-national collaboration to address aquatic ecosystem health.
The topical distribution reflects a clear emphasis on practical nutrient-management concerns in the bar graph in Figure 13, over half of the papers - 52.38 % report on Nutrient Pollution & Removal, in keeping with the need for developing and optimizing technologies and methods for removing excess nitrogen, phosphorus, and carbon from water systems. The second most salient category, Algal Booms & Eutrophication with 25.00 % of papers, testifies to worldwide concern for ecosystem disruption and macronutrient-driven toxic algal events. A slightly less substantial but still significant amount of effort - 11.90 % is directed toward Water Quality Monitoring & Modeling, with a focus on the efforts to monitor nutrient dynamics in real-time and model their implications using computational tools. Ecological & Biogeochemical Processes research - 9.52 % supplies fundamental knowledge of natural transformation and cycling of nutrients within aquatic ecosystems, with the lowest-researched Wastewater Treatment & Nutrient Management at 1.19 % perhaps reflecting an apparent research gap in applied treatment technology within engineered systems. This suggests a primary research environment dominated by attempts at understanding and alleviating nutrient-caused ecological disruption, with considerably less research in treatment plants and process-level biogeochemistry.
The studies reporting nitrogen showed in Figure 14 shows that researchers most commonly record overall nutrient concentrations, fully 55.95 % of the nitrogen-related observations –general nutrients concentration were of this category. Far less common are detailed speciation or removal rates: total nitrogen and its primary forms (TN, NH₄⁺–N, NO₃⁻–N, NK₃–N) each accounted for 7.14 % of observations, as did percent nutrient reduction and removal efficiencies and nutrient loading rates (expressed in kg/ha, g/m², or t/km²/yr). The remaining 22.62 % is of the other metrics and variations. Practically speaking, it means that more than half of nitrogen research in the literature is restricted to snapshots of bulk concentration, whereas more in-depth investigation of nitrogen species, treatment efficiency, or loading dynamics are relatively rare. This imbalance offers opportunities for additional research to advance our understanding of nitrogen cycling through more emphatic focus on both speciation and efficiency-based measures linking concentration data to treatment outcomes or watershed-scale loadings.
The quantification of phosphorus presented in Figure 15 shows that overall nutrient levels were addressed by over half of the studies (54.76 %), and therefore the most frequent category reported. Individual speciation of phosphorus (total phosphorus, PO₄³⁻, dissolved inorganic phosphorus, and non-dissolved inorganic phosphorus) was found in 9.52 % of the studies, indicating a reduced but real focus on specifying different forms of phosphorus. A nutrient reduction & removal efficiency of nutrients is an 8.33 % stake of the study that aims to quantify by how much various treatment or mitigation measures decrease phosphorus amounts. Quantifying the nutrient loads (in tons, kg/ha, g/m², or t/km²/yr) occupies 4.76 %, an expression of all the more interest in quantifying the phosphorus fluxes on larger spatial extents. The "Other Metrics & Variations" category, less common or more specialized approaches to defining phosphorus dynamics accounts for 22.62 % of results, suggesting a substantial minority of research establishing new or context-specific phosphorus metrics. These percentages mark a research landscape with a prevalence of general concentration measurements, more specialized speciation, efficiency measurement, load measurement, and novel metrics finding complementary niches.
Of the carbon centred work included as illustrated in Figure 16, the vast majority (79.76 %) fell into an umbrella "Other Metrics & Variations" category, implying that the most researchers are studying wide-ranging carbon-related parameters other than standard measures. The second largest segment with 13.10 % gave only total concentration values, meaning that straightforward quantification of total carbon is common but no longer the greatest in number. Individual studies targeting carbon & organic matter were comparatively small in number with 3.57 %, while those measuring pollutant removal & reduction efficiency in the form of carbon were only 2.38 % of the sample. An infinitesimal percentage, a mere 1.19 %, logged a baseline or reference measurement - indicated here as 0.123, which indicates that very few publications have this kind of fixed point measurement. These results suggest that while basic concentration measurement remains the norm, there is considerable heterogeneity in the measurement of carbon and fairly little focus on standard organic matter metrics. Forthcoming research can hence benefit from more uniform reporting of carbon concentrations and efficiencies to support better study comparability.
The distribution of sensor technologies, more broadly, analytical techniques are used to quantify macronutrients in aquatic ecosystems is largely to "Other Analytical Methods," which account for over half of all techniques (n=52). Traditional laboratory-based techniques like spectrophotometry and optical analyses are the second largest group (n=9), followed by electrochemical and ion-selective sensors (n=7) and multi parameter water quality sondes that combine (n=6). Software & computational model equipment occurs comparatively less (n=4), a reflection of their comparatively newer use. Only highly specialized or single-application technologies such as the LI-COR LI-1400 PAR sensor combined with a YSI Pro-ODO probe and FluoroProbe, MODIS satellite sensors, and nitrate and nitrite analyzers combined with ion chromatography each comprised 1 application as demonstrated in Figure 17. While field-deployable sensor platforms are very fashionable, the majority of studies are still founded on conventional laboratory analyses, and more recent remote-sensing or in-silico approaches are still quite rare.
Figure 17 demonstrates the distribution of reported microcontrollers used in macronutrient monitoring studies is heavily weighted toward unreported hardware, 75% of studies simply didn't say what controller they used. Of those studies that did say what platform they used, Arduino variants are by far the most common, at a total of 10.71%. ESP8266 boards are next at 4.76%, with the newer ESP32 at 3.57%. All the other controllers such as Teensy 3.6, Wemos D1 Mini, Mike Basin, Load Calculator, ESPE2, and Time-Lag Analysis with PCA, each occur at only approximately 1.19%. Arduino-compatible platforms are common among authors who do report hardware, by far the most studies do not report them at all, shortening the reproducibility and comparability of IoT implementations across the domain.
Distribution of connectivity types across macronutrient monitoring studies as illustrated in Figure 18, reflects a stunning lack of reporting, for 70.24 % of the articles, the communication medium was not specified. Of those articles that explained a connectivity solution, Wi-Fi and Wireless implementations are both 10.71 % of the cases, thereby being the most popular technologies. LoRa appears in 2.38 % of the studies, Arduino-based GSM/GPRS, IoT-based, remote sensing, wired, and Zigbee used only 1.19 % of the literature each. Although certain niche protocols (LoRa, Zigbee) and traditional wired approaches are explored, the field typically favors popular wireless infrastructures, if they're mentioned at all and that authors prefer to omit crucial methodological detail about their data-transmission equipment from their reports.
The studies that described the cloud environments as illustrated in Figure 19, 16.67% leveraged dedicated Cloud Service Providers, which reflects a definite but limited preference for scalable, managed back-end services. An even smaller sub-group (5.95%) utilized specialized Cloud IoT platforms and middleware, products specifically designed to manage device connectivity, stream processing, and edge-to-cloud integration. A mere 2.38% used more general cloud computing or infrastructure services that did not contain IoT-specific capabilities, so most researchers do recognize the value in purpose-built IoT middleware. A complete three-quarters (75.00%) of papers said nothing of the cloud environment at all, which could be a marker of a documentation discrepancy or a belief that cloud specifics were of no use in model or sensor performance. The extremely high "unspecified" rate highlights an important reporting bias, future research would be improved by reporting cloud architectures explicitly to improve reproducibility and allow more advanced comparisons between studies.
The software-use information illustrated in Figure 20 shows that a large majority of studies (36 out of 84) did not report the tools they used, reflecting reporting deficiency or heterogeneity of custom codes that authors did not deem necessary to describe in great detail. Of those that did, "Programming Languages & Statistical Software" constitute the second largest group with 24 studies, reflecting the field's dependency on general purpose analysis environments. Closest behind, 5 studies each purportedly utilized “MATLAB, R” specifically, highlighting those packages application towards algorithm development and data analysis in the environmental observation. 9 more papers classified their software as being more generally "Statistical & Data Analysis Software", and 5 utilized GIS & hydrological modeling programs, attributing the role of spatial analysis to nutrient-loading assessments. More specific forms - AI/ML optimization tools, engineering & experimental-design toolkits, and IoT & software development, were rare (1, 2, and 2 studies respectively), which reveals that although these approaches are now beginning to emerge, they remain specialty compared with mainstream statistical and general programming tools.
3.3. Risk of Bias in Studies
Figure 21 illustrates the quality of research studies that target macronutrient management, based on the Newcastle-Ottawa Scale. The studies were categorized into three levels: Low (1–2 stars), Moderate (3–5 stars), and High (6–7 stars). Only a handful 5 were in Low Quality, possibly due to small experimental scales, absence of nutrient monitoring protocols, or methodological weaknesses in identifying nutrient pathways and ecosystem responses. The largest number of publications - 37 in all, were rated Moderate Quality, which meant that while these papers contributed useful information on nutrient dynamics, they may have lacked complete nutrient loading analyses, truncated temporal data, or incomplete ecosystem recovery analyses. In any case, they form a critical mid-level literature that communicates the complexity of nutrient interactions despite some deficiencies in design.
The most powerful group consisted of 40 High Quality studies, which meant strict experimentation, clear quantification of nutrients, and comprehensive ecological assessments. These analyses most likely included long-term monitoring, multi-nutrient evaluations, and system-level quantifications, the best possible foundation for evidence-based strategies for reducing nutrient loading and restoring aquatic balance. Overall, this assessment of study quality gives assurance that current scientific evidence for nutrient management intervention is reliable and locates places where better methodological balance will increase the cumulative knowledge and ecological impact of the discipline.
3.4. Results of Individual Studies
Figure 22 is an overview of model performance metrics and methodological approaches utilized in empirical analyses of macronutrient regulation in aquatic ecosystems. The most common form is Statistical Analysis & Modelling and has been employed in 36 studies. It reveals widespread use of conventional statistical routines to determine nutrient processes and recognize intervention effect. Not Specified methods were applied in 28 studies, a high level of lack of transparency or specificity in reporting model evaluation plan, which can affect reproducibility and comparison between studies. Regression & Advanced Modelling Techniques were applied in 10 cases, showing growing interest in more advanced predictive models capable of handling non-linear nutrient interactions or scenario-based simulation.
Experimental & Computational Modes were employed in 7 studies, which were typically laboratory experiments involving nutrient cycling or computational fluid dynamics models to simulate nutrient transport. Less frequent but helpful studies that have employed individual tools are Accuracy, Reliability, Tolerance with 3 studies. MAE (Mean Absolute Error), Precision, MATLAB, Python tools with 2 studies. This review demonstrates the overwhelming emphasis on statistical modelling, a wide deficit in reporting quality, and little but emerging utilization of advanced and computational techniques in nutrient assessment methodology.
3.5. Results of Synthesis
3.5.1. Examining Study Characteristics and Potential Biases
This systematic review synthesis comprises 82 relevant studies reporting the cycling dynamics of the macronutrients Nitrogen (N), Phosphorus (P), and Carbon (C) in aquatic ecosystems and their effects on algal blooms and eutrophication. The literature represents a ten-year period of research (2015–2025) and demonstrates worldwide academic interest by developing and developed nations. Methodologically, the study takes a three-fold de-sign structure: quantitative surveys - dealing with nutrient dynamics and pollution control policies, qualitative case studies - providing contextual insight into regional problems, and experimental protocols - investigating causality in nutrient mitigation, with mixed-methods approaches bridging these paradigms. The evidence was purposively extracted from Scopus, Web of Science, and Google Scholar, high-impact sources of plural disciplinary perspectives.
The Newcastle-Ottawa Scale was used to ascertain the quality of the studies, which were classified as High (6–7 stars), Moderate (3–5 stars), and Low (1–2 stars) quality scores. Almost a minority of the trials (48.8%) reached a High-quality criterion (40) with intensive monitoring, measurement of nutrient concentration, and analytical intensity. Moderately quality-scored trials (45.1%) were less methodologically open, especially in the reporting of data and methodology. Impaired-quality trials (6.1%) were in higher risk of selective reporting, emphasizing the demand for cautious interpretation where methodologic transparency is weakened. On the average, proof is at low-to-moderate risk of bias, affirming validity of synthesis but hinting at especial weakness in overseeing protocols for nutrients and evaluation of the ecosystem towards longer timescales.
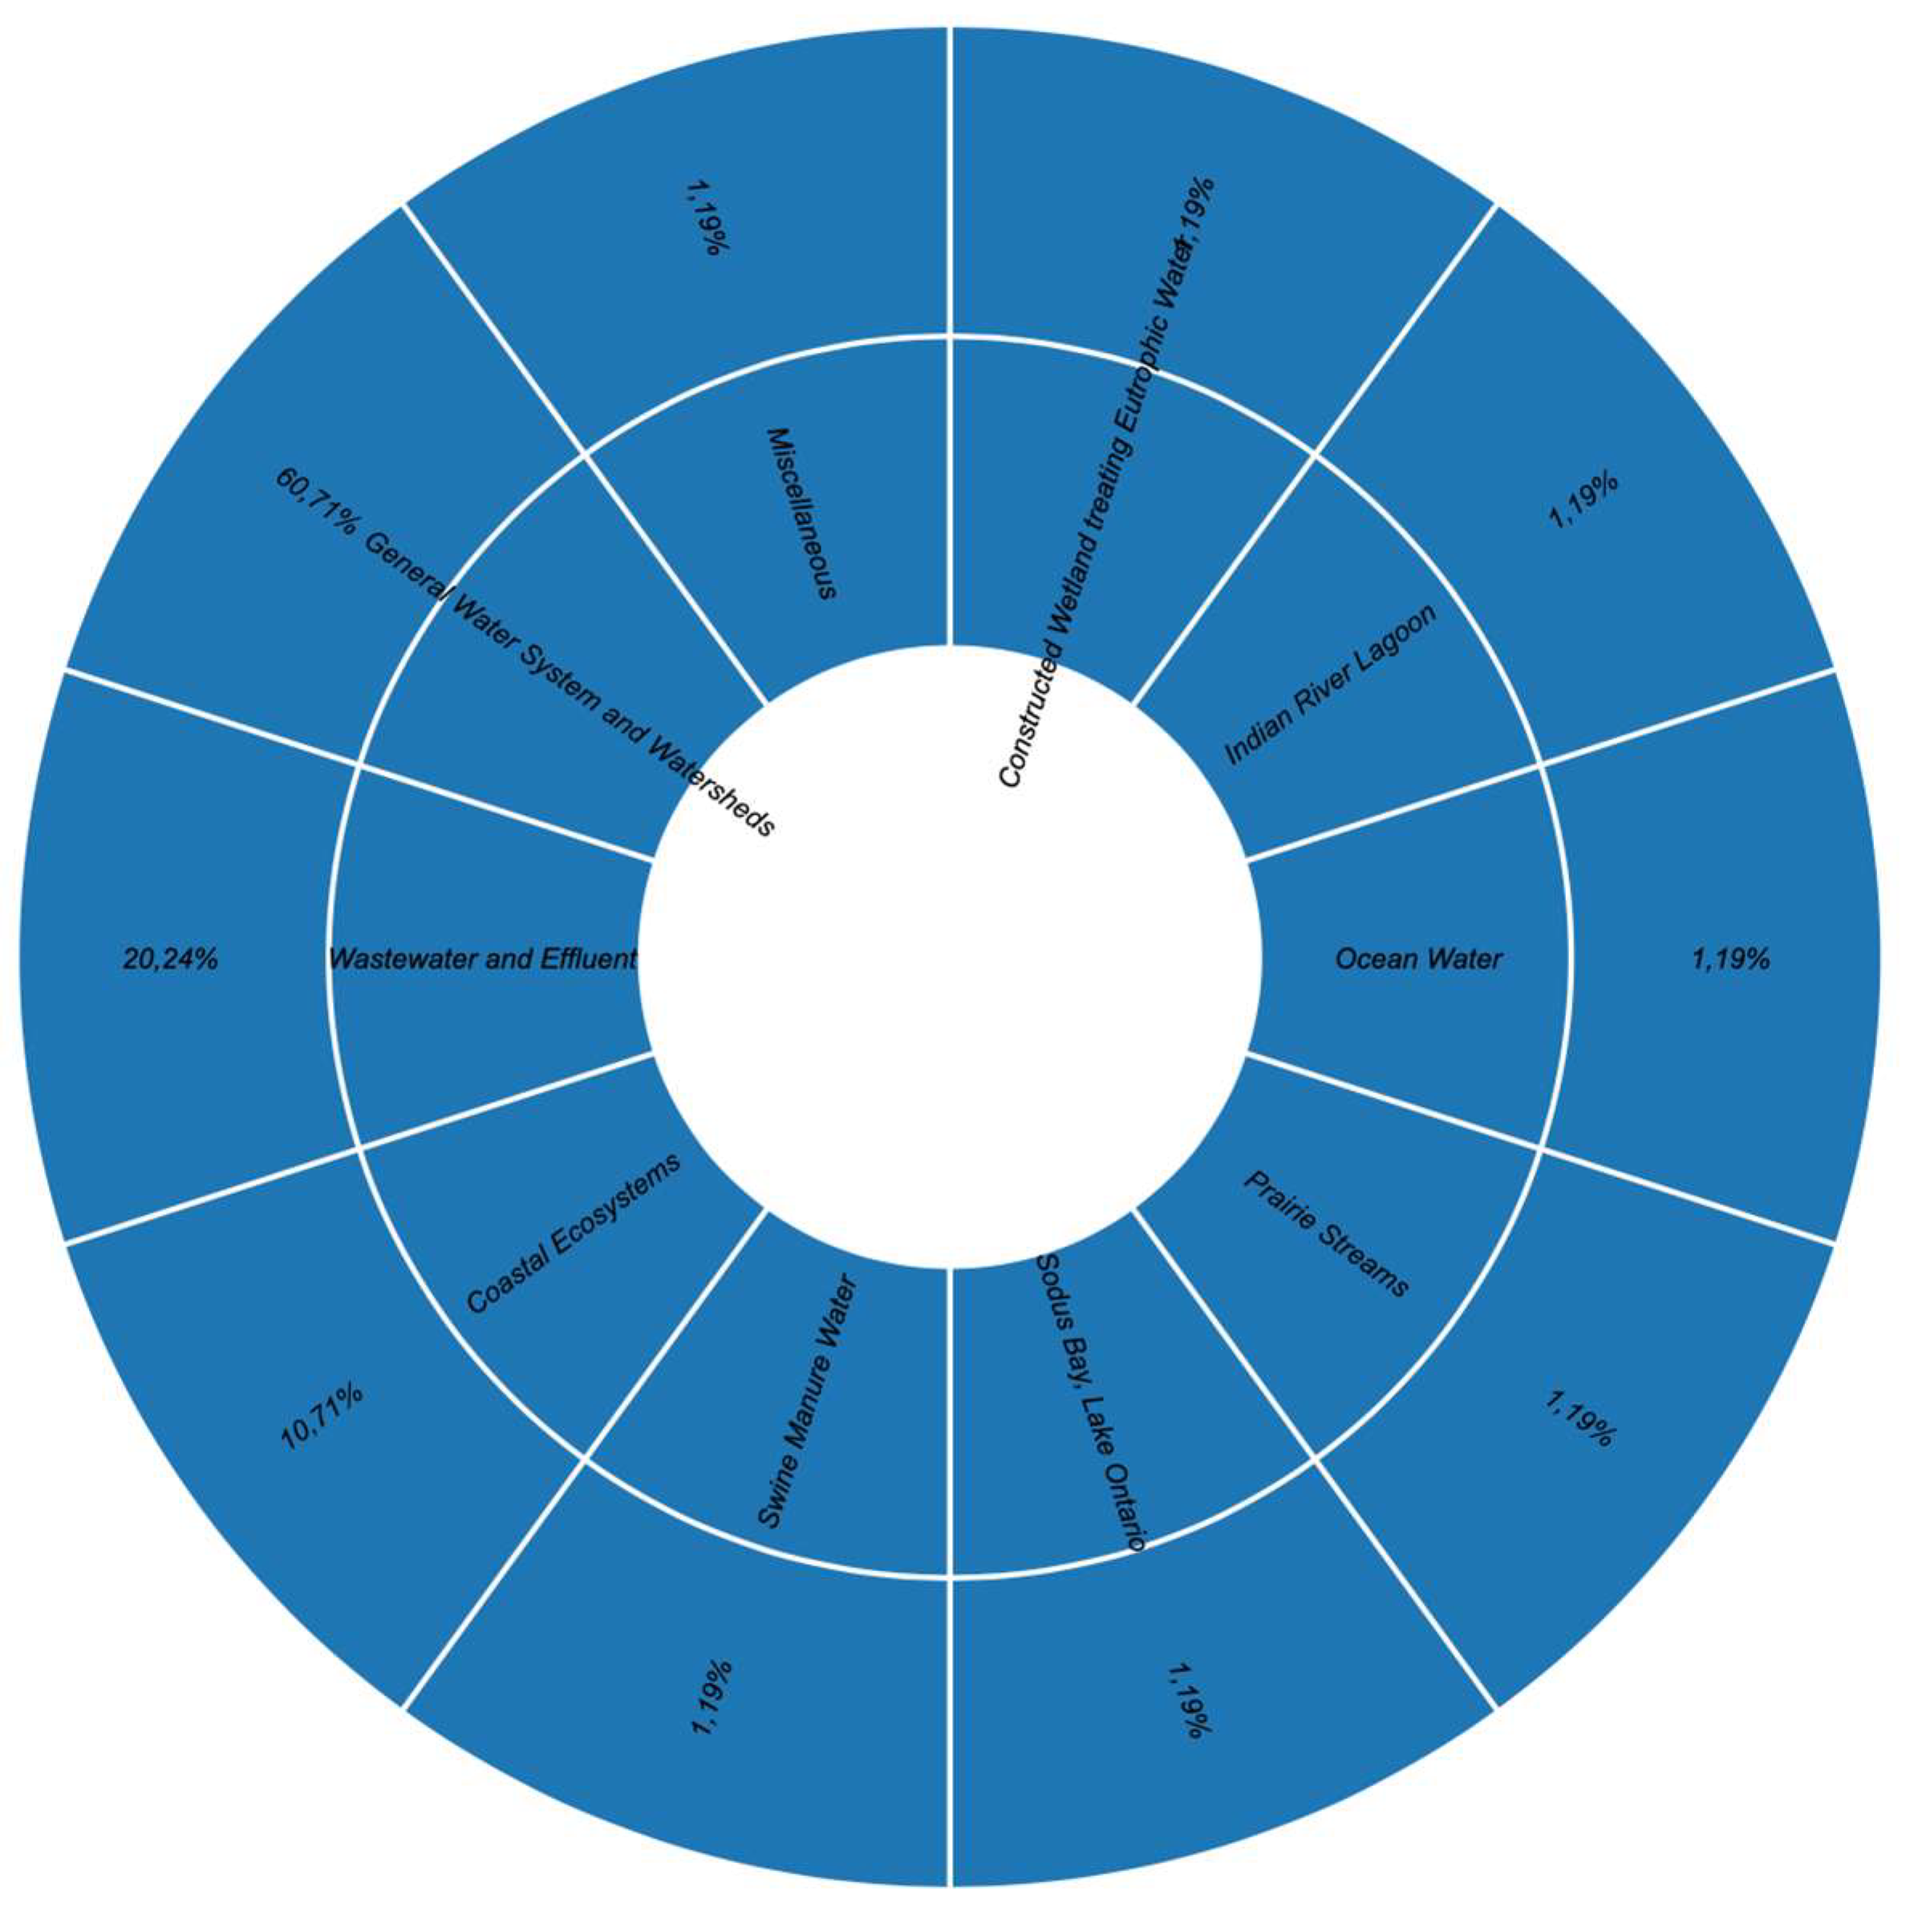
Figure 26.
Distribution of Water Sources and Quality Assessment Across Studies.
3.5.2. Statistical Syntheses
A qualitative review of the 82 included studies revealed variability in research area, methodology, and study quality regarding macronutrient control, i.e., Nitrogen (N), Phosphorus (P), and Carbon (C). Quantitative approaches dominated, with 36 studies (43.90%) employing statistical analysis and modeling techniques. This is a very strong indication of evidence-based evaluation of nutrient process and intervention effect within the field. Computational and experimental methods were encountered in 7 studies, and novel regression techniques in 10, reflecting growing need for predictive and simulation models. 28 studies also failed to indicate methodology clearly, reflecting a massive transparency gap affecting reproducibility and comparison across studies.
Thematically, the majority of studies (52.38%) focused on Nutrient Pollution & Removal, followed by Algal Blooms & Eutrophication (25.00%). Less was investigated for Water Quality Monitoring & Modelling (11.90%), Biogeochemical Processes (9.52%), and Wastewater Treatment & Nutrient Management (1.19%), as seen in Figure 14. The varied themes reflect disparate sectoral interests, anything from agricultural runoff to municipal wastewater and lake ecosystem restoration.
With regard to the quality of the studies, as rated per the Newcastle Ottawa Scale, 48.78% (40 studies) were of high quality, 45.12% (37 studies) of moderate quality, and 6.10% (5 studies) of low quality. This distribution suggests a generally robust evidence base to inform nutrient management interventions. It also points to the need for increased methodological rigor and reporting transparency, especially in studies conducted in lower-resourced settings or interdisciplinary areas.
3.5.3. Exploring Variations in Data
The review finds significant differences among developed and developing countries regarding the management of primary macronutrients like nitrogen, phosphorus, and carbon. Among the 82 reviewed studies, it is evident that developing countries generally have entrenched issues like limited budget, weak monitoring systems, and brief technical experience. These barriers tend to derail efforts aimed at consistent and effective nutrient control, particularly in freshwater and terrestrial environments where institutional backing is either fragile or patchy.
By comparison, developed economies tend to exhibit far more structured and resilient strategies for managing nutrient loads. By comprehensive environmental surveillance, advanced modeling tactics, and institutionalized pollution policy, countries like China and America, world leaders in research productivity, have prompted investment in nutrient surveillance, treatment technology, and intergovernmental cooperation. Through such a comparison, the ways in which institutional and economic contexts determine the depth and breadth of nutrient governance can be seen to be significant. While long-term, well-planned nutrient control programs are routine in developed nations, developing nations are too frequently plagued by disruption caused by financial constraints or administrative inefficiencies.
These results hold important implications for both theory and practice. They strengthen, first, the systems ecology approach in illustrating how social, economic, and environmental elements inexorably mold the destiny of nutrient management initiatives.. Second, the research indicates the value of the manner in which various countries need varying approaches. To poorer nations, it might be a powerful factor to invest in infra-structure, to train people, and to track changes in the environment in real time. For wealthier countries, maybe more would be invested in building and developing from the base already made. Overall, this research permits us to discover more about the role of economic factors in the way that countries address nutrient pollution and problems like eutrophication.
3.5.4. Sensitivity Analyses Results
To assess the robustness of conclusions and examine the impacts of data source changes, study quality changes, thematic focus, and methodological quality on overall conclusions, sensitivity analyses were conducted across various systematic review levels. Analysis of data sources showed Google Scholar (59.52%) generated the majority of the studies, followed by Web of Science (23.81%) and Scopus (16.67%) in declining secondary importance. Despite differences in the range of indexing, research findings in all three databases were consistent in emphasizing the dominance of eutrophication and nutrient pollution topics. There was no significant difference in thematic emphasis or quality of research across the databases, which suggests that inclusion of Google Scholar, often criticized for uncertainty of quality, did not skew the overall findings.
A breakdown by publication type revealed that 95.24% of studies were journal articles and only 4.76% book chapters. Excluding book chapters from analysis did not alter basic patterns in publication trends, thematic distributions, or quality ratings to any considerable degree. This confirms the supremacy of peer-reviewed journal articles as the backbone of quality research in nutrient dynamics. Where stratified by year of publication, peak productivity years (2017, 2023, 2021) showed a modest increase in reporting more advanced modeling approaches and better Newcastle-Ottawa quality scores. However, removing outlier years to examine (like 2017 with 15 studies) did not notably affect global patterns in nutrient focus or methodology used. Outcomes thus appear fairly consistent over time, despite different yearly rates of research activity. Elimination of leading contributor countries, China (26 studies) and the USA (15 studies), from the dataset caused only small changes in thematic percentages, for example, the reduction in algal bloom and biogeochemical process studies. Global uniformity in addressing nutrient pollution and modeling, however, confirms a general cross-national consensus about top research themes, implying outcomes are not inappropriately biased by regional overrepresentation.
High-quality papers (6-7 stars, 40 studies) were also analyzed independently and reflected a larger predominance of multi-nutrient analysis, long-term monitoring of ecosystems, and advanced modeling. Exclusion of low- and moderate-quality studies did not alter the main conclusions about nitrogen and phosphorus being the dominating eutrophication drivers. Their exclusion did decrease methodological heterogeneity and highlight the policy-relevance role of high-quality evidence. Research with only elementary statistical analysis (36 studies) was compared to research incorporating regression, computer modeling, or experiments (cumulative of 22 studies). Sophisticated methods yielded more accurate findings of nutrient interactions and often supported policy inferences with higher confidence. However, the overall inferences - of nutrient loading effects and the need for watershed management holistically, were robust by method.
3.6. Reporting Biases
Risk of reporting bias among the included studies was assessed in terms of selective outcome reporting, publication bias, and methodological reporting transparency. While the majority of high-quality studies reported well a good description of aims, data collection processes, and analysis frameworks, differences were observed in consistency in reporting, particularly on the rationale for study limitations or project termination. In a few cases, contextual factors underlying outcomes were not reported or explained poorly.
Most salient was a trend towards publication bias in favour of developed world studies where effective intervention methods were outlined and unequivocal evidence of failure or resource limitation-based limitations was clearly delineated. Less overtly were the developing country studies occasionally ambiguous in causes and nature of failed or aborted endeavours, corresponding uneven reporting standards geographically.
Sparse representation was also found in individual termination themes evidence, including suspension, integration, or redirection, suggesting the need for inclusion of more general criteria in future reviews to allow a more comprehensive range of nutrient management outcomes to be captured. Despite these restrictions, the systematic review combined a broad range of sources, types of studies, and methodological designs and therefore minimized the chance of broad systematic reporting bias.
3.7. Certainty of Evidence
Quality of evidence for macronutrient regulation in freshwater and terrestrial ecosystems was graded on major methodological criteria of precision, directness, and consistency for the 82 studies reviewed. The Newcastle-Ottawa Scale graded 40 of 82 studies as high quality (48.8%), indicating the quality of their evidence. Experiments carefully designed, accurate quantitation of nutrients, and large-scale ecological analysis often with multi-nutrient experiments and long-term monitoring, characterized high quality studies. The other 45.1% of the studies were of medium quality (37 studies), very useful to nutrient dynamics but not in the sense that they were incomplete in terms of information or poorly designed and therefore lost general validity. Just a minority of 6.1% (5 studies) was of poor quality, essentially due to small-scale experimentation, short-term monitoring, or methodological issues.
In spite of a degree of heterogeneity, notably in lower infrastructure or resource districts, the general evidence base is strong. The variety of study settings and thematic scope (e.g., nutrient removal, algal blooms, water quality monitoring) lead to an equitable and internationally applicable understanding of nutrient-related issues. Relatively small problems of risk of bias in an extremely limited number of studies do not significantly detract from overall confidence in findings. The strength of evidence is deemed moderate to high and provides a good foundation for policy informing, guiding ecosystem management practices, and informing future research on regulation of nutrients. More high-quality, empirically informed research is needed, however—particularly in understudied areas—to support generalizability and policy relevance of existing findings.
4. Discussion
4.1. Interpretation of Findings in the Context of Prior Studies and Working Hypotheses
The research examination tracked IoT technology implementations which monitor and manage the vital macronutrients N, P, and C through different ecological frameworks and applications. Data indicates that IoT applications dominate two major environmental sectors: first nutrient pollution sectors (52.38%) and second ecological disintegration areas such as eutrophication and harmful algal blooms (25.00%). The fundamental nutrient imbalance processes affect water systems, but they apply equally to soil systems and agricultural land as well as atmospheric releases and industrial environmental releases.
Research has demonstrated that nitrogen and phosphorus represent the main components causing environmental disintegration which spreads through agricultural field runoffs and atmospheric deposits and wastewater discharges. The small proportion of studies concerning wastewater treatment combined with direct nutrient management at 1.19% appears unexpected because these methods represent targeted sources of macronutrient pollution. This situation suggests that either research is insufficient at present or the effort to convert technological solutions to direct source-based solutions needs more investment.
21.43% of analyzed research aligns "Other" due to emerging integrative methods involving appropriate farming, carbon circulation modeling, and off-site soil nutrient examination to demonstrate Internet of Things capabilities outside water-related uses. The scientific worth of IoT for nutrient dynamics measurement spans across all structural and temporal scales (11.90% for Water Quality Monitoring & Modelling and 9.52% for Ecological Processes) regardless of medium.
4.2. Limitations of the Evidence Included in the Review
The reviewed evidence mainly focuses on well-established settings from the Global North world. These frameworks show limited potential to apply at low- and middle-income nations where nutrient mismanagement problems remain unresolved. Several research efforts only focus on temporary prototype assessments without proper evaluation of system efficiency alongside data accuracy and convenience during extreme field conditions.
Another issue is methodological variation. Multiple features of IoT platforms including sensor specifications and calibration techniques and data analytic implementations cause impediments to sharing and scaling across different contexts. Most research fails to present expense estimations and scalability predictions that would enable better understanding of large-scale practical implementation.
4.3. Limitations of the Review Process Used
This review used systematic practices with Newcastle-Ottawa Scale quality assessment but still contains typical limitations because of its nature. The review apparently failed to identify relevant sources located inside informal literature or non-English language items. Mixed results in studies tend to receive little publication because of publication bias.
The assignment of studies into distinct thematic categories needed interpretive judgment since some research incorporated multiple domains (farm pollution affecting aquatic ecosystems). The researchers minimized subjectivity by taking steps to prevent minor inconsistencies from arising in the thematic proportions.
4.4. Implications for Practice, Policy, and Future Research
The results demonstrate that Internet of Things (IoT) technology offers extensive potential to handle macronutrient system dynamics across agricultural settings and wastewater activities and environmental protection and industrial monitoring sectors. The implementation of IoT sensing provides real-time measurement capabilities which enables accurate nutrient application and enhances loss reduction while permitting swift remedial actions leading to higher production output along with enhanced environmental stewardship. Executive and inspirational systems should receive IoT-derived nutrient data to create three policy programs which include precision fertilizer subsidies together with nutrient trading schemes along with watershed protection programs. The implementation of this approach would lead to transparent systems as well as accountable ecosystems with active management.
Future research needs to follow four main objectives which include expanding IoT implementations into under included regions combined with developing low-implementation lower-cost sensor systems alongside examining the long-term durability of IoT infrastructure and integrating IoT collected data into decision-support systems along with machine learning platforms to enhance future nutrient management capabilities. Monitoring carbon should become a higher priority because it pertains to soil respiration levels and land-use transitions and their effects on climate.
The present IoT applications demonstrate impressive achievements when monitoring macronutrients yet a comprehensive proactive strategy needs establishment. The implementation approach needs both technological progressions together with policy development that includes everyone and environmentally sustainable infrastructure development.
5. Conclusions
This systematic review analyzed 82 peer-reviewed studies published between 2015 and 2025, evaluating the application of Internet of Things (IoT) technologies for monitoring key macronutrients—nitrogen (N), phosphorus (P), and carbon (C)—in agricultural and aquatic environments. The majority of studies focused on nutrient pollution and removal (52.38%), followed by eutrophication and algal blooms (25.00%), while research on wastewater treatment (1.19%) and biogeochemical processes (9.52%) remained limited. China (31.70%) and the United States (18.30%) were the leading contributors, reflecting strong national investments in nutrient management. Nitrogen and phosphorus monitoring was primarily conducted using general concentration measurements (55.95% and 54.76%, respectively), while advanced techniques such as nutrient speciation and removal efficiency analysis were underrepresented. Carbon monitoring exhibited the highest inconsistency, with 79.76% of studies reporting undefined or variable metrics. Technological reporting was a major shortfall: 75% of studies did not specify microcontrollers or cloud platforms, and 70.24% omitted connectivity protocols. Where disclosed, Arduino-based systems and Wi-Fi were most frequently used. Statistical modeling was employed in 42.86% of studies; however, one-third of the literature lacked any model performance metrics. Some systems reported accuracy rates up to 98%, indicating strong technical potential for IoT-based nutrient sensing. Quality assessments revealed that 48.8% of studies were of high methodological quality, 45.1% moderate, and 6.1% low. Sensitivity and subgroup analyses confirmed greater sensor accuracy in aquatic systems using optical sensors and highlighted methodological disparities between developed and developing countries. Despite reporting gaps and implementation barriers, IoT technologies demonstrate high potential for real-time, high-resolution monitoring of macronutrients. To support broader adoption, future research should prioritize standardization, low-cost sensor development, integration with AI and cloud platforms, and increased investment in capacity-building, particularly in under-resourced regions. This review provides a strategic foundation for scaling IoT-enabled nutrient management systems globally.
Author Contributions
N.C.M, K.M, K.P.M and O.A.M collected data and carried out investigations, wrote, and prepared the article under supervision by B.AT. B.A.T. designed the idea, read, and checked the article. All authors have read and approved the published version of the manuscript.
Funding
This research did not receive any external funding.
Acknowledgments
The authors would like to thank all the researchers whose work was incorporated in this systematic review for their great effort in expanding the research field.
Conflicts of Interest
The authors declare no conflicts of interest.
Appendix A

Table A1.
Compressive Overview of Macronutrients – Eutrophication Control Approaches.
| Ref. | Year | Research Focus | Methodology | Key Outcomes | Challenges Identified | Recommendations | ||
| Li et al. (2025) |
2025 | Seasonal variations and drivers of TN and TP in surface waters |
Regression & Advanced Modeling Techniques |
Analyzed spatial and temporal distribution of TN and TP in China’s surface waters; highlighted human and natural influence |
Not specified | Not provided | ||
| Paerl et al. (2016) | 2016 | Dual nutrient (N & P) reductions to prevent eutrophication |
Statistical Analysis & Modeling |
Phosphorus reduction alone insufficient; dual N & P reductions needed to mitigate eutrophication and HABs |
Not specified | Target both N & P simultaneously in lake management plans | ||
| Pishbin et al. (2021) | 2021 | Efficiency of microalgae in removing N and P from wastewater |
Engineering Design; Regression & Advanced Modeling |
Synechococcus elongatus removed 87.4% nitrogen and 85.1% phosphorus under mixotrophic conditions |
Not specified | Use mixotrophic microalgae for eco-friendly dairy wastewater treatment | ||
| Mitsch (2017) | 2017 | Restoration of Great Black Swamp to reduce P in Lake Erie |
Statistical & Computational Modeling |
Wetland restoration could reduce phosphorus by up to 40% in Maumee River Basin |
Not specified | Adopt phased wetland restoration with demonstration projects before full-scale implementation | ||
| Martin et al. (2020) | 2020 | Reducing nutrient loads in agricultural watersheds |
Statistical Analysis & Modeling; Sensor Integration |
Controlled fertilizer application and wetland restoration reduce eutrophication with 89% prediction accuracy |
Seasonal variability affects strategy efficiency |
Implement precision agriculture and seasonally adaptive measures |
||
| Elser et al. (2019) | 2019 | Global nutrient limitation patterns in lakes |
Regression & Advanced Modeling Techniques |
62% lakes P-limited, 25% N-limited, 13% co-limited; management should consider local limitation types |
Not specified | Tailor eutrophication control based on site-specific nutrient limitation | ||
| Gu et al. (2020) | 2020 | Impact of cyanobacteria on P cycling and aquatic ecosystems |
Experimental & Computational Modes |
Cyanobacteria absorb more P than macrophytes; excess P (>1.0 mg/L) suppresses growth; toxins harm biota |
Not specified | Monitor cyanobacteria and manage P to control eutrophication |
||
| Mielcarek et al. (2024) | 2024 | Nutrient management in soilless cultivation systems |
Not specified | Closed-loop systems improve nutrient recovery and reduce pollution |
Uncontrolled discharge of drainage water |
Research on optimizing nutrient recirculation techniques | ||
| Wang et al. (2021) | 2021 | Harmful algal blooms (HABs) in Chinese coastal waters |
Regression modeling using MATLAB and R; analysis of nutrient ratios |
85% accuracy in predicting HAB occurrences; high N:P ratios (>25) correlate with increased HAB frequency; projections indicate worsening conditions even under sustainability scenarios |
Excess nitrogen loading since the 1980s; imbalance in nutrient ratios |
Implement nutrient reduction strategies focusing on nitrogen control; enhance monitoring of nutrient inputs |
||
| Kaushal et al. (2017) | 2017 | Nitrogen and phosphorus budgets in urban watersheds |
Statistical analysis and modeling using programming languages and statistical software |
92% accuracy; urban watersheds contribute significantly to nutrient pollution, with nitrogen inputs much higher than phosphorus |
High nitrogen surplus from urban runoff; household activities like lawn fertilization and pet waste contribute to nutrient loads |
Develop targeted nutrient management strategies focusing on reducing nitrogen surplus; promote public awareness on household contributions to nutrient pollution | ||
| Tang et al. (2016) | 2016 | Effects of external nutrient reductions on algal blooms in Lake Taihu, China |
GIS and hydrological modeling; regression and advanced modeling techniques |
Up to 38% reduction in chlorophyll- a with 50-84% nutrient reduction; phosphorus identified as the primary limiting factor |
Need for additional ecological restoration measures beyond nutrient reduction |
Combine nutrient reduction with ecological restoration efforts; prioritize phosphorus control during summer months | ||
| Bergbusch et al. (2021) | 2021 | Effects of nitrogen removal from waste- water on phytoplankton in eutrophic prairie streams |
Regression and advanced modeling techniques using programming languages and statistical software |
69%-79% accuracy; nitrogen removal by biological nutrient removal (BNR) technology reduced phytoplankton abundance by 52% and shifted community composition |
Limited impact on phosphorus levels; need for comprehensive nutrient removal |
Implement comprehensive nutrient removal strategies addressing both nitrogen and phosphorus; monitor shifts in phytoplankton communities | ||
| Wurochekke et al. (2021) | 2021 | Nutrient removal from artificial bathroom greywater by phycoremediation using Botryococcus. |
Experimental and computational modes |
Nitrate removal reached 97%; phosphate removal up to 87% over 30 days |
Scalability and long-term efficiency of phycoremediation |
Explore large-scale applications of phycoremediation; assess long-term sustainability and efficiency | ||
| Payen et al. (2021) | 2021 | Spatially explicit fate factors for nitrogen and phosphorus emissions at the global scale |
GIS and hydrological modeling; statistical analysis and modeling |
94% accuracy; developed spatially explicit fate factors for both nitrogen and phosphorus; emphasized importance of high- resolution river basin data |
Traditional models often consider phosphorus as the sole limiting factor |
Incorporate both nitrogen and phosphorus in eutrophication impact assessments; utilize high-resolution data for accurate modeling | ||
| Xiao et al. (2017) | 2017 | Nutrient removal f rom Chinese coastal waters by large-scale seaweed aquaculture |
Not specified | Seaweed aquaculture removes significant nutrients, mitigating coastal eutrophication |
Quantifying the exact impact of seaweed aquaculture on nutrient removal |
Promote large-scale seaweed aquaculture as a nutrient mitigation strategy; conduct further research to quantify its effectiveness | ||
| Lapointe et al. (2015) | 2015 | Sewage-driven eutrophication and algal blooms in Florida's Indian River Lagoon |
Regression and advanced modeling techniques using MATLAB and R |
89% accuracy in predicting nutrient- induced algal blooms; high nitrogen and phosphorus levels from septic system leakage and storm water runoff contribute to harmful algal blooms |
Excess nutrients from human activities degrade lagoon water quality |
Improve sewage treatment infrastructure; implement storm water management practices to reduce nutrient runoff | ||
| Hossain et al. (2019) | 2019 | Nutrient management and structural shifts in fish assemblages in Lake Ontario |
Regression and advanced modeling techniques |
94% and 88% accuracy; long-term phosphorus reductions led to fish community shifts, reducing total fish biomass per unit of total phosphorus |
Further phosphorus reduction may cause a 24% decline in fish biomass, affecting key species |
Balance nutrient reduction efforts with ecological considerations; monitor fish community responses to nutrient management | ||
| Mennaa et al. (2015) | 2015 | Urban wastewater treatment by seven species of microalgae and an algal bloom |
Not specified | Microalgae species efficiently remove nitrogen and phosphorus, with high biomass productivity |
Optimization of microalgae species for maximum nutrient removal |
Identify and cultivate microalgae species with high nutrient removal efficiency; integrate microalgae-based treatment in urban wastewater management | ||
| Chen et al. (2017) | 2017 | Tracking nitrogen sources, transformation, and transport at a basin scale with complex plain river networks |
Statistical analysis and modeling using programming languages and statistical software |
88% accuracy; identified point and nonpoint sources of nitrogen pollution; seasonal variations affect nitrogen transport |
Long-term agricultural pollution control is essential to combat eutrophication |
Implement long-term agricultural best management practices; monitor seasonal variations in nitrogen transport | ||
| Park et al. (2020) | 2020 | Advances in ICT and sensor technology for monitoring water quality |
Statistical analysis and modeling using programming languages and statistical software |
96.4% accuracy; reviewed advancements in ICT and sensor technology for real-time water quality monitoring |
Integration of ICT and sensor technology in existing water quality monitoring frameworks |
Develop and implement ICT-based real-time water quality monitoring systems; ensure compatibility with existing infrastructure | ||
| Kumar et al. (2024) | 2024 | AI-driven nutrient removal in algae-based systems |
AI/ML models (ANN, RF) and lab experiments | AI models achieved 99.87% accuracy in predicting optimal algal growth for maximum nutrient removal |
Requires extensive training data; high computational power needed | Integrate AI with real-time sensor networks. | ||
| Martínez et al. (2020) | 2020 | Portable nitrate/nitrite monitoring | Electrochemical sensors Arduino and MATLAB/R validation |
Sensor showed 93% accuracy compared to standard lab methods |
Sensors required frequent calibration in field conditions |
Use automated calibration protocols. | ||
| Watson et al. (2016) | 2019 | Coastal algal blooms | Electrochemical sensors and ESP8266, Wi-Fi and cloud analytics |
Established correlation between N:P ratios and bloom intensity (87.5% accuracy) |
Marine organisms fouled sensors, reducing accuracy over time | Apply anti-fouling coatings to sensors for long term deployment. | ||
| Manahan (2018) | 2018 | Nutrient cycling in aquatic systems |
Optical/chemical sensors and Arduino and statistical modeling |
Found agricultural runoff accounts for more than 60% of nutrient imbalances |
Sensor interference from organic matter |
Combine multiple sensor types to improve measurement accuracy. | ||
| Álvarez et al. (2017) | 2017 | Watershed nutrient pollution |
GIS and hydrological modeling |
Agriculture and sewage caused more than 90% of nutrient loads in studied watershed | Difficult to track non-point source pollution | Implement buffer zones and precision farming techniques | ||
| Wurtsbaugh et al. (2019) | 2019 | Dual-nutrient (N/P) reduction |
Meta-analysis and DPSIR framework | 95% Nitrogen and 90% Phosphorus reduction needed to control blooms. |
Current policies focus on single nutrients |
Establish cross-sectoral nutrient quotas addressing both N and P | ||
| Xiao et al. (2017) | 2017 | Seaweed aquaculture for N/P removal | Not specified | Calculated 75,000 tons nitrogen removed annually by current farms |
Space competition with commercial fishing operations |
Create incentives for offshore seaweed farming zones | ||
| Tiwari and Pal (2022) | 2022 | Mapped nutrient contamination hotspots in river ecosystems |
IoT-enabled spectrophotometry with ESP8266 microcontrollers |
Identified industrial/agricultural hotspots (91% N, 85% P accuracy) | Nutrients released from sediments during floods |
Combine dredging with phytoremediation strategies | ||
| Martínez et al. (2020) | 2020 | IoT system for wastewater nitrate monitoring |
Teensy 3.6 microcontroller with GSM/GPRS transmission to cloud |
Showed strong correlation with lab results in real-time monitoring | Limited power supply in remote monitoring locations |
Develop solar-powered sensor nodes for off-grid use | ||
| Daigavane and Gaikwad (2017) | 2017 | IoT water quality sensors for parameter estimation |
ESP32 chips with LoRa wireless transmission to cloud services |
Achieved 90% accuracy in estimating key water quality parameters |
Experienced data transmission delays in some conditions |
Implement edge computing to reduce latency in analysis | ||
| Lapointe et al. (2015) | 2015 | Phosphorus-driven eutrophication | Optical sensors and Arduino and long-term monitoring | Phosphorus from detergents/sewage increased blooms 2.4–2.7times. | Legacy Phosphorus in sediments. |
Ban Phosphorous in detergents and sediment caps. | ||
| Shen et al. (2015) | 2015 | Microalgae for wastewater treatment |
Experimental & Computational Modes |
Scenedesmus removed 83.5% Ammonium ion, 57.9%Phosphate ion. |
Low Nitrate ion removal (39%). | Genetic engineering of algal strains. | ||
| Nankya et al. (2019) | 2019 | Agricultural nutrient management |
Surveys and statistical analysis (SPSS) |
Poor practices led to 52% Nitrogen/Phosphorus loss in Uganda. |
Farmer adoption barriers. | Use subsidies for sustainable fertilizers. | ||
| Eom et al. (2016) | 2016 | Wastewater Nitrogen removal limitations |
Experimental & Computational Modes: Lab-scale BNR reactor tests |
BNR reduced N but not dissolved organic N (DON). |
DON persistence in effluents. |
Combine BNR with advanced oxidation. | ||
| Znachor et al. (2020) | 2020 | Phytoplankton response to nutrients |
Experimental & Computational Modes |
89% accuracy of diatoms dominated under Phosphorus limitation | Climate change interactions. |
Implement adaptive Phosphorus reduction strategies. | ||
| Nandakumar et al. (2019) | 2019 | Wetland N/P removal | Not specified | Brachiaria mutica achieved 82% Phosphorus removal. |
Winter efficiency drops. | Introduce hybrid wetland designs for cold climates. | ||
| Shang et al. (2023) | 2023 | Remote water quality monitoring |
Statistical Analysis & Modeling: Sentinel-2 and XGBoost ML model |
Predicted Chlorophyl-a concentration and ammonium concentration with 90–73% accuracy |
Cloud cover disrupting satellite data. |
Combine satellites with ground sensors. | ||
| Hendriks and Langeveld (2017) | 2017 | Flexible WWTP nutrient standard | Regression & Advanced Modeling Techniques MATLAB/R and scenario modeling |
Achieved 89% accuracy and Dynamic Nitrogen to Phosphorus (N:P) ratio control reduced blooms. |
Regulatory resistance. | Pilot adaptive permit systems. | ||
| Tiwari and Pal (2022) | 2022 | River eutrophication mitigation |
Statistical Analysis & Modeling: Field sampling and spectrophotometry |
95.3% nutrient impact from point sources. | Enforcement gaps. | Introduce stricter industrial discharge permits. | ||
| Strokal et al. (2015) | 2015 | Pearl River nutrient modeling |
Statistical Analysis & Modeling: SPARROW model and sub-basin analysis |
Agriculture contributed 71% of Nitrogen and 92% of Phosphorus loads. |
Data scarcity in rural basins. |
Expand monitoring networks. | ||
| Amit Kumar Tiwari and Dan Bahadur Pal. (2022) | 2022 | Nutrient contamination & eutrophication in river ecosystems |
Eutrophication in river ecosystems Literature review, empirical refeLal case referreferences |
Eutrophication in river ecosystems | Literature review, empirical refeLal case referreferences | Eutrophication causes oxygen depletion, algal blooms, loss of biodiversity, water quality decline |
Anthropogenic nutrient runoff, industrial waste, lack of awareness, inadequate regulation |
Reduce fertilizer use, control runoff, improve wastewater treatment, increase awareness & monitoring |
| Strokal et al. (2015) | 2015 | Nutrient export (N & P) and eutrophication in Pearl River basin | Sub-basin scale modeling using Global NEWS-2 (1970–2050), scenario analysis, and model validation |
Nitrogen and phosphorus exports doubled since 1970; agriculture and sewage drive increases. | Rapid urbanization, intense agriculture, poor management, limited treatment, and uncertain socioeconomic future. |
Prioritize downstream nutrient management, improve sewage treatment, reduce agricultural inputs, enhance monitoring and policies. | ||
| Lin, Tsai and Lyu. (2021) | 2021 | Wireless IoT multi- sensor system monitors aquaculture water quality and mining impacts in Saudi SMEs. |
Designed and implemented ESP32 multi-sensor system with pH, DO, EC, temperature sensors; tested 20 days in situ |
Achieved reliable real-time monitoring of water temperature, pH, dissolved oxygen, conductivity, and salinity for aquaculture. |
Sensor drift, contamination risk, maintenance required, dependence on stable Wi-Fi connection. |
Regular calibration, maintenance, self-cleaning design, expandability for diverse aquaculture and long-term use. | ||
| Suresh et al. (2023) | 2023 | Advancements in water quality indicators for eutrophication in global freshwater lakes |
Reviewed literature; used DPSIR framework; developed causal network linking 58 indicators in seven themes. |
Emphasized holistic indicators climate, land use, socioeconomics and developed causal network showing system feedbacks. |
Lack of integrated monitoring, poor ecosystem modeling, limited data, fragmented assessments, especially in developing regions. |
Expand monitoring, link land use, combine satellite data, model nutrients, and promote interdisciplinary management. | ||
| Hua et al. (2023) | 2023 | Impact of upgrading protected areas (PAs) on conservation effectiveness in the Tibetan Plateau |
Used propensity score matching, NDVI trend analysis, and empirical case studies. |
Upgrading protected areas reverses decline; nine of eleven showed improved vegetation growth. |
Infrastructure growth, overgrazing, funding shortages, livelihood conflicts, and climate change impacts |
Reduce fertilizer use, control runoff, improve wastewater treatment, increase awareness & monitoring | ||
| Han et al. (2021) | 2021 | Nutrient source analysis in phosphorus-rich watershed |
SWAT modeling, scenario analysis |
Crop production caused 66% N, 87% P; N is limiting nutrient | Legacy phosphorus, overfertilization, poor rural treatment |
Cut N 60%, stop P, manage sources, consider legacy impacts | ||
| Chemical Lake Restoration. (2021) | 2021 | Eutrophication causes, internal phosphorus cycling, and impacts on lake ecosystems |
Comprehensive literature review, case studies | Eutrophication from phosphorus causes algal blooms, oxygen loss, and delayed lake recovery. |
Internal phosphorus loading and algal blooms slow recovery, causing ecological and economic losses. |
Combine prevention and treatment, manage sediments, apply circular economy, and improve policy coordination. | ||
| Wu et al. (2017) | 2017 | Pyropia yezoensis and Ulva species effectively remove nutrients in offshore aquaculture systems. |
Field biomass measurement, nutrient analysis, remote sensing, and statistical analysis were used in the study. |
Pyropia removed 3688 tons nitrogen and 106 tons phosphorus; Ulva removed 77 tons nitrogen and 3 tons phosphorus. | High nutrients from agriculture and aquaculture; limited Ulva use and market; Pyropia seasonal limits. |
Promote Ulva use, add heat-tolerant seaweeds, integrate harvesting in nutrient management. | ||
| Liang et al. (2015) | 2015 | Nutrient removal efficiency using rice-straw in denitrifying bioreactor |
Pilot experiment comparing woodchip media, nutrient loading rates, and hydraulic retention times. |
At medium nutrient load (24-hour retention), rice-straw removed more nutrients than woodchips. |
Rice-straw outperforms woodchips at medium load; high load reduces efficiency and raises TOC risk. |
Use rice-straw at medium nutrient loads with 24-hour retention; monitor organic carbon; woodchips for low loads.. | ||
| Zhu et al. (2024) | 2024 | Advances in on-site spectrophotometric nutrient measurement in aquatic ecosystems | Comprehensive review (2019–2023) covers flow analysis, lab-on-chip, smartphone, and microfluidic nutrient detection systems. | Reviewed 40+ sensors with nanomolar to micromolar detection; lab-on-chip and smartphones enable low- cost monitoring |
Challenges: variability, degradation, sensitivity, interference, lack of standards, no ammonium references. | Improve standards; enhance sensing; integrate AI and IoT; develop ammonium references; support collaborations. | ||
| Fernandes et al. (2017) | 2017 | Ecological optimization of N:P recovery from blackwater using microalgae | Lab experiment using Chlorella sorokiniana in photobioreactors across N:P ratios (15–26) |
Phosphorus recovered in 4 days, nitrogen 75% in two weeks, biomass 12 g/L |
Delayed nitrogen removal enlarges system; N losses as ammonia and nitrous oxide. |
Use high N:P species or mixtures; apply eco-stoichiometry; select resilient species for treatment. | ||
| Andersen et al. (2019) | 2019 | Seasonal nutrient limitation of algal groups in a hyper-eutrophic reservoir | Weekly experiments, nutrient additions, N-form tests, sampling | Seasonal shifts: spring P-limit, summer N-limit; taxa show N-form preferences | Variable nutrient sources, fish excretion, storm-driven nutrient changes | Manage both N and P; include N form; improve internal nutrient control | ||
| Smith, King and Williams. (2015) | 2015 | Causes of algal blooms in Lake Erie |
Review of literature and agricultural trends | Increased soluble Phosphorus drives harmful algal blooms | Climate shifts, poor fertilizer timing, soil layering, drainage, large farm sizes |
Revise fertilizer guidelines, control runoff, target phosphorus at landscape level | ||
| Morales-Marín, et al. (2017) | 2017 | Nutrient loading in prairie reservoir |
Catchment modeling using SPARROW | High nutrient retention; fertilizer is major nutrient source | Agricultural runoff, population growth, reservoir limitations |
Optimize land use, reduce inputs, improve monitoring | ||
| Diaz-Elsayed et al. (2017) | 2017 | Sustainability of onsite wastewater treatment | Life cycle and cost assessments |
Advanced systems remove more nitrogen, lower eutrophication | High costs, material and energy use, variable performance |
Use efficient designs, sustainable materials, reduce maintenance | ||
| Alazaiza et al. (2023) | 2023 | Microalgae-based sewage water treatment | Experimental, various mixing ratios, biomass tracking | 97% phosphorus, 95% nitrogen, 84% organic removal, biomass yield | Light limitation, cost, scalability, pH, temperature control. | Optimize conditions, integrate systems, improve harvesting methods | ||
| Liu et al. (2025) | 2025 | Eutrophication in separated urban ponds | Field sampling, phosphorus analysis, water testing | High phosphorus, Class V water, Fe/Al-P main eutrophication source | Sediment pollution, sewage input, poor circulation, ineffective treatment | Remove silt, plant submerged vegetation, divert and treat sewage | ||
| Chen et al. (2017) | 2017 | Phytoremediation of nutrient-polluted drainage |
Pot experiment with five plant species | LS removed 57.7% nitrogen, 57.3% phosphorus; high plant uptake | Poor growth of some species, limited scalability, root decay | Use LS, OS, IA; harvest on time; test in real field conditions | ||
| Ma, Huang and Kao. (2018) | 2018 | Gate management impact on river water quality |
WASP modeling with hydrology and pollution data | Gate opening raises BOD, ammonia; 5 days to self-recover |
High pollution load, tidal effects, system sensitivity |
Limit gate open time, simulate effects, optimize closure strategy | ||
| Vymazal & Kröpfelová (2015) | 2015 | How hydraulic loading and seasonality affect nutrient removal in free-water-surface constructed wetlands |
Monitored N and P removal in a temperate free-water-surface wetland across seasonal hydraulic load rates | Removal rates ranged 4–12 g P m⁻² yr⁻¹ and 50–75 g N m⁻² yr⁻¹, peaking in summer |
Seasonal cold and high flows reduced performance | Adapt hydraulic loading seasonally to optimize removal vs. | ||
| Shuet et al. (2018) |
2018 | Nutrient removal by Chlorella vulgaris and Scenedesmus quadricauda in batch reactors | Operated batch algal reactors with municipal wastewater; tracked NH₄–N, NO₃–N, PO₄ removal kinetics | S. quadricauda removed 84 % NH₃–N, C. vulgaris 77 % TN; PO₄ removal < 50 % |
Both strains limited in NO₃–N and PO₄ |
Employ mixed-strain consortia and kinetic modeling to boost uptake rates | ||
| Pedersen & Borum (2016) |
2016 | Nutrient removal via biomass accumulation on artificial substrata in the northern Baltic Sea |
Deployed artificial substrates in situ for 14.5 months; quantified accumulated N, P in biomass |
Substrata biomass sequestered ~50 g N m⁻² and 5 g P m⁻² primarily in invertebrate and algal biomass | Heavy-metal uptake by biomass limits its use as soil amendment |
Locate substrata near point sources and valorize biomass for bioenergy | ||
| Mao et al. (2020) |
2020 | Quantification of N and P removal by China’s seaweed aquaculture | Combined national seaweed production statistics with tissue N/P content to estimate total nutrient sink |
China’s seaweed farms removed ~75,000 t N and 9,500 t P in 2010 | Expansion constrained by market incentives and profitability | Support seaweed farmers through policy incentives and integrate aquaculture into eutrophication management | ||
| Meng et al. (2020) |
2020 | IoT/cloud-based potassium sensor for real- time water quality |
Developed an ion-selective electrode for K⁺ linked via MQTT to a cloud platform; validated against lab assays |
Sensor achieved R² = 0.992 vs. lab standards; detection limit 0.1 mg L⁻¹ | Electrode fouling requires frequent calibration | Integrate self-cleaning membranes and remote calibration routines | ||
| Dodds et al. (2018) |
2018 | Review of N and P roles in stream eutrophication and management implications | Meta-analysis of global stream nutrient–chlorophyll datasets; developed trophic state classification thresholds | Defined thresholds where TN > 2 mg L⁻¹ or TP > 0.05 mg L⁻¹ drove periphyton blooms; dual N+P |
Overlooking N control leads to persistent cyanobacteria |
Manage both N and P in stream catchments simultaneously | ||
| Liet al.(2017) | 2017 | Advanced tertiary treatment of wastewater with Desmodesmus sp. SNN1 |
Batch culture optimization of pH and inoculum density for municipal secondary effluent polishing | Achieved ~90 % TN, 95 % TP and ~100 % NH₄⁺ removal within 12 days | Maintaining elevated pH operationally challenging | Deploy Desmodesmus in tertiary ponds and valorize algal biomass | ||
| Wang & Lü (2015) |
2015 | Impact of pyrolysis temperature on nutrient retention in poultry litter biochar | Produced biochar at 300 °C and 500 °C; characterized nutrient availability and sorption properties in lab assays |
Higher-temperature biochar (500 °C) had greater C stability but reduced P availability; 300 °C char released more labile |
Trade-off between nutrient stabilization and availability |
Apply 500 °C biochar with co-amendments to balance P retention and release | ||
| Fu et al. (2022) |
2022 | Warming and acidification effects on Heterosigma akashiwo cellular composition |
Cultured under current vs. elevated T (+4 °C) and pCO₂ (1000 µatm); measured cellular C, N, P, DNA/RNA content |
Future climate reduced cellular C, N, P and nucleic acids by 30–36 %, indicating potential bloom declines | Species-specific responses complicate projections | Incorporate multispecies experiments into climate–eutrophication models | ||
| Paerl & Huisman (2021) | 2021 | Global trends in harmful cyanobacterial blooms driven by climate change |
Synthesized > 200 satellite and in situ bloom records (2003–2007); correlated bloom frequency with SST and nutrient loads | Bloom frequency increased ~2 % yr⁻¹; warming strongest |
Distinguishing climate vs. nutrient driverse | Strengthen long-term monitoring and coupled climate–nutrient models | ||
| Wu et al. (2021) |
2021 | IoT-based dissolved oxygen monitoring for river basins |
Deployed wireless microcontroller DO sensors linked via NB-IoT to cloud; validated against YSI sondes | Enabled continuous DO profiles with error < 0.15 mg L⁻¹; supported remote data visualization |
Field connectivity and power supply consistency | Integrate solar power and mesh networking for robust basin-scale DO monitoring | ||
| Zhou et al (2017) | 2017 | Effects of CAS vs. BNR wastewater effluent on algal bloom potential | Bioassays exposing freshwater algal communities to CAS (conventional activated sludge) vs. BNR (biological nutrient removal) plant effluents |
BNR effluent triggered higher N-based algal yield despite lower TN, due to more bioavailable forms | Variability in nutrient speciation alters downstream effects | Evaluate effluent bioavailability before implementing full-scale BNR conversion | ||
| Mehta et al. (2015) | 2015 | River–lake connectivity effects on sediment C:N:P ratios in large lakes | Sampled sediments from 82 lakes; compared C:N:P stoichiometry in connected vs. isolated systems using elemental analysis | Connected lakes had higher sediment P; isolated lakes showed greater C and N accumulation; eutrophication reduced carbon sequestration | Heterogeneity in connectivity and hydrodynamics | Tailor sediment management to connectivity context (e.g., dredging vs. biomanipulation) | ||
| Kim et al. (2018) | 2018 | Smart IoT water-monitoring system for pH, CO₂, water level | Built ARM-based sensor nodes measuring pH, temperature, CO₂ and level; cloud integration with alert functions | Real-time monitoring with < 5 min latency; automated malfunction alerts | Scaling across multiple sites challenged by network bandwidth | Employ LPWAN protocols and edge computing for scalable, low-power deployments | ||
| Zhang et al. (2020) | 2020 | Microbial community response to nutrient removal in coastal sediment using ecological concrete | Embedded eco-concrete aggregates in nutrient-rich sediments; tracked microbial 16S rRNA gene abundances and TN/TP removal over 28 days | Eco-concrete promoted denitrifying bacteria (e.g., Sulfurovum); achieved ~8 % TN, 8 % TP removal | Low overall removal efficiency; substrate performance varied | Optimize eco-concrete formulations and support targeted microbial colonization | ||
| Wu et al. (2016) | 2016 | Phytoremediation of eutrophic waters by paired emergent vs. submerged macrophytes |
Paired plantings of Thalia dealbata, Canna indica (emergent) and Vallisneria natans (submerged) in waters high in N, P or both; measured uptake and biomass over 30 days | Dual emergent–submerged combinations removed nutrients more effectively; T. dealbata + C. indica best for TN, NH₃–N, NO₃–N and TP removal |
Site-specific species performance; optimal pairings vary with nutrient profile | Design phytoremediation schemes tailored to dominant nutrient stress (N, P or mixed) |
References
- Abiola, O. , Gift, O. and Omozele, A. (2024). Advances in communication tools and techniques for enhancing collaboration among creative professionals. International Journal of Frontiers in Science and Technology Research. [CrossRef]
- Akinnawo, S. (2023). Eutrophication: Causes, Consequences, Physical, Chemical and Biological Techniques for Mitigation Strategies. Environmental Challenges, 2667. [Google Scholar] [CrossRef]
- Álvarez, X. , Valero, E., Santos, R.M.B., Varandas, S.G.P., Sanches Fernandes, L.F. and Pacheco, F.A.L. (2017). Anthropogenic nutrients and eutrophication in multiple land use watersheds: Best management practices and policies for the protection of water resources. Land Use Policy, 69. [CrossRef]
- Amit Kumar Tiwari and Dan Bahadur Pal (2022). Nutrients contamination and eutrophication in the river ecosystem. <i>Ecological Significance of River Ecosystems</i>, pp. Amit Kumar Tiwari and Dan Bahadur Pal (2022). Nutrients contamination and eutrophication in the river ecosystem. Ecological Significance of River Ecosystems. [CrossRef]
- Andersen, I.M. , Williamson, T.J., González, M.J. and Vanni, M.J. (2019). Nitrate, ammonium, and phosphorus drive seasonal nutrient limitation of chlorophytes, cyanobacteria, and diatoms in a hyper-eutrophic reservoir. Limnology and Oceanography. [CrossRef]
- Bai, J. , Qin, Y., Zhao, J. and Song, Y. (2025). Investigation of agricultural nutrient removal by ecological ditches using meta-analysis. Agriculture, Ecosystems & Environment, 9401. [Google Scholar] [CrossRef]
- Bergbusch, N.T. , Hayes, N.M., Simpson, G.L., Swarbrick, V.J., Quiñones-Rivera, Z.J. and Leavitt, P.R. (2021). Effects of nitrogen removal from wastewater on phytoplankton in eutrophic prairie streams. Freshwater Biology, 2283. [Google Scholar] [CrossRef]
- Boonsong, W. , Ismail, W., Shinohara, N., Nameh, S.M.I.S., Alifah, S., Hafiz, K. and Kamaludin, T.A., 2020. Real-time water quality monitoring of aquaculture pond using wireless sensor network and internet of things. Journal of Theoretical and Applied Information Technology.
- Campelo, J.C. , Capella, J.V., Ors, R., Peris, M. and Bonastre, A. (2022). IoT Technologies in Chemical Analysis Systems: Application to Potassium Monitoring in Water. Sensors (Basel, Switzerland). [CrossRef]
- Chabalala, K. , Boyana, S., Kolisi, L., Thango, B., & Lerato, M. (2024). Digital technolo-gies and channels for competitive advantage in SMEs: A systematic review. Available at SSRN 4977280.
- Chang, N.-B. , Imen, S. and Vannah, B. (2015). Remote Sensing for Monitoring Surface Water Quality Status and Ecosystem State in Relation to the Nutrient Cycle: A 40-Year Perspective. Critical Reviews in Environmental Science and Technology. [CrossRef]
- Chen, C. , Zhao Tian-cheng, Liu, R. and Luo, L. (2017). Performance of five plant species in removal of nitrogen and phosphorus from an experimental phytoremediation system in the Ningxia irrigation area. Environmental Monitoring and Assessment. [CrossRef]
- Daigavane, V. and Gaikwad, M. (2017). Water Quality Monitoring System Based on IOT. [online] 10(5), pp.1107–1116. Available at: https://www.ripublication.com/awmc17/awmcv10n5_24.pdf.
- Das, B. and Jain, P., 2017. Real-time water quality monitoring system using Internet of Things. In: Proceedings of the 2017 International Conference on Computer, Communications and Electronics (Comptelix 2017), Jaipur, India, , pp.78–82. 1–2 July.
- Diaz-Elsayed, N. , Xu, X., Balaguer-Barbosa, M. and Zhang, Q. (2017). An evaluation of the sustainability of onsite wastewater treatment systems for nutrient management. Water Research. [CrossRef]
- Dladla, V. M. N. , & Thango, B. A. (2025). Fault Classification in Power Transformers via Dissolved Gas Analysis and Machine Learning Algorithms: A Systematic Literature Review. Applied Sciences, 15(5), 2395. [CrossRef]
- Dodds, W. and Smith, V. (2016). Nitrogen, phosphorus, and eutrophication in streams. Inland Waters. [CrossRef]
- El-Tohamy, W.S. , Azab, Y.A. and Abdel-Aziz, N., 2019. Evaluation of the water quality of Damietta Harbor: Using the zooplankton diversity and the traditional water quality parameters. International Journal of Oceans and Oceanography.
- Elijah, O. , Rahman, T.A., Leow, C.Y., Yeen, H.C., Sarijari, M.A., Aris, A., Salleh, J. and Chua, T.H. (2018). A Concept Paper on Smart River Monitoring System for Sustainability in River. International Journal of Integrated Engineering. [CrossRef]
- Eom, H. , Borgatti, D., Paerl, H.W. and Park, C. (2017). Formation of Low-Molecular-Weight Dissolved Organic Nitrogen in Predenitrification Biological Nutrient Removal Systems and Its Impact on Eutrophication in Coastal Waters. Environmental Science & Technology, 3776. [Google Scholar] [CrossRef]
- Faria, T. , Martins, V., Canha, N., E. Diapouli, M. Manousakas, P. Fetfatzis, Gini, M.I. and Almeida, S.M. (2021). Assessment of children’s exposure to carbonaceous matter and to PM major and trace elements. The Science of The Total Environment, 1510. [Google Scholar] [CrossRef]
- Fernandes, T.V. , Suárez-Muñoz, M., Trebuch, L.M., Verbraak, P.J. and Van de Waal, D.B. (2017). Toward an Ecologically Optimized N:P Recovery from Wastewater by Microalgae. Frontiers in Microbiology. [CrossRef]
- Gehlot, A. , Singh, R., Samkaria, R., Choudhary, S., De, A. and Kamlesh (2018).
- using XBee and internet of things. International Journal of Engineering & Technology. [CrossRef]
- Glibert, P.M. , Berdalet, E., Burford, M.A., Pitcher, G.C. and Zhou, M. (2018). Introduction to the Global Ecology and Oceanography of Harmful Algal Blooms (GEOHAB) Synthesis. Ecological studies. [CrossRef]
- Ghimire, S. , Flury, M., Scheenstra, E.J. and Miles, C.A. (2020). Sampling and degradation of biodegradable plastic and paper mulches in field after tillage incorporation. Science of The Total Environment, 1355. [Google Scholar] [CrossRef]
- Gu, P. , Li, Q., Zhang, H., Luo, X., Zhang, W., Zheng, Z. and Luo, X. (2020). Effects of Cyanobacteria on Phosphorus Cycling and Other Aquatic Organisms in Simulated Eutrophic Ecosystems. Water, 2265. [Google Scholar] [CrossRef]
- Han, J. , Xin, Z., Han, F., Xu, B., Wang, L., Zhang, C. and Zheng, Y. (2021). Source contribution analysis of nutrient pollution in a P-rich watershed: Implications for integrated water quality management. Environmental Pollution, 1168. [Google Scholar] [CrossRef]
- Hendriks, A.T.W.M. and Langeveld, J.G. (2017). Rethinking Wastewater Treatment Plant Effluent Standards: Nutrient Reduction or Nutrient Control? Environmental Science & Technology, 4735. [Google Scholar] [CrossRef]
- Hua, T. , Zhao, W., Cherubini, F., Hu, X. and Pereira, P. (2023). Upgrading protected areas can improve or reverse the decline in conservation effectiveness: Evidence from the Tibetan Plateau, China. Science of The Total Environment, 1623. [Google Scholar] [CrossRef]
- Hobbie, S.E. , Finlay, J.C., Janke, B.D., Nidzgorski, D.A., Millet, D.B. and Baker, L.A. (2017). Contrasting nitrogen and phosphorus budgets in urban watersheds and implications for managing urban water pollution. Proceedings of the National Academy of Sciences, 4177. [Google Scholar] [CrossRef]
- Hossain, M. , Arhonditsis, G.B., Hoyle, J.A., Randall, R.G. and Koops, M.A. (2019). Nutrient management and structural shifts in fish assemblages: Lessons learned from an Area of Concern in Lake Ontario. Freshwater Biology. [CrossRef]
- Ibrahim, S.N. , Asnawi, A.L., Malik, N.A., Mohd Azmin, N.F., Jusoh, A.Z. and Mohd Isa, F.N. (2018). Web based Water Turbidity Monitoring and Automated Filtration System: IoT Application in Water Management. International Journal of Electrical and Computer Engineering (IJECE), 2503. [Google Scholar] [CrossRef]
- Ighalo, J.O. , Adeniyi, A.G. and Marques, G., 2021. Internet of things for water quality monitoring and assessment: A comprehensive review. In: Artificial Intelligence for Sustainable Development: Theory, Practice and Future Applications. Cham, Switzerland: Springer, pp.245–259.
- ]. Lan, J. ]. Lan, J., Liu, P., Hu, X. and Zhu, S. (2024). Harmful Algal Blooms in Eutrophic Marine Environments: Causes, Monitoring, and Treatment. Water, 2525. [Google Scholar] [CrossRef]
- Kapsalis, V.C. and Kalavrouziotis, I.K. (2021). Eutrophication—A Worldwide Water Quality Issue. Springer eBooks. [CrossRef]
- Kgakatsi, M. , Galeboe, O. P., Molelekwa, K. K., & Thango, B. A. (2024). The Impact of Big Data on SME Performance: A Systematic Review. Businesses, 4(4), 632-695. [CrossRef]
- Khanyi, M. B. , Xaba, S. N., Mlotshwa, N. A., Thango, B., & Matshaka, L. (2024). A Roadmap to Systematic Review: Evaluating the Role of Data Networks and Application Programming Interfaces in Enhancing Operational Efficiency in Small and Medium Enterprises. Sustainability, 16(23), 10192. [CrossRef]
- Kumar, A. , Mishra, S., Singh, N.K., Yadav, M., Padhiyar, H., Christian, J. and Kumar, R. (2024). Ensuring carbon neutrality via algae-based wastewater treatment systems: Progress and future perspectives. Journal of Environmental Management, 1211. [Google Scholar] [CrossRef]
- Lalithadevi, B. , Yadav, A., Pandey, A. and Adhikari, M., 2019. IoT-based WSN ground water monitoring system with cloud-based monitoring as a service (MaaS) and prediction using machine learning. International Journal of Innovative Technology and Exploring Engineering (Regular Issue).
- Lakshmikantha, V. , Hiriyannagowda, A., Manjunath, A., Patted, A., Basavaiah, J. and Anthony, A.A. (2021). IoT based smart water quality monitoring system. Global Transitions Proceedings. [CrossRef]
- Lapointe, B.E. , Herren, L.W., Debortoli, D.D. and Vogel, M.A. (2015). Evidence of sewage-driven eutrophication and harmful algal blooms in Florida’s Indian River Lagoon. Harmful Algae, 43. [CrossRef]
- Li, J. , He, Y., Xie, T., Song, Z., Bai, S., Zhang, X. and Wang, C. (2025). Seasonal Variations and Drivers of Total Nitrogen and Phosphorus in China’s Surface Waters. Water. [CrossRef]
- Li, Y. , Huang, Y., Ji, D., Cheng, Y., Nwankwegu, A.S., Paerl, H.W., Tang, C., Yang, Z., Zhao, X., Chen, Y. and Li, J. (2022). Storm and floods increase the duration and extent of phosphorus limitation on algal blooms in a tributary of the Three Gorges Reservoir, China. Journal of Hydrology, 1275. [Google Scholar] [CrossRef]
- Liang, X. , Lin, L., Ye, Y., Gu, J., Wang, Z., Xu, L., Jin, Y., Ru, Q. and Tian, G. (2015). Nutrient removal efficiency in a rice-straw denitrifying bioreactor. Bioresource Technology. [CrossRef]
- Ma, C.-Y. , Huang, Y.-C. and Kao, C.-M. (2018). Development of Optimal Management Strategies for the Interception System Using River Water Quality Modeling. MATEC Web of Conferences, 0302. [Google Scholar] [CrossRef]
- Mahapatro, P.K. , Panigrahi, R. and Padhy, N. (2024). Integrated Internet of Things and Artificial Intelligence System for Real-Time Multi-Nutrient Water Quality Analysis in Agriculture. ECSA-11. [CrossRef]
- Mahsa Pishbin, Mohammad-Hossein Sarrafzadeh and Faramarzi, M.A. (2020). Nitrate and Phosphate Removal Efficiency of Synechococcus elongatus Under Mixotrophic and Heterotrophic Conditions for Wastewater Treatment. Iranian Journal of Science and Technology Transactions of Civil Engineering, 1831. [CrossRef]
- Martin, J.F. , Kalcic, M.M., Aloysius, N., Apostel, A.M., Brooker, M.R., Evenson, G., Kast, J.B., Kujawa, H., Murumkar, A., Becker, R., Boles, C., Confesor, R., Dagnew, A., Guo, T., Long, C.M., Muenich, R.L., Scavia, D., Redder, T., Robertson, D.M. and Wang, Y.-C. (2021). Evaluating management options to reduce Lake Erie algal blooms using an ensemble of watershed models. Journal of Environmental Management, 1117. [Google Scholar] [CrossRef]
- Martínez, R. , Vela, N., el Aatik, A., Murray, E., Roche, P. and Navarro, J.M. (2020). On the Use of an IoT Integrated System for Water Quality Monitoring and Management in Wastewater Treatment Plants. Water, 1096. [Google Scholar] [CrossRef]
- Mennaa, F.Z. , Arbib, Z. and Perales, J.A. (2015). Urban wastewater treatment by seven species of microalgae and an algal bloom: Biomass production, N and P removal kinetics and harvestability. Water Research. [CrossRef]
- Mielcarek, A. , Karolina Kłobukowska, Rodziewicz, J., Wojciech Janczukowicz and Kamil Łukasz Bryszewski (2023). Water Nutrient Management in Soilless Plant Cultivation versus Sustainability. Sustainability. [CrossRef]
- Milla Suutari, Leskinen, E., Spilling, K., Kirsi Kostamo and Jukka Seppälä (2016). Nutrient removal by biomass accumulation on artificial substrata in the northern Baltic Sea. Journal of applied phycology, 1707. [CrossRef]
- Mitsch, W.J. (2017). Solving Lake Erie’s harmful algal blooms by restoring the Great Black Swamp in Ohio. Ecological Engineering. [CrossRef]
- Modeling temporal and spatial variations of biogeochemical processes in a large subtropical lake: Assessing alternative solutions to algal blooms in Lake Okeechobee, Florida. (2023). Journal of Hydrology: Regional Studies, 1014; 47. [CrossRef]
- Molete, O. B. , Mokhele, S. E., Ntombela, S. D., & Thango, B. A. (2025). The Impact of IT Strategic Planning Process on SME Performance: A Systematic Review. Businesses, 5(1), 2. [CrossRef]
- Msane, M. R. , Thango, B. A., & Ogudo, K. A. (2024). Condition Monitoring of Electrical Transformers Using the Internet of Things: A Systematic Literature Review. Applied Sciences, 14(21), 9690. [CrossRef]
- Nadu, T. , 2020. An underground pipeline water quality monitoring using IoT devices. European Journal of Molecular & Clinical Medicine, 2054. [Google Scholar]
- Nandakumar, S. , Pipil, H., Ray, S. and Haritash, A.K. (2019). Removal of phosphorous and nitrogen from wastewater in Brachiaria-based constructed wetland. Chemosphere. [CrossRef]
- Ngatia, L. and Taylor, R. (2018). Phosphorus Eutrophication and Mitigation Strategies. Phosphorus - Recovery and Recycling. [CrossRef]
- Ngcobo, K. , Bhengu, S., Mudau, A., Thango, B., & Lerato, M. (2024). Enterprise data management: Types, sources, and real-time applications to enhance business performance-a systematic review. Systematic Review| September.
- Niu, Y. , Ye, Q., Liu, Q., Yu, H., Tao, Y., Wang, H., Niu, Y. and Luo, M. (2022). Effect of river–lake connectivity on ecological stoichiometry of lake and carbon storage status in Eastern Plain, China. Environmental Geochemistry and Health, 1905. [Google Scholar] [CrossRef]
- Olatinwo, S.O. and Joubert, Trudi-H. (2019). Energy Efficient Solutions in Wireless Sensor Systems for Water Quality Monitoring: A Review. IEEE Sensors Journal, 1596. [Google Scholar] [CrossRef]
- Oliver, N. , Martín, M., Gargallo, S. and Hernández-Crespo, C. (2016). Influence of operational parameters on nutrient removal from eutrophic water in a constructed wetland. Hydrobiologia. [CrossRef]
- Oztemel, E. and Gursev, S. (2020). Literature review of Industry 4.0 and related technologies. Journal of Intelligent Manufacturing, [online] 31(31). Available at: https://link.springer.com/article/10.1007/s10845-018-1433-8.
- Paerl, H.W. , Scott, J.T., McCarthy, M.J., Newell, S.E., Gardner, W.S., Havens, K.E., Hoffman, D.K., Wilhelm, S.W. and Wurtsbaugh, W.A. (2016). It Takes Two to Tango: When and Where Dual Nutrient (N & P) Reductions Are Needed to Protect Lakes and Downstream Ecosystems. Environmental Science & Technology, 1081. [Google Scholar] [CrossRef]
- Park, C. , Sheppard, D., Yu, D., Dolan, S., Eom, H., Brooks, J. and Borgatti, D. (2016). Comparative assessment on the influences of effluents from conventional activated sludge and biological nutrient removal processes on algal bloom in receiving waters. Environmental Engineering Research. [CrossRef]
- Park, J. , Kim, K.T. and Lee, W.H. (2020). Recent Advances in Information and Communications Technology (ICT) and Sensor Technology for Monitoring Water Quality. Water. [CrossRef]
- Payen, S. , Cosme, N. and Elliott, A.H. (2021). Freshwater eutrophication: spatially explicit fate factors for nitrogen and phosphorus emissions at the global scale. The International Journal of Life Cycle Assessment. [CrossRef]
- Pedram Kheirkhah Sangdeh and Zeng, H. (2021). DeepMux: Deep-Learning-Based Channel Sounding and Resource Allocation for IEEE 802.11ax. IEEE Journal on Selected Areas in Communications, 2333. [Google Scholar] [CrossRef]
- Perri, K.A. , Sullivan, J.M. and Boyer, G.L. (2015). Harmful algal blooms in Sodus Bay, Lake Ontario: A comparison of nutrients, marina presence, and cyanobacterial toxins. Journal of Great Lakes Research. [CrossRef]
- Petr Znachor, Jiří Nedoma, Hejzlar, J., Jaromír Seďa, Jaroslava Komárková, Vojtěch Kolář, Tomáš Mrkvička and Boukal, D.S. (2020). Changing environmental conditions underpin long-term patterns of phytoplankton in a freshwater reservoir. Science of The Total Environment, 1356. [CrossRef]
- Pingilili, A. , Letsie, N., Nzimande, G., Thango, B., & Matshaka, L. (2025). Guiding IT Growth and Sustaining Performance in SMEs Through Enterprise Architecture and Information Management: A Systematic Review. Businesses, 5(2), 17. [CrossRef]
- Prabu, M. , Abhinav, S.B., Narayanan, H.B., Sugandhi, S.S. and Rajeshkumar, D., 2023. Design of water quality and soil macronutrients measuring device using TDS and NPK sensor.
- Qi, J. , Deng, L., Song, Y., Qi, W. and Hu, C. (2022). Nutrient Thresholds Required to Control Eutrophication: Does It Work for Natural Alkaline Lakes? Water, 2674. [Google Scholar] [CrossRef]
- Richa, A. , Fizir, M. and Touil, S. (2021). Advanced monitoring of hydroponic solutions using ion-selective electrodes and the internet of things: a review. Environmental Chemistry Letters, 3445. [Google Scholar] [CrossRef]
- S. Göncü, B. S. Göncü, B. Şimşek Uygun and S. Atakan (2025). Nıtrogen and phosphorus removal from wastewater usıng Chlorella vulgarıs and Scenedesmus quadrıcauda mıcroalgae wıth a batch bıoreactor. International Journal of Environmental Science and Technology. [CrossRef]
- Sakiyama, R.Z. , Zukeram, E.S.J., Ruiz, L.B. and Andrade, C.M.G. (2023). Development of a Platform for Monitoring the Levels of Dispersed Oxygen in River Components of a Water Supply Micro Basin Using Programmable Microcontrollers. Water, 2316. [Google Scholar] [CrossRef]
- Sguanci, M. , Stefano Mancin, Gazzelloni, A., Diamanti, O., Ferrara, G., Palomares, S.M., Parozzi, M., Petrelli, F. and Cangelosi, G. (2024). The Internet of Things in the Nutritional Management of Patients with Chronic Neurological Cognitive Impairment: A Scoping Review. Healthcare. [CrossRef]
- Sharma, R. , Vaidya, P. and Sharma, B. (2024). A Review on Plant Growth Monitoring using Artificial Intelligence and the Internet of Things. [CrossRef]
- Shen, Q.-H. , Jiang, J.-W., Chen, L.-P., Cheng, L.-H., Xu, X.-H. and Chen, H.-L. (2015). Effect of carbon source on biomass growth and nutrients removal of Scenedesmus obliquus for wastewater advanced treatment and lipid production. Bioresource Technology. [CrossRef]
- Stubbs, M. , 2016. Nutrients in Agricultural Production: A Water Quality Overview, /: Research Service, Report No. R43919. Available at: https, 4391. [Google Scholar]
- Strokal, M. , Kroeze, C., Li, L., Luan, S., Wang, H., Yang, S. and Zhang, Y. (2015). Increasing dissolved nitrogen and phosphorus export by the Pearl River (Zhujiang): a modeling approach at the sub-basin scale to assess effective nutrient management. Biogeochemistry. [CrossRef]
- Suresh, K. , Tang, T., Michelle, Marc, Maryna Strokal, Florian Sorger-Domenigg and Wada, Y. (2023). Recent advancement in water quality indicators for eutrophication in global freshwater lakes. 18(6), pp.063004–063004. [CrossRef]
- Tang, C. , Li, Y. and Acharya, K. (2016). Modeling the effects of external nutrient reductions on algal blooms in hyper-eutrophic Lake Taihu, China. Ecological Engineering, 94. [CrossRef]
- Thai-Nghe, N. , Thanh-Hai, N. and Chi, N. (2020). Deep Learning Approach for Forecasting Water Quality in IoT Systems. International Journal of Advanced Computer Science and Applications. [CrossRef]
- Thangaraj, S. and Sun, J. (2023). Ocean warming and acidification affect the transitional C:N:P ratio and macromolecular accumulation in the harmful raphidophyte Heterosigma akashiwo. Communications Biology. [CrossRef]
- Thango, B. A. , & Obokoh, L. (2024). Techno-Economic Analysis of Hybrid Renewable Energy Systems for Power Interruptions: A Systematic Review. Eng, 5(3), 2108-2156. [CrossRef]
- Thilakarathna, M. and Raizada, M. (2015). A Review of Nutrient Management Studies Involving Finger Millet in the Semi-Arid Tropics of Asia and Africa. Agronomy. [CrossRef]
- Thobejane, L. T. , & Thango, B. A. (2024). Partial Discharge Source Classification in Power Transformers: A Systematic Literature Review. Applied Sciences, 14(14), 6097. [CrossRef]
- Tian, S. , Guo, H., Xu, W., Zhu, X., Wang, B., Zeng, Q., Mai, Y. and Jinhui Jeanne Huang (2022). Remote sensing retrieval of inland water quality parameters using Sentinel-2 and multiple machine learning algorithms. Environmental Science and Pollution Research, 1861. [Google Scholar] [CrossRef]
- Vantarakis, A. (2021). Eutrophication and Public Health. Chemical Lake Restoration. [CrossRef]
- Watson, S.B. , Miller, C., Arhonditsis, G., Boyer, G.L., Carmichael, W., Charlton, M.N., Confesor, R., Depew, D.C., Höök, T.O., Ludsin, S.A., Matisoff, G., McElmurry, S.P., Murray, M.W., Peter Richards, R., Rao, Y.R., Steffen, M.M. and Wilhelm, S.W. (2016). The re-eutrophication of Lake Erie: Harmful algal blooms and hypoxia. Harmful algae, [online] 56, pp.44–66. [CrossRef]
- Wang, J. , Bouwman, A.F., Liu, X., Beusen, A.H.W., Van Dingenen, R., Dentener, F., Yao, Y., Glibert, P.M., Ran, X., Yao, Q., Xu, B., Yu, R., Middelburg, J.J. and Yu, Z. (2021). Harmful Algal Blooms in Chinese Coastal Waters Will Persist Due to Perturbed Nutrient Ratios. Environmental Science & Technology Letters. [CrossRef]
- Wang, Y. , Zhao, D., R Iestyn Woolway, Yan, H., Paerl, H.W., Zheng, Y., Zheng, C. and Feng, L. (2025). Algal blooms intensify in global large lakes over the past two decades. National Science Review. [CrossRef]
- Wang, P. , Shao, Y., Geng, Y., Mushtaq, R., Yang, W., Li, M., Sun, X., Wang, H. and Chen, G. (2023). Advanced treatment of secondary effluent from wastewater treatment plant by a newly isolated microalga Desmodesmus sp. SNN1. ( 2023). Advanced treatment of secondary effluent from wastewater treatment plant by a newly isolated microalga Desmodesmus sp. SNN1. Frontiers in Microbiology, 14. [CrossRef]
- Wang, W. , Shen, H., Shi, P., Chen, J., Ni, L. and Xie, P. (2015). Experimental evidence for the role of heterotrophic bacteria in the formation of Microcystis colonies. Journal of Applied Phycology, 1111. [Google Scholar] [CrossRef]
- Wang, X. , Gu, J., Wang, Y., Chang, B., Jin, Q., Cong, X., Xu, Y. and Wang, Y. (2024). phytoremediation of water with different eutrophic characteristics by macrophytes in two life forms. Environmental Technology & Innovation, 1038. [Google Scholar] [CrossRef]
- Wells, M.L. , Karlson, B., Wulff, A., Kudela, R., Trick, C., Asnaghi, V., Berdalet, E., Cochlan, W., Davidson, K., De Rijcke, M., Dutkiewicz, S., Hallegraeff, G., Flynn, K.J., Legrand, C., Paerl, H., Silke, J., Suikkanen, S., Thompson, P. and Trainer, V.L. (2020). Future HAB science: Directions and challenges in a changing climate. Harmful Algae, 1016; 91. [Google Scholar] [CrossRef]
- Wright, S.H. and Manahan, D.T. (1989). Integumental Nutrient Uptake by Aquatic Organisms. Annual Review of Physiology. [CrossRef]
- Wurtsbaugh, W.A. , Paerl, H.W. and Dodds, W.K. (2019). Nutrients, eutrophication and harmful algal blooms along the freshwater to marine continuum. Wiley Interdisciplinary Reviews: Water. [CrossRef]
- Wu, H. , Kim, J.K., Huo, Y., Zhang, J. and He, P. (2017). Nutrient removal ability of seaweeds on Pyropia yezoensis aquaculture rafts in China’s radial sandbanks. Aquatic Botany. [CrossRef]
- Xiao, X. , Agusti, S., Lin, F., Li, K., Pan, Y., Yu, Y., Zheng, Y., Wu, J. and Duarte, C.M. (2017). Nutrient removal from Chinese coastal waters by large-scale seaweed aquaculture. Scientific Reports. [CrossRef]
- Xu, L. , Cheng, S., Zhuang, P., Xie, D., Li, S., Liu, D., Li, Z., Wang, F. and Xing, F. (2020). Assessment of the Nutrient Removal Potential of Floating Native and Exotic Aquatic Macrophytes Cultured in Swine Manure Wastewater. International Journal of Environmental Research and Public Health, 1103. [Google Scholar] [CrossRef]
- Yang, Y. , Qian, X., Alamu, S.O., Brown, K., Lee, S.W. and Kang, D.-H. (2024). Qualities and Quantities of Poultry Litter Biochar Characterization and Investigation. Energies, 2885. [Google Scholar] [CrossRef]
- Yi, Q. , Chen, Q., Hu, L. and Shi, W. (2017). Tracking Nitrogen Sources, Transformation, and Transport at a Basin Scale with Complex Plain River Networks. Environmental Science & Technology, 5396. [Google Scholar] [CrossRef]
- Zaragüeta, M. and Acebes, P. (2017). Controlling Eutrophication in A Mediterranean Shallow Reservoir by Phosphorus Loading Reduction: The Need for an Integrated Management Approach. Environmental Management. [CrossRef]
- Zhang, M. , Ji, J., Liu, L., Guo, Y. and Chen, J. (2023). Response of microbial communities to nutrient removal in coastal sediment by using ecological concrete. Environmental Science and Pollution Research, 7081. [Google Scholar] [CrossRef]
- Zhu, Y. , Fang, T., Ji, D., Li, H., Chen, J. and Ma, J. (2024). Recent advances and prospects in on-site spectrophotometric nutrient measurement in aquatic ecosystems. TrAC Trends in Analytical Chemistry, 1177. [Google Scholar] [CrossRef]
- Zulkifli, C.Z. , Garfan, S., Talal, M., Alamoodi, A.H., Alamleh, A., Ahmaro, I.Y.Y., Sulaiman, S., Ibrahim, A.B., Zaidan, B.B., Ismail, A.R., Albahri, O.S., Albahri, A.S., Soon, C.F., Harun, N.H. and Chiang, H.H. (2022). IoT-Based Water Monitoring Systems: A Systematic Review. Water, 3621. [Google Scholar] [CrossRef]
Figure 1.
Data collection process.
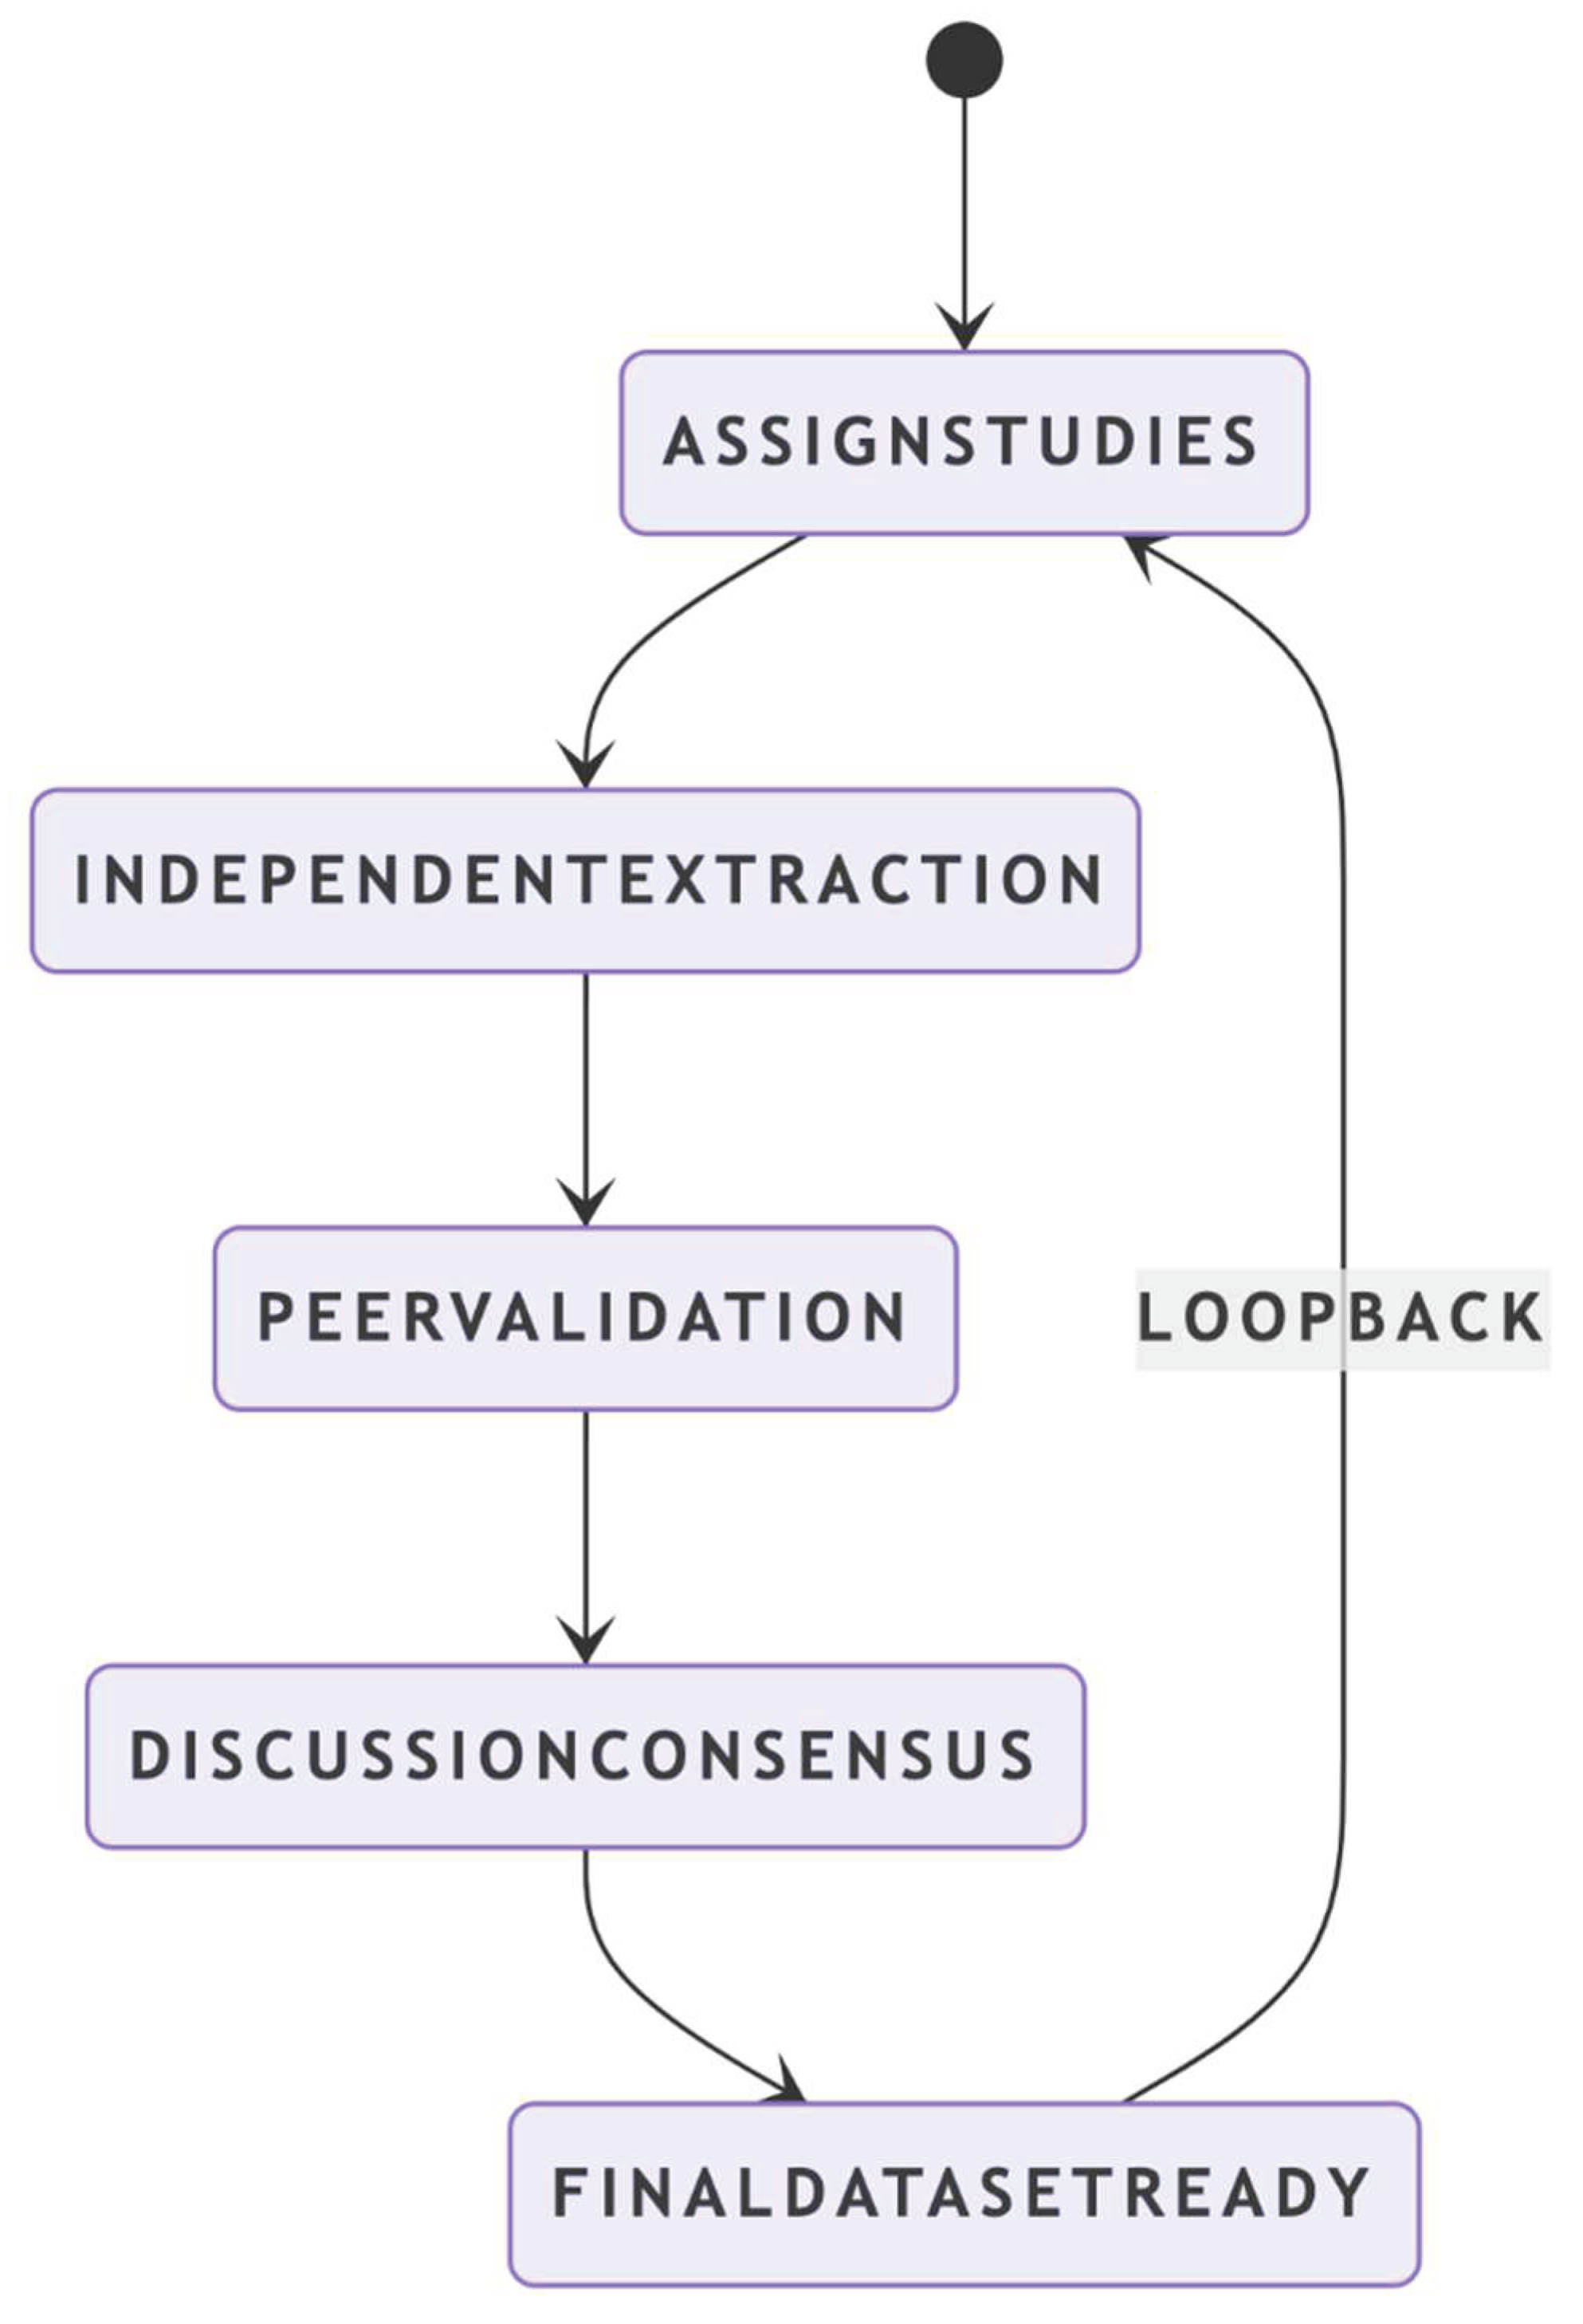
Figure 2.
Data collection methods.
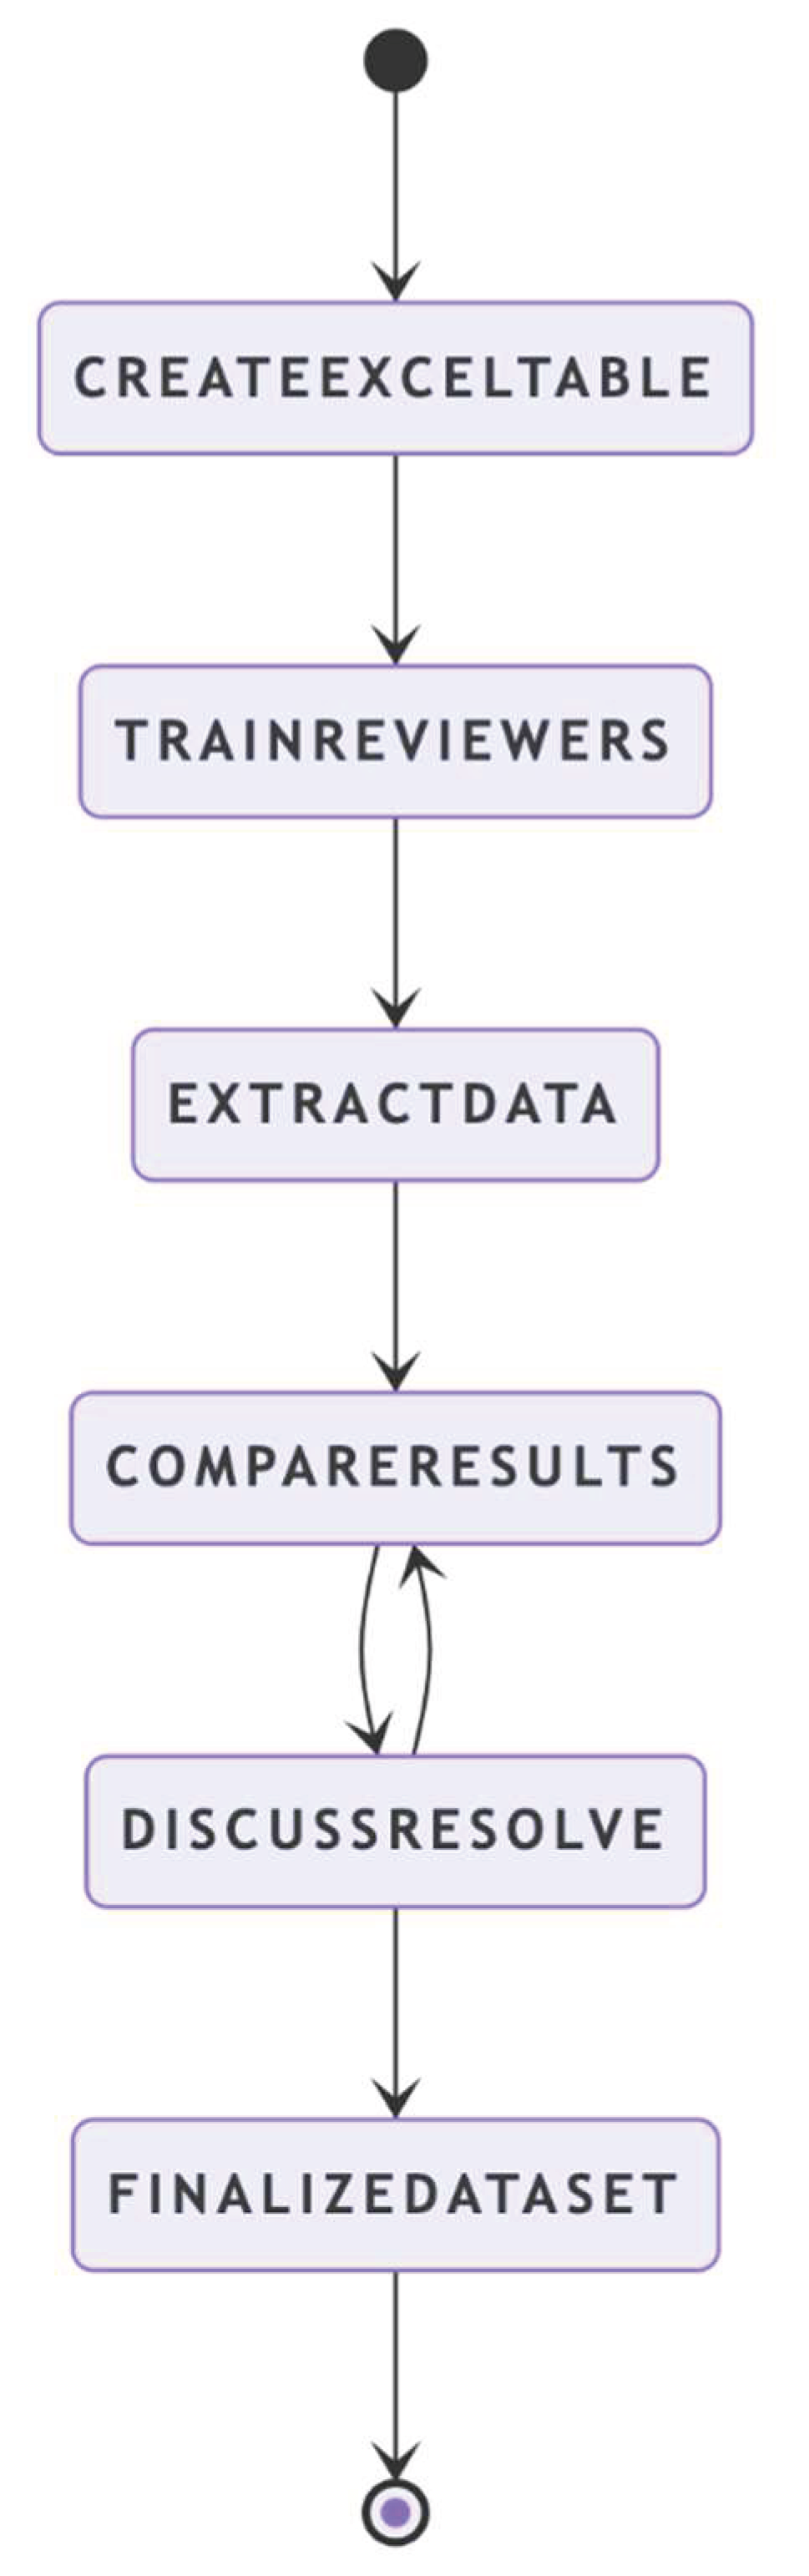
Figure 3.
Study risk bias assessment.
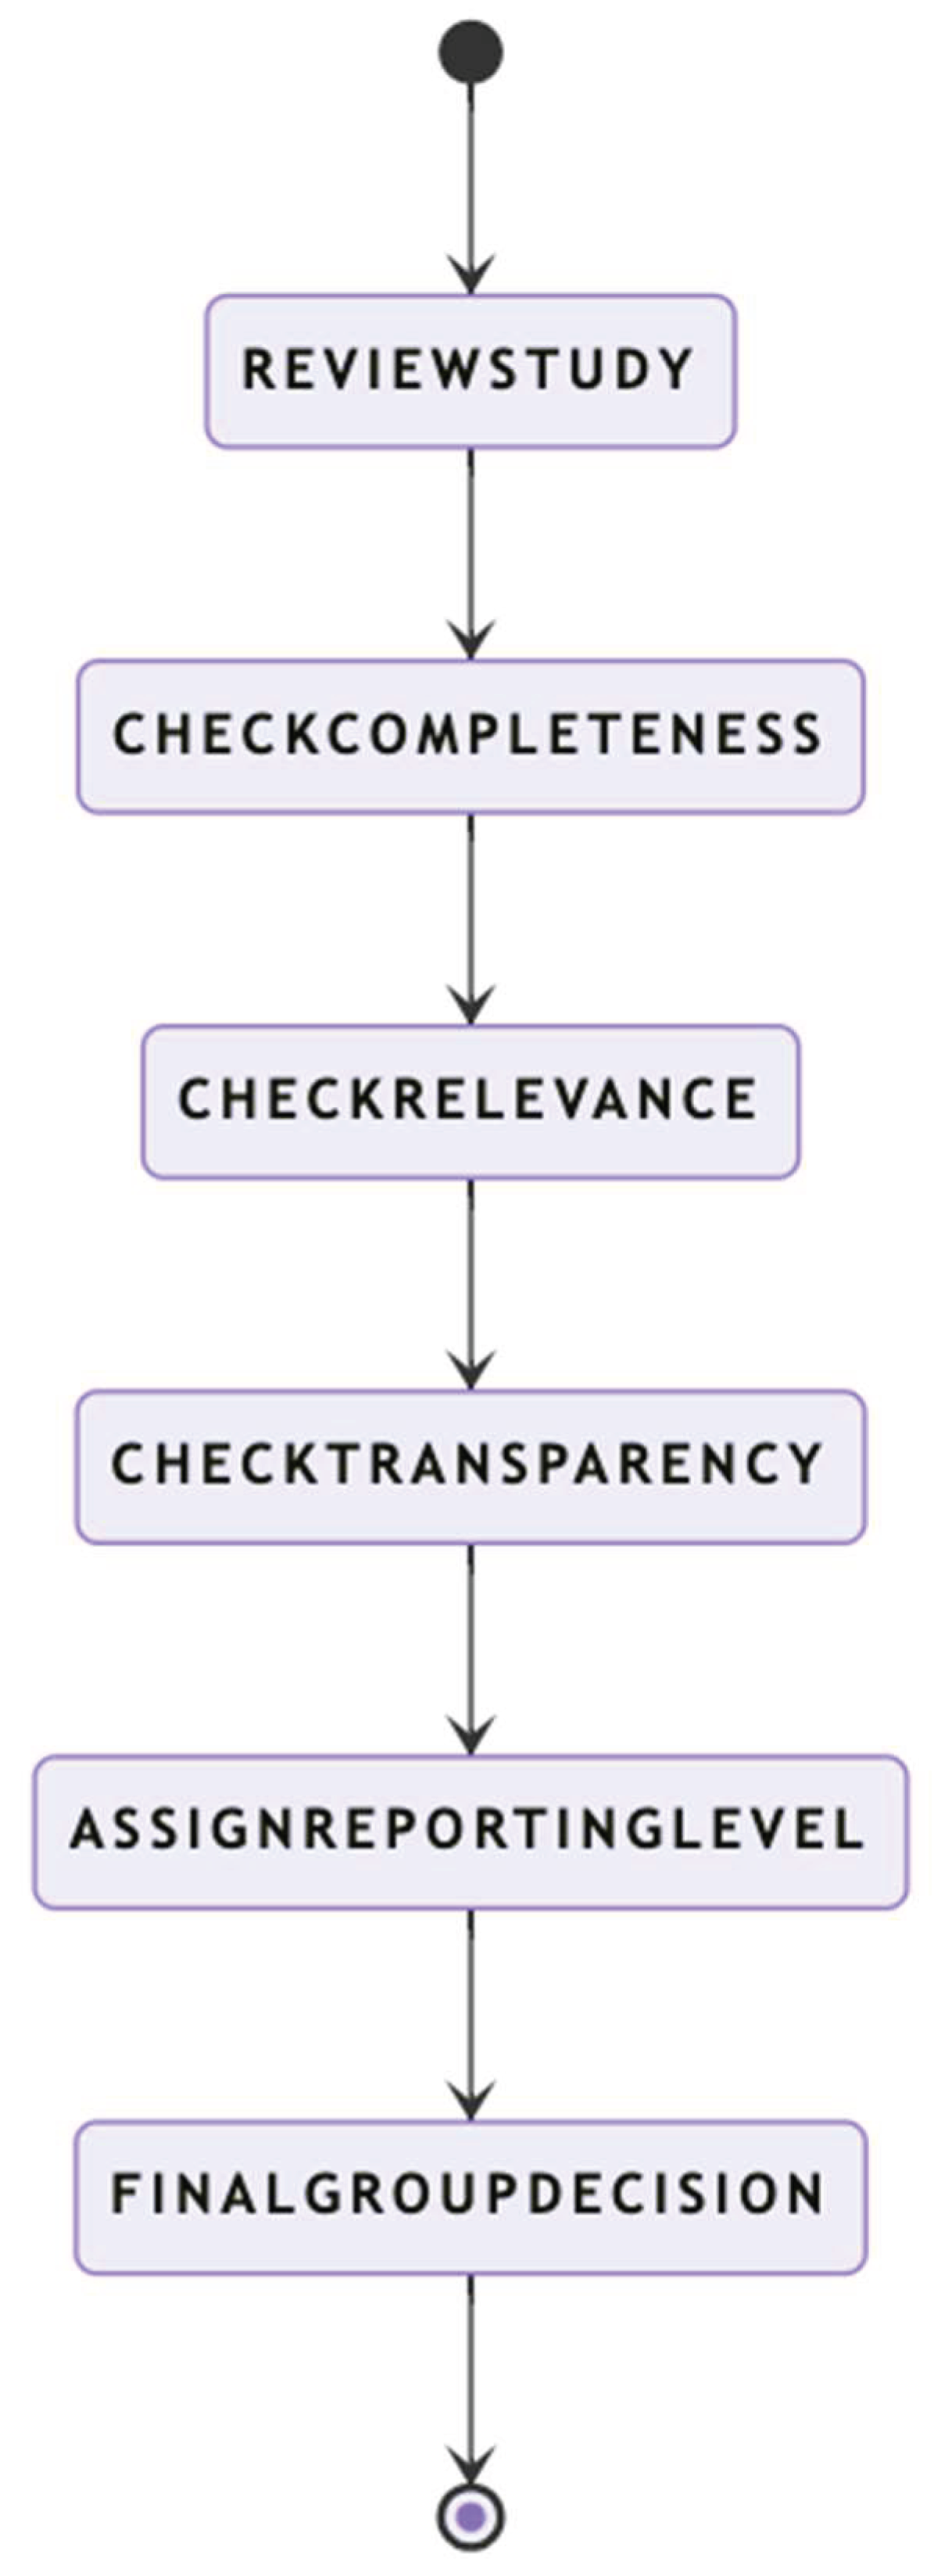
Figure 4.
Flowchart for data preparation for synthesis.
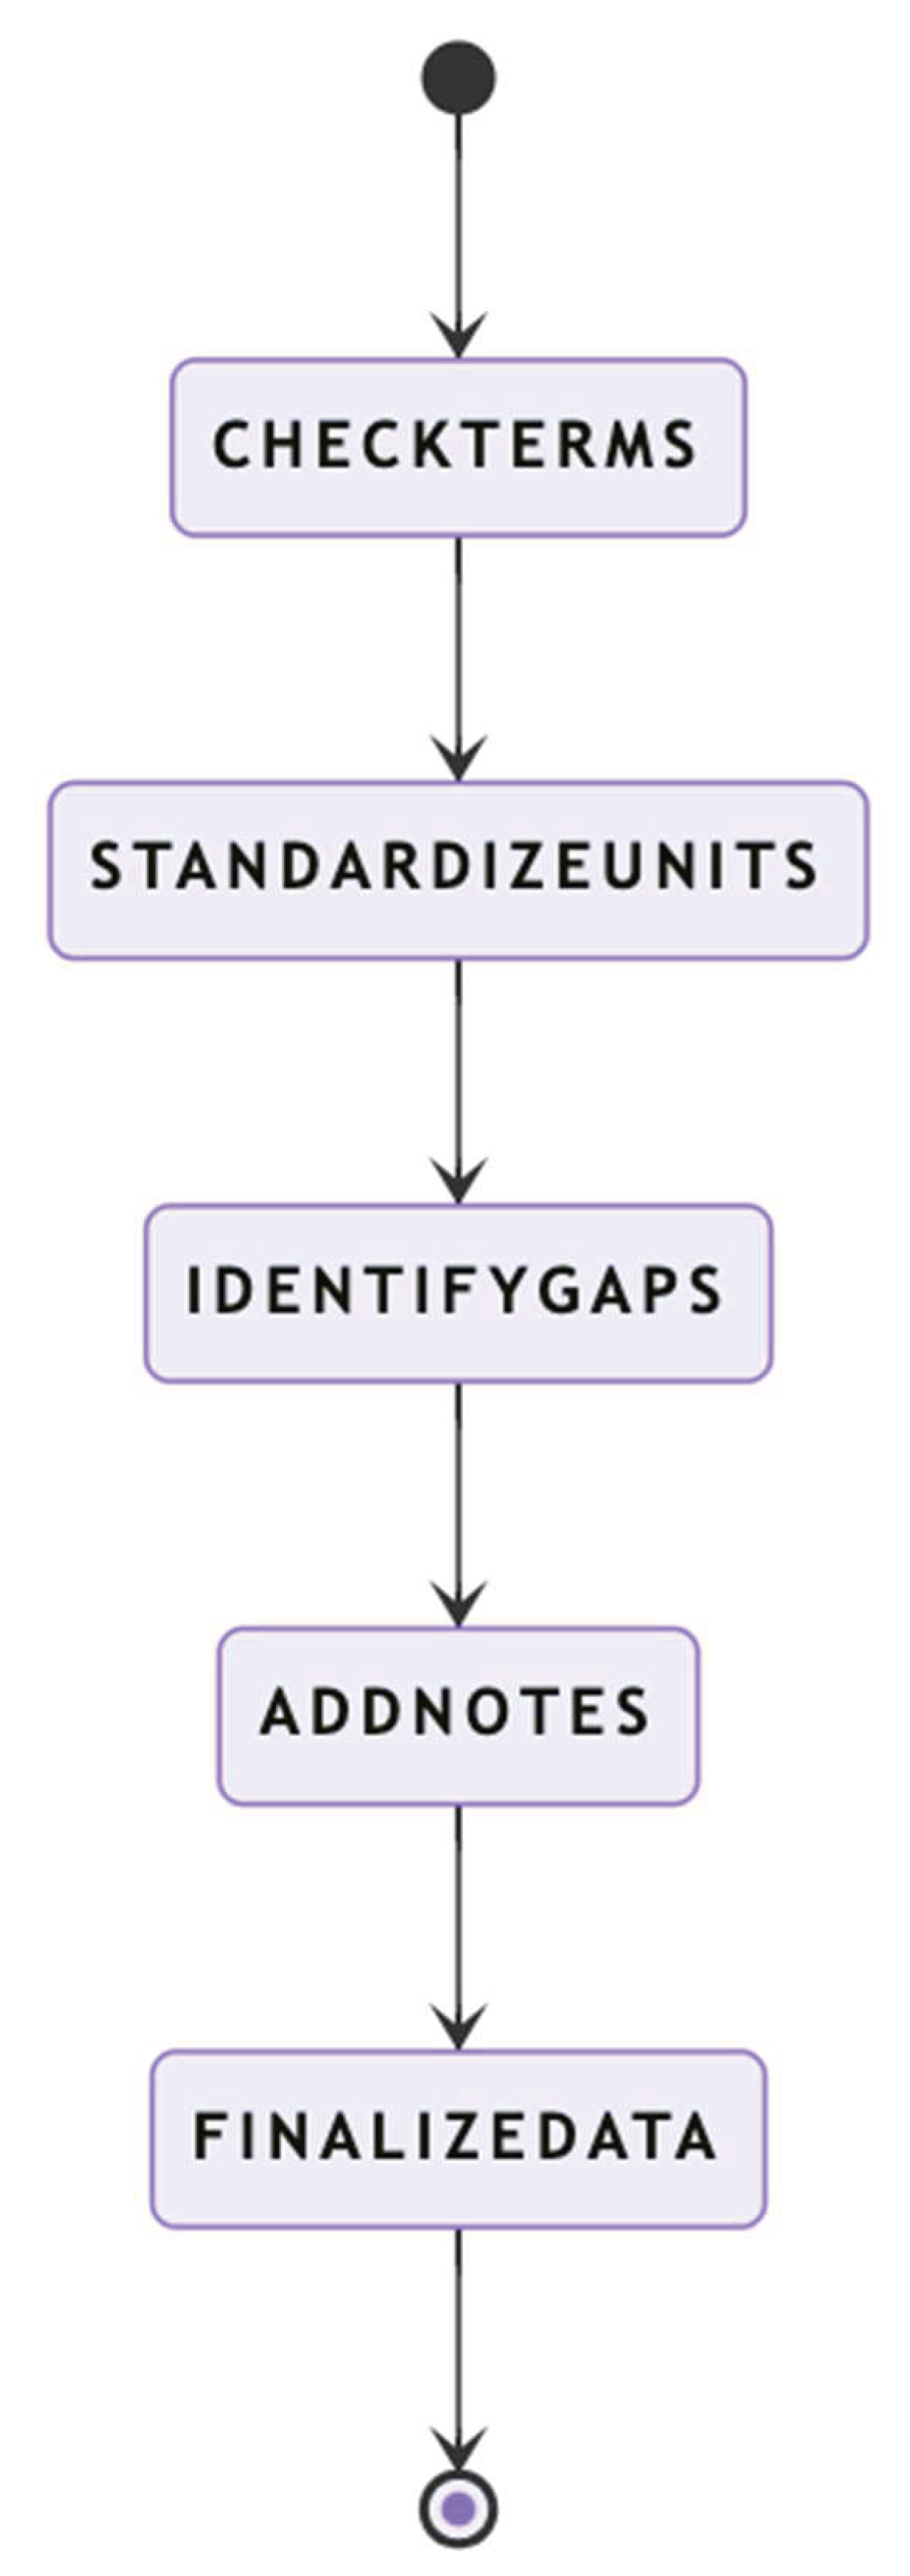
Figure 5.
Process for tabulation and visual display of results.
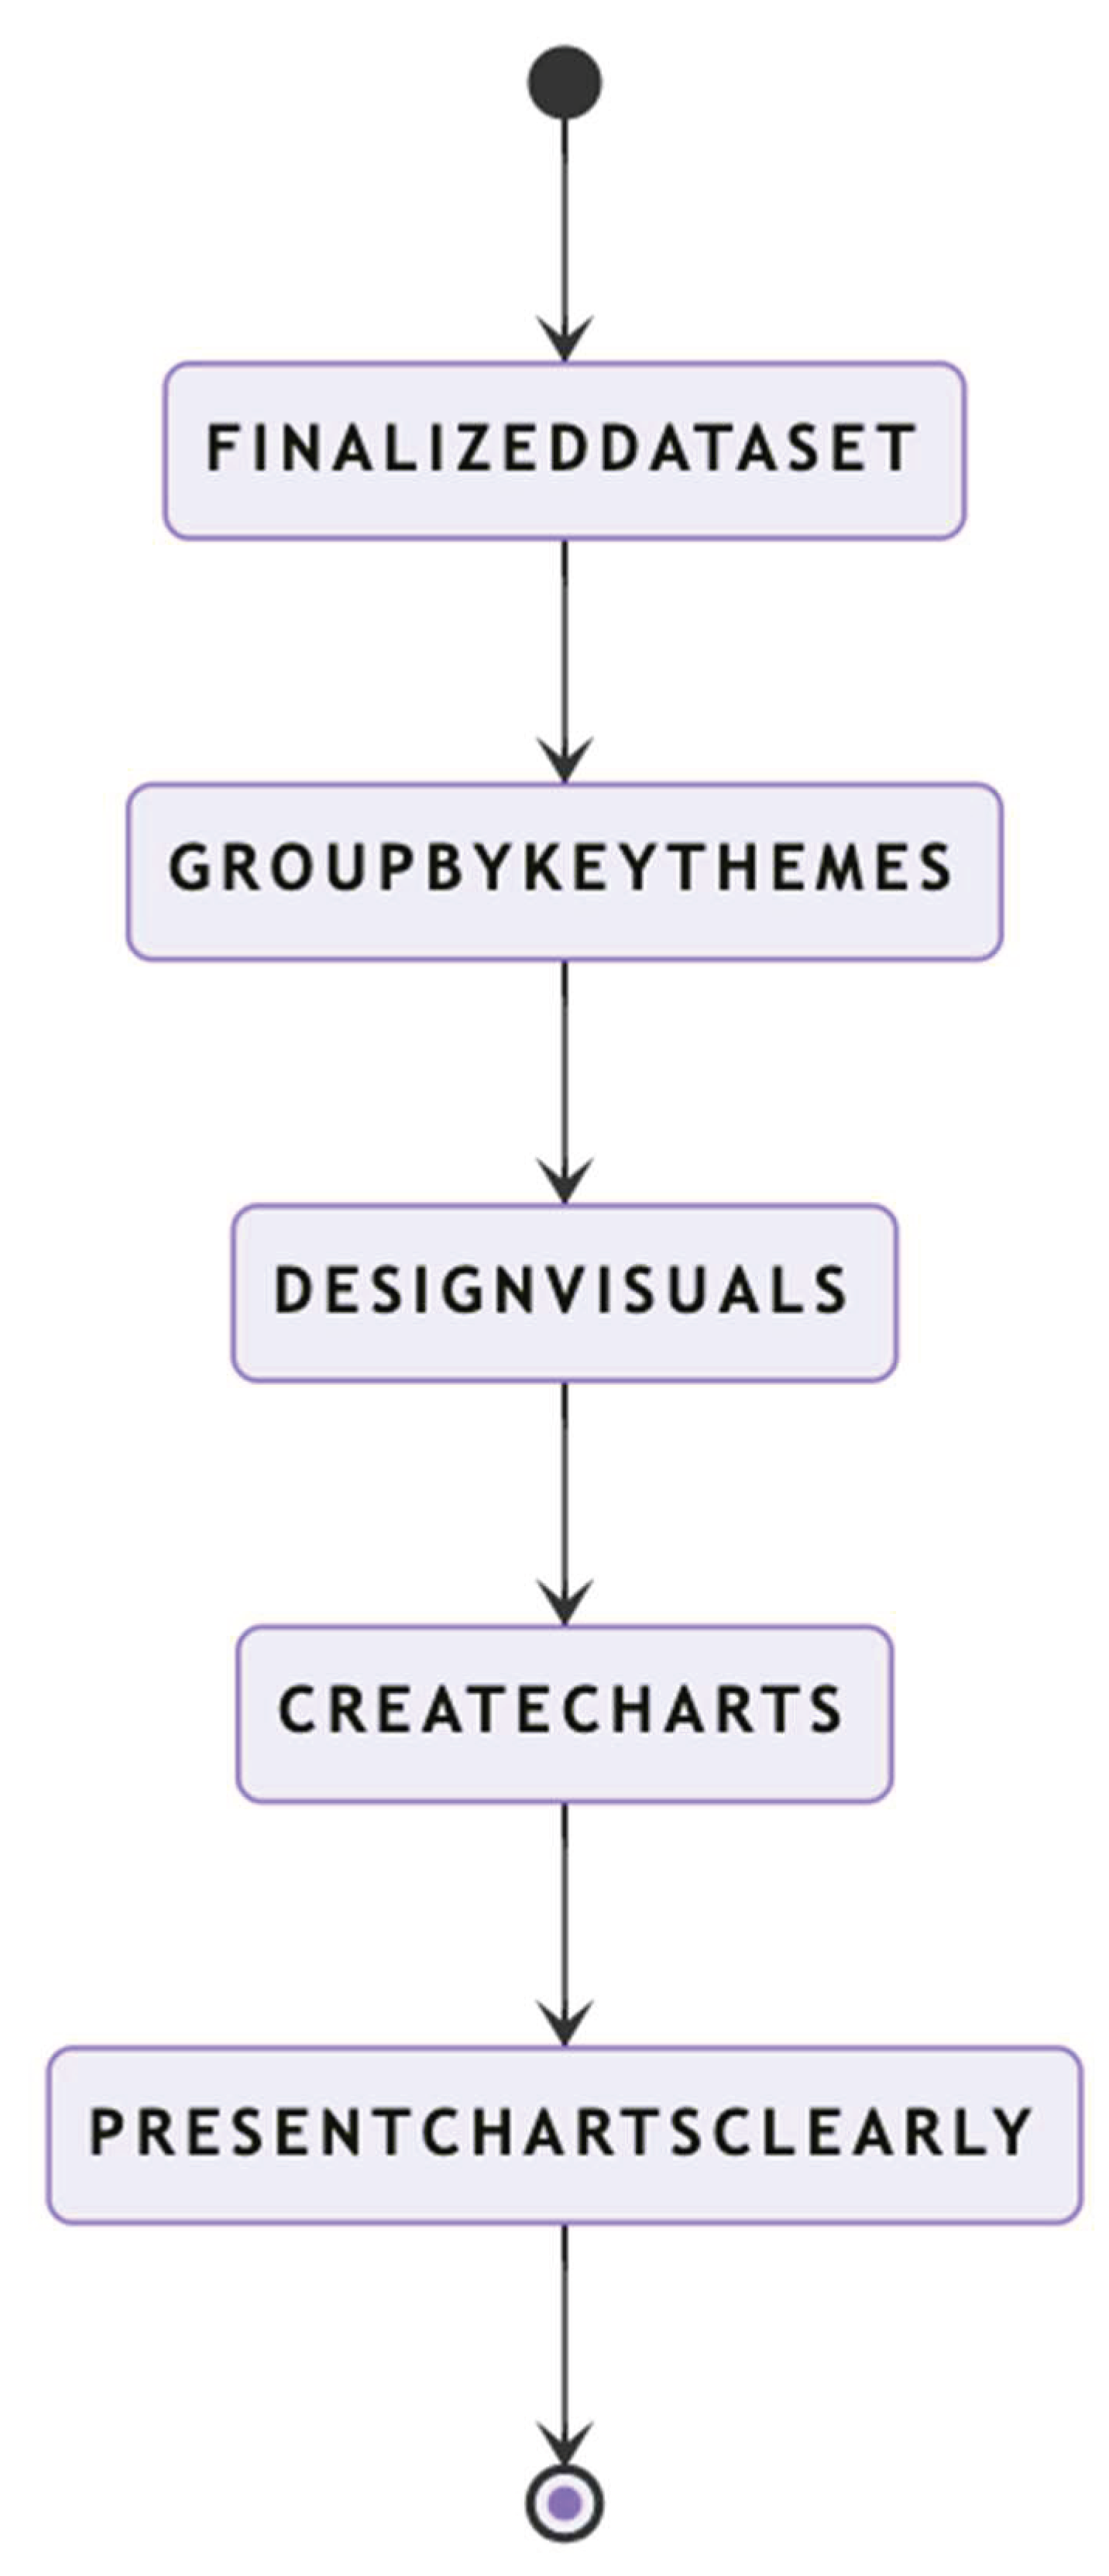
Figure 6.
Flowchart for synthesis results.
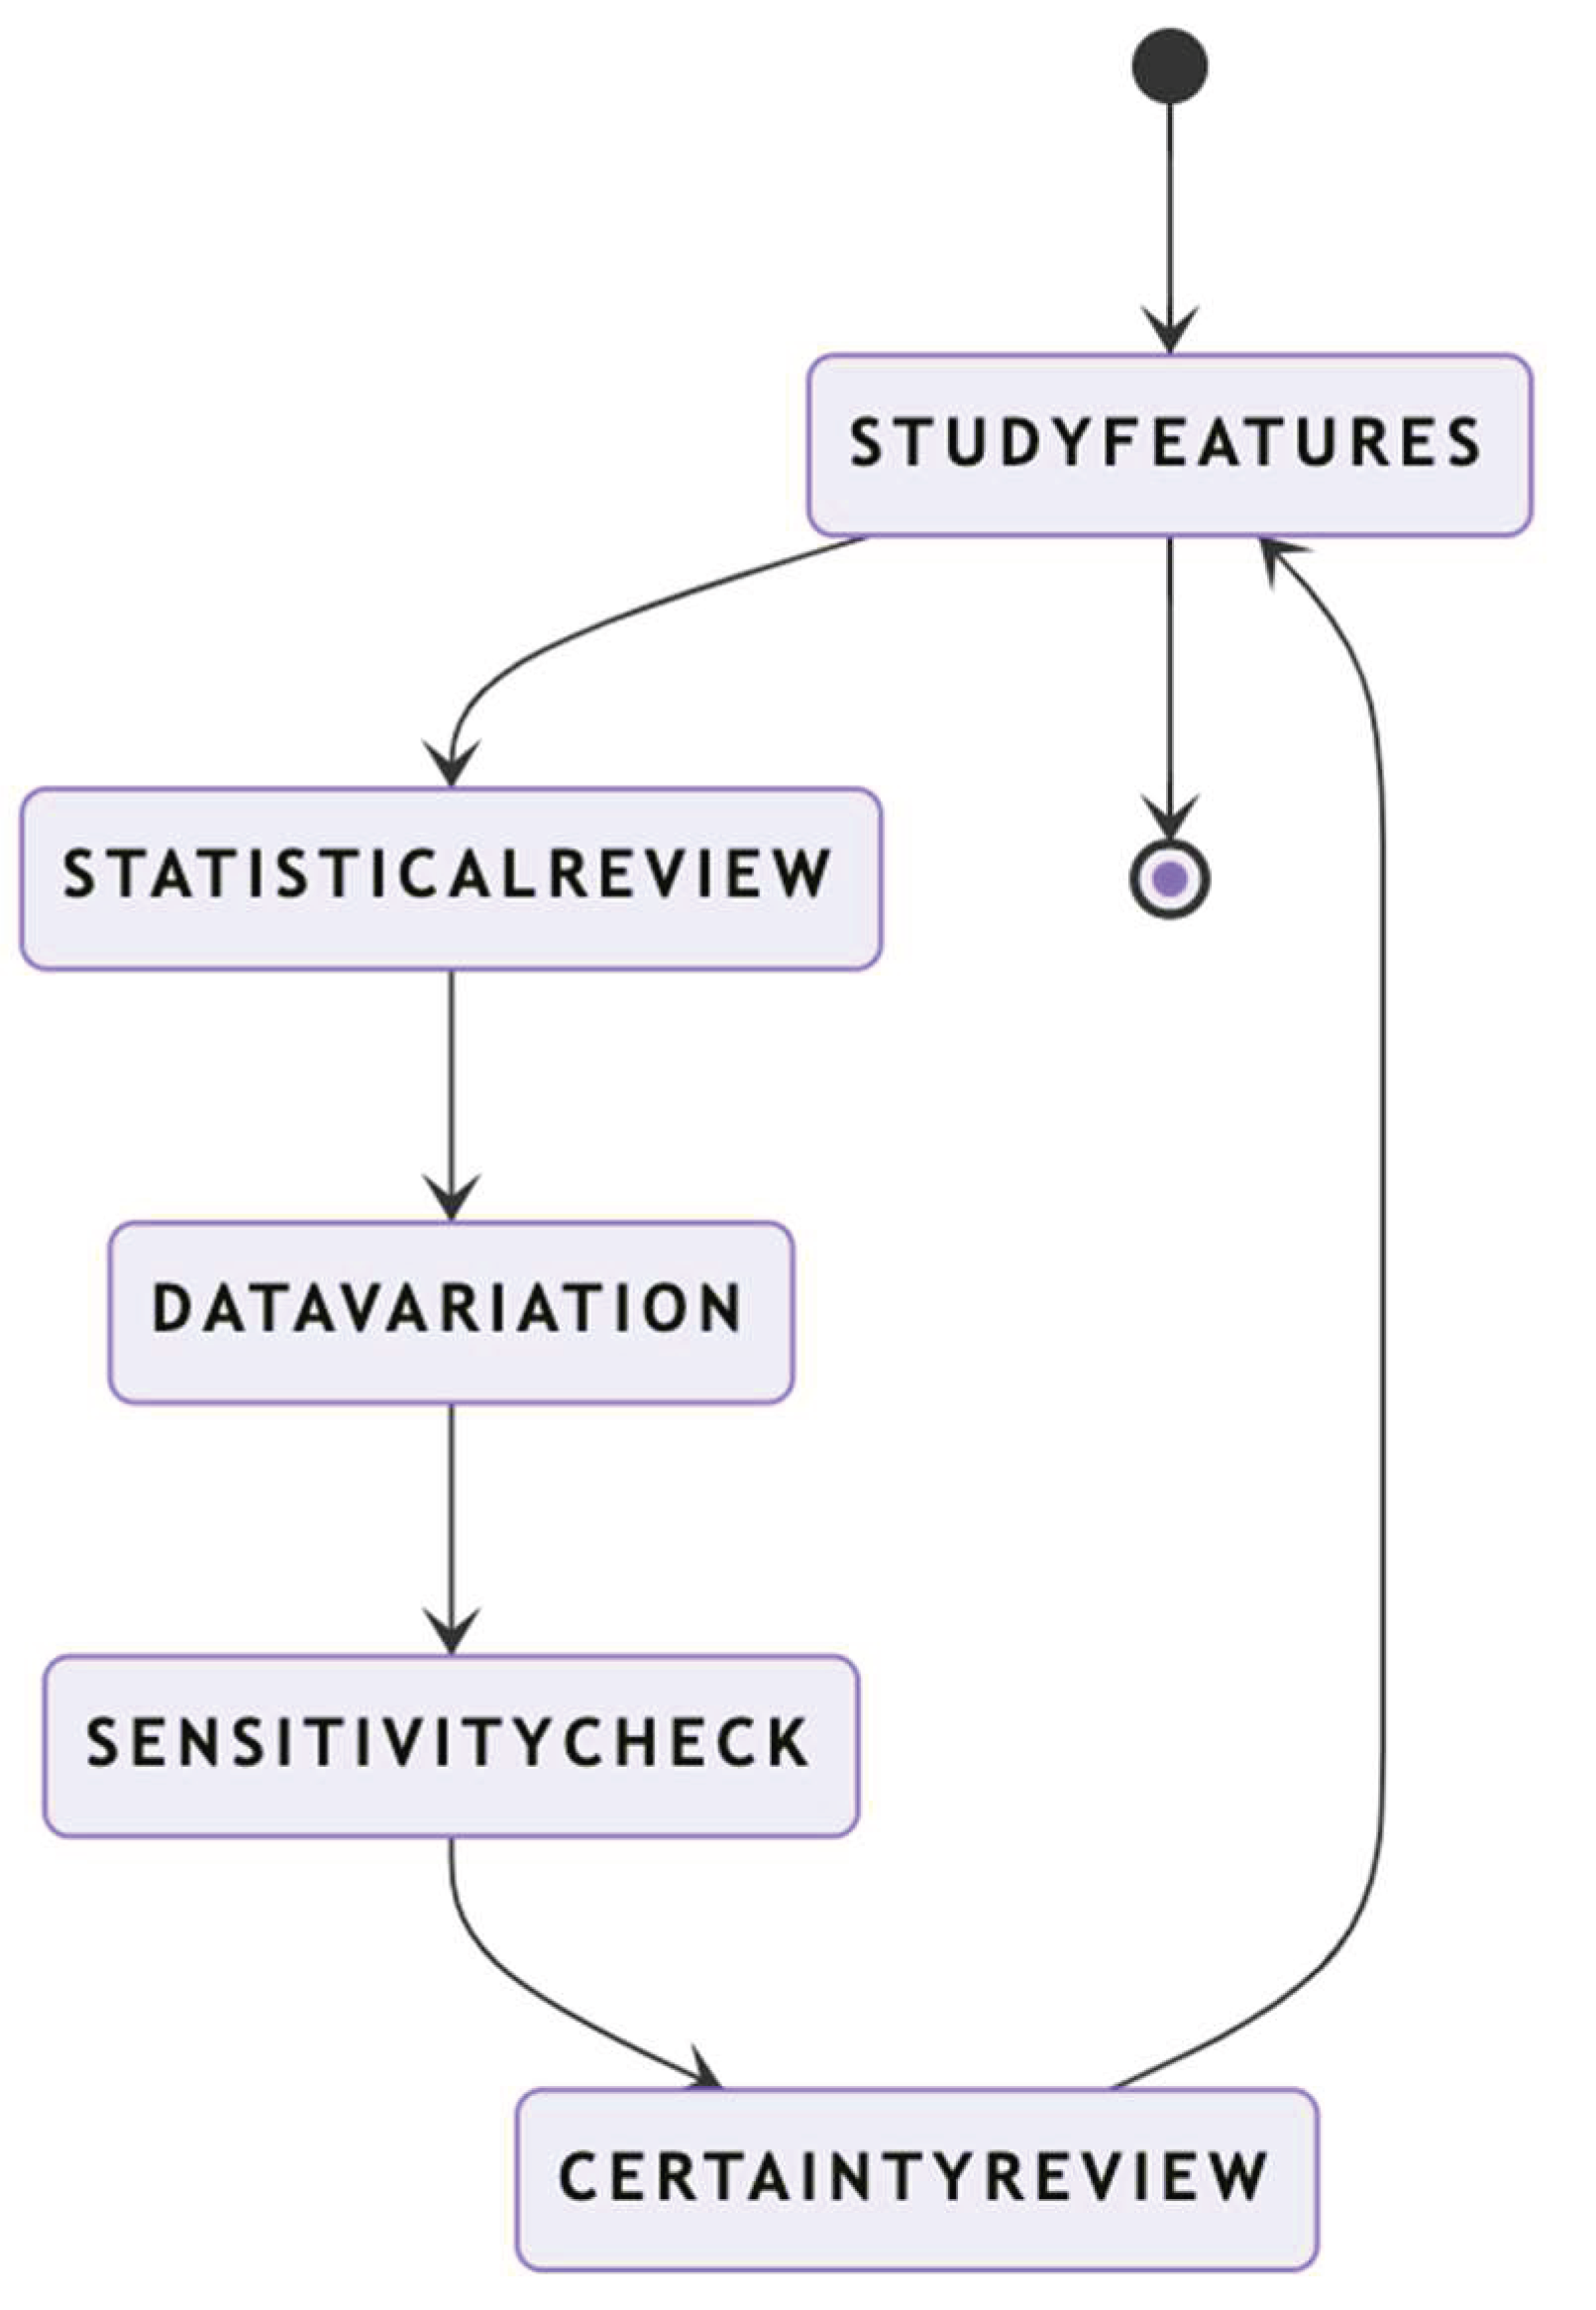
Figure 7.
Process for sensitivity analysis.
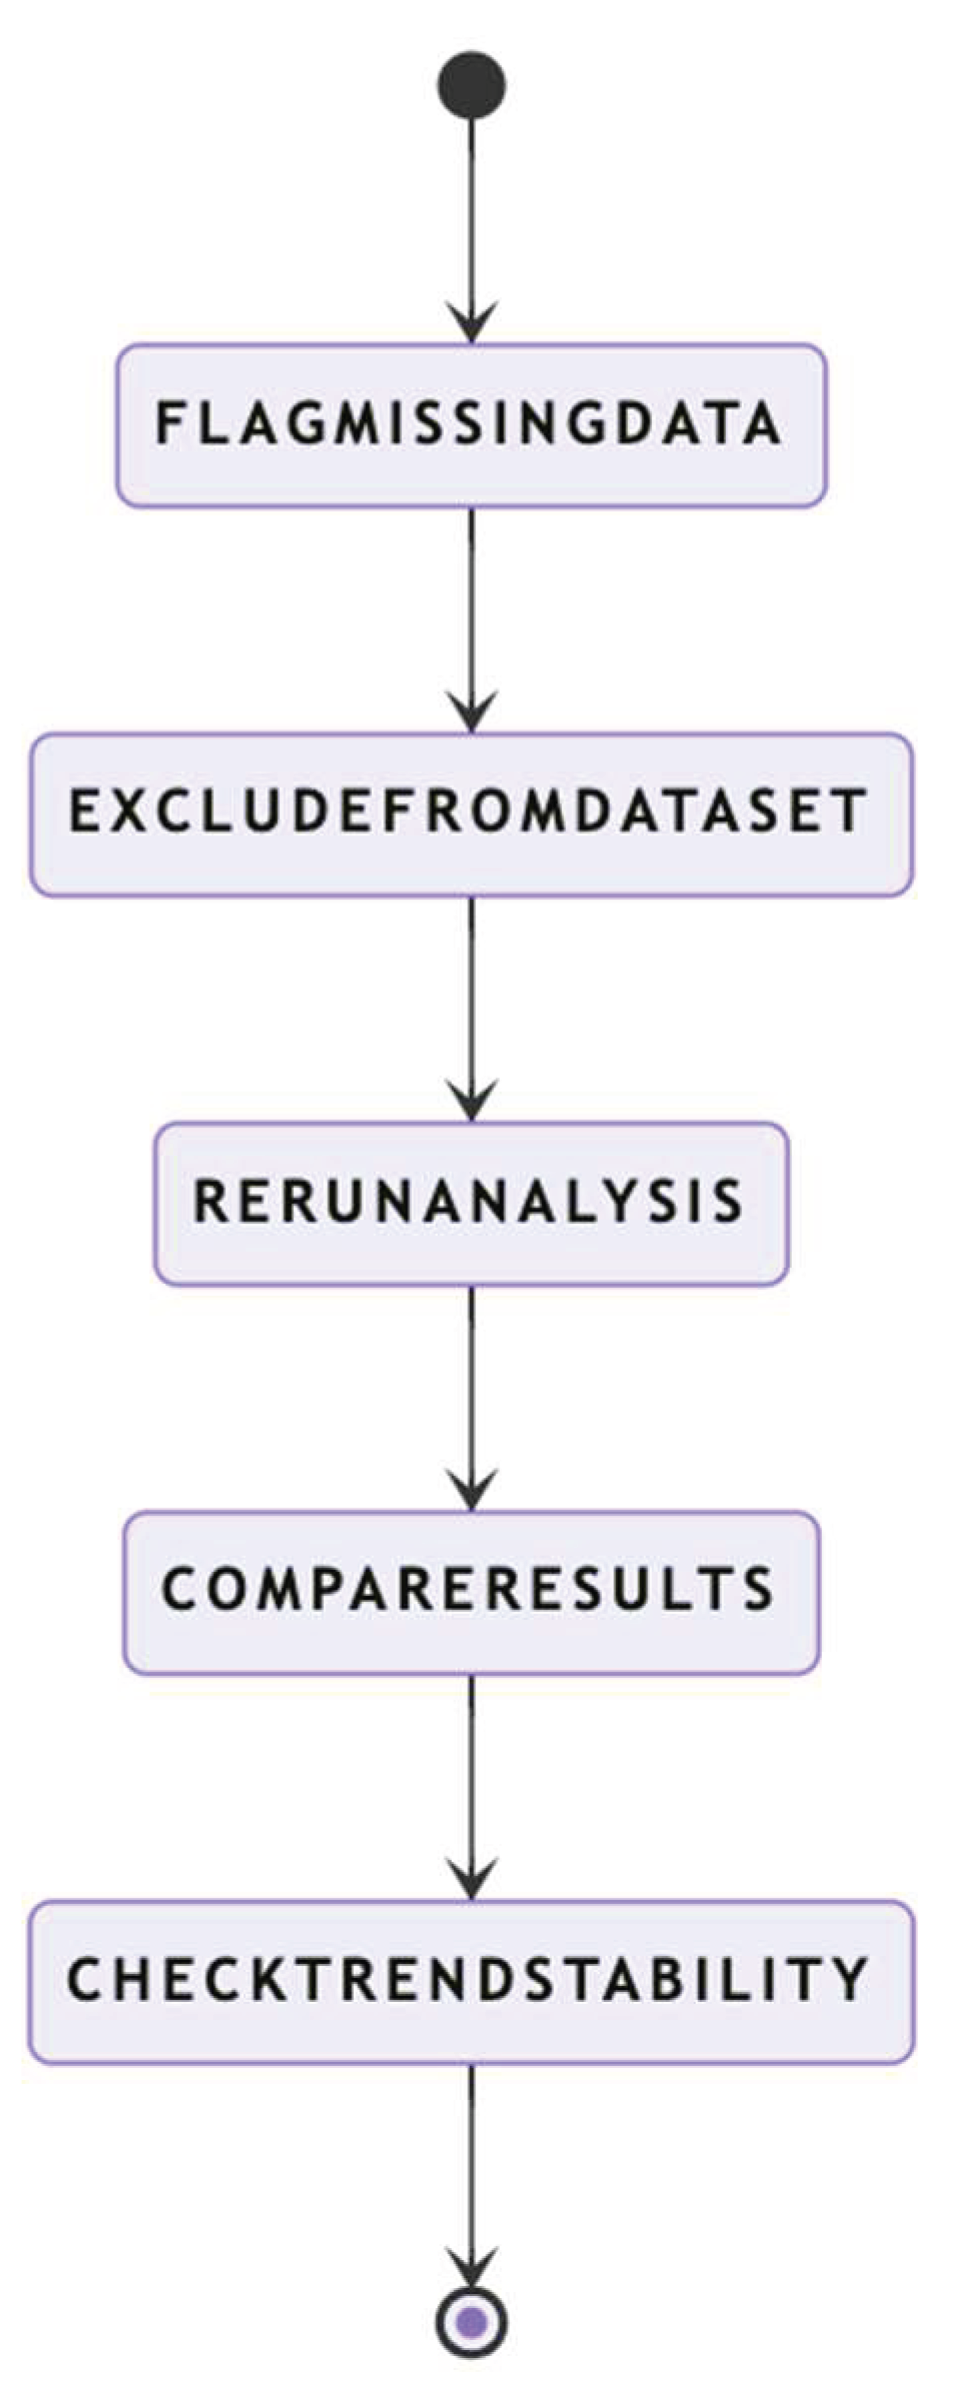
Figure 8.
Proposed PRISMA Flowchart.
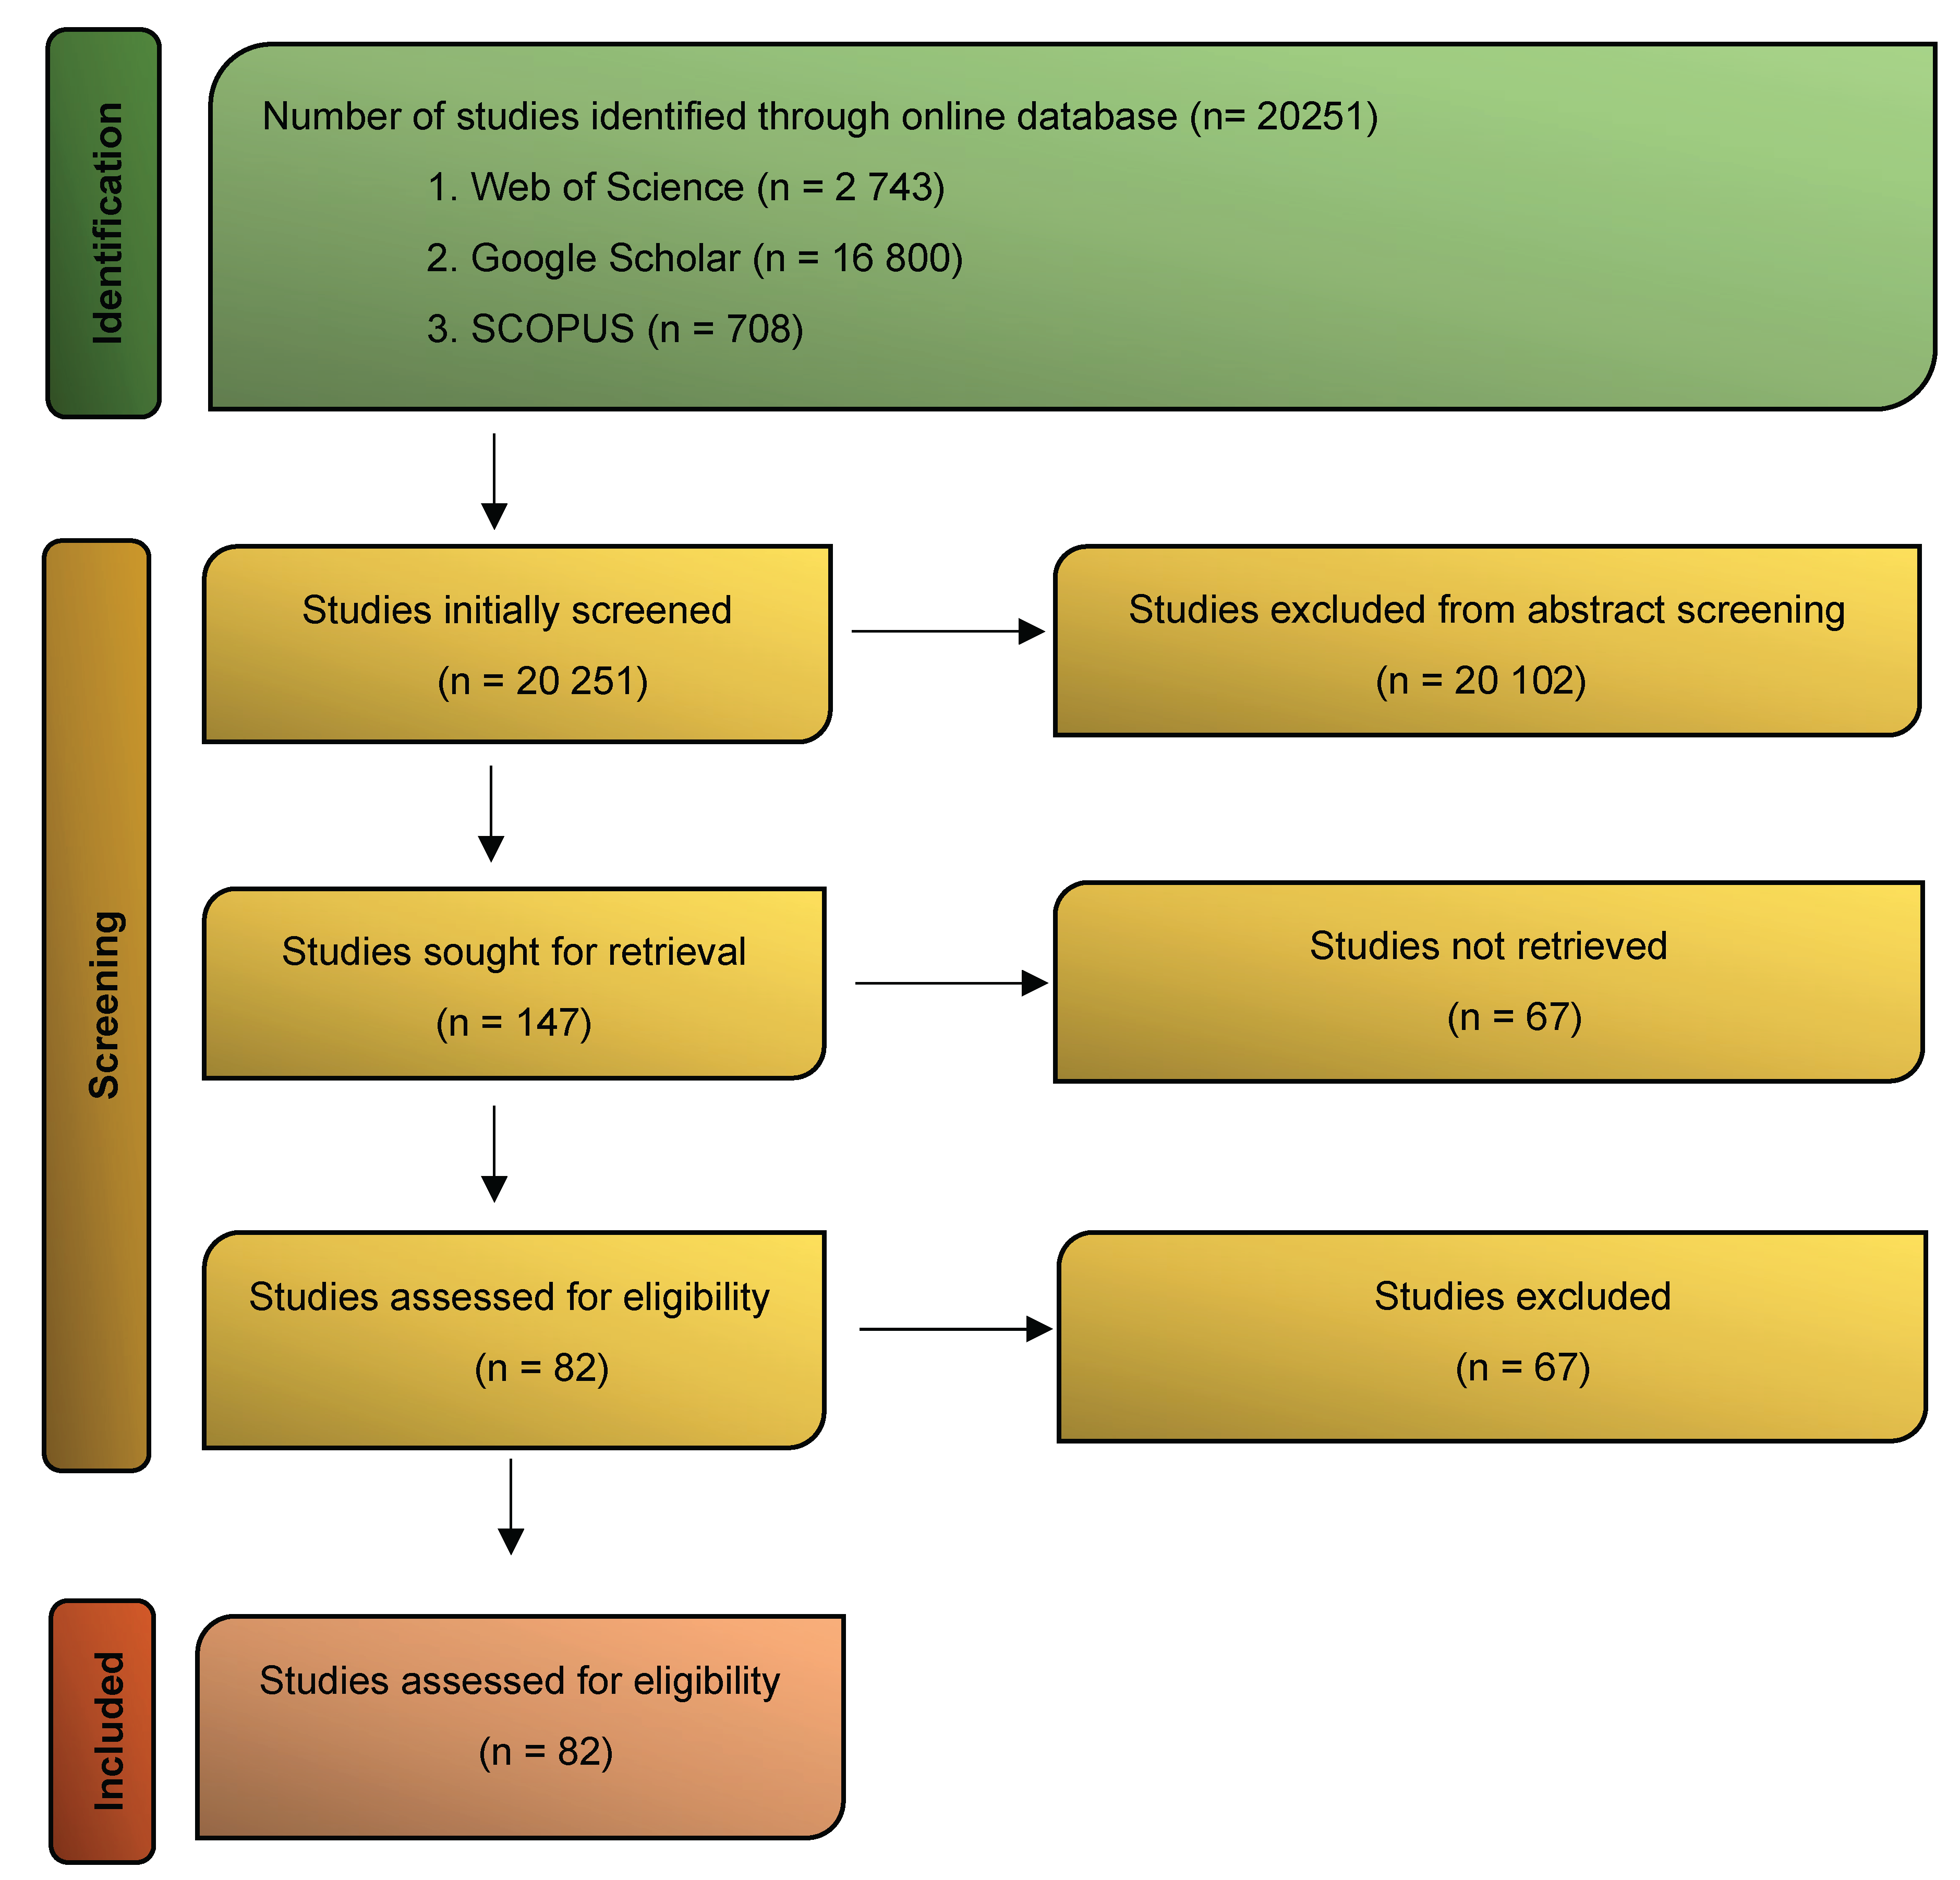
Figure 9.
Distribution of Online Database.
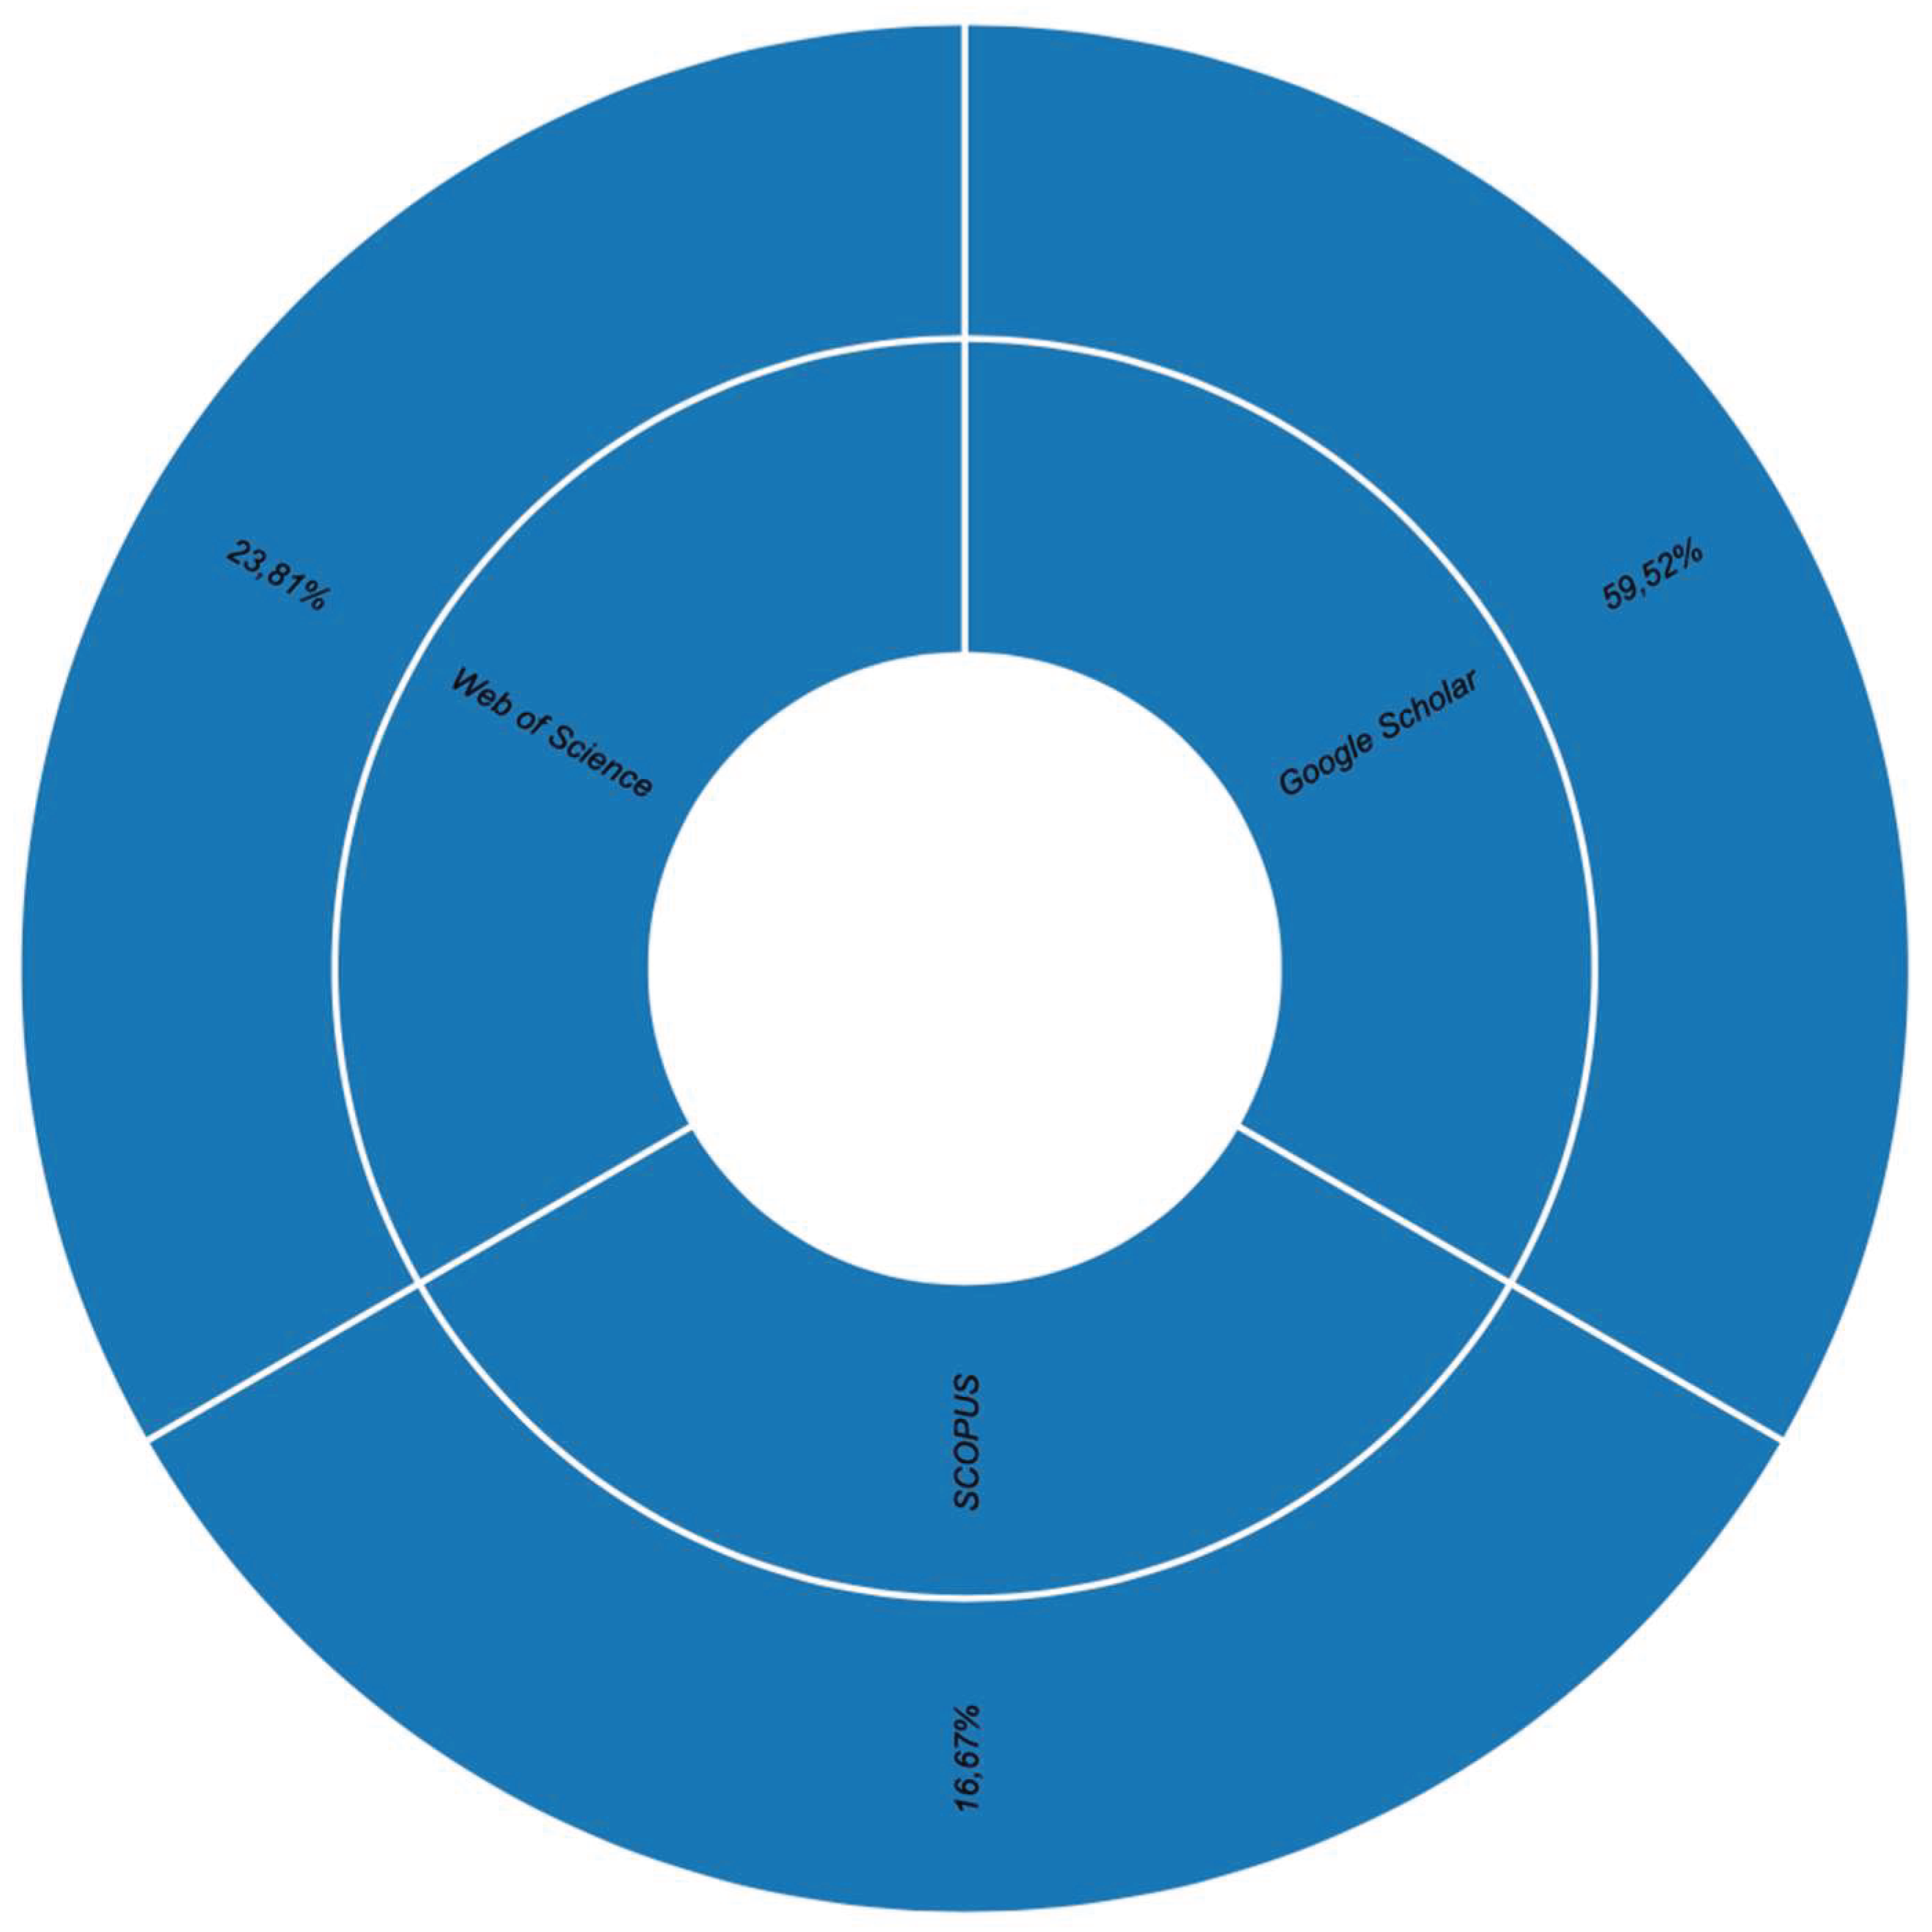
Figure 10.
Annual Research Publications.
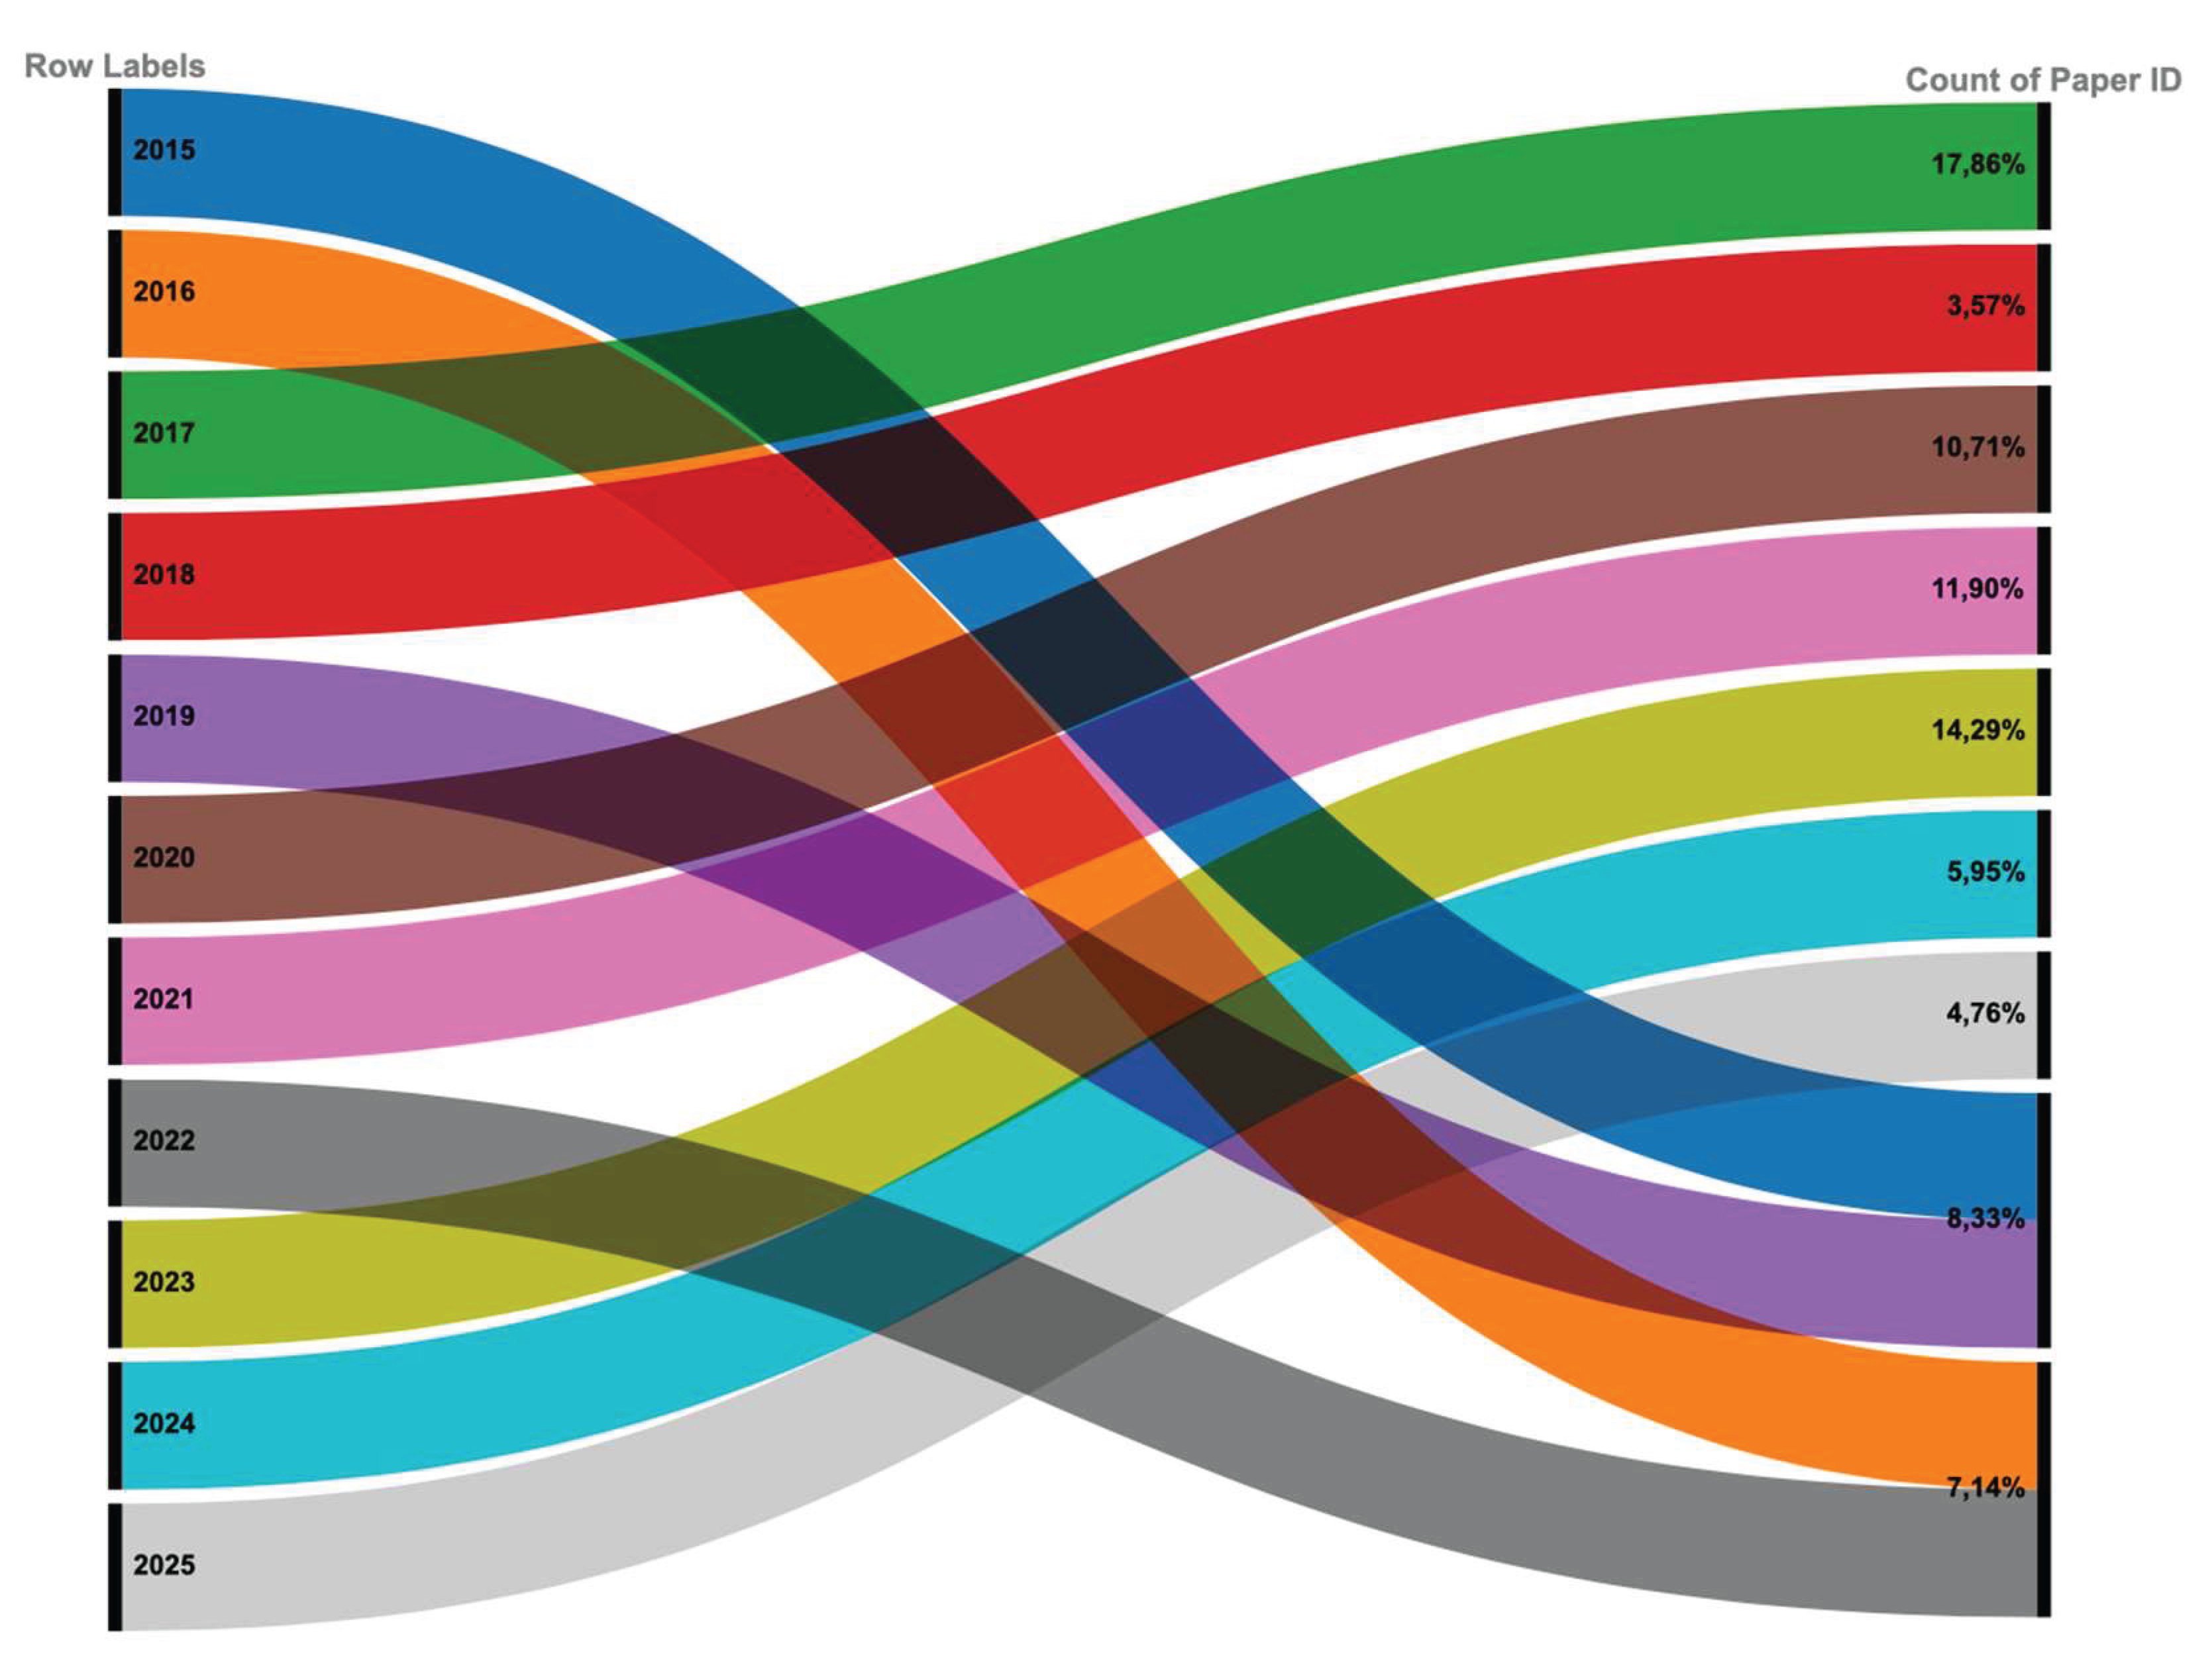
Figure 11.
Identification of the Type of Research.
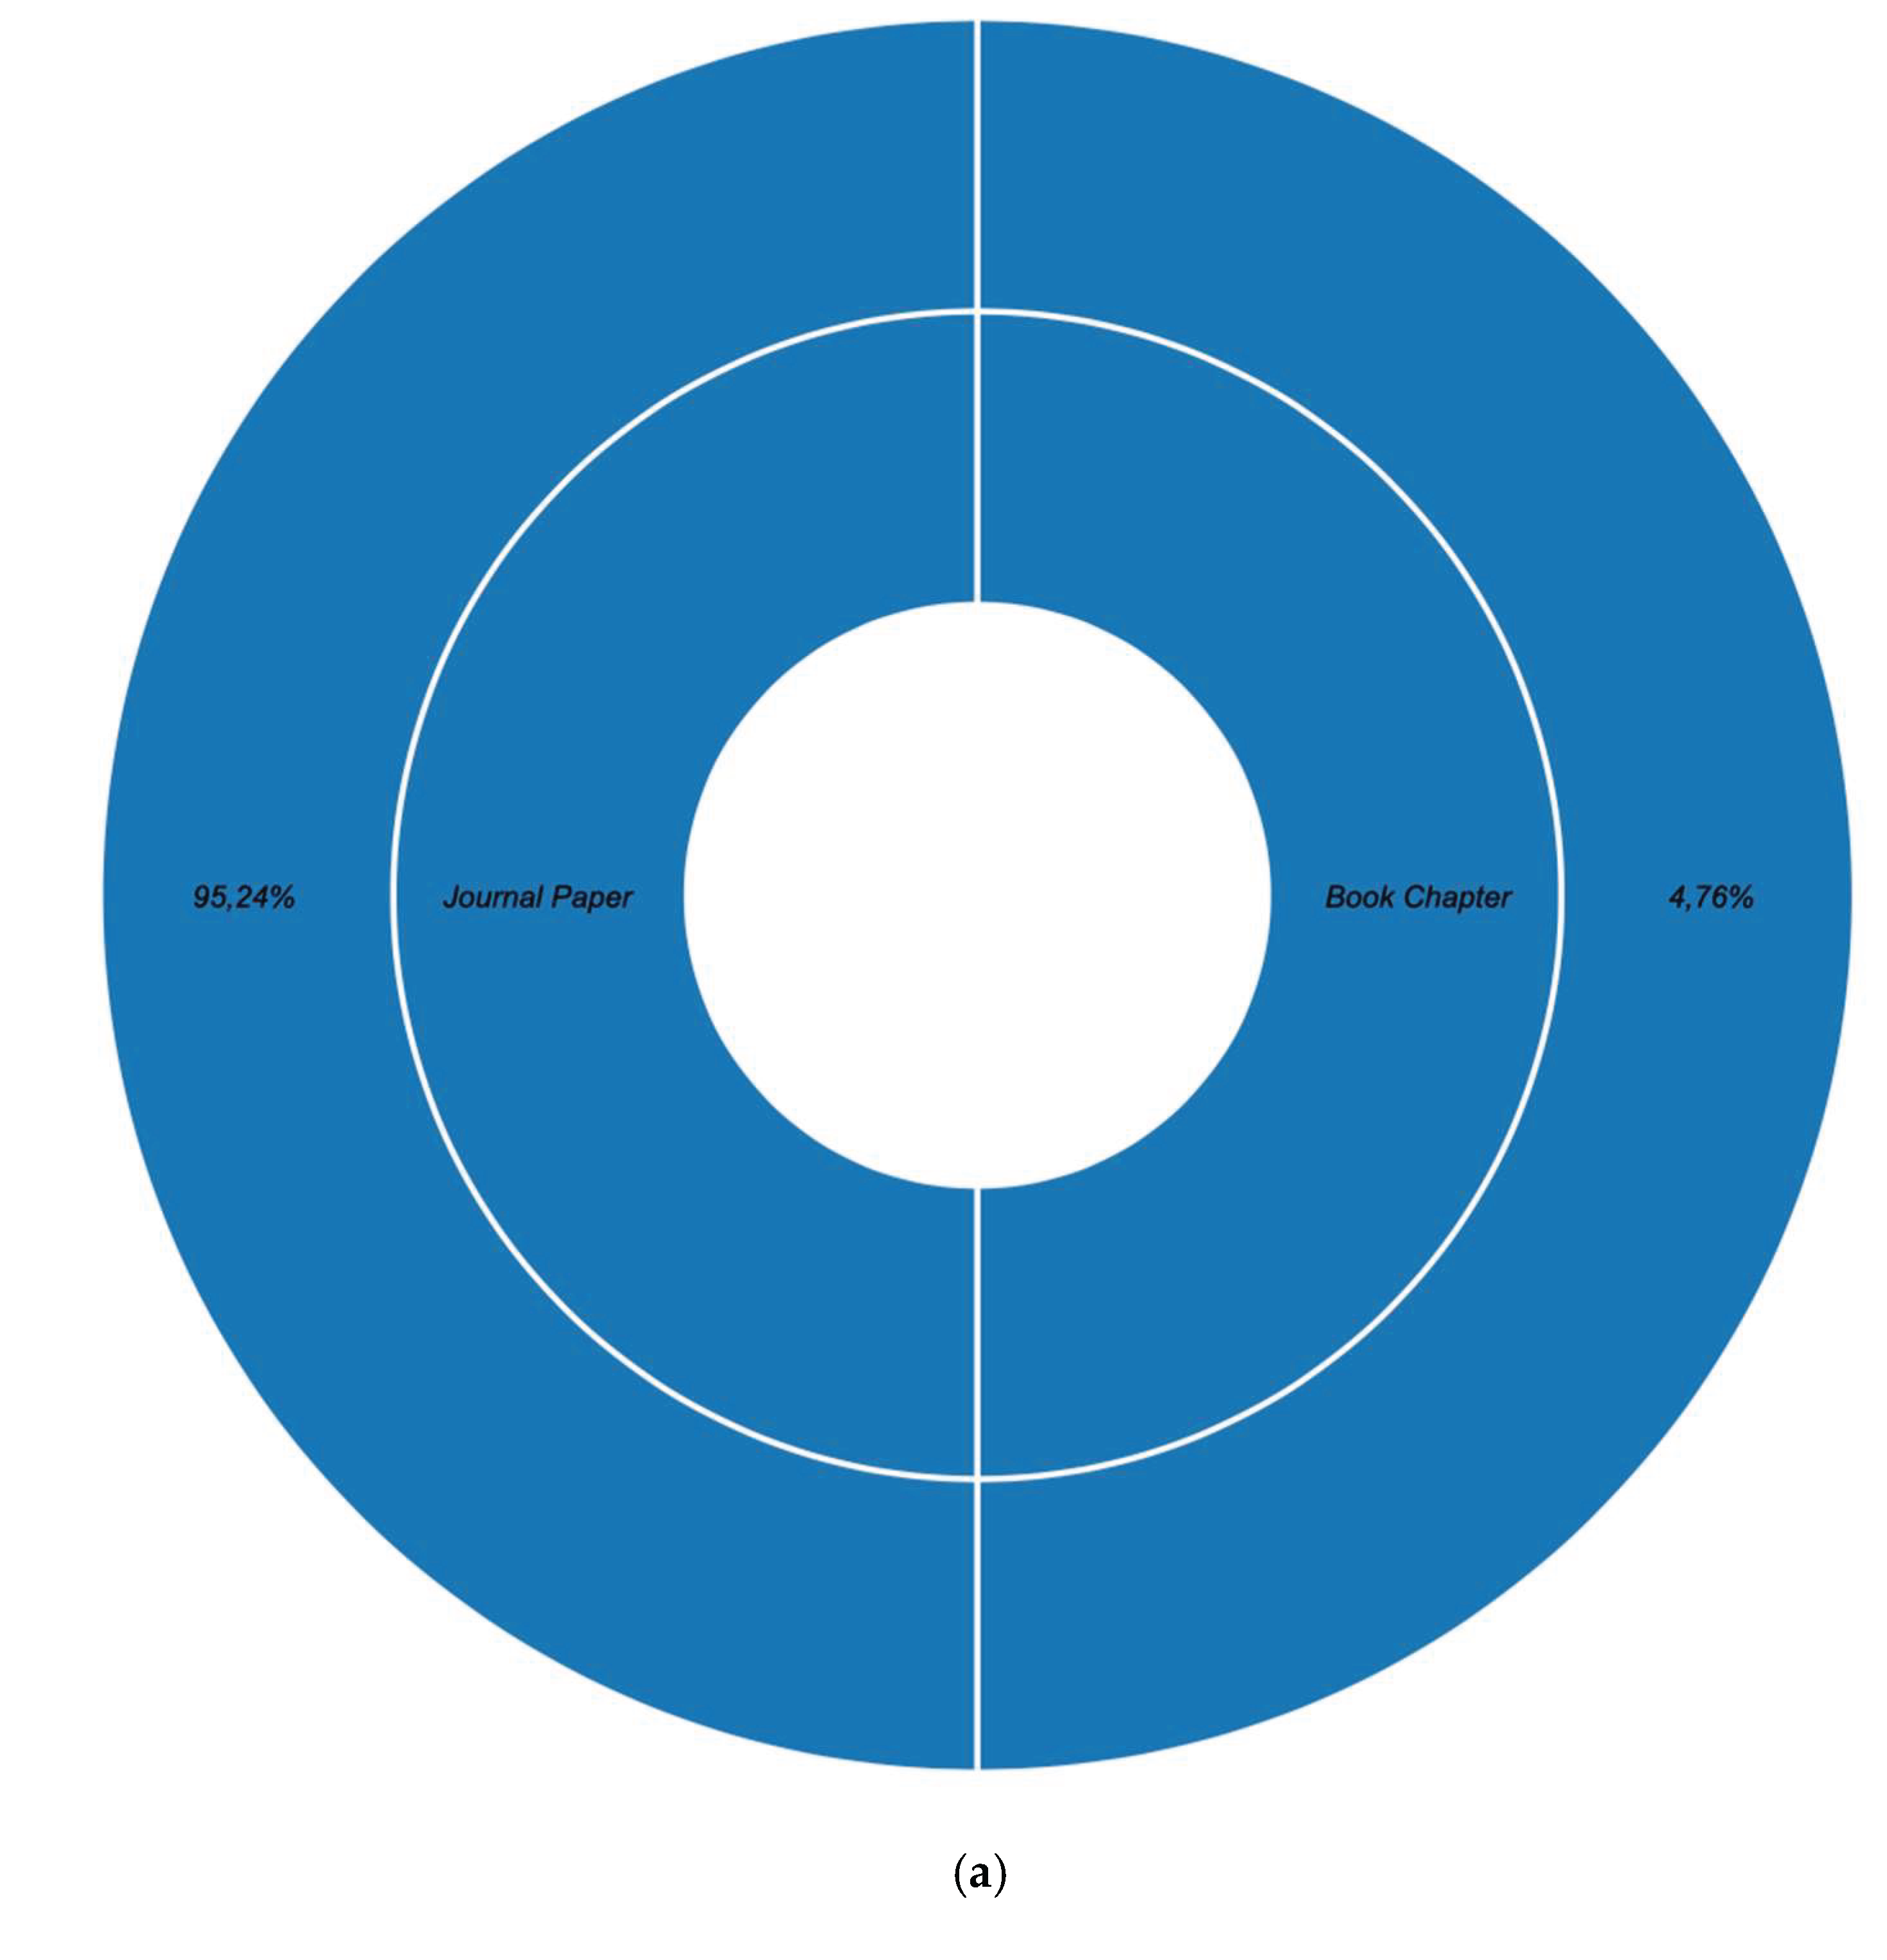
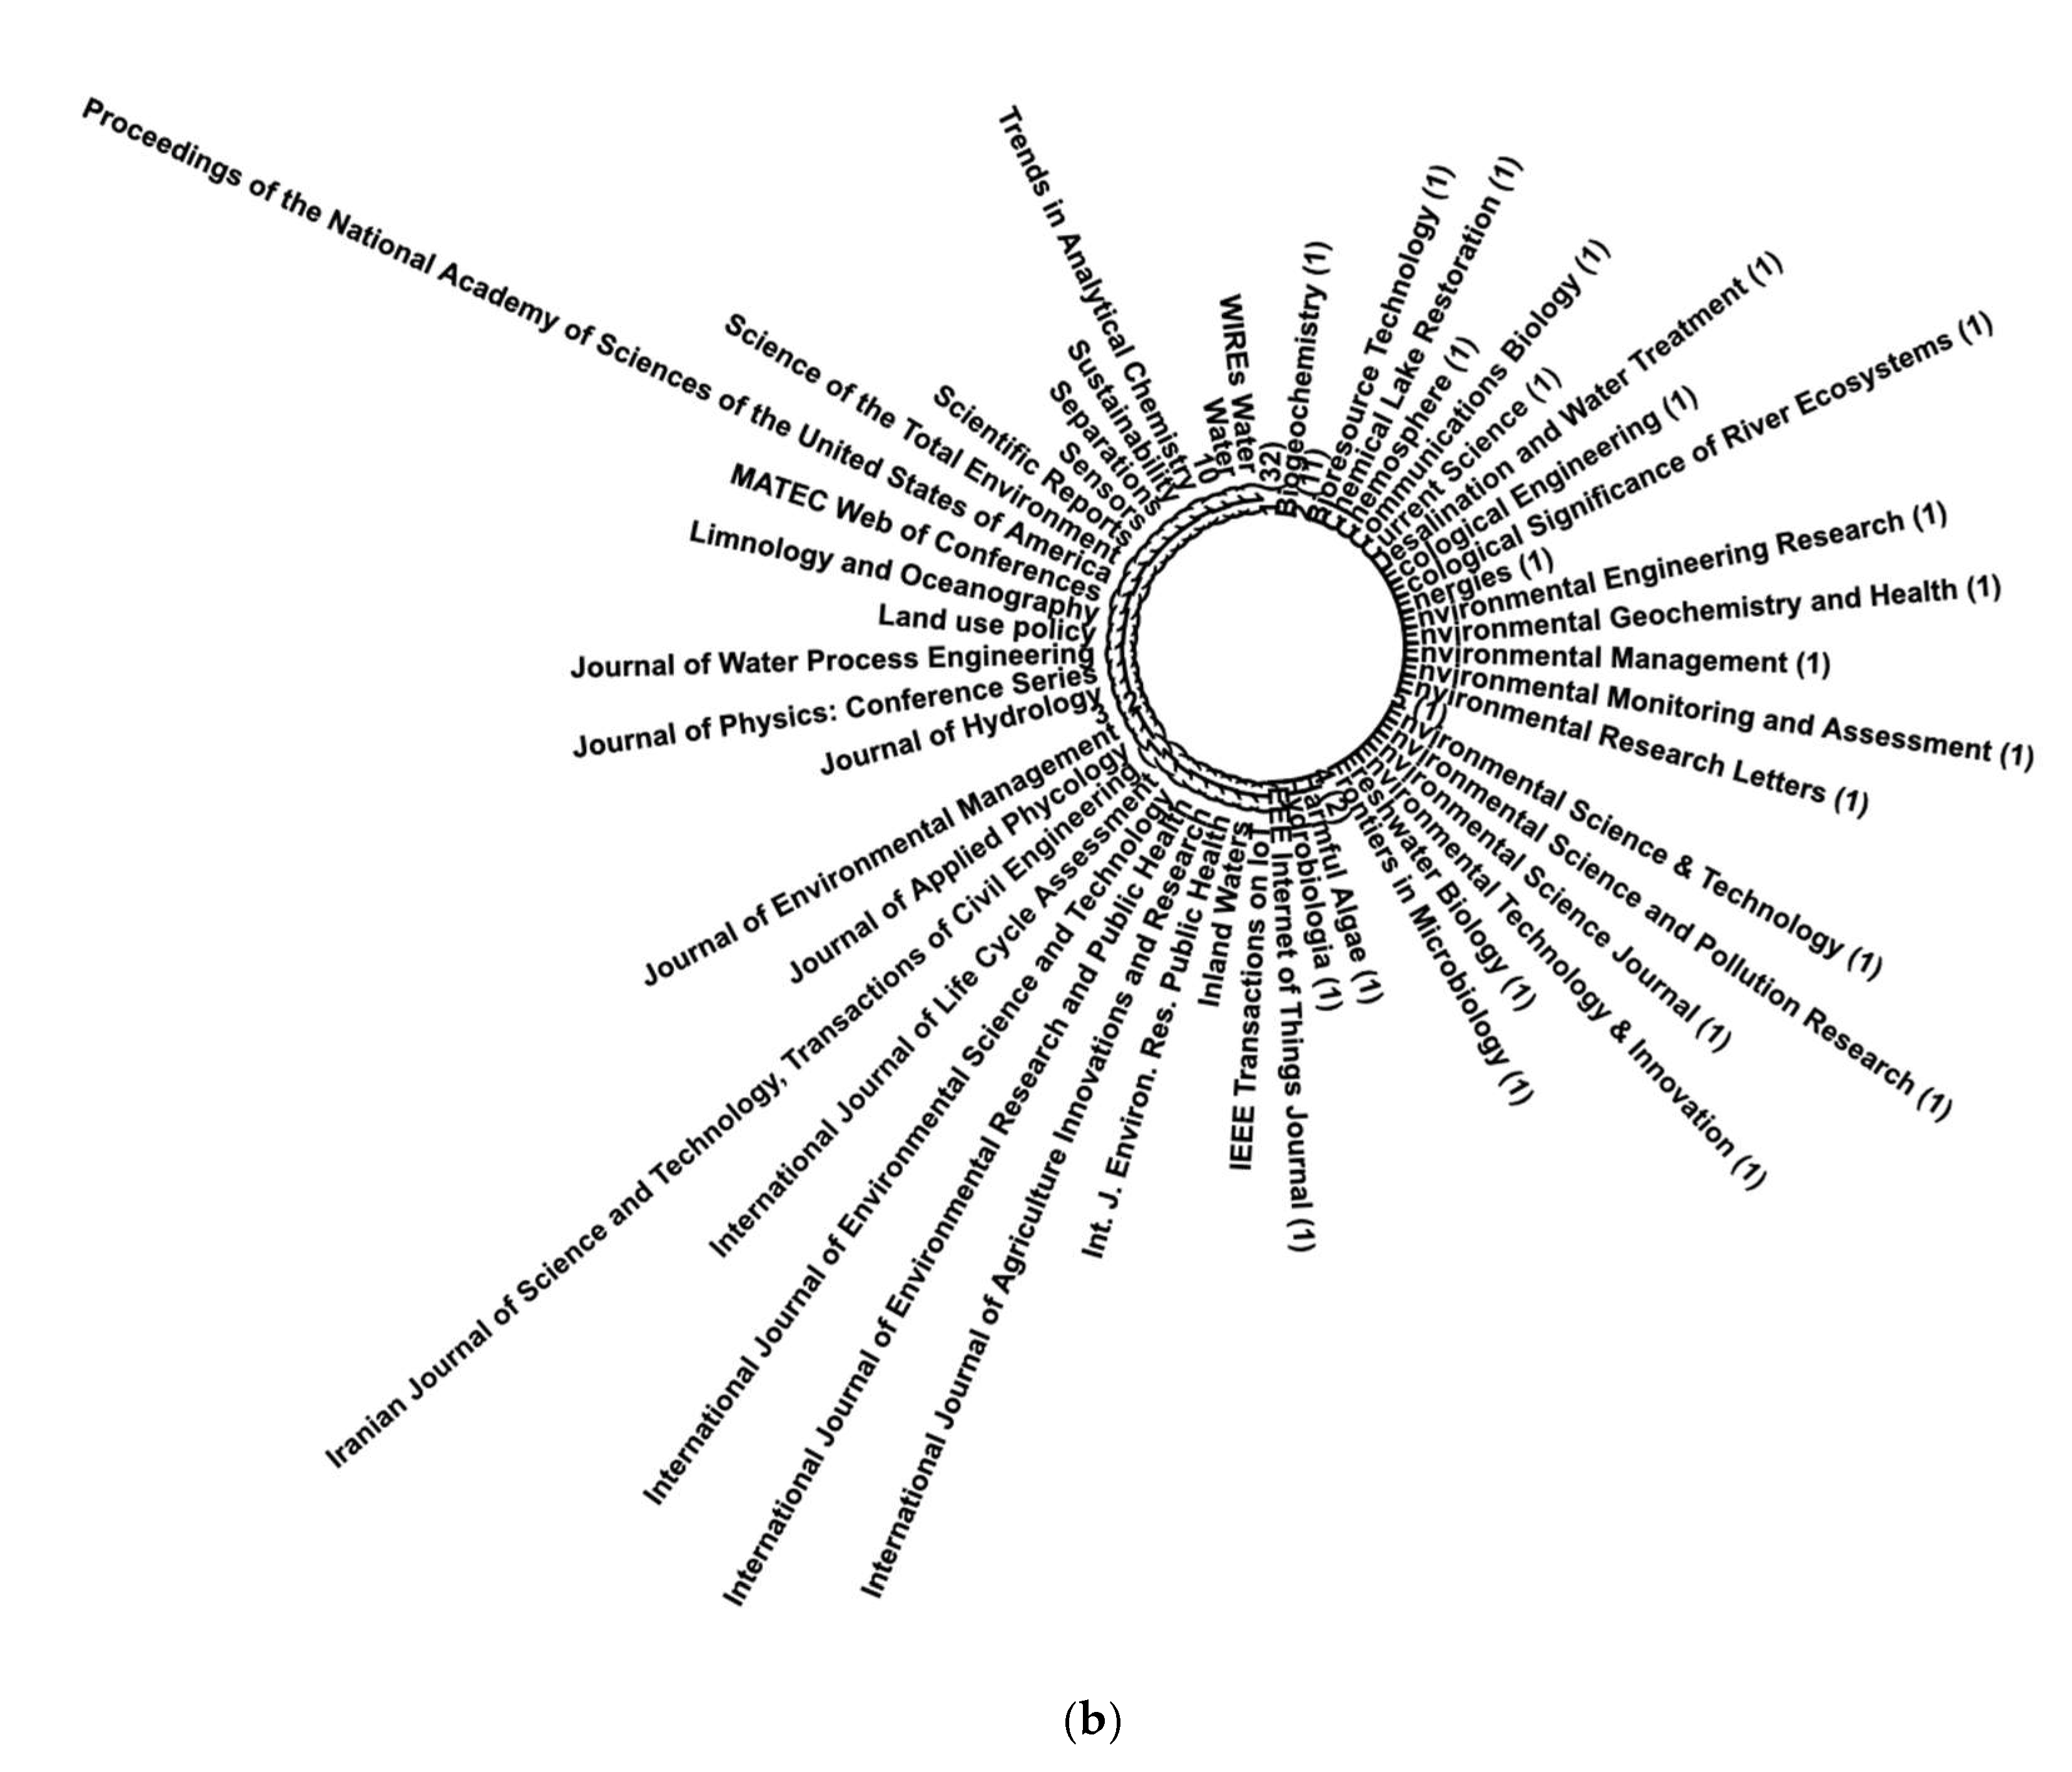
Figure 12.
Distribution of Research Papers Worldwide.
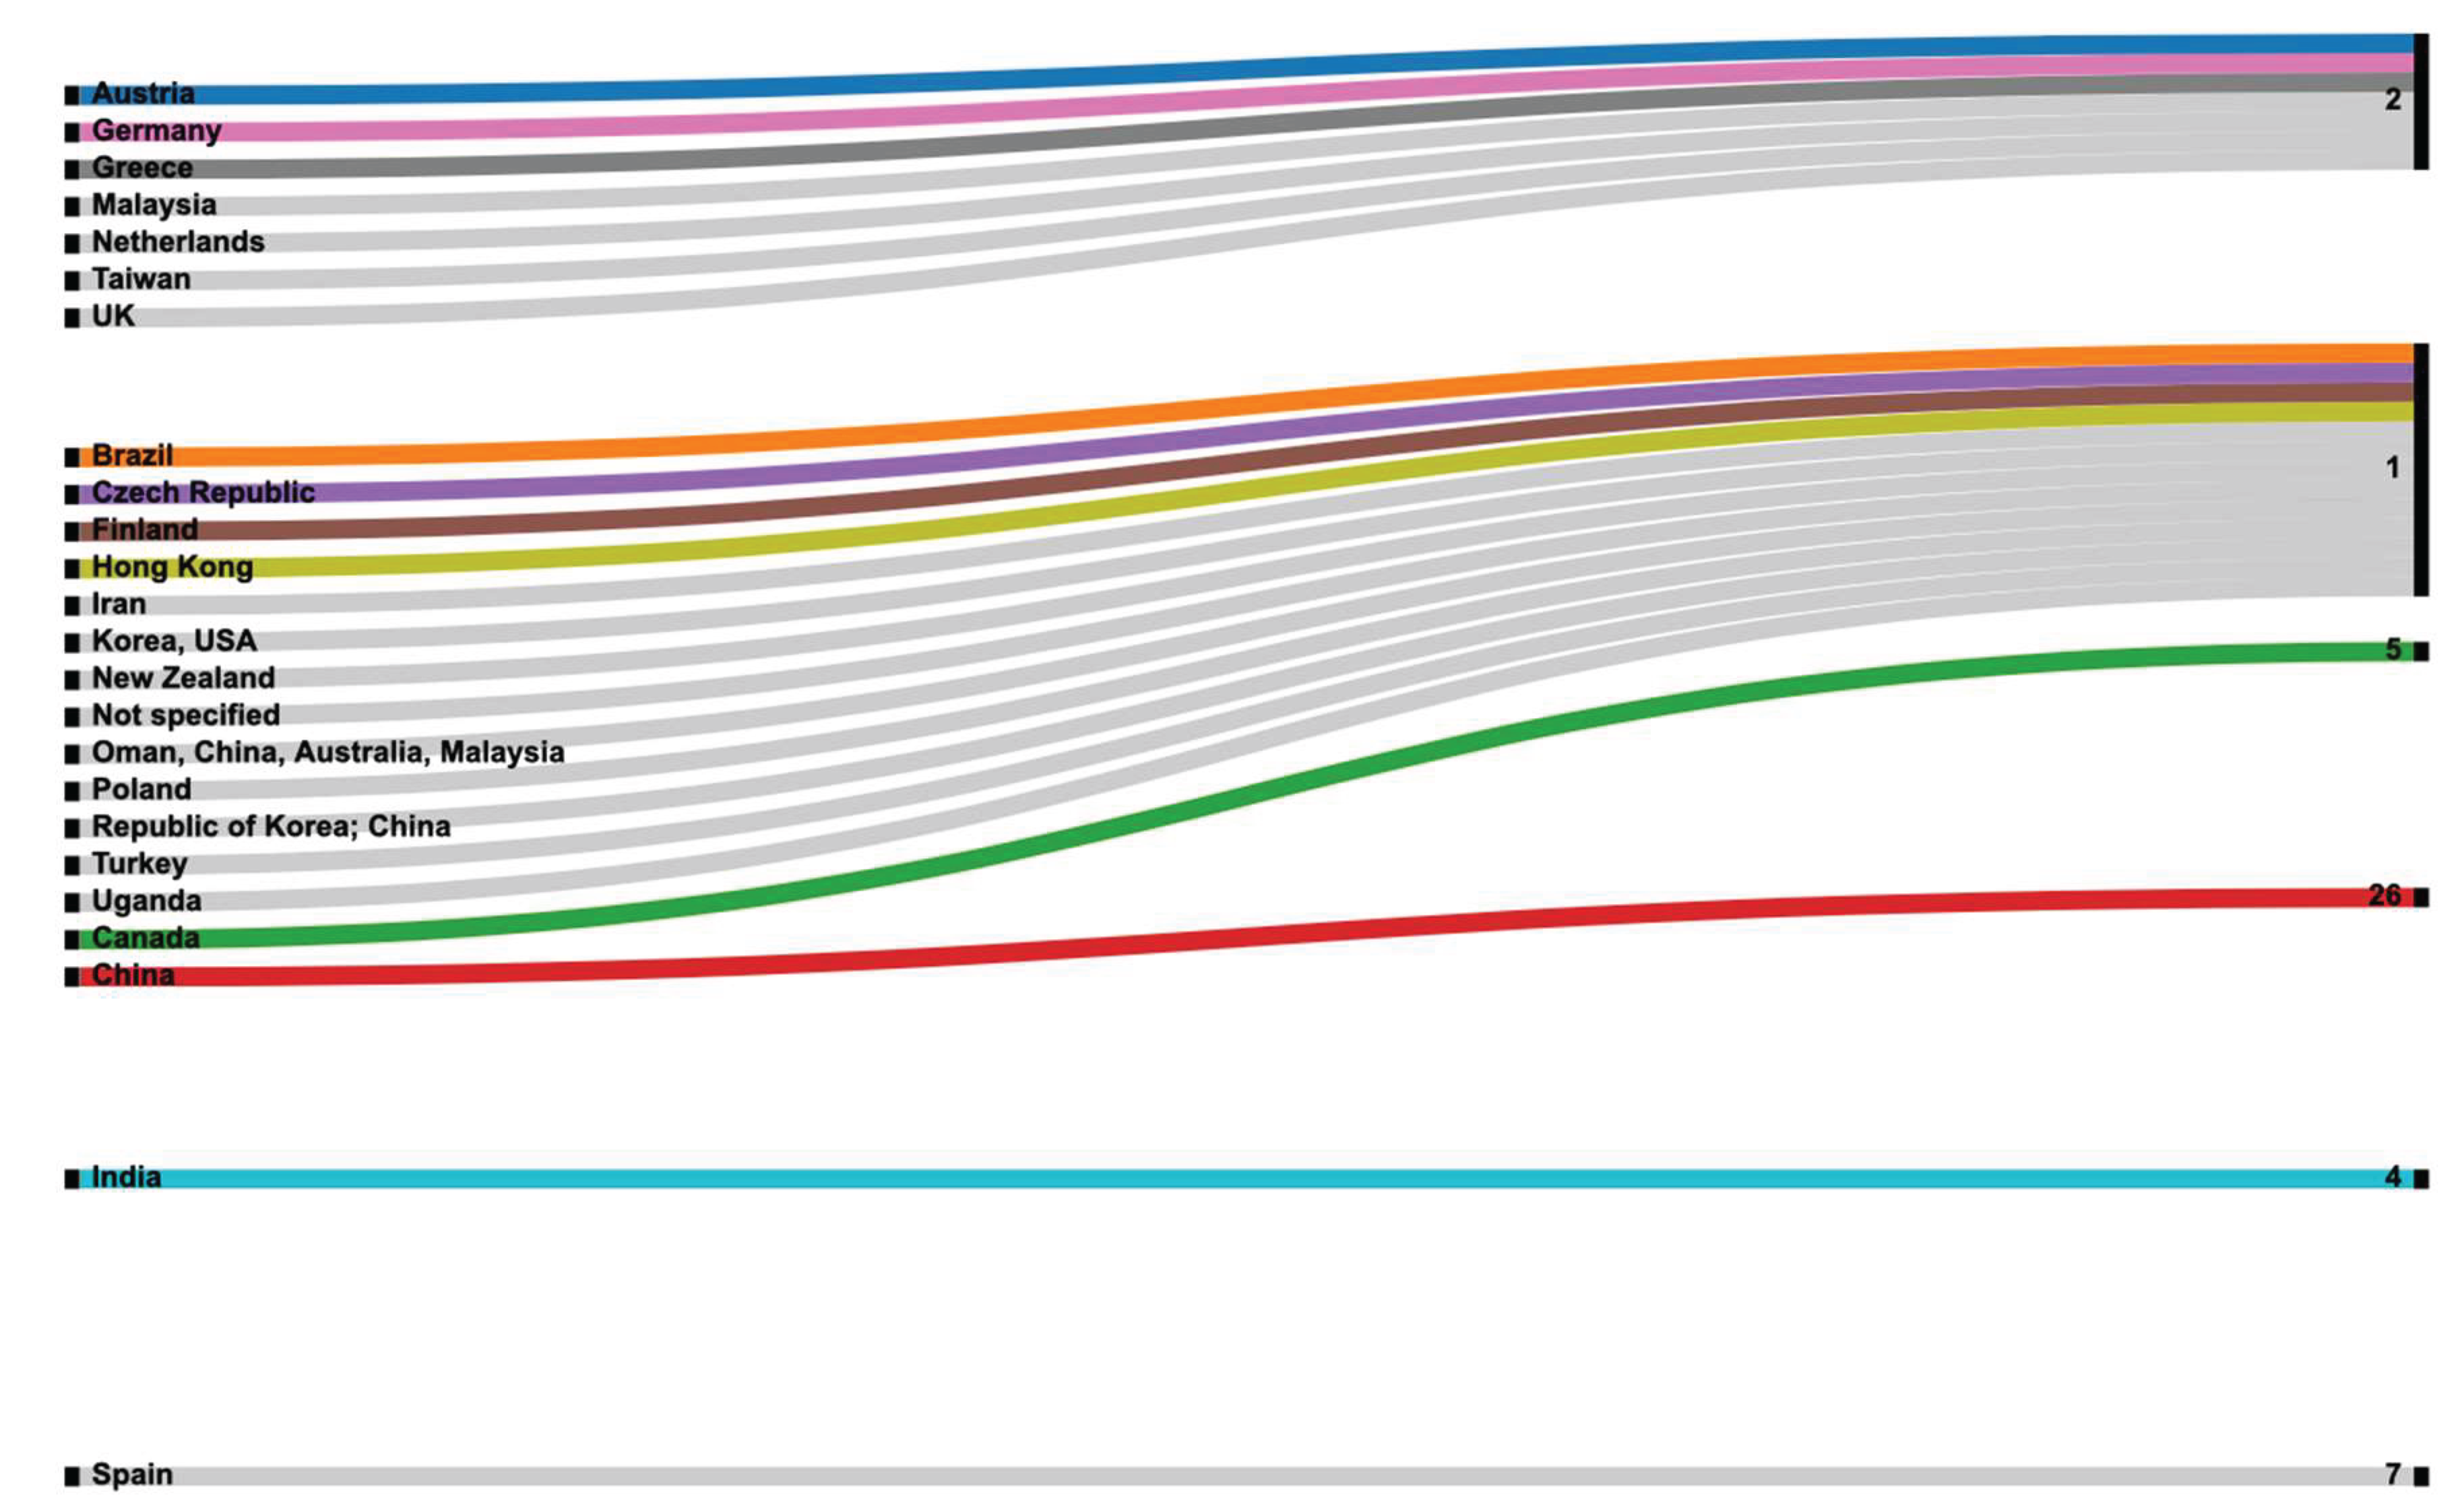
Figure 13.
Investigated Water Aspect.
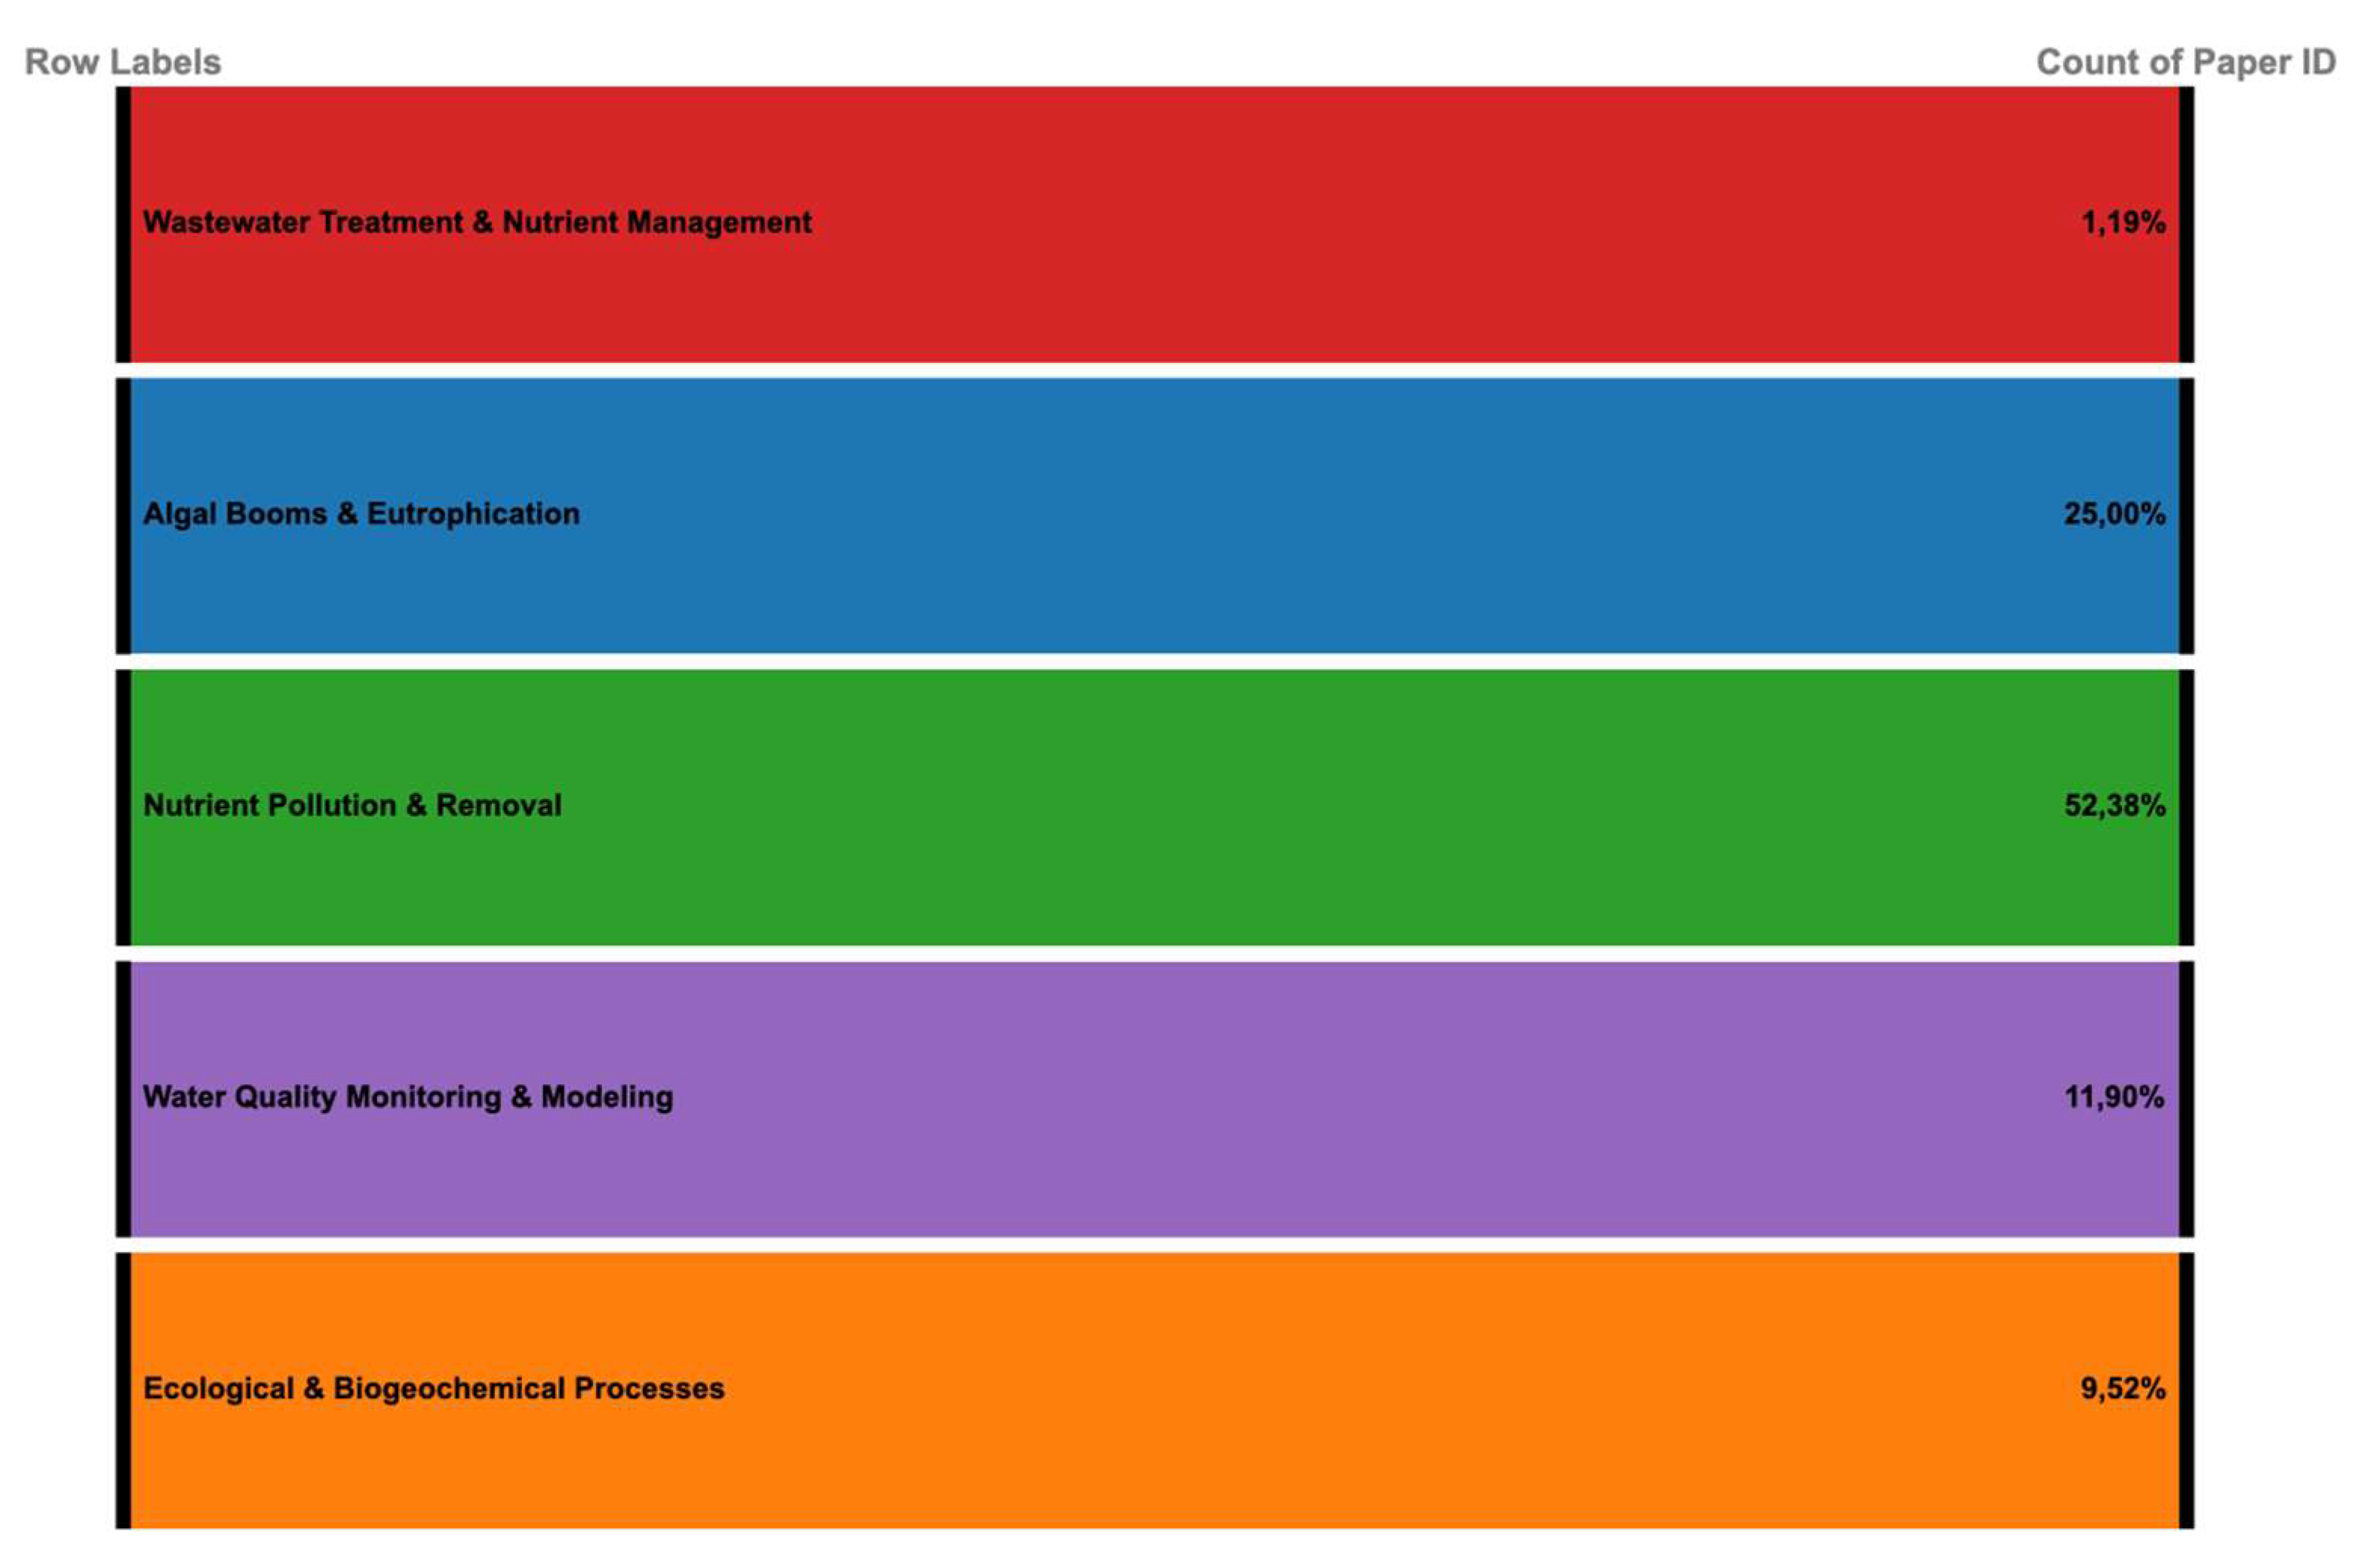
Figure 14.
Distribution of Nitrogen Assessment Metrics in Monitoring Studies.
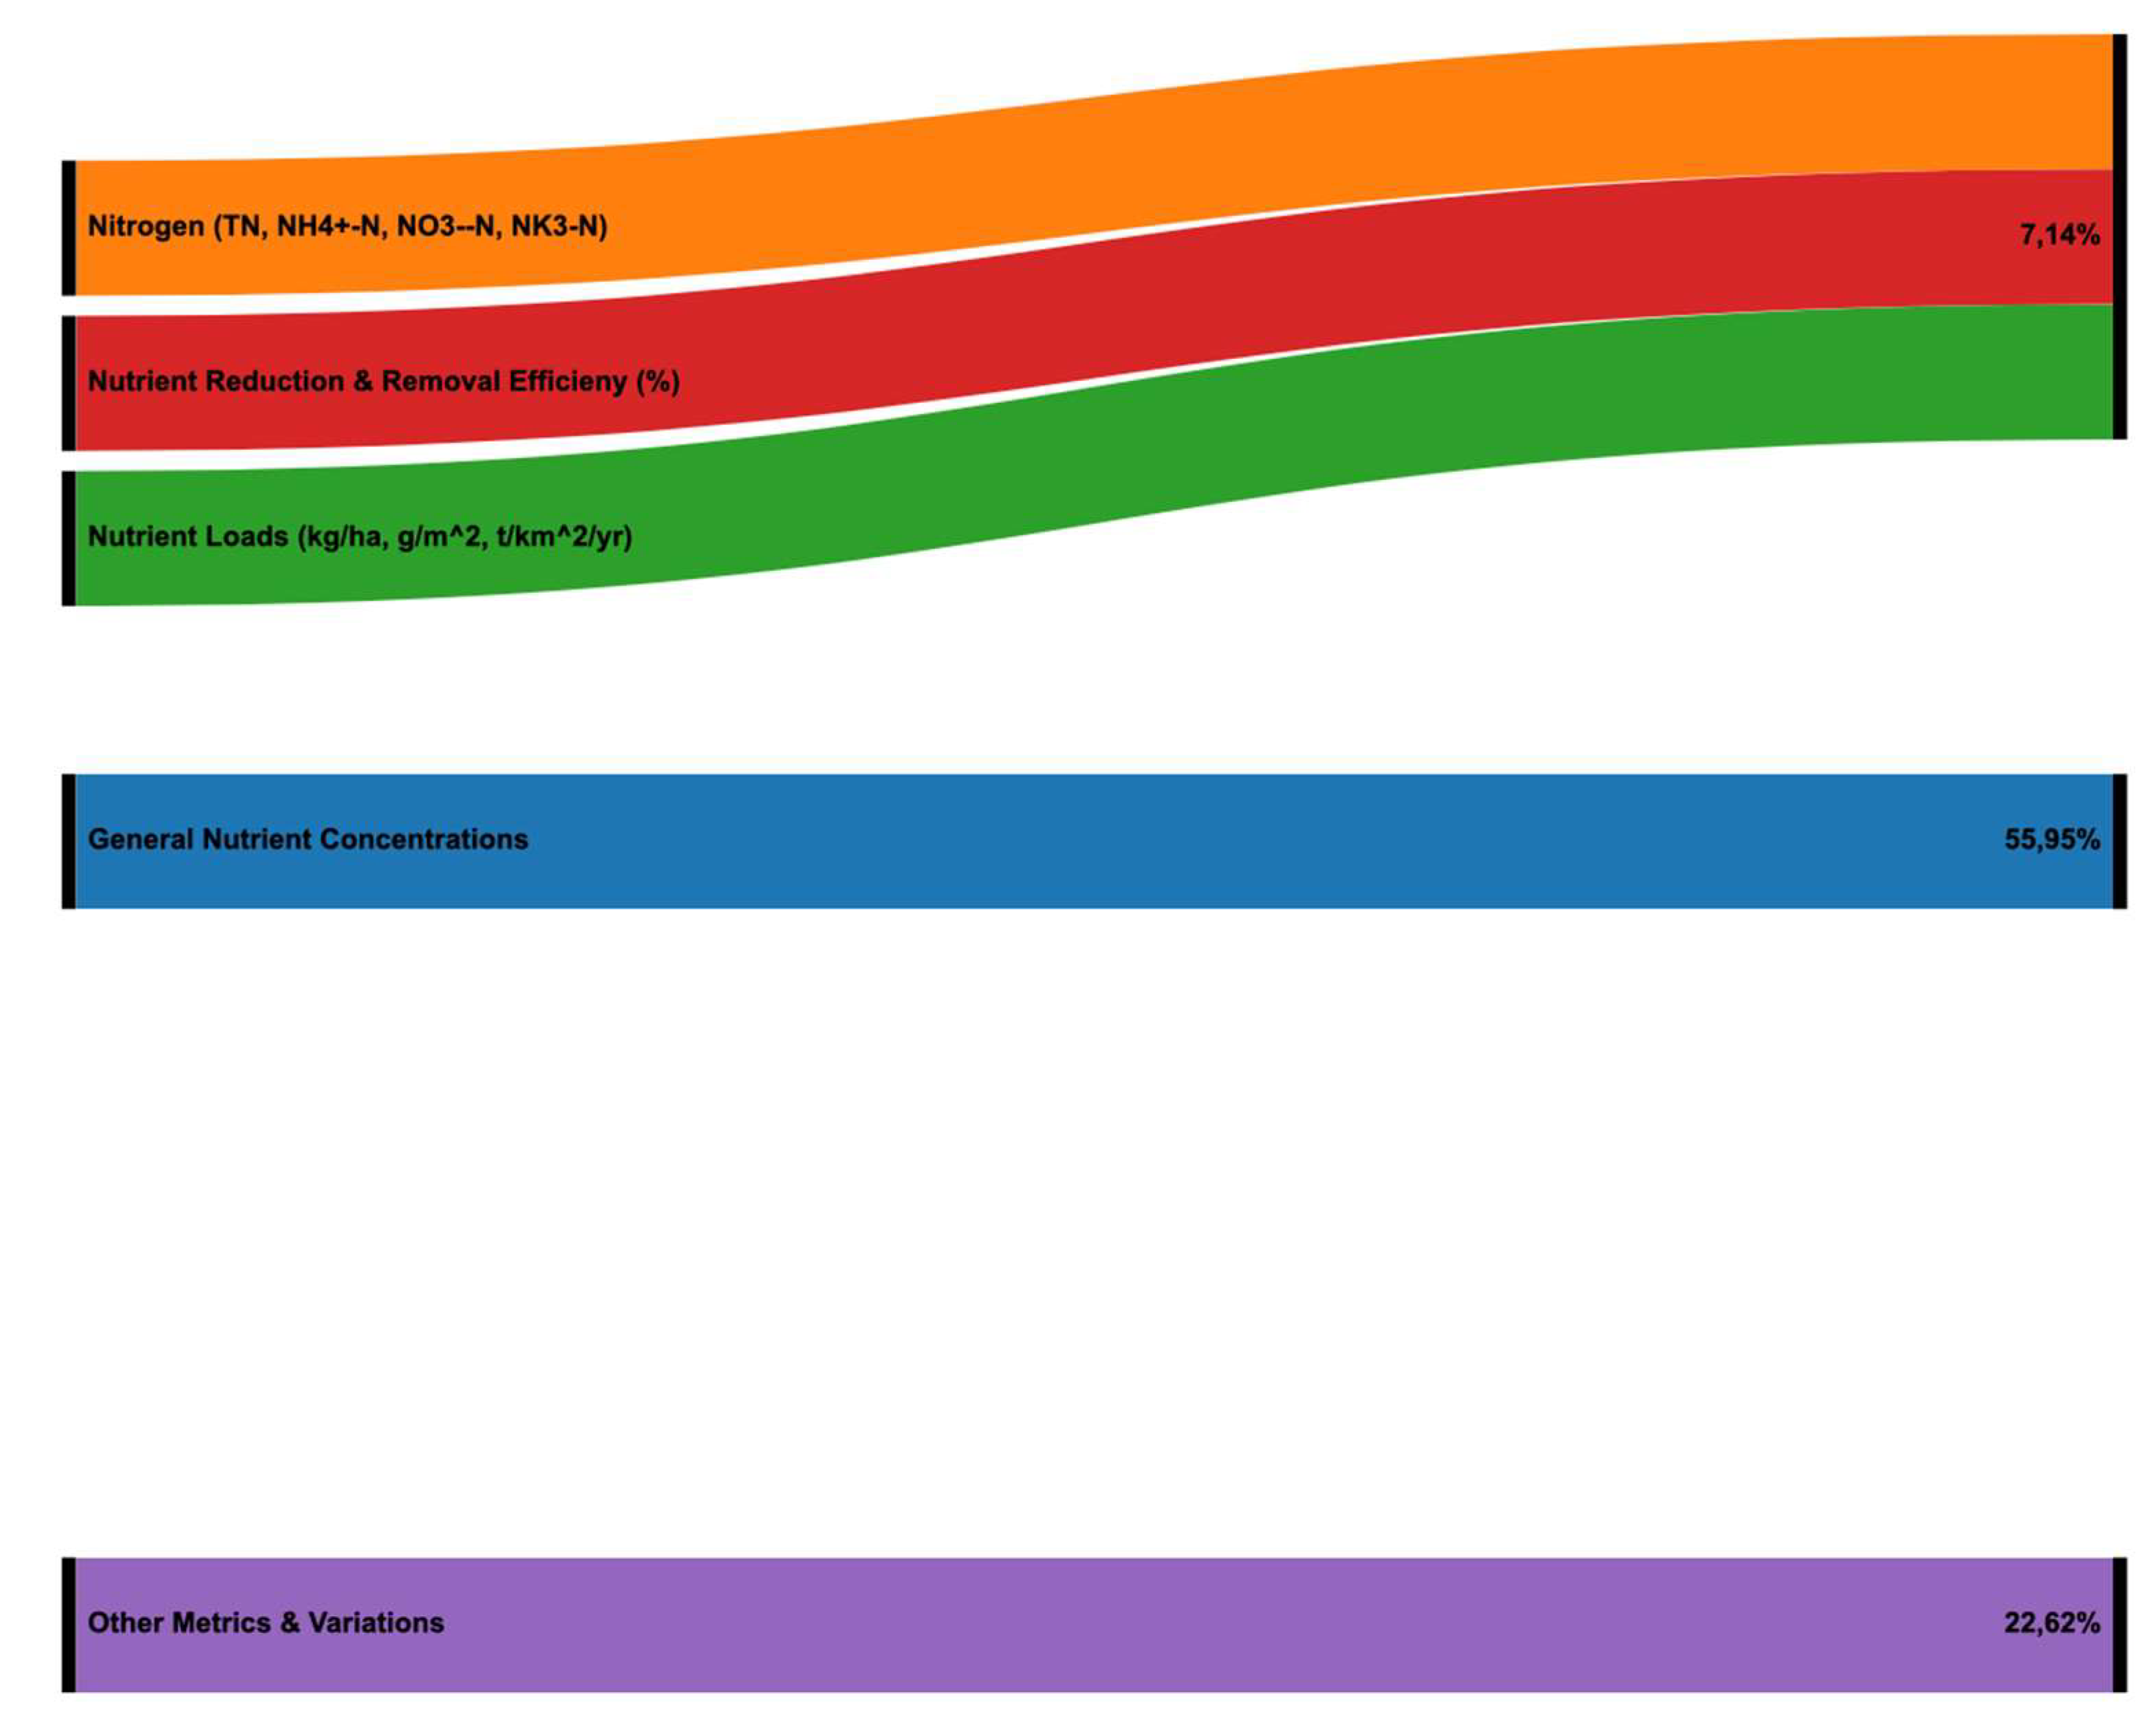
Figure 15.
Proportional Distribution of Phosphorus Measurement Categories.
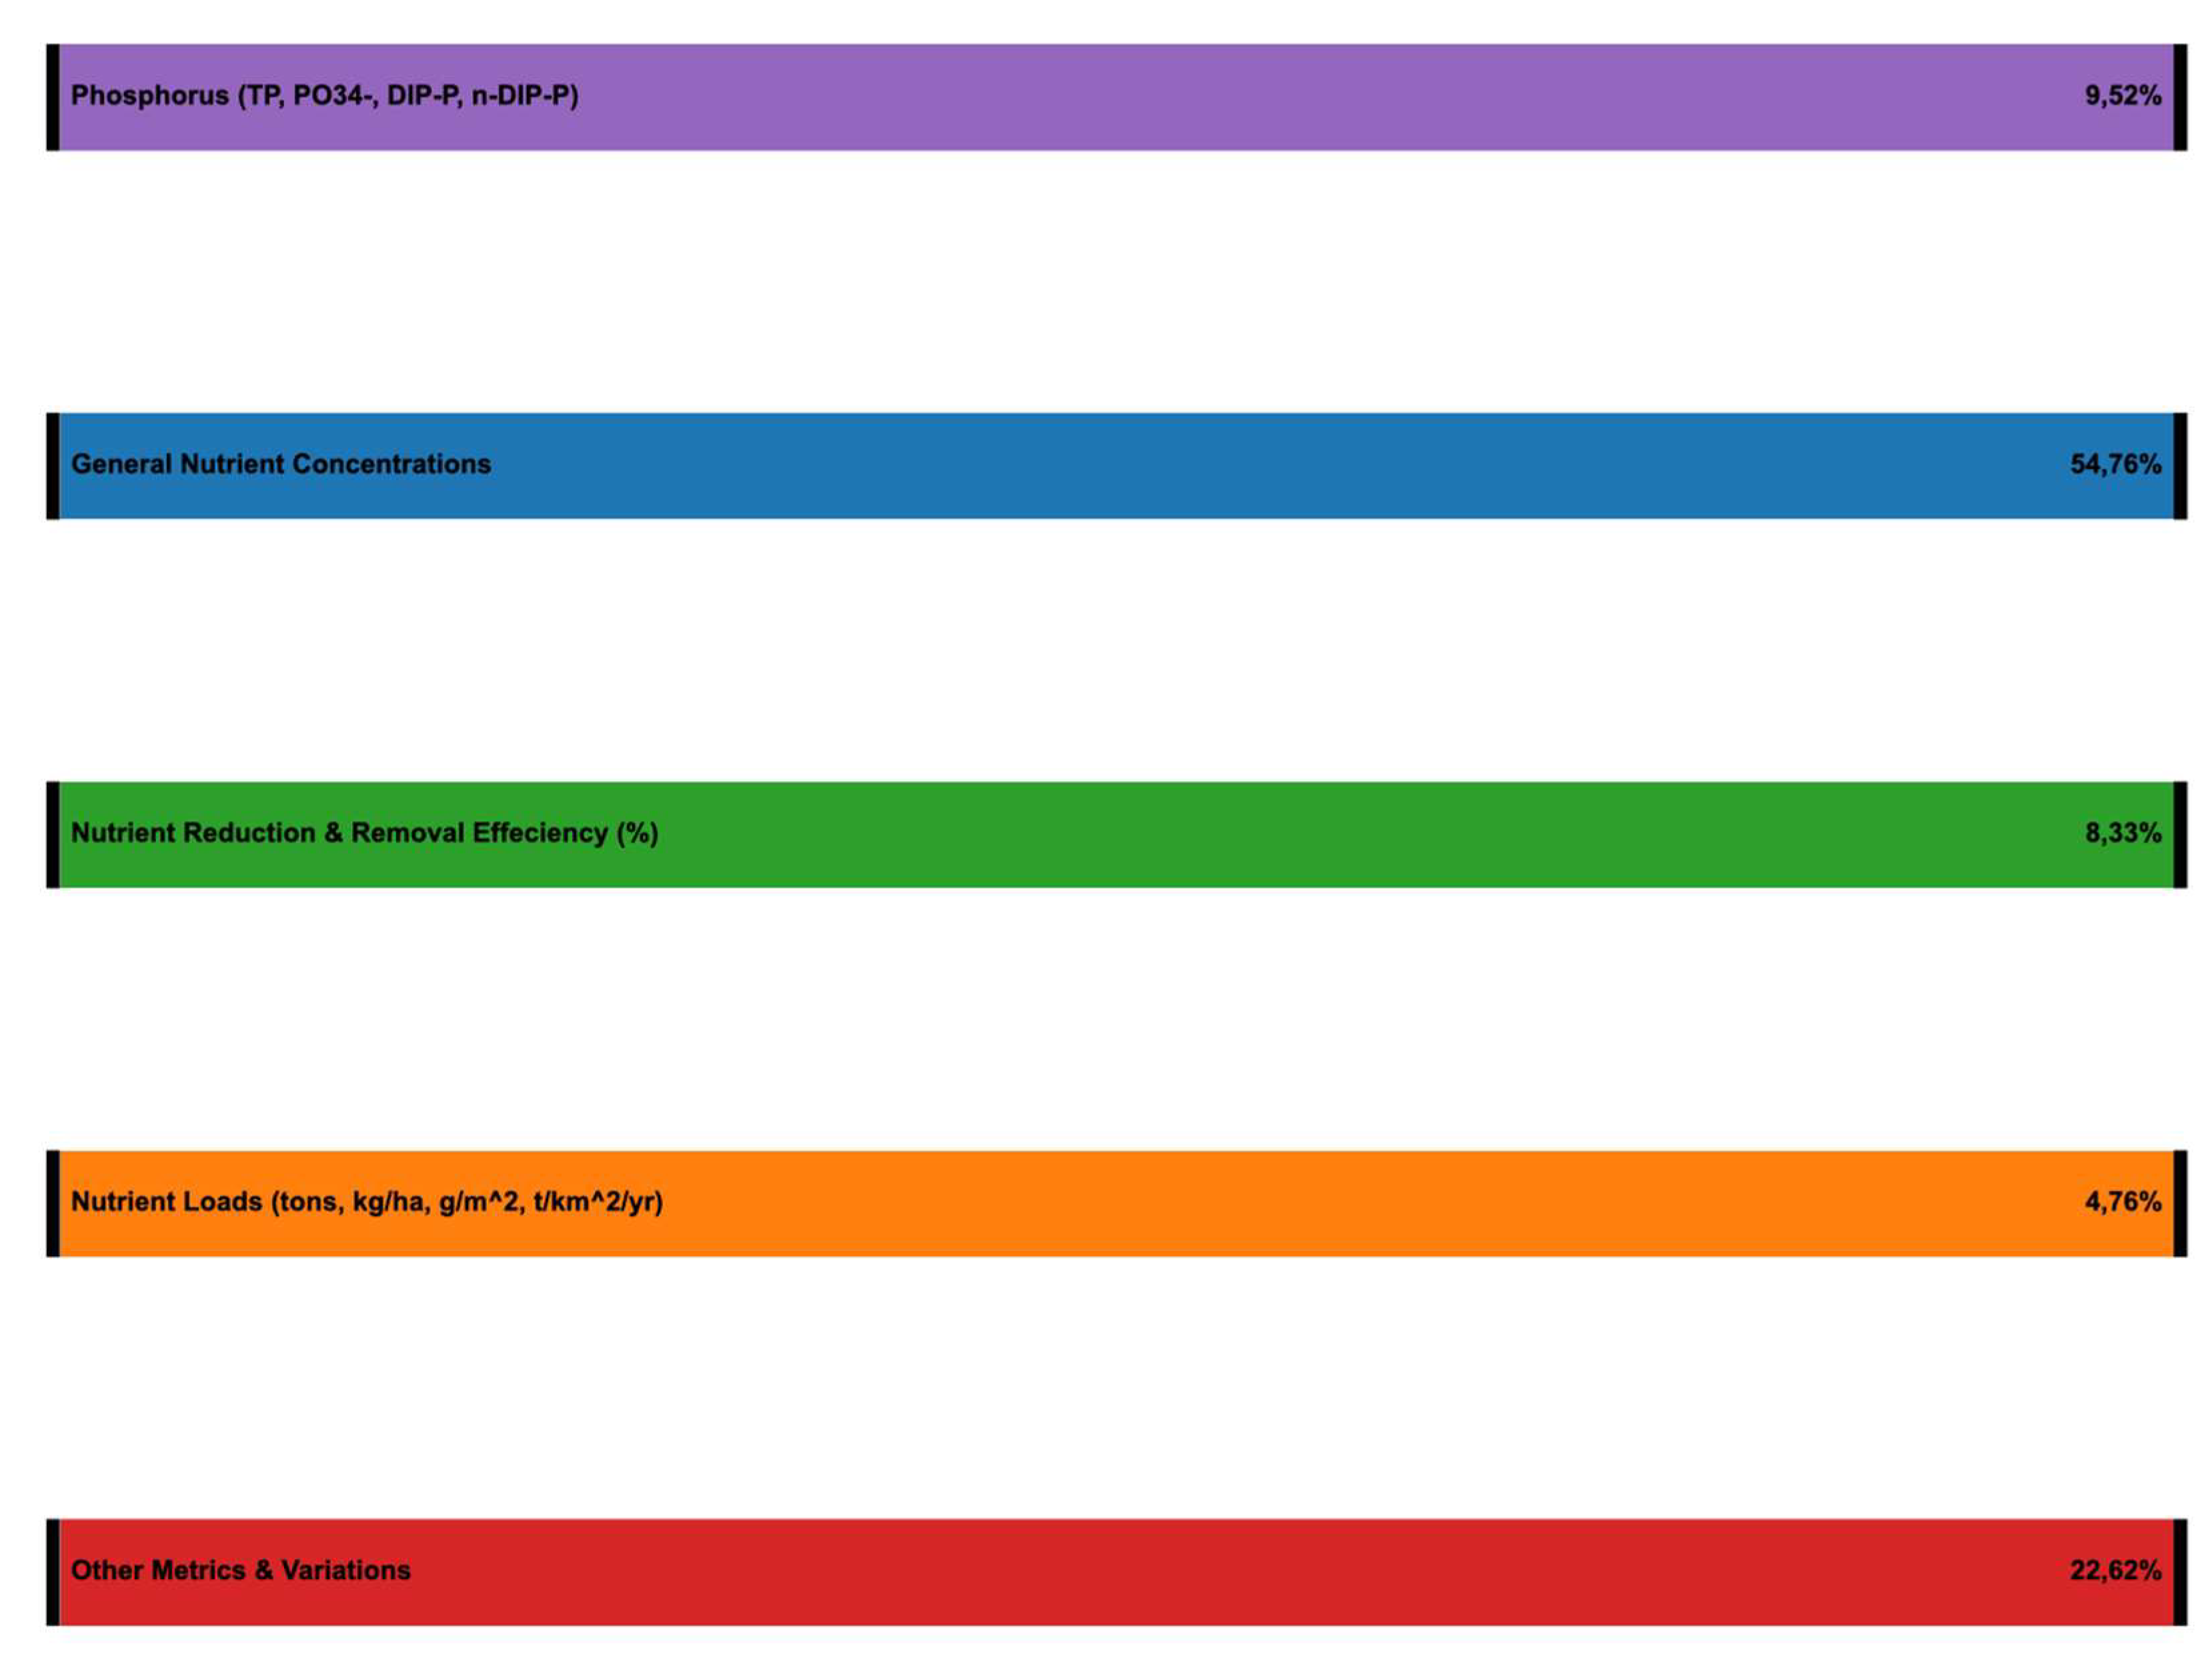
Figure 16.
Distribution of Carbon Metrics.
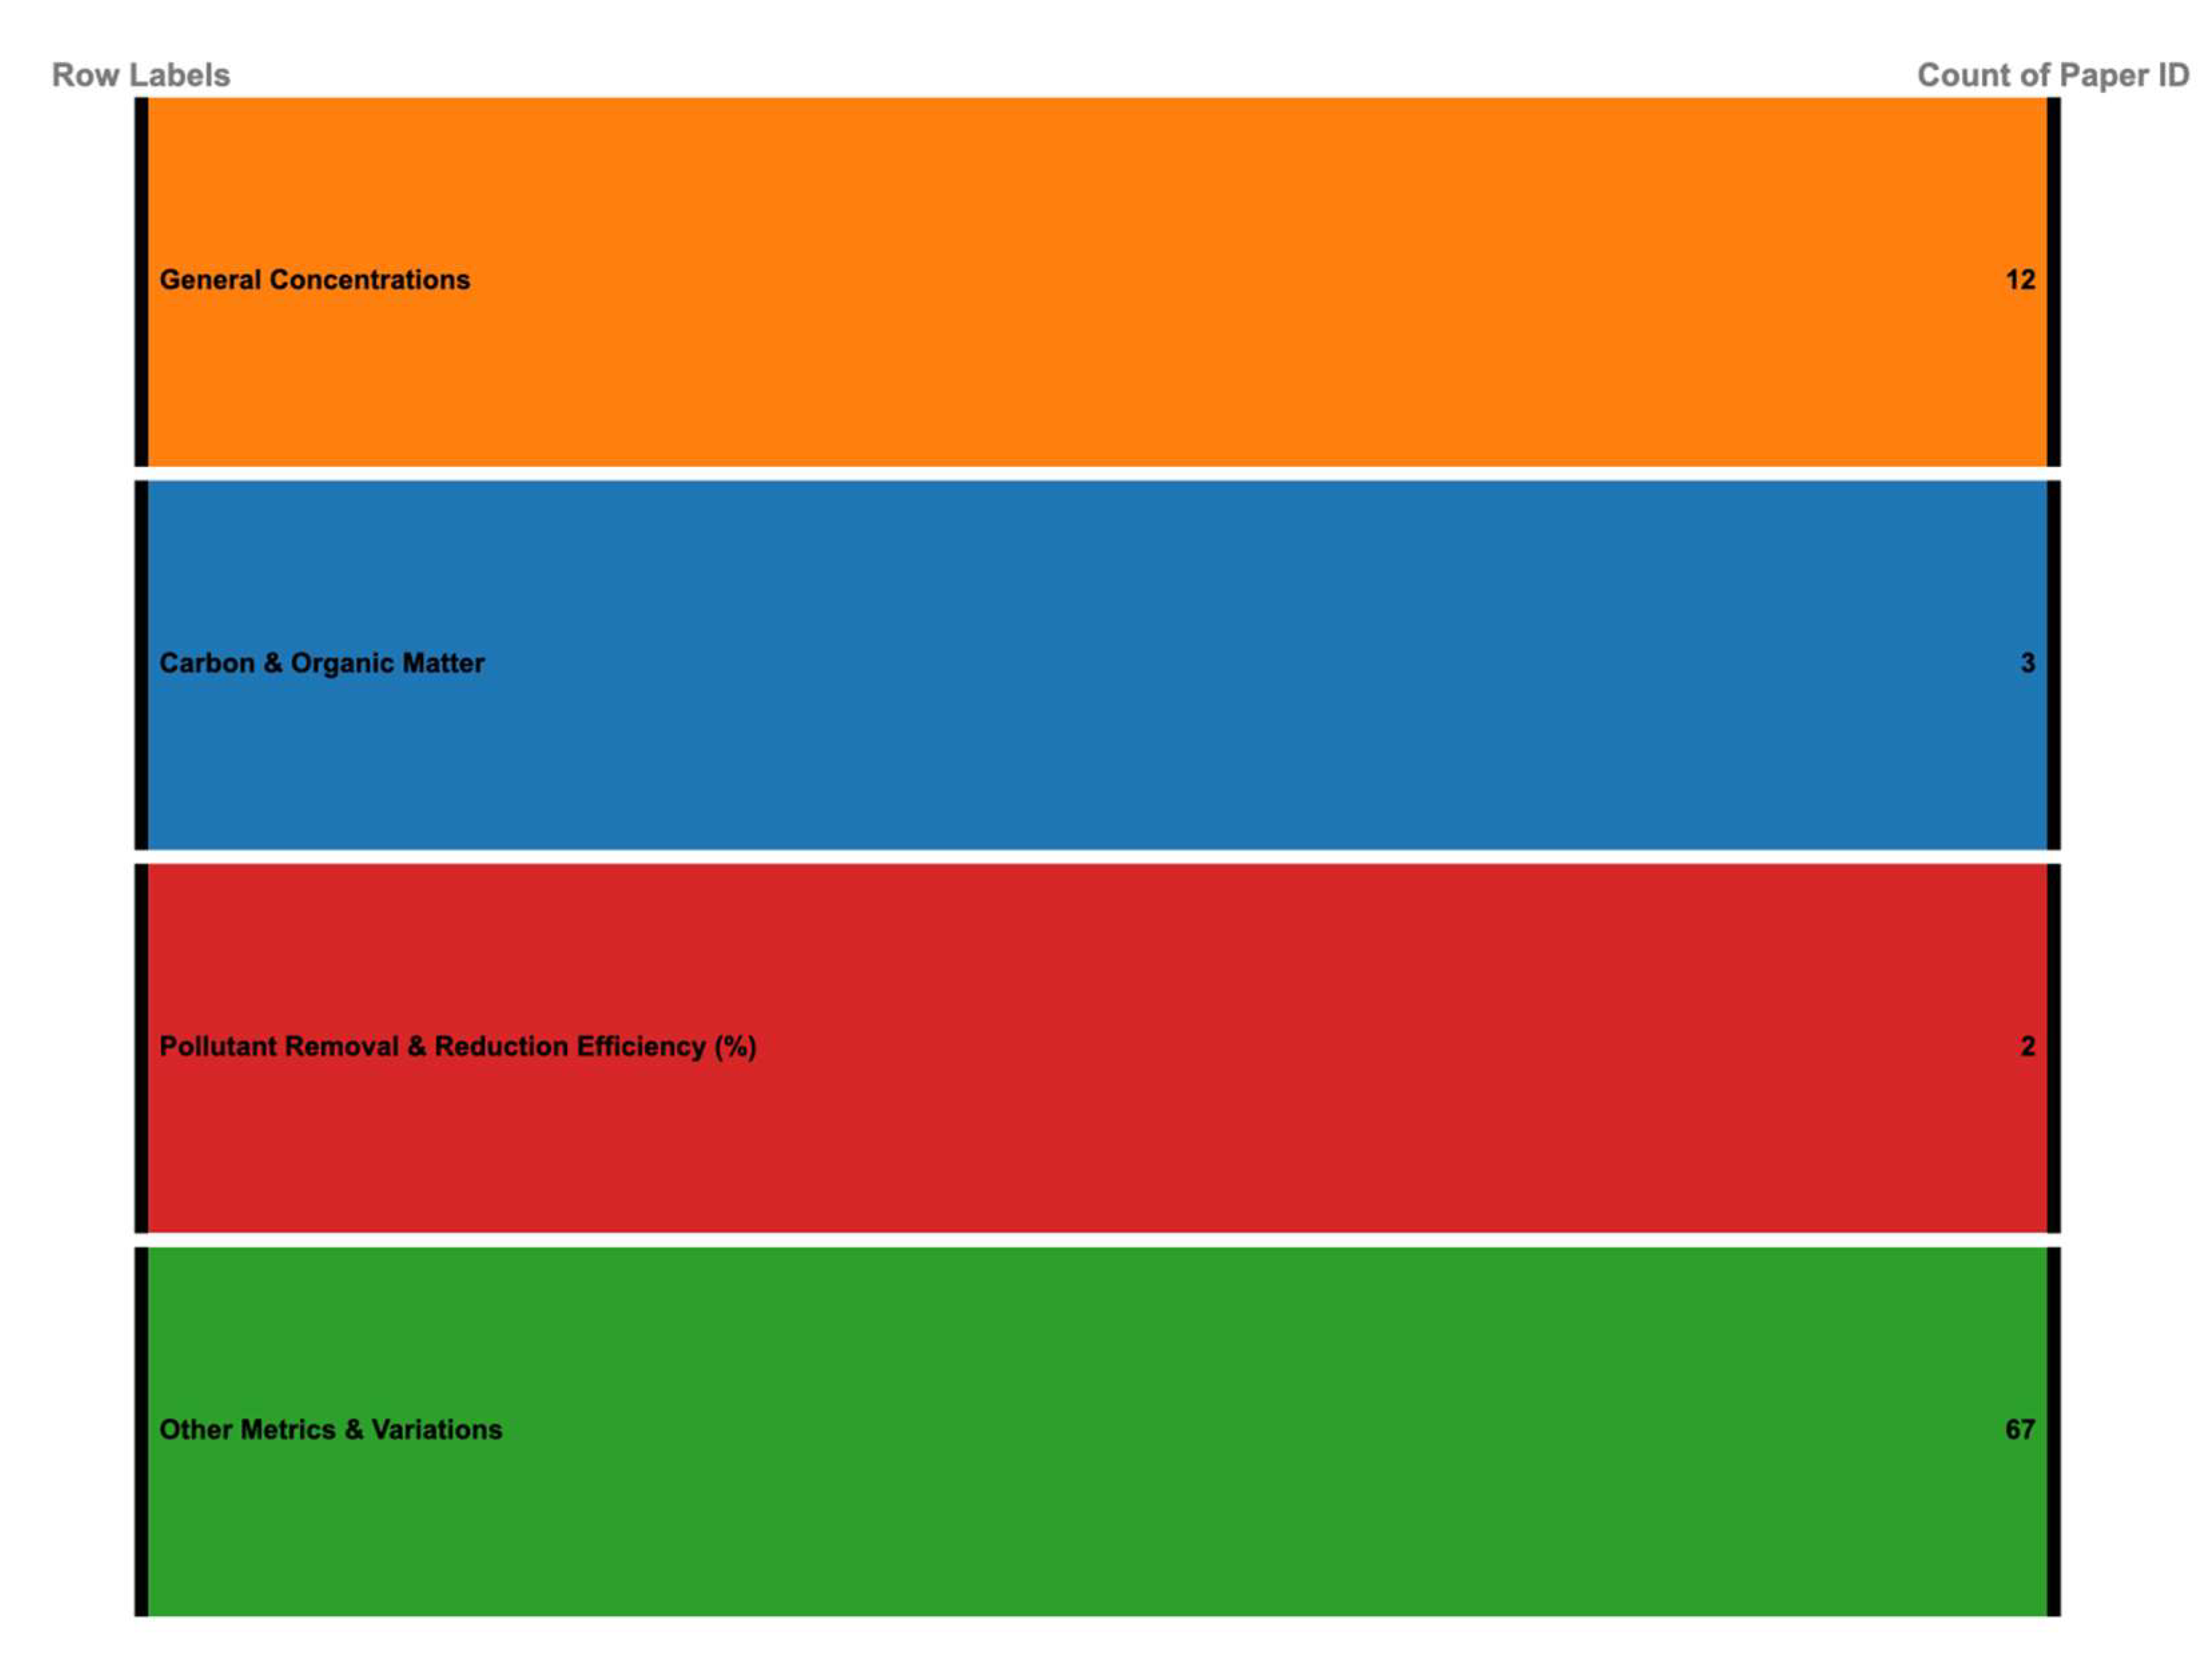
Figure 16.
Sensor and Analytical Method Frequencies.
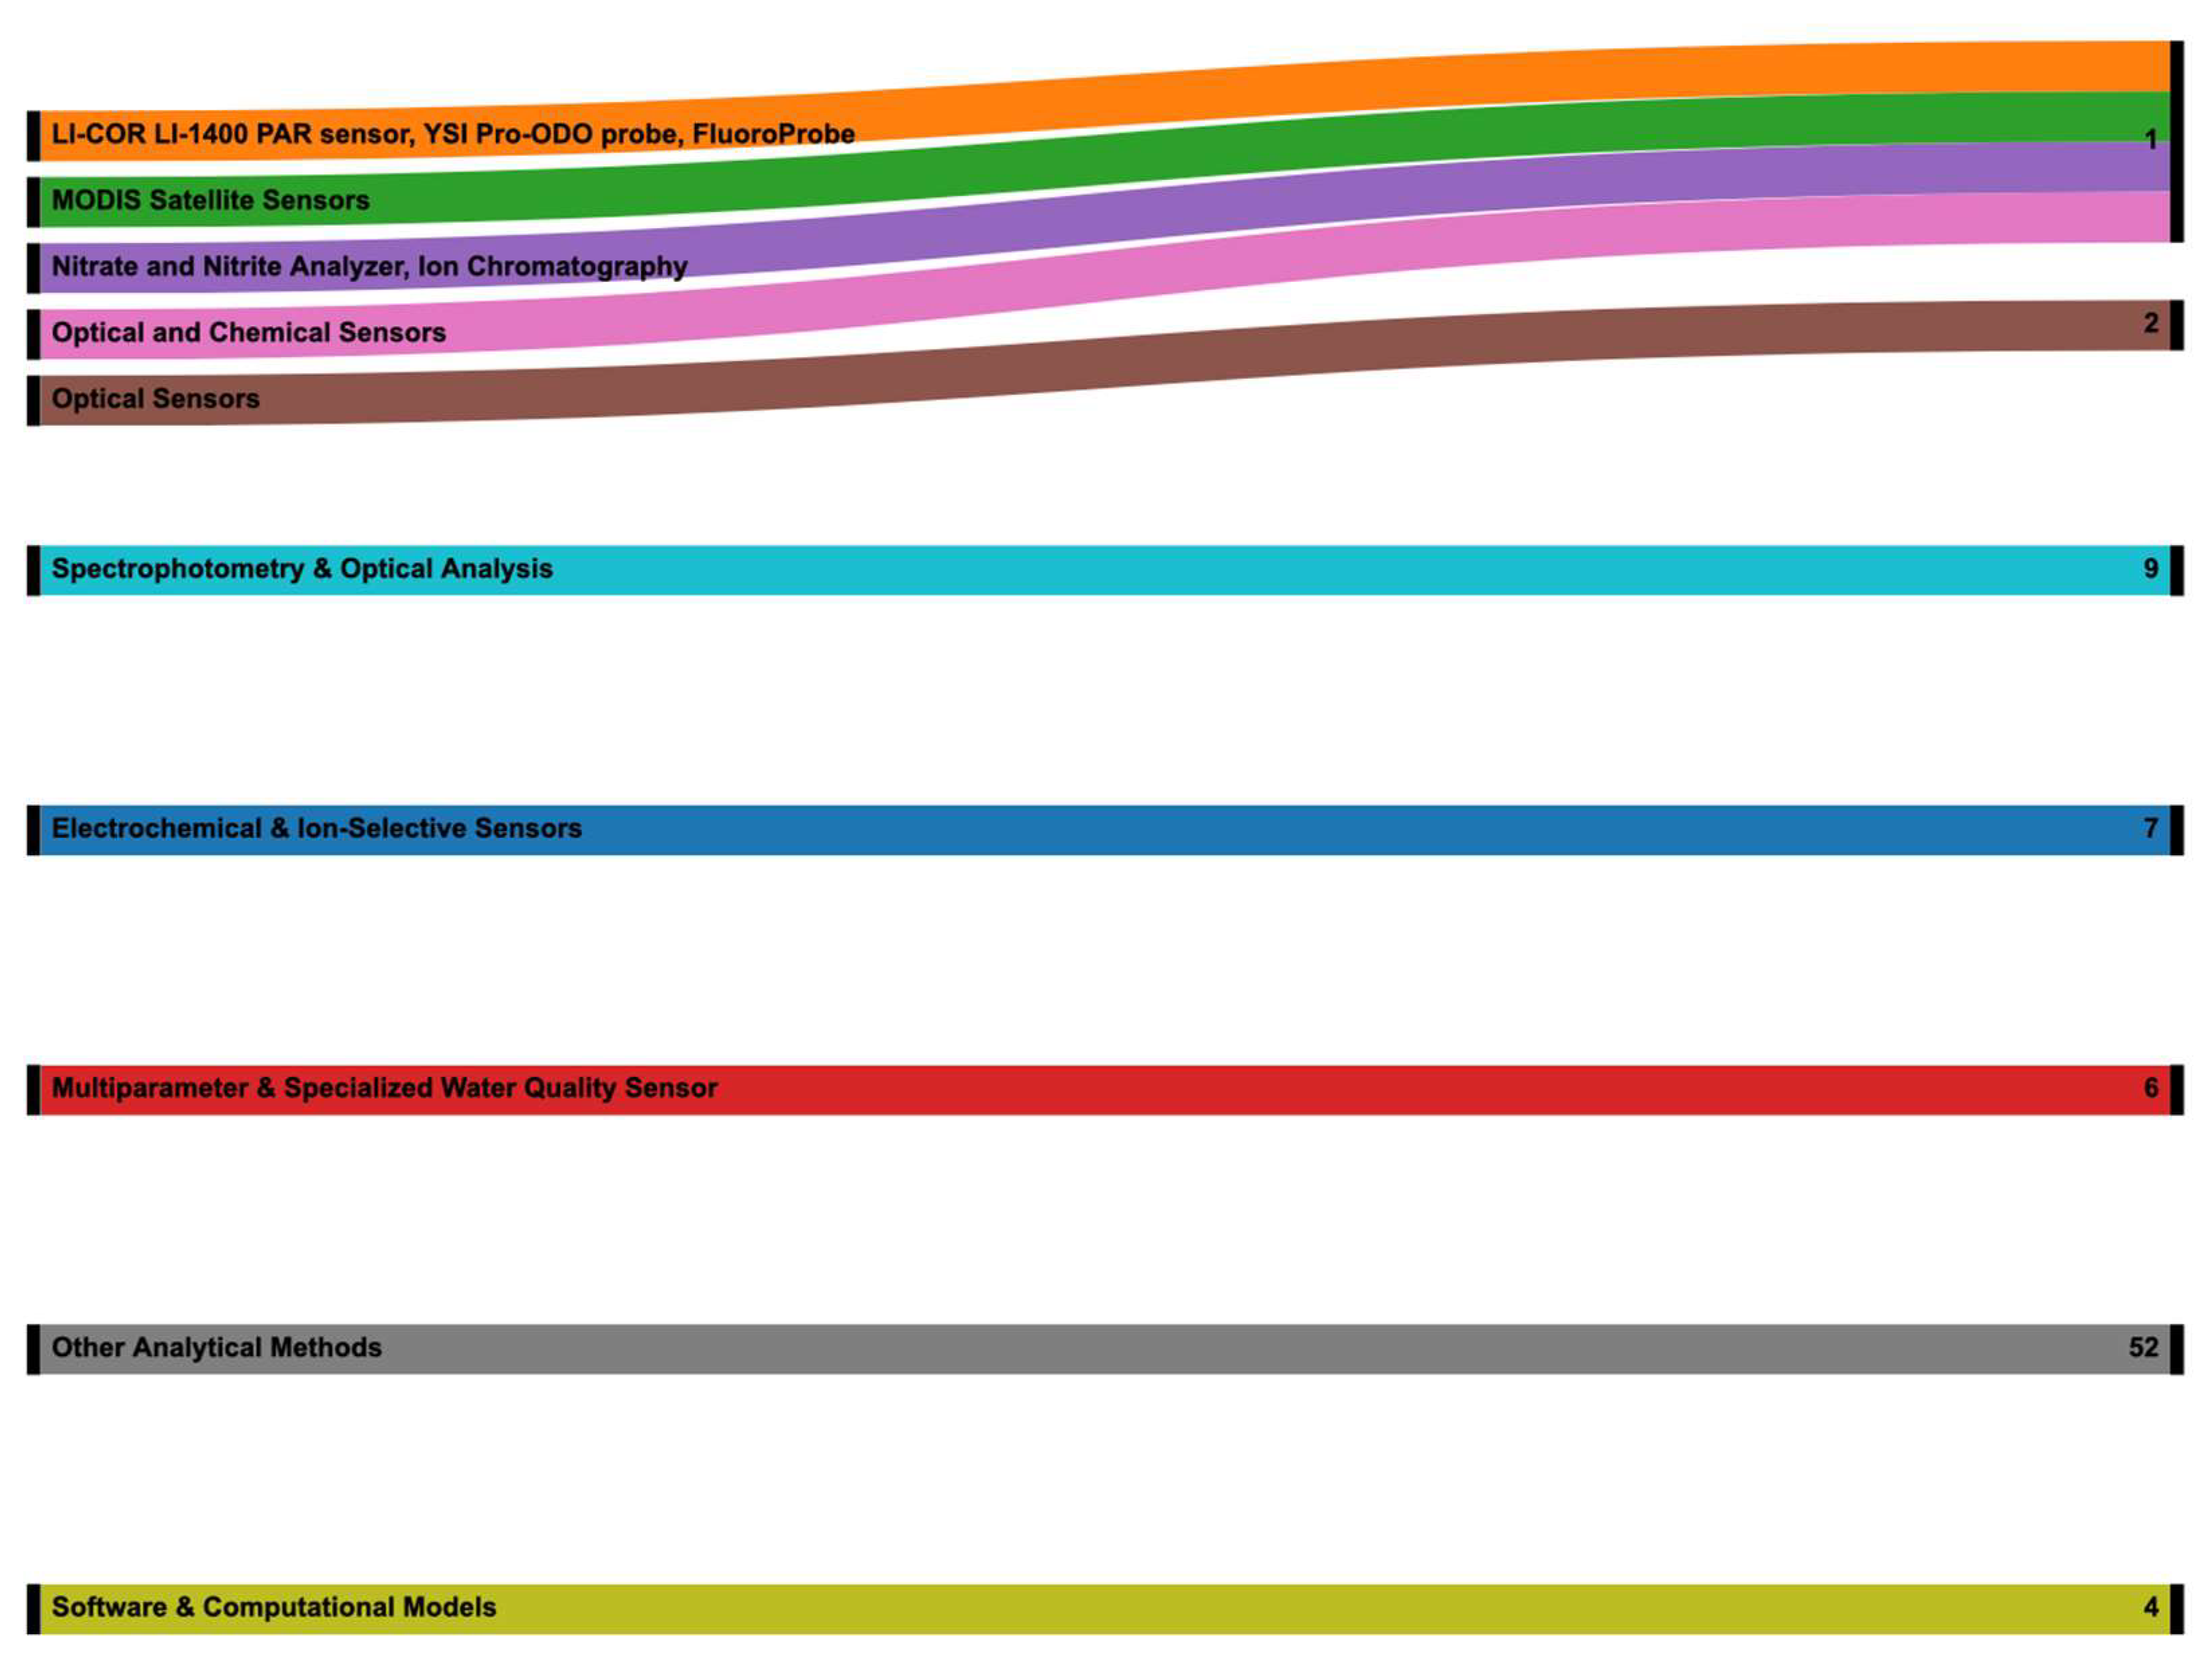
Figure 17.
Distribution of Microcontroller Platforms.
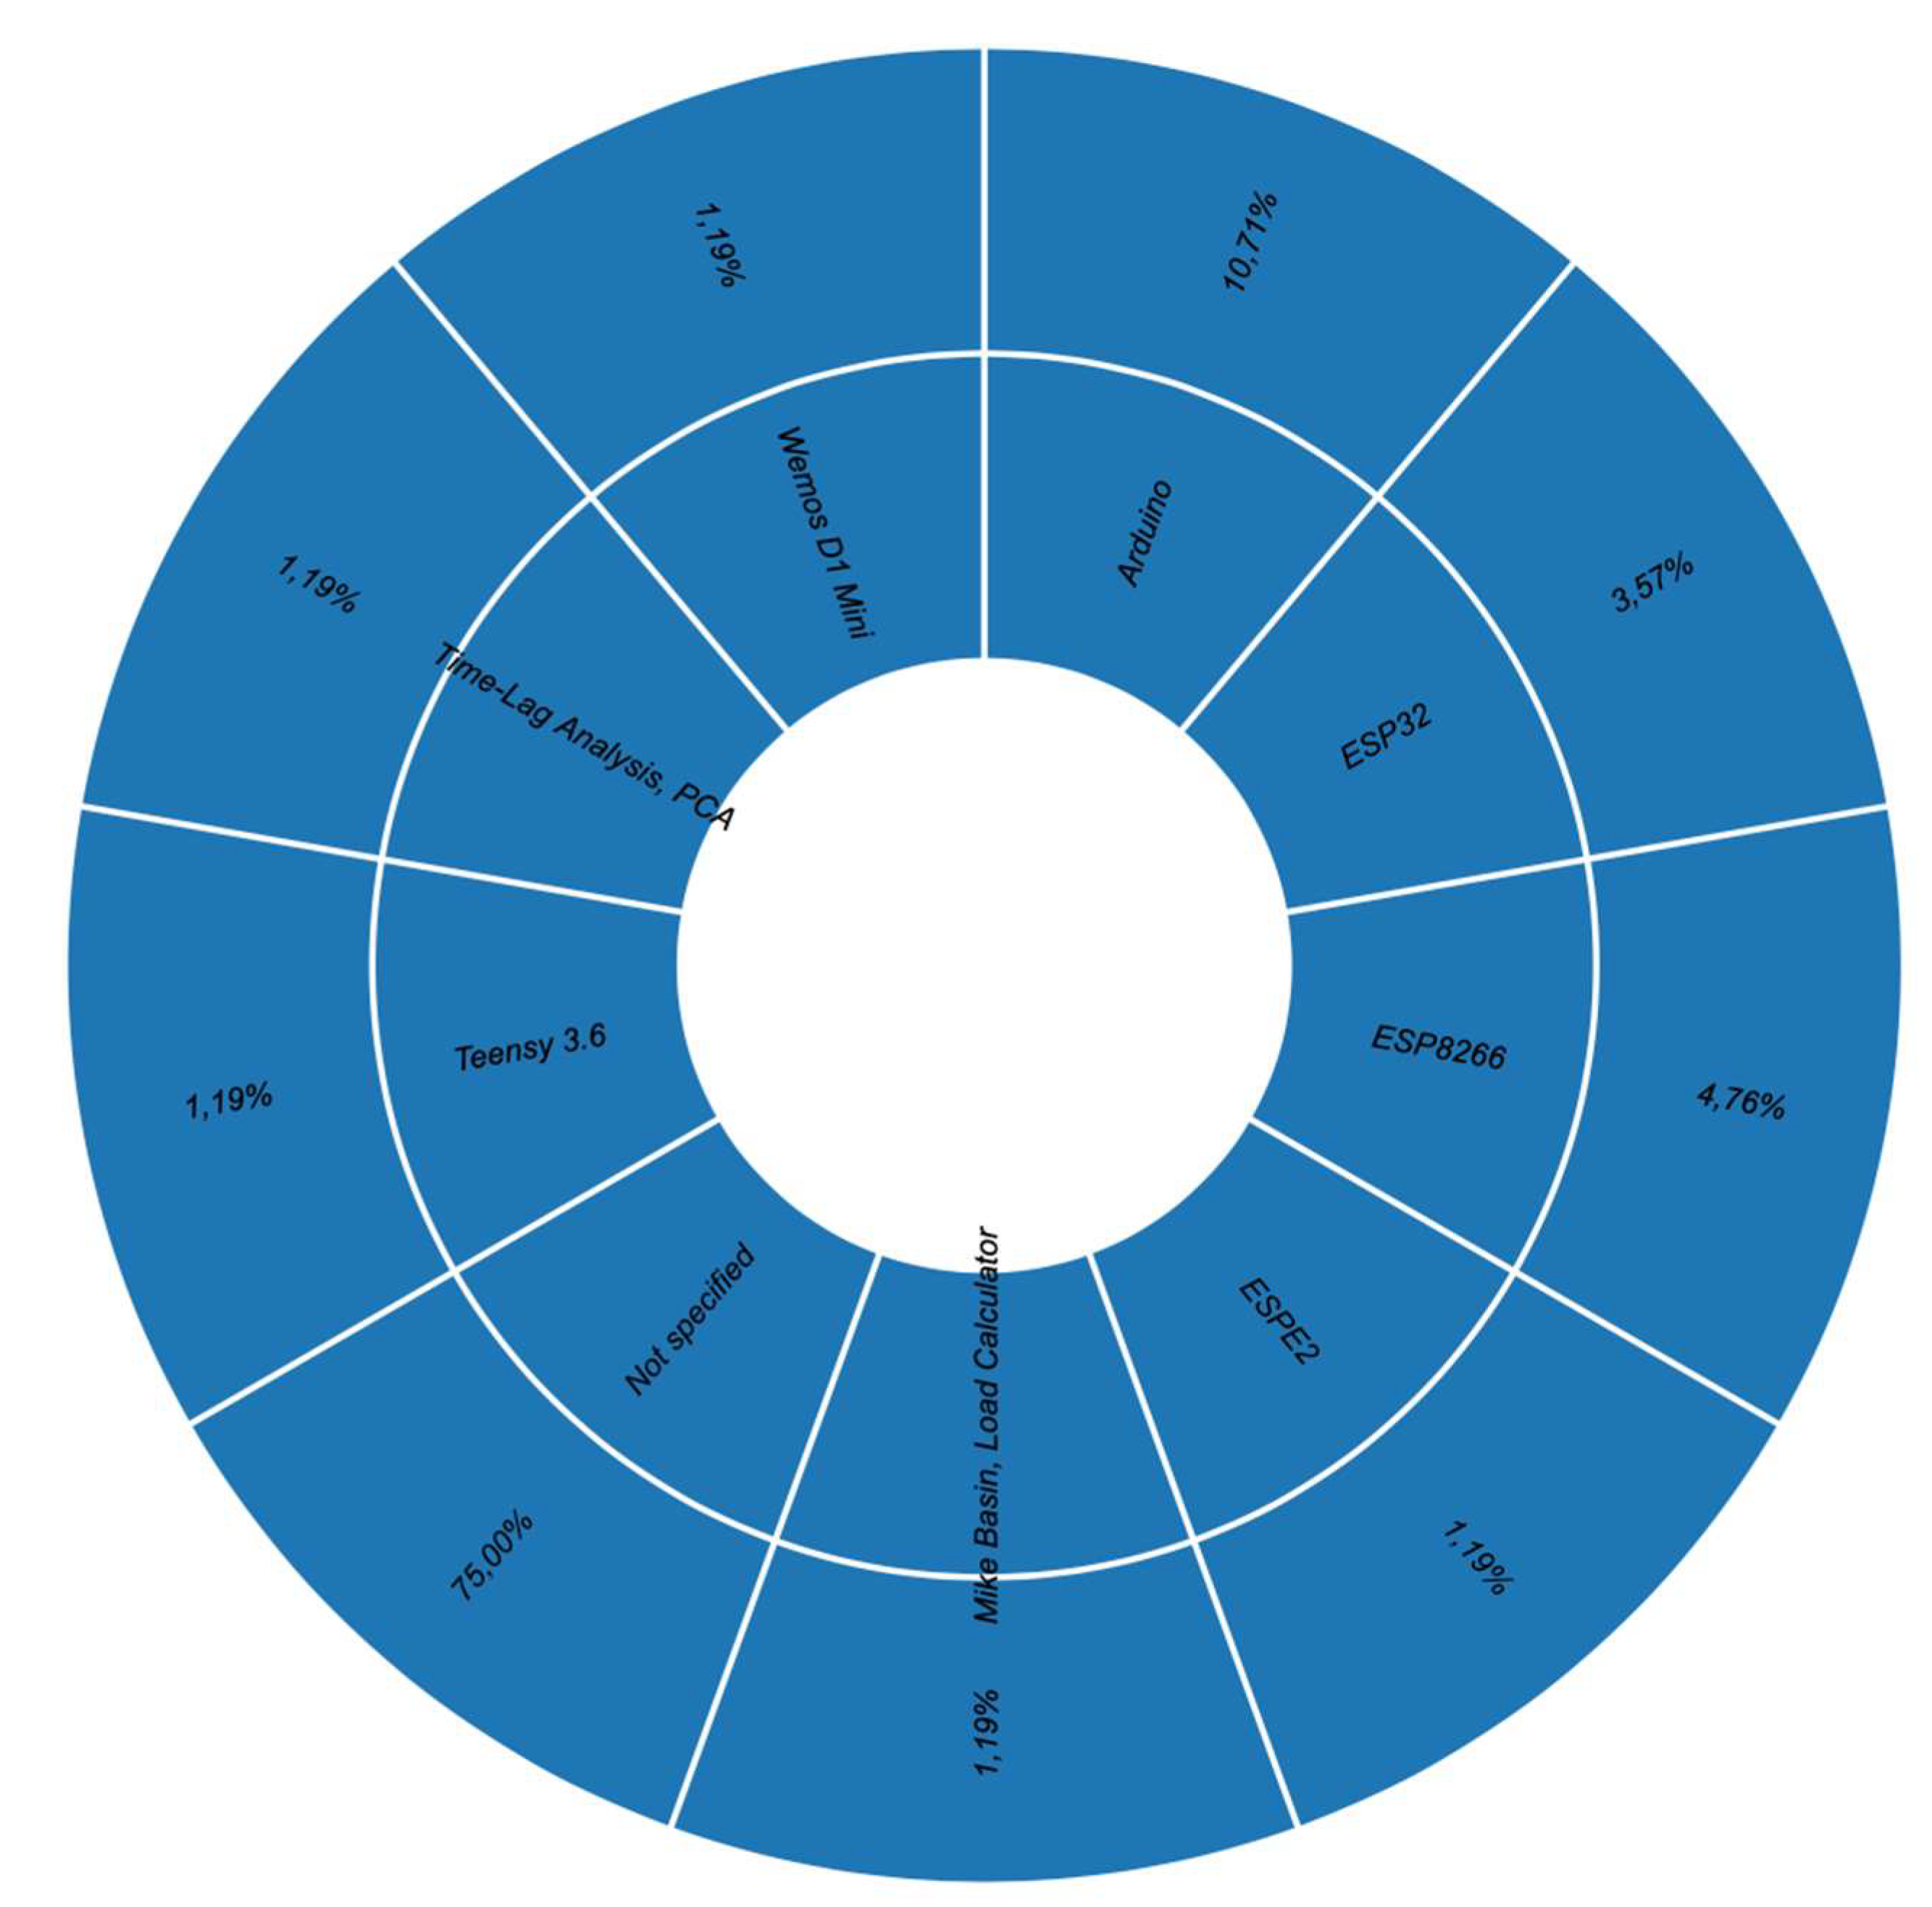
Figure 18.
Distribution of Connection Types.
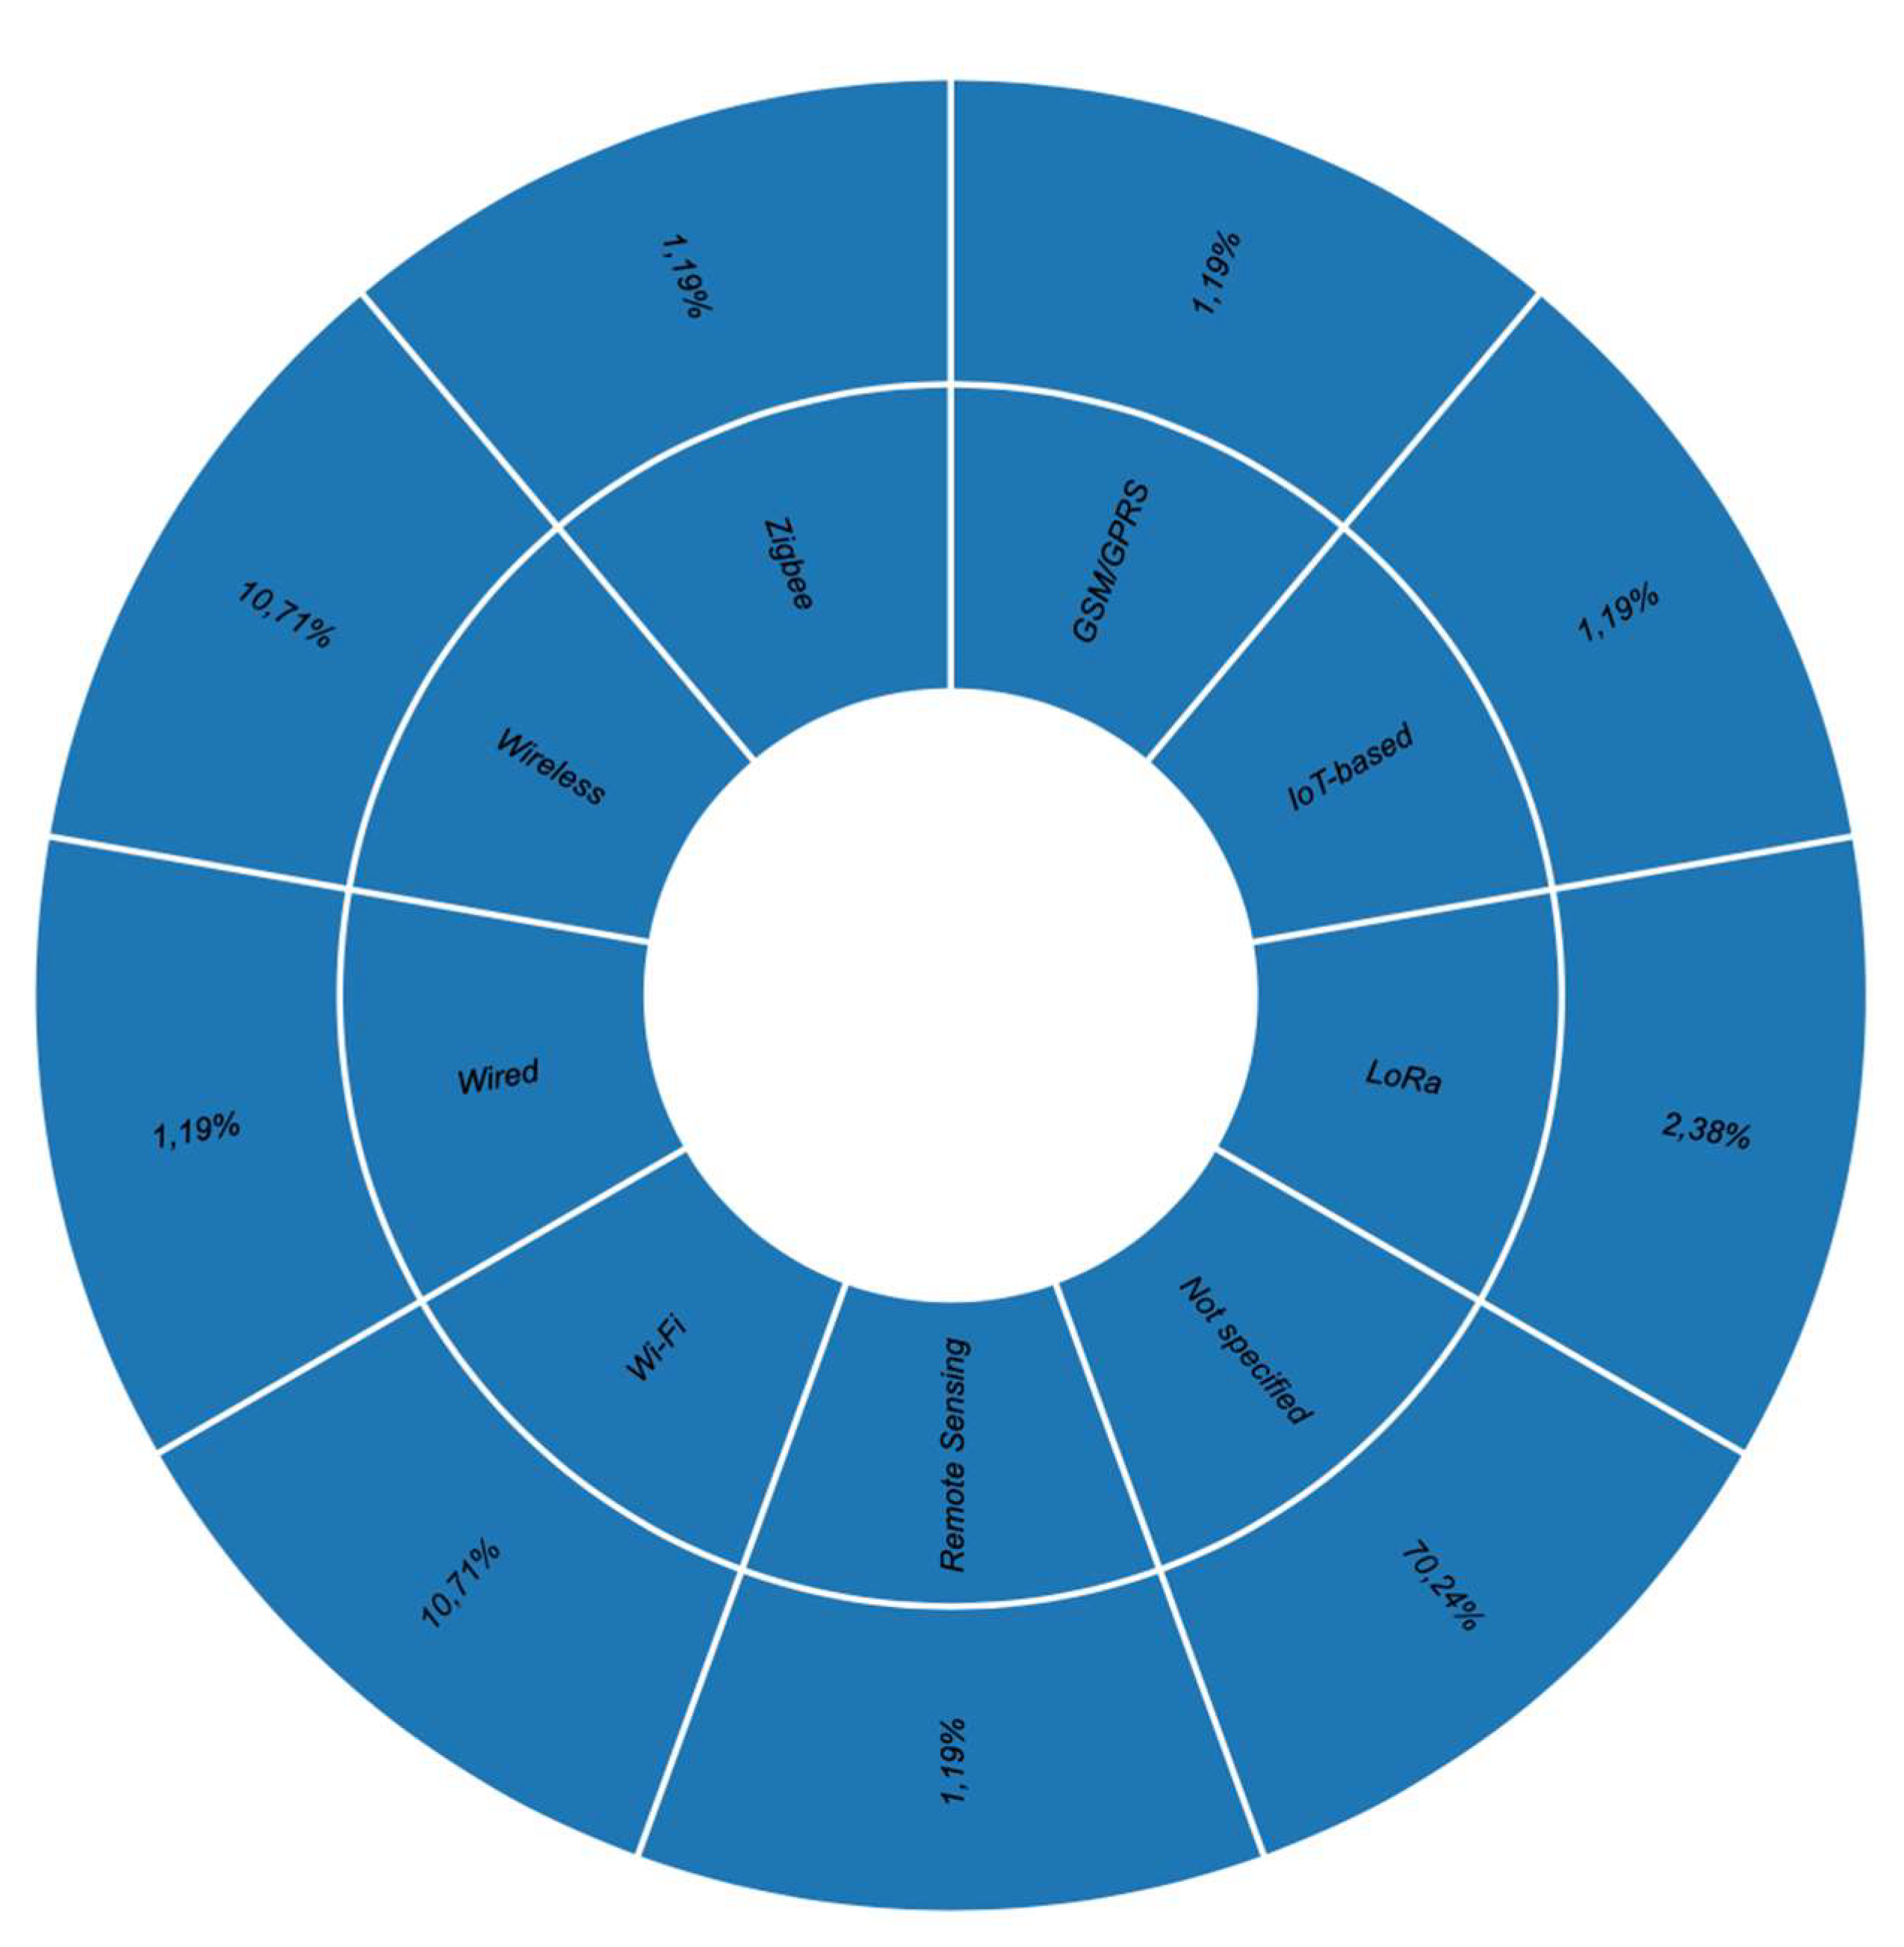
Figure 19.
Distribution of Cloud Used.
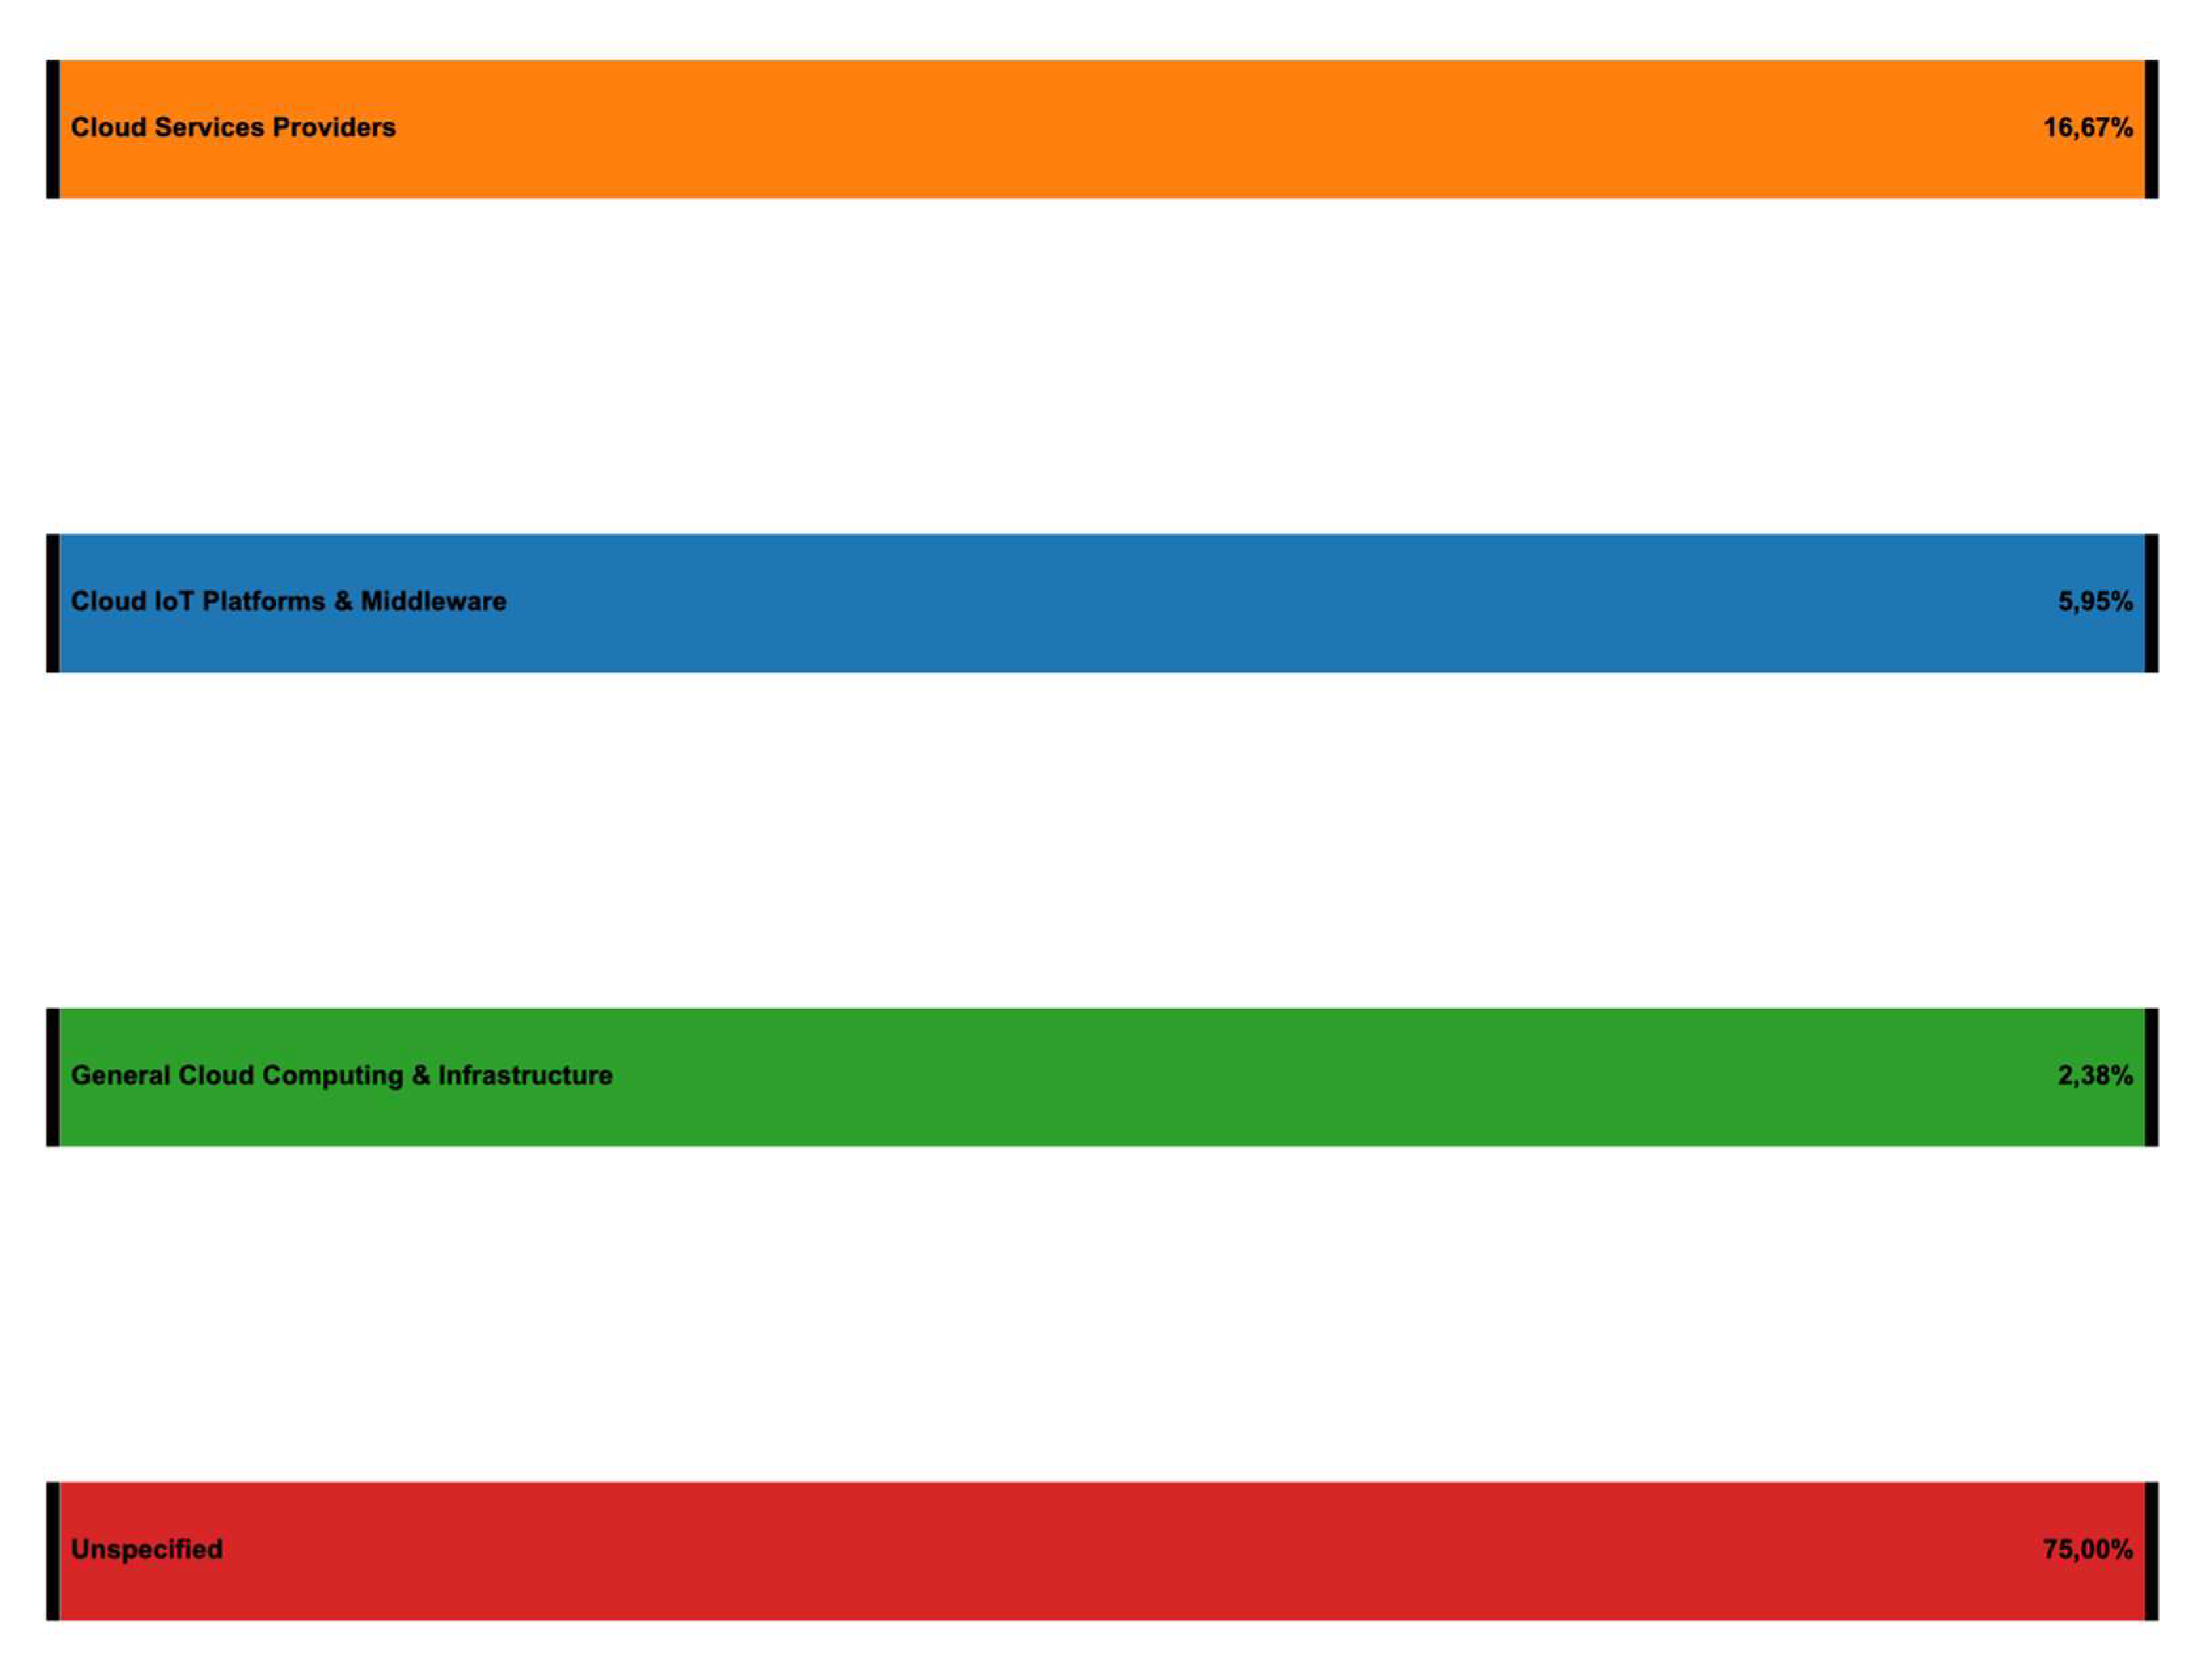
Figure 20.
Distribution of Software Used.
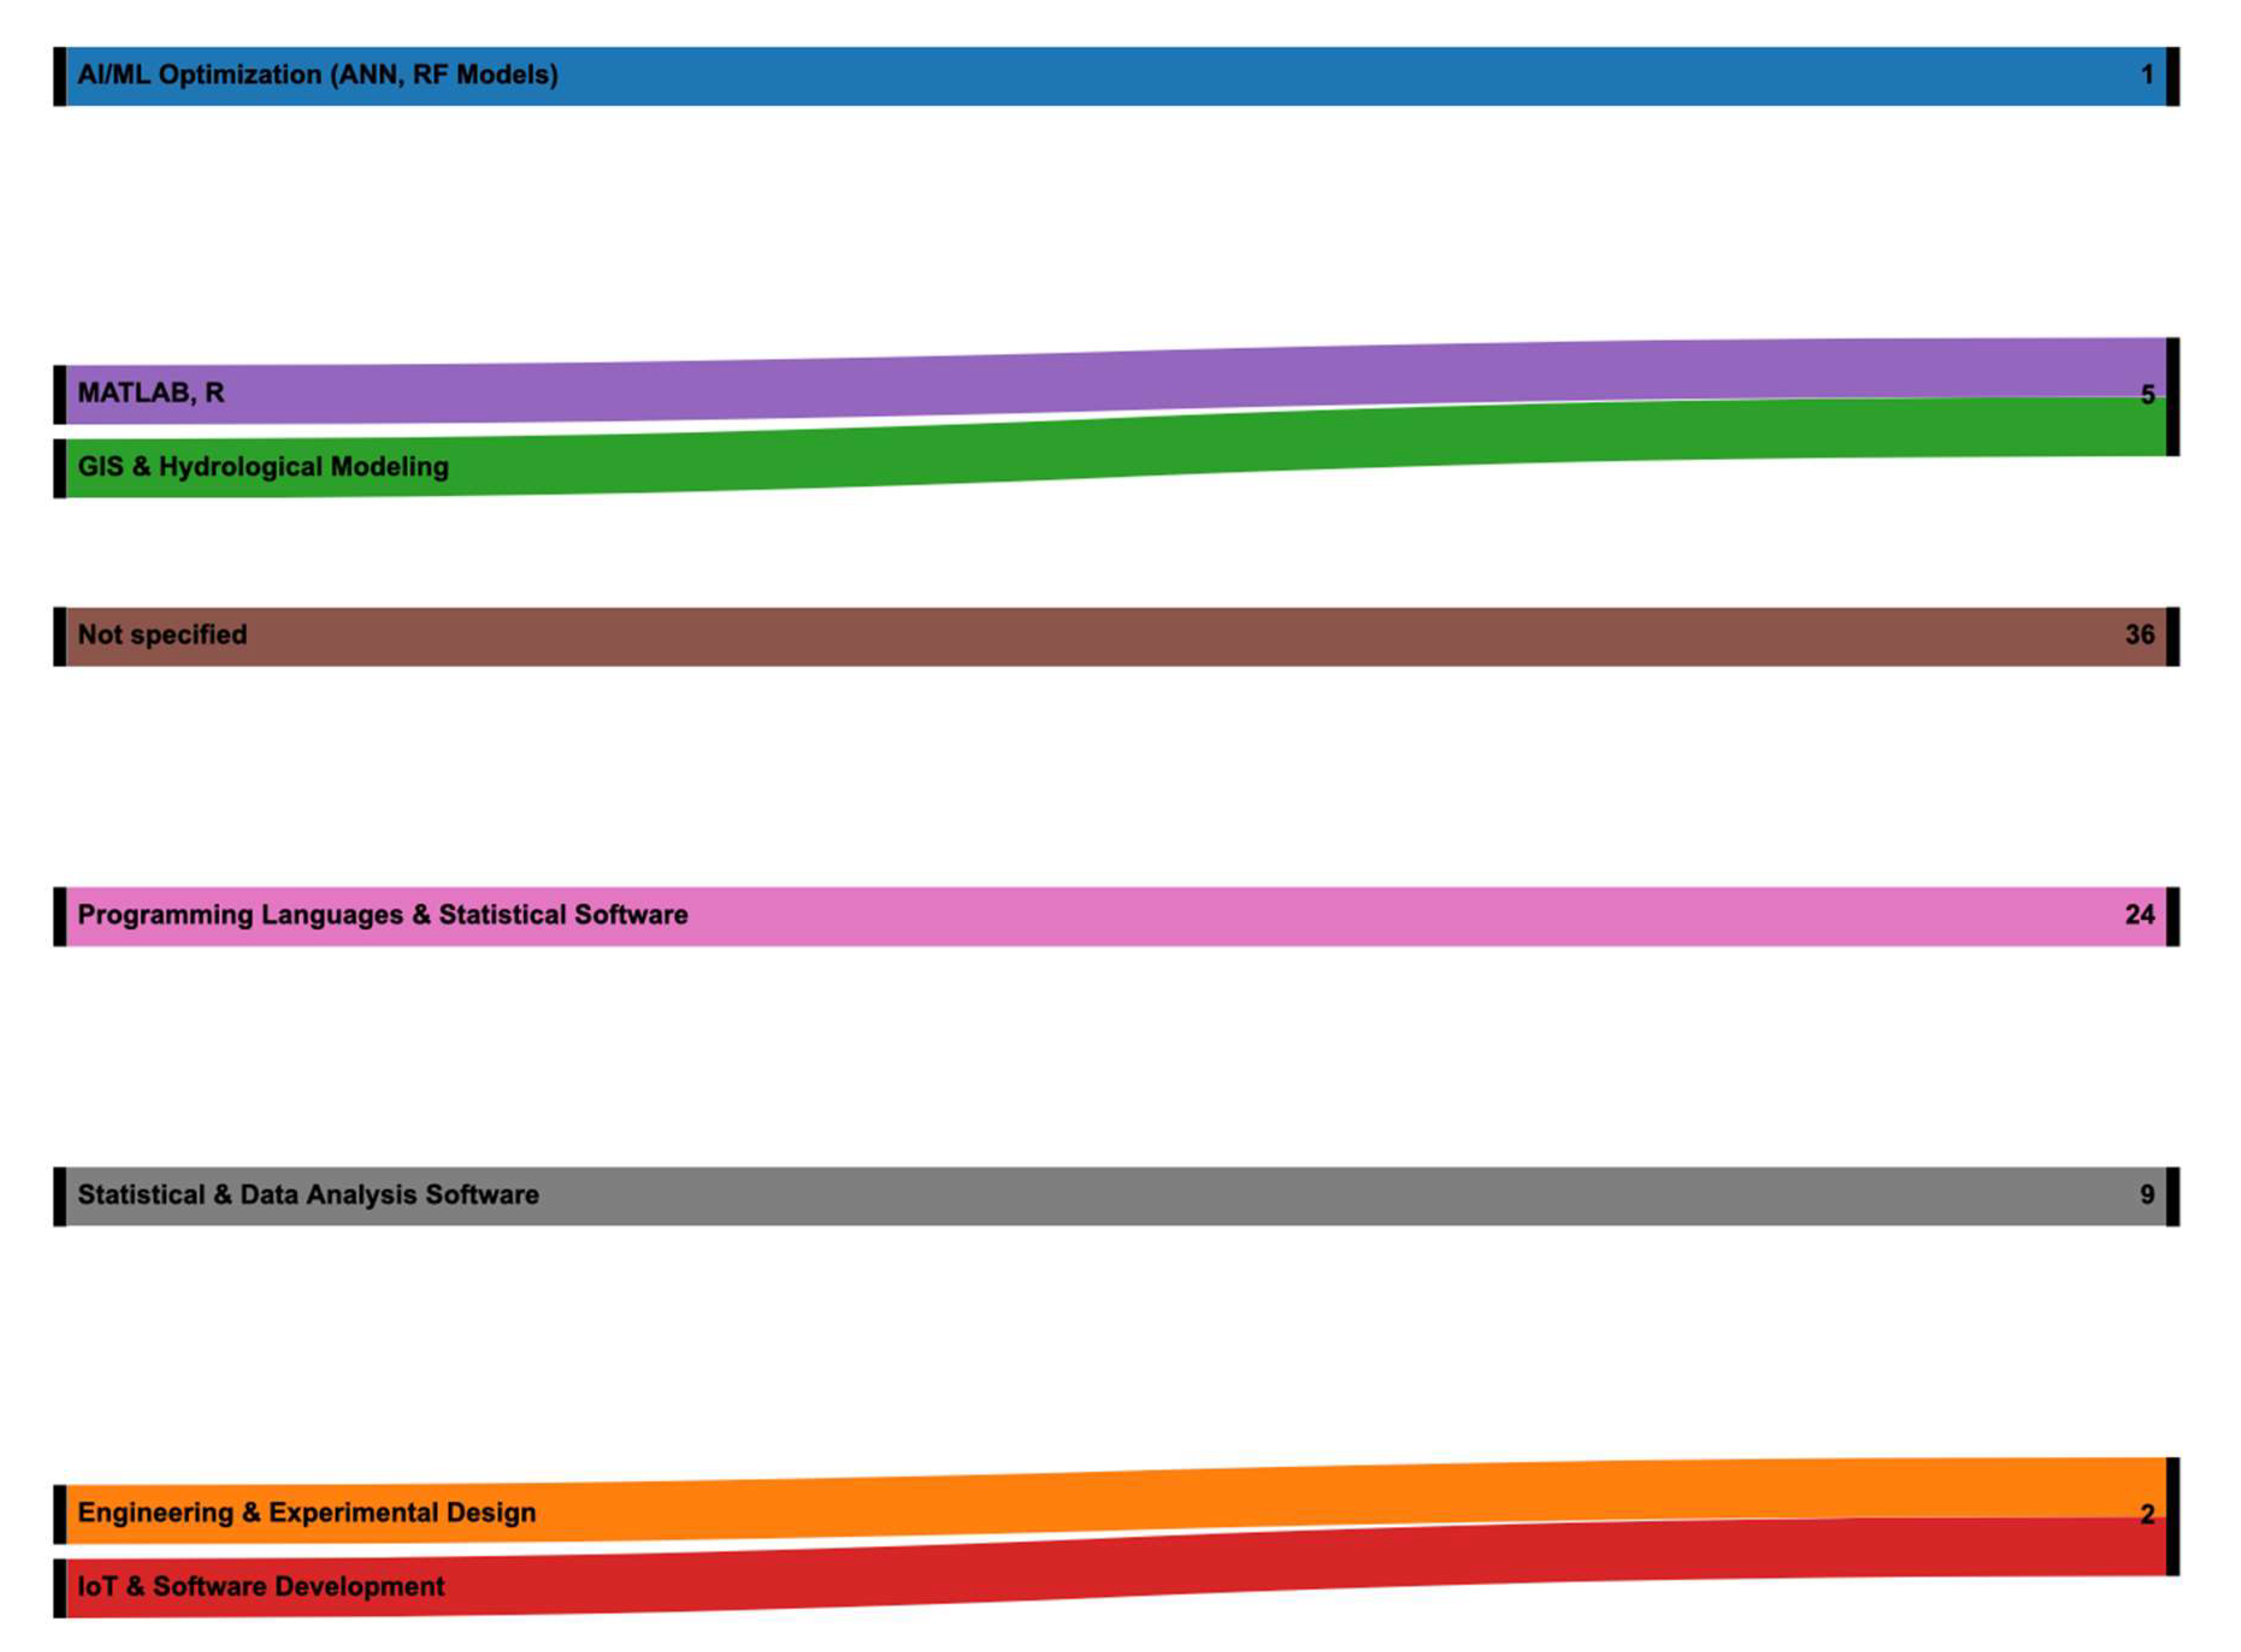
Figure 21.
Using the Newcastle-Ottawa Scale to Assess Study Quality.
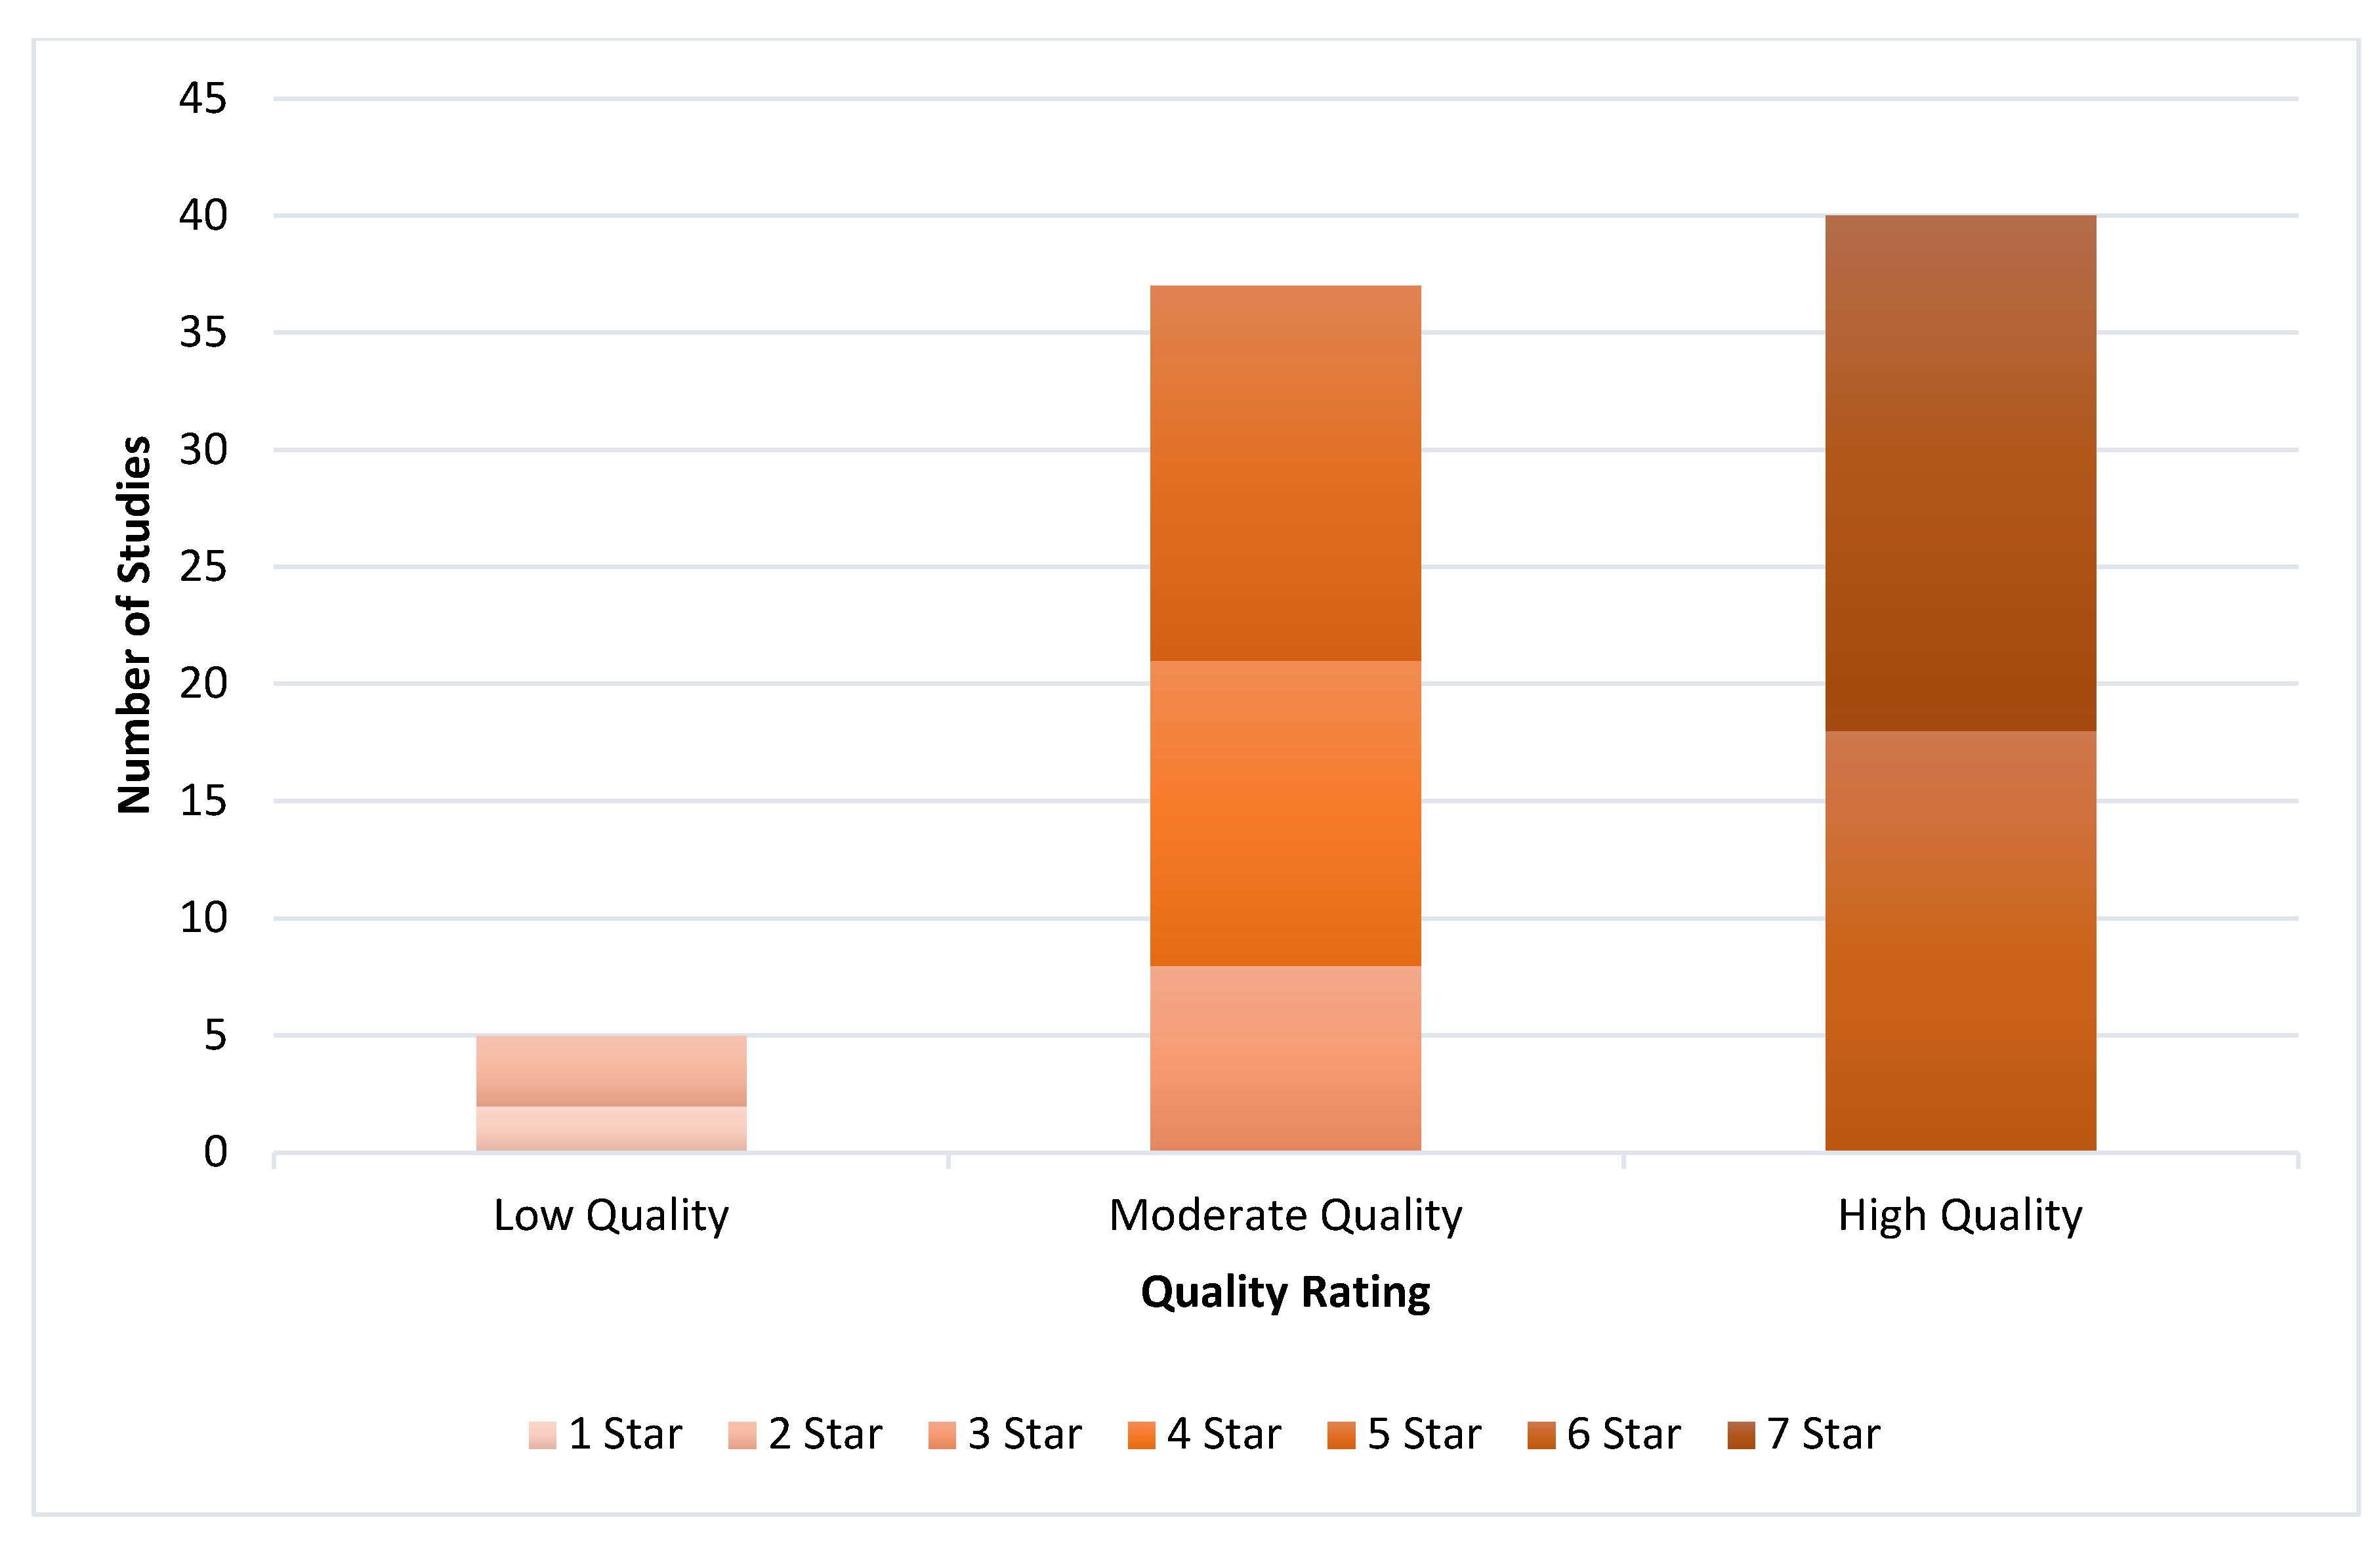
Figure 22.
Best Practices for Effective Macronutrient Management in Aquatic Ecosystems.
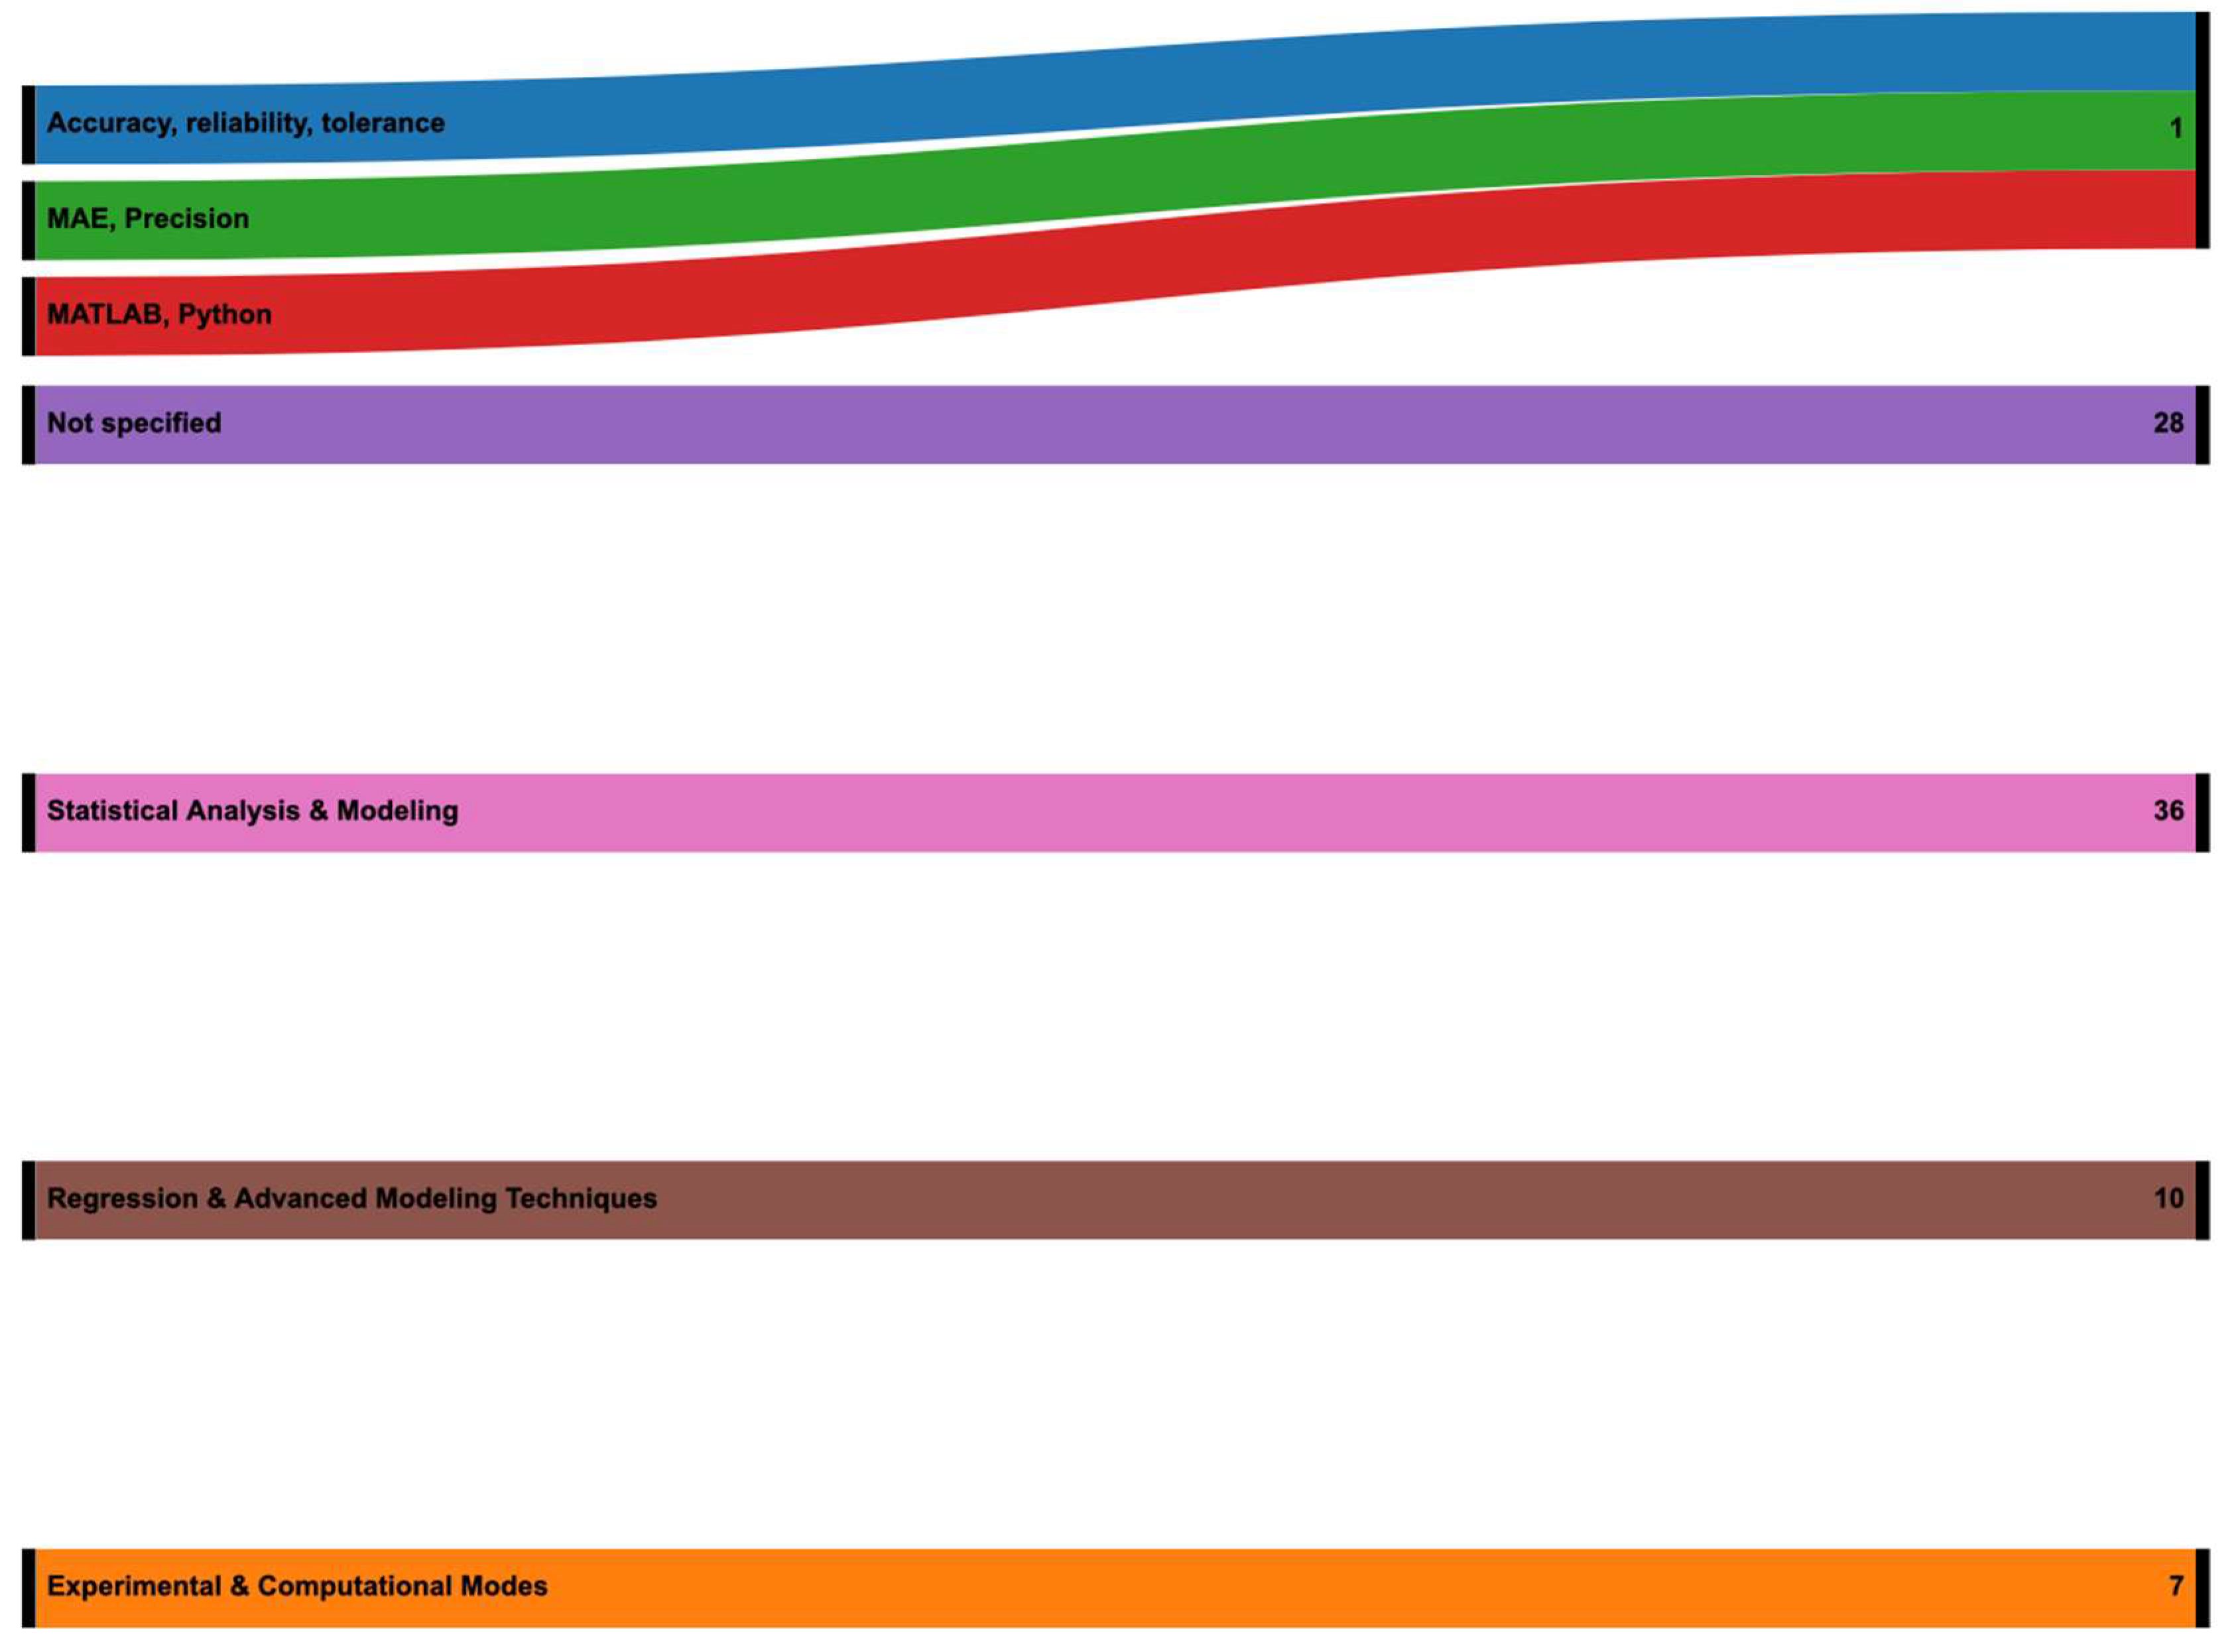
Table 1.
Comparative analysis of existing reviews and proposed systematic review.
| Ref. | Cites | Year | Contribution | Pros | Cons |
|---|---|---|---|---|---|
| Chang et al. (2015) | 146 | 2015 | Reviewed remote sensing technologies for water quality monitoring; categorized methods and platforms; provided inversion models and case | Integrative and historical approach; detailed methodological classification; supports ecosystem-based and multiscale water quality management. | Limited citation of applications in developing countries; less focus on recent AI-based models; lacks real-time operational framework. |
| Watson et al. (2016) | 646 | 2016 | Provided a comprehensive synthesis of nutrient loading, HABs, and hypoxia in Lake Erie, outlining causes, impacts, and adaptive management strategies. | Offered a multidisciplinary analysis across ecology, climatology, and nutrient modeling; highly relevant for policymakers addressing eutrophication. | Region-specific (Lake Erie); challenges in generalizing findings to other aquatic systems. |
| Glibert et al. (2018) | 99 | 2018 | Synthesized almost two decades of global research on harmful algal blooms (HABs), emphasizing ecological drivers, international case studies, and emerging trends through the GEOHAB program. | Comprehensive global perspective; multidisciplinary approach; foundation for future HAB research via Global HAB initiative. | Limited focus on freshwater HABs; some regional disparities in data coverage. |
| Wurtsbaugh et al. (2019) | 986 | 2019 | Provides a broad review of eutrophication impacts, nutrient sources, and algal blooms from freshwater to marine systems, stresses dual nutrient control. | Comprehensive and interdisciplinary; covers freshwater to marine systems; supports policy and management decisions. | General in scope; lacks primary data or modeling; geographic focus mainly on North America and Europe. |
| Richa et al. (2021) | 27 | 2021 | Reviewed the integration of ion-selective electrodes and IoT technologies for nutrient monitoring in hydroponic systems. Focused on sensor performance, ion sensitivity, system calibration, and automation. | Demonstrated the potential of ISEs for real-time monitoring, emphasizing PVC-membrane sensor advantages, IoT-enabled automation, and support for sustainable agriculture | Limited micronutrient sensor development. |
| Akinnawo. (2023) | 264 | 2023 | Reviewed causes, effects, and mitigation of eutrophication; assessed pollutant removal efficiencies, material performance, and advanced technologies like Nano filtration and electrocoagulation. | Provided a comprehensive and comparative review incorporating real-world performance data and integrating multidisciplinary mitigation strategies | Highlighted high technical complexity, limited scalability in developing regions, and the lack of a unified framework for selecting mitigation techniques |
| Sharma et al. (2024) | 5 | 2024 | Conducted a review on AI and IoT applications in plant growth monitoring, covering climatic factors, sensor technologies, data processing, and emerging tools like block chain and robotics. | Integrated a wide range of technologies and case studies, identifying key AI and IoT tools and their agricultural relevance, aiding in the design of intelligent monitoring systems | Lacks original empirical data or field validation. |
| Sguanci et al. (2024) | 8 | 2024 | Reviewed how IoT technologies support nutritional management for patients with chronic neurological cognitive impairments, identifying key applications in monitoring, intervention, and education. | Highlights promising IoT innovations for remote nutritional care, provides a roadmap for future research, and offers insights for healthcare providers. | IoT solutions are in early development, with a lack of standardization and most studies based on small samples and Western contexts |
| Lan et al. (2024) | 31 | 2024 | Provided a comprehensive review of HABs, linking causes to eutrophication from agricultural and urban sources, and evaluating monitoring and treatment methods for effectiveness and sustainability | Offers an integrated view of HABs’ causes and responses, with a detailed analysis of global patterns and highlights technological advancements in monitoring and mitigation | Lacks new empirical data or modeling, with generalizations that may overlook regional variability and a descriptive approach without deep comparative analysis of interventions. |
| Bai et al. (2025) | 2 | 2024 | Conducted a meta-analysis on 115 studies to evaluate nitrogen and phosphorus removal efficiency in ecological ditches, analyzing factors like plant type, materials, temperature, and hydraulic retention time. | Offers a comprehensive synthesis across multiple variables and vegetation setups, useful for designing agricultural pollution mitigation strategies | Limited geographic diversity (mostly from China), lacks real-time or operational field-testing data, and does not fully address potential variability due to local climate or soil. |
| Proposed systematic review | Reviews current applications of Internet of Things (IoT) technologies in monitoring macronutrients (nitrogen, phosphorus, potassium) in agricultural and environmental systems. | Identifies technological advancements, integration potential with real-time data analytics, and enhanced precision in nutrient monitoring and management. | Limited scalability in rural or underdeveloped regions, concerns over data privacy, and high initial costs for deployment and maintenance of IoT infrastructure. | ||
Table 2.
Proposed Inclusion and Exclusion Criteria.
| Criteria | Inclusion | Exclusion |
|---|---|---|
| Topic | Research papers focusing on real-time monitoring of macronutrients (Carbon, Nitrogen, Phosphorus) using IoT-based sensors. | Research papers not focusing on real-time monitoring of macronutrients or those studying unrelated water quality parameters. |
| Research Framework | Research articles with a clear methodology linking IoT technology to macronutrient monitoring | Articles without empirical research frameworks or relevant methodologies |
| Language | Research papers must be written in English. | Research papers published in languages other than English. |
| Period | Articles between 2015 to 2025 | Articles outside 2015 and 2025 |
Table 3.
Data source, search string and number of results found.
| Source | Search string | Results |
|---|---|---|
| Web of science | ("nutrient management" OR "nutrient removal" OR "aquatic systems") AND ("eutrophication" OR "algal bloom") AND ("phosphorus" OR "nitrogen" OR "carbon" OR "dissolved carbon") OR ("IoT" OR "Internet of Things") AND ("water quality" OR "water monitoring") | 2743 |
| Scopus | (nutrient management OR nutrient removal) AND (eutrophication OR algal bloom) AND (phosphorus OR nitrogen) AND IoT. For Google Scholar, the search included ("nutrient management" OR "nutrient removal") AND ("eutrophication" OR "algal bloom") AND ("phosphorus" OR "nitrogen") | 708 |
| Google Scholar | ("nutrient management" OR "nutrient removal") AND ("eutrophication" OR "algal bloom") AND ("phosphorus" OR "nitrogen") | 16800 |
Table 4.
Method for selection process.
| Stage | Action | Researchers |
|---|---|---|
| Initial Screening | First 80 records independently reviewed. | K, NC, OA and KP |
| Discussion of Calibration | Discussed and resolved early disagreements | K, NC, OA and KP |
| Independent Title/Abstract Screening | Remaining records screened individually | K, NC, OA and KP |
| Full Text Review | Independently checked full text articles for eligibility | K, NC, OA and KP |
| Final Consensus Meeting | Resolve conflicts through discussions | K, NC, OA and KP |
Table 5.
Fields description for the table used to collect data.
| Field | Definition |
|---|---|
| Paper ID Paper Title Citations Year |
An internal identifier assigned to each paper for organization. Full title of the study. Number of citations the study had received (at time of collection) to assess impact Publication year to identify trends over time. |
| Research Type Online repository Country of Authors Water source Investigated water aspect Macronutrients Sensor Microcontroller Connection type Cloud used Software used Software used Model evaluation metrics Accuracy Key findings IEEE Reference Format Link |
Categorization as a Journal Paper, Conference Paper, Book Chapter, Dissertation, or Thesis. Source database used to retrieve the study (Google Scholar, SCOPUS, or Web of Science). Country or countries affiliated with the authors, for geographical trend analysis. Specific water body or source investigated (e.g., rivers, lakes, wastewater). The aspect of water quality that was the focus (e.g., nutrient concentration, eutrophication monitoring). The aspect of water quality that was the focus (e.g., nutrient concentration, eutrophication monitoring). Types of sensors or sensing technology applied Type of microcontroller used Communication protocols employed (e.g., Wi-Fi) Whether and which cloud platforms were utilized for data storage or processing (e.g., AWS, Azure, Google Cloud). Any software tools mentioned for data analysis, visualization, or system development. Any software tools mentioned for data analysis, visualization, or system development. Metrics used to evaluate predictive or monitoring models (e.g., RMSE, R², MAE). Reported accuracy values associated with the models Major conclusions or innovations reported by the study Complete reference citation for standardized referencing Direct access link to the paper or its repository record |
Table 6.
Method for effect measures.
| Outcome | Measure used | Purpose |
|---|---|---|
| Sensor accuracy | Percentage (%) | To show detection performance |
| Technology comparison | Visual arts, counts | To compare commonly used tools |
| System responsiveness | Time recorded | To show how fast sensors respond to water change |
| Challenges reported | Frequency count | To identify technically recurring issues |
Table 7.
Eligibility for Synthesis.
| Study ID | IoT Application | Environment (Agriculture/Aquatic | Nutrient focus | Outcome Reported | Included for synthesis |
|---|---|---|---|---|---|
| 1 |
Smart nutrient Monitoring |
Agriculture |
Nitrogen, Phosphorus |
Improved detection accuracy | Yes |
| 2 |
Wireless sensor network for water quality |
Aquatic |
Nitrogen |
Real-time monitoring data |
Yes |
| 3 | Laboratory prototype only |
Laboratory only (Excluded) |
Phosphorus | No field deployment reported | No |
Table 8.
Table to explore Heterogeneity.
| Subgroup Criteria | Findings | Observed differences |
|---|---|---|
| Environment Type | Aquatic systems favored sensor accuracy in nutrient detection | Agricultural setups showed more variation due to soil interference |
| Sensor Type | Optical sensors performed better in clear water environments | Electrochemical sensors had more variability in muddy or low-flow conditions |
| Nutrient Type | Nitrogen monitoring was most frequently studied | Carbon monitoring was less consistent in method and outcomes |
Table 9.
Certainty Assessment Results for Collected Literature on IoT in Macronutrient Monitoring.
| Ref. | QA1 | QA2 | QA3 | QA4 | QA5 | Total | % grading |
|---|---|---|---|---|---|---|---|
| Paerl et al., 2016, Bai et al., 2025, Strokal et al., 2015, Wurtsbaugh et al., 2019 | 1 | 1 | 1 | 1 | 1 | 5 | 100 |
| Martínez et al., 2020 | 1 | 1 | 0.5 | 1 | 0.5 | 4 | 80 |
| Park et al., 2020 | 1 | 0.5 | 0.5 | 1 | 0.5 | 3.5 | 70 |
| Mielcarek et al., 2023 | 0.5 | 0 | 0.5 | 0.5 | 0 | 1.5 | 30 |
Table 10.
A summary of the research's development over time, based on the publication dates of each study.
Table 10.
A summary of the research's development over time, based on the publication dates of each study.
| Year of Publications | Journal Article | Book Chapter |
|---|---|---|
| 2015 | 7 | 0 |
| 2016 | 6 | 0 |
| 2017 | 15 | 0 |
| 2018 | 2 | 0 |
| 2019 | 7 | 0 |
| 2020 | 9 | 0 |
| 2021 | 8 | 2 |
| 2022 | 4 | 2 |
| 2023 | 11 | 0 |
| 2024 | 5 | 0 |
| 2025 | 4 | 0 |
Disclaimer/Publisher’s Note: The statements, opinions and data contained in all publications are solely those of the individual author(s) and contributor(s) and not of MDPI and/or the editor(s). MDPI and/or the editor(s) disclaim responsibility for any injury to people or property resulting from any ideas, methods, instructions or products referred to in the content. |
© 2025 by the authors. Licensee MDPI, Basel, Switzerland. This article is an open access article distributed under the terms and conditions of the Creative Commons Attribution (CC BY) license (http://creativecommons.org/licenses/by/4.0/).
Copyright: This open access article is published under a Creative Commons CC BY 4.0 license, which permit the free download, distribution, and reuse, provided that the author and preprint are cited in any reuse.


