
Submitted:
02 July 2024
Posted:
03 July 2024
You are already at the latest version
Abstract
AbstractLarge numbers of urban lakes are facing issues related to cyanobacteria, commonly known as blue-green algae, resulting in significant threats to humans and animal health due to their production of microtoxins and Anatoxin-A. These toxins induce acute effects including gastrointestinal distress, and respiratory problems, underscoring the need to protect urban lakes to safeguard community health and ecosystem well-being. A comprehensive monitoring program is a critical step to address cyanobacteria-related issues. Monitoring results of dissolved phosphorous, nitrates(N), Total Kjeldahl Nitrogen (TKN), total phosphorous (TP), TSS, and Escherichia coli (E. coli) concentrations, are used to understand the importance of different pathways events during dry conditions (no prior rainfall) and wet events (rainfall during or proceeding monitoring events) plus a microbial source tracking procedure, to understand impacts on growth characteristics of cyanobacteria and microtoxins. The Mann-Kendall Trend Test is used to characterize trends of various parameters (using transitions of ‘wet’ and ‘dry’ to the Lake and within the Lake), to identify the impact of various management strategies and/or the impact of various sources from overland land uses for a) wet events to the Lake, b) dry events to the Lake, c) wet events in the Lake, and d) dry events within the Lake. Microbial source tracking methods are used along the shoreline of Fairy Lake to interpret elevated levels of fecal pollution and E. coli bacteria in water samples, aiding in the identification of pollution sources. Blue-green algae have been observed at least once each year from 2018 to 2023. Microtoxins and Anatoxin-A were present in nine samples with a maximum of 1.72 mg/L and 0.02 mg/L, respectively. Frequent beach closures have occurred every year, raising public concerns regarding both ecological and recreational aspects for Fairy Lake.
Keywords:
cyanobacteria
; blue-green algae
; algal blooms
; urban lakes
; Fairy Lake
; microtoxins
1.0. Introduction
Freshwater lakes are vital for human sustenance, supporting various economic activities and providing recreational opportunities. However, the presence of cyanobacteria (a.k.a blue-green algae or BGA) is increasingly threatening water quality and public health due to toxins they produce. BGA blooms not only impact drinking water safety but also disrupt the ecosystems. Understanding the factors driving the proliferation of BGAs is crucial for effective freshwater resource management.
The challenges of BGA microorganisms are their potential to pose risks to public health by causing skin irritations, gastrointestinal problems, and even acute liver and neurological disorders due to their toxins. Domestic animals such as cattle, horses, sheep, dogs, and cats are susceptible to cyanobacterial toxins if they drink contaminated water or ingest cyanobacteria while swimming or playing near affected water bodies. Livestock deaths due to cyanobacterial poisoning have been reported worldwide, particularly in areas where Harmful Algal Blooms (HABs) are prevalent. In the US alone, in 2021, a total of 2715 animal illnesses which include 48 domestic pets, 25 Livestock, and 2642 wildlife where 2000 bats died from harmful algal bloom events [1]. Aquatic species are also affected by cyanobacterial toxicity which can lead to a reduction in aquatic ecosystem biodiversity. Further, certain cyanobacteria species produce compounds that impart unpleasant tastes and odors to water, negatively impacting perceptions of water quality and potentially requiring additional treatment processes including microcystins and saxitoxins. BGA blooms can disrupt nature-based tourism and undermine both the intrinsic and commercial values associated with aquatic environments, with shallow lakes being highly susceptible to human impacts, with cyanobacteria frequently becoming the predominant species in the phytoplankton community of eutrophic shallow lakes, particularly in warmer climates [2,3,4].
BGA, also known as cyanobacteria, thrive in freshwater, saltwater, and brackish environments. They can multiply rapidly in nutrient-rich lakes, especially in warm, calm conditions, forming blooms that turn the water green and may create surface scum. While most BGA species are not harmful, some produce toxins like microcystin, which can be released when cells die or rupture. Exposure to these toxins, typically through contaminated water, can pose risks to human health, leading to HABs. Additionally, some BGA toxins can accumulate in fish, advising caution in consuming fish from areas affected by major blooms.
The increasing prevalence of BGA blooms, linked to excessive eutrophication and global warming, poses a significant challenge in freshwater management worldwide [5,6]. Algal blooms disrupt ecological balance, deplete oxygen levels, and endanger aquatic life. Moreover, BGA blooms complicate water treatment processes in drinking water reservoirs, leading to increased costs. Hence, the monitoring of BGA dynamics is essential to safeguard human health, protect the environment, and efficiently manage water resources amid changing environmental conditions [7].
Nutrients serve as essential factors for the formation of cyanobacteria blooms, with nitrogen (N) and phosphorus (P) recognized as key drivers influencing the occurrence and longevity of cyanobacteria in freshwater ecosystems [8,9]. As a result, the monitoring of nutrient levels and temperatures are crucial for understanding and predicting algal growth, and especially cyanobacterial blooms, for reasons including: a) Nutrient availability as nutrients such as N and P, are primary drivers if N and/or P are in limited quantities. High nutrient levels will trigger rapid cyanobacterial proliferation, leading to HABs which facilitate early detection of eutrophication and opportunities for implementation of management strategies to mitigate its effects; b) Cyanobacteria may produce toxins such as microcystins and, most importantly, nutrient monitoring helps predict toxin production by identifying conditions conducive to cyanobacterial growth and bloom formation; c)Temperature plays a critical role in algal growth rates and bloom dynamics. Warmer temperatures accelerate algal growth providing insights into bloom events; and d) Monitoring nutrient levels and temperature enables authorities to implement timely interventions to diminish or mitigate HABs (thereby protecting public health), provides insights into the complex dynamics of algal growth, including cyanobacterial blooms, and for implementing effective management strategies to safeguard water resources and human well-being.
Predicting the timing, severity, duration, and health implications of these blooms is complex [10,11] In Canada, a seasonal Maximum Acceptable Concentration (MAC) of 1.5 µg/L has been established for total microcystins in drinking water [12]. Toxins produced by freshwater cyanobacteria pose health risks, with Health Canada recommending a maximum concentration of 10 µg/L for total microcystins in waters used for primary contact activities [10].
Canada, with more than 900,000 lakes [13], holds the global record for lake abundance in a country. These lakes fulfill essential needs including drinking water, crop irrigation, fishing, swimming, and boating. With more than 246 urban lakes in Canada already experiencing algal blooms [14] plus many more potentially affected due to anthropogenic inputs and climate change, the full impact of climate change on cyanobacteria growth remains uncertain. Climate change, intensified farming, and urban and industrial expansion will lead to pollutants entering aquatic habitats, further endangering lake health and the crucial ecosystem services they provide [13]. Nieto et al. [15] revealed a rising trend in confirmed cyanobacteria-dominated algal blooms, documenting various waterbodies in Ontario from 1994 to 2019. Further, in research described herein, nutrient levels and temperature as monitored in Fairy Lake (a shallow urban lake) are shown to be crucial for understanding and predicting algal growth. As described in the subsections following, the monitored results are described along with a microbial source tracking procedure to assess the presence of human sewage contamination, as well as the entry of human fecal contamination into the Lake from tributaries and storm water outfalls, providing important insights.
(ii) Methodology for Sampling and Consideration of Nutrient Pathways in Lakes
Sampling methodology plays a crucial role in accurately assessing nutrient dynamics within a lake ecosystem. This section outlines a comprehensive approach for sampling, considering both dry and wet sampling techniques, by addressing the pathways through which nutrients are transported within the lake. Sampling methodology encompasses the sampling techniques, consideration of nutrient pathways, source input and influencing processes, and internal processes within a lake. A systematic approach to sampling, considering both dry and wet sampling techniques, coupled with an understanding of nutrient pathways and influencing processes, is essential for assessing and managing cyanobacterial blooms in lakes. By integrating field observations, laboratory analyses, and modeling studies, researchers can gain valuable insights into nutrient dynamics and cyanobacterial ecology, informing evidence-based decision-making for lake conservation and restoration efforts.
Section III: Dynamics of Nutrient Levels and Lake Behavior
Understanding the intricate balance of nutrient levels and the behavior of a lake over time is crucial in determining the susceptibility of cyanobacteria growth due to: Nutrient Dynamics, Lake Behavior and Stratification and Processes of Entry into the Lake. Overall, grasping the intricacies of nutrient dynamics, lake behavior, and the processes driving nutrient entry are imperative for comprehensively understanding cyanobacterial dynamics. An understanding of this not only elucidates the mechanisms governing cyanobacterial growth but also informs the development of effective sampling strategies necessary for monitoring and managing waterbodies susceptible to harmful algal blooms as illustrated in Figure 1, the sequence that will be describing incrementally in the following section of the paper.
2.0. Methodology
Water quality monitoring stations and an array of sampling events encompassing over two years with both wet and dry conditions, are key. These results allow assessment of pathways (e.g. overland or migration through soils profile). Water temperature at two Temperature Mooring (TMA and TMB) stations were also collected and a microbial source-tracking approach is used to characterize the presence of human sewage contamination at the beach and nearby areas, as well as the entry of human fecal contamination into the Lake from tributaries and storm water outfalls.
2.1. Description of Fairy Lake Site
2.1.1. Characteristics of Fairy Lake
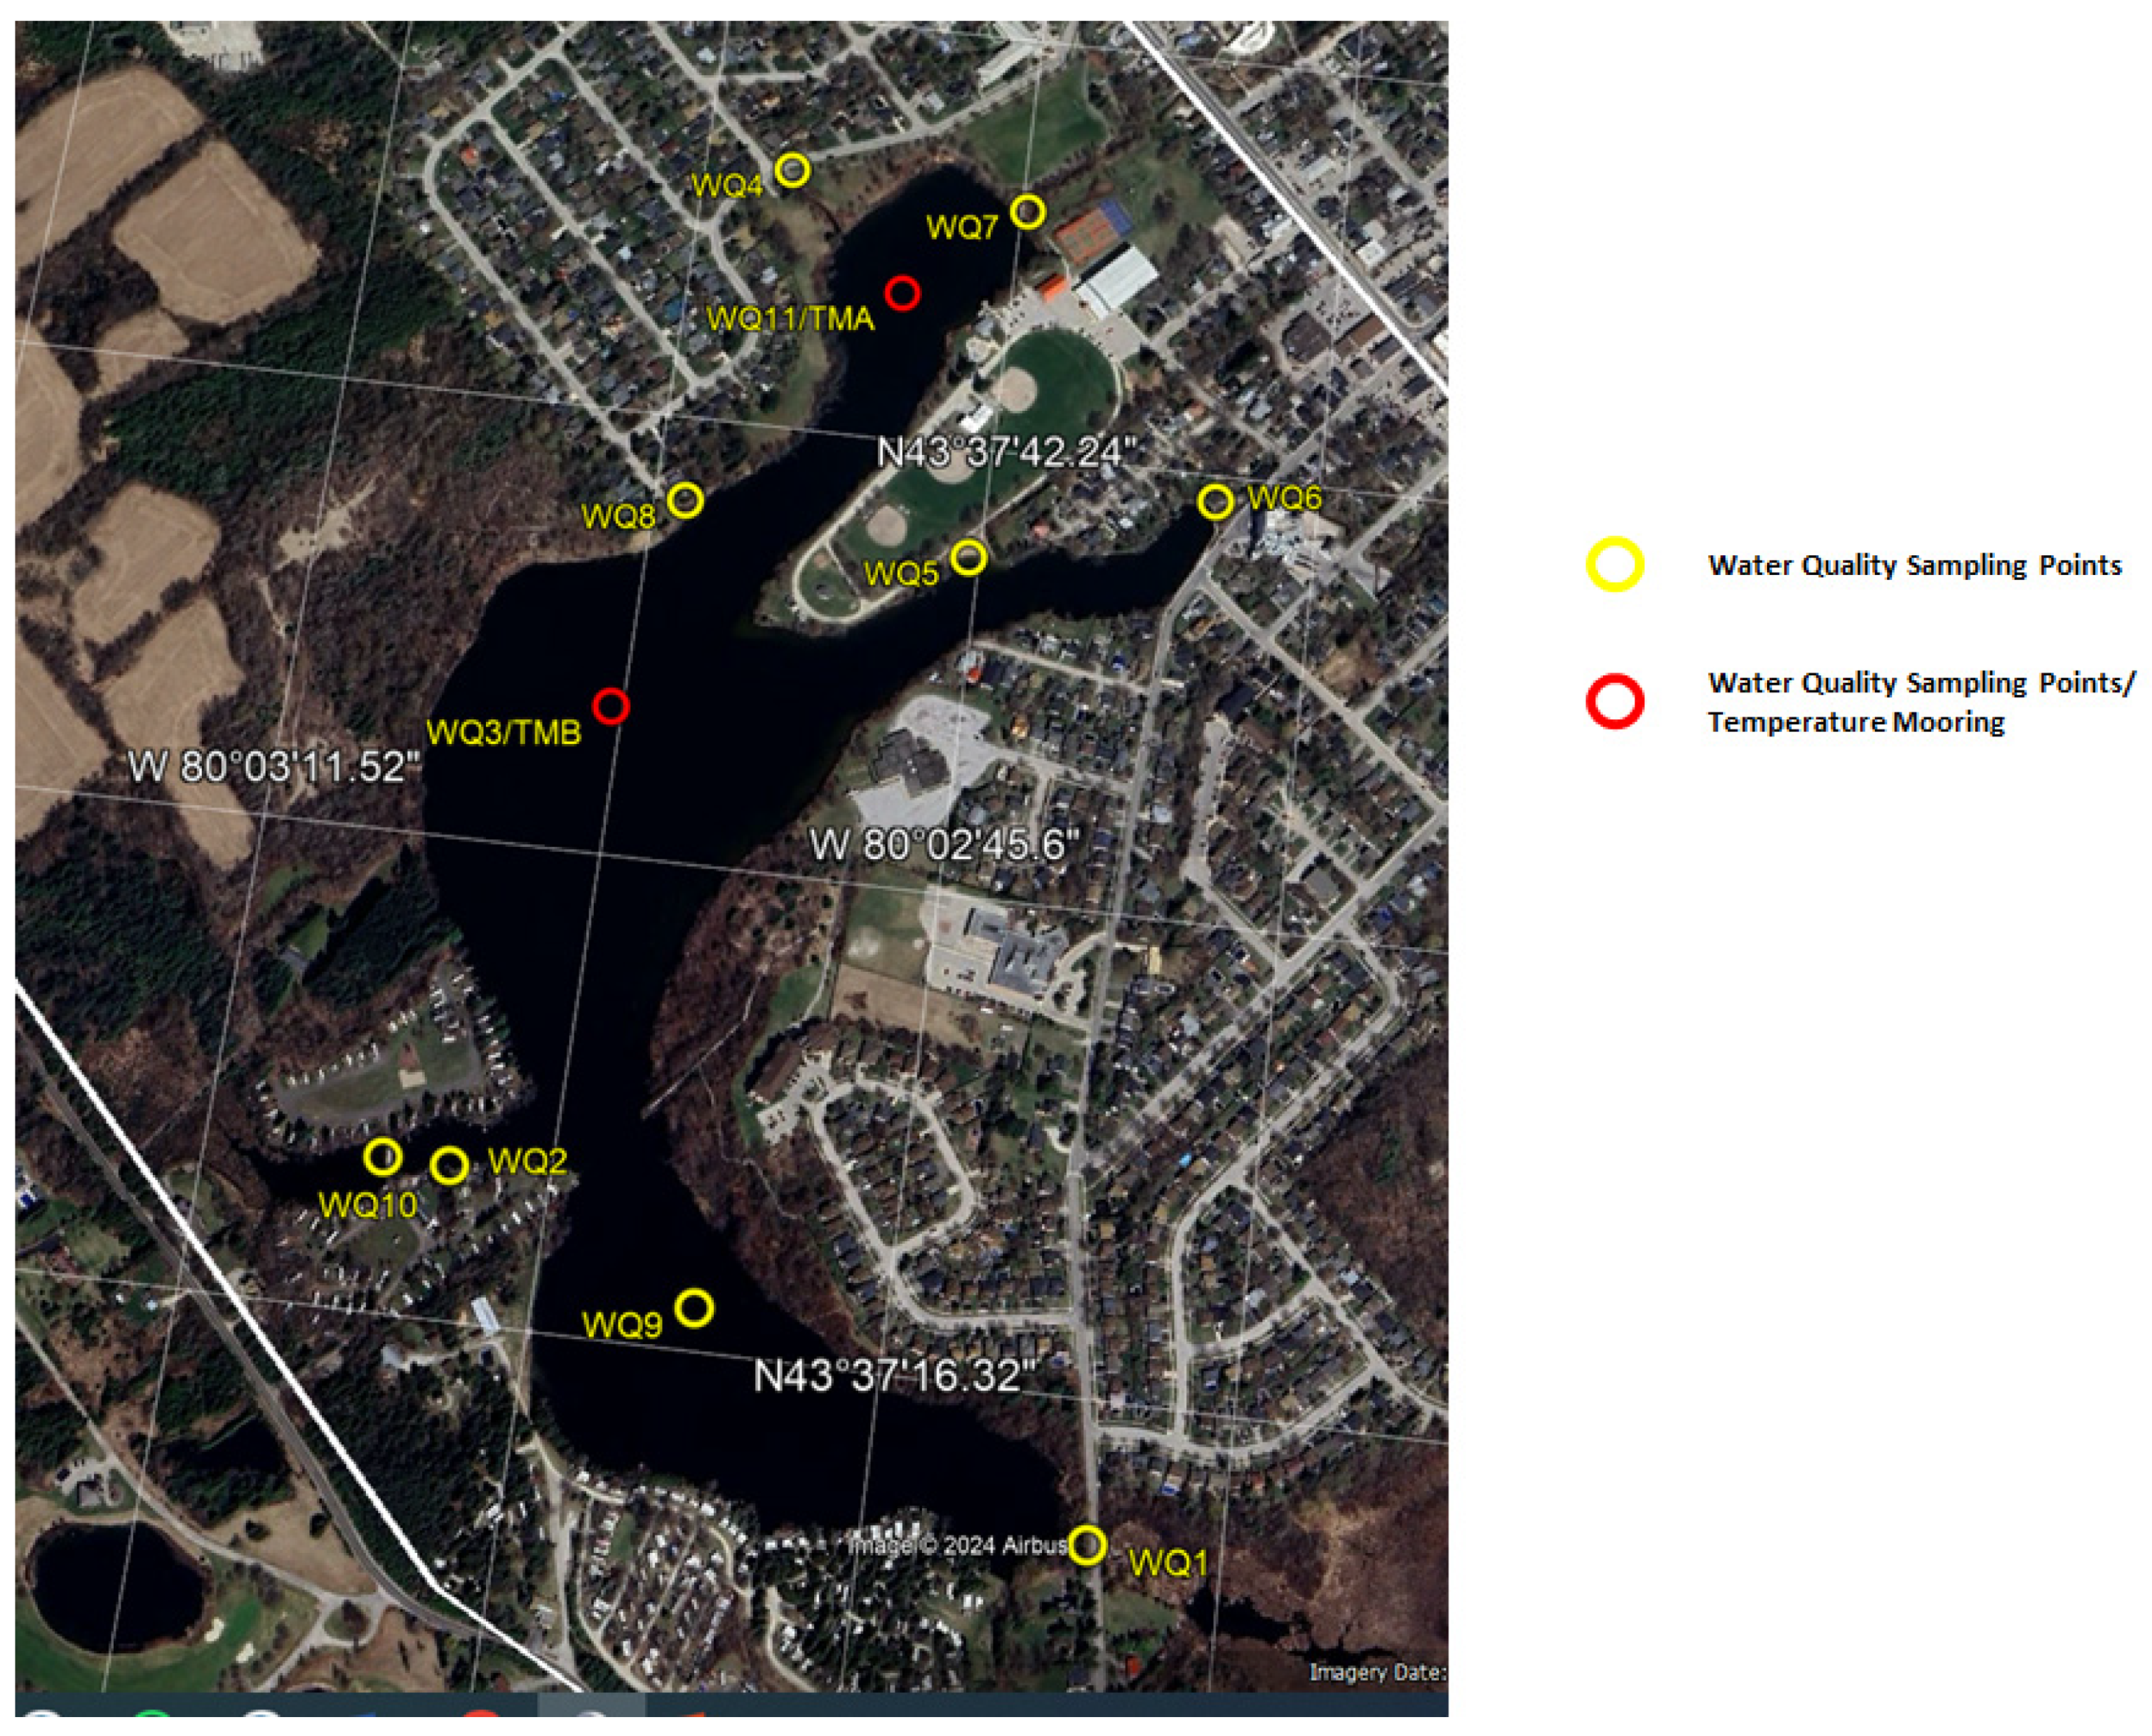
Fairy Lake is a man-made lake ~ 26 hectares in size located in Acton near the headwaters of Black Creek adjacent to Prospect Park and Rotary Park, and surrounded by urban lands, rural lands, campgrounds/trailer parks, and natural open spaces as shown in Figure 1. The Fairy Lake dam is located at the northeast arm of the Lake. Black Creek flows eastward below the dam and discharges to the Credit River system. Outlet flows from the Lake are controlled by a series of stop-logs that are adjusted to regulate the elevation of Fairy Lake, currently set at an elevation of 345 m above sea level (ASL) [16]. Fairy Lake is part of a designated Provincially Significant Wetland (PSW) and the surrounding area also includes additional PSWs southwest of the Lake [17].
A bathymetric survey conducted on Fairy Lake revealed the perimeter of the Lake measures 4.6km, where the southern end of the Lake has depths of less than 2 m, while deeper waters are confined to small areas within the main basin. The average depth of the Lake is 1 meter, with a maximum depth of 7 m, resulting in a total volume of 400,656 m3 [18].
Fairy Lake exhibits a shallow, alkaline character with a productive ecosystem dominated by aquatic plants. Its water quality appears to be influenced by various external and internal factors, including direct discharge from upstream sources, agricultural runoff, storm sewer discharges, internal nutrient dynamics such as nutrient release from sediments and organic matter remineralization, plus input of fecal matter from waterfowl and runoff and the surrounding wetland environment [18]. Over the past two years, occurrences of BGA have been observed in the Lake, raising public concerns regarding both ecological and recreational aspects.
Figure 2.
Aerial Photo of Fairy Lake and the Surrounding Regime including Water Quality Sampling Locations and Temperature Mooring locations from Google Earth.
Figure 2.
Aerial Photo of Fairy Lake and the Surrounding Regime including Water Quality Sampling Locations and Temperature Mooring locations from Google Earth.
E. coli and BGA can be linked in several ways, primarily through water contamination and ecosystem interactions: nutrient pollution, particularly from agricultural runoff or untreated sewage, may be contributing to both E. coli and cyanobacterial growth. Excessive N and P nutrients can fuel cyanobacterial blooms, while E. coli levels may increase due to fecal matter contributions. Thus, nutrient pollution can create conditions favorable for the proliferation of both organisms in aquatic ecosystems. Overall, while E. coli and cyanobacteria are distinct organisms with different ecological roles, they can be linked through shared environmental conditions, water pollution, and associated health risks; water bodies contaminated with fecal matter containing E. coli may provide conditions conducive to cyanobacterial growth if nutrient levels are also elevated, leading to potential co-occurrence of both organisms.
2.1.2. Water Quality Stations
In this undertaking, eleven water quality monitoring locations were selected (shown in Figure 1) as described below in Table 1:
Out of these eleven locations, four (WQ3, WQ5, WQ9 and WQ11) are in the Lake, six (WQ1 WQ2, WQ4, WQ7, WQ8 and WQ10) are contributing water to the Lake, and one WQ6 at the outlet. Air and water temperature were monitored at 15-minute intervals at WQ3 and WQ11. Sixteen monitoring events occurred during the span of three years by UoG and five by LGL Limited. Monitoring Points Events Conditions are described in Table 2.
LGL Limited [19] collected water quality samples from these locations simultaneously in five of the monitoring events i.e. 2021/08/03, 2021/09/22, 2022/01/24, 2022/02/17 and 2022/04/20, with three events in dry periods while two were in wet periods. The results of these events are included in the statistical and trend analyses, resulting in 21 monitoring events in total.
3.0. Results
The results are divided into two categories, (i) the monitoring points feeding the water to the Lake (WQ1 WQ2, WQ4, WQ7, WQ8 and WQ10) and (ii) the monitoring points which are in the Lake and at the outlet of Lake (WQ3, WQ5, WQ9, WQ11 and WQ6). Twenty-one (21) monitoring events occurred. The following analyses includes those events, with one-half the detection limit when non-detect.
Detailed monitoring results are presented in supplementary Tables S1 and S2. Two sets of graphs are presented below for all the monitoring locaction (feeding the Lake, in the Lake and at Lake outlet). The first six graphs show the concentartions for both wet and dry events (orange for wet conditions and green for dry conditions) along with the precipiation to characteruze rain event or dry event impact. They are presented in the Supplemenry data S3 and box diagrams to view the distribution and magniture of concenrarion.
3.1. Discussion of Each Monitoring Location Parameter-Wise
The exceedances of various recreational water quality guidelines are shown in Figure 3 below and briefly described in the preceding section.
3.1.1. Total Phosphorus
Total phosphorus (P) is recognized as one of the key drivers influencing the occurrence and longevity of cyanobacteria in freshwater ecosystem. The Recreational Water Quality guideline for total phosphors is 0.02 mg/L [20].
Monitoring Points Feeding Fairy Lake
WQ1 which feeds the southern basin of Fairy Lake, the TP exceedances were observed in sixteen samples, the maximum being 0.19 mg/L in a wet sample. It was observed in five dry samples and in ten wet samples. WQ2, a storm water outlet at the trailer park bring water to Fairy Lake, the TP exceedances were observed in 17 samples, the maximum being 0.22 mg/L in a wet sample. TP was also observed six dry and ten wet samples. WQ4, which is a storm water outlet, had eight (8) exceedances of the TP, the maximum being 0.26 mg/L. WQ7, which is Black Creek inlet, the total phosphorus exceedances were observed in fourteen samples, the maximum being 0.14 mg/L in a wet sample. TP was observed in four dry and ten wet samples. WQ8, another storm water outlet, had eight exceedances of the TP (one dry and seven wet), the maximum being 0.19 mg/L in a wet sample on 2/17/2022. WQ10, which is the west inlet of Fairy Lake, the TP exceedances were observed in 14 samples, the maximum being 0.1 mg/L in a dry sample. TP was observed in five dry samples and in nine wet samples. Overall, there were 81 exceedances of TP from all monitoring locations in all the events.
Based on the above results, it is imperative that sources of the total phosphorus have to be identified and management practices have to be initiated to reduce the TP from the Fairy Lake catchment.
Monitoring Locations in the Lake
In WQ3 and WQ11 there were no exceedances of TP of water quality guidelines. WQ5, which is near the old beach, had only one wet sample above the WQ guideline being 0.026 mg/L. WQ6, which is the outlet of Fairy Lake, had three exceedances of the TP, the maximum being 0.11 mg/L in a wet sample on 3/17/2023. WQ9 which is the south basin of the lake had only one exceedance of the TP in a dry sample being 0.023 mg/L on 1/24/2022.
3.1.2. TSS
Elevated TSS levels can degrade aquatic habitat quality by covering substrates, reducing habitat complexity, and altering the composition of benthic communities. Fine sediments can clog interstitial spaces between substrate particles, affecting the availability of food and shelter for benthic organisms. TSS can serve as carriers for nutrients, organic matter, and contaminants in aquatic environments. Nutrients adsorbed to suspended particles can be transported within the water column and deposited in different areas of the lake, potentially contributing to nutrient enrichment and eutrophication processes.
Monitoring Points Feeding the Fairy Lake
The Recreational Water Quality (RWQ) guideline for TSS is 25.0 mg/L [20]. In WQ1, only one sample exceeded the RWQ guideline for TSS of 25 mg/L. It was in wet sample at a concentration of 370 mg/L. In WQ2, nine samples (four dry and five wet) exceeded the RWQ guideline for TSS being 250 mg/L in a wet sample. In WQ4, four samples exceeded the RWQ guideline for TSS, the maximum being 69 mg/L in a dry sample. WQ7, seven samples (five wet and two dry) have exceedances of WQ Guideline of TSS, the maximum being, 84 mg/L. WQ8. Only three samples (one dry, two wet) have exceedances of WQ Guideline of TSS, the maximum being, 160 mg/L. WQ10, only two samples (one dry, one wet) have exceedances of WQ Guideline of TSS, the maximum being, 130 mg/L. Among the monitoring points feeding Fairy Lake, there were 30 exceedances of TSS from all monitoring locations in all the events with maximum levels reaching 160 mg/L in WQ10. As high levels of TSS may affect the clearness of water in the Lake and may deposit nutrients in the bed of Lake. Overall, there were 30 exceedances of TSS from all monitoring locations in all the events.
Based on the above results, it is imperative that management practices be initiated to reduce the TSS from the Fairy Lake catchment specially for WQ-7, WQ4 and WQ10 catchments.
Monitoring Locations in the Lake
In WQ3, WQ6, WQ9, and WQ11, there were no exceedances of TSS water quality guidelines. WQ5, four samples (two wet and two dry) have exceedances of WQ Guideline of TSS, the maximum being, 160 mg/L,
3.1.3. E. coli
Exposure to recreational water contaminated with E. coli can increase the risk of gastrointestinal and skin infections. Swallowing or contact with water containing high levels of E. coli can lead to illnesses such as diarrhea, vomiting, and skin rashes. E. coli itself doesn't directly interact with blue-green algae, but their relationship can be indirectly linked through environmental factors. One indirect relationship between E. coli and blue-green algae lies in nutrient pollution. E. coli can be used as an indicator of fecal contamination in water bodies. When there's high fecal contamination, it often means there's also an abundance of nutrients like P and N, which can fuel the growth of cyanobacteria. Therefore, the presence of E. coli in water bodies can be a warning sign of potential HABs caused by cyanobacteria. The RWQ guideline for single maximum concentration for E.coli is ≤ 400 E. coli /100 m [21].
Monitoring Points Feeding Fairy Lake
In WQ1, four samples exceeded the RWQ guideline for E.coli. All were in wet samples with a maximum of 3,500 E. coli /100 mL. In WQ2, eight samples (two dry and six wet) exceeded the RWQ guideline for E.coli, the maximum being 43,000 E. coli /100 mL on 6/23/2022. WQ4 has six (6) exceedances of RWQ guideline, two in dry samples and four in wet samples with a maximum of 9,700 E. coli /100 mL. WQ7 has eleven (11) exceedances of RWQ guideline, three in dry samples and eight in wet samples with a maximum of 7,800 E. coli /100 mL. WQ8 has nine (9) exceedances of RWQ guideline, two in dry samples and seven in wet samples with a maximum of 8,600 E. coli /100 mL. In WQ10, three wet samples exceeded the RWQ guideline for E.coli, the maximum being 23,000 E. coli /100 mL.
Monitoring Locations in the Lake
In WQ3, WQ6, WQ9, and WQ11, there were no exceedances of E.coli water quality guidelines. In WQ5, three dry samples and two wet samples exceeded the Recreational Water Quality guideline for E.coli, the maximum being 3,000 E. coli /100 mL.
Overall, there were 44 exceedances of E.coli from all monitoring locations in all the events. Based on the above results, it is imperative that sources of the E.coli have to be identified and management practices have to be initiated to reduce the E.coli from the Fairy Lake catchment.
3.1.4. Nitrates
Nitrate (NO3-) is a vital nutrient for the growth of BGA. Cyanobacteria, like other photosynthetic organisms, require nutrients to thrive, and nitrate is essential. Nitrate is involved in the process of photosynthesis, which is how cyanobacteria generate energy. Cyanobacteria require a steady supply of nutrients, including nitrate, for cell division and reproduction. Nitrate availability influences the rate of cell division and overall biomass production in cyanobacterial populations. Managing nitrate levels in water bodies is essential to prevent the proliferation of cyanobacterial blooms while still providing enough nutrients to support healthy aquatic ecosystems.
For Nitrate, the Canadian Water Quality Guideline (CWQG) is 3.0 mg/L [20]. Only in WQ8, where exceeded eight times (six in wet and two in dry samples), the maximum being 4.86 mg/L on 11/23/2023. One exceedance was in 2022 and all other in 2023. The remainder of the monitoring locations outside or inside the lake have no exceedances.
3.1.5. Total Kjeldahl Nitrogen (TKN)
TKN includes both organic nitrogen and ammonia, which are important sources of nitrogen for cyanobacteria. When levels of TKN are elevated, it can lead to an increase in nitrogen availability for cyanobacteria. This excess nitrogen can fuel the growth of cyanobacterial blooms, leading to HABs. Therefore, the relationship between TKN and cyanobacteria is that elevated TKN levels can contribute to the proliferation of cyanobacterial blooms. No Ontario guideline for TKN is presently available; however, waters not influenced by excessive organic inputs typically range from 0.100 to 0.500 mg/l, Environment Canada [21], however, Rideau Valley Conservation Authority’s [22] uses a guideline of 0.500 mg/l to assess TKN within surface waters. In this analysis a TKN value of 0.500 mg/L is used.
Monitoring Points Feeding the Lake
Among the monitoring locations which are on streams or outfalls bringing water to the lake, WQ1 had twelve (12) exceedances of TKN, four in dry events and eight in wet events. In WQ2, there are twelve (12) exceedances of TKN four in dry events and eight in wet events. The maximum concentration of TKN was 2.3 mg/L in a wet event. In WQ4, there are four exceedances of TKN one in dry events and three in wet events. In WQ7, there are five exceedances of TKN one in dry events and four in wet events. The maximum concentration of TKN was 1.17 mg/L in a wet event. In WQ8, there are five (5) exceedances of TKN two in dry events and three in wet events. In WQ10, there are 11 exceedances of TKN three in dry events and eight in wet events. Across various water quality monitoring locations feeding the lake, there were a total of 54 TKN exceedances, with varying distributions between dry and wet events. The highest TKN concentration recorded was 2.3 mg/L in WQ2 during a wet event, while the lowest was 0.83 mg/L in WQ4, also during a wet event.
Monitoring Points in the Lake
At the Lake monitoring locations, several water quality assessments revealed TKN exceedances. In WQ3, there were six exceedances, with four during dry events and two during wet events, peaking at 1.13 mg/L in a wet event. WQ5 recorded four exceedances evenly distributed between dry and wet events, reaching a maximum of 0.62 mg/L in a wet event. Similarly, WQ6 documented six exceedances, with two during dry events and four during wet events, reaching a peak of 0.816 mg/L in a wet event. WQ9 observed eight exceedances, three during dry events and five during wet events, with a maximum of 1.00 mg/L in a dry event. Lastly, WQ11 had two exceedances, all during dry events, reaching a maximum concentration of 0.7 mg/L.
Overall, there has been seventy-five (75) exceedances of TKN above guidelines whereas 49 are from the monitoring points feeding the lake and 26 from monitoring points in the lake. WQ-1 flow is coming through the wetland and that may be causing elevated levels of TKN. WQ-2, WQ-4 and WQ-8 are storm water outlets. Based on the above results, it is imperative that sources of the TKN be identified and management practices initiated to reduce the TKN from the Fairy Lake catchment.
3.2. Statistical Results
3.4. Cyanobacteria and Microcystin
Health Canada recommends a maximum microcystin concentration of 10 μg/L for recreational waters to protect against ingestion. Halton Region Public Health visually monitors for BGA at the public beach from late June/early July onward as part of routine beach monitoring. If BGA is seen, staff refrain from entering the water for safety. Daily visual monitoring continues until BGA is no longer observed, then water samples are collected and analyzed for microcystin. Since 2019, HABs have been observed near the boathouse and public beach, prompting the posting of warning signs to alert the public. Blue Green Algae test results are shown in Table 5.
As seen in Table 5, all the Microcystin results were below the Health Canada recommendations of a maximum microcystin concentration of 10 μg/L for recreational waters to protect against ingestion.
3.5. Temperature
A primary key to estimate the growth of Cyanobacterial is the water temperature. The optimal temperature ranges for Cyanobacterial growth and the occurrence of blooms are typically between 20°C to 30°C (68°F to 86°F) [23, 24, 25, 26]. A minimal optimal temperature of 20°C for Cyanobacterial growth and the occurrence of blooms is selected for this analysis which is based on the review of literature [24,26]. Two Temperature Mooring (TMA and TMB) were installed in Fairy Lake are shown in Figure 2. Water level data has been barometrically compensated using barometric data from the climate station at Acton Wastewater Treatment Plant. The Town of Halton Hills has recently conducted a bathymetric survey in April 2022 and elevation of water surface in the lake was 345.7m above sea level [18].
The results of 2022 and 2023 for TMA (WQ11) are presented in Figure 4 and in Figure 5 for year. Visible Blue-Green Algae (BGA) are also shown in these graphs. The results of 2022 for TMB (WQ3) are presented in Supplementary data S4 as Figure S4.1 and in Figure S4.2 for year where they show the same pattern.
At the surface, 1-m depth and 2-m depth the water temperatures are several degrees oC below and even more so, for 3-m depth. At 4-m and 5- m depth the water temperatures are substantially lower than surface water temperature until October and goes higher than surface water temperature.
In 2023, at depths of 0.5-meter, 1-meter depth and 2-meter, the water temperatures several degrees oC below than surface water temperature. At 4-meter and 5- meter depth they are quite lower up till October and goes higher than 0.5 meter- temperature. This shows overturning of water in the Lake.
Detections of cyanobacteria, on 10/18/2023 when the water temperature was below 15 demands further analysis as 20°C in mostly mentioned as the minimum optimal temperature for cyanobacteria blooms.
4.0. Trend Analysis
The Mann-Kendall Trend Test (MK Test) used to detect trends in time series data to determine whether there is a systematic upward or downward trend in the monitoring data (without making assumptions about the distribution of the data or the underlying trend shape). Trend analysis is conducted by using USEPA ProUCL 5.1 software and MK Test is used. The results show that the concentrations of dissolved phosphorus and total phosphorus have decreasing trends from the flow contributing locations to the Lake in wet and dry sampling events. However, N and TSS have increasing trends. In the Lake, only N has decreasing trends possibly showing that N is being consumed or being deposited in sediments.

Table 6.
Trend Analysis Results of Various Parameters in each Group.
| All wet sampling events to of lake | All dry sampling events to the lake | All Wet sampling events in the lake | All dry sampling events in the lake | |
| NumObs | 88 | 41 | 38 | 29 |
| # Missing | 3 | 15 | 14 | 3 |
| Variable | Trend | Trend | Trend | Trend |
| dissolved phosphorus | decreasing trend | decreasing trend | Insufficient evidence | Insufficient evidence |
| E. coli | increasing Trend | Insufficient evidence | Insufficient evidence | Insufficient evidence |
| nitrate (n) | increasing Trend | increasing Trend | decreasing trend | decreasing trend |
| total kjeldahl nitrogen (tkn) | decreasing trend | Insufficient evidence | Insufficient evidence | Insufficient evidence |
| total phosphorus | decreasing trend | Insufficient evidence | Insufficient evidence | Insufficient evidence |
| total suspended solids) | increasing Trend | increasing Trend | Insufficient evidence | Insufficient evidence |
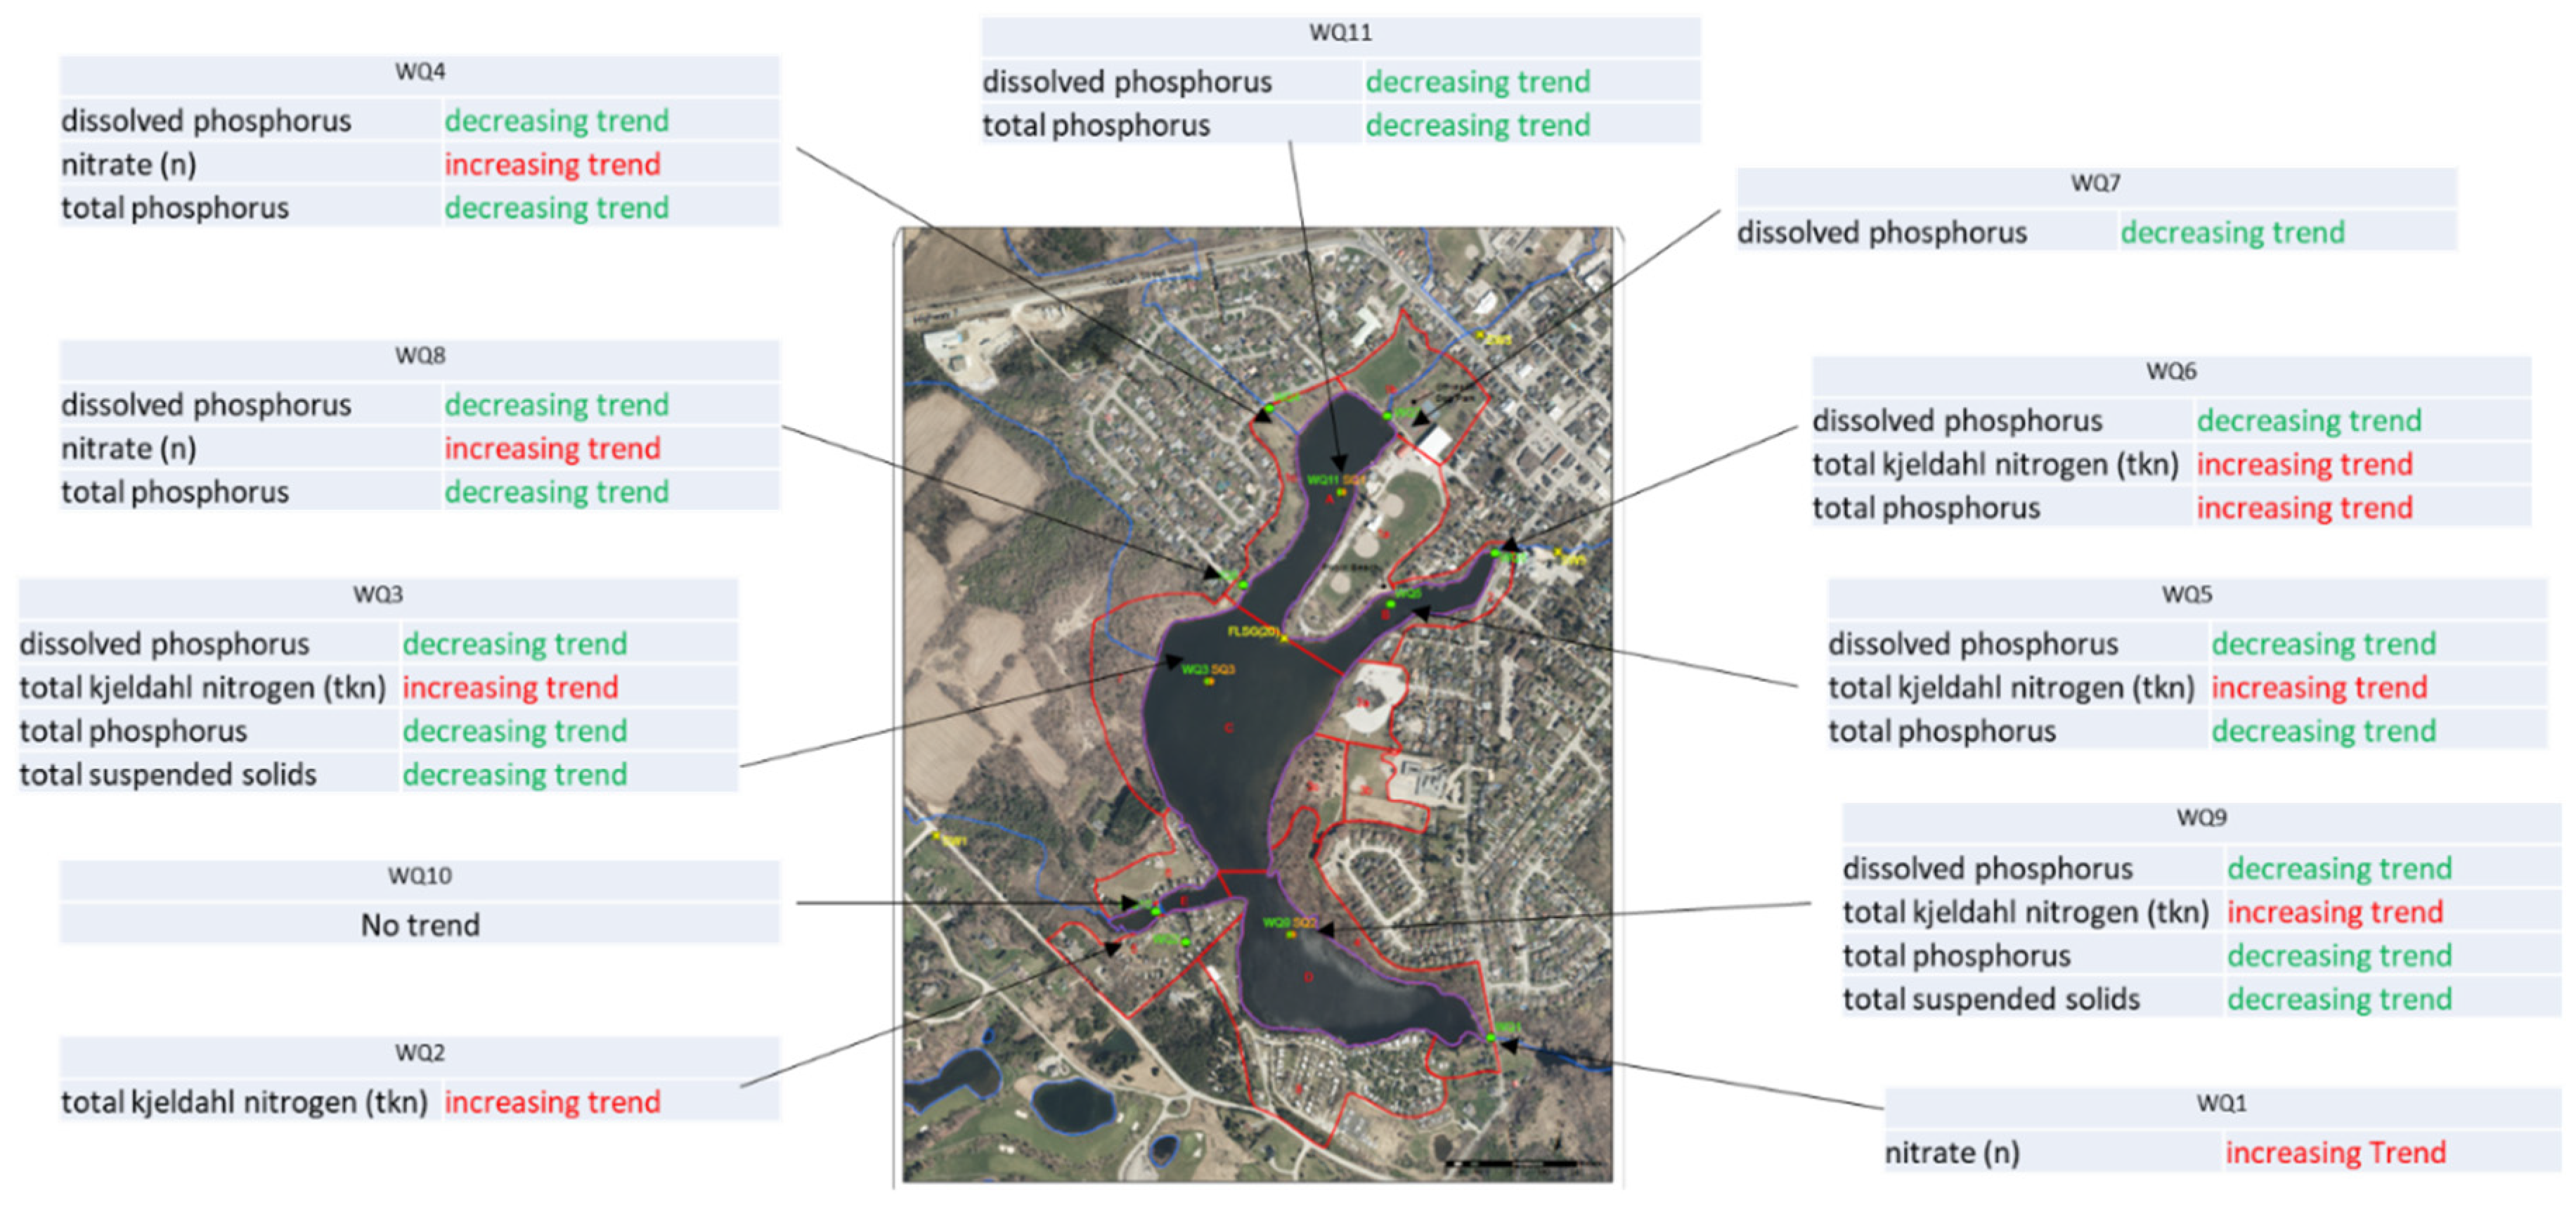
An analysis is also carried out for each monitoring location for both in the Lake and outside the Lake and the results are provided in Table 7 and Table 8. All the results are shown in Figure 5.
Monitoring Points Feeding to The Lake
For dissolved phosphorus, there are decreasing trends for WQ4, WQ7 and WQ8. While for Total phosphorus, there are decreasing trends for WQ4 and WQ8..
Monitoring Points in The Lake
For the monitoring locations in the Lake the dissolved phosphorus and TP, there are decreasing trends for WQ3, WQ5, WQ9 and WQ11. While for TKN, there are increasing trends for WQ3, WQ5 and WQ9. TSS are also decreasing in WQ3 and WQ9.
Figure 5.
Trend Analysis of dissolved phosphorus, nitrate and total phosphorus for all monitoring locations.
Figure 5.
Trend Analysis of dissolved phosphorus, nitrate and total phosphorus for all monitoring locations.
4.1. TN/TP Ratio
Regulating nutrients, particularly N and P, are crucial in preventing cyanobacterial HABs. Variations in the significance of different nutrients (e.g. N and P), their forms (e.g., soluble/particulate, oxidized/reduced, bioavailable/refractory), and their ratios (e.g., TN:TP) for the occurrence of CyanoHABs across various locations may be attributed to species-specific physiological adaptations, such as atmospheric N fixation [27,28]. A study evaluating future scenarios of nutrient load reduction in Lake Winnipeg, using the PB model WASP [29], reported that a 10% reduction in TP load would decrease the abundance of total cyanobacteria but increase the total biomass of non N-fixing cyanobacteria. Consequently, the recommended management strategy for this scenario was to reduce TP while maintaining a minimum TN to TP ratio [30].
Much of the debate revolves around whether low TN:TP ratios contribute to the occurrence of HAB blooms and can serve as predictors for these blooms. Various researchers [31,32,33,34,35,36] have reported values for N-limited and P limited values such as 20-50, 6-16, 8-24 and more. However, Lefler et al. [4] reported that TN:TP ≥ 23 indicates P-limitation, TN:TP ≤ 9 indicates N-limitation, and 23 > TN:TP > 9 indicates co-nutrient limitation. Smith [37] reported that a high concentration of P and a low TN:TP ratio tend to favor the development of cyanobacterial blooms.
The probable risk of microcystin concentrations exceeding water quality guidelines was greatest when the ratio of N to P was low and rapidly decreased at higher TN:TP ratios. Maximum concentrations of microcystins occurred in hypereutrophic lakes at mass ratios of TN:TP below 23 [38]. Li et al. [39] conducted a study in Lake Vombsjön, located in southern Sweden to assess changes in the risk of cyanobacterial bloom occurrence and enhance understanding of how N and P impact cyanobacteria growth. Their findings indicate that TP exhibits a stronger positive correlation with cyanobacteria biomass compared to dissolved inorganic P (DIP), while dissolved inorganic N(DIN) shows a stronger negative correlation with cyanobacteria biomass than TN. Moreover, the DIN:TP ratio demonstrates a stronger negative correlation with cyanobacteria biomass than the TN:TP ratio. Elevated cyanobacteria biomass, exceeding the WHO Alert Level 2 (10 mm3/L) for drinking water, corresponds to a DIP/TP ratio below 10.
Li et al. [39] suggested that to mitigate cyanobacteria growth, emphasis should be placed on controlling TP and DIN, ideally maintaining TP levels below 0.02 mg/L and ensuring the DIN:TP ratio remains above 10, preferably above 50, thus reducing the likelihood of nitrogen limitation favoring cyanobacterial blooms.
4.1.1. TN/TP Analysis of Fairy Lake
All the monitoring results of various locations are grouped locations contributing water to the Lake and other in the Lake. Wet and dry results in both the groups were analyzed separately for calculating the statistics, as presented in Table 9. The TN/TP ratios for Lake samples are low although the 50%ile numbers are higher than 27 which is slightly above the P limiting number.
The results show that minimum TN/TP ratio in all dry and wet evens went below 10 as this ratio is alarming meaning that water has N-limitation as TN:TP ≤ 9 indicates N-limitation and it may help cyanobacteria to grow.
4.1.2. Trend Analysis of TN/TP Ratio
Trend analyses of these samples show increasing trends for the samples wet and dry to the Lake and wet in the Lake. However, there was insufficient evidence of any trend for dry in the Lake.
Table 10.
Statistics of TN/TP ratio in Wet and Dry Events to the lake and in the Lake.
| NumObs | # Missing | Variable | TN/TP | |
|---|---|---|---|---|
| Wet events to the lake | 88 | 3 | Trend | increasing Trend |
| dry evens to the lake | 41 | 15 | Trend | increasing Trend |
| wet events in the lake | 38 | 14 | Trend | increasing Trend |
| dry evens in the lake | 29 | 3 | Trend | Insufficient evidence |
TN/TP Trend analysis was conducted for all the monitoring locations individually and results where there were trends are shown in Figure 6. TN/TP Trend analyses of all the monitoring locations feeding the Lake and in the Lake are shown in Figure 7.
Although TN/TP ratio trend from contributing flows is increasing but in the Lake itself is decreasing; this finding is considered indicative that the total N is being consumed or there is an internal loading of TP from the sediments similar to that reported by Swann et al. [40]. Swann et al. [40] reported that during summer, phosphorus (P) entering a lake can undergo cycling within food webs or become retained in sediment. Under oxidizing conditions, P is adsorbed onto ferric oxy-hydroxides and deposited in sediment. Thermal stratification in summer prevents the vertical exchange of dissolved oxygen (DO), leading to anoxic sediments releasing chemically bound P into pore water. This P is eventually internally loaded into the overlying water column via advection and diffusion. Additionally, aerobic decomposition of organic matter can further release both inorganic and dissolved organic P into the water column [41,42].
T/N ratio vs Nutrient Limitation at Various Monitoring Locations.
An analysis was carried out to compare TN/TP ratio with Lefler et al., [4] who reported that TN:TP ≥ 23 indicates P-limitation, TN:TP ≤ 9 indicates N-limitation, and 23 > TN:TP > 9 indicates co-nutrient limitation. The results are presented below in Table 11.
Among the monitoring points feeding the Lake, WQ-1, WQ-2, WQ-10 and WQ-3 had N-limitations four, five, three and two times, respectively. The catchment of WQ-1 and WQ-2 needs TN limitation and co-nutrient limitations in total are 11 and 16 out of 18 respectively. A low TN:TP ratio favors the development of cyanobacterial blooms; however, the monitoring points in the Lake had no TN limitations. The above analysis indicates that strong managerial efforts are required to reduce the TP in the catchment to increase the TN/TP ratio.
5.0. Microbial Source Tracking
This study applied a microbial source tracking approach to assess the presence of human sewage contamination at the beach and nearby areas, as well as the entry of human fecal contamination and fecal contamination from birds (gulls) and ruminants (cattle) into the Lake from tributaries or stormwater outfalls. Edge-Water DNA Inc. [43] helped to conduct this analysis.
Microbial source tracking methods offer new insights into interpreting elevated levels of fecal pollution and E. coli bacteria in water samples, aiding in the identification of pollution sources [44,45]. In these methods, a water sample is filtered to collect microorganisms such as bacteria. The DNA from these microorganisms is then extracted and analyzed using polymerase chain reaction (PCR) assays. These assays measure the number of copies of specific DNA sequences (DNA markers) present in the water sample. These DNA markers are known to be associated with bacteria found exclusively in the feces of humans or certain animals. For example, detecting high numbers of a DNA marker from a bacterium found only in the human gut indicates human fecal contamination in the water sample. This information aids in interpreting high E. coli counts in water samples and inferring their source as human fecal pollution. Water samples were gathered at 8 designated sites along the shoreline of the Lake, chosen based on assessments by CVC and ongoing water quality surveillance studies for the locations which are WQ1, WQ2, WQ4, WQ5, WQ6, WQ7, WQ8 and WQ10. The human HF183 DNA marker and the Gull4 DNA marker were used to trace human fecal contamination and bird fecal contamination at these locations. Human fecal contamination makers showed presence in WQ2 (trailer park), WQ7 (creek inflow) and the stormwater outfall site WQ4. Bird fecal contamination was detected WQ1, WQ7 and WQ10. These results are shown in Figure 8.
The Site and its characteristics are discussed. The water quality monitoring stations and various sampling events which encompasses over two years are presented. The dissolved phosphorous, Nitrates(N), Total Kjeldahl Nitrogen (TKN), Total phosphorous, TSS, and Escherichia coli concentrations both in wet and dry conditions are analyzed in lab. Water temperature at the two Temperature Mooring (TMA and TMB) stations are collected. A microbial source tracking approach to assess the presence of human sewage contamination at the beach and nearby areas, as well as the entry of human fecal contamination into the lake from tributaries or stormwater outfalls. The Site and its characteristics are discussed. The water quality monitoring stations and various sampling events which encompasses over two years are presented. The dissolved phosphorous, Nitrates(N), Total Kjeldahl Nitrogen (TKN), Total phosphorous, TSS, and Escherichia coli concentrations both in wet and dry conditions are analyzed in lab. Water temperature at the two Temperature Mooring (TMA and TMB) stations are collected. A microbial source tracking approach to assess the presence of human sewage contamination at the beach and nearby areas, as well as the entry of human fecal contamination into the lake from tributaries or stormwater outfalls.In summary, while repeated sampling and higher sample numbers can provide more confidence in understanding water quality variability and fecal pollution sources, the results in this report identify low levels of human fecal waste sources and bird fecal droppings impacting water quality (and likely nutrient levels) at sites on Fairy Lake
In summary, while repeated sampling and higher sample numbers can provide more confidence in understanding water quality variability and fecal pollution sources, the results show low levels of human fecal waste sources and bird fecal droppings impacting water quality (and likely nutrient levels) at sites on Fairy Lake.
7.0. Conclusion
Issues of cyanobacteria and microcystins are profound and the implications of continuing due to surrounding land use challenges as well as the implications of climate change – implications that identify strategies to control the microcystins, to protect the quality of the urban lakes and the public usage thereof. Different climate and geographical conditions under which cyanobacteria could bloom and impact the lake ecology and provide insights on management opportunities; nevertheless, identification of the circumstances where the detrimental effects of cHABs are not limited to humans; they also affect dogs, livestock, and wildlife, leading to symptoms from gastrointestinal upset to neurological disorders, and in some cases, death. This poses significant challenges, particularly for drinking water and recreational activities such as swimming, bathing, wading, windsurfing, and waterskiing. Cases of animal fatalities due to contact with cyanobacteria blooms have received extensive media coverage, raising awareness of the risks in recreational waters [46].
Many features are relevant. The baseline mudt include monitoring to enable understanding of the set of conditions that produce cyanobacteria and cHABs. Clearly, as evident from the monitoring results, monitoring has shown that cyanobacteria possess unique traits such as phototaxis, allowing photosynthesis at varying light intensities, and buoyancy, enabling movement in stratified water columns. Vertical migration is thought to be beneficial to cyanobacteria because it allows them to travel between the surface layers of a waterbody, where light is abundant, and lower where there are more nutrients. The conclusions include:
- a)
- The monitoring analysis of the results shows that there have been many exceedances of TP over the Water Quality Guideline of TP of 0.02 mg/L from all monitoring locations in all the events. There is a strong need to improve management practices to reduce the TP from the catchment to the Fairy Lake.
- b)
- The monitoring results show that there has been many exceedances of E. coli above the RWG values of 400 E. coli /100 mL. Exposure to recreational water contaminated with E. coli, can increase the risk of gastrointestinal and skin infections.
- c)
- The monitoring results show that there have been many exceedances of TSS above the RWG values of 25 mg/L. Elevated TSS levels can degrade aquatic habitat quality by covering substrates, reducing habitat complexity, and altering the composition of benthic communities. Fine sediments may clog interstitial spaces between substrate particles, affecting the availability of food and shelter for benthic organisms. Since TSS can serve as carriers for nutrients, organic matter, and contaminants in aquatic environments, it is important that managerial practices be implemented to reduce the TSS from the catchment.
- d)
- Although TN/TP ratio trends from contributing flows are increasing, in the Lake itself they are decreasing. Either the total N is being consumed or there is an internal loading of total P from the sediments.
- e)
- Detections of cyanobacteria, on 10/18/2023 when the water temperature was below 15 demands further analysis as 20°C in mostly mentioned as the minimum optimal temperature for cyanobacteria blooms.
- f)
- Microbial source tracking methods was used for 8 designated sites along the shoreline of the Lake into interpreting elevated levels of fecal pollution and E. coli bacteria in water samples, aiding in the identification of pollution sources and used to show increasing of both human fecal contamination issues originating from sewage or septic sources upstream of these sites and at sites WQ10 and WQ7 bird fecal contamination.
- g)
- Long term monitoring of the key cyanobacterial triggering parameters is required to further understand.
Supplementary Materials
The following supporting information can be downloaded at the website of this paper posted on Preprints.org.
References
- CDC, 2021, Centers for Disease Control and Prevention (CDC). Summary Report – One Health Harmful Algal Bloom System (OHHABS), United States, 2021. Atlanta, Georgia: U.S. Department of Health and Human Services.
- Reynolds, C. S. (1987). Cyanobacterial water-blooms. Editor, callow J.A. Adv. Bot. Res. 13, 67–143. [CrossRef]
- Bonilla, S., Aguilera, A., Aubriot, L., Huszar, V., Almanza, V., Haakonsson, S., et al. (2023). Nutrients and not temperature are the key drivers for cyanobacterial biomass in the Americas. Harmful Algae 121:102367. [CrossRef]
- Lefler FW, Barbosa M, Zimba PV, Smyth AR, Berthold DE and Laughinghouse HD (2023) Spatiotemporal diversity and community structure of cyanobacteria and associated bacteria in the large shallow subtropical Lake Okeechobee (Florida, United States). , Front. Microbiol. 14:1219261. [CrossRef]
- Paerl H.W., 2018, Mitigating toxic planktonic cyanobacterial blooms in aquatic ecosystems facing increasing anthropogenic and climatic pressures Toxins, 10 (2) (2018), p. 76. [CrossRef]
- Treuer G., C. Kirchhoff, M.C. Lemos, F. McGrath, 2021.Challenges of managing harmful algal blooms in US drinking water systems, Nature Sustainability, 4 (11) (2021), pp. 958-964. [CrossRef]
- Namsrai J. , Kwang-Guk An, 2023, Seasonal and inter annual responses of blue-green algal taxa and chlorophyll to a monsoon climate, flow regimes, and N:P ratios in a temperate drinking-water reservoir, Science of The Total Environment, Volume 896, 20 October 2023, 165306.
- Smith VH and Schindler DW. 2009. Eutrophication science: where do we go from here? Trends in Ecology and Evolution 24:201-207.
- Glibert, P.M., Maranger, R., Sobota, D.J., Bouwman, L., 2014. The Haber Bosch–harmful algal bloom (HB–HAB) link. Environ. Res. Lett. 9 (10), 105001.
- Health Canada, 2022, Guidelines for Recreational Water Quality Guideline Technical Document Cyanobacteria and Their Toxins, Health Canada, February 2022.
- Dupont, A.; Botrel, M.; St-Gelais, N.F.; Timothée Poisot, T.; and Maranger,R. 2023, A social–ecological geography of southern Canadian lakes, FACETS 16 November 2023. [CrossRef]
- Health Canada, 2017, Guidelines for Canadian Drinking Water Quality: Guideline Technical Document — Cyanobacterial Toxins. Water and Air Quality Bureau, Healthy Environments and Consumer Safety Branch, Health Canada, Ottawa, Ontario. (Catalogue No H144-38/2017EPDF).
- Council of Canadians, “Concerns about blue-green algae on the rise”. https://canadians.org/analysis/concerns-about-blue-green-algae-rise (accessed Jan 4 2024).
- Favot, E.J.; Holeton,C.; DeSellas, A.M.; Paterson, A.M. (2023): Cyanobacterial blooms in Ontario, Canada: Continued increase in reports through the 21st century, Lake and Reservoir Management. [CrossRef]
- Nieto, P.J.G.; García-Gonzalo, E.; Lasheras, F.S.; Fernández, J.R.A.; Muñiz, C.M.; Juez, F.J.C., 2018, Cyanotoxin level prediction in a reservoir using gradient boosted regression trees: a case study, Environmental Science and Pollution Research (2018) 25:22658–22671. [CrossRef]
- Town of Halton Hills, 2021, Fairy Lake Water Quality Study Update – Project Charter and Terms of Reference, REPORT NO.: RP-2021-0003, RP-2021-0003.
- Town of Halton Hills, 2009, Fairy Lake Water Quality Study, Prepared by: AECOM, Project Number: 107983 Date: December 2009.
- Town of Halton Hills, 2023, Personal communication, 2023.
- LGL, 2023, Fairy Lake Water Quality Update May 2023 Town of Halton Hills LGL File No. TA9122.
- CVC, 2023, Credit Valley Conservation (Personal Communications).
- Environment Canada (1979), Water Quality Sourcebook, A Guide to Water Quality Parameters, Inland Waters Directorate, Water Quality Branch, Ottawa, Canada.
- Rideau Valley Conservation Authority’s (RVCA), (2024), Sub-watershed Reports. https://watersheds.rvca.ca/subwatersheds-reports/middle-rideau/catchment-reports-middle-rideau/middle-rideau-irish-creek/surface-water-quality-conditions, Accessed on -9-2024.
- Auld, H.; Switzman, H., Comer, N., Eng, S., Hazen, S., Milner, G., 2016, Region of Peel. Climate Trends and Future Projections in Region of Peel, Technical Report; Ontario Climate Consortium: Toronto, ON, Canada, 2016.
- Hu, L.; Wang, H.; Cui, J.; Zou,W.; Li, J.; and Shan,K., Temperature-Dependent Growth Characteristics and Competition of Pseudanabaena and Microcystis, Water 2023, 15(13), 2404. [CrossRef]
- Lurling, M.; Eshetu, F.; Faassen, E.J.; Kosten,S.; And Huszar, V.L.M. Comparison of Cyanobacterial and green algal growth rates at different temperatures, Freshwater Biology (2013) 58, 552–559. [CrossRef]
- Health Canada, 2021, Guidelines for Canadian Drinking Water Quality: Guideline Technical Document – Cyanobacterial Toxins. https://www.canada.ca/en/health-canada/services/publications/healthy-living/guidelines-canadian-drinking-water-quality-guideline-technical-document-Cyanobacterial-toxins-document.html.
- Håkanson, L., Bryhn, A. C., & Hytteborn, J. K. (2007). On the issue of limiting nutrient and predictions of cyanobacteria in aquatic systems. Science of the Total Environment, 379(1), 89-108.
- Dolman, A. M., Rücker, J., Pick, F. R., Fastner, J., Rohrlack, T., Mischke, U., & Wiedner, C. (2012). Cyanobacteria and cyanotoxins: The Influence of nitrogen versus phosphorus. PLoS ONE, 7(6), e38757.
- Zhang, W., Rao, Y. R. (2012). Application of a eutrophication model for assessing water quality in Lake Winnipeg. Journal of Great Lakes Research, 38, 158-173.
- Rousso, B.Z.; Bertone, E.; Stewart, R.; Hamilton, D.P. 2020. A systematic literature review of forecasting and predictive models for cyanobacteria blooms in freshwater lakes. Water Research. [CrossRef]
- Guildford S.J. and Robert E. Hecky, 2000, Total nitrogen, total phosphorus, and nutrient limitation in lakes and oceans: Is there a common relationship?, Limnol. Oceanogr., 45(6), 2000, 1213–1223.
- Mamun M., Sang-Jae Lee, Kwang-Guk An, 2018, Roles of Nutrient Regime and N:P Ratios on Algal, Growth in 182 Korean Agricultural Reservoirs, Pol. J. Environ. Stud. Vol. 27, No. 3 (2018), 1-11. [CrossRef]
- Ekholm, P. N:P Ratios in Estimating Nutrient Limitation in Aquatic Systems; Finnish Environment Institute: Helsingfors, Finland, 2008; pp. 11–14.
- Graeber D., McCarthy M.J., Shatwell T., Borchardt D., Jeppesen E., Søndergaard M., Lauridsen T.L. , Davidson T.A., 2023, Consistent stoichiometric long-term relationships between nutrients and chlorophylla, across shallow lakes, Nature Communications | ( 2024)1 5:809. [CrossRef]
- Savic R., Stajic, M.; Blagojevic, B.; Bezdan, A.; Vranesevic, M.; Nikoli´c Jokanovic, V.; Baumgertel, A.; Bubalo Kovacic, M.; Horvatinec, J.; Ondrasek, G., 2022, Nitrogen and Phosphorus Concentrations and Their Ratios as Indicators of Water Quality and Eutrophication of the Hydro-System Danube–Tisza–Danube., Agriculture 2022, 12, 935. [CrossRef]
- Nariyama Y., Yoshimasa Amano, Motoi Machida, 2023, Growth Characteristics and Changes in Elemental Composition of Microcystis sp. under Various N:P Mass Ratios, Journal of Water and Environment Technology, Vol. 21, No.2: 119–128, 2023. [CrossRef]
- Smith, V.H. Low Nitrogen to Phosphorus Ratios Favor Dominance by Blue-Green Algae in Lake, Phytoplankton. Science 1983, 221, 669–671.
- Orihel D.M., et al., 2012 High microcystin concentrations occur only at low nitrogen-to-phosphorus ratios in nutrient-rich, Canadian lakes, Can. J. Fish. Aquat. Sci. 69: 1457–1462 (2012). Published by NRC Research Press. [CrossRef]
- Li J., ID, Lars-Anders Hansson and Kenneth M. Persson, 2018, Nutrient Control to Prevent the Occurrence of Cyanobacterial Blooms in a Eutrophic Lake in Southern Sweden, Used for DrinkingWater Supply, Water 2018, 10, 919. www.mdpi.com/journal/water. [CrossRef]
- Swann M.M., Alicia Cortes, Alexander L. Forrest1, Nick Framsted1, Steven Sadro, S. Geoffrey Schladow, Angela De Palma-Dow, 2024, Internal phosphorus loading alters nutrient limitation and contributes to cyanobacterial blooms in a polymictic lake, Aquatic Sciences (2024) 86:46. [CrossRef]
- Hupfer M, Lewandowski J (2008) Oxygen controls the phosphorus release from lake sediments—a long-lasting paradigm in limnology. Int Rev Hydrobiol 93(4–5):415–432. [CrossRef]
- Song K, Burgin AJ (2017) Perpetual phosphorus cycling: eutrophication amplifies biological control on internal phosphorus loading in agricultural reservoirs. Ecosystems 20(8):1483–1493. [CrossRef]
- Edge, T.A. (2023). Microbial source tracking at Fairy Lake, Acton, Ontario – Summer 2023. Report submitted to Dr. Amanjot Singh, Credit Valley Conservation. Edge-Water DNA Inc., Toronto, Ontario. September 25, 2023. 14p.
- Edge, T.A., and K.A. Schaefer. 2006. Microbial source tracking in aquatic ecosystems: the state of the science and an assessment of needs. National Water Research Institute, Environment Canada, Burlington, Ont. NWRI Scientific Assessment Report Series No. 7. http://publications.gc.ca/site/eng/9.560375/publication.html.
- Harwood, V.J., et al. 2014. Microbial source tracking markers for detection of fecal contamination in environmental waters: relationships between pathogens and human health outcomes. FEMS Microbiol. Rev. 38: 1–40.
- Health Canada, 2023, Guidelines for Recreational Water Quality Guideline, Technical Document, Cyanobacteria and Their Toxins, Publication date: February 2022, Cat.: H129-129/2022E-PDF, ISBN: 978-0-660-41541-3 , Pub.: 210507.
Figure 1.
Overall Sequence of Actions to Establish/interpret the Findings from Monitoring.
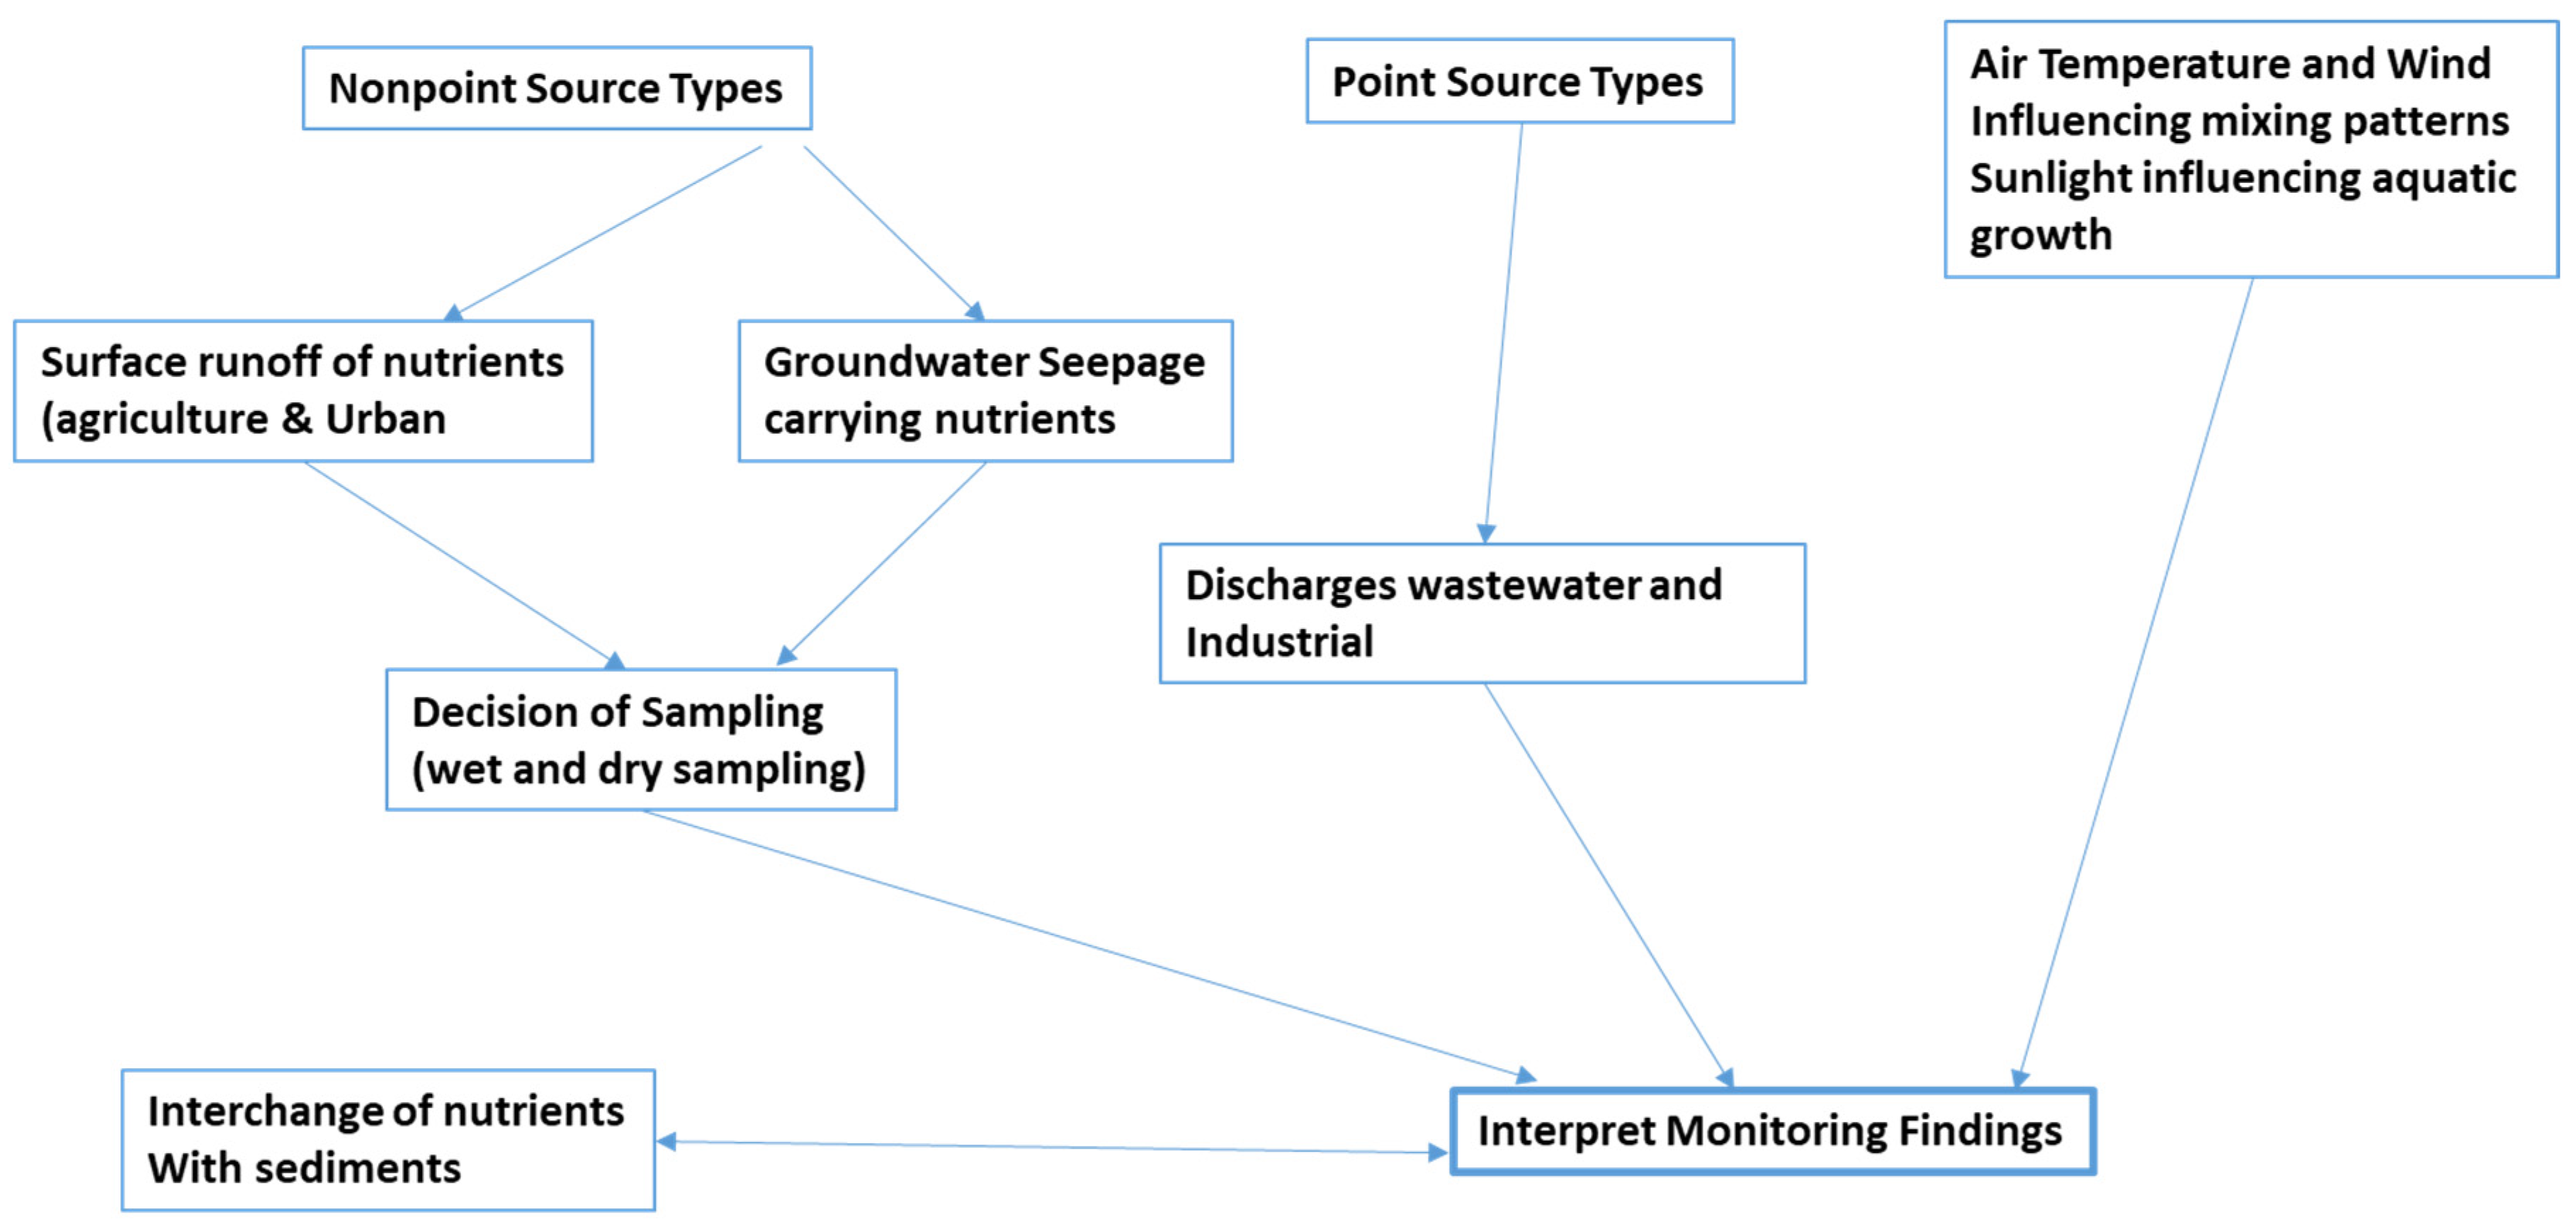
Figure 3.
Number of exceedances of various recreational water quality guidelines for all Sampling Locations.
Figure 3.
Number of exceedances of various recreational water quality guidelines for all Sampling Locations.
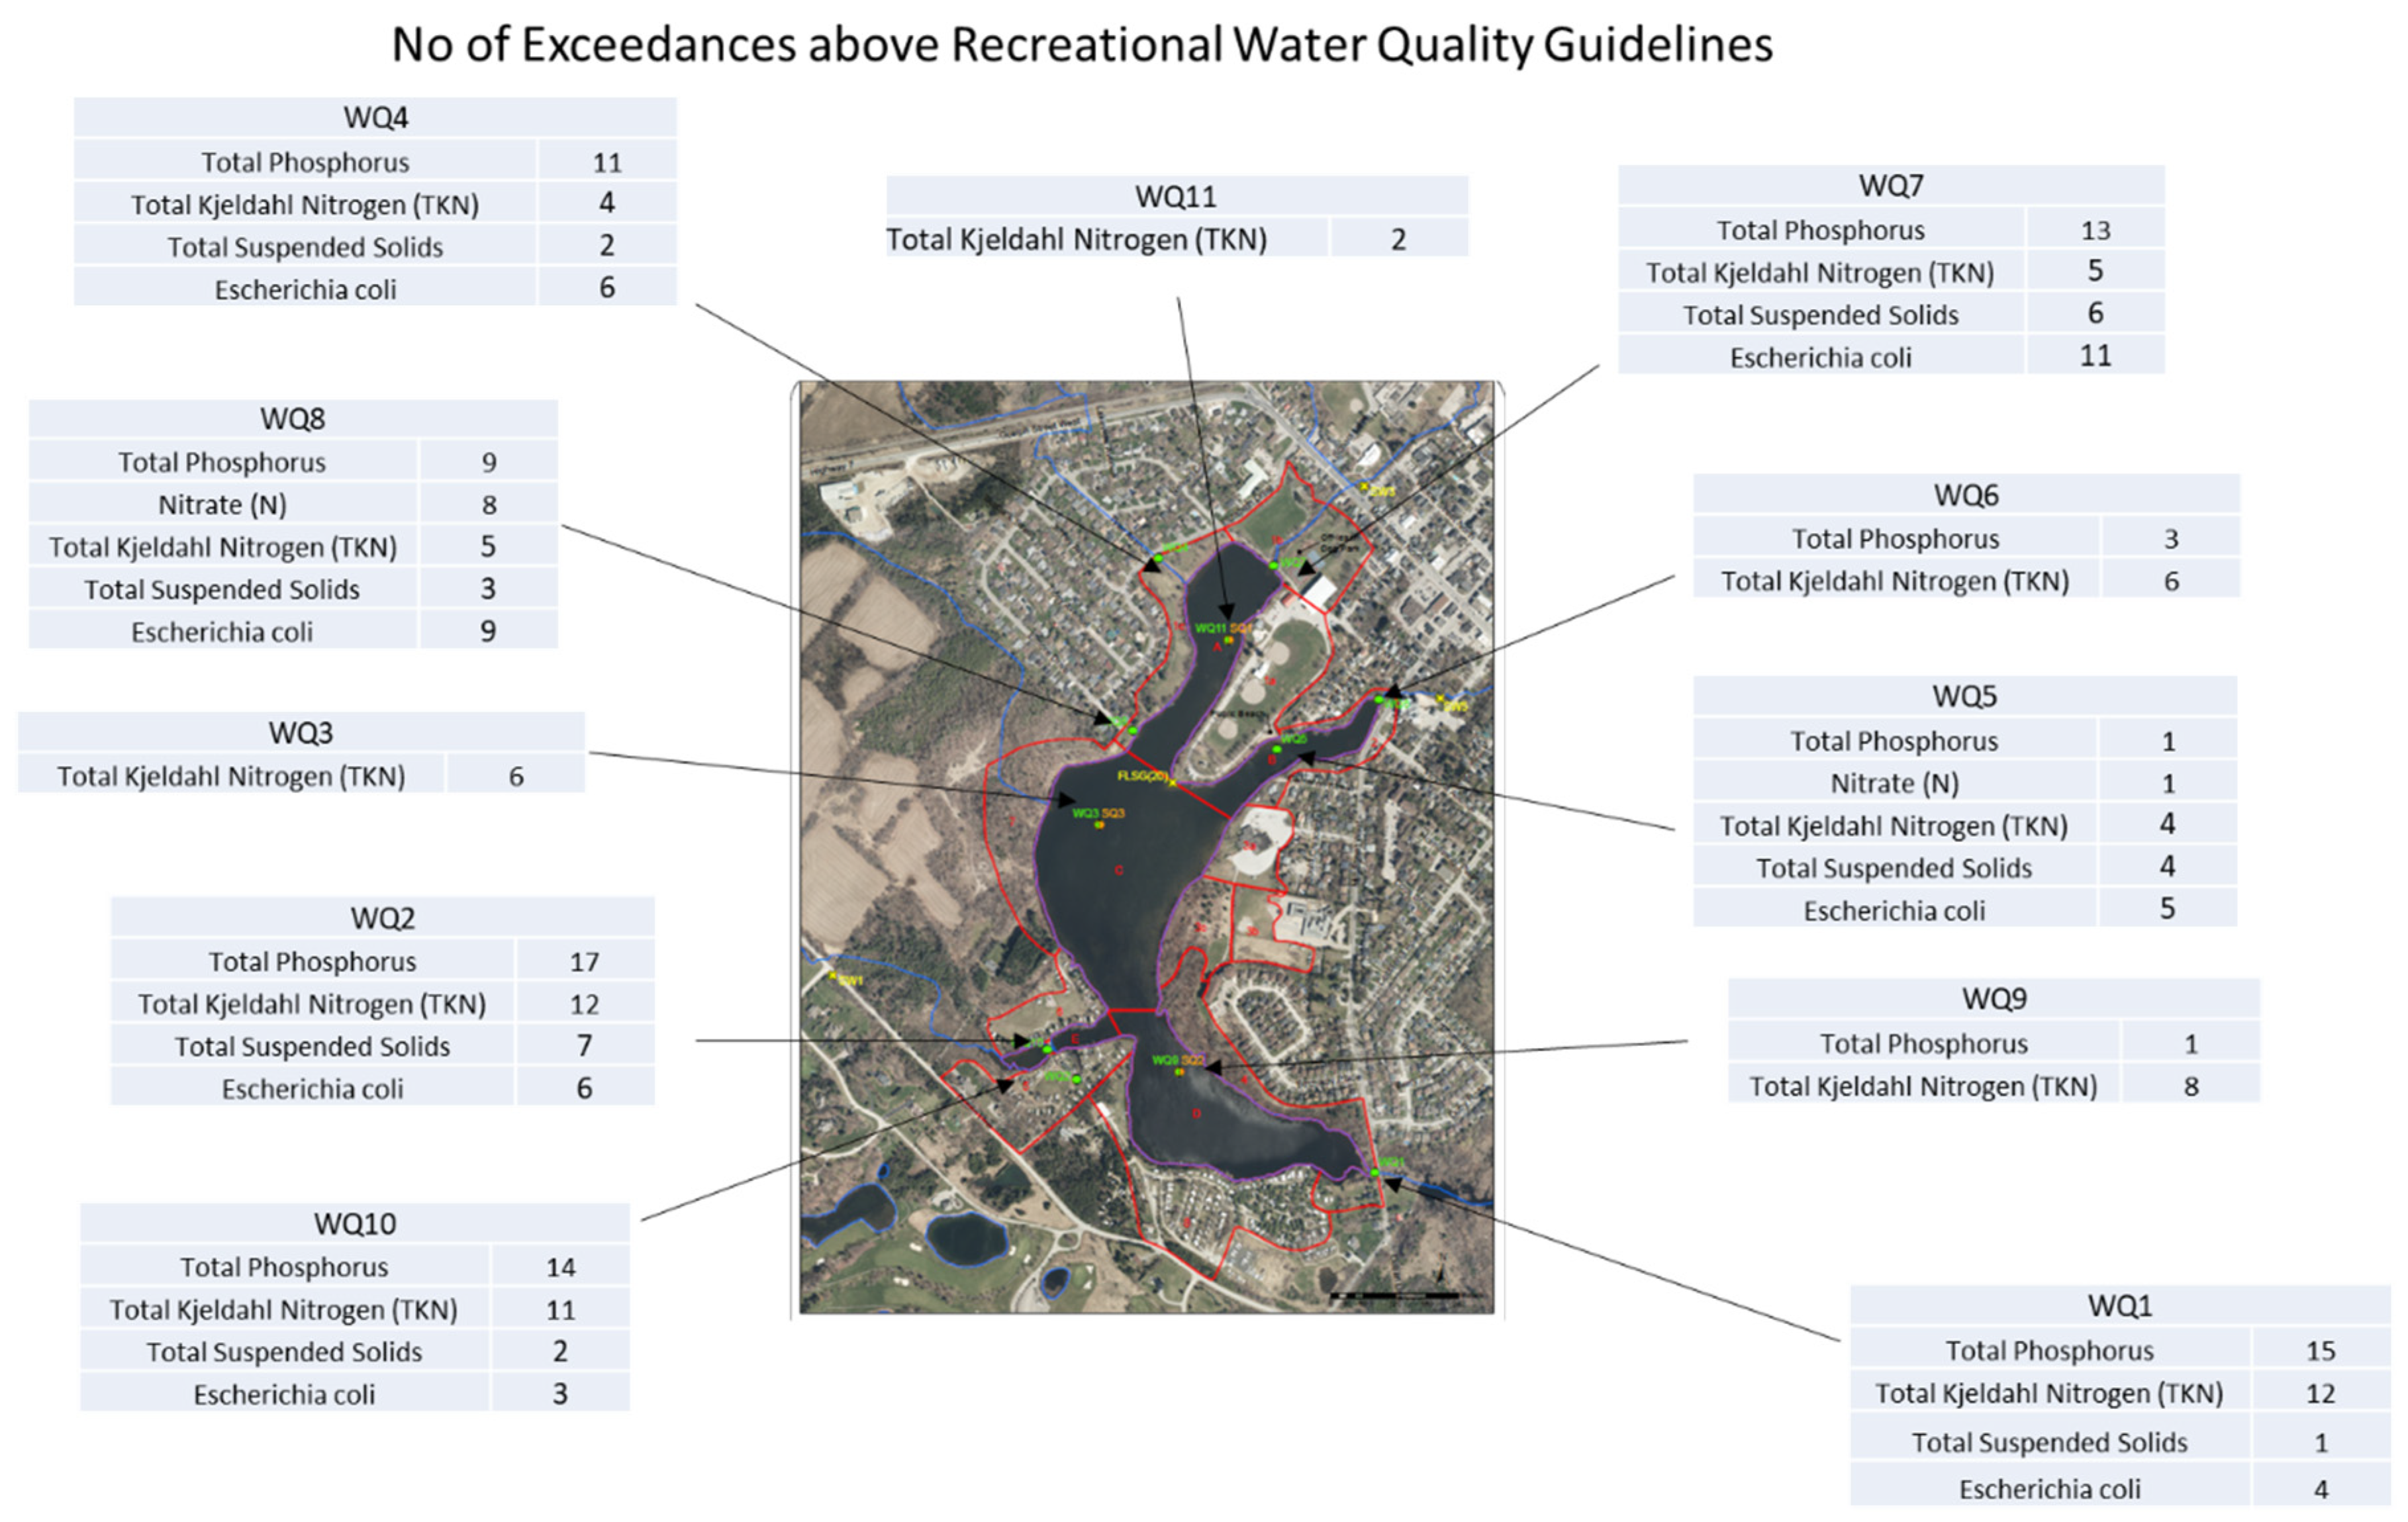
Figure 4.
Observed Temperature at various Depths and Blue Green Bloom observed in 2022.
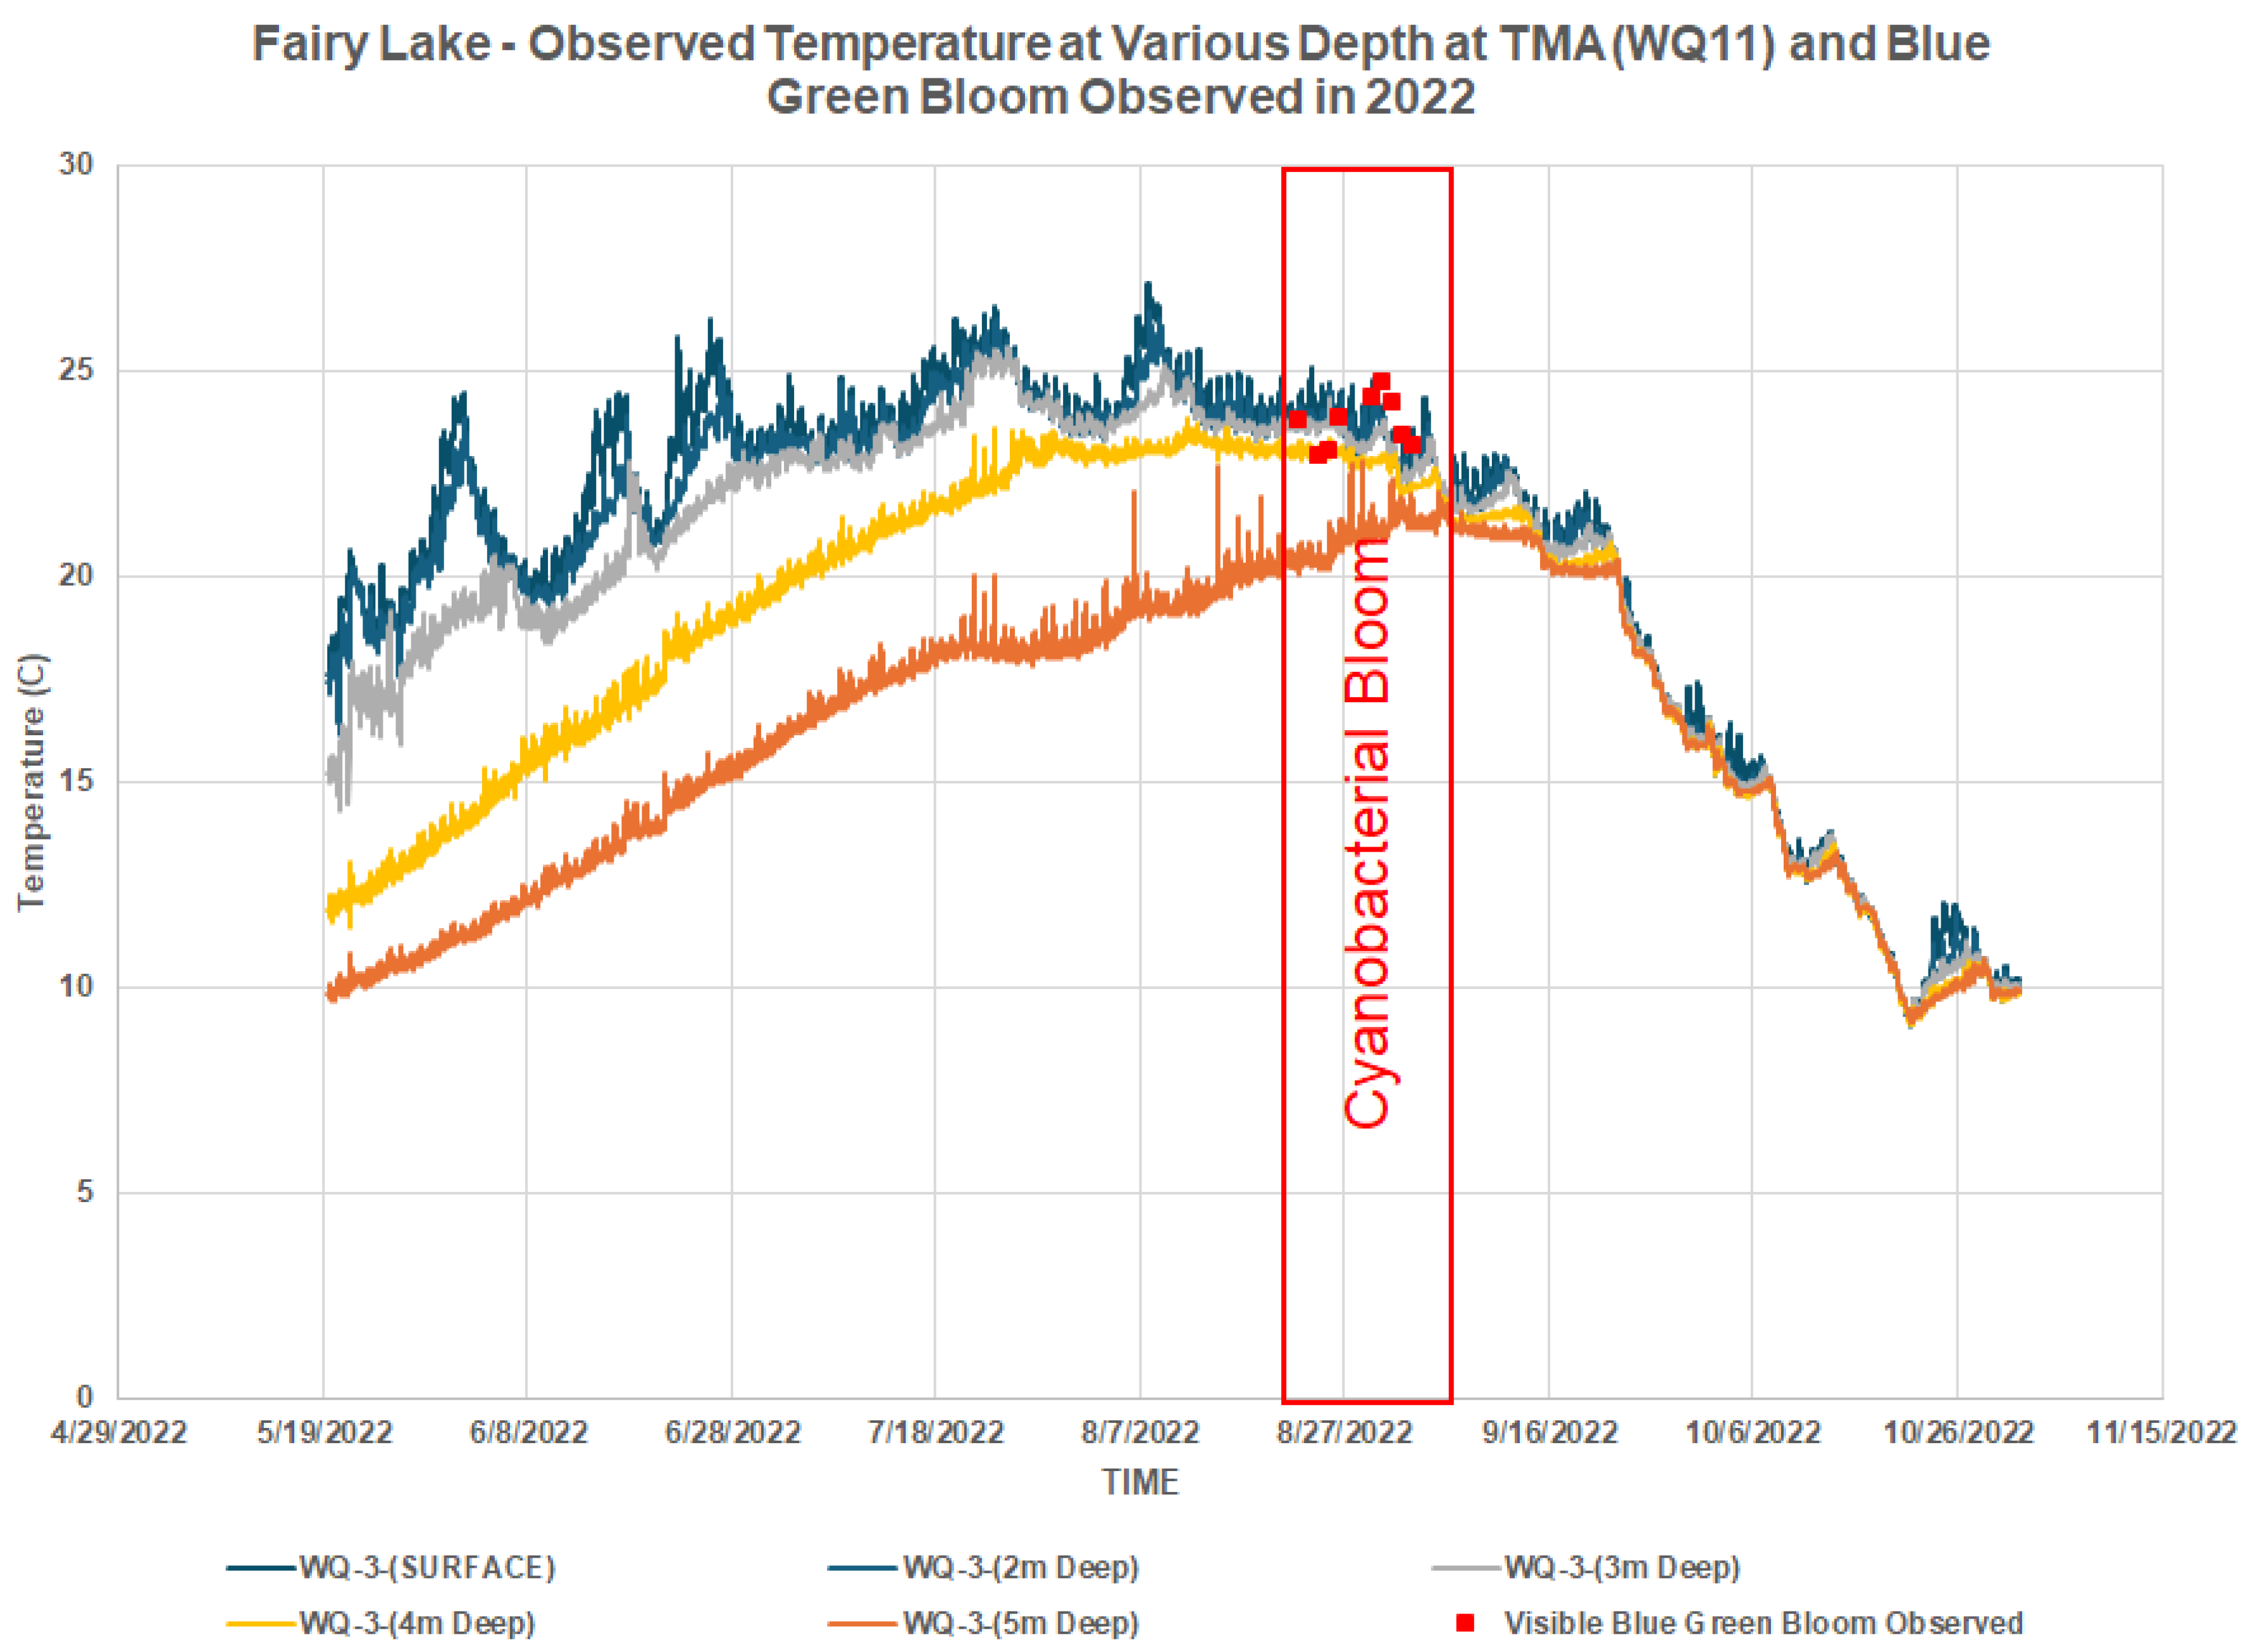
Figure 5.
Observed Temperature at various Depths and Blue Green Bloom observed in 2023.
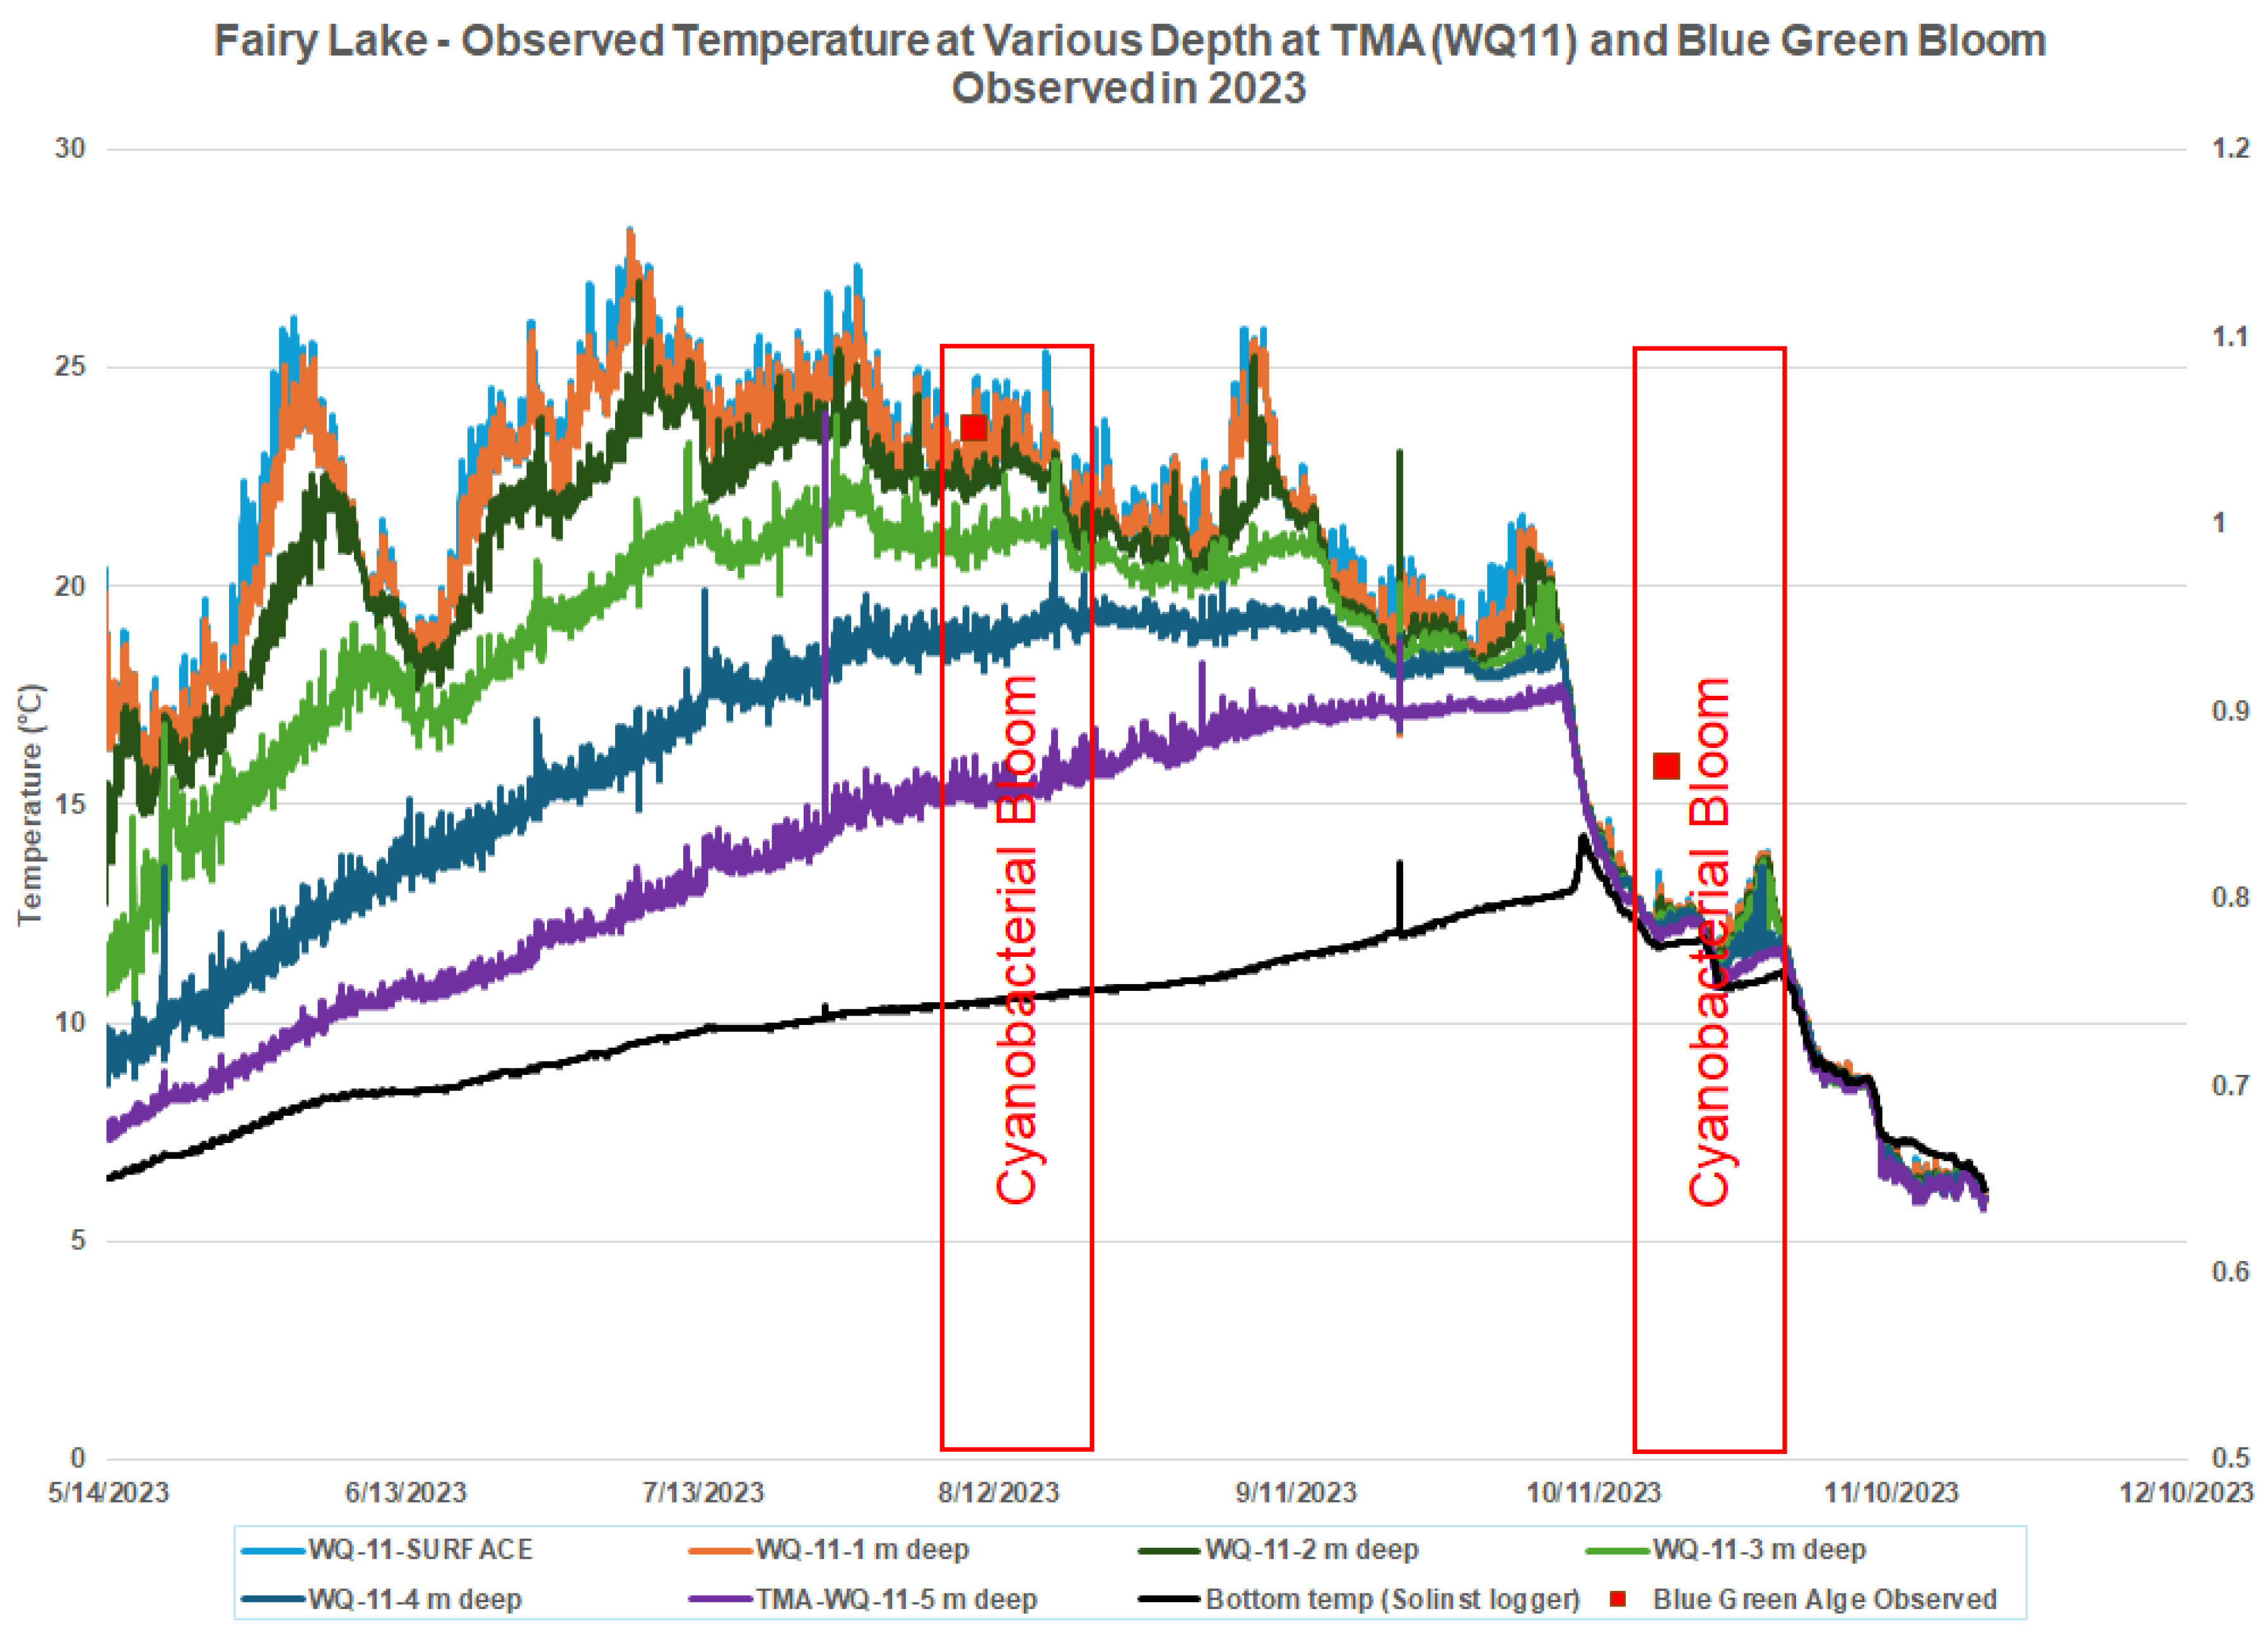
Figure 6.
Trend Analysis of TN/TP Ratio for all monitoring locations.
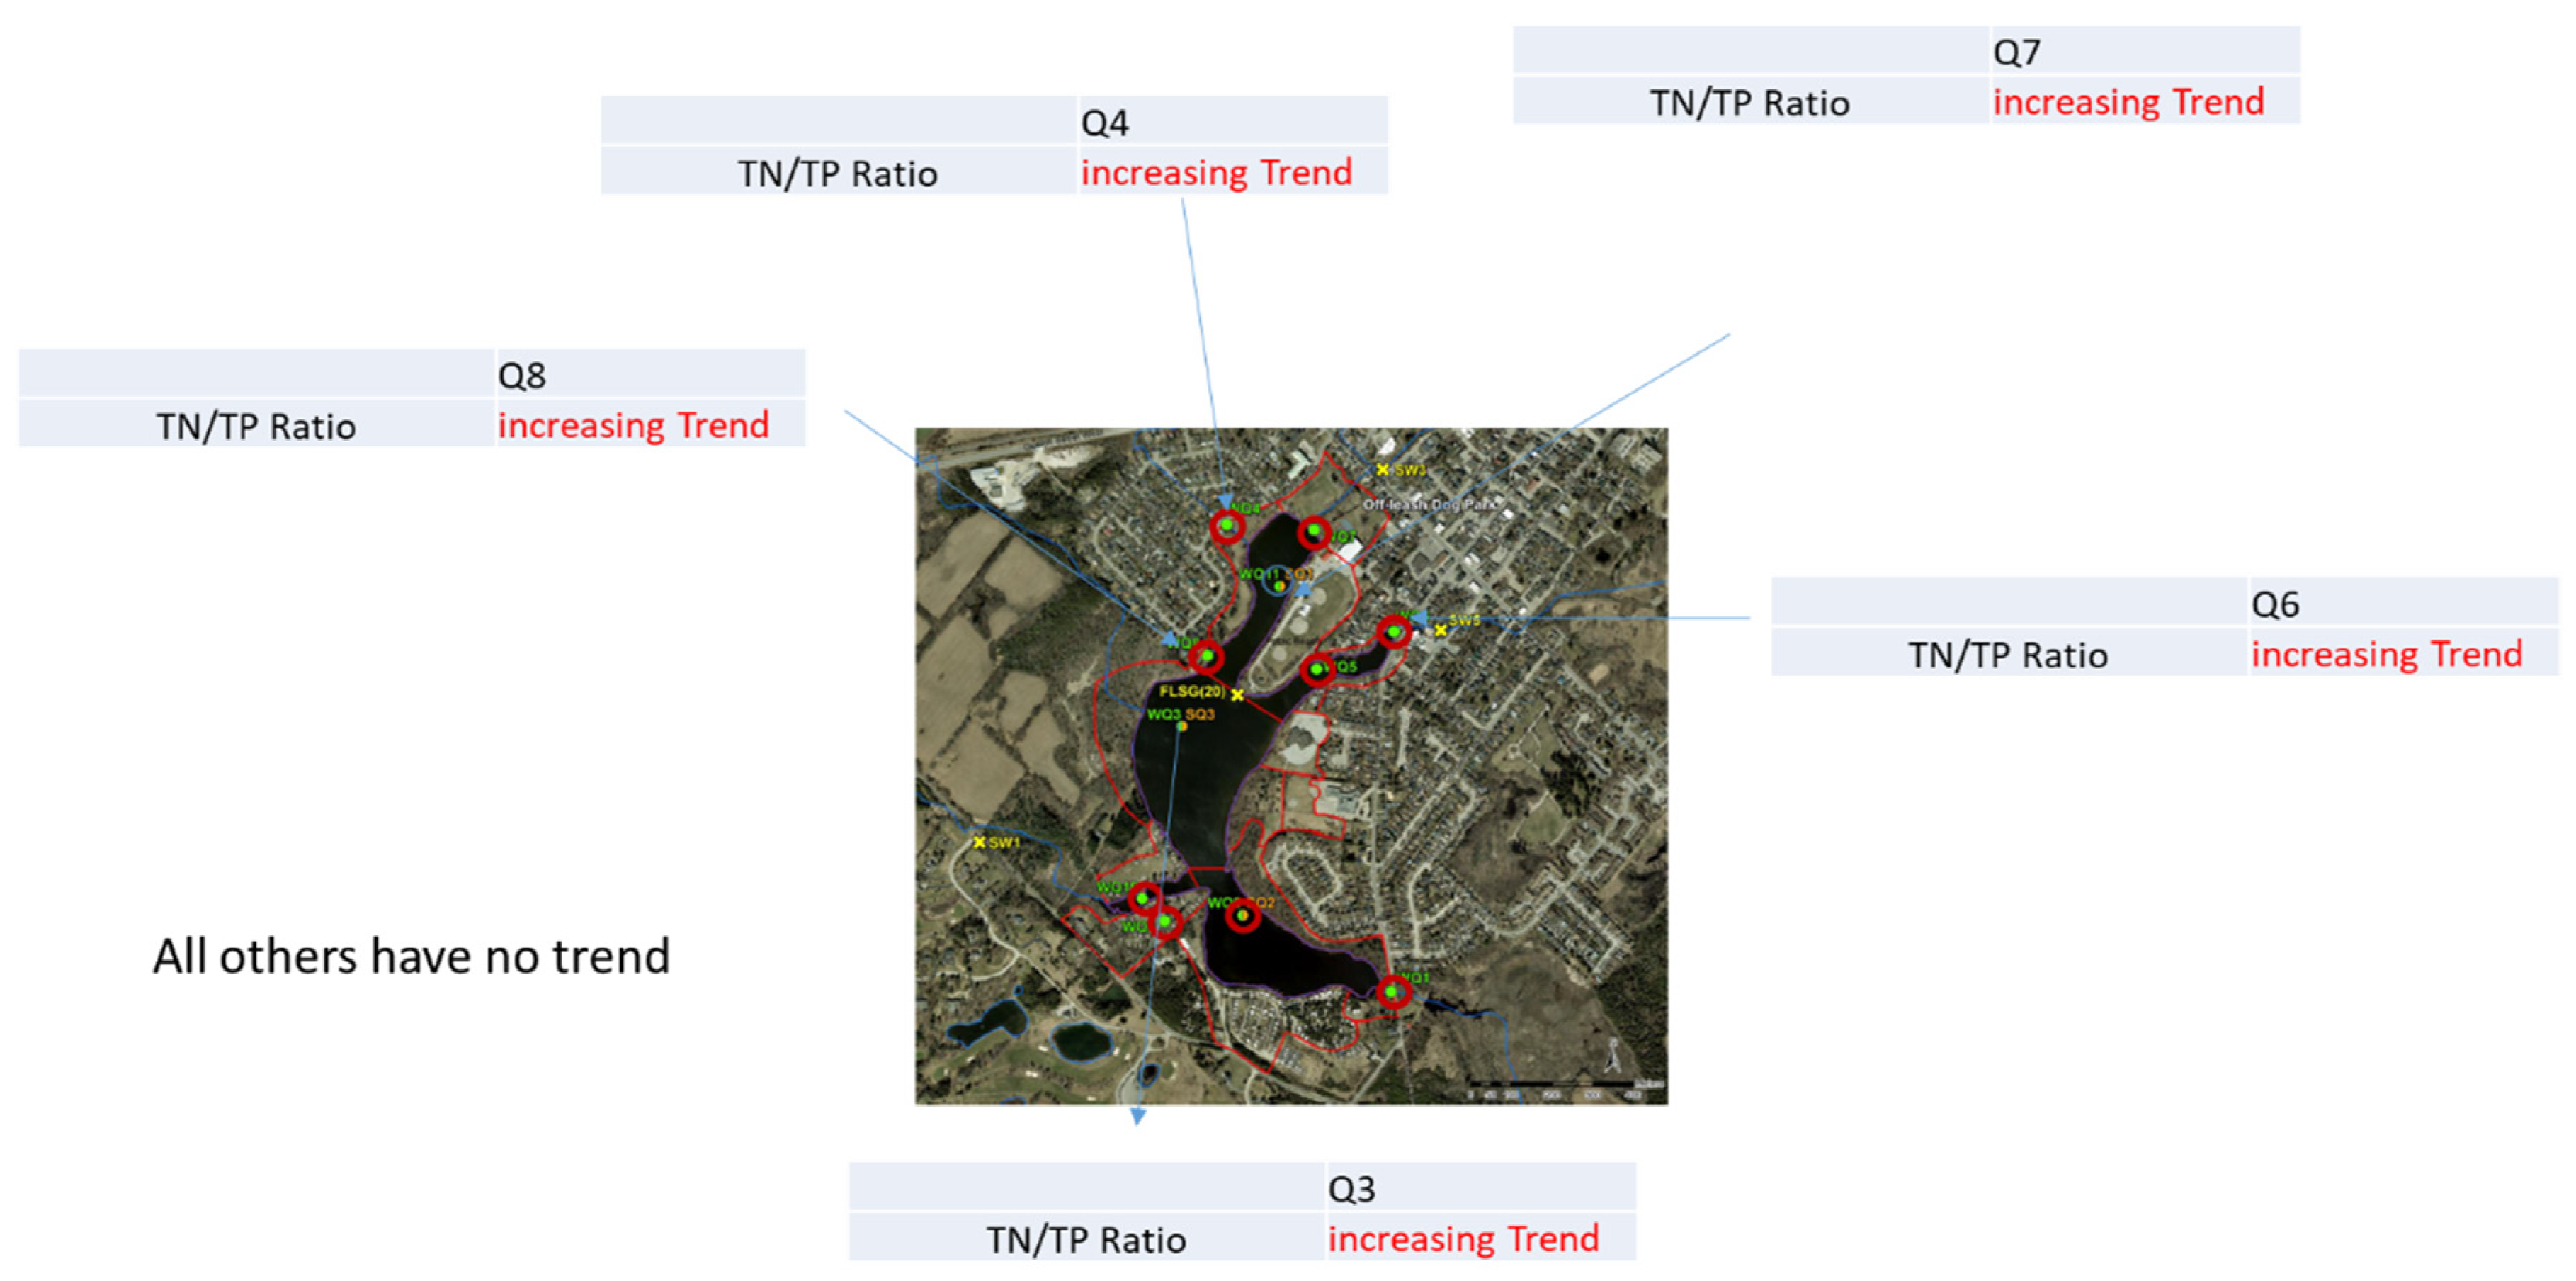
Figure 7.
Trend Analysis of TN/TP Ratio for all the monitoring locations feeding the Lake and in the Lake.
Figure 7.
Trend Analysis of TN/TP Ratio for all the monitoring locations feeding the Lake and in the Lake.
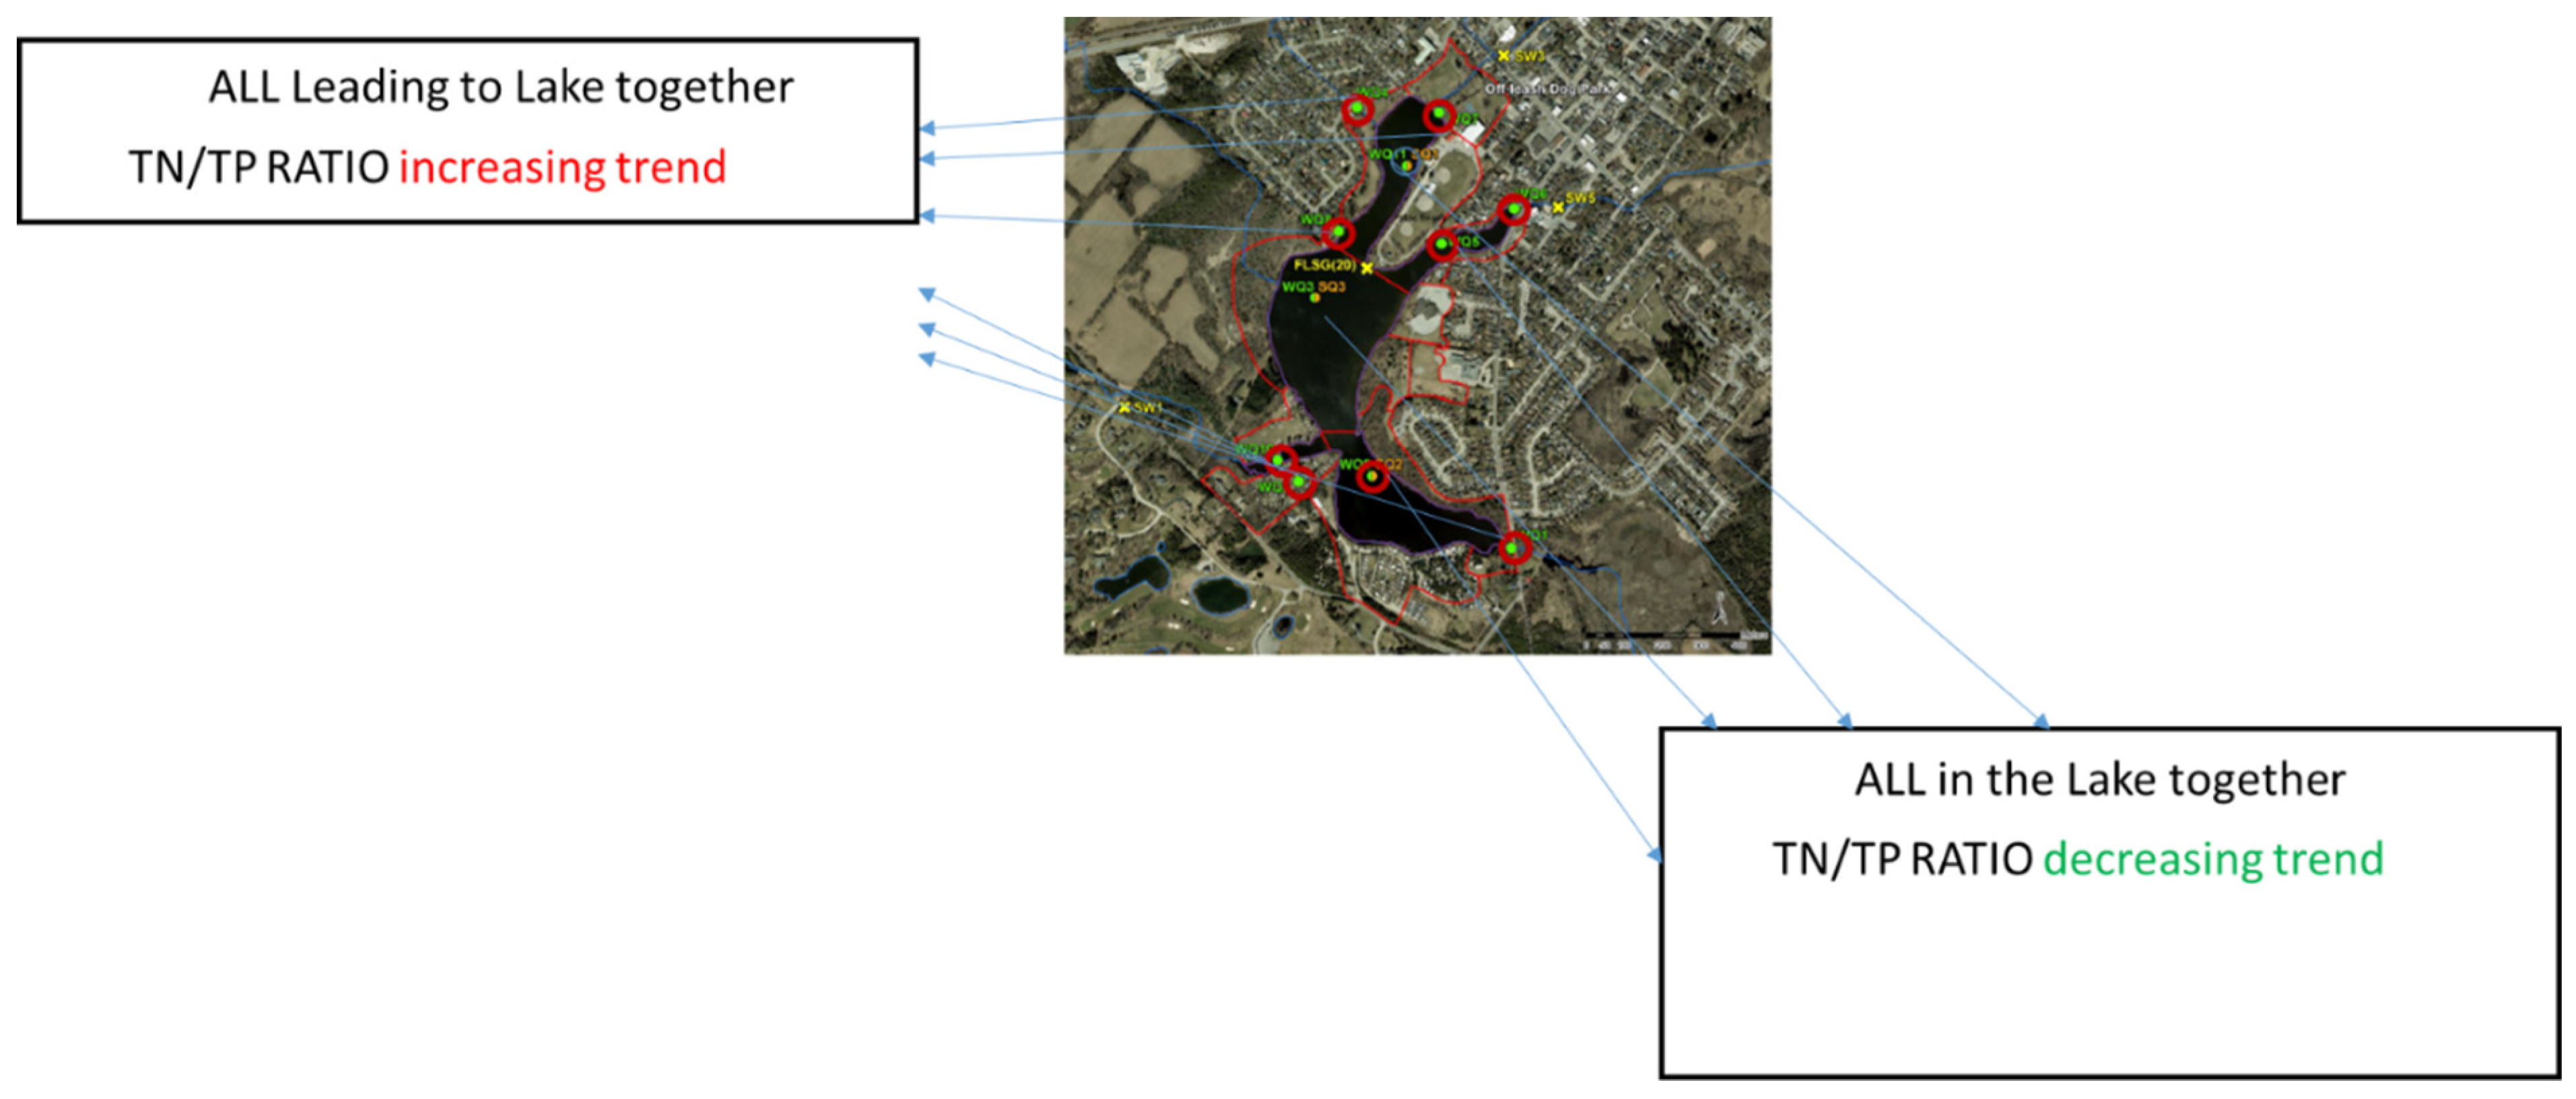
Figure 8.
Human fecal contamination and bird fecal contamination Detection Points.
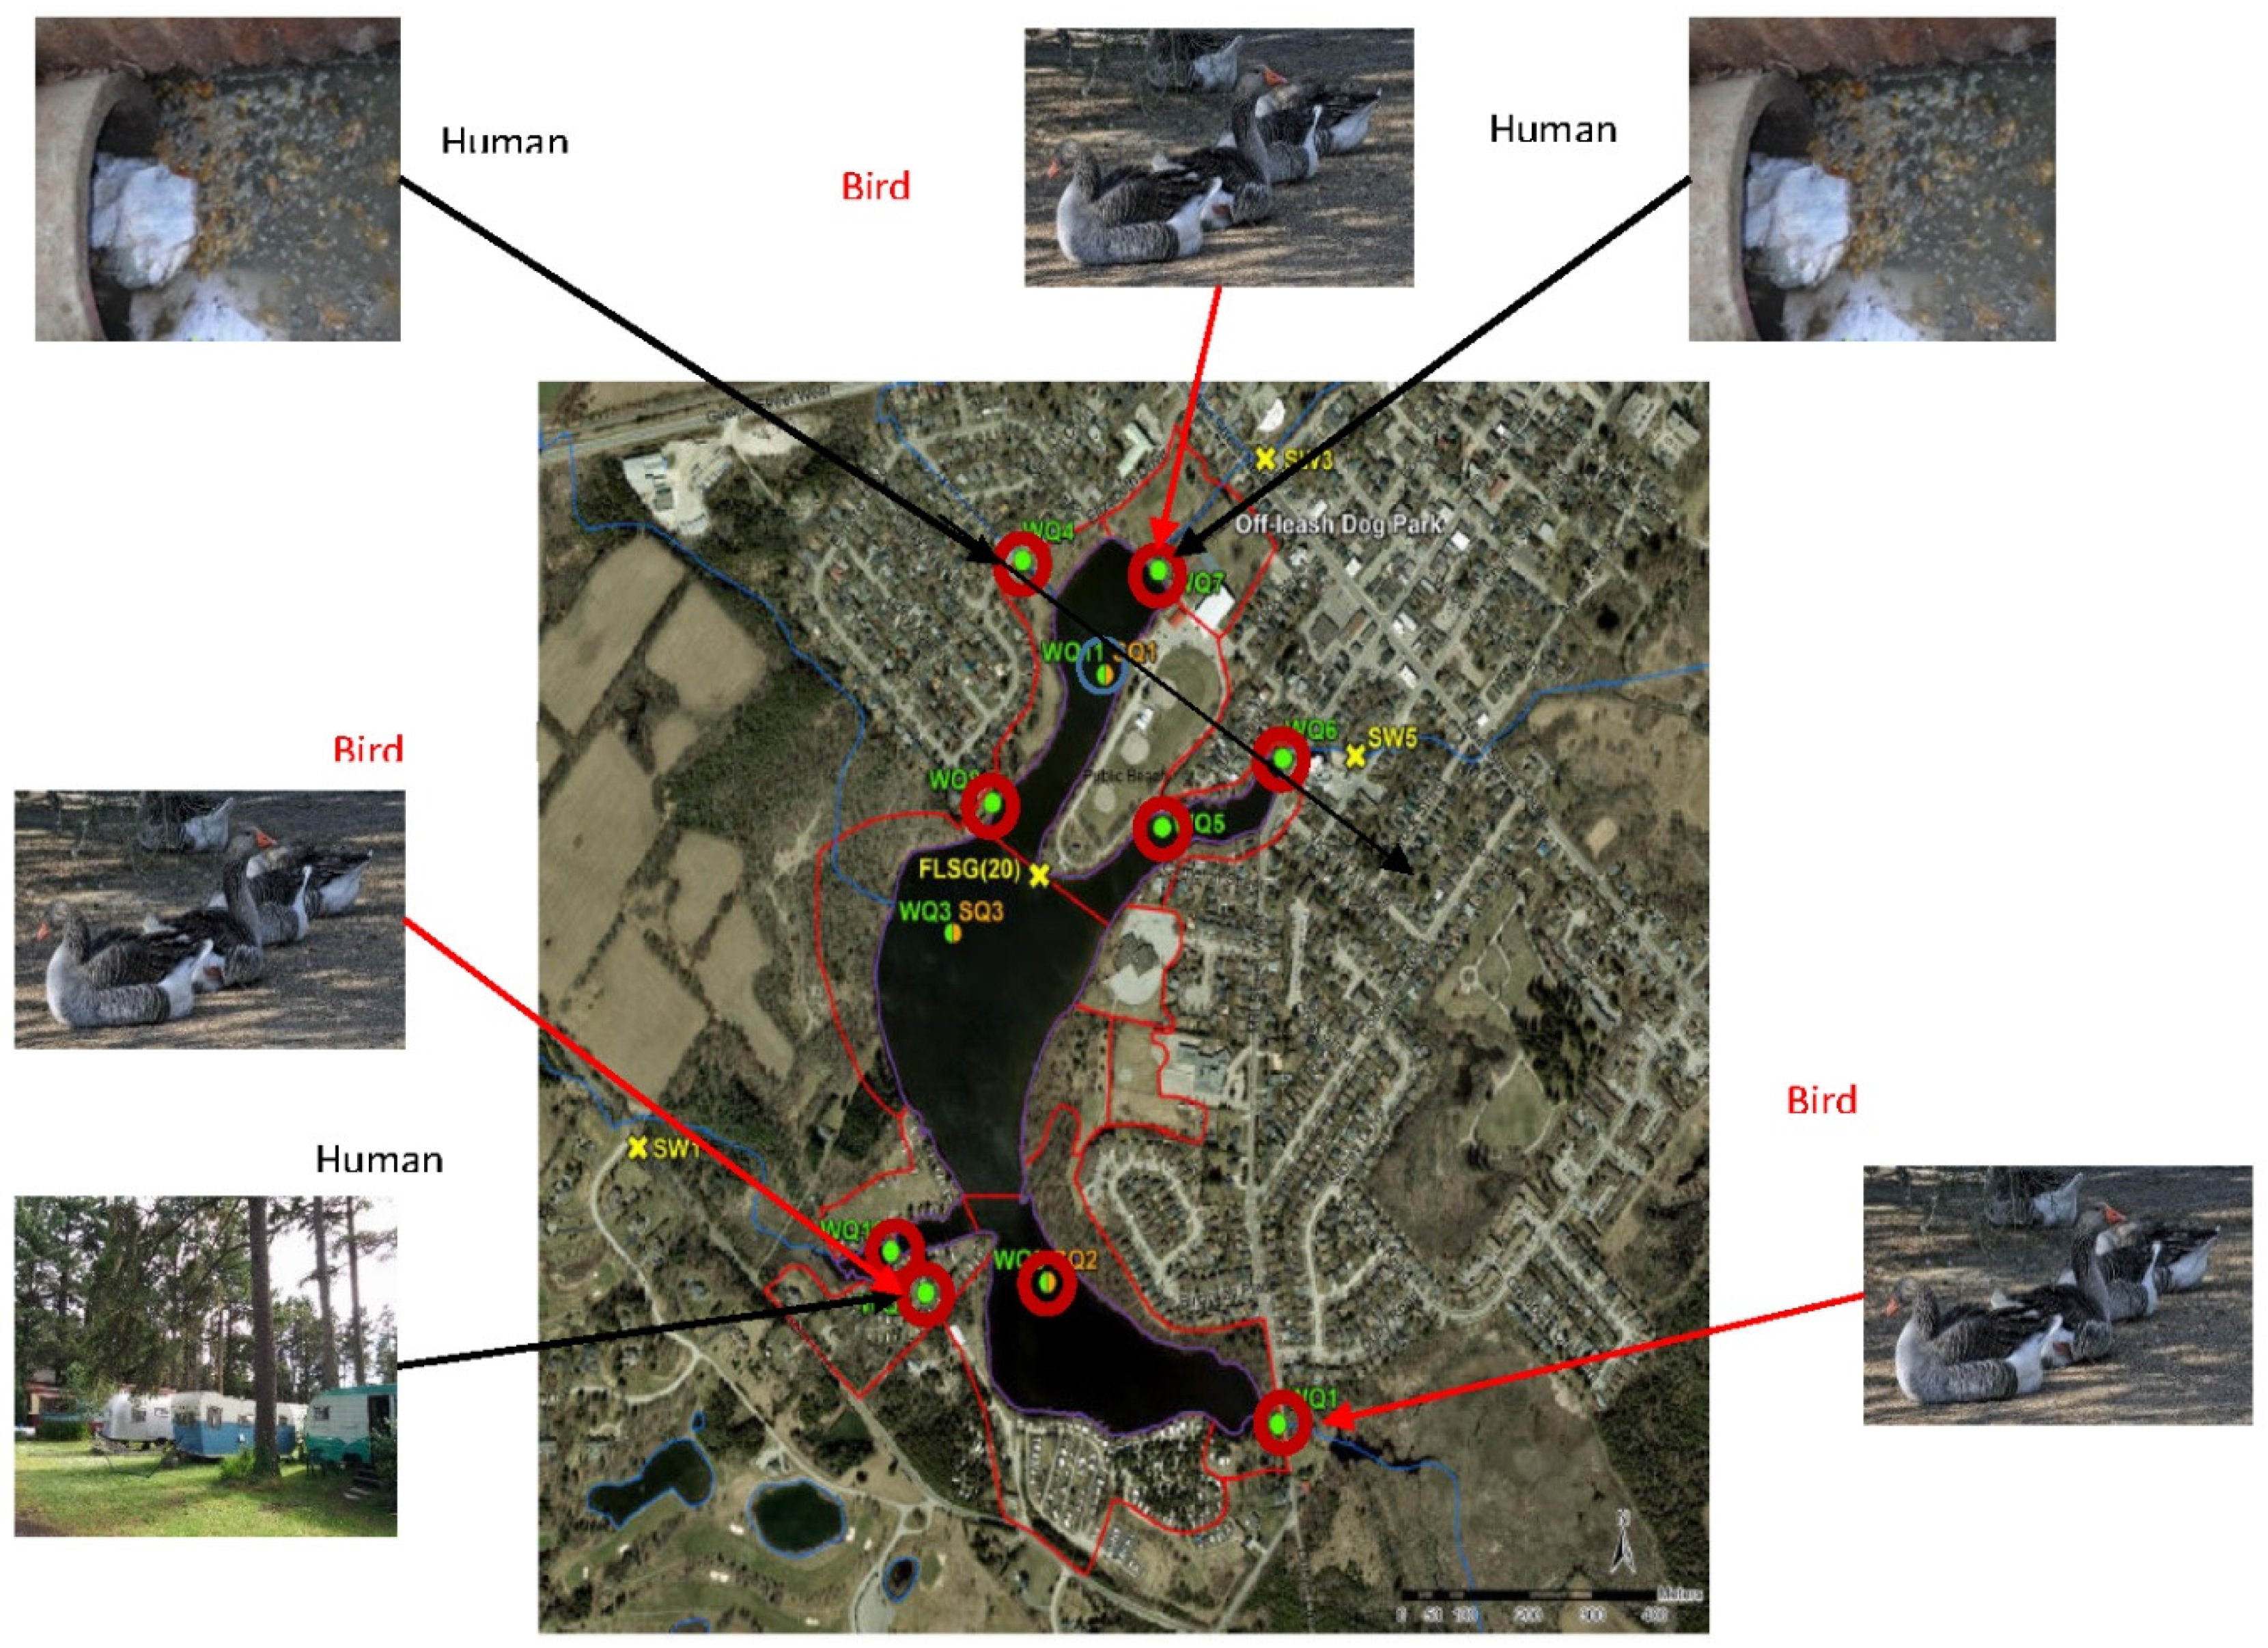
Table 1.
Monitoring Points Location Rationale.
| Monitoring Point | Location | Rationale |
|---|---|---|
| WQ1 | South basin Inlet | Stream Feeding the lake |
| WQ2 | Storm water inlet at trailer park | Stormwater feeding the lake |
| WQ3 | Central basin | In the lake |
| WQ4 | Stormwater outlet - Tyler Avenue | Storm water feeding the lake |
| WQ5 | Old beach | Recreational Beach of the lake |
| WQ6 | Fairy Lake dam | Outlet of the Lake |
| WQ7 | Black Creek inlet | Stream Feeding the lake |
| WQ8 | Storm water outlet - Elmore Drive | Storm water feeding the lake |
| WQ9 | South basin | In the Lake |
| WQ10 | West inlet | Stream Feeding the Lake |
| WQ11 | Northwest basin | In the Lake |
Table 2.
Monitoring Points Events Conditions.
| Event Number | Date | Event Condition |
|---|---|---|
| 1 | 2021/08/03 | Dry |
| 2 | 2021/09/22, | Wet |
| 3 | 2022/01/24 | Dry |
| 4 | 2022/02/17 | Wet |
| 5 | 2022/04/20 | Dry |
| 6 | 5/19/2022 | Dry |
| 7 | 6/8/2022 | Wet |
| 8 | 6/23/2022 | Dry |
| 9 | 7/7/2022 | Wet |
| 10 | 7/13/2022 | Dry |
| 11 | 8/5/2022 | Wet |
| 12 | 9/20/2022 | Wet |
| 13 | 2/10/2023 | Wet |
| 14 | 3/17/2023 | Wet |
| 15 | 3/27/2023 | Wet |
| 16 | 6/12/2023 | Wet |
| 17 | 6/22/2023 | Dry |
| 18 | 7/21/2023 | Wet |
| 19 | 8/24/2023 | Wet |
| 20 | 9/7/2023 | Wet |
| 21 | 11/23/2023 | Dry |
Table 3.
Range of Various Parameters in various Groups.
| wet events to the of lake | wet events in the lake | wet events in the lake | dry events in the lake | |
|---|---|---|---|---|
| NumObs | 88 | 38 | 41 | 29 |
| # Missing | 3 | 14 | 15 | 3 |
| Variable | Range | |||
| dissolved P | 0-0.14 | 0-0.011 | 0.002-0.14 | 0.002-2 |
| E. coli | 0-23000 | 0-3000 | 5-43000 | 5-2 |
| N | 0-4.8 | 0-0.53 | 0.002-4.86 | 0.002-2 |
| TKN | 0-2.3 | 0-0.671 | 0.05-1.8 | 0.24-2 |
| total P | 0-0.22 | 0-0.026 | 0.002-0.26 | 0.002-2 |
| TSS | 0-370 | 0-160 | 0.5-160 | 0.5-53 |
Table 4.
Mean of Various Parameters in various Groups.
| Wet events to the of Lake | Wet events in the Lake | Wet events in the Lake | Dry events in the Lake | |
|---|---|---|---|---|
| NumObs | 88 | 38 | 41 | 29 |
| # Missing | 3 | 14 | 15 | 3 |
| Variable | Mean | |||
| dissolved P | 0.020 | 0.004 | 0.018 | 0.005 |
| E. coli | 1271.000 | 178.300 | 1439.000 | 154.100 |
| N | 0.670 | 0.151 | 0.638 | 0.246 |
| TKN | 0.560 | 0.398 | 0.524 | 0.478 |
Table 5.
Blue Green Algae Test Results from 2018 to 2023.
| Blue Green Algae Test Results | |||
|---|---|---|---|
| Date | Cyanobacteria Observed (Y/N) | Microcystin Level (μg/L) | Anatoxin-A (μg/L) |
| 9/6/2018 | Y | 0.73 | 0.05 |
| 10/25/2018 | N | 0.10 | 0.00 |
| 5/29/2019 | Y | 0.15 | 0.20 |
| 8/6/2019 | N | 0.10 | 0.20 |
| 8/20/2020 | N | 0.10 | 0.20 |
| 9/24/2020 | Y | 0.11 | 0.20 |
| 8/24/2021 | Y | 1.08 | 0.20 |
| 8/22/2022 | Y | - | - |
| 8/24/2022 | Y | - | - |
| 8/25/2022 | Y | - | - |
| 8/26/2022 | Y | - | - |
| 8/29/2022 | Y | - | - |
| 8/30/2022 | Y | - | - |
| 8/31/2022 | Y | - | - |
| 9/1/2022 | Y | - | - |
| 9/2/2022 | Y | - | - |
| 8/9/2023 | Y | - | - |
| 10/18/2023 | Y | 1.72 | 0.20 |
Table 7.
Trend Analysis Results of Various Parameters in Monitoring Points Feeding the Lake.
| WQ1 | WQ2 | WQ4 | WQ7 | WQ8 | WQ10 | |
| dissolved phosphorus | Insufficient evidence | Insufficient evidence | decreasing trend | decreasing trend | decreasing trend | Insufficient evidence |
| E.coli | Insufficient evidence | Insufficient evidence | Insufficient evidence | Insufficient evidence | Insufficient evidence | Insufficient evidence |
| nitrate (n) | increasing Trend | Insufficient evidence | increasing Trend | Insufficient evidence | increasing Trend | Insufficient evidence |
| total kjeldahl nitrogen (TKN) | Insufficient evidence | increasing Trend | Insufficient evidence | Insufficient evidence | Insufficient evidence | Insufficient evidence |
| total phosphorus | Insufficient evidence | Insufficient evidence | decreasing trend | Insufficient evidence | decreasing trend | Insufficient evidence |
| total suspended solids) | Insufficient evidence | Insufficient evidence | Insufficient evidence | Insufficient evidence | Insufficient evidence | Insufficient evidence |
Table 8.
Trend Analysis Results of Various Parameters in Monitoring Points in the Lake.
| WQ3 | WQ5 | WQ9 | WQ11 | |
| dissolved phosphorus | decreasing trend | decreasing trend | decreasing trend | decreasing trend |
| E.coli | Insufficient evidence | Insufficient evidence | Insufficient evidence | Insufficient evidence |
| nitrate (n) | Insufficient evidence | Insufficient evidence | Insufficient evidence | Insufficient evidence |
| nitrate + nitrite (n) | Insufficient evidence | Insufficient evidence | Insufficient evidence | Insufficient evidence |
| nitrite (n) | Insufficient evidence | Insufficient evidence | Insufficient evidence | Insufficient evidence |
| TKN | increasing Trend | increasing trend | increasing trend | Insufficient evidence |
| total phosphorus | decreasing trend | decreasing trend | decreasing trend | decreasing trend |
| total suspended solids) | decreasing trend | Insufficient evidence | decreasing trend | Insufficient evidence |
Table 9.
Statistics of TN/TP ratio in Various Groups.
| ALL DRY EVENTS IN LAKE | ALL WET EVENTS IN LAKE | ALL DRY EVENTS TO LAKE | ALL WET EVENTS TO THE LAKE | |
|---|---|---|---|---|
| Variable | TN over TP | TN over TP | TN over TP | TN over TP |
| NumObs | 28 | 35 | 41 | 87 |
| # Missing | 4 | 17 | 15 | 4 |
| Minimum | 27.14 | 26.25 | 3.211 | 5.529 |
| Maximum | 495 | 480 | 2790 | 1090 |
| Mean | 122.9 | 107.5 | 141.5 | 64.23 |
| 50%ile(Q2) | 73.77 | 52.22 | 31.54 | 27.78 |
Table 11.
TN/TP ratio of each Monitoring Point with regards to TP- limitation, TN- limitation and co-nutrient limitation to the Lake and in the Lake.
Table 11.
TN/TP ratio of each Monitoring Point with regards to TP- limitation, TN- limitation and co-nutrient limitation to the Lake and in the Lake.
| Location | No of Samples | TN:TP ≥ 23 | 23 > TN:TP > 9 | TN:TP ≤ 9 |
|---|---|---|---|---|
| (TP-limitation) | (co-nutrient limitation) | (TN-limitation) | ||
| Points Feeding the Lake | ||||
| WQ-1 | 18 | 7 | 7 | 4 |
| WQ-2 | 18 | 3 | 10 | 5 |
| WQ-4 | 18 | 12 | 4 | 2 |
| WQ-7 | 19 | 14 | 4 | 1 |
| WQ-8 | 18 | 16 | 2 | 0 |
| WQ-10 | 18 | 8 | 7 | 3 |
| Points in the Lake | ||||
| WQ-3 | 16 | 16 | 0 | 0 |
| WQ-5 | 19 | 19 | 0 | 0 |
| WQ-6 | 19 | 17 | 2 | 0 |
| WQ-9 | 15 | 15 | 0 | 0 |
| WQ-11 | 13 | 13 | 0 | 0 |
Disclaimer/Publisher’s Note: The statements, opinions and data contained in all publications are solely those of the individual author(s) and contributor(s) and not of MDPI and/or the editor(s). MDPI and/or the editor(s) disclaim responsibility for any injury to people or property resulting from any ideas, methods, instructions or products referred to in the content. |
© 2024 by the authors. Licensee MDPI, Basel, Switzerland. This article is an open access article distributed under the terms and conditions of the Creative Commons Attribution (CC BY) license (http://creativecommons.org/licenses/by/4.0/).
Copyright: This open access article is published under a Creative Commons CC BY 4.0 license, which permit the free download, distribution, and reuse, provided that the author and preprint are cited in any reuse.


