
Submitted:
24 May 2025
Posted:
26 May 2025
You are already at the latest version
Abstract
The objectives of this study were to determine the genetic variation and phylogenetic relationships of Holstein Friesian, Jersey and Ayrshire crossbred dairy cows and Zebu cattle reared in the humid coastal region of Tanzania based on the HSF1 and HSPA6 genes responsible for heat tolerance. The animals used in the study were obtained from Tanzania Livestock Research Institute (TALIRI) - Tanga and Livestock Training Agency (LITA) Buhuri dairy farms located in Tanga districts and Mruazi Heifer Breeding Unit dairy farm located in Korogwe district. Sixty - five blood samples were collected from Holstein Friesian (23), Ayrshire (15), Jersey (12) crosses, and pure Zebu (15). For each animal, 10 ml of blood was collected by Jugular vein puncture. Total genomic DNA was extracted and amplification performed following manufacturer’s instructions. The polymorphic sites, haplotype diversity (Hd), nucleotide diversity (π), expected heterozygosity (He) and neutrality (FU’s FS and Tajima’s D) tests were calculated. The He was 0.23 ± 0.13, 0.22 ± 0.14, 0.16 ± 0.13, and 0.00 ± 0.00 in Zebu, Holstein Friesian crosses, Jersey crosses and Ayrshire crosses, respectively. The zebu had the highest Hd (0.47 ± 0.08) followed by Holstein Friesian (0.34 ± 0.14), and Jersey (0.33 ± 0.21), while the lowest Hd was observed in Ayrshire crosses (0.00 ± 0.00). The average π was 0.23 ± 0.14, 0.22 ± 0.13, 0.16 ± 0.11, and 0.00 ± 0.00 for Zebu, Holstein Friesian crosses, Jersey crosses and Ayrshire crosses, respectively. Dairy cattle breeds were grouped in one and three clusters based on HSPA6 and HSF1 genes, respectively. There is low genetic diversity and no significant genetic differentiation among the four dairy cattle breeds, an indication of a single panmictic population.
Keywords:
dairy cattle breeds
; heat tolerance
; HSF1 gene
; HSPA6 gene
; haplotype diversity
; genetic diversity
; phylogenetic relationship
1. Introduction
In Tanzania, dairy cattle consist 2.6% of cow population and are basically the crossbred of indigenous East African Shorthorn Zebu (EASZ) and exotic dairy breeds composed of Holstein Friesian, Jersey, and Ayrshire that were imported from western countries and advanced by the government in the 1980s [1,2,3]. These crossbred dairy cattle are reared in the smallholder farms and have been used for natural and artificial selection for production parameters including milk production and composition, growth performance, and reproduction traits [2]. These crossbred dairy cows, however, are relatively susceptible to heat stress (HS) as they are less adapted to tropical climatic conditions [4]. The eastern coastal lowlands in the Tanga region of Tanzania are considered as a HS stress production system for dairy cattle. The production environment in this region is characterized by extreme humidity, low altitude, extreme wind speed, and high temperatures with a temperature-humidity index (THI) ranging between 72 and 79. These conditions lead to mild or moderate HS levels in dairy cows [5,6]. HS leads into negative consequences on health, behavioral changes, and reproduction performance of dairy cows, leading to higher production deprivation globally [7].
The tropical Zebu cattle (Bos indicus) breeds are relatively more tolerant to environmental HS due to their long-term exposure in the tropical climatic conditions compared with Bos taurus dairy breeds [4,8,9]. The zebu cattle are highly adaptable and reproduce in extreme climatic conditions owing to physiological and genetic acclimation [10]. On the other hand, Bos taurus dairy breeds such as Holstein Friesian, Jersey, and Ayrshire that are predominantly reared in the coastal region of Tanzania are highly susceptible to HS compared to Bos indicus breeds [8]. Because of the limitation of EASZ milk producing ability and the lack of adaptability of the imported temperate dairy breeds, efforts have been made in the country to produce crossbred dairy cattle by crossing the pure dairy breeds with the EASZ. The crossbreds tend to have better productive performance than the indigenous EASZ breed and at the same time they are more tolerant to the harsh environment, including HS, compared to pure dairy breeds. The higher tolerance to HS in the crossbred population may be due to the combination of heat-tolerance genes from the EASZ.
In Tanzania, dairy cattle used for milk production are mainly crosses of Friesian and EASZ, Ayrshire and EASZ and Jersey and EASZ. Assessing the genetic diversity of these crosses is essential for determining crossbred animals capable of adapting to HS situations and this can help in effective management of genetic resources [11]. The genetic variation pertains to the heritable variation perceived among the populations, and stipulates the level of differentiation among any species or livestock breeds [12]. Thus, molecular characterization of animals applying genetic markers such as microsatellites and single nucleotide polymorphisms (SNPs) permits the determination of genetic diversity and phylogenetic relationships between livestock populations [1]. Thus, enable to genetically evaluate the variations and determine potential genomic features of crossbred dairy cows [1]. Cheruiyot et al. [2] performed analysis of selection signatures in admixed crossbred dairy cows reared in the southern and northern highlands (i.e., Rungwe and Lushoto districts of Tanzania) and identified potential candidate genes underlying production and adaptation processes. However, limited studies have been conducted to assess the genetic diversity of genes responsible for HS tolerance in crossbred dairy cows reared in the eastern coastal lowlands of Tanzania where the environment is very hot year-round.
Dairy cows express large number of heat shock proteins (HSPs) and respond to heat during acute and persistent stimulation by extreme temperatures [13]. The HSPs are chaperones mediating the cellular response to stress, controlling complicated molecular processes that happen during the stress response, thus considered as candidate genes for heat tolerance in dairy cows [4,14,15]. A raise in the level of these HSPs in threatened cells devotes to protein restore and preservation of cell survival as they prevent cell deterioration [9,16]. Based on their heat tolerance function, HSPs are divided into HSP110, HSP90, HSP70, HSP60 and HSP40 families as well as other small HSPs [15,16,17]. Among these HSPs, HSP70 is the most widely studied protein as it is a conserved protein [15, 18], and is a biomarker for the degree of HS, especially HS accounted by the livestock breed [19]. The HSP70 gene plays a crucial role in cell protection against damage and is highly sensitive to HS in immune cells compared to other HSPs genes in heat-stressed dairy cows [20]. Amid of the HSP70 family genes, the heat shock 70 kDa protein 6 (HSPA6) gene that encrypts for the HSP70 family of protein 6 has been found to have a superior degree of utterance in goats exposed to HS environments [9]. This might be the reason that the HSPA6 gene maintains important functions during extreme HS conditions [9,18]. Besides HSP70, the heat shock family (HSF) is also an important controller of transcription in threatened cells through regulation of transcription of HSP genes that are found on chromosome 14 in cows and is implicated in several physiological actions [8]. The HSF consists of HSF1, HSF2, HSF3, and HSF4 genes [8]. Among these genes, HSF1 and HSF2 are perceived in vertebrate animals while HSF3 and HSF4 are involved in avian and mammalian animals [8]. The HSF1 controls genes which encrypt transcription factors, cell cycle basis and translation elements in threatened cells [8,17,21]. The HSF1 is triggered amidst HS and is highly related with the initiation of HSP70 gene utterance [9].
It is known that individual animals have different abilities to withstand HS. Therefore, it is expected that there is genetic variation in HSPs genes among crossbred dairy cows reared in the eastern coastal lowland of Tanzania. Previous studies have strived to genetically portray the Tanzanian indigenous cows using either microsatellites, random amplified polymorphic DNA (RAPD) or high-density markers such as SNPs [1]. However, no studies have been conducted to assess the genetic diversity and phylogenetic relationship of crossbred dairy cattle in Tanzania based on the candidate genes responsible for heat tolerance. Therefore, the main objective of this study was to determine the genetic diversity and phylogenetic relationship of crosses of Holstein-Friesian, Jersey and Ayrshire with zebu reared in the coastal region of Tanzania using the HSF1 and HSPA6 genes responsible for tolerance to HS in dairy cattle breeds. It is expected that the findings of this study will contribute to the genetic selection and breeding of heat tolerant dairy cattle in the coastal region of Tanzania and other countries with different environmental conditions. This will have crucial implications for the management of dairy breeds and the permanent sustainability of the dairy sector as the incidence of high temperatures and humidity increases in many tropical regions [7].
2. Results
2.1. Genetic Diversity Within Populations
The HSF1 and HSPA6 genes assessed in the present study correspond to nucleotide positions of the cow reference sequences (GenBank accession number: NC_037341.1 for HSF1 and NC_037330.1 for HSPA6). From the 54 consensus sequences generated for the HSF1 gene, four polymorphic sites were detected. The polymorphic sites portrayed three haplotypes (Hap1:TG, Hap2:CG, and Hap3:CC) in all populations from the Tanga region. The number of polymorphic sites were 2, 0, 1, and 1, respectively, for Holstein Friesian crosses, Ayrshire crosses, Jersey crosses, and Zebu cattle breeds (Table 1). From 112 consensus sequences for the HSPA6 gene, one polymorphic site was identified. No genetic diversity indices were estimated for the HSPA6 gene. Additionally, the haplotypes were built for every breed and only 3 haplotypes were attained. The total number of haplotypes from all breeds was 3, of which 3, 2, 2, and 1 were observed from Holstein Friesian crosses, Jersey crosses, zebu, and Ayrshire crosses, respectively. Holstein Friesian crossbred dairy cattle shared with Jersey crosses and Zebu two haplotypes (Hap 1 and Hap 2), and one haplotype (Hap 1) with Ayrshire crosses.
Furthermore, Jersey crosses and Zebu shared two haplotypes (Hap 1 and Hap 2) whilst Ayrshire shared only one haplotype (Hap 1) with all breeds. This shared presence of identical haplotypes among the breeds indicates gene flow and admixture likely due to crossbreeding practices. The polymorphic sites’ number that indicates the number of usable loci that display higher than one allele per locus was also assessed. The polymorphic information content (PIC) value for HSF1 showed that all dairy cattle breeds used in this study have low haplotype diversity (Hd) = 0.31 and Hd = 0.00, respectively for the HSF1 and HSPA6 genes. The haplotype diversity of Zebu was highest (0.47) while Ayrshire showed the lowest haplotype diversity (0.00). Gene diversity ranged from 0.47 to 0.00 in Zebu cattle and Ayrshire crosses, respectively. The highest nucleotide diversity (π ± SD) was observed in Zebu (0.23 ± 0.14) while Ayrshire showed the lowest nucleotide diversity (0.00 ± 0.00) (Table 1).
The genetic variation within populations was calculated using mean number of alleles (MNA) and expected heterozygosity (He) (Table 2). The highest MNA (2.00 ± 0.00) was observed in Holstein Friesian crosses population while the lowest (1.00 ± 0.00) was observed in Ayrshire crosses population. On the other hand, Zebu dairy cattle breeds showed the highest expected heterozygosity (He) while Ayrshire showed the lowest (Table 2). Additionally, the Holstein Friesian crosses showed the highest average nucleotide difference (0.797) while Ayrshire crosses showed the lowest (0.000). On the other hand, Zebu dairy cattle breeds showed the highest expected heterozygosity (He) while Ayrshire showed the lowest (Table 2).
The highest MNA (2.00 ± 0.00) was observed in Holstein Friesian crosses population while the lowest (1.00 ± 0.00) was observed in Ayrshire crosses population. On the other hand, Zebu dairy cattle breeds showed the highest expected heterozygosity (He) while Ayrshire showed the lowest (Table 1).
2.2. Analysis of Molecular Variance, Genetic Differentiation and Phylogenetic Relationship Among the Populations
2.2.1. Analysis of Molecular Variance
The analysis of molecular variance (AMOVA) indicated that about 6.28% of the total genetic variation was observed among the populations while the variation within populations was 93.72% (Table 3). Such a pattern indicates a possible effect of genetic admixture or panmictic population.
2.2.2. Genetic Differentiations
The differentiation coefficient (FST) was used as the measure of the amount of genetic diversity between pairs of the populations. The FST was highest (0.261) between Ayrshire and Zebu and the lowest (-0.503) was observed between Jersey and Zebu cattle population. The biggest genetic distance (0.025) was observed between Ayrshire and Holstein Friesian while the smallest distance (-0.037) was found between Jersey and Holstein Friesian dairy cattle populations (Table 4). Negative or near – zero FST values imply no significant population structure, supporting the notion of extensive genetic mixing between the breeds.
2.2.3. Phylogenetic Relationships Among the Populations
The phylogenetic relationship was determined through the maximum likelihood tree. The phylogenetic tree constructed pertaining to the HSF1 gene sequences (Figure 3) revealed three haplotypes while HSPA6 (Figure 4) revealed one haplotype in which all dairy cattle breed clustered. The analysis of phylogenetic relationships at the HSF1 gene grouped all dairy cattle crosses into three clusters, but the breeds were intermixed and there was no breed specific cluster, while for the HSPA6 gene all breeds were grouped in one cluster. There was no clear clustering pattern in the population as all breeds were grouped within one haplotype for the HSPA6 gene (Figure 4). This lack of breed – specific grouping suggests high genetic relatedness and mixing likely from uncorrelated crossbreeding over time.
2.2.4. Demographic History
Past expansion events of cattle breeds were derived pertaining to the neutrality tests (Table 5). The Fu’s Fs values obtained were negative and statistically non-significant (P ˃ 0.05) for Holstein Friesian (-0.571) and Jersey (-0.0027). Besides, Zebu showed a positive and non-significant Fu’s Fs (1.214). Similarly, the Tajima’s D values obtained, also showed a negative and statistically non-significant (P ˃ 0.05) for Holstein Friesian (-0.648) and Jersey (-0.933). Zebu showed a positive and non-significant Tajima’s D of 1.166. However, both selective tests of neutrality could not be computed on a single locus for Ayrshire (Table 5).
3. Discussion
Knowledge regarding the genetic variation and population structure between cattle breeds is crucial for genetic enhancement, perception of climatic adaptation, usage and preservation of livestock animals [25]. Furthermore, identifying and selecting heat tolerant dairy cows is a potential option for decreasing the negative consequences of HS on dairy cow performance [21]. Heat shock transcription factor 1 (HSF1) and heat shock 70kDa protein 6 (HSPA6) genes have been observed as candidate genes responsible for thermo-tolerance in cows [9,26]. The present study assessed the genetic variation and phylogenetic relationship between Holstein Friesian, Jersey and Ayrshire crossbred dairy cows and Zebu cattle reared in the eastern coastal lowlands of Tanzania based on the HSF1 and HSPA6 genes which are the candidate genes associated with thermo- tolerance in livestock.
3.1. Genetic Diversity Within Populations
In the present study, the Holstein Friesian crossbred cows showed the highest MNA while the Ayrshire crosses had the lowest value. The lower MNA values observed in this study might be due to the small number of breeds used in this study. Moreover, the lower MNA values indicate the lack of diversity in the studied crossbred dairy cows. Also, it might be due to inbreeding which increases homozygosity and in the long run may result in genetic disorders and decreased animal fitness [27]. In this study, the MNA for each breed are lower than those reported by Bora et al. [28] in Ethiopian Bonga, Jimma and Kerayu breeds. Furthermore, the MNA observed in this study are lower than the MNA of 4.9722 reported by Mao et al. [29] in Chinese Holstein cows. The difference can be attributed to the fact that in both studies, they used microsatellite markers to genetically characterize the cattle populations [28,29]. Microsatellite markers have higher polymorphism compared to other genetic markers, and this is the main reason for the lower MNA observed in this study in comparison with the previous studies. Limited studies have assessed the MNA in crossbred dairy cows using HSF1 gene, thus becomes highly difficult to compare the findings of the present study.
The Zebu cattle breed revealed higher He compared to Holstein Friesian, Jersey and Ayrshire crosses. Zebu cattle breeds have advanced for many years and indicate a wide phenotypic and genetic variation, and this has enabled them to evolve special adaptive attributes to withstand shortage of feed, extreme temperatures and relative humidities, extreme disease occurrence including internal and external parasites compared to the commercial breeds [30]. Moreover, Zebu cattle breeds are mainly kept in the traditional production systems where they are exposed to natural and non - systematic artificial selection for production traits in comparison with the commercial breeds [30]. The He values obtained in the present study concur with those reported by Rong et al. [21] who assessed the association of HSF1 genetic variation with heat tolerance in Chinese cattle. The small number of individuals sampled per population studied might be the main reason for the lower value of He. This low level of heterozygosity might be the result of many factors including null alleles, small effective population size, positive assortative mating, unintentional selection opposed with heterozygotes, many periods of inbreeding along with few contacts with other cattle breeds [28,31]. Moreover, the lower He values indicate the need for increasing genetic diversity in these breeds through the use of exchange bulls from the different genetic pools [25]. Ning et al. [32] investigated the genetic variation of MTOR gene responsible for heat resistance in Chinese cattle breeds and found that the He ranged between 0.0783 to 0.4950, an indication that these cows have not been subjected to high intensity of selection and had rich genetic diversity. These findings are not in agreement with the results of this study as the markers used were different with the markers used in the present study.
Zebu cattle breed also showed the highest Hd whilst Ayrshire crosses showed the lowest. All dairy cattle breeds shared two haplotypes, except Ayrshire crosses which shared only one haplotype with the other breeds. The Hd values reported in the present study are lower than those observed by Tarekegn et al. [33] who assessed the variation in the mitochondrial cytochrome b region in Ethiopian indigenous cattle populations. In their study, they found that the Hd in Holstein Friesian 50% blood level was 0.672 ± 0.123 which is greater than that obtained in the present study. This could be the result of greater gene pool of maternal origins in Ethiopian cattle in comparison with the crossbred dairy cows in the current study. Limited studies have reported the Hd in crossbred dairy cows using the HSF1 gene, making it difficult to compare the findings of the present study. However, Strucken et al. [34] reported that a number of breeds that phenotypically resemble as pure indicine may hold greater correlation with Bos taurus origin. The low haplotype diversities observed in this study could be due to the traditional breeding practices of sharing very few superior bulls [35] in the Tanga region. The mixture of moderate haplotype diversity and low nucleotide diversity reported in the current study, implied little differences amidst haplotypes and might be an indication of quick population growth from a little effective population size [36]. It should be noted that the limited number of samples in our study affected the population analysis and may be the reason for the reduced haplotype diversity, especially in Ayrshire cattle breeds.
Furthermore, Zebu cattle breed showed the highest π whereas Ayrshire showed the lowest. The lowest π observed in Ayrshire crossbred cows might be the result of sampling bias whereby majority of animals used in this study (n = 7) could have been collected from animals with alike haplotype origin and consequently very few haplotypes were detected in this study [33]. The absence of genetic variation observed amidst the Ayrshire crosses and Jersey crosses could be due to small population size. The highest He, Hd, and π observed in Zebu cattle population shows that Zebu cattle are highly genetically variable at HSF1 locus in comparison with other crossbreds. It is also perceived that owing to their genetic adaptation to tropical climates, Bos indicus (Zebu) cattle have higher thermotolerant capacity compared to Bos taurus (Holstein Friesian, Jersey, and Ayrshire) cattle [21,34]. Zebu (Bos indicus) cattle have naturally developed adaptive traits like disease resistance and heat tolerance due to prolonged exposure to these stresses, and this might have contributed to maintaining higher genetic diversity. Furthermore, Zebu cattle are native to tropical climatic conditions and have evolved under high heat and humidity conditions, this likely has led to the retention of genetic variants that confer heat tolerance. This adaptive evolution contributed to their higher genetic diversity, particularly for the HSF1 and HSPA6 genes associated with HS response. The π values reported in the current study are lower than those observed by Meseret et al. [37] in Ethiopia for Holstein Friesian (π = 0.308) and Jersey (π= 0.264). On the other hand, the π values reported in this study are greater than those observed by Tarekegn et al. [33] who found π = 0.0009 ± 0.0003 in Holstein Friesian 50% blood level. However, the findings of this study are consistent with those reported by Bhuiyan et al. [38] in indicine Bangladesh cattle population who found nucleotide diversity values ranging between 0.22 and 0.23.
3.2. Genetic Differentiation and Phylogenetic Relations Among the Populations
The genetic differentiation (FST) values describe the amount of genetic differentiation and relatedness among populations [34]. In this study, the highest FST values were observed between Ayrshire crosses and Zebu, followed by that between Ayrshire crosses and Jersey crosses. The high level of genetic differentiation between these breeds can be attributed to reproductive isolation originating from being located in dissimilar geographical environment [38,39] as Zebu breed was reared in a specific farm at TALIRI Tanga whilst Jersey and Ayrshire breeds were reared in other dairy cattle farms in the Tanga region. The estimated FST values in this study are lower than that found among the Ethiopian cattle breeds (0.129). Furthermore, the FST values obtained in this study are lower than those reported in South African cattle breeds [25]. However, our findings are higher than those reported by Bhuiyan et al. [38] with a FST value of 0.07.
Fixation index of amidst 0 and 0.05 indicate absence of genetic differentiation, while values amidst 0.05 to 0.15 shows a moderate differentiation [24]. The negative FST values observed between Jersey and Holstein Friesian, Jersey and Zebu as well as between Zebu and Holstein Friesian indicate that there is no population subdivision at this locus. This also suggests that these crossbred dairy cows reared in the Tanga region are not highly differentiated [39]. Moreover, these negative FST values observed between the crossbred dairy cows reflect the close relationship of the breeds to each other or no occurrence of genetic differentiation between populations [40]. Furthermore, the low FST values observed in this study might be the outcome of latest similar ancestral origin, multiple introgressions along with greater genetic exchange between the crossbreds’ dairy cows reared in the Tanga region [33]. The promotion of crossbreeding between Bos taurus dairy breeds and indigenous Zebu cattle in the Tanga region could have resulted into genetic admixture, hence, lowering the FST values than that might be expected if pure breeds were compared. The lower genetic distance observed among dairy cattle breeds in this study suggests that the dairy cattle raised in the Tanga region are not genetically differentiated as independent breeds, which could be due to their similar ancestral origin and exchange of genetic material in the recent past [37,38]. This could also be the result of possible gene flow between every pair of animals as a result of common geographical location and lack of controlled breeding in the farms where the dairy cows were sampled [31]. This scenario is also supported from the phylogenetic results where the HSPA6 gene grouped all dairy cattle population in a single cluster suggesting strong gene flow among the breeds. The lack of breed specific clusters observed in this study, suggests high gene flow between commercial and Zebu dairy cattle populations. In this study, the lowest genetic distance was observed between Ayrshire and Holstein Friesian crosses. Similarly, the lowest genetic distance was observed between Ayrshire crosses and Zebu cattle. The genetic distance values between the pairs of breeds were close to zero indicating that these breeds shared their genetic material through breeding [11]. It is perceived that in the semi-intensive management system rehearsed in the coastal lowlands and farms where the cows were sampled, occasional interbreeding between these breeds have occurred for long period, hence, the low level of genetic variation between these breeds [31].
Analysis of molecular variance between Zebu along with commercial breeds (Holstein Friesian, Jersey, and Ayrshire) indicated that about 93.72% of the genetic diversity occurred within the populations, an indication of high gene exchange or low genetic differentiation between the dairy cattle populations. Such a pattern reflects high within-population variation and low differentiation, a common outcome of genetic admixture or panmictic population. The similar trend of genetic admixture in Tanzania dairy cattle breeds was also reported in previous studies [2,41] conducted in Lushoto and Rungwe Districts. In their study, they reported that the range of admixture in Tanzania dairy cattle is quite high given the spectrum of taurine introgression observed [41]. Furthermore, similar high genetic variation (90%) within population has been reported in South Africa [25]. However, the variation within populations observed in this study is slightly lower than the value of 94.45% reported by Tarekegn et al. [33] in the Ethiopian indigenous cattle population and Holsten Friesian 50% blood level. The results for genetic variation among the populations revealed that only 6.28% of the total variation was found between the populations. This observation reflects substantial degree of isolation and this is likely to happen in breeds kept in research institutions [31]. This can be attributed to absence of selective breeding and random mating among the breeds. Moreover, the reported little genetic diversity between the populations can be correlated with limited gene flow amidst the dairy cattle breeds (Holstein Friesian, Jersey, and Ayrshire). It can also be attributed to the small sample size used in the present study.
Visualization of breed relationship was performed by constructing a neighbor joining tree pertaining with the genetic distance of Tamura-Nei. The phylogenetic analysis pertaining with the HSF1 gene indicated that all dairy cattle breeds were grouped into three clusters while the analysis of the HSPA6 gene grouped the breeds in one cluster. This confirms the closer relationship among Zebu and Bos taurus dairy breeds. The observed relationship of breeds indicated in the current study shows high level of interbreeding [31]. Moreover, the observed close relationship between the dairy cattle breeds studied may be attributed to the small sample size [25]. It will be crucial to enlarge this breed degree assessment in upcoming studies through incorporation of other dairy cattle breeds from other coastal region of Tanzania in order to better understand the genetic correlation between the dairy cattle breeds reared in coastal region of Tanzania.
3.3. Demographic History Within the Populations
Neutrality tests of the breeds were carried out using Fu’s Fs and Tajima’s D statistics to investigate the signatures of latest historical demographic occurrence. Tajima’s D test pertains on comparison of the allelic frequency of segregating nucleotide sites whilst the Fu’s Fs test pertains on the alleles or haplotype distributions [36]. In this study, the Fu’s Fs and Tajima’s D tests showed that Holstein Friesian crosses and Jersey crosses were neutral. Similar findings have been reported in Ethiopian indigenous cattle breeds by Mandefro et al. [42]. The negative Fu’s Fs and Tajima’s D values observed on Holstein Friesian and Jersey dairy cattle population portrays the affirmation of an extra number of alleles and can be the result from a latest population growth or genetic hitchhiking [36,42]. The negative values of neutrality observed between Holstein Friesian and Jersey dairy cows also indicate a natural selection pressure in the populations resulting from an extra rare allele [33]. In another study by Tarekegn et al. [33] in Ethiopia, they also reported an overall negative neutrality test (Tajima’s D = -1.0312 ± 0.484) which concur with the results of the present study. However, the positive Fu’s Fs and Tajima’s D values observed in Zebu cattle population suggest a deficiency of alleles, that could be the result of a latest population bottleneck or balancing selection [36]. Furthermore, breeds kept in highly stressful environmental conditions are required to evolve adaptive immunity through the principles of natural selection and hence, diversifications of immune-related genes might occur [43]. This suggests the presence of greater polymorphic sites and higher number of total mutation rates in the Zebu cattle population.
4. Materials and Methods
4.1. Ethics Statement
This study was conducted following the approval by the research ethics committee of Sokoine University of Agriculture (SUA), and given the research clearance (reference number: SUA/ADM/R.1/8/843) by the Vice – Chancellor of SUA on behalf of the Tanzania Commission for Science and Technology (COSTECH). The study was performed in accordance to the good scientific practices approved by the institution. During blood sampling the cows were repressed by expert veterinarians and all animal welfare concerns were addressed to minimize discomfort.
4.2. Study Site
The animals used in this study were obtained from three different dairy farms namely, Tanzania Livestock Research Institute (TALIRI) - Tanga and Livestock Training Agency (LITA) Buhuri campus located in Tanga district and Mruazi Heifer Breeding Unit dairy farm located in Korogwe district. Both districts are located in the Tanga region. It is based in the eastern coastal lowland of Tanzania. The province comprises 26,680 km2 and belongs amid of latitude 4.965088o S and 5.5743o S and longitude 38.2744o E and 38.7787 o E [6]. The eastern coastal lowland is known for its extreme temperatures, humidities, and increased heat load with the temperature-humidity index (THI) reaching over 77.29 in the hot season [5]. Additionally, perennial rainfall in the region spans through 1230 to 1400 mm, dipping in two seasons through which peaks occur amid of April-May and October-November. The average temperature in cold period (May - August) ranges from 20 – 24 ◦C and 23 – 28 ◦C amidst the night and day, successively. During the hot period, the average temperature spans from 260C to 330C, of which January and February are the yearly warmest months. The humidity of the area spans from 65% to 100% [22].
4.3. Animal Breeds and Blood Sampling
In order to determine the diversity of the candidate genes responsible for heat tolerance in dairy cattle reared in Tanga region, crossbreds of Holstein-Friesian, Ayrshire, and Jersey with EASZ were sampled. Only crossbred animals with 50% and 75% blood level of the mentioned dairy breeds were sampled. In addition, pure zebu breed (Bos indicus) found in Tanga was included as a reference breed. The zebu breed was used owing to its adaptation to harsh climatic environments such as extreme temperatures, relative humidity, wind speed, and solar radiation and high burden of parasites whereas Holstein-Friesian, Jersey, and Ayrshire (Bos taurus) are known to have the low ability to tolerate HS compared to the zebu breed. Zebu breed has many genes associated with thermotolerance [21]. Studies have shown that a sample size of between three and 20 animals is sufficient to estimate genetic diversity of breeds [23]. Therefore, blood samples were collected from Holstein-Friesian (23), Ayrshire (15), Jersey (12) crossbred dairy cows and pure zebu cows (15) cows reared in the Tanga region. For each breed, only unrelated animals were sampled. About 10 ml of blood was collected from each animal by Jugular vein puncture and placed into the vacutainer tube, anti-coagulated with EDTA. Each tube was labeled with the animal identification number (ear tag number) and the blood samples were stored in a cool box packed with ice and then shipped to a laboratory at the Tanzania Livestock and Research Institute (TALIRI)-Tanga within six hours and kept at 4oC. On the next day, blood samples were shipped to the molecular biology laboratory at SUA for further analysis.
4.4. DNA Extraction
Total genomic DNA was extracted in the whole blood samples employing the genomic DNA min extraction kit (Quick-gDNATM MiniPrep plus) (Zymo Research Corp.) based on the manufacturer’s instructions. Gel electrophoresis was assessed using 1.5% agarose gel to assess the integrity of DNA. A total of 5 µL of DNA sample was loaded on the agarose gel and gel electrophoresis was run at 100 V at about 1 hour. The gel was dyed with gel red and observed through UV light gel documentation machine.
4.5. DNA Quantification
To determine the purity and concentration of obtained DNA, the DNA samples were assessed employing Nanodrop Spectrophotometry (Thermo Scientific, Marlborough, England, UK). The quality of DNA was verified by determining the DNA concentration through the elute, by measuring the absorbance at 260 nm. The A260/A280 ratio of all DNA samples ranged from 1.712 to 2.188. The DNA concentration for every sample was later accustomed to 50 ng/µL.
4.6. DNA Amplification and Gel Electrophoresis of PCR Products
In this study, HSF1 and HSPA6 genes from HSPs family that are known as HS resilient genes in cattle were targeted. The forward primer targeting the amplified fragments of PCR products for the HSF1 gene was 5ꞌ-AGCAAATCCCATGCCGAGG-3ꞌ while the reverse primer was 5ꞌ-CGACCACCCTTATTGACTCCA-3ꞌ. The forward primer for the HSPA6 gene was 5ꞌ-GAAACCACAACCATGTCCGC-3ꞌ whilst the reverse primer was 5ꞌ-AGTCGTTGAAGTAGGCAGGC-3ꞌ. The targeted loci for these genes were amplified using Bio-Rad T100 Thermal cycler following the manufacturer’s instructions. Briefly, the PCR amplification protocol for HSF1 and HSPA6 genes were the same, except that annealing for HSPA6 genes was set at 57oC for 45 sec whilst for HSF1 gene was set at 62oC for 45 sec. The PCR amplification for HSF1 and HSPA6 genes were carried out in a 50 μL tube holding 1 μL bovine genomic DNA (20 ng/μL), 1 μL forward primer (10 μM), 1 μL reverse primer (10 μM), 12.5 µL of PCR Master Mix (2X) (fermentas) and 8.5µL of water. The reaction conditions for HSF1 were set at 95 °C for 5 min for initial denaturation, followed by 35 cycles of denaturation at 95 °C for 30 sec; annealing at 62 oC for 45 sec and extension at 72 °C for 45 sec and final extension at 72 °C for 10 min, followed by cooling at -20 oC. The amplification conditions for the HSPA6 gene were as follows: the denaturation process began with 5 min at 950C, then 35 cycles at 950C for 30 sec, annealing at 570C for 45 sec with extension at 72oC for 45 and a final extension at 720C for 10 min in a Bio-Rad T100 Thermal cycler. To assess the success of amplification for HSF1 and HSPA6 genes, the PCR products were electrophoresed on 1.5% agarose gel. The gel was assembled by dissolving 1.5 g of agarose powder in 100 ml 1X TAE buffer, and the gel was stained with gel red. A total of 5 µL of the PCR products for every gene was filled on a 1.5 % agarose gel red. Electrophoresis was performed at 80 V for 1:00 h. Following gel electrophoresis, the gel pictures (Figure 1 and Figure 2) were held amid UV Tran’s illuminator through Biodoc analysis using a digital cannon camera. Out of 65 DNA samples, only 56 sampled amplified well and were sequenced for HSPA6 gene whilst for HSF1 only 53 amplified and sequenced.
4.7. PCR Purification and Sequencing
The PCR products were purified employing the Gel Extraction Kit (Zymo research, South Africa). Thereafter, PCR products were sequenced employing Big Dye® Terminator v3.1 Cycle Sequencing Kit (Thermo Fisher, South San Francisco, CA, USA) using the same primers as those used during amplification process. Sequencing was performed for the amplified products with a size of 257 base pairs for HSF1 gene and 475 base pairs for HSPA6 gene. Forward and reverse sequences were sequenced from amplified fragments employing Big Dye® Terminator v3.1 Cycle Sequencing Kit (Thermo Fisher, South San Francisco, CA, USA). The fragments were analyzed on an ABI PRISMTM 3100 Genetic Analyzer (Applied Biosytems). The FASTA files for sequences of HSF1 and HSPA6 genes were obtained after sequencing these genes.
4.8. Data Analysis
BLASTn was used to identify sequence similarity with other related sequences. Out of 53 sequences for the HSF1 gene, 27 samples had good quality sequences for further analysis. Thus, a total of 26 samples were removed from the analysis because of bad sequences. On the other hand, all 56 samples that were sequenced for the HSPA6 gene had good quality sequences. The analysis of homology was performed through the BLAST program found at http://ncbi.nlm.nih.gov/BLAST. Thereafter, the sequences were quality checked, trimmed, and edited using Chromas version 2.5.1 software. Moreover, SeqMan ultra version 17.2.0 was used to align the sequences with reference gene sequences of the HSF1 and HSPA6 genes to derive the consensus sequences for each gene. Reference sequences of cattle for the HSF1 and HSPA6 genes were used during alignment. Multiple sequence alignment was carried out employing Multiple Sequence Comparison by Log Expectation (MUSCLE) version 3.8.31 [24] within a Seaview version 3.2 software. Haplotypes were counted manually and validated employing DnaSP version 6 [24], and population genetic diversity indices [polymorphic sites, haplotype diversity (Hd), nucleotide diversity (π), expected heterozygosity (He) and mean number of alleles (MNA)] were calculated using Arlequin version 3.5.2.2 software for the HSF1 gene. Determination of the genetic differentiation within the populations, an analysis of molecular variance (AMOVA) was computed employing Arlequin version 3.5.2.2 software for HSF1 haplotypes. To determine the pairwise fixation index (FST), FST genetic distances, and neutrality (FU’s FS and Tajima’s D) tests, we also used Arlequin version 3.5.2.2 software. The phylogenetic relationship was computed through the use of the maximum likelihood algorithm implemented in Molecular Evolutionary Genetic Analysis (MEGA) 11. Bootstraps of 1000 replications and Tamura-Nei joining network were used.
5. Conclusions
In the present study, the genetic variation and phylogenetic relationship of dairy cattle breeds reared in the Tanga and Korogwe districts in Tanzania were assessed using the HSF1 and HSPA6 genes. The results showed that there is low haplotype diversity and low nucleotide diversity in the dairy cattle breeds reared in the Tanga region as portrayed by the HSF1 gene. Results of neutrality tests of commercial dairy cattle populations indicate negative results, suggesting an excess of rare nucleotide variants and rare haplotypes for dairy cattle breeds reared in Tanga region. Moreover, the study indicated absence of significant genetic differentiation between the dairy cattle breeds from the three sampling locations in Tanga, suggesting that the populations are panmictic. However, the Ayrshire dairy cattle breeds appear to be slightly differentiated from the other two dairy cattle breeds. Thus, the dairy cattle breeds from the three dairy farms sampled can be regarded as a single stock unit for genetic improvement purposes. Knowledge produced from this work can form the foundation for future management and genetic improvement of these dairy cattle breeds.
Author Contributions
Conceptualization, VH, ASN and SWC; methodology, VH and SWC; formal analysis, VH; data curation, VH; writing-original draft preparation, VH; writing-review, editing and supervision, ASN, ZCN, CC-ED, GM, RM, and SWC. All authors have read and agreed to the published version of the manuscript.
Funding
This study was funded by the Regional Scholarship and Innovation Fund (RSIF) of the Partnership for Skills in Applied Sciences, Engineering, and Technology (PASET) (Project Grant Number: P165581) grant to the SACIDS Africa Centre of Excellence for Infectious Diseases of Humans and Animals in the Southern and East Africa (SACIDS-ACE) at the Sokoine University of Agriculture (SUA). VH is a recipient of an RSIF-PASET doctoral scholarship at SUA.
Data Availability Statement
The data that support this study will be shared upon reasonable request to the corresponding author.
Acknowledgments
The authors acknowledge the assistance provided by Mariam Richard Makange of the SACIDS Africa Centre of Excellence for Infectious Diseases, SACIDS Foundation for One Health, SUA during DNA extraction and PCR amplification analyses. The authors also acknowledge the assistance provided by Stephen Omondi Ogada of the Institute for Biotechnology Research, Jomo Kenyatta University of Agriculture and Technology during data analyses. The authors also extend appreciation to the smallholder dairy farmers in Tanga that allowed VH to collect blood samples from their animals. The funders had no role in study design, data collection and analysis, the decision to publish, or the preparation of the manuscript. The findings and conclusions of this study are those of the authors and do not necessarily represent the views of the funders.
Conflicts of Interests
The authors have not declared any conflict of interest regarding the publication of this article.
References
- Msalya, G.; Kim, E.-S.; Laisser, E.L.K.; Kipanyula, M.J.; Karimuribo, E.D.; Kusiluka, L.J.M.; Chenyambuga, S.W.; Rothschild, M.F. Determination of Genetic Structure and Signatures of Selection in Three Strains of Tanzania Shorthorn Zebu, Boran and Friesian Cattle by Genome-Wide SNP Analyses. PLOS ONE 2017, 12, e0171088. [Google Scholar] [CrossRef] [PubMed]
- Cheruiyot, E.K.; Bett, R.C.; Amimo, J.O.; Zhang, Y.; Mrode, R.; Mujibi, F.D.N. Signatures of Selection in Admixed Dairy Cattle in Tanzania. Front. Genet. 2018, 9, 607. [Google Scholar] [CrossRef] [PubMed]
- Kibona, C.A.; Yuejie, Z.; Tian, L. Towards developing a beef meat export oriented policy in Tanzania: -Exploring the factors that influence beef meat exports-. PLOS ONE 2022, 17, e0270146. [Google Scholar] [CrossRef] [PubMed]
- Sajjanar, B.; Aalam, M.T.; Khan, O.; Tanuj, G.N.; Sahoo, A.P.; Manjunathareddy, G.B.; Gandham, R.K.; Dhara, S.K.; Gupta, P.K.; Mishra, B.P.; et al. Genome-wide expression analysis reveals different heat shock responses in indigenous (Bos indicus) and crossbred (Bos indicus X Bos taurus) cattle. Genes Environ. 2023, 45, 1–15. [Google Scholar] [CrossRef]
- Shija, D. S. , Okeyo, M. A., Migwi, P. K., Kelya, N. J., and Bebe, B. O. (2022). Assessing Animal Disease Prevalence and Mortality in Smallholder Dairy Farms under Contrasting Management Practices and Stressful Environments in Tanzania. Open Journal of Veterinary Medicine 12, 117–134. [CrossRef]
- Habimana, V., Nguluma, A. S., Nziku, Z. C., Ekine-Dzivenu, C. C., Morota, G., Mrode, R., and Chenyambuga, S. W. (2024). Heat Stress Effects on Physiological and Milk Yield Traits of Lactating Holstein Friesian Crossbreds Reared in Tanga Region, Tanzania. Animals, 14(13). https://doi.org/10.3390/ ani14131914. [CrossRef]
- Abbas, Z.; Hu, L.; Fang, H.; Sammad, A.; Kang, L.; Brito, L.F.; Xu, Q.; Wang, Y. Association Analysis of Polymorphisms in the 5′ Flanking Region of the HSP70 Gene with Blood Biochemical Parameters of Lactating Holstein Cows under Heat and Cold Stress. Animals 2020, 10, 2016. [Google Scholar] [CrossRef]
- Gill, J.K.; Arora, J.S.; Kumar, B.V.S.; Mukhopadhyay, C.S.; Kaur, S.; Kashyap, N. Cellular thermotolerance is independent of HSF 1 expression in zebu and crossbred non-lactating cattle. Int. J. Biometeorol. 2017, 61, 1687–1693. [Google Scholar] [CrossRef]
- Rocha, R.d.F.B.; Baena, M.M.; Estopa, A.d.C.; Gervásio, I.C.; Ibelli, A.M.G.; Gionbelli, T.R.S.; Gionbelli, M.P.; de Freitas, R.T.F.; Meirelles, S.L.C. Differential expression of HSF1 and HSPA6 genes and physiological responses in Angus and Simmental cattle breeds. J. Therm. Biol. 2019, 84, 92–98. [Google Scholar] [CrossRef]
- Rojas-Downing, M.M.; Nejadhashemi, A.P.; Harrigan, T.; Woznicki, S.A. Climate change and livestock: Impacts, adaptation, and mitigation. Clim. Risk Manag. 2017, 16, 145–163. [Google Scholar] [CrossRef]
- Corredor, F.-A.; Figueroa, D.; Estrada, R.; Salazar, W.; Quilcate, C.; Vásquez, H.V.; Gonzales, J.; Maicelo, J.L.; Medina, P.; Arbizu, C.I. Genetic diversity and population structure of a Peruvian cattle herd using SNP data. Front. Genet. 2023, 14, 1073843. [Google Scholar] [CrossRef]
- Martínez-Rocha, R.; Hidalgo, J.; Cesarani, A.; Ramírez-Valverde, R.; Núñez-Domínguez, R.; García-Muñiz, J.G.; Domínguez-Viveros, J. Assessment of Genetic Diversity, Runs of Homozygosity, and Signatures of Selection in Tropical Milking Criollo Cattle Using Pedigree and Genomic Data. Genes 2022, 13, 1896. [Google Scholar] [CrossRef] [PubMed]
- Zeng, L.; Cao, Y.; Wu, Z.; Huang, M.; Zhang, G.; Lei, C.; Zhao, Y. A Missense Mutation of the HSPB7 Gene Associated with Heat Tolerance in Chinese Indicine Cattle. Animals 2019, 9, 554. [Google Scholar] [CrossRef] [PubMed]
- Elayadeth-Meethal, M.; Tiambo, C.K.; Naseef, P.P.; Kuruniyan, M.S.; Maloney, S.K. The profile of HSPA1A gene expression and its association with heat tolerance in crossbred cattle and the tropically adapted dwarf Vechur and Kasaragod. J. Therm. Biol. 2022, 111, 103426. [Google Scholar] [CrossRef]
- Han, X.; Jin, S.; Shou, C.; Han, Z. Hsp70 Gene Family in Sebastiscus marmoratus: The Genome-Wide Identification and Transcriptome Analysis under Thermal Stress. Genes 2023, 14, 1779. [Google Scholar] [CrossRef]
- Rehman, S.U.; Nadeem, A.; Javed, M.; Hassan, F.-U.; Luo, X.; Khalid, R.B.; Liu, Q. Genomic Identification, Evolution and Sequence Analysis of the Heat-Shock Protein Gene Family in Buffalo. Genes 2020, 11, 1388. [Google Scholar] [CrossRef]
- Trivedi, R.; Jurivich, D.A. A molecular perspective on age-dependent changes to the heat shock axis. Exp. Gerontol. 2020, 137, 110969. [Google Scholar] [CrossRef]
- Elrobh, M.S.; Alanazi, M.S.; Khan, W.; Abduljaleel, Z.; Al-Amri, A.; Bazzi, M.D. Molecular Cloning and Characterization of cDNA Encoding a Putative Stress-Induced Heat-Shock Protein from Camelus dromedarius. Int. J. Mol. Sci. 2011, 12, 4214–4236. [Google Scholar] [CrossRef]
- Banerjee, D.; Upadhyay, R.C.; Chaudhary, U.B.; Kumar, R.; Singh, S.; Ashutosh; G., J.M.; Polley, S.; Mukherjee, A.; Das, T.K.; et al. Seasonal variation in expression pattern of genes under HSP70. Cell Stress Chaperon- 2014, 19, 401–408. [CrossRef]
- Kim, W.-S.; Nejad, J.G.; Roh, S.-G.; Lee, H.-G. Heat-Shock Proteins Gene Expression in Peripheral Blood Mononuclear Cells as an Indicator of Heat Stress in Beef Calves. Animals 2020, 10, 895. [Google Scholar] [CrossRef]
- Rong, Y.; Zeng, M.; Guan, X.; Qu, K.; Liu, J.; Zhang, J.; Chen, H.; Huang, B.; Lei, C. Association of HSF1 Genetic Variation with Heat Tolerance in Chinese Cattle. Animals 2019, 9, 1027. [Google Scholar] [CrossRef]
- Miyayo, S.F.; Owili, P.O.; Muga, M.A.; Lin, T.-H. Analysis of Pneumonia Occurrence in Relation to Climate Change in Tanga, Tanzania. Int. J. Environ. Res. Public Heal. 2021, 18, 4731. [Google Scholar] [CrossRef]
- Onasanya, G.O.; Msalya, G.M.; Thiruvenkadan, A.K.; Sreekumar, C.; Tirumurugaan, G.K.; O Fafiolu, A.; A Adeleke, M.; Yakubu, A.; Ikeobi, C.O.N.; Okpeku, M. Heterozygous Single-Nucleotide Polymorphism Genotypes at Heat Shock Protein 70 Gene Potentially Influence Thermo-Tolerance Among Four Zebu Breeds of Nigeria. Front. Genet. 2021, 12, 1. [Google Scholar] [CrossRef] [PubMed]
- Masila, E.M.; Ogada, S.O.; Ogali, I.N.; Kennedy, G.M.; Too, E.K.; Ommeh, C.S. Mitochondrial DNA D-Loop Polymorphisms among the Galla Goats Reveals Multiple Maternal Origins with Implication on the Functional Diversity of the HSP70 Gene. Genet. Res. 2024, 2024, 1–15. [Google Scholar] [CrossRef] [PubMed]
- Makina, S.O.; Muchadeyi, F.C.; van Marle-Kã¶Ster, E.; MacNeil, M.D.; Maiwashe, A. Genetic diversity and population structure among six cattle breeds in South Africa using a whole genome SNP panel. Front. Genet. 2014, 5, 333–333. [Google Scholar] [CrossRef]
- Baena, M.M.; Tizioto, P.C.; Meirelles, S.L.C.; Regitano, L.C.d.A. HSF1 and HSPA6 as functional candidate genes associated with heat tolerance in Angus cattle. Rev. Bras. de Zootec. 2018, 47. [Google Scholar] [CrossRef]
- Aboul-Naga, A.M.; Alsamman, A.M.; El Allali, A.; Elshafie, M.H.; Abdelal, E.S.; Abdelkhalek, T.M.; Abdelsabour, T.H.; Mohamed, L.G.; Hamwieh, A. Genome-wide analysis identified candidate variants and genes associated with heat stress adaptation in Egyptian sheep breeds. Front. Genet. 2022, 13, 898522. [Google Scholar] [CrossRef]
- Bora, S.K.; Tessema, T.S.; Girmay, G. Genetic Diversity and Population Structure of Selected Ethiopian Indigenous Cattle Breeds Using Microsatellite Markers. Genet. Res. 2023, 2023, 1–12. [Google Scholar] [CrossRef]
- Mao, Y.; Chang, H.; Yang, Z.; Zhang, L.; Xu, M.; Chang, G.; Sun, W.; Song, G.; Ji, D. The analysis of genetic diversity and differentiation of six Chinese cattle populations using microsatellite markers. J. Genet. Genom. 2008, 35, 25–32. [Google Scholar] [CrossRef]
- Ayalew, W.; Wu, X.-Y.; Tarekegn, G.M.; Chu, M.; Liang, C.-N.; Tessema, T.S.; Yan, P. Signatures of positive selection for local adaptation of African native cattle populations: A review. J. Integr. Agric. 2023, 22, 1967–1984. [Google Scholar] [CrossRef]
- Nwachukwu, E.N.; Kalla, D.J.U.; Ukwu, H.O.; Ogbu, C.C.; Ezea, J.; Udoh, U.H.; Ekumankama, O.O. Genetic diversity and population structure of four Nigerian indigenous cattle breeds. Trop. Anim. Heal. Prod. 2022, 54, 1–11. [Google Scholar] [CrossRef]
- Ning, Q.; Qu, K.; Hanif, Q.; Jia, Y.; Cheng, H.; Zhang, J.; Chen, N.; Chen, H.; Huang, B.; Lei, C. MTOR Variation Related to Heat Resistance of Chinese Cattle. Animals 2019, 9, 915. [Google Scholar] [CrossRef]
- Tarekegn, G.M.; Ji, X.-Y.; Bai, X.; Liu, B.; Zhang, W.; Birungi, J.; Djikeng, A.; Tesfaye, K. Variations in mitochondrial cytochrome b region among Ethiopian indigenous cattle populations assert Bos taurus maternal origin and historical dynamics. Asian-Australasian J. Anim. Sci. 2018, 31, 1393–1400. [Google Scholar] [CrossRef] [PubMed]
- Strucken, E. M., Gebrehiwot, N. Z., Swaminathan, M., Joshi, S., Al Kalaldeh, M., and Gibson, J. P. (2021). Genetic diversity and effective population sizes of thirteen Indian cattle breeds. Genetics Selection Evolution, 53(1), 1–17.
- Li, M.H.; Zerabruk, M.; Vangen, O.; Olsaker, I.; Kantanen, J. Reduced genetic structure of north Ethiopian cattle revealed by Y-chromosome analysis. Heredity 2007, 98, 214–221. [Google Scholar] [CrossRef] [PubMed]
- Samuel, B.; Mengistie, D.; Assefa, E.; Kang, M.; Park, C.; Dadi, H.; Dinka, H. Genetic diversity of DGAT1 gene linked to milk production in cattle populations of Ethiopia. BMC Genet. 2022, 23, 1–10. [Google Scholar] [CrossRef]
- Meseret, S.; Mekonnen, Y.A.; Brenig, B.; Schütz, E.; Hanotte, O.; Gültas, M.; Schmitt, A.O. Genetic diversity and population structure of six ethiopian cattle breeds from different geographical regions using high density single nucleotide polymorphisms. Livest. Sci. 2020, 234, 103979. [Google Scholar] [CrossRef]
- Alam Bhuiyan, M.S.; Lee, S.-H.; Hossain, S.M.J.; Deb, G.K.; Afroz, M.F.; Lee, S.-H.; Bhuiyan, A.K.F.H. Unraveling the Genetic Diversity and Population Structure of Bangladeshi Indigenous Cattle Populations Using 50K SNP Markers. Animals 2021, 11, 2381. [Google Scholar] [CrossRef]
- Tapsoba, A.S.R.; (LaBioSA), I.d.l.e.d.R.A. (.L.d.B.e.S.a.; Sawadogo, S.E.; Yougbaré, B.; Traoré, F.G.; Béré, F.; Sanou, M.; Tamboura, H.H.; Bayala, B.; Pichler, R.; et al. Genetic Diversity and Population Structure of Taurine Cattle Using STR Markers in Burkina Faso, West Africa. Trop. Anim. Sci. J. 2024, 47, 131–140. [Google Scholar] [CrossRef]
- Ariyaraphong, N.; Laopichienpong, N.; Singchat, W.; Panthum, T.; Ahmad, S.F.; Jattawa, D.; Duengkae, P.; Muangmai, N.; Suwanasopee, T.; Koonawootrittriron, S.; et al. High-Level Gene Flow Restricts Genetic Differentiation in Dairy Cattle Populations in Thailand: Insights from Large-Scale Mt D-Loop Sequencing. Animals 2021, 11, 1680. [Google Scholar] [CrossRef]
- Mujibi, F.D.N.; Rao, J.; Agaba, M.; Nyambo, D.; Cheruiyot, E.K.; Kihara, A.; Zhang, Y.; Mrode, R. Performance Evaluation of Highly Admixed Tanzanian Smallholder Dairy Cattle Using SNP Derived Kinship Matrix. Front. Genet. 2019, 10, 375. [Google Scholar] [CrossRef]
- Mandefro, A.; Sisay, T.; Edea, Z.; Uzzaman, R.; Kim, K.-S.; Dadi, H. Genetic assessment of BoLA-DRB3 polymorphisms by comparing Bangladesh, Ethiopian, and Korean cattle. J. Anim. Sci. Technol. 2021, 63, 248–261. [Google Scholar] [CrossRef]
- Shija, D.S.; Mwai, O.A.; Ojango, J.M.K.; Komwihangilo, D.M.; Bebe, B.O. Assessing Lactation Curve Characteristics of Dairy Cows Managed under Contrasting Husbandry Practices and Stressful Environments in Tanzania. World 2022, 3, 1032–1052. [Google Scholar] [CrossRef]
Figure 3.
Maximum likelihood (ML) phylogenetic tree of 65 individual animals from the four breeds and the reference sequences of cow (NC_037341.1) constructed based on HSF1 gene; Note: HF means Holstein Friesian breed.
Figure 3.
Maximum likelihood (ML) phylogenetic tree of 65 individual animals from the four breeds and the reference sequences of cow (NC_037341.1) constructed based on HSF1 gene; Note: HF means Holstein Friesian breed.
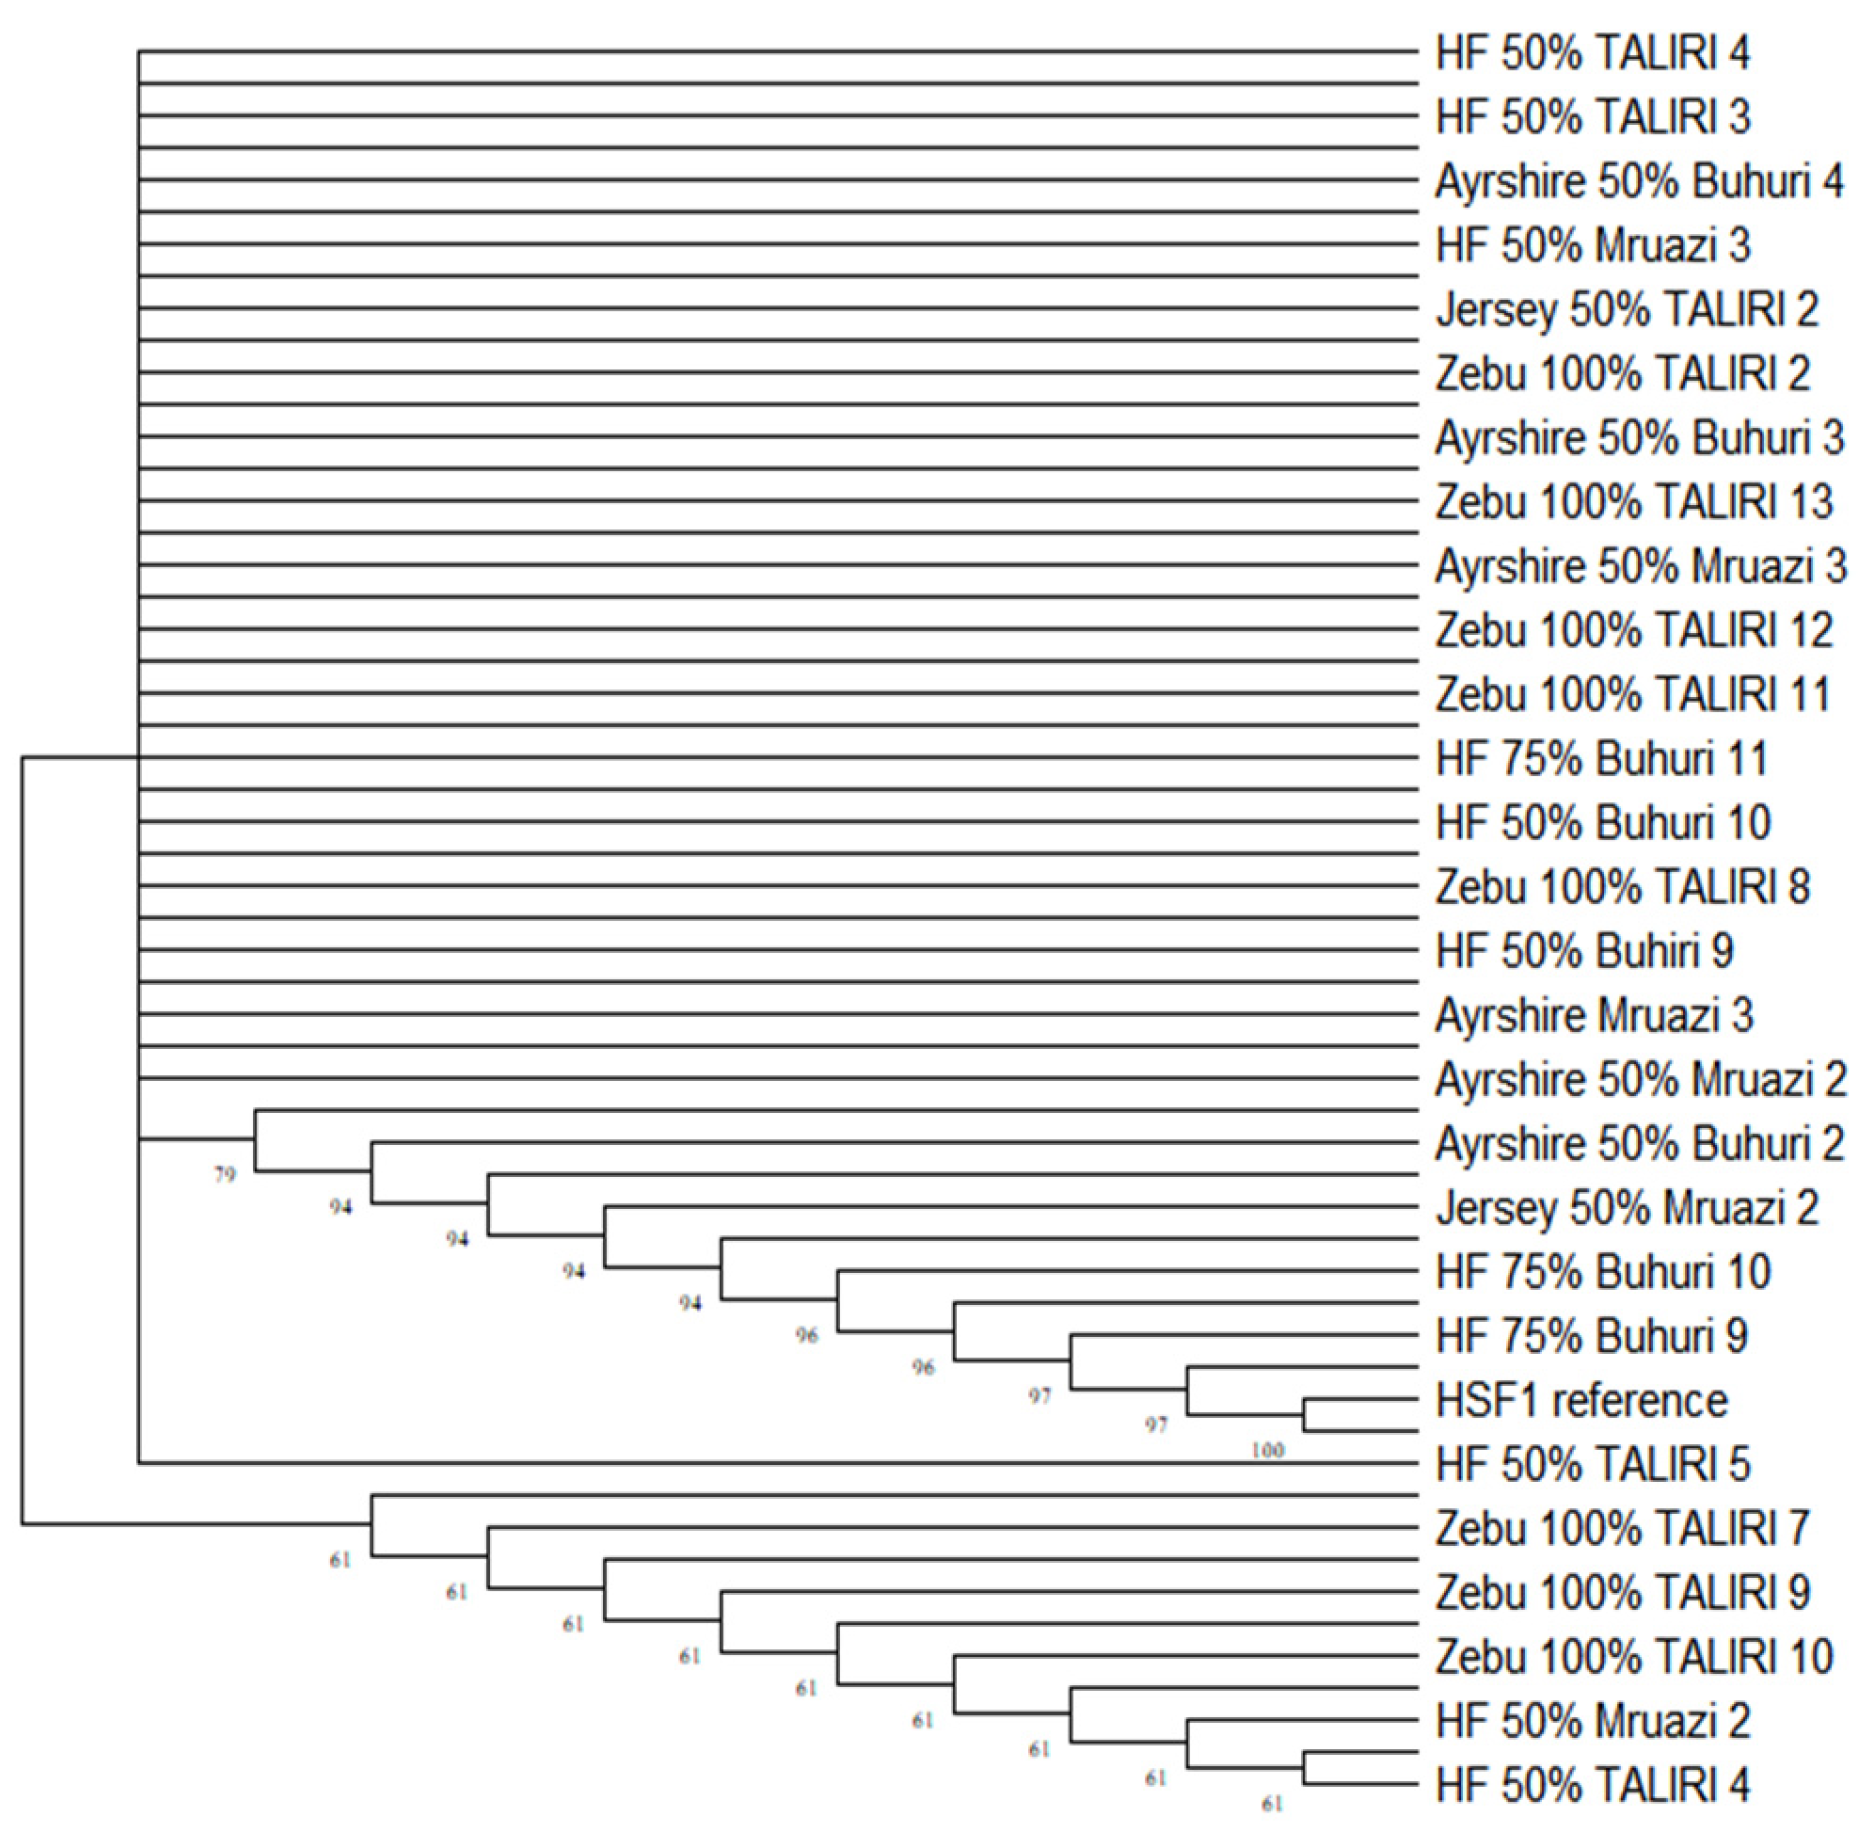
Figure 4.
Maximum likelihood (ML) phylogenetic tree of 56 cows and the reference sequences of cow (NC_037330) constructed based on HSPA6 gene; Note: HF means Holstein Friesian breed.
Figure 4.
Maximum likelihood (ML) phylogenetic tree of 56 cows and the reference sequences of cow (NC_037330) constructed based on HSPA6 gene; Note: HF means Holstein Friesian breed.
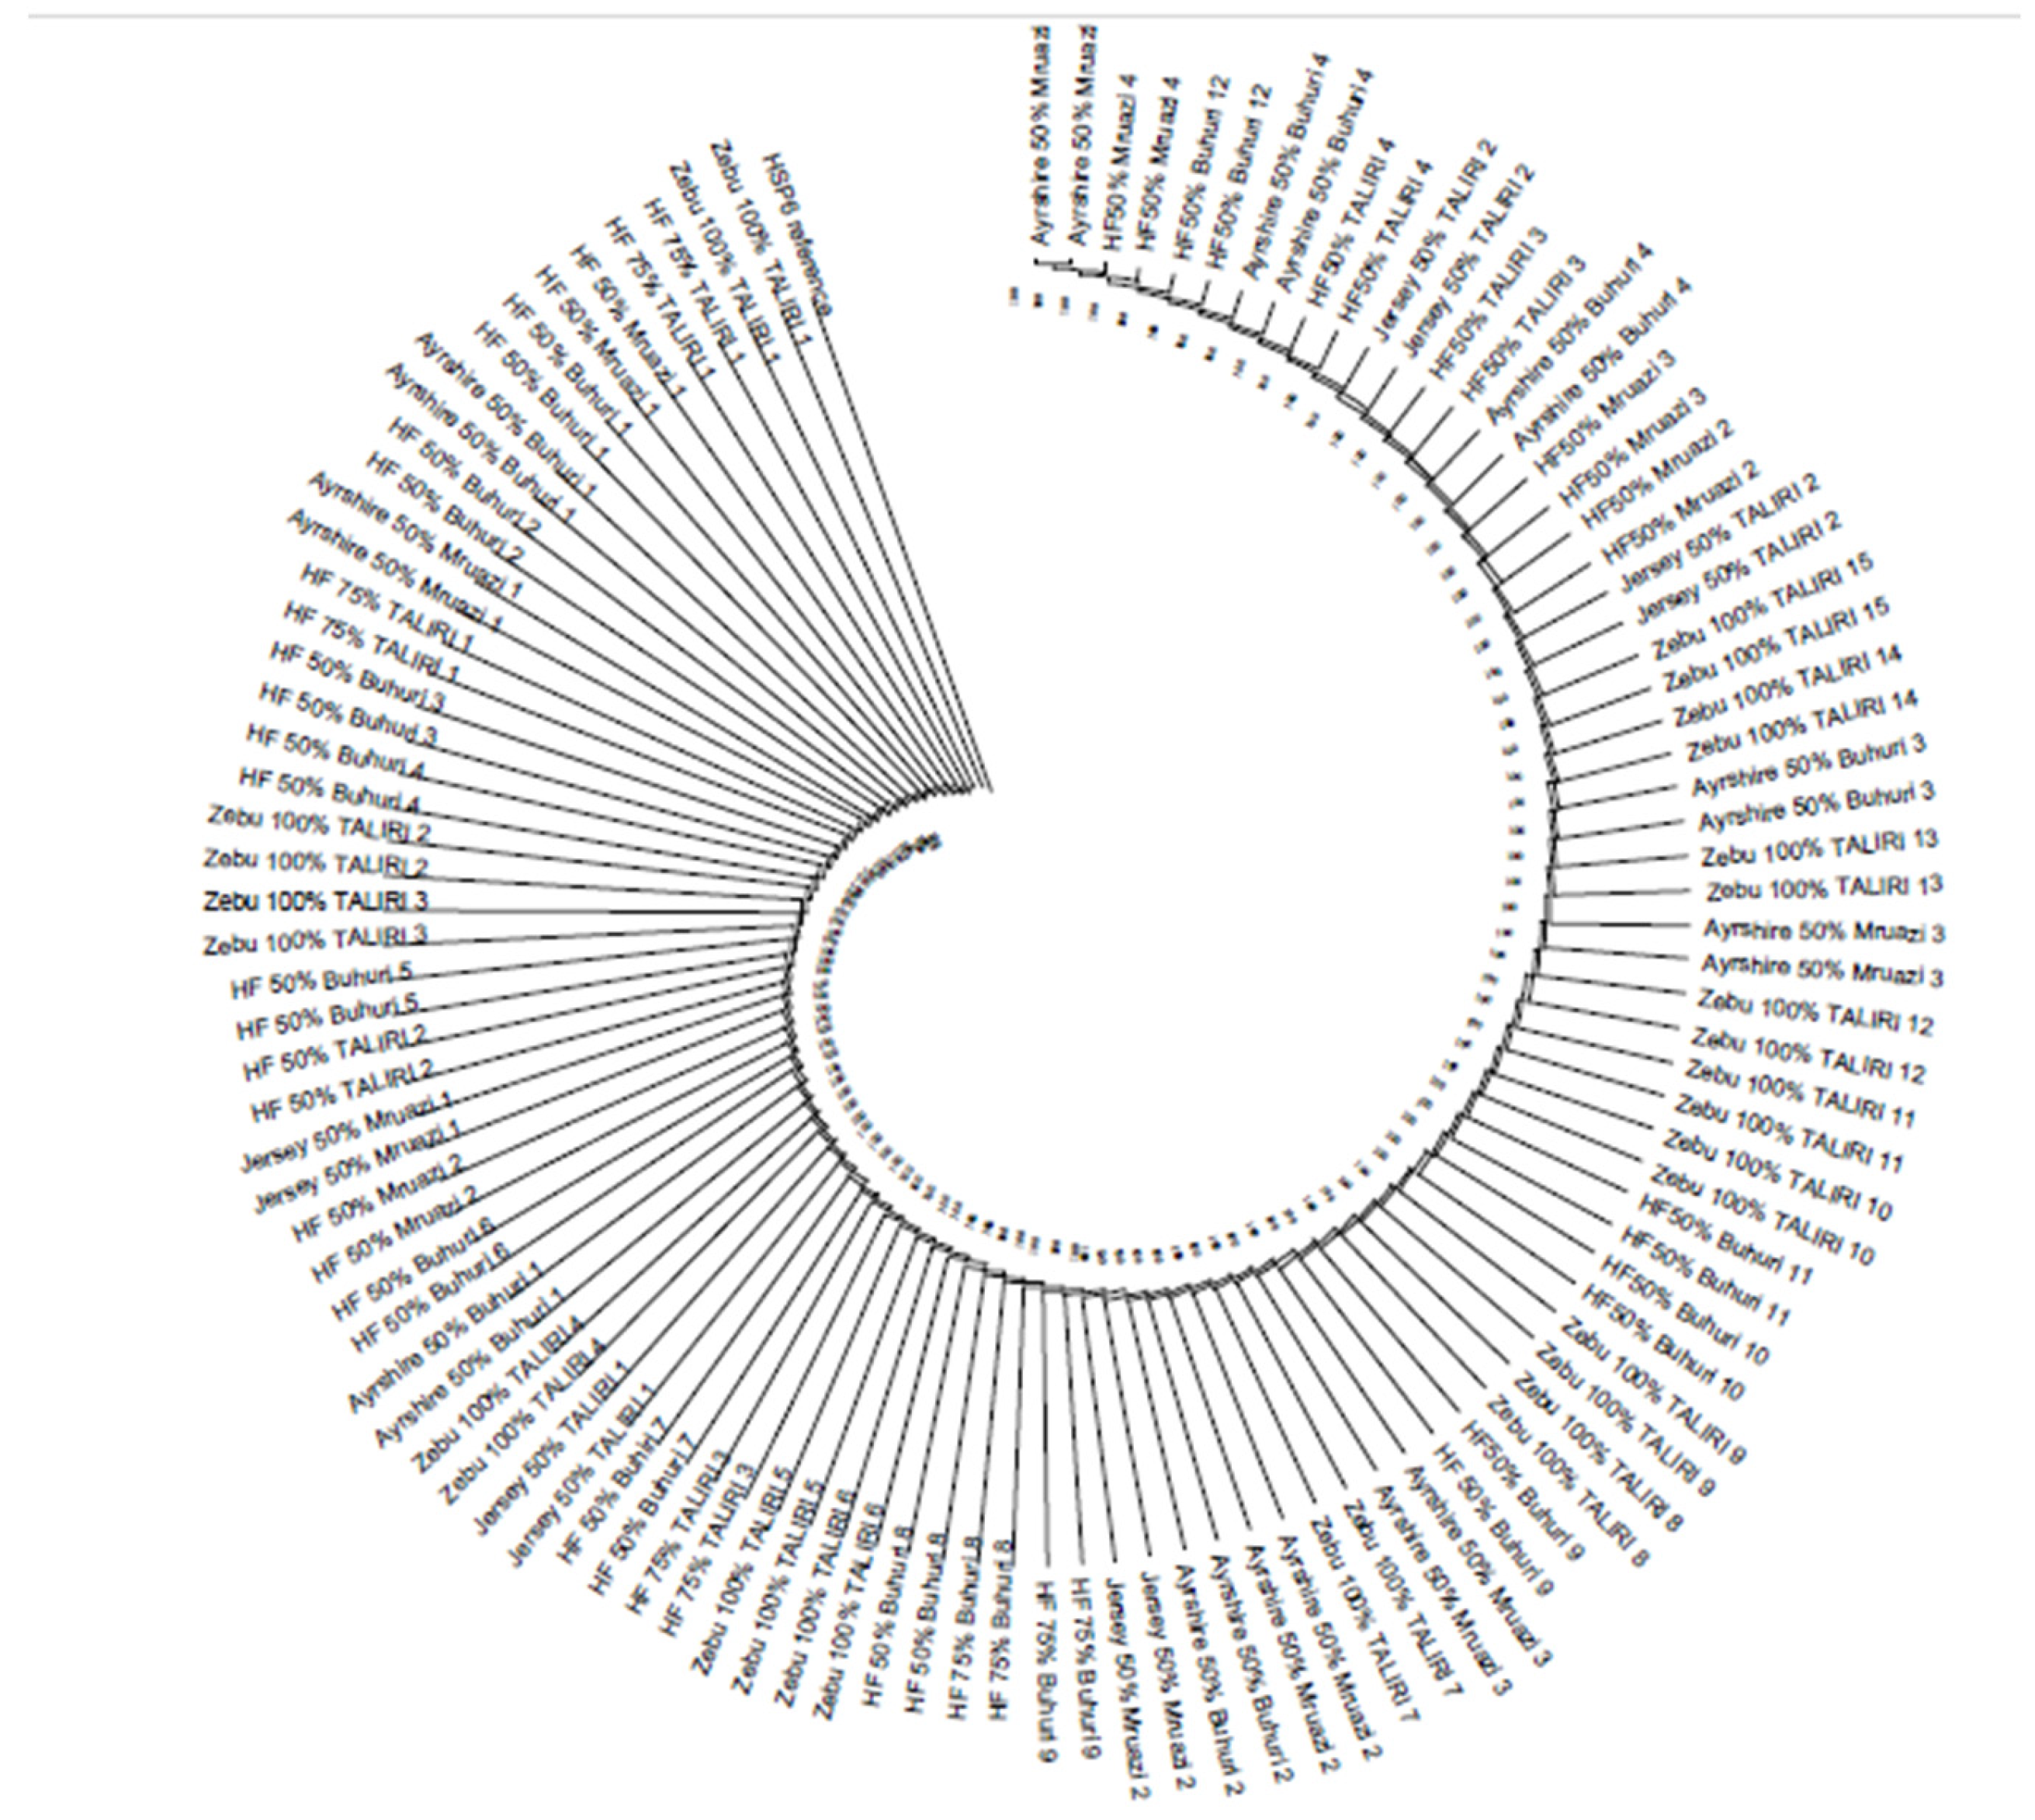
Figure 1.
PCR products of HSF1 gene for selected dairy cattle breeds reared in the Tanga region.
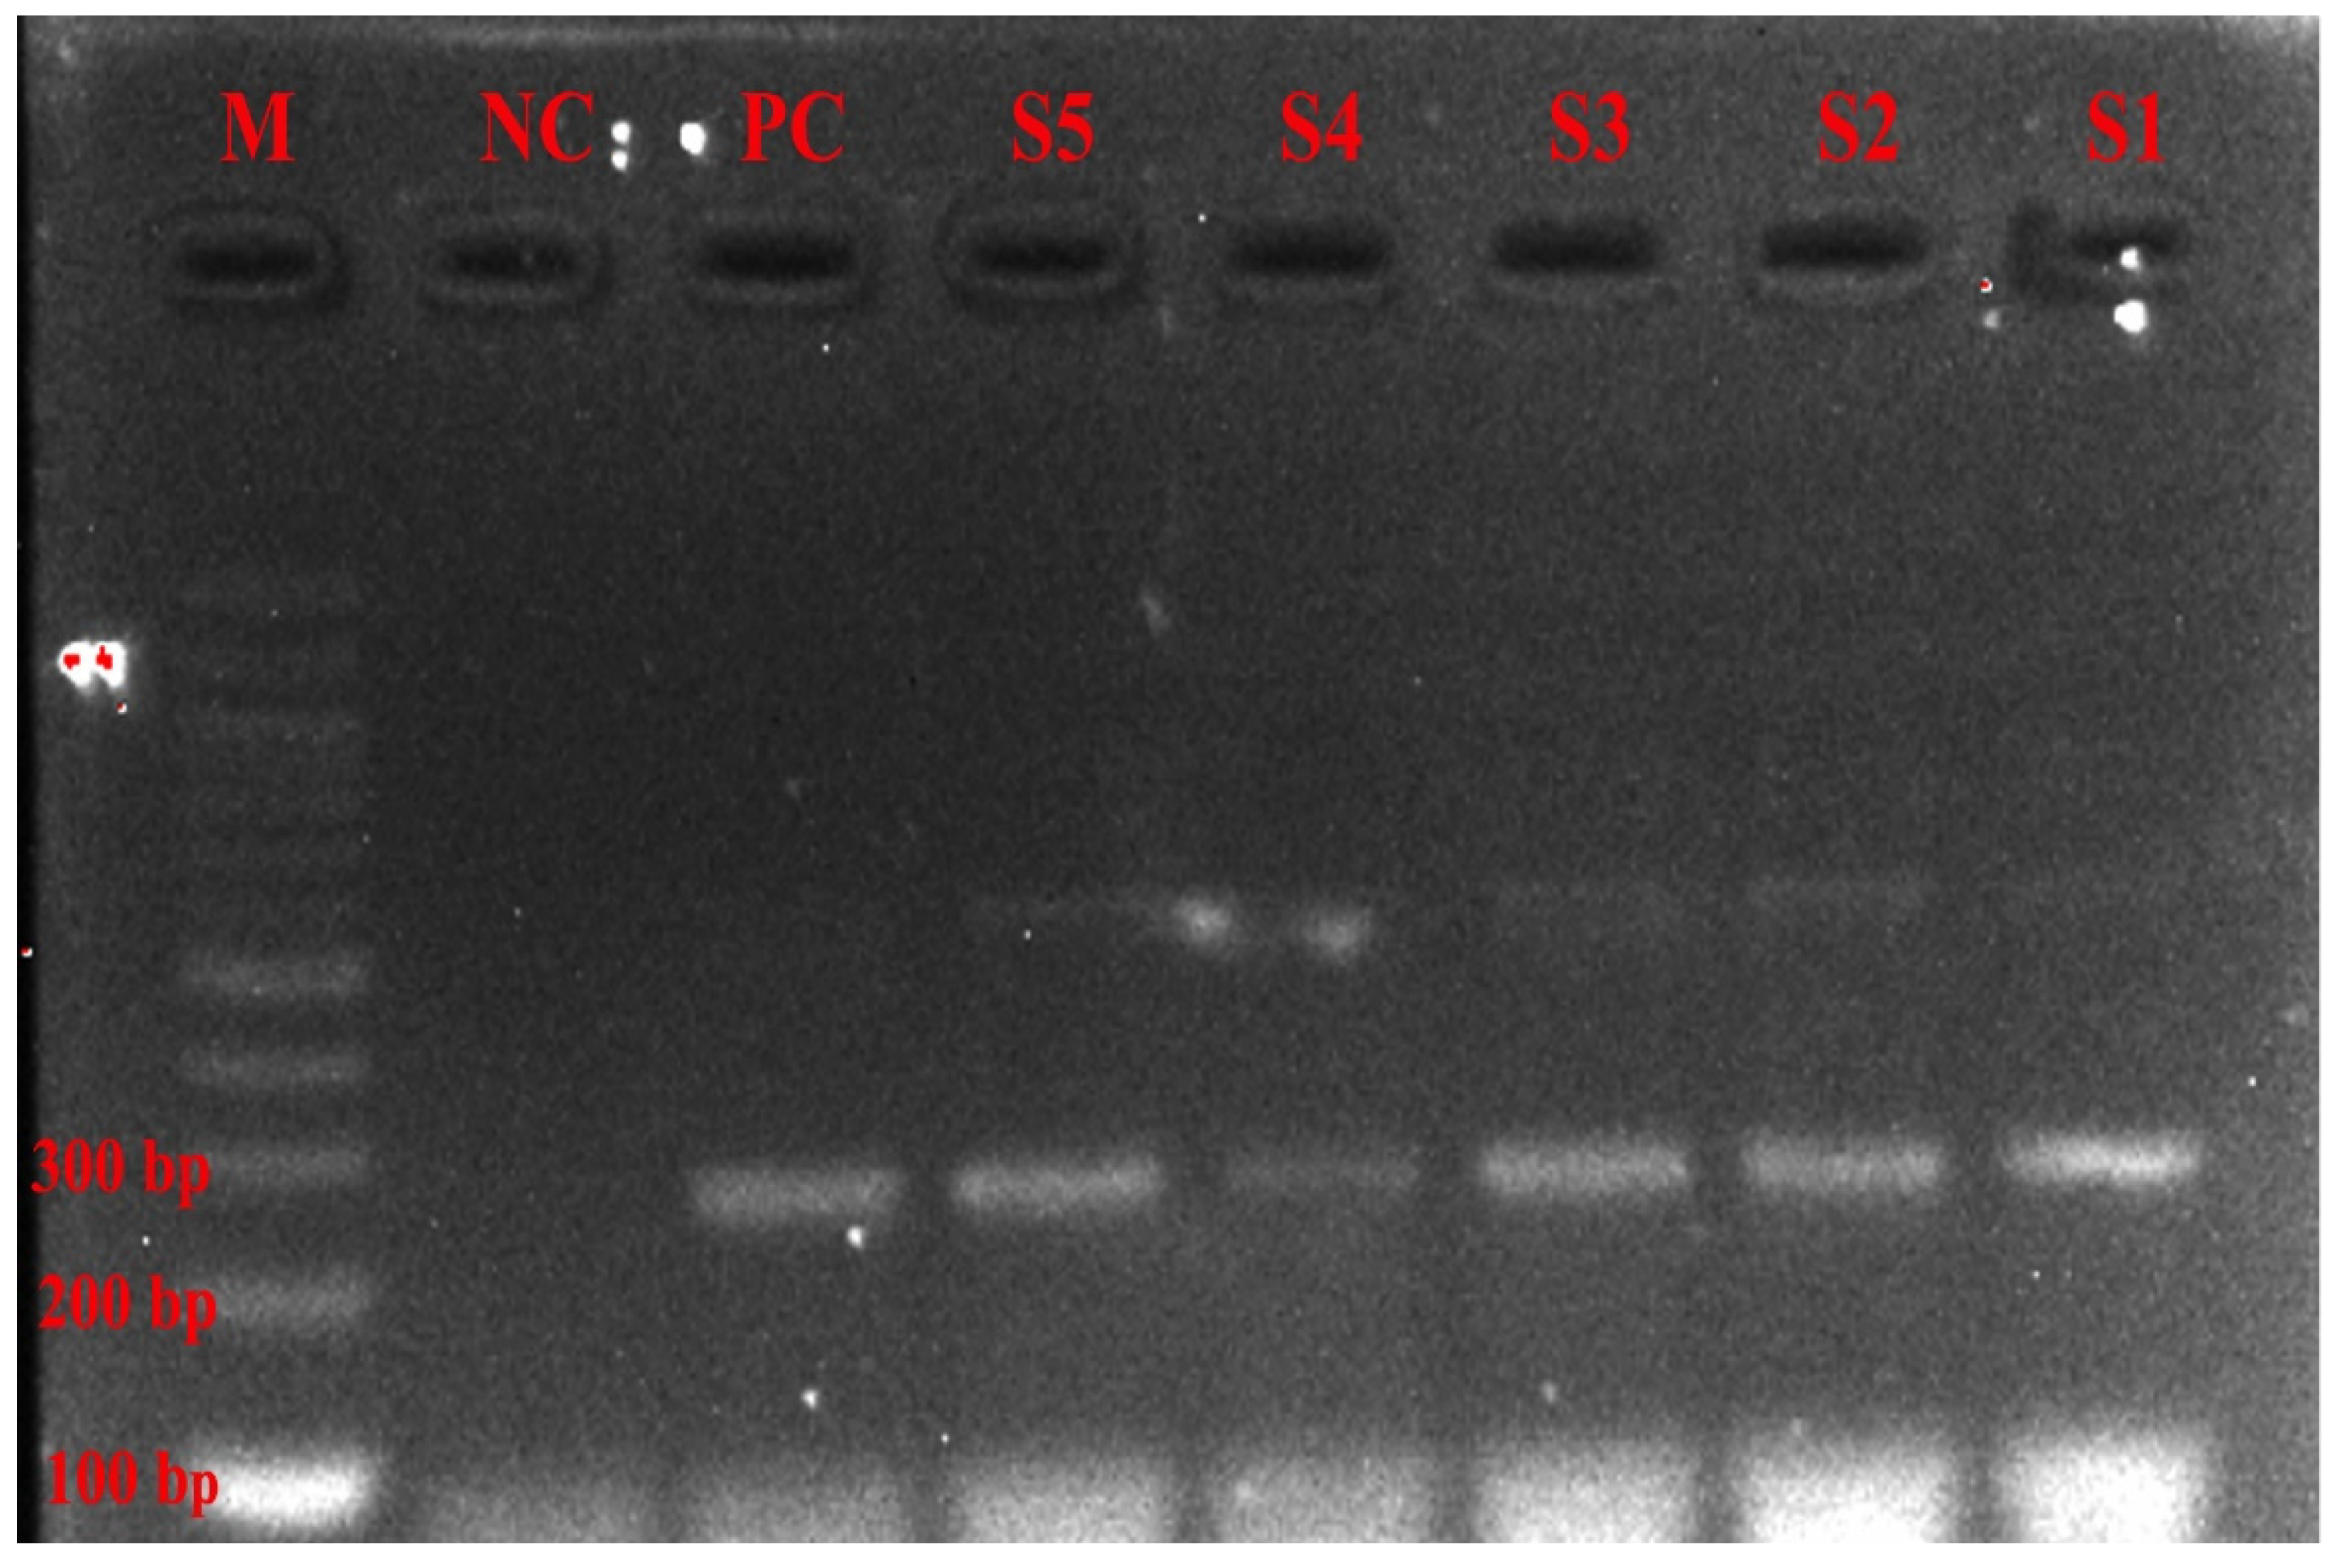
Figure 2.
PCR products of HSPA6 gene for selected dairy cattle breeds reared in the Tanga region.
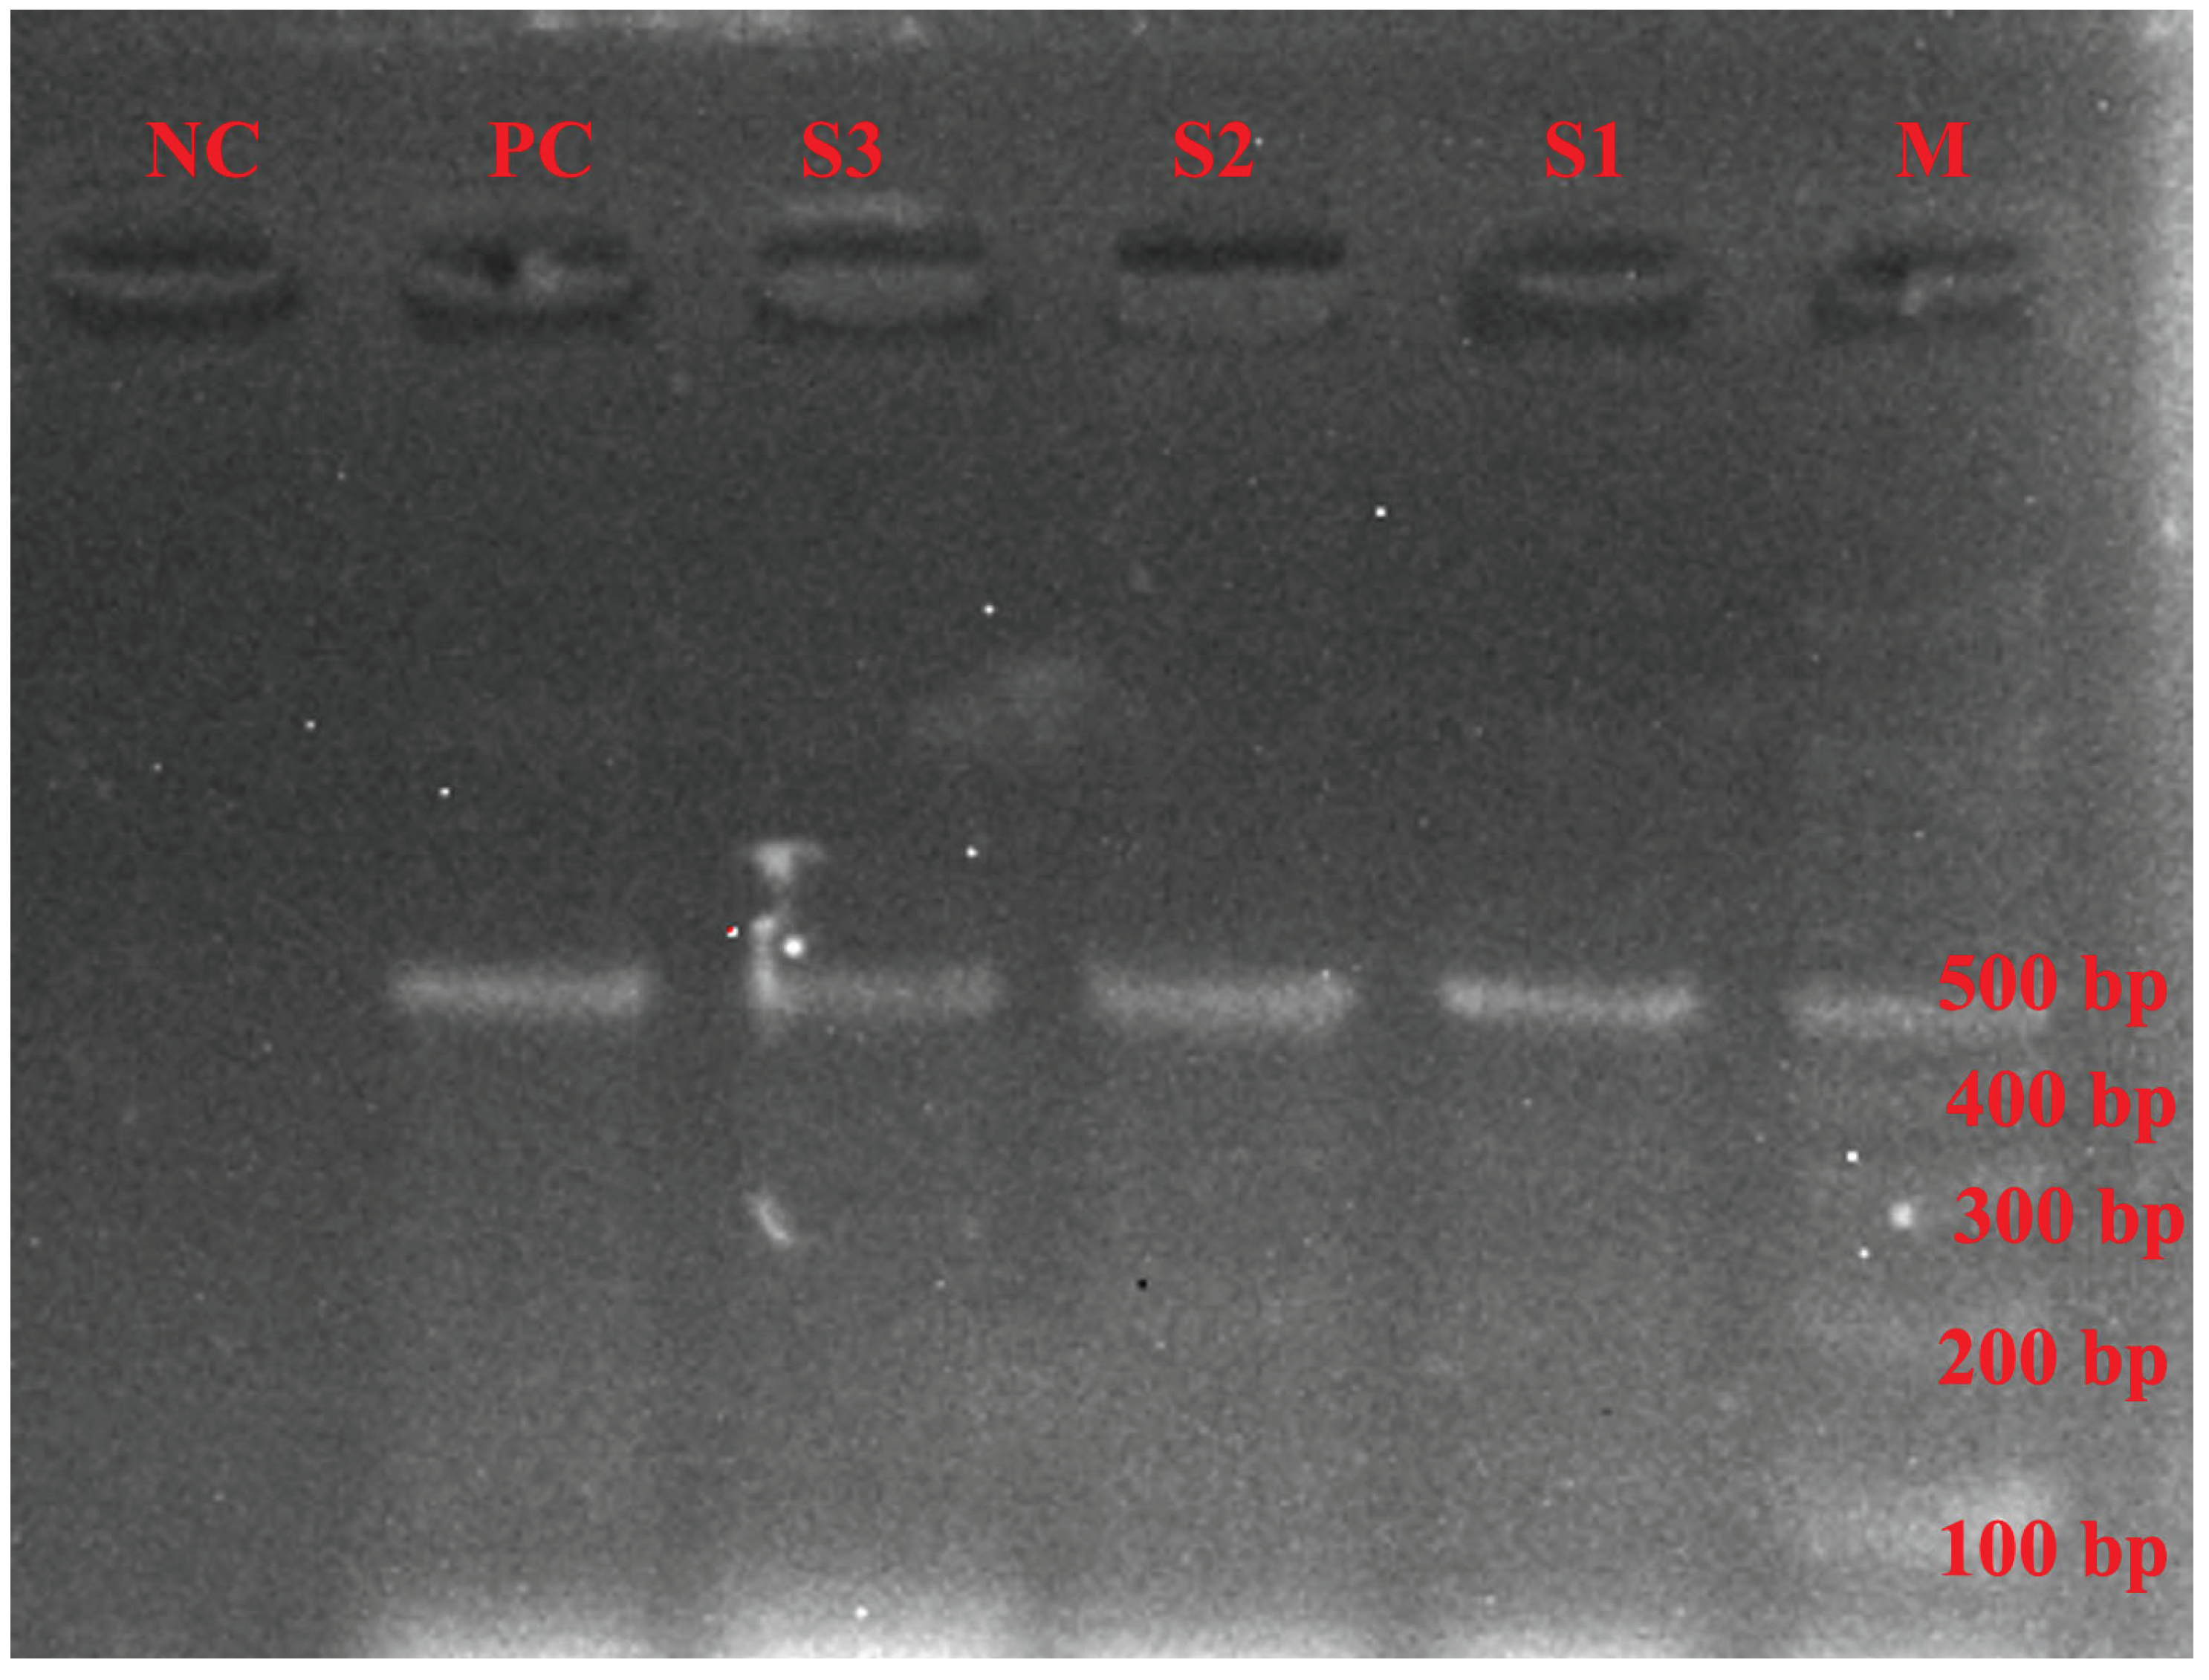

Table 1.
Number of haplotypes, polymorphic sites, haplotype diversity, and average nucleotide diversity of three commercial dairy cattle and Zebu cattle.
Table 1.
Number of haplotypes, polymorphic sites, haplotype diversity, and average nucleotide diversity of three commercial dairy cattle and Zebu cattle.
| Population | N | Haplotypes | Polymorphic Sites | Hd ± SD | π ± SD |
| Holstein-Friesian crosses | 8 | 3 | 2 | 0.34 ± 0.14 | 0.22 ± 0.23 |
| Ayrshire crosses | 7 | 1 | 0 | 0.00 ± 0.00 | 0.00 ± 0.00 |
| Jersey crosses | 3 | 2 | 1 | 0.33 ± 0.21 | 0.16 ± 0.21 |
| Zebu | 9 | 2 | 1 | 0.47 ± 0.08 | 0.23 ± 0.24 |
*N= sample size, Hd= haplotype diversity, π = average nucleotide diversity, SD= standard deviation.
Table 2.
Mean number of alleles and expected heterozygosity of three commercial dairy cattle and Zebu cattle.
Table 2.
Mean number of alleles and expected heterozygosity of three commercial dairy cattle and Zebu cattle.
| Population | N | MNA | He ± SD | K |
| Holstein Friesian crosses | 8 | 2.00 ± 0.00 | 0.22 ± 0.14 | 0.797 |
| Jersey crosses | 3 | 1.50 ± 0.70 | 0.16 ± 0.23 | 0.592 |
| Ayrshire crosses | 7 | 1.00 ± 0.00 | 0.00 ± 0.00 | 0.000 |
| Zebu | 9 | 1.50 ± 0.70 | 0.23 ± 0.33 | 0.331 |
N= number of samples, MNA= mean number of alleles, He±SD= expected heterozygosity, K = average of nucleotide differences.
Table 3.
Analysis of molecular variance and fixation indices for HSF1 gene.
| Source of Variation | Degrees of Freedom | Sum of Squares | Variation | Percentage of Variation | P-Value |
| Among populations | 3 | 0.921 | 0.01101 | 6.28 | 0.37830 |
| Within populations | 50 | 8.208 | 0.16417 | 93.72 | 0.37830 |
| Total | 53 | 9.130 | 0.17517 |
Table 4.
Population pairwise FST genetic differentiation (below diagonal) and pairwise genetic distances (above diagonal) among crossbreds of three commercial dairy cattle breeds and Zebu cattle.
Table 4.
Population pairwise FST genetic differentiation (below diagonal) and pairwise genetic distances (above diagonal) among crossbreds of three commercial dairy cattle breeds and Zebu cattle.
| Breed | Ayrshire | Jersey | Holstein Friesian | Zebu |
| Ayrshire | - | 0.000** | 0.025** | 0.098** |
| Jersey | 0.153** | - | -0.037** | -0.013** |
| Holstein Friesian | 0.086** | -0.116** | - | -0.001** |
| Zebu | 0.261* | -0.050** | -0.004** | - |
*: significant at P ≤0.05, **: not significant at P ≤0.05.
Table 5.
Neutrality tests in dairy cattle breeds for HSF1 gene.
| Population | Sample Size | Fu’s Fs | Tajima’s D |
| Holstein Friesian crosses | 8 | -0.571 * | -0.648* |
| Jersey crosses | 3 | -0.002 * | -0.933* |
| Ayrshire crosses | 7 | - | - |
| Zebu | 9 | 1.214 * | 1.166 * |
*: Not significant (ns) p ˃ 0.05.
Disclaimer/Publisher’s Note: The statements, opinions and data contained in all publications are solely those of the individual author(s) and contributor(s) and not of MDPI and/or the editor(s). MDPI and/or the editor(s) disclaim responsibility for any injury to people or property resulting from any ideas, methods, instructions or products referred to in the content. |
© 2025 by the authors. Licensee MDPI, Basel, Switzerland. This article is an open access article distributed under the terms and conditions of the Creative Commons Attribution (CC BY) license (http://creativecommons.org/licenses/by/4.0/).
Copyright: This open access article is published under a Creative Commons CC BY 4.0 license, which permit the free download, distribution, and reuse, provided that the author and preprint are cited in any reuse.


