
Submitted:
26 May 2025
Posted:
27 May 2025
You are already at the latest version
Abstract
Jasmonic acid (JA) plays a crucial role in plant disease resistance defense. To explore its regulatory mechanism in plant resistance to pathogens, this study focused on Ustilago maydis (U. maydis) using, exogenous application of different concentrations of JA and jasmonic acid inhibitor ibuprofen (IBU), combined with physiological and biochemical analysis, cytological observation, transcriptome analysis and weighted gene co-expression network analysis (WGCNA), to systematically analyze the JA-induced disease resistance mechanism in maize. The results showed that 0.1 mmol/L JA treatment significantly inhibited pathogen mycelial growth (with an inhibition rate of 19.0%) and improved plant disease resistance (disease index decreased by 52.65%), while IBU treatment exacerbated disease susceptibility. Physiological and biochemical analysis showed that JA treatment significantly increased the activity of defense enzymes (POD, PPO, β-1,3-GA), reduced malondialdehyde (MDA) content and alleviated membrane damage. Cytological observation demonstrated that JA maintained the integrity of mesophyll cells and vascular bundle sheath structures, effectively inhibiting cell expansion and division caused by pathogens. Transcriptome analysis indicated that JA induced more differentially expressed genes (DEGs) in the susceptible variety Ye478 compared to the resistant variety Qi319, and these genes were significantly enriched in phenylpropanoid biosynthesis, starch and sucrose metabolism pathways. Through WGCNA analysis, 16 key genes were identified from four modules, further identifying six candidate genes related to disease resistance, including self-resistance-resistant genes (PP2C, WRKY) and JA-induced resistance-related genes (CGT, GLCAT, RING zinc finger protein, CaM). In summary, JA significantly enhances maize resistance to U. maydis by enhancing defense enzyme activity, maintaining cell structure stability and regulating key gene expression. This study provides an important theoretical basis for clarifying the JA-mediated disease resistance mechanism and disease-resistant breeding.
Keywords:
maize
; Ustilago maydis
; jasmonic acid
; disease resistance
; RNA-seq
1. Introduction
Ustilago maydis (U. maydis) is a significant disease that seriously endangers maize production. It is prevalent in major maize-producing areas and significantly affects maize yield and quality [1]. This pathogen has unique infection characteristics, infecting throughout the entire growth period of maize, with a preference for young tissues. The most typical symptom is the formation of characteristic tumor-like protrusions on the ear [2]. The development of the tumor shows a distinct dynamic change process: initially, it presents as a white fleshy structure. As it develops, it gradually turns black and eventually forms a black powdery winter spore mass. After maturation, it releases spores for secondary transmission [3]. It is worth noting that this pathogen has a wide range of infection and can infect multiple organs of maize such as roots, stems and leaves. Among them, the period from the emergence stage to the three-leaf stage is the most susceptible and dangerous period [4]. Its teliospores have special biological characteristics, without a dormant period and can directly germinate under suitable temperature and humidity conditions, invading maize tissues through wounds to complete the infection cycle [5]. Currently, the prevention and control of this disease mainly adopt comprehensive prevention and control strategies, including agricultural measures such as the selection and breeding of disease-resistant varieties, the removal of diseased and dead plants, reasonable crop rotation and the optimization of field cultivation management [6,7,8]. Although chemical control has been widely adopted in production due to its simple operation and quick effect, the problem of pesticide residues caused by the long-term use of chemical pesticides, as well as the potential risks to the ecological environment and the safety of agricultural products, have become increasingly prominent [9]. This situation has prompted researchers to actively seek more environmentally friendly, efficient and sustainable new disease prevention and control methods. Under this background, in-depth research on the self-defense mechanism of plants and the development of green prevention and control technologies based on plant immune induction and resistance have important theoretical and practical significance.
The formation of plant disease resistance is a complex and long-term evolutionary process, with different plant species exhibiting diverse resistance mechanisms in response to pathogen infection. Induced resistance refers to the systemic defense response activated in plants after being infected by pathogens or stimulated by specific inducers. This phenomenon was first discovered in research on plant-virus interactions [10]. Studies have shown that certain beneficial microorganisms, such as Pseudomonas spp., can induce broad-spectrum resistance in plants and significantly enhancing the host's defense against various pathogens [11,12]. The molecular mechanisms of plant induced resistance mainly include the following four aspects: (1) Reinforcement of cell wall structure, such as callose deposition and lignification enhancement; (2) The outbreak of reactive oxygen species (ROS) and the activation of the antioxidant system significantly increased the activities of related defense enzymes (such as POD, PPO, PAL, chitinase, etc.). (3) Induced synthesis of phytoalexins, such as the accumulation of secondary metabolites like capsaicin and maize terpenoids; (4) The outbreak of reactive oxygen species (ROS) and the activation of the antioxidant system significantly increased the activities of related defense enzymes (such as POD, PPO, PAL, chitinase, etc.). According to the nature of the inducers, plant induced resistance can be divided into two major categories: abiotic induction (such as chemical substances, physical stimuli) and biotic induction (such as microorganisms, pathogen-related molecular patterns). Currently, various efficient and safe disease resistance inducers have been applied in agricultural production [13].
In recent years, the use of exogenous plant hormones to induce disease resistance has become a research hotspot in maize disease prevention and control. Plant hormones, as key signaling molecules, can regulate plant physiological responses at extremely low concentrations and trigger endogenous synthesis through environmental stimuli [14]. When pathogens infect, the plant hormone network precisely regulates defense signal transduction through antagonistic, synergistic, or temporal regulation, activating the expression of disease resistance-related genes [15], thereby coordinating the adaptability of plant to biological stress [16]. Among them, jasmonic acid (JA) plays a central role as an important endogenous signaling molecule in plant disease resistance, especially in the defense against necrotrophic pathogens [17,18]. JA and its methyl ester derivatives (such as methyl jasmonate, MeJA) can induce the synthesis of various defense-related secondary metabolites, including nicotine, alfalfa alkaloids and other alkaloids [19,20]. Research by Zou Zhiyan [21] shows that exogenous JA treatment can significantly enhance rice resistance to rice blast disease, and the mechanism involves the systematic enhancement of antioxidant enzyme activities (such as SOD, CAT, POD). At the molecular level, the JA signaling pathway can be divided into three key stages: (1) JA signal perception mediated by the receptor COI1 (CORONATINE INSENSITIVE 1); (2) Signal transduction and inhibitor degradation involving JAZ (JASMONATE ZIM-DOMAIN) proteins; (3) Activation of downstream transcriptional regulatory networks, ultimately achieving various physiological functions mediated by JA, including disease resistance defense, growth and development, and environmental adaptation, etc. [22]. The clarification of this signaling pathway provides an important theoretical basis for using JA to induce plant disease resistance.
However, the molecular mechanism by which JA regulates maize resistance to U. maydis infection has not been fully clarified. This study selected the disease-resistant variety Qi319 and the disease-susceptible variety Ye478 as experimental materials to systematically investigate the regulatory role of JA in the maize-U. maydis interaction. Initially, the optimal treatment concentrations of JA and acid inhibitor ibuprofen (IBU) were determined through a concentration gradient experiment. Based on this, a comprehensive approach involving cytological observation, physiological and biochemical analysis and molecular biology techniques was employed to explore the effects of JA treatment on maize defense enzyme activity, cell structure integrity and disease resistance-related gene expression. Furthermore, by combining transcriptome sequencing (RNA-seq) and weighted gene co-expression network analysis (WGCNA), the JA-mediated disease resistance signaling pathway was deeply analyzed and key regulatory genes were identified. This study not only provides a new theoretical basis for elucidating the mechanism of JA-induced maize resistance to U. maydis, but also lays an important foundation for the development of green prevention and control technologies based on plant immune induction of resistance.
2. Results
2.1. Effect of Exogenous JA on U. maydis Mycelial Growth and Maize Disease Resistance
The results showed that JA treatment exhibited a significant concentration effect on the mycelial growth of U. maydis (Supplementary Table S1). The determination of colony area at 24 h and 48 h revealed that treatment with a low concentration of 0.01 mmol/L JA significantly promoted mycelial growth (P<0.05). However, a moderate concentration of JA at 0.1 mmol/L showed a significant inhibitory effect. The colony areas at the two time points decreased by 16.4% and 19.0% respectively compared with the control (CK) (P<0.05). Higher concentrations (0.5-1 mmol/L) of JA treatment did not show significant differences. At the plant level, JA and IBU treatments had opposite effects on the disease resistance of maize (Supplementary Table S2-3). The 0.1 mmol/L JA treatment showed the best antibody-inducing effect. The disease index decreased to 25%, which was significantly reduced by 52.65% compared with CK (P<0.05). The antibody-inducing effects of each JA treatment were 0.1>0.5>1>0.01 mmol/L in sequence, which was consistent with the results of the in vitro antibacterial experiment. However, IBU treatment (especially 3 mmol/L) significantly increased susceptibility, and the disease index was 15.7% higher than that of CK (P<0.05), confirming the key role of endogenous JA signaling pathway in maize resistance to U. maydis. These results collectively indicate that exogenous JA treatment at an appropriate concentration (0.1 mmol/L) can enhance maize disease resistance through a dual mechanism of directly inhibiting pathogen growth and activating the plant defense system.
2.2. Alterations in Defense-Related Enzyme Activities Induced by Exogenous JA in Maize Resistance Against U. maydis
In this study, the dynamic changes of defense enzyme activities were systematically analyzed by treating maize plants inoculated with U. maydis with 0.1 mmol/L JA.
The results indicated that JA treatment significantly increased the activities of POD, PPO and β-1,3-GA (P<0.05), reaching peak levels at 48 h after inoculation (Figure 1). Compared to the controls (QCK-I and YCK-I), the POD activities of the resistant variety Qi319 (QJA-I) and the susceptible variety Ye478 (YJA-I) increased by 44.6% and 43.49%, respectively (Figure 1A). The PPO activities increased by 44.96% and 40.24% (Figure 1B), respectively, and the β-1,3-GA activities increased by 50.41% and 45.35%, respectively (Figure 1C), while PAL activity increased slightly but the difference was not significant. (Figure 1D). Meanwhile, JA treatment significantly reduced MDA content, with QJA-I and YJA-I decreasing by 58.63% and 42.23% respectively compared to the controls (QCK-I and YCK-I), effectively alleviating membrane system damage (Figure 1E). It is worth noting that the defense enzyme activity of resistant inbred lines is higher than that of susceptible inbred lines at all time points, especially during the critical 48 h period when the difference is most significant. These findings confirm that 0.1 mmol/L JA enhances maize disease resistance by synergistically regulating defense enzyme activity and protecting cell membrane integrity, and resistant varieties exhibit stronger defense response capabilities.
2.3. Cytological Analysis of Exogenous JA-Induced Resistance to U. maydis in Maize
This study revealed the protective effect of JA on the cellular structure of maize leaves through microscopic observation (Figure 2). The results showed that infection by U. maydis led to abnormal division of vascular bundle sheath cells and expansion of mesophyll cells in maize leaves, seriously damaging the integrity of the garland structure. In the susceptible variety Ye478, 12 h after inoculation, the vascular bundle sheath cells treated with the control (YCK-I) showed a significant trend of expansion and division, while the cell structure of the JA-treated group (YJA-I) remained stable. By 48 h, the cell structure disorder in the YCK-I treatment group intensified, whereas the YJA-I treatment still maintained the orderliness of cell arrangement. The disease-resistant variety Qi 319 exhibited stronger structural stability under JA treatment (QJA-I). At 96 hours, the mesophyll cell structure treated with JA remained intact, which was significantly better than that treated with QCK-I. It is worth noting that the cell structure damage induced by pathogenic bacteria is more significant in susceptible varieties, and JA treatment can effectively slow down the expansion and division speed of vascular bundle sheath cells, maintaining the stability of cell structure. These findings confirm that JA significantly enhances plant resistance to U. maydis by protecting the structural integrity of maize leaf vascular bundle sheath and mesophyll cells, and the cell structure stability of resistant varieties is superior to that of susceptible varieties.
2.4. Transcriptomic Analysis of Exogenous JA-Induced Maize Resistance to U. maydis
Exogenous JA can induce maize resistance to U. maydis. To explore its molecular mechanism, we performed transcriptome sequencing on maize leaves and verified the RNA quality (Q20≥97.29%, Q30≥92.22%, GC≥55.04%) before sequencing. The alignment efficiency of the sequencing data (87.67%~90.31%) and biological replicate correlation (r²≈1) met the requirements, ensuring data reliability. The analysis revealed that the resistant variety Qi319 had a higher number of differentially expressed genes (DEGs) under U. maydis stress (1978 up-regulated and 2576 down-regulated), while the susceptible variety Ye478 had fewer DEGs (318 up-regulated and 238 down-regulated), indicating that Qi319 enhances disease resistance through a stronger transcriptomic response (Figure 3A). After exogenous JA application, the number of DEGs in Qi319 decreased (652 up-regulated and 313 down-regulated), while Ye478 showed more significant gene expression regulation (1755 up-regulated and 1431 down-regulated), indicating that the susceptible variety is more sensitive to exogenous JA, possibly by activating more disease resistance-related genes to reduce susceptibility. The Venn diagram analysis further revealed that there were 50 commonly differentially expressed genes among the treatment groups, indicating that exogenous JA can significantly regulate the transcriptomic response of the susceptible variety, providing a theoretical basis for using exogenous substances to enhance maize disease resistance (Figure 3B).
Through GO functional analysis of DEGs from two varieties under the stress of U. maydis, it was found that under non-JA induction conditions, the enrichment trends of DEGs in the three major functional categories of Qi319 and Ye478 were basically the same. Biological Process (BP) was mainly enriched in metabolic processes and single-organism processes. Cellular Component (CC) was mainly enriched in cell parts and organelles. Molecular Function (MF) was mainly enriched in catalytic activity and transporter activity. It is worth noting that the number of DEGs in Qi319 was significantly higher than that in Ye478 among the same enrichment terms (Figure 4A). Under JA induction conditions, after inoculation with two inbred lines, it was found that the DEGs of Qi319 were still mainly enriched in the above-mentioned functional categories compared to the control group (Q/Y CK-I), but new entries such as nucleic acid binding transcription factor activity and structural molecular activity were added to the molecular functions. Although Ye478 maintained a similar enrichment pattern, the number of DEGs in each functional category exceeded that of Qi319 (Figure 4B). This result indicates that exogenous JA may enhance maize resistance to U. maydis by regulating more DEGs, especially those involved in metabolic regulation, signal transduction and transcription factor activity.
Through KEGG pathway analysis, it was found that there were significant differences in the number of DEGs annotated in different comparison groups (ranging from 293 to 666), and the number of significantly enriched metabolic pathways ranged from 88 to 107 (Supplementary Table S4). Under non-JA induction conditions, both Qi319 and Ye478 were significantly enriched in the "Plant-Pathogen Interaction" and "Hormone Signal Transduction" pathways in the comparison between inoculated and non-inoculated samples, indicating that these basic defense pathways play an important role in maize's response to U. maydis stress. Notably, under JA induction conditions, the two varieties exhibited different metabolic pathway response patterns: the resistant material (QCK-I vs QJA-I) was mainly enriched in the "Phenylpropane biosynthesis", "Starch and sucrose metabolism" and " MAPK signaling pathway-plant ", while the susceptible material (YCK-I vs YJA-I) was mainly enriched in the "Phenylpropane biosynthesis", "Starch and sucrose metabolism" and "Carbon metabolism" pathways. It is particularly noteworthy that both varieties were significantly enriched in the "Phenylpropane biosynthesis" and "Starch and sucrose metabolism" pathways (Figure 5), suggesting that these metabolic pathways may play a key role in the JA-induced regulation of maize resistance to U. maydis. These findings provide important clues for deciphering the molecular mechanisms of maize disease resistance mediated by JA.
2.5. Validation of DEGs by qRT-PCR Analysis
We randomly selected six genes and verified the accuracy of the transcriptome data through qRT-PCR (Figure 6). The results showed that the expression change trends of these genes across six different treatments were completely consistent with the transcriptome sequencing data, indicating that our transcriptome sequencing data are accurate and reliable, and can truly reflect the changes in gene expression levels. This demonstrates the reliability of the transcriptome sequencing results.
2.6. Construction of Weighted Gene Co-Expression Network and Visualization Network
We systematically studied the gene regulatory network of maize resistance to U. maydis induced by JA through weighted gene co-expression network analysis (WGCNA). Firstly, a scale-free network was constructed based on differentially expressed genes (Figure 7), and the genes were divided into five co-expressed modules using hierarchical clustering method. The clustering relationships of genes within the modules were displayed through hierarchical clustering trees, while the correlations between samples were visually presented through dendrograms and heatmaps. The analysis revealed four key modules significantly correlated with treatment conditions (|r|>0.7, P<0.05). The QCK-I group without JA treatment was significantly correlated with the brown module (r=0.79, P=0.07). The QCK-U group without inoculation and JA treatment showed a strong correlation with both the blue module (r=0.99, P=0.0004) and the pink module (r=0.77, P=0.07). It is particularly notable that the YJA-I group treated with JA in Ye478 showed a high correlation with the black module (r=0.99, P=0.0005), and this finding provides an important clue for revealing the molecular mechanism of JA-induced resistance regulation in the susceptibility line.The identification of these key modules not only clarifies the gene co-expression characteristics under different treatment conditions but also lays the foundation for a deeper understanding of the regulatory network of maize disease resistance responses.
Through the KEGG pathway enrichment analysis of four key modules (Figure 8 A~D), we deeply analyzed the biological functional characteristics of each module. The results showed that different modules presented unique pathway enrichment patterns. The brown module was significantly enriched in defense-related pathways such as plant-pathogen interaction, plant hormone signal transduction and phenylpropanoid biosynthesis. The blue module was mainly involved in basic metabolic processes such as carbon metabolism, and was also enriched in plant hormone signal transduction and plant-pathogen interaction pathways. The pink module was specifically enriched in plant-pathogen interaction and plant hormone signal transduction pathways, while the black module showed significant enrichment in pathways such as phenylpropanoid biosynthesis, plant hormone signal transduction and starch and sucrose metabolism. These findings not only revealed the functional division of different modules in the disease resistance response, but more importantly, they discovered that the phenylpropanoid biosynthesis and plant hormone signal transduction pathways repeatedly appeared in multiple modules, suggesting that these two pathways may play a core regulatory role in JA-induced disease resistance in maize, providing important target pathways for subsequent research.
Through the analysis of the core gene networks of four key modules (Figure 9 A~D), we identified 16 hub genes (the top four genes with the highest connectivity in each module) and constructed their interaction networks. Among them, the core genes of the brown module were significantly up-regulated in the disease-resistant variety Qi319 without JA treatment, including the genes encoding β-1,3-galactosyltransferase (Zm00001d013804), legumin (Zm00001d011036) and protein phosphatase (Zm00001d009620), which may be involved in the basic disease resistance response. The core genes of the blue module that were significantly down-regulated in the disease-susceptible material without JA treatment involved phosphopyruvate kinase regulatory protein (Zm00001d021672), WRKY transcription factor (Zm00001d043062) and peptidyl-prolyl cis-trans isomerase (Zm00001d011104), suggesting that the disease-susceptible variety may lack key defense regulatory factors. The calmodulin-like protein (Zm00001d042108) and zinc finger protein (Zm00001d010956) down-regulated in the disease-resistant material of the pink module may be involved in the negative regulation of disease resistance signaling. It is particularly noteworthy that the genes of cytokinin-O-glucosyltransferase (Zm00001d052209) and β-glucuronosyltransferase (Zm00001d040047) significantly up-regulated in the JA-treated disease-susceptible material of the black module, these glycosyltransferases may play a key role in JA-induced resistance by modifying hormones or secondary metabolites. The identification of these core genes provides important candidate targets for dissecting the molecular mechanism of maize disease resistance.
2.7. Candidate Gene Prediction
Through in-depth analysis of 16 core genes, we identified multiple key candidate genes. Zm00001d009620 (protein phosphatase) and Zm00001d043062 (WRKY transcription factor) play a significant role in biological stress response and may be key regulatory factors for maize resistance to U. maydis, while Zm00001d052209 (cytokinin-O-glucosyltransferase) and Zm00001d040047 (β-glucuronosyltransferase) may play a central role in JA-induced disease resistance. Combining transcriptome and module KEGG enrichment analysis, we further screened two important genes in the blue and pink modules, the RING zinc finger protein (Zm00001d051460) specific to disease-resistant materials and calmodulin (Zm00001d047618) specific to disease-sensitive materials (Table 1). Both genes were significantly upregulated under JA treatment and ranked in the top 10% in terms of connectivity within the module. Notably, these key genes are mainly enriched in plant hormone signal transduction and phenylpropane biosynthesis pathways, highly consistent with the results of module analysis. These findings not only validate the reliability of the WGCNA network analysis but also provide key targetgenes for dissecting the molecular mechanism of JA-induced maize resistance to U. maydis. Among them, the WRKY transcription factor and glycosyltransferase genes are particularly noteworthy and can be focused on for subsequent functional studies.
3. Discussion
Jasmonic acid substances (JAs), as important plant defense signaling molecules, have a dual mechanism of action in regulating plant disease resistance. On the one hand, JAs function by activating the endogenous defense system of plants, including promoting the biosynthesis of disease-resistant secondary metabolites (such as phenols, terpenes, etc.) and regulating the expression of disease-resistant genes (such as PR genes, defense enzyme genes, etc.) [23,24]. On the other hand, our experiments confirmed that exogenous JA (0.1 mmol/L) could directly inhibit the mycelial growth of U. maydis (inhibitory rate up to 19.0%), which is consistent with previous research findings that plant hormones such as salicylic acid (SA), auxin (IAA) and methyl jasmonate (MeJA) could directly inhibit the growth of pathogenic bacteria [25,26,27,28]. It is worth noting that this dual mechanism of action (host defense activation and direct pathogen inhibition) makes JA a highly potential plant immune inducer. Especially in the maize-U. maydis interaction system. JA may achieve effective prevention and control of U. maydis by regulating the expression of transcription factors such as WRKY (such as Zm00001d043062 identified in this study) and glycosyltransferases (such as Zm00001d052209), simultaneously activating the plant immune system and inhibiting the development of pathogens. These findings provide a theoretical basis for the development of green prevention and control technologies for maize diseases based on JA.
This study found that exogenous JA has a significant inducing effect on maize resistance to U. maydis and its effect exhibits a clear concentration dependence. By setting up a concentration gradient experiment of 0.01-1 mmol/L, it was confirmed that the 0.1 mmol/L JA treatment showed the optimal inductance effect, and its resistance induction ability was 0.1 mmol/L > 0.5 mmol/L > 1 mmol/L > 0.01 mmol/L in sequence. This result is consistent with the research of Su et al. [29] on the regulation of defense enzyme activity by JA to inhibit diseases. It is worth noting that the antibody-inducing effect of JA at an excessively high concentration (1 mmol/L) decreased instead, suggesting that there may be a feedback regulation mechanism in the JA signaling pathway. To verify the necessity of the JA signaling pathway, treatment with IBU revealed that 3 mmol/L IBU significantly inhibited plant disease resistance (p<0.01), and significant increase in disease index. These positive and negative experimental evidences collectively indicate that the integrity of the endogenous JA signaling pathway is crucial for maize resistance to U. maydis. Exogenous application of JA at appropriate concentrations (especially 0.1 mmol/L) can effectively activate the plant defense system, but its inducing effect is concentration-specific, and too high a concentration may lead to downregulation of the defense response, providing an important theoretical basis for the precise application of JA in maize disease prevention and control.
Research has shown that when plants are infected by pathogenic bacteria, they enhance their disease resistance by activating the defense enzyme system [30]. As a core component of the plant defense signaling network, JA can effectively regulate the synthesis of various defense-related substances [31,32]. This experiment found that after treating maize plants with 0.1 mmol/L JA, the activities of PPO, POD, and β-1,3-GA enzymes in the leaves were significantly increased compared to the CK (P<0.05), while the PAL activity increased but did not reach a significant level. This is consistent with the previous research results that JA can induce an increase in the activities of defense enzymes such as PPO and PAL [33]. In addition, MDA, as a key indicator of membrane lipid peroxidation, its content changes can reflect the degree of damage to plant cell membranes. This experiment found that JA treatment significantly reduced the MDA content in maize leaves, which is consistent with Gao Qianqian's research on the reduction of MDA content in non-heading Chinese cabbage by salicylic acid (SA) treatment [34], indicating that JA at an appropriate concentration can enhance maize resistance to U. maydis by reducing membrane lipid peroxidation damage. These results collectively demonstrate that JA enhances maize disease resistance through a dual mechanism (activating the defense enzyme system and reducing membrane damage), providing new experimental evidence for a deeper understanding of JA-induced plant immune mechanisms.
The structural characteristics of plant cell tissues serve as important physical defense barriers, playing a crucial role in the early stages of disease resistance [35]. Through paraffin section observation in this study, it was found that after maize was infected by U. maydis, the susceptible material 478 exhibited typical susceptible tissue structure characteristics: abnormal enlargement of mesophyll cells, disordered garland structure, division of bundle sheath cells, and thickening of spongy tissue. However, the disease-resistant material Qi 319 maintained a tight and orderly arrangement of palisade tissues and a complete garland structure. This result is highly consistent with the discovery made by Pu [36] in the powdery mildew system. It is worth noting that JA treatment can significantly alleviate the structural damage caused by pathogen infection. The mechanism of action may involve: (1) Promoting the growth of epidermal cells to form a physical barrier, hindering the infection of mycelium into the vascular bundle sheath and mesophyll tissue. (2) Maintain the tight arrangement of the palisade tissue and enhance the mechanical strength of the cell wall. (3) Inhibit the excessive proliferation of spongy tissue and maintain the normal morphology of mesophyll cells. These findings not only confirm the significant role of cellular tissue structure characteristics in maize resistance to U. maydis, but also provide histological evidence for analyzing the disease resistance mechanism induced by JA, laying an important foundation for subsequent in-depth studies. Ghareeb et al. [37]'s study on inflorescence regeneration also suggests that plants may respond to pathogen infection by restructuring their tissue structure, which is consistent with the findings of this study.
In terms of disease resistance regulatory mechanisms, the PP2C family protein phosphatase gene Zm00001d009620 specifically upregulated in disease-resistant varieties may indirectly inhibit reactive oxygen species production by negatively regulating the ABA signaling pathway. This finding is consistent with the functions of PP2C genes (such as ABI1 and HAB1) in Arabidopsis thaliana [38,39,40]. In terms of the molecular strategies by which pathogenic bacteria interfere with host defense, the significantly downregulated WRKY transcription factor gene Zm00001d043062 in the susceptible species suggests that the U. maydis may target and inhibit the expression of related disease-resistant genes activated by this factor through the secretion of effector proteins [41,42]. Thereby blocking the expression of the activated PTI/ETI defense genes [43,44], this discovery provides a new perspective on the mechanism of action of pathogenic effectors.
In the JA-induced defense network, the upregulated cytokinin-O-glucosyltransferase gene Zm00001d052209 of the susceptible varieties may regulate hormone homeostasis through glycosylation modification and affect JA signaling efficiency [45,46]. Meanwhile, the β-glucuronosyltransferase gene Zm00001d040047 may be involved in the synthesis of cell wall polysaccharides or defend against metabolite modification [47,48], and it is speculated that it regulates disease resistance by promoting the thickening of the cell wall. It is particularly worth noting the upregulated expression of the RING zinc finger protein gene Zm00001d051460 in disease-resistant varieties. Considering the key role of Ring-like E3 ubiquitin ligases in regulating the stability of COI1 protein, a core component of JA signaling [49,50], we speculate that this gene may precisely regulate the intensity and temporal dynamics of the JA signaling pathway through the ubiquitin-proteasome system, and this mechanism may be an important factor determining the differences in disease resistance among varieties. Additionally, the upregulated expression of the calmodulin gene Zm00001d047618 in susceptible varieties indicates that disease resistance-related calcium signaling is activated. This gene is associated with promoting the increase of calcium ions, which interact with the production of reactive oxygen species. Furthermore, this gene is involved in the expression of LOX gene in the JA synthesis pathway [51]. These findings construct an innovative theoretical framework: JA forms a precisely coordinated disease resistance defense system by integrating multi-level networks such as PP2C-mediated ABA signal regulation, WRKY transcriptional cascade, metabolic remodeling involving glycosyltransferases, ubiquitin-mediated protein degradation and calcium signal activation. This provides a new theoretical paradigm for understanding plant immune mechanisms and lays a molecular foundation for the design of disease-resistant breeding strategies.
4. Conclusion
At the cellular tissue structure level, JA treatment can maintain the tight arrangement of palisade tissue and induce GLCAT expression to strengthen the cell wall, forming an effective physical barrier (Figure 10). This discovery provides direct evidence for understanding plant structural resistance. At the molecular regulation level, omics analysis revealed that JA coordinates disease resistance through a complex gene expression regulatory network. Two important findings deserve special attention: (1) Under the stress of U. maydis, the resistant variety Qi319 demonstrates its inherent resistance advantage through more significant transcriptome reprogramming (1978 genes up-regulated and 2576 genes down-regulated). (2) Under JA induction, the susceptible variety Ye478 exhibits a stronger transcriptome response (1755 genes up-regulated and 1431 genes down-regulated), suggesting that JA may enhance resistance by compensating for the defects in defense signal transduction in susceptible varieties. In-depth analysis revealed that MeJA enhances maize defense capabilities through a triple-action mechanism: on the one hand, it induces the synthesis of endogenous JA to activate the JA signaling pathway, leading to the expression of disease resistance genes under the JA synthesis pathway [52]. On the other hand, JA mainly induces the upregulation of genes related to ABA and CK pathways, activating the defense enzyme system (PPO, POD, and β-1,3-GA enzyme activities significantly increased), effectively reducing membrane lipid peroxidation damage (MDA content significantly decreased), and activate the calcium signaling disease resistance system. These pathways work synergistically and the three hormone pathways interact with each other to eliminate or affect the production of reactive oxygen species, thereby enhancing antioxidant resistance, including negatively regulating the ABA signaling pathway (PP2C gene), activating defense-related transcription factors (WRKY gene), modifying hormone activity (CGT gene), regulating protein stability (RING zinc finger protein), and activating the calcium signaling system (CaM gene); On the other hand, it promotes disease resistance by downregulating pathogen-induced related transcription factors to negatively activate the expression of related disease resistance genes. These findings not only confirm the importance of JA as a core defense hormone but also reveal the molecular basis of variety resistance differences. Based on these results, we propose an innovative hypothesis: JA may partially compensate for the inherent defects in the defense pathways of susceptible varieties through a "signal compensation mechanism," providing new ideas for crop disease resistance improvement. Future research should focus on: (1) Functional verification of key candidate genes (2) The cross-regulation mechanism of the JA signal network and other defense pathways; (3) The genetic basis of species-specific defense responses. These works will promote the further development of theoretical and applied research on crop disease resistance.
5. Materials and Methods
5.1. Experimental Materials
The maize materials used were the susceptible variety Ye478 and the resistant variety Qi319, provided by the Maize Research Group of Gansu Agricultural University.
Test strain: U. maydis, strain number 5.208, purchased from the Institute of Microbiology, Chinese Academy of Sciences. U. maydis powder was provided by the Maize Research Group of Gansu Agricultural University.
Preparation of inoculum: The teliospores are crushed, collected through a 100-mesh sieve to obtain fungal powder and 10 mL of water is added per 1 g of fungal powder. Then, it is filtered through a 300-mesh sieve, and it should be prepared immediately before use.
PDA medium: 500 mL of potato extract, 10.0 g of glucose, 1.5 g of KH2PO4, 1.5 g of MgSO4·7H2O, 7.5 g of agar and trace vitamin B1, adjusted to pH 6.0.
JA: liquid, purity 98%, purchased from Gansu Yuanxin Biotechnology.
IBU: solid, purchased from Gansu Aierwei Scientific Instrument Co., Ltd.
5.2. Treatment Methods with JA and IBU
Experimental study on the inhibitory effect of JA on the mycelial growth of U. maydis: Prepare JA solutions of different concentrations (0.01, 0.1, 0.5 and 1 mmoL/L), sterilize them through a 0.22 μm bacterial filter, then add them to PDA medium and mix well. Use the same amount of sterile as the control (CK). In the ultra-clean workbench, bacterial plates with a diameter of 5 mm were inoculated in the center of the culture medium and placed in an artificial climate chamber at 25℃ for cultivation. The colony expansion area was measured at 24 h and 48 h respectively and the inhibition rate was calculated [53].
Plant treatment experiment: prepare JA solutions (0.01, 0.1, 0.5 and 1 mmoL/L) and IBU solutions (0.1, 1, 3, and 5 mmoL/L), and add 0.05% Tween 20 as a surfactant. When the maize plants reach the six-leaf stage, inoculate with U. maydis by injection [54]. After 6 hours of inoculation, treat with JA solution and IBU solution, using a sprayer to evenly spray the leaves until they are wet. The control group is sprayed with an equal amount of distilled water containing 0.05% Tween 20. After 7 days of treatment, assess the disease incidence in the maize plants and calculate the disease index (DI) and the induced resistance effect [55]. Each treatment has three biological replicates, with 10 plants in each replicate. The grading criteria for U. maydis are shown in Supplementary Table S5.
Disease index(DI=∑(number of diseased plants at each level ×level of disease)×100/ (highest level of disease×total number of plants surveyed) (1)
Induced resistance effect(%)= (control disease index−treated disease index)/ (control disease index) ×100 (2)
5.3. Determination of Maize Defense-Related Enzyme Activity
Maize plants at the six-leaf stage were inoculated with U. maydis. Six hours after inoculation, 0.1 mmoL/L JA (determined to have the best resistance effect through preliminary screening) is sprayed on the maize leaves. The experiment includes six treatments: Qi319 uninoculated control (QCK-U), Qi319 inoculated control (QCK-I), Qi319 inoculated + JA treatment (QJA-I), Ye478 uninoculated control (YCK-U), Ye478 inoculated control (YCK-I) and Ye478 inoculated + JA treatment (YJA-I). Each treatment has three biological replicates. Samples were collected at five time points after treatment: 0 h, 12 h, 48 h, 72 h, and 96 h, flash-frozen in liquid nitrogen and stored at −80°C for subsequent enzyme assays. The extraction of crude enzyme solution follows the method of Kibiza et al. [56]. Peroxidase (POD) activity is measured using the guaiacol method [57], phenylalanine ammonia-lyase (PAL) activity is determined using the phenylalanine colorimetric method [58], polyphenol oxidase (PPO) activity is measured using the catechol method [59], malondialdehyde (MDA) content is determined by referring to the method of Chen et al. [60], β-1,3 Glucanase (β-1,3-GA) activity is measured using the Solarbio β-1,3 glucanase activity detection kit.
5.4. Cytological Analysis of Maize Leaves
To analyze the effects of JA treatment on the cellular structure of maize leaves, we performed cytological observations using paraffin sectioning coupled with hexamine silver staining [61]. The focus was on observing the morphology of mesophyll cells, vascular bundle structure and pathogen infection. This method can clearly show the impact of JA treatment on the cellular structure of maize leaves and the progression of pathogen infection.
5.5. Total RNA Extraction and RNA-seq
Total RNA was extracted from maize leaves using the AccuRNA RNA Extraction Kit (Hunan AccuRNA Biotechnology Co., Ltd.). After passing the quality control, samples were submitted to Biomarker Technologies Corporation (Beijing) for transcriptome sequencing analysis. The experimental workflow consisted of: (1) Library preparation using NEBNext® Ultra™ RNA Library Prep Kit; (2) Paired-end sequencing (150 bp) on the Illumina NovaSeq 6000 platform; (3) Raw data quality control using Fastp software. High-quality clean data were then aligned to the maize reference genome (ZmB73_5a.59) using HISAT2 software. Differentially expressed genes (DEGs) were identified with DESeq2 (thresholds: |log2FC|≥1 and FDR<0.01). Functional annotation was performed through GO analysis using EggNOG-mapper and KEGG pathway enrichment analysis using KOBAS (P-value<0.05). Finally, a gene co-expression network was constructed using Weighted Gene Co-expression Network Analysis (WGCNA), with key modules (correlation >0.7) selected and visualized using Cytoscape (3.10.0) software.
5.6. Quantitative Real-Time PCR (qRT-PCR) Analysis
To verify the reliability of the transcriptome sequencing results, six randomly selected genes were subjected to qRT-PCR verification. The experimental procedure was conducted as follows: First, using maize Actin gene as the internal reference, total RNA (1 μg) was reverse transcribed into cDNA reference using the AccuRT Reverse Transcription Kit (Cat. No. ACCRT-002; Hunan AccuRNA Biotechnology Co., Ltd.). Gene-specific primers were designed using Primer 5.0 software (primer sequences listed in Table 2), with three biological replicates performed for each gene. qRT-PCR reactions were carried out on a QuantStudio 5 Real-Time PCR System under the following thermal cycling conditions: 95℃ pre-denaturation for 30 sec, followed by 40 cycles of 95℃ denaturation for 5 sec and 60℃ annealing/extension for 30 sec. Finally, the relative gene expression levels were calculated using the 2-ΔΔCT method and correlated with RNA-seq data (R² > 0.85). The results demonstrated strong concordance between qRT-PCR and RNA-seq data, confirming the reliability of the transcriptome sequencing results.
5.7. Data Processing and Statistical Analysis
Statistical analyses were performed using SPSS 22.0 software (IBM, USA). One-way analysis of variance (ANOVA) followed by LSD post-hoc test (P<0.05) was conducted to determine significant differences among treatments. Data visualization was implemented using Origin 2024 (OriginLab, USA) for generating high-quality statistical graphs. The gene co-expression network derived from WGCNA analysis was visualized using Cytoscape 3.10.0 to illustrate interactions among core genes. All statistical analyses were performed with a 95% confidence interval to ensure the reliability and scientific validity of the results.
Supplementary Materials
The following supporting information can be downloaded at: Preprints.org, Table S1: Investigation and grading standards of Ustilago maydis; Table S2: Effect of jasmonic acid on mycelium of maize smut; Table S3: Effect of jasmonic acid treatment on maize smut; Table S4: Effects of jasmonic acid inhibitor treatment on maize smut; Table S5: Sample transcriptome sequencing data statistics.
Author Contributions
F.W. and Y.P. designed the experiments. J.W. and T.W. performed the experiments. J.W., T.W. and F.W. analyzed the data. F.W., J.W., T.W. and Y.S. wrote the manuscript. All authors have read and agreed to the published version of the manuscript.
Funding
Please add: This research was supported by the Key Project of Natural Science Foundation of Gansu Province (No. 23JRRA1405), and the National Natural Science Foundation project, China (No. 32060487).
Institutional Review Board Statement
Not applicable.
Informed Consent Statement
Not applicable.
Data Availability Statement
Data is contained within the article or Supplementary Materials.
Acknowledgments
We thank the reviewer for the positive and constructive comments regarding our paper, and Wang Fang for her guidance and revision.
Conflicts of Interest
The authors declare no conflict of interest.
References
- Sun, H.M. Investigation on the Occurrence of Corn Smut and Study on Chemical Control. Agric. Dev. Equip. 2021, 3, 163–164. [Google Scholar]
- Redkar, A.; Hoser, R. ; Schilling L; Zechmann, B.; Krzymowska, M.; Walbot, V.; Doehlemann, G. A Secreted effector protein of Ustilago maydis guides maize leaf cells to form tumors. Plant Cell. [CrossRef]
- Meng, Y.; Chen, G.; Tan, H. Main Pests and Diseases of Maize and Their Control Techniques. Mod. Agric. 2007, 29, 43–45. [Google Scholar] [CrossRef]
- Lu, J.H. Occurrence Patterns and Control Measures of Corn Head Smut. Rural Sci. Technol. 2020, 37, 42–43. [Google Scholar] [CrossRef]
- Zhang, J.Q.; Zhang, H.J.; Liu, S.S.; Guo, N.; Jin, G.; Shi, J. Establishment and Application of Indoor Rapid Screening Method for Controlling Ustilago maydis. J. Pestic. Sci. 2020, 22(4), 711–715. [Google Scholar] [CrossRef]
- Ee, W.D.; Wang, Z.H.; Zhang, L.G.; Zhang, L.; Wang, X.; Sun, G.Q. The Advances in the Research of Common Smut in Maize . Maize Sci. 2006, 14, 153–157. [Google Scholar]
- Li, A.M. Discussion on High-Yield Maize Cultivation Techniques and Pest and Disease Control Strategies. Seed Sci. Technol. 2023, 2023 41, 47–49. [Google Scholar] [CrossRef]
- Zhang, W.J.; Ren, C.Y. Causes and Control Strategies of Corn Smut Disease. Seed Sci. Technol. 2021, 39, 83–84. [Google Scholar] [CrossRef]
- Yang, K.Z.; Ma, J.H.; Ren, B.C. Efficacy Test of Seed Coating against Ustilago maydis. Pesticides 2016, 55, 764–766. [Google Scholar] [CrossRef]
- Peng, W.; Li, K.T.; Zeng, Y.J. Advances in Microbial Control of Rice Diseases. J. Jiangxi Agric. Univ. 2015, 37, 625–631. [Google Scholar] [CrossRef]
- Pan, L.Y.; Zhao, X.Y.; Chen, M.; Fu, Y.Q.; Xiang, M.L.; Chen, J.Y. Methyl Jasmonate Regulates Defense Enzyme Activity to Induce Postharvest Soft Rot Resistance in Kiwifruit Fruits. Plant Prot. 2019, 45, 75–80. [Google Scholar] [CrossRef]
- Ivica, D.; Tamara, J.; Marija, P.; Giuliano, D.; Djordje, F. Plant-Associated Bacillus and Pseudomonas Antimicrobial Activities in Plant Disease Suppression via Biological Control Mechanisms - A Review. Physiol. Mol. Plant Pathol. 2021, 117, 101754. [Google Scholar] [CrossRef]
- Walters, D.R. , Ratsep, J., Havis, N.D. Controlling Crop Diseases using Induced Resistance: Challenges for the Future. J. Exp. Bot. 2013, 64, 1263–1280. [Google Scholar] [CrossRef] [PubMed]
- Yu, C.G.; Li, T.L.; Du, Y.Y.; Zhou, D.; Wei, S. Plant-Induced Disease Resistance Signal Transduction Pathways. Plant Prot. 2008, 34, 1–4. [Google Scholar]
- Robert-Seilaniantz, A.; Grant, M.; Jones, J. D.G. Hormone Crosstalk in Plant Disease and Defense: More Than Just Jasmonate-Salicylate Antagonism. Annu. Rev. Phytopathol. 2011, 49, 317–343. [Google Scholar] [CrossRef]
- Zheng, X.L.; Zheng, J.L.; Xi, J.G.; et al. Preliminary Report on the Sensitivity of Colletotrichum gloeosporioides to Ethephon in Rubber Trees. Acta Agric. Australas. Sin. 2017, 48, 82–86. [Google Scholar]
- Liu, L. Study on the Regulation Mechanism of Plant Hormones on Rice Seed Germination and Seedling Root Growth Under Salt Stress. Ph.D. Dissertation, Huazhong Agricultural University, Wuhan, China, 2018. [Google Scholar]
- Bari, R.; Jones, J. D. Role of Plant Hormones in Plant Defence Responses. Plant Mol. Biol. 2009, 69, 473–488. [Google Scholar] [CrossRef]
- Li, Y. Exploration of the Mechanism of Action of Hormones in the Interaction Between Rice and Pathogens, and Functional Analysis of the Disease Resistance-Related Gene OsDR10. Master’s Thesis, Huazhong Agricultural University, Wuhan, China, 2016. [Google Scholar]
- Lv, S. Study on the Disease Resistance Mechanism of Rice Induced by Protein Elicitor Mo Hrip1. Master’s Thesis, Chinese Acad. Agric. Sci. 2016.
- Zou, Z.; Wang, Z. Study on the Induction of Resistance to Rice Blast by JA in Rice Seedlings. Acta Phytopathol. Sin. 2006, 36, 432–438. [Google Scholar] [CrossRef]
- Li, M.; Yan, X.F. JA, the Environmental Signal Molecule of Plants, and Its Biological Functions. Acta Ecol. Sin. 2014, 34, 6779–6788. [Google Scholar] [CrossRef]
- Zhang, H. Cell Wall Degrading Enzymes of Rhizoctonia solani and Their Role in Pathogenesis. Master’s Thesis, Yangzhou University, Yangzhou, China, 2004. [Google Scholar]
- Chen, Z.Y.; Xu, Z.G; Lu, F.; Liu, Y.F. Induction of Resistance in Rice Plants by Antagonistic Bacterium B-916. Acta Agric. Agrolog. Sin. 2001, 17, 44–48. [Google Scholar] [CrossRef]
- Wang, Y.; Yang, L. , Chen, X., Ye, T., Zhong, B., Liu, R., Wu, Y., Chan, Z. Salicylic Acid Inhibits Pathogen Growth in Plants Through Direct Antimicrobial Activity and Defense Induction. Plant Physiol. 2015, 167, 1254–1266. [Google Scholar] [CrossRef]
- Navarro, L.; Dunoyer, P. , Jay, F., Arnold, B., Dharmasiri, N., Estelle, M., Voinnet, O., Jones, J.D.G. A Plant miRNA Contributes to Antibacterial Resistance by Repressing Auxin Signaling. Science 2006, 312, 436–439. [Google Scholar] [CrossRef] [PubMed]
- Thaler, J. S.; Humphrey, P.T. , Whiteman, N.K. Jasmonate-Deficient Plants Have Reduced Direct and Indirect Defenses Against Herbivores. Ecol. Lett. 2012, 15, 224–232. [Google Scholar] [CrossRef]
- He, Y. Study on the Mechanism of JA Pathway Inhibiting Brassinosteroid Regulation of Rice Immunity Against Rice Black-Streaked Dwarf Virus. Ph.D. Dissertation, Zhejiang University, Hangzhou, China, 2017. [Google Scholar]
- Su, Y.; Zheng, Q.; Ma, X.; Li, J.; Wu, B.; Hu, L.; Fan, R. Study on Physiological and Biochemical Changes in Pepper Resistance to Blight Induced by JA and Salicylic Acid. J. Southwest Agric. Univ. 2021, 34, 1630–1636. [Google Scholar] [CrossRef]
- Wen, S.H.; Yang, J.W.; Wang, Y.; Li, G.J.; Wen, J.F.; Duan, C.X.; Jia, X.; Wang, J.J. Progress in Maize Anti-Fungal Disease Gene Mining and Molecular Breeding Utilization Research. Crop J. 2023, 11, 1–11. [Google Scholar] [CrossRef]
- Wasternack, C.; Strnad, M. Jasmonate Signaling in Plant Stress Responses and Development-Active and Inactive Compounds. New Biotechnol. 2016, 33, 604–613. [Google Scholar] [CrossRef]
- Yang, J.; Duan, G. H.; Li, C. Q.; Liu, L.; Han, G. G.; Zhang, Y. L.; Wang, C. M. The Crosstalks Between JA and Other Plant Hormone Signalings Highlight the Involvement of JA as a Core Component in Plant Response to Biotic and Abiotic Stresses. Front. Plant Sci. 2019, 13, 1349. [Google Scholar] [CrossRef]
- Liu, L.; Sun, L.; Zhang, Z.; An, M.; Chen, K.; Wang, X. Induction Resistance and Defense Enzyme Activity by Extraneous Factors to Fusarium oxysporum f.sp.melonisin Melon. North. Hortic. 2016, 40, 122–126. [Google Scholar]
- Gao, Q. Physiological Mechanism of Salicylic Acid-Induced Resistance to Clubroot Disease in Non-Heading Chinese Cabbage. Master's Thesis, Nanjing Agricultural University, Nanjing, China, 2016. [Google Scholar]
- Wang, C. Study on the Mechanism of StLTP10 Regulating Potato Resistance to Late Blight. Master's Thesis, Shandong Agricultural University, Taian, China, 2020. [Google Scholar]
- Pu, X. Physiological and Molecular Mechanisms of Resistance to Powdery Mildew in Trifolium pratense and Cloning and Genetic Transformation of the Disease Resistance Gene TpGDSL. Ph.D. Dissertation, Gansu Agricultural University, Lanzhou, China, 2021. [Google Scholar]
- Ghareeb, H.; Becker, A.; Iven, T.; Feussner, I.; Schirawski, J. Sporisorium reilianum Infection Changes Inflorescence and Branching Architectures of Maize. Plant Physiol. 2011, 156, 2037–2052. [Google Scholar] [CrossRef]
- Wu, X.Y.; Li, T. A Casein Kinase II Phosphorylation Site in AtYY1 Affects Its Activity, Stability, and Function in the ABA Response. Front. Plant Sci. 2017, 11, 323. [Google Scholar] [CrossRef]
- Chu, M.; Chen, P.; Meng, S.; Zhang, X. , Liang, Z., Guo, Q., Wang, Y. The Arabidopsis Phosphatase PP2C49 Negatively Regulates Salt Tolerance Through Inhibition of AtHKT1;1. J. Integr. Plant Biol. 2021, 63, 528–542. [Google Scholar] [CrossRef]
- Hirayama, T.; Umezawa, T. The PP2C-SnRK2 Complex: The Central Regulator of an Abscisic Acid Signaling Pathway. Plant Signal. Behav. 2010, 5, 160–163. [Google Scholar] [CrossRef] [PubMed]
- Chisholm, S.T.; Coaker, G.; Day, B.; Staskawicz, B.J. Host-Microbe Interactions: Shaping the Evolution of Plant Immune Responses. Cell 2006, 124, 803–814. [Google Scholar] [CrossRef] [PubMed]
- Song, T. Functional and Mechanistic Studies on Three Effectors of Phytophthora sojae Regulating Plant Immune Response. Ph.D. Dissertation, Nanjing Agricultural University, Nanjing, China, 2015. [Google Scholar]
- Yu, Y.C.; Qiao, M.; Liu, Z.H.; Xiang, F.Y. Diversification function of WRKY transcription factor. Life Sci. 2010, 22, 345–351. [Google Scholar] [CrossRef]
- Jones, J. D. G.; Dangl, J. L. The Plant Immune System. Nature 2006, 444, 323–329. [Google Scholar] [CrossRef]
- Wang, J. Functional Analysis of Cytokinin N-Glycosyltransferase Gene in Arabidopsis thaliana. Master's Thesis, Shandong University, Jinan, China, 2011. [Google Scholar]
- Argueso, C.T.; Ferreira, F.J.; Epple, P.; To, J.P.; Hutchison, C.E.; Schaller, G.E.; Dangl, J.L.; Kieber, J.J. Two-Component Elements Mediate Interactions Between Cytokinin and Salicylic Acid in Plant Immunity. PLoS Genet. 2012, 8, e1002448. [Google Scholar] [CrossRef]
- Awolade, P.; Cele, N.; Kerru, N.; Gummidi, L.; Oluwakemi, E.; Singh, P. Therapeutic Significance of β-Glucuronidase Activity and Its Inhibitors: A Review. Eur. J. Med. Chem. 2020, 187, 111921. [Google Scholar] [CrossRef]
- Wan, J.; He, M.; Hou, Q.; Zou, L.; Yang, Y.; Wei, Y.; Chen, X. Plant Cell Wall-Associated Immunity. Journal Abbrev. 2021, 1, 3. [Google Scholar] [CrossRef]
- Han, G.; Qiao, Z.; Li, Y.; Yang, Z.; Wang, C.; Zhang, Y.; Liu, L.; Wang, B. RING Zinc Finger Proteins in Plant Abiotic Stress Tolerance. Front. Plant Sci. 2022, 13, 877011. [Google Scholar] [CrossRef] [PubMed]
- Zander, M.; Lewsey, M.G.; Clark, N.M.; Yin, L.; Bartlett, A.; Saldierna Guzmán, J.P.; Hann, E.; Langford, A.E.; Jow, B.; Wise, A.; Nery, J.R.; Chen, H.; Bar-Joseph, Z.; Walley, J.W.; Solano, R.; Ecker, J.R. Integrated Multi-Omics Framework of the Plant Response to Jasmonic Acid. Nat. Plants 2020, 6, 290–302. [Google Scholar] [CrossRef]
- Heo, W.D.; Lee, S.H.; Kim, M.C.; Kim, J.C. , Chung, W.S., Chun, H.J., Park, C.Y., Park, H.C., Choi, J.Y., Cho, M.J. Involvement of Specific Calmodulin Isoforms in Salicylic Acid-Independent Activation of Plant Disease Resistance Responses. Proc. Natl. Acad. Sci. USA. 1999, 96, 766–771. [Google Scholar] [CrossRef]
- Creelman, R.A.; Mullet, J.E. Biosynthesis and Action of Jasmonates in Plants. Annu. Rev. Plant Biol. 1997, 48, 355–381. [Google Scholar] [CrossRef] [PubMed]
- Zhang, Z.H.; Nie, Y.F.; He, L.; Li, Y.F.; Wang, Z.Z. Resistance-related defense enzymes and endogenous salicylic acid induced by exogenous methyl jasmonate in rice against blast disease. Acta Phytopathol. Sin. 2010, 40, 395–403. [Google Scholar] [CrossRef]
- Wang, W. Study on Genetic Characteristics and Biochemical Properties of Resistance to Ustilago maydis. Ph.D. Dissertation, Gansu Agricultural University, Lanzhou, China, 2010. [Google Scholar]
- Robert-Seilaniantz, A.; Grant, M.; Jones, J. D. G. Hormone Crosstalk in Plant Disease and Defense: More Than Just Jasmonate-Salicylate Antagonism. Annu. Rev. Phytopathol. 2011, 49, 317–343. [Google Scholar] [CrossRef] [PubMed]
- Kibinza, S.; Vinel, D.; Côme, D.; Bailly, C.; Corbineau, F. Sunflower Seed Deterioration as Related to Moisture Content During Ageing, Energy Metabolism and Active Oxygen Species Scavenging. Physiol. Plant. 2006, 128, 496–506. [Google Scholar] [CrossRef]
- Jing, X. QTL Analysis of Peroxidase Activity in Wheat Grains and Cloning of Related Genes and Development of Functional Markers. Master’s Thesis, Chinese Academy of Agricultural Sciences, Beijing, China, 2015. [Google Scholar]
- Hu, Z.H.; Zhang, W.; Shen, Y.B.; Shen, Y.B.; Wang, N.N. Activities of Lipoxygenase and Phenylalanine Ammonia-Lyase in Polar Leaves Induced by Insect Herbivory and Volatiles. J. For. Res. 2009, 20, 372–376. [Google Scholar] [CrossRef]
- Hu, Z.H.; Shen, Y.B.; Wang, N.N.; Wang, J.F.; Zhou, Y.C.; Zhang, Z.Y. The Activities of Polyphenol Oxidase in Populus simonii × P. pyramidalis ‘Opera8277’ Leaves in Response to Insect Herbivory and Volatiles Exposure. Acta Ecol. Sin. 2009, 29, 5265–5270. [Google Scholar]
- Chen, G. Study on the Induction of Resistance to Rust Disease in Safflower by Exogenous Chemicals. Master’s Thesis, Sichuan Agricultural University, Chengdu, China, 2009. [Google Scholar]
- Paraffin Sides Experiment Report. Available online: https://www.servicebio.cn/data-detail?id=3588&code=RSSYBG (accessed on 23 April 2022).
Figure 1.
Changes in the activity of defense enzymes related to maize resistance to U. maydis under different treatments. Different lowercase letters represent the same time with significant difference under different treatments (p< 0.05). QCK-U: Qi319 uninoculated control; QCK-I: Qi319 inoculated control; QJA-I: Qi319 inoculated + JA treatment; YCK-U: Ye478 uninoculated control; YCK-I: Ye478 inoculated control; YJA-I: Ye478 inoculated + JA treatment. A. POD activity; B: PPO activity; C: β-1,3-GA activity; D: PAL activity; E: MDA content.
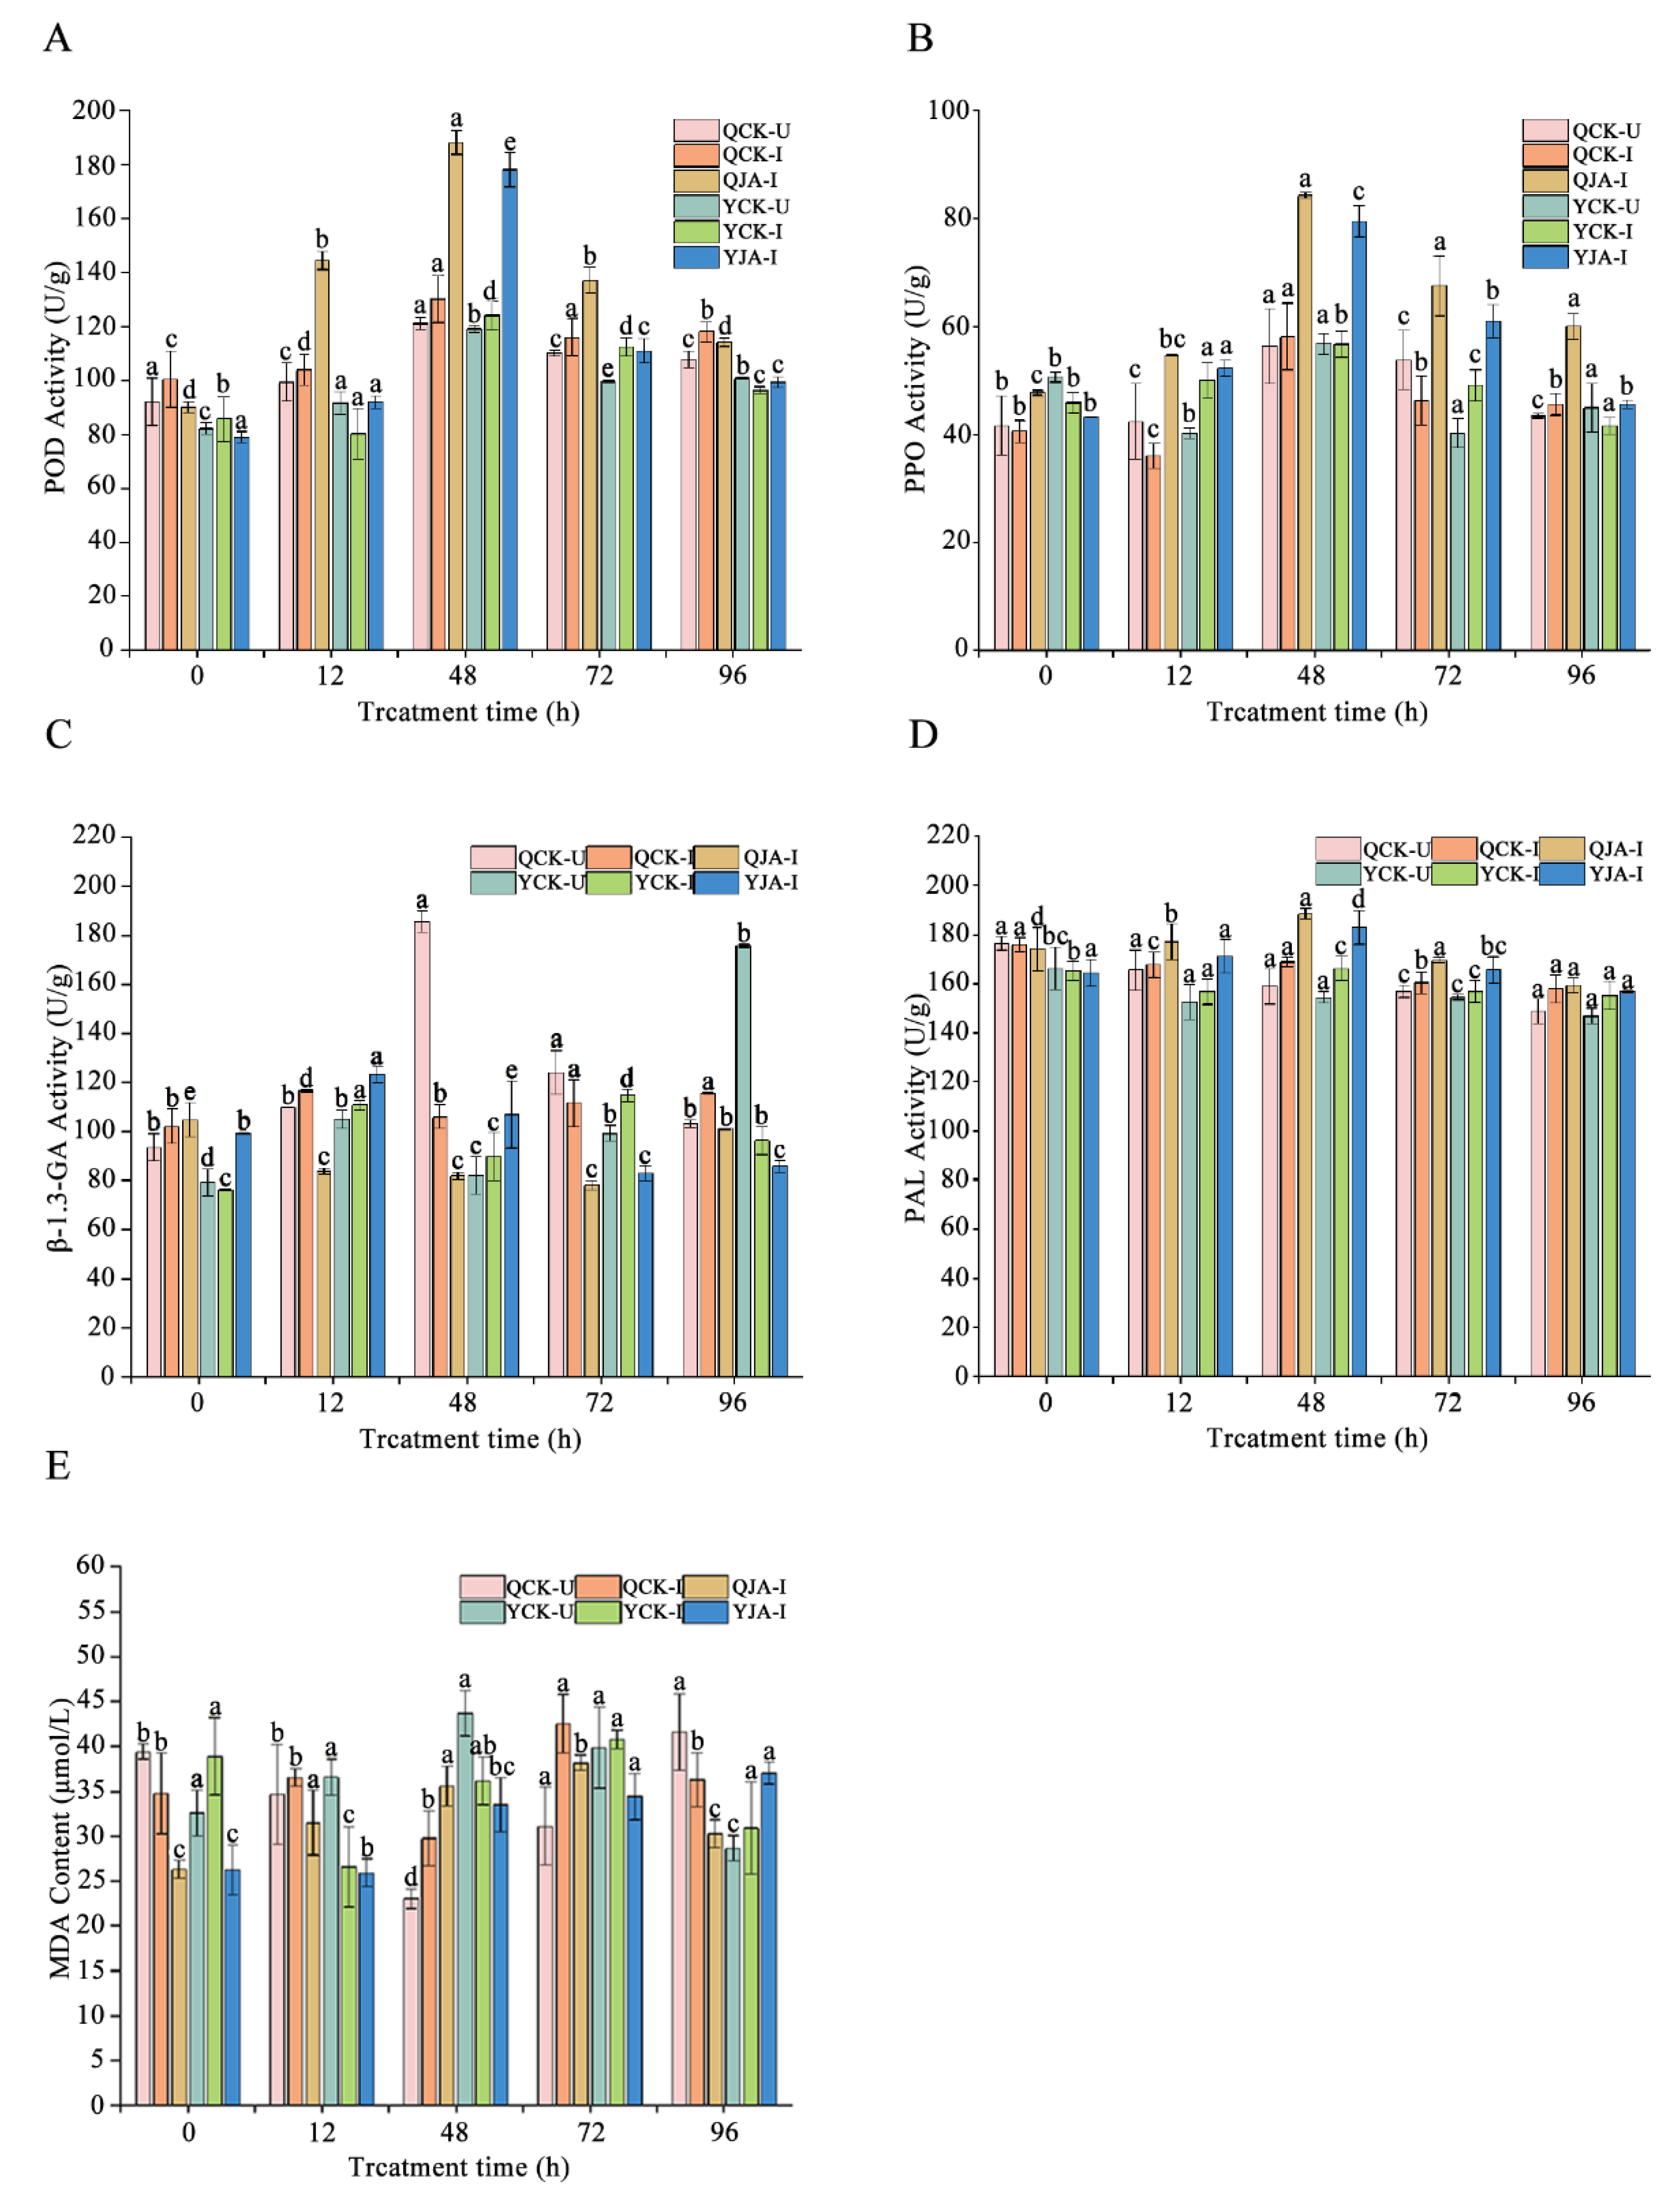
Figure 2.
Cell structure of maize leaves under JA treatment. A1-A5: 0, 12, 48, 72, 96 h QJA-I leaf transverse section structure; B1-B5: 0, 12, 48, 72, 96 h YJA-I leaf transverse section structure; C1-C5: 0, 12, 48, 72, 96 h QCK-I leaf transverse section structure; D1-D5: 0, 12, 48, 72, 96 h YCK-I leaf transverse section structure; E1-E5: 0, 12, 48, 72, 96 h QCK-U leaf transverse section structure; F1-F5: 0, 12, 48, 72, 96 h YCK-U leaf transverse section structure; EP: Epidermis; BSC: Bundle sheath cells; MC: Mesophyll cells; Scale bar: 50 μm.
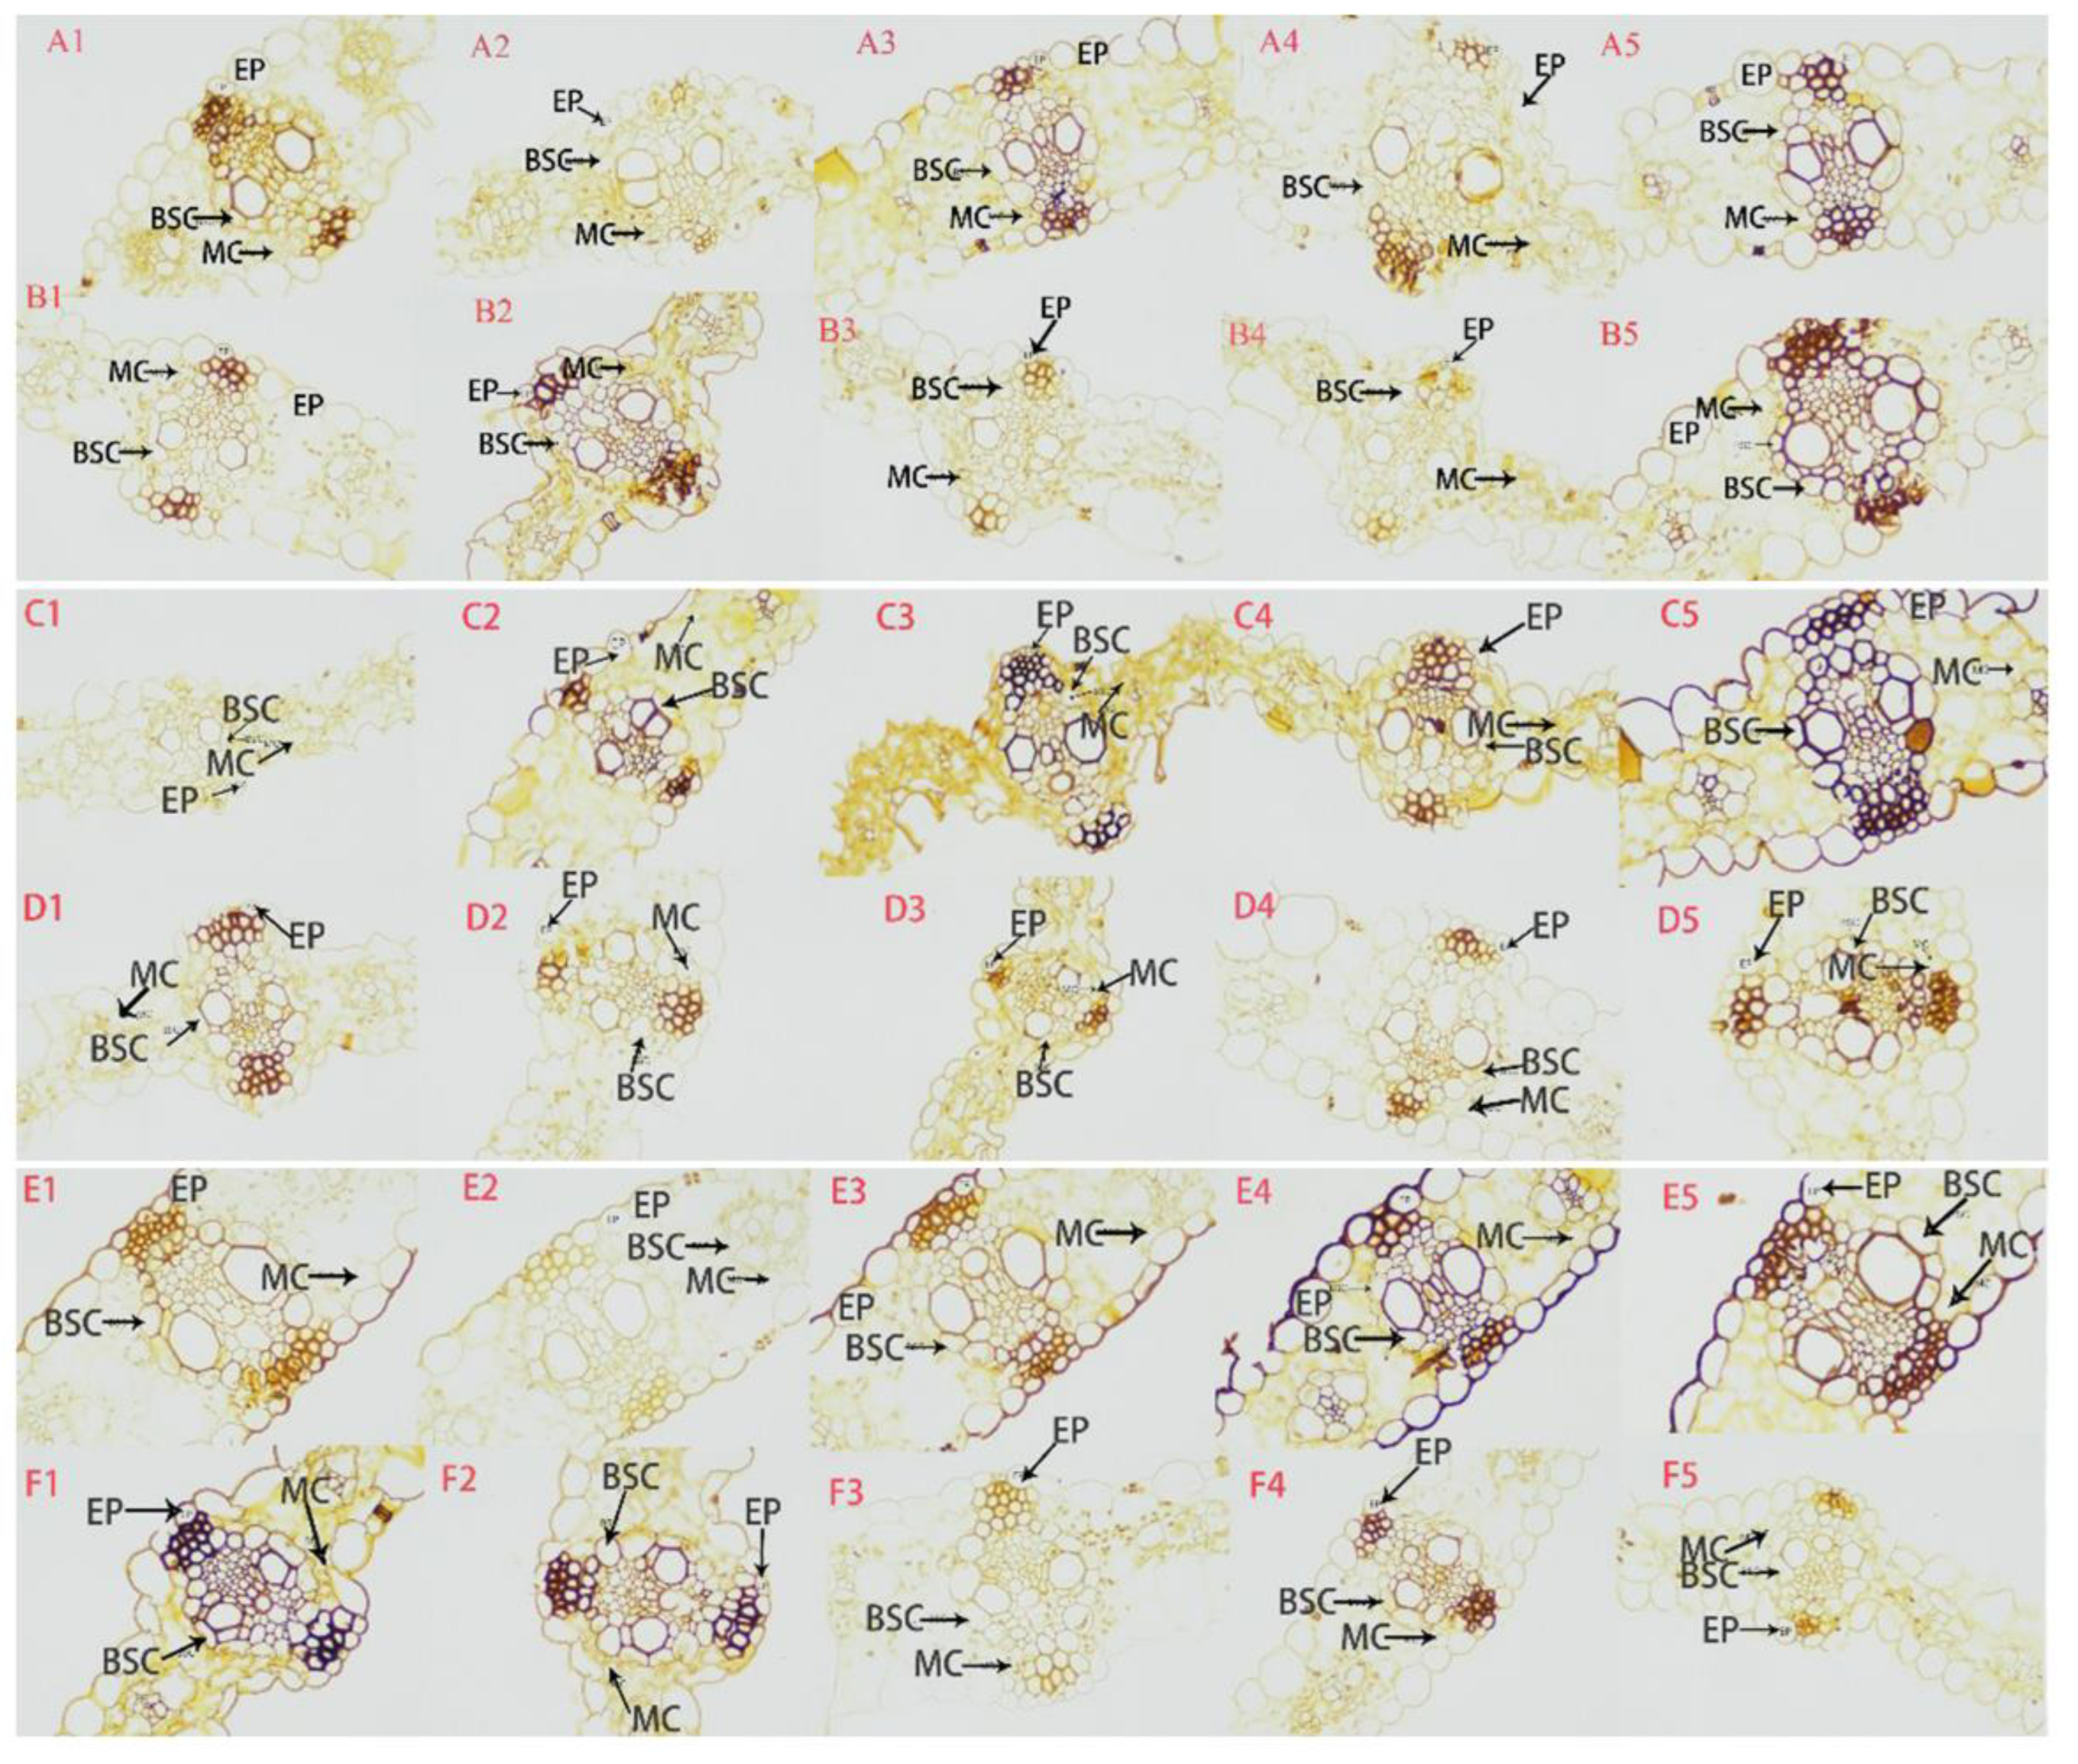
Figure 3.
Number of upregulated and downregulated DEGs across different treatments and venen analysis. A: Number of upregulated and downregulated DEGs across different treatments; B: Venn analysis of expressed genes in different treatment groups.
Figure 3.
Number of upregulated and downregulated DEGs across different treatments and venen analysis. A: Number of upregulated and downregulated DEGs across different treatments; B: Venn analysis of expressed genes in different treatment groups.
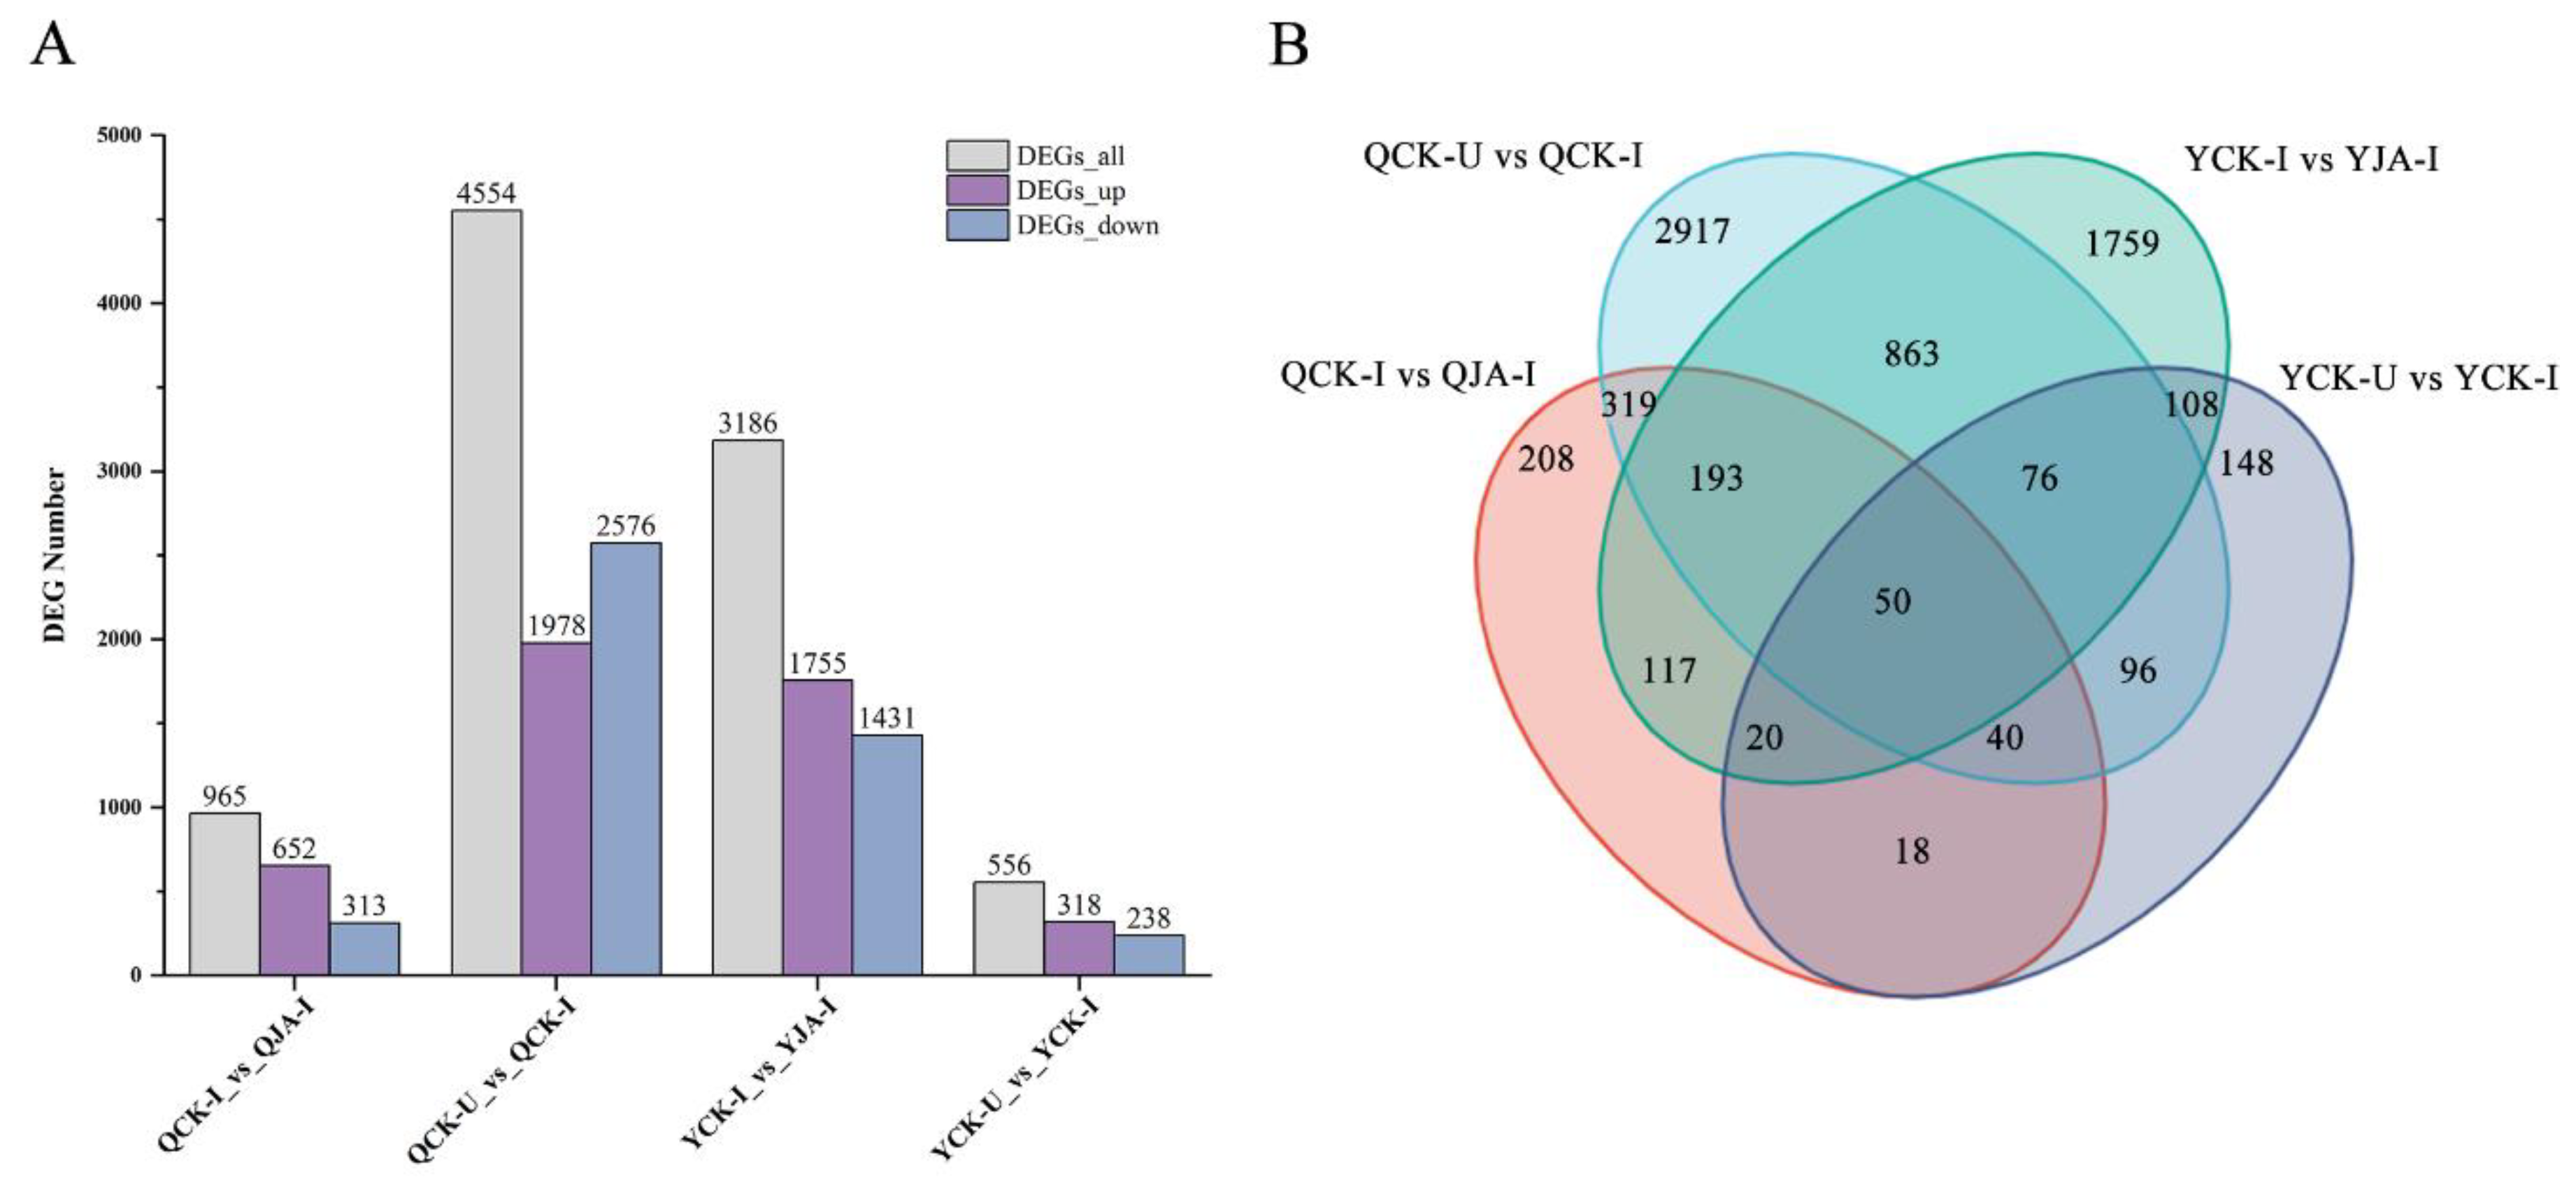
Figure 4.
GO analysis of DEGs between two varieties under different treatments. A: GO analysis of DEGs between QCK-U and QCK-I, and between QCK-I and QJA-I; B: GO analysis of DEGs between YCK-U and YCK-I, and between YCK-I and YJA-I.
Figure 4.
GO analysis of DEGs between two varieties under different treatments. A: GO analysis of DEGs between QCK-U and QCK-I, and between QCK-I and QJA-I; B: GO analysis of DEGs between YCK-U and YCK-I, and between YCK-I and YJA-I.
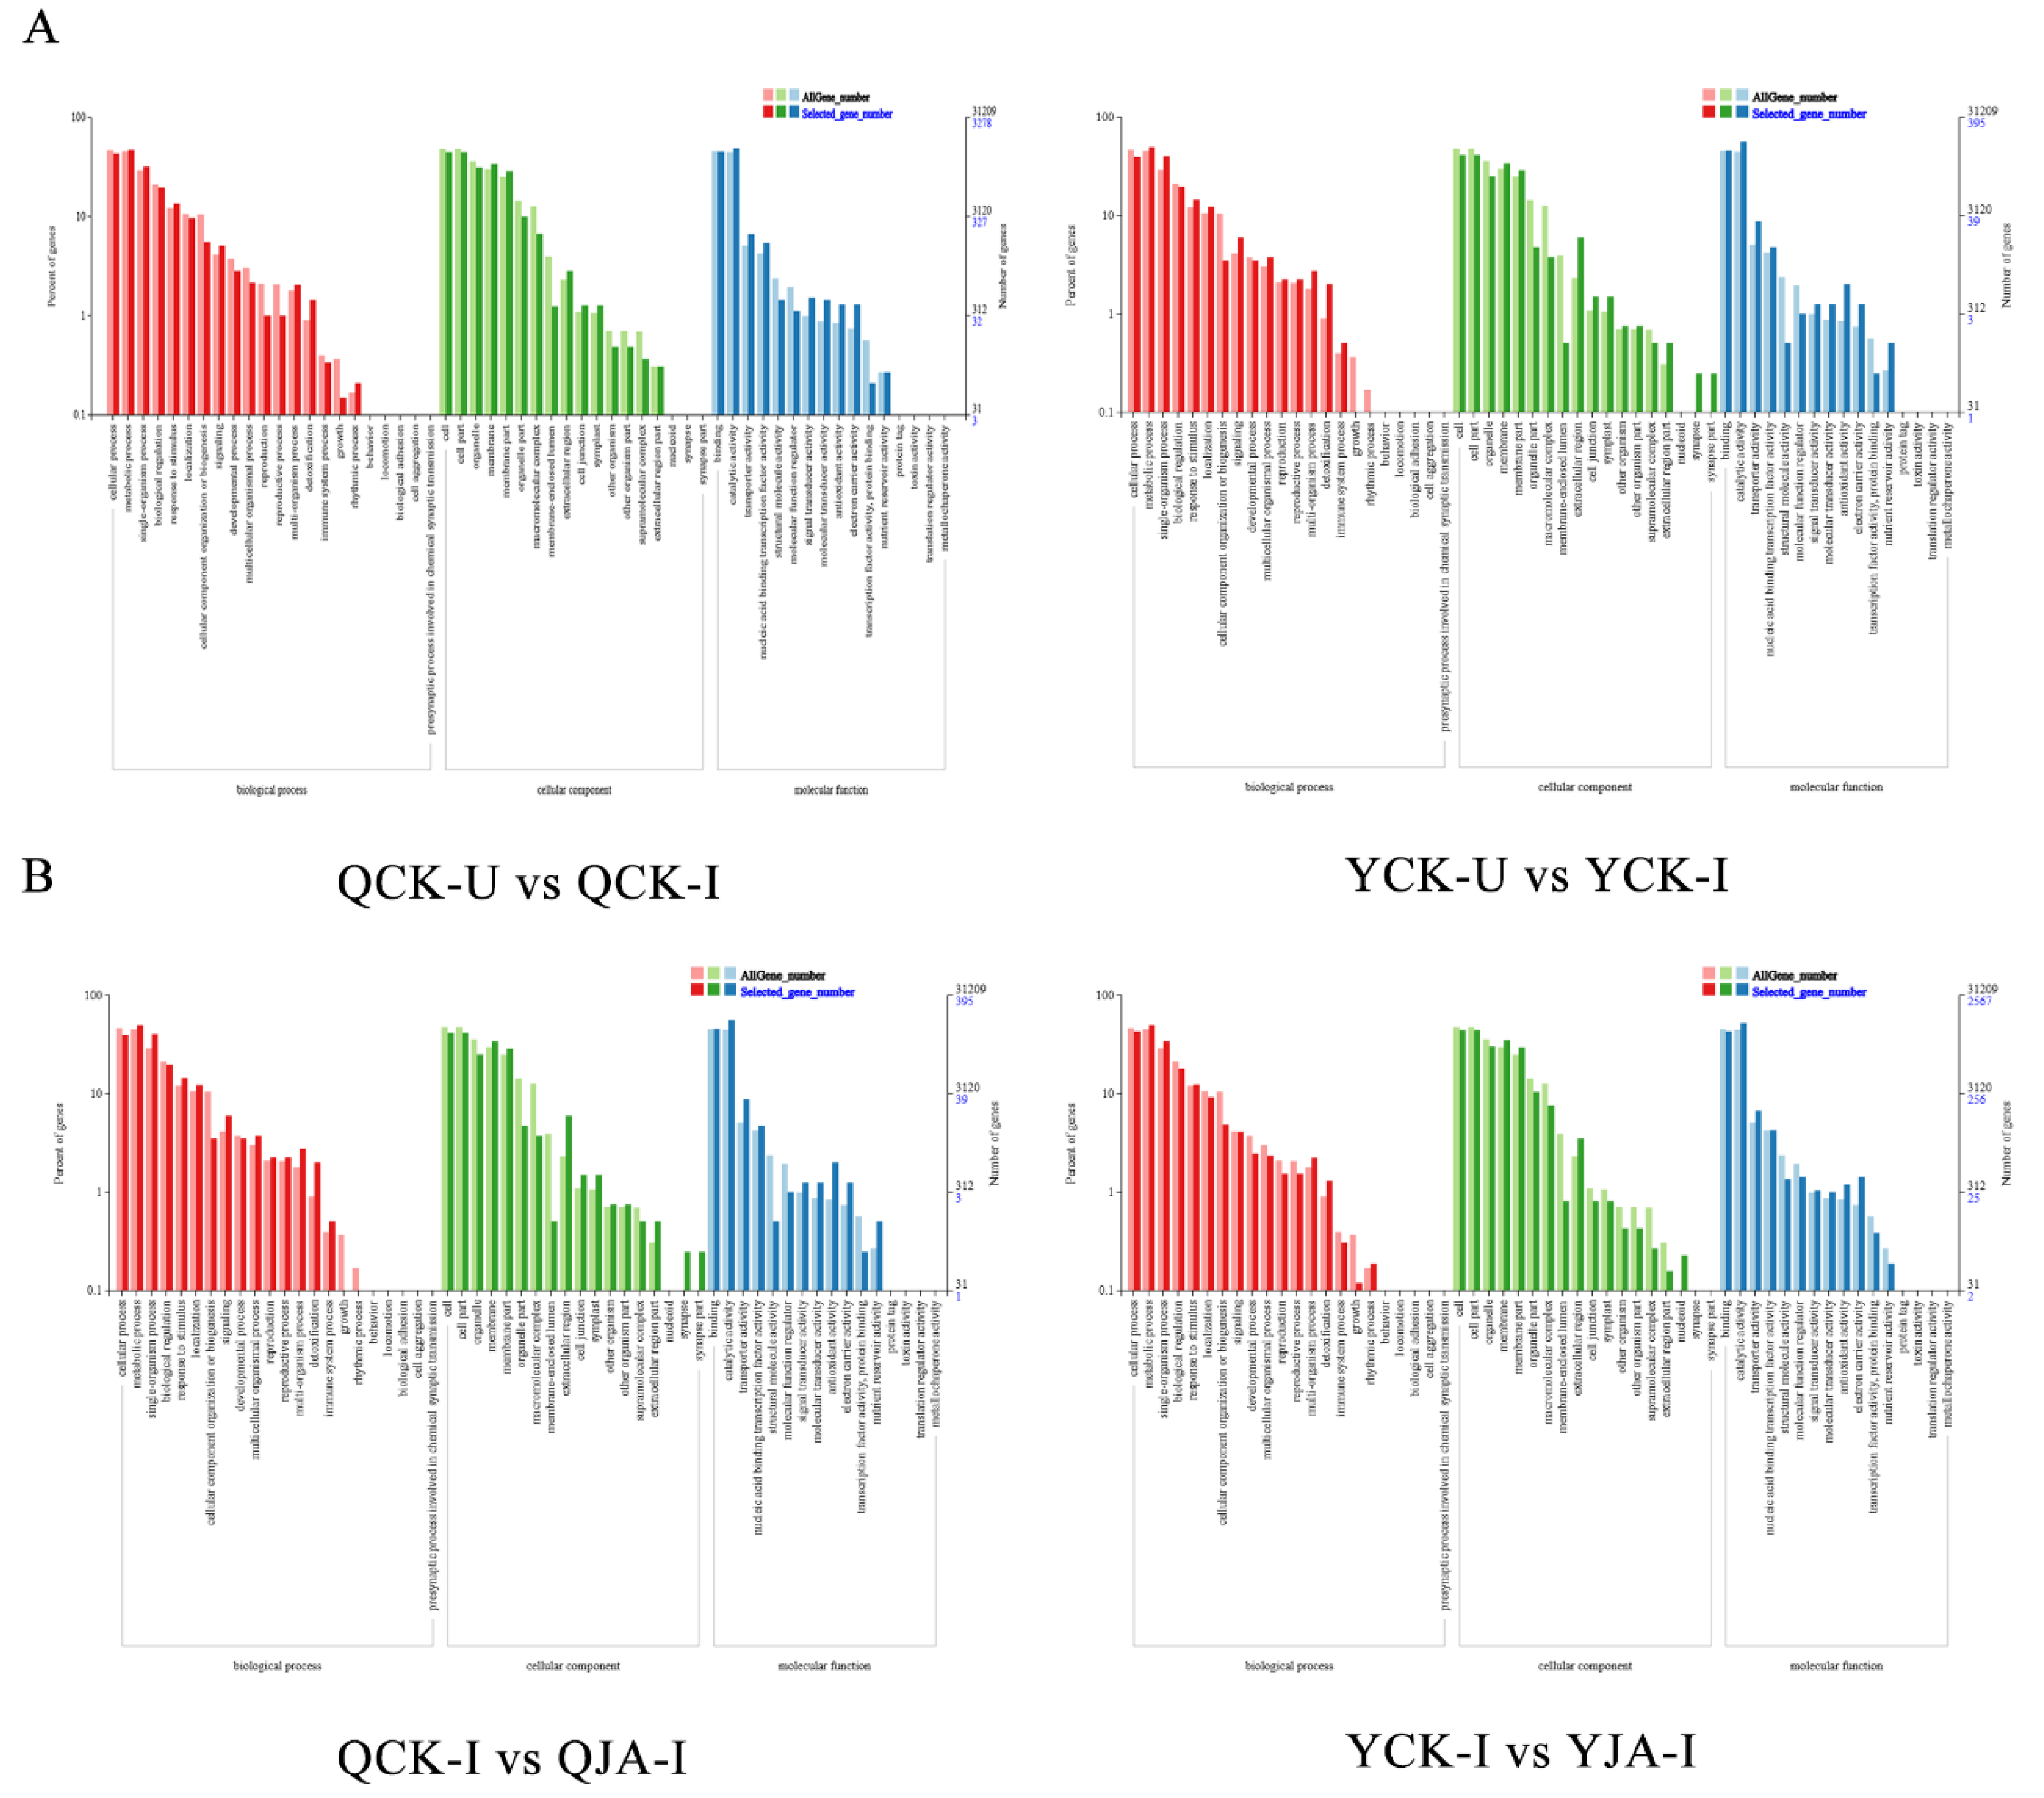
Figure 5.
KEGG pathway analysis of DEGs for two varieties under different treatments. A: KEGG pathways of DEGs for QCK-U vs QCK-I and QCK-I vs QJA-I; B: KEGG pathways of DEGs for YCK-U vs YCK-I and YCK-I vs YJA-I.
Figure 5.
KEGG pathway analysis of DEGs for two varieties under different treatments. A: KEGG pathways of DEGs for QCK-U vs QCK-I and QCK-I vs QJA-I; B: KEGG pathways of DEGs for YCK-U vs YCK-I and YCK-I vs YJA-I.
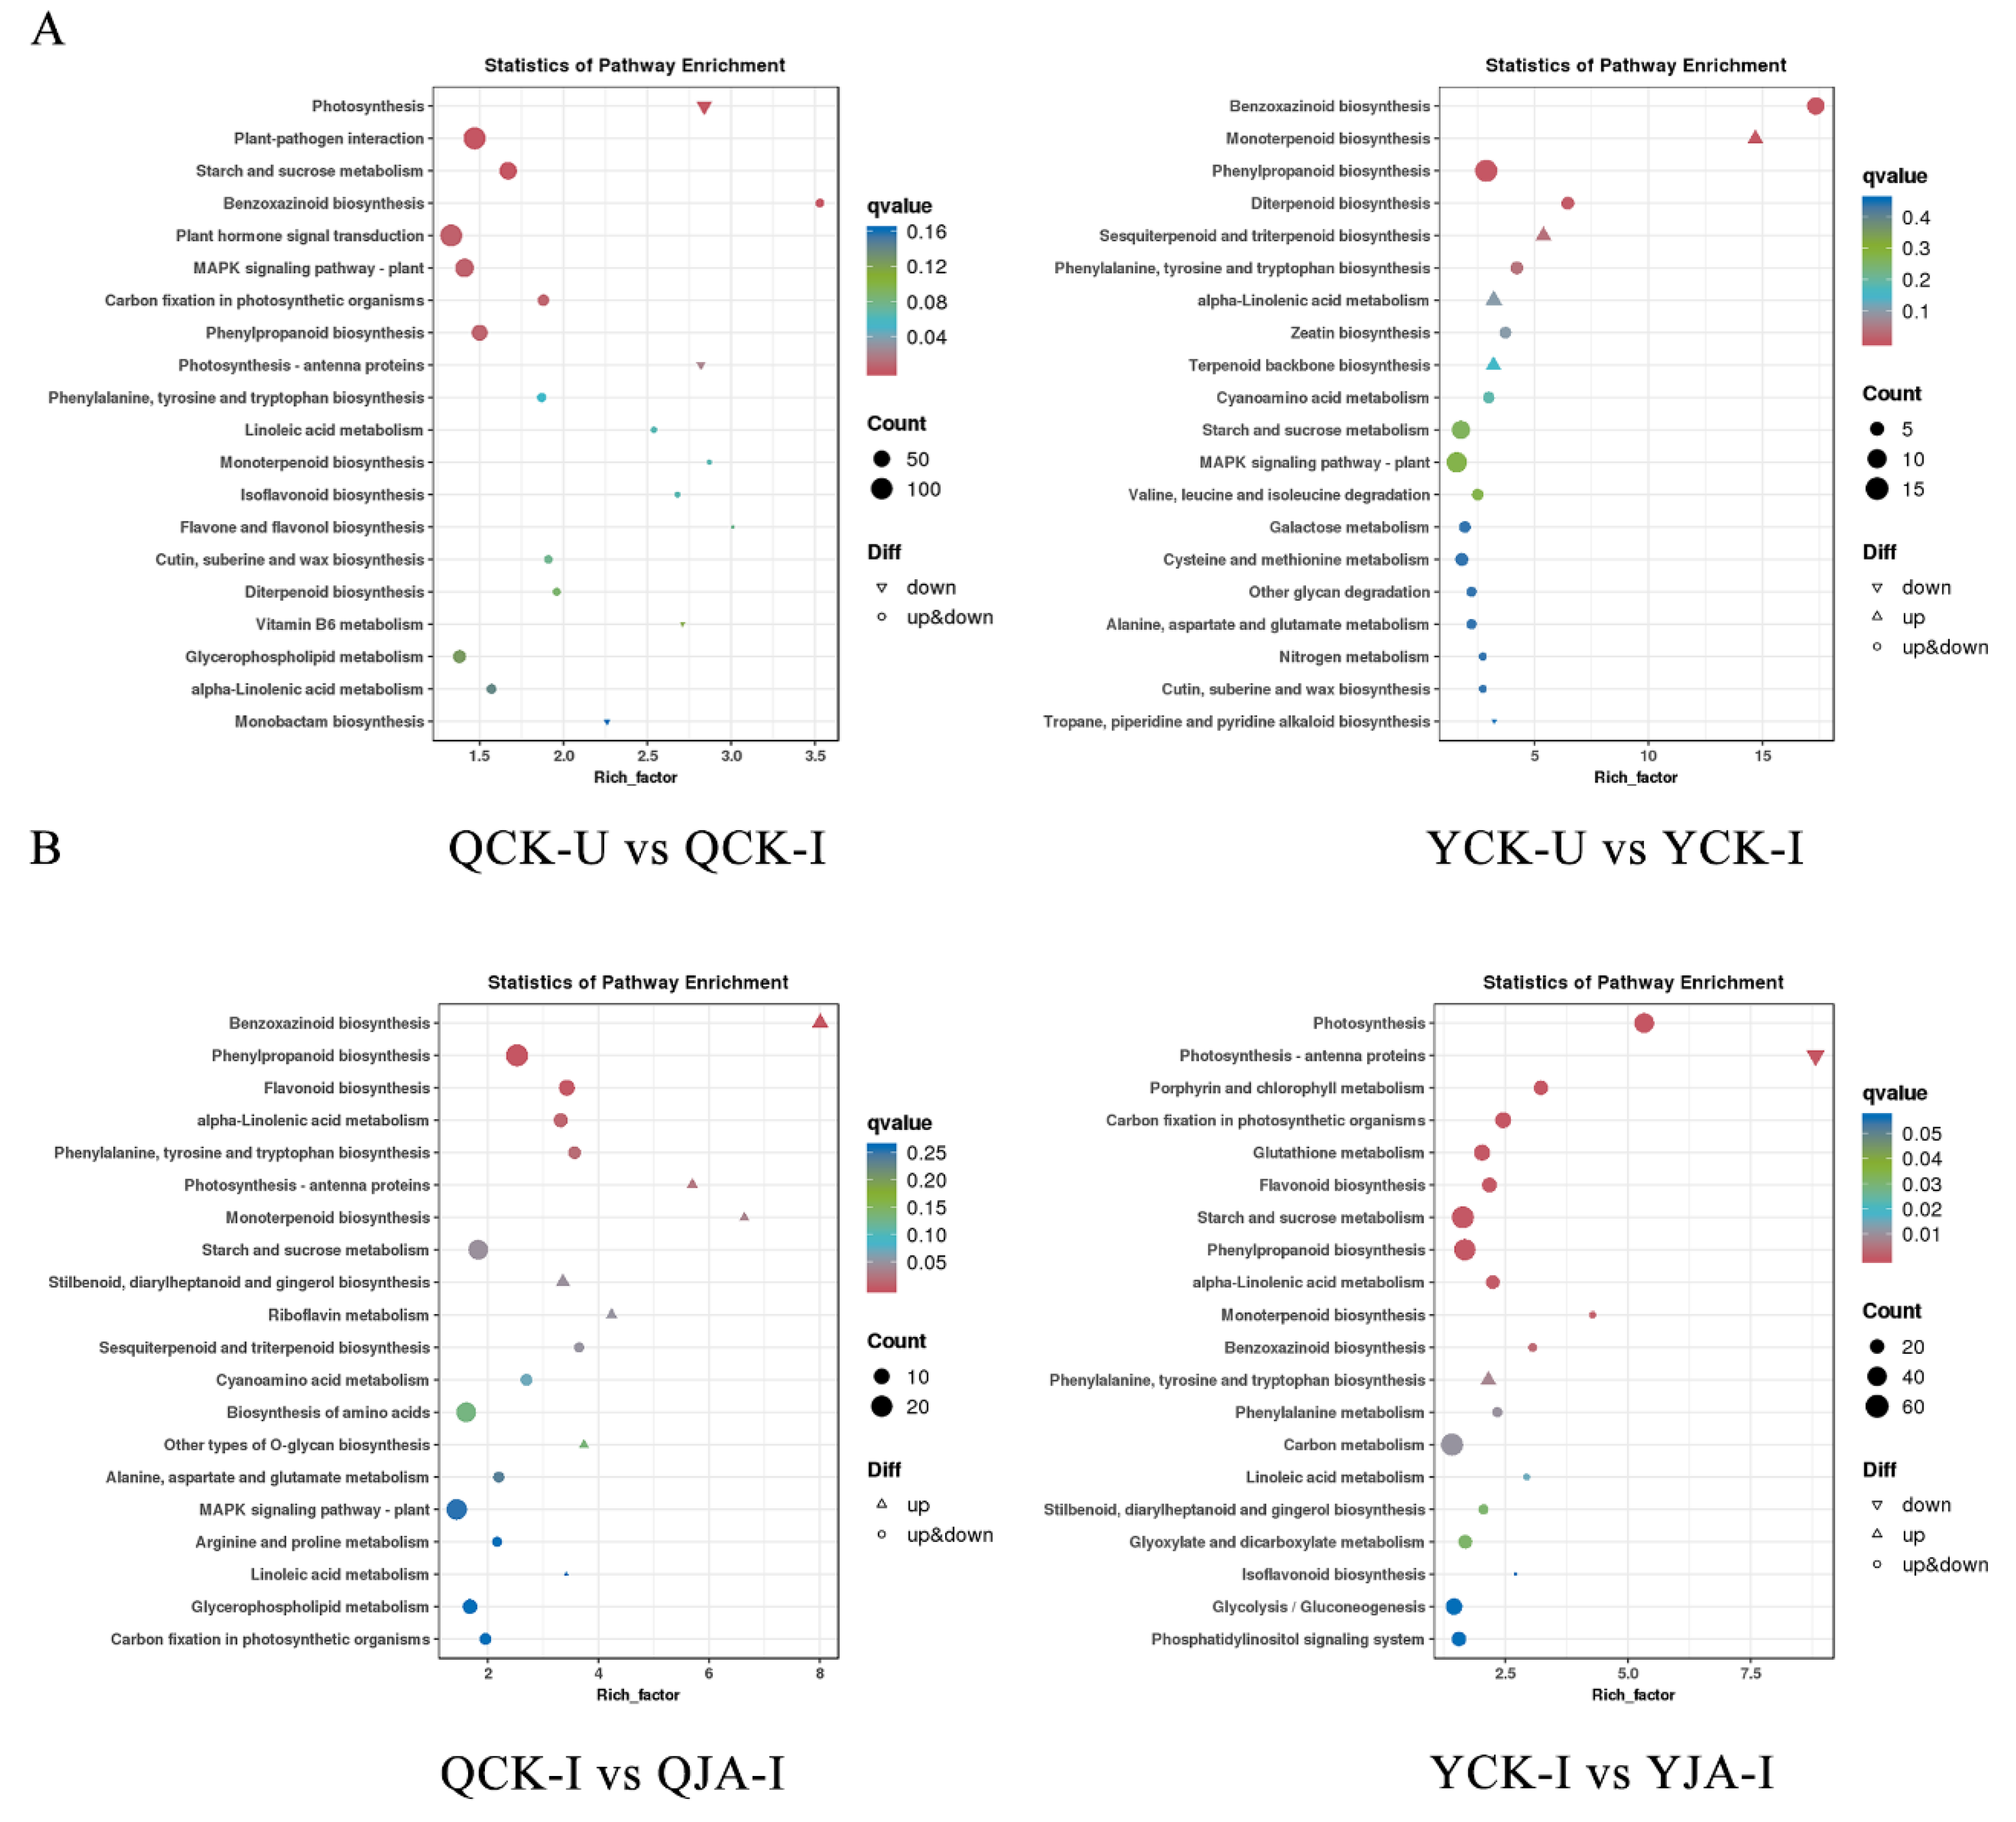
Figure 6.
The expression patterns of 6 selected genes identified by RNA-seq was verified by qRT-PCR. A: Heat map showing the expression changes (logy-fold change) in response to the QCK-U, QCK-I, QJA-I, YCK-U, YCK-I, and YJA-I treatments for each candidate gene as measured by RNA-seq and qRT-PCR; B: Scatter plot showing the changes in the expression (logy-fold change) of selected genes based on RNA-seq via qRT-PCR. Gene expression levels are indicated by colored bars.
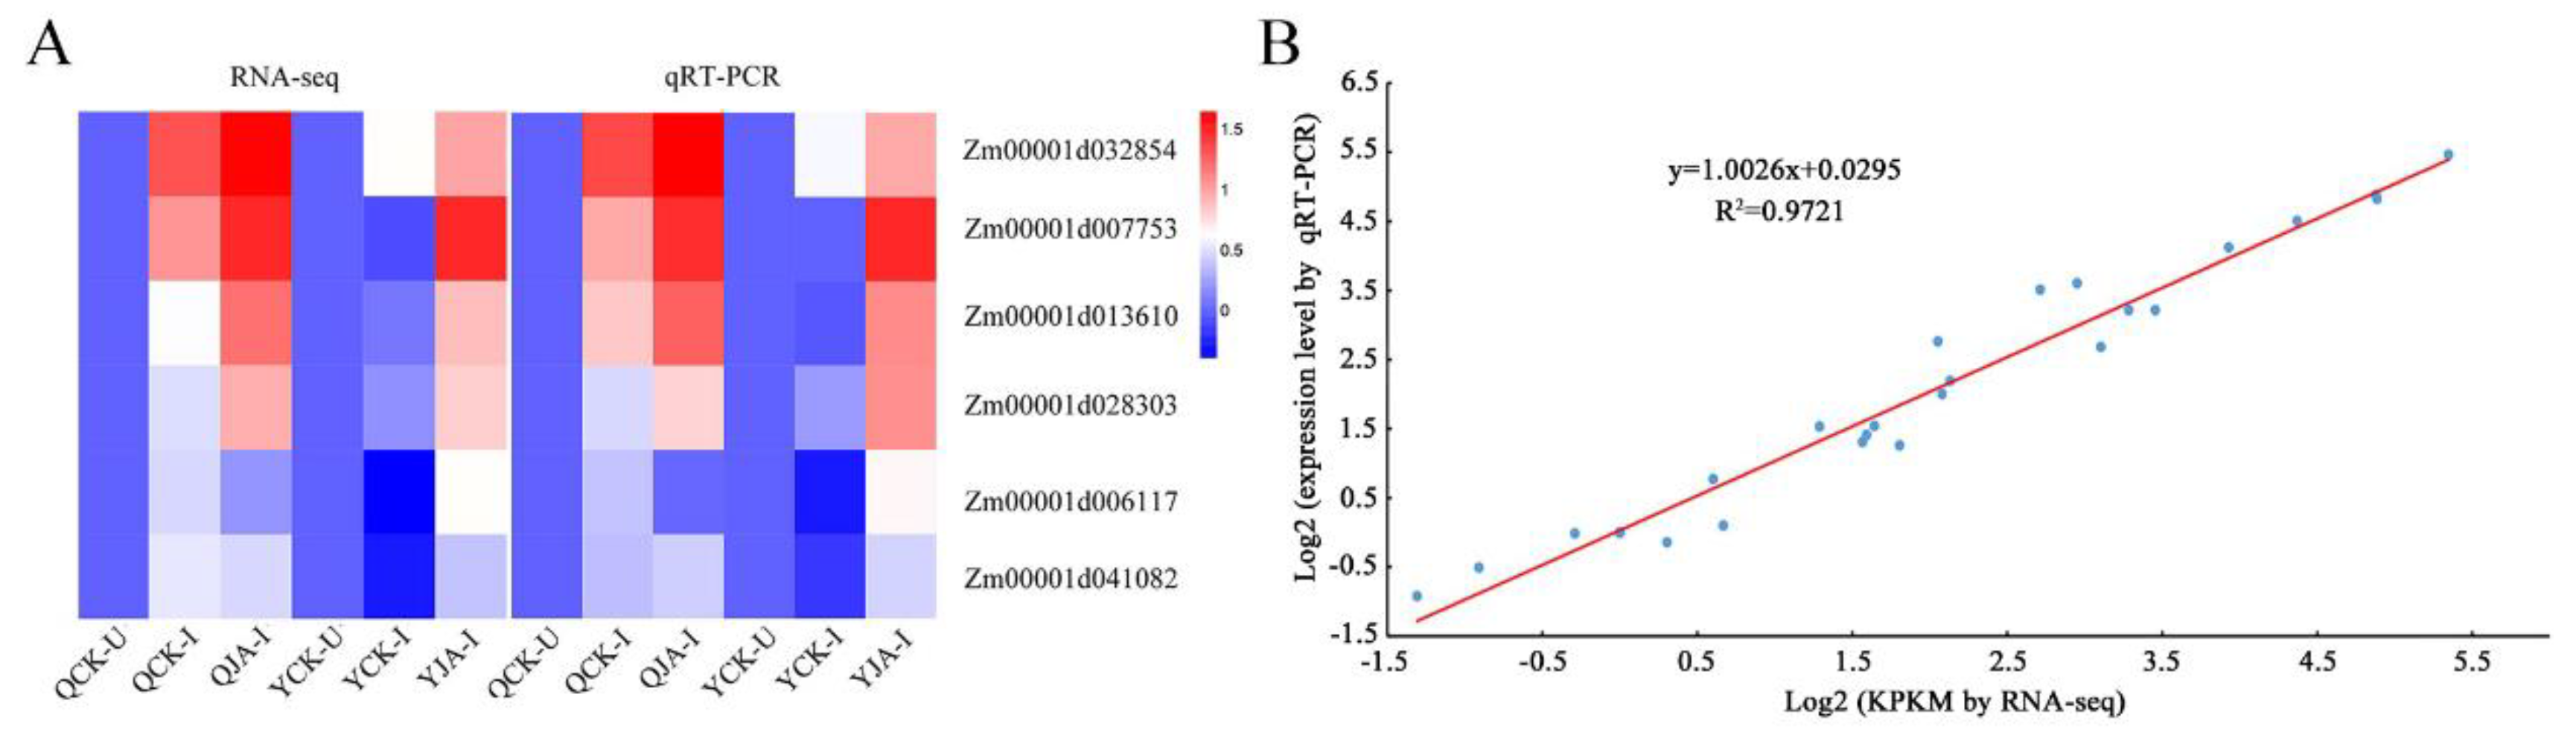
Figure 7.
Module construction based on WGCNA. A: Gene module clustering analysis; B: Module gene clustering heatmap; C: Gene dendrogram and correlation heatmap between samples; D: Correlation heatmap between modules and samples.
Figure 7.
Module construction based on WGCNA. A: Gene module clustering analysis; B: Module gene clustering heatmap; C: Gene dendrogram and correlation heatmap between samples; D: Correlation heatmap between modules and samples.
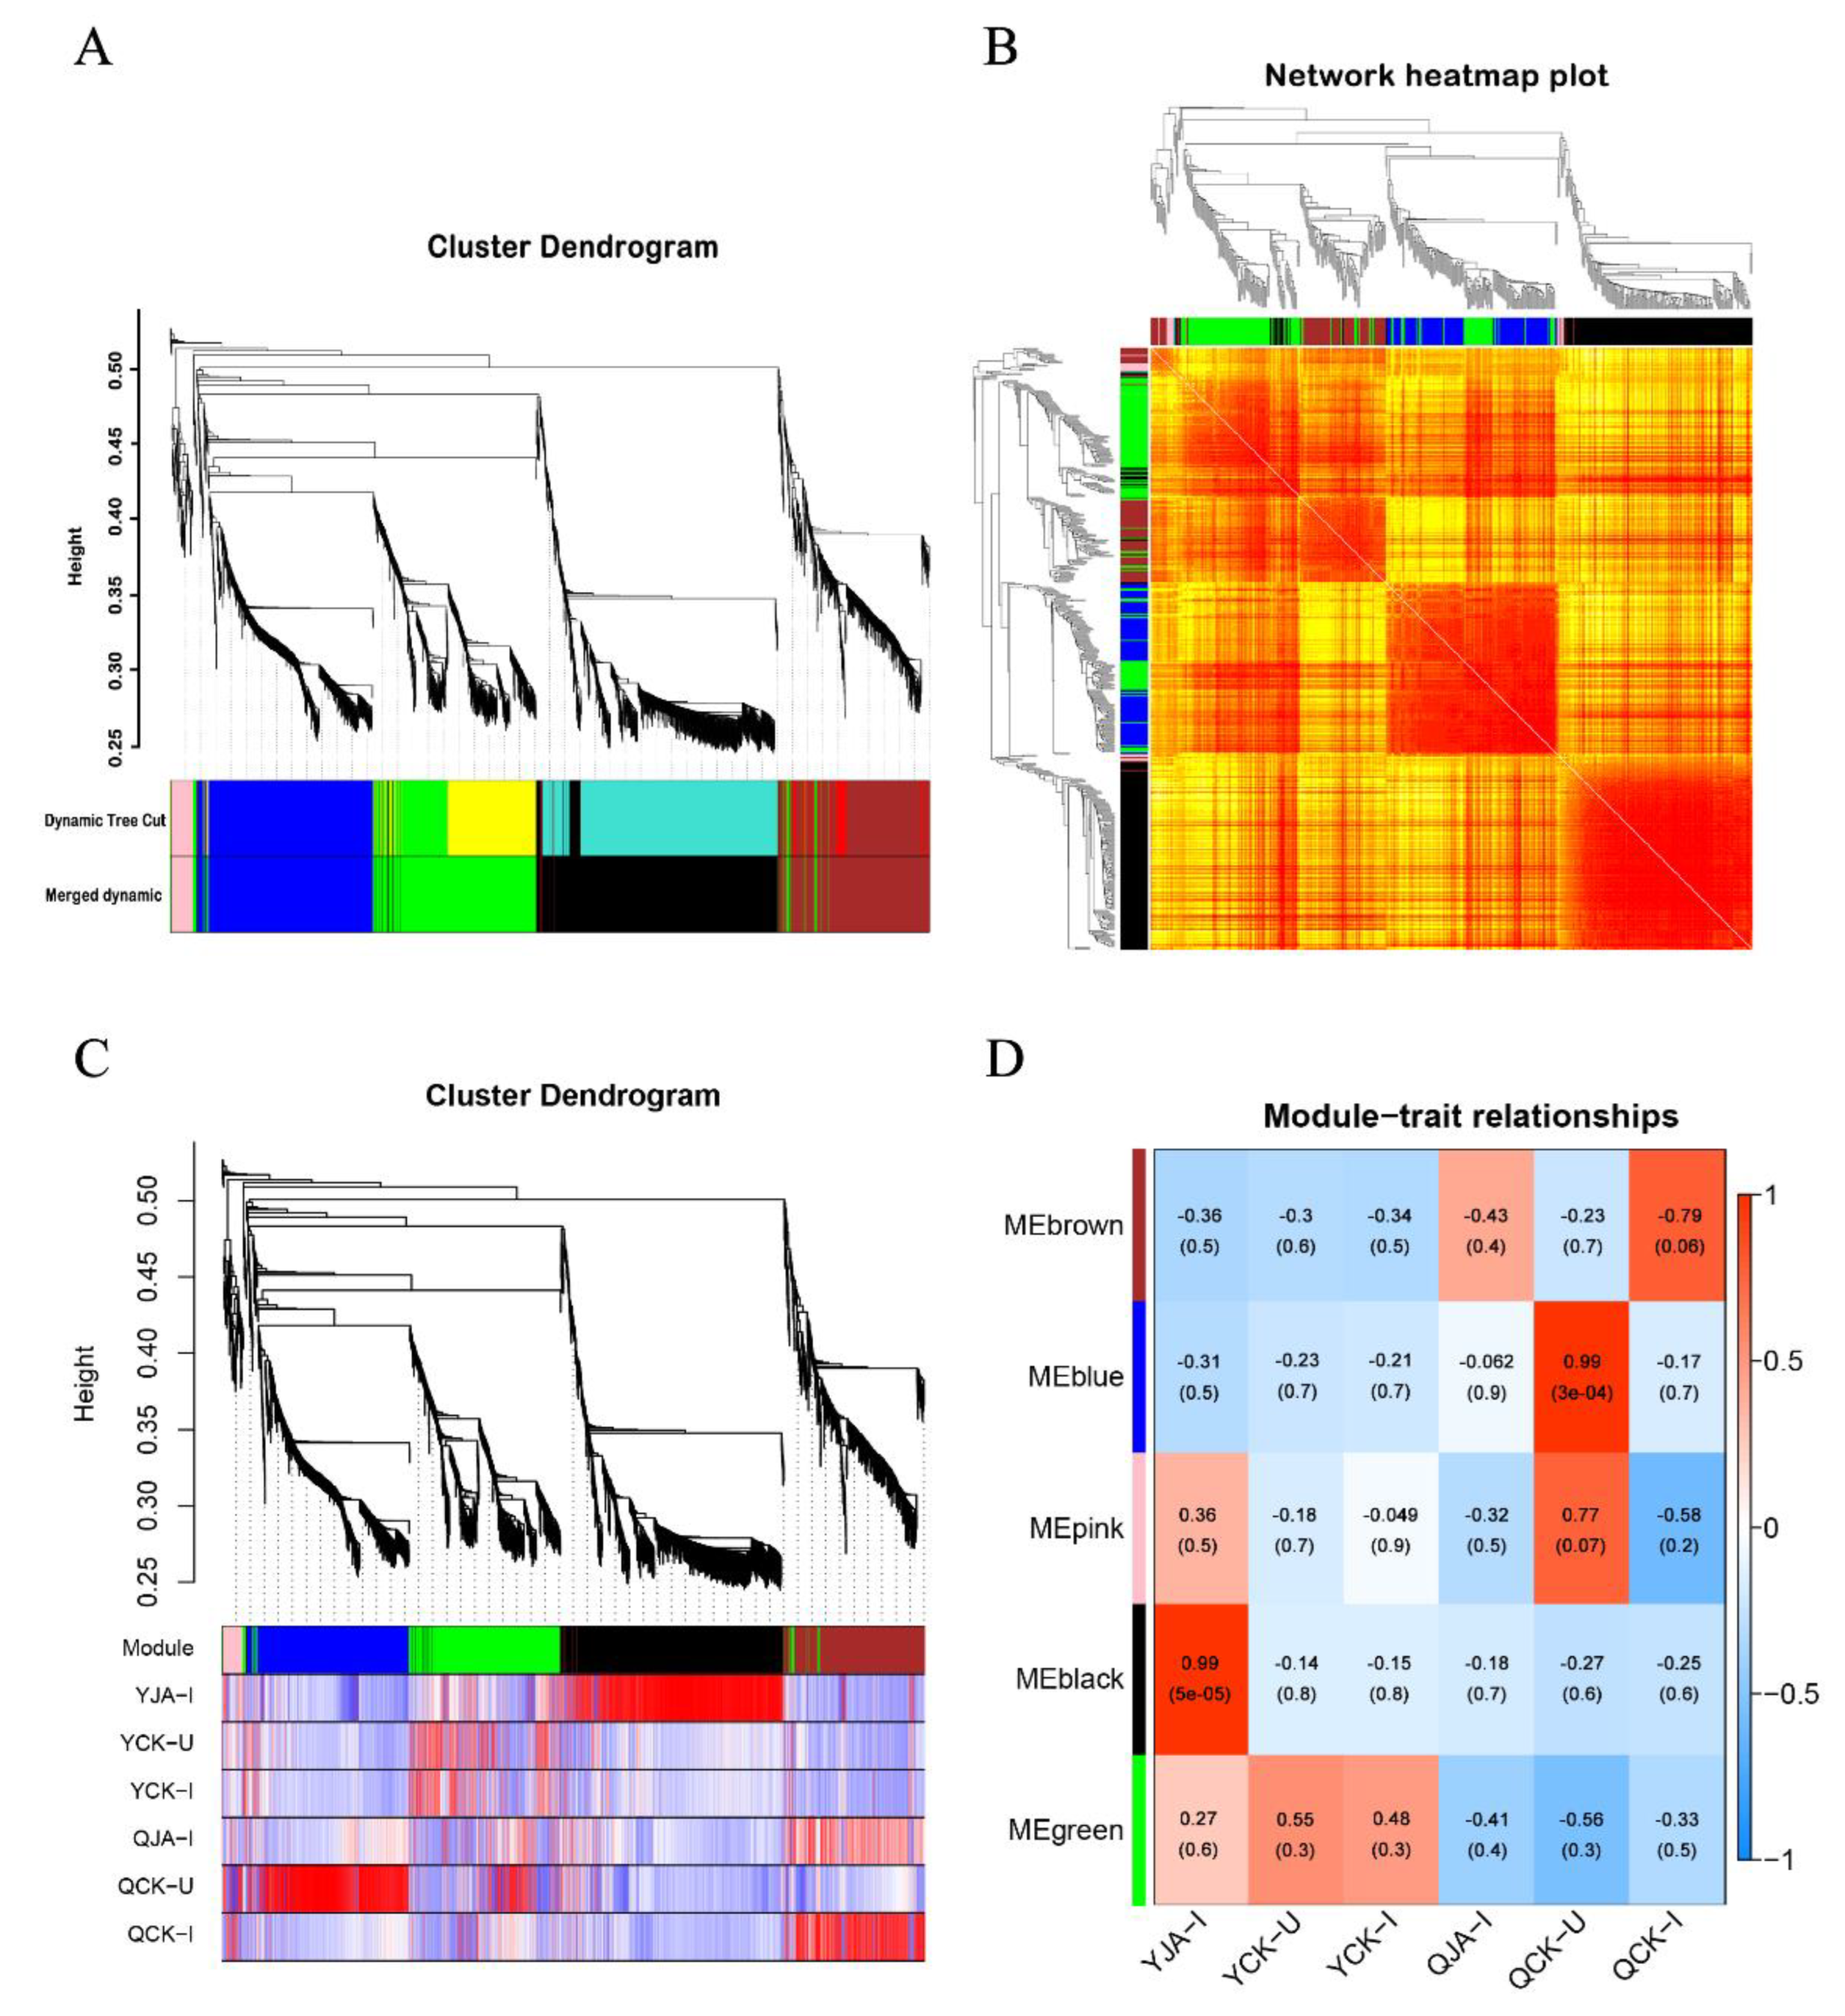
Figure 8.
KEGG enrichment analysis of target modules. (A): Brown module KEGG; (B): Blue module KEGG; (C): Pink module KEGG; (D): Black module KEGG.
Figure 8.
KEGG enrichment analysis of target modules. (A): Brown module KEGG; (B): Blue module KEGG; (C): Pink module KEGG; (D): Black module KEGG.
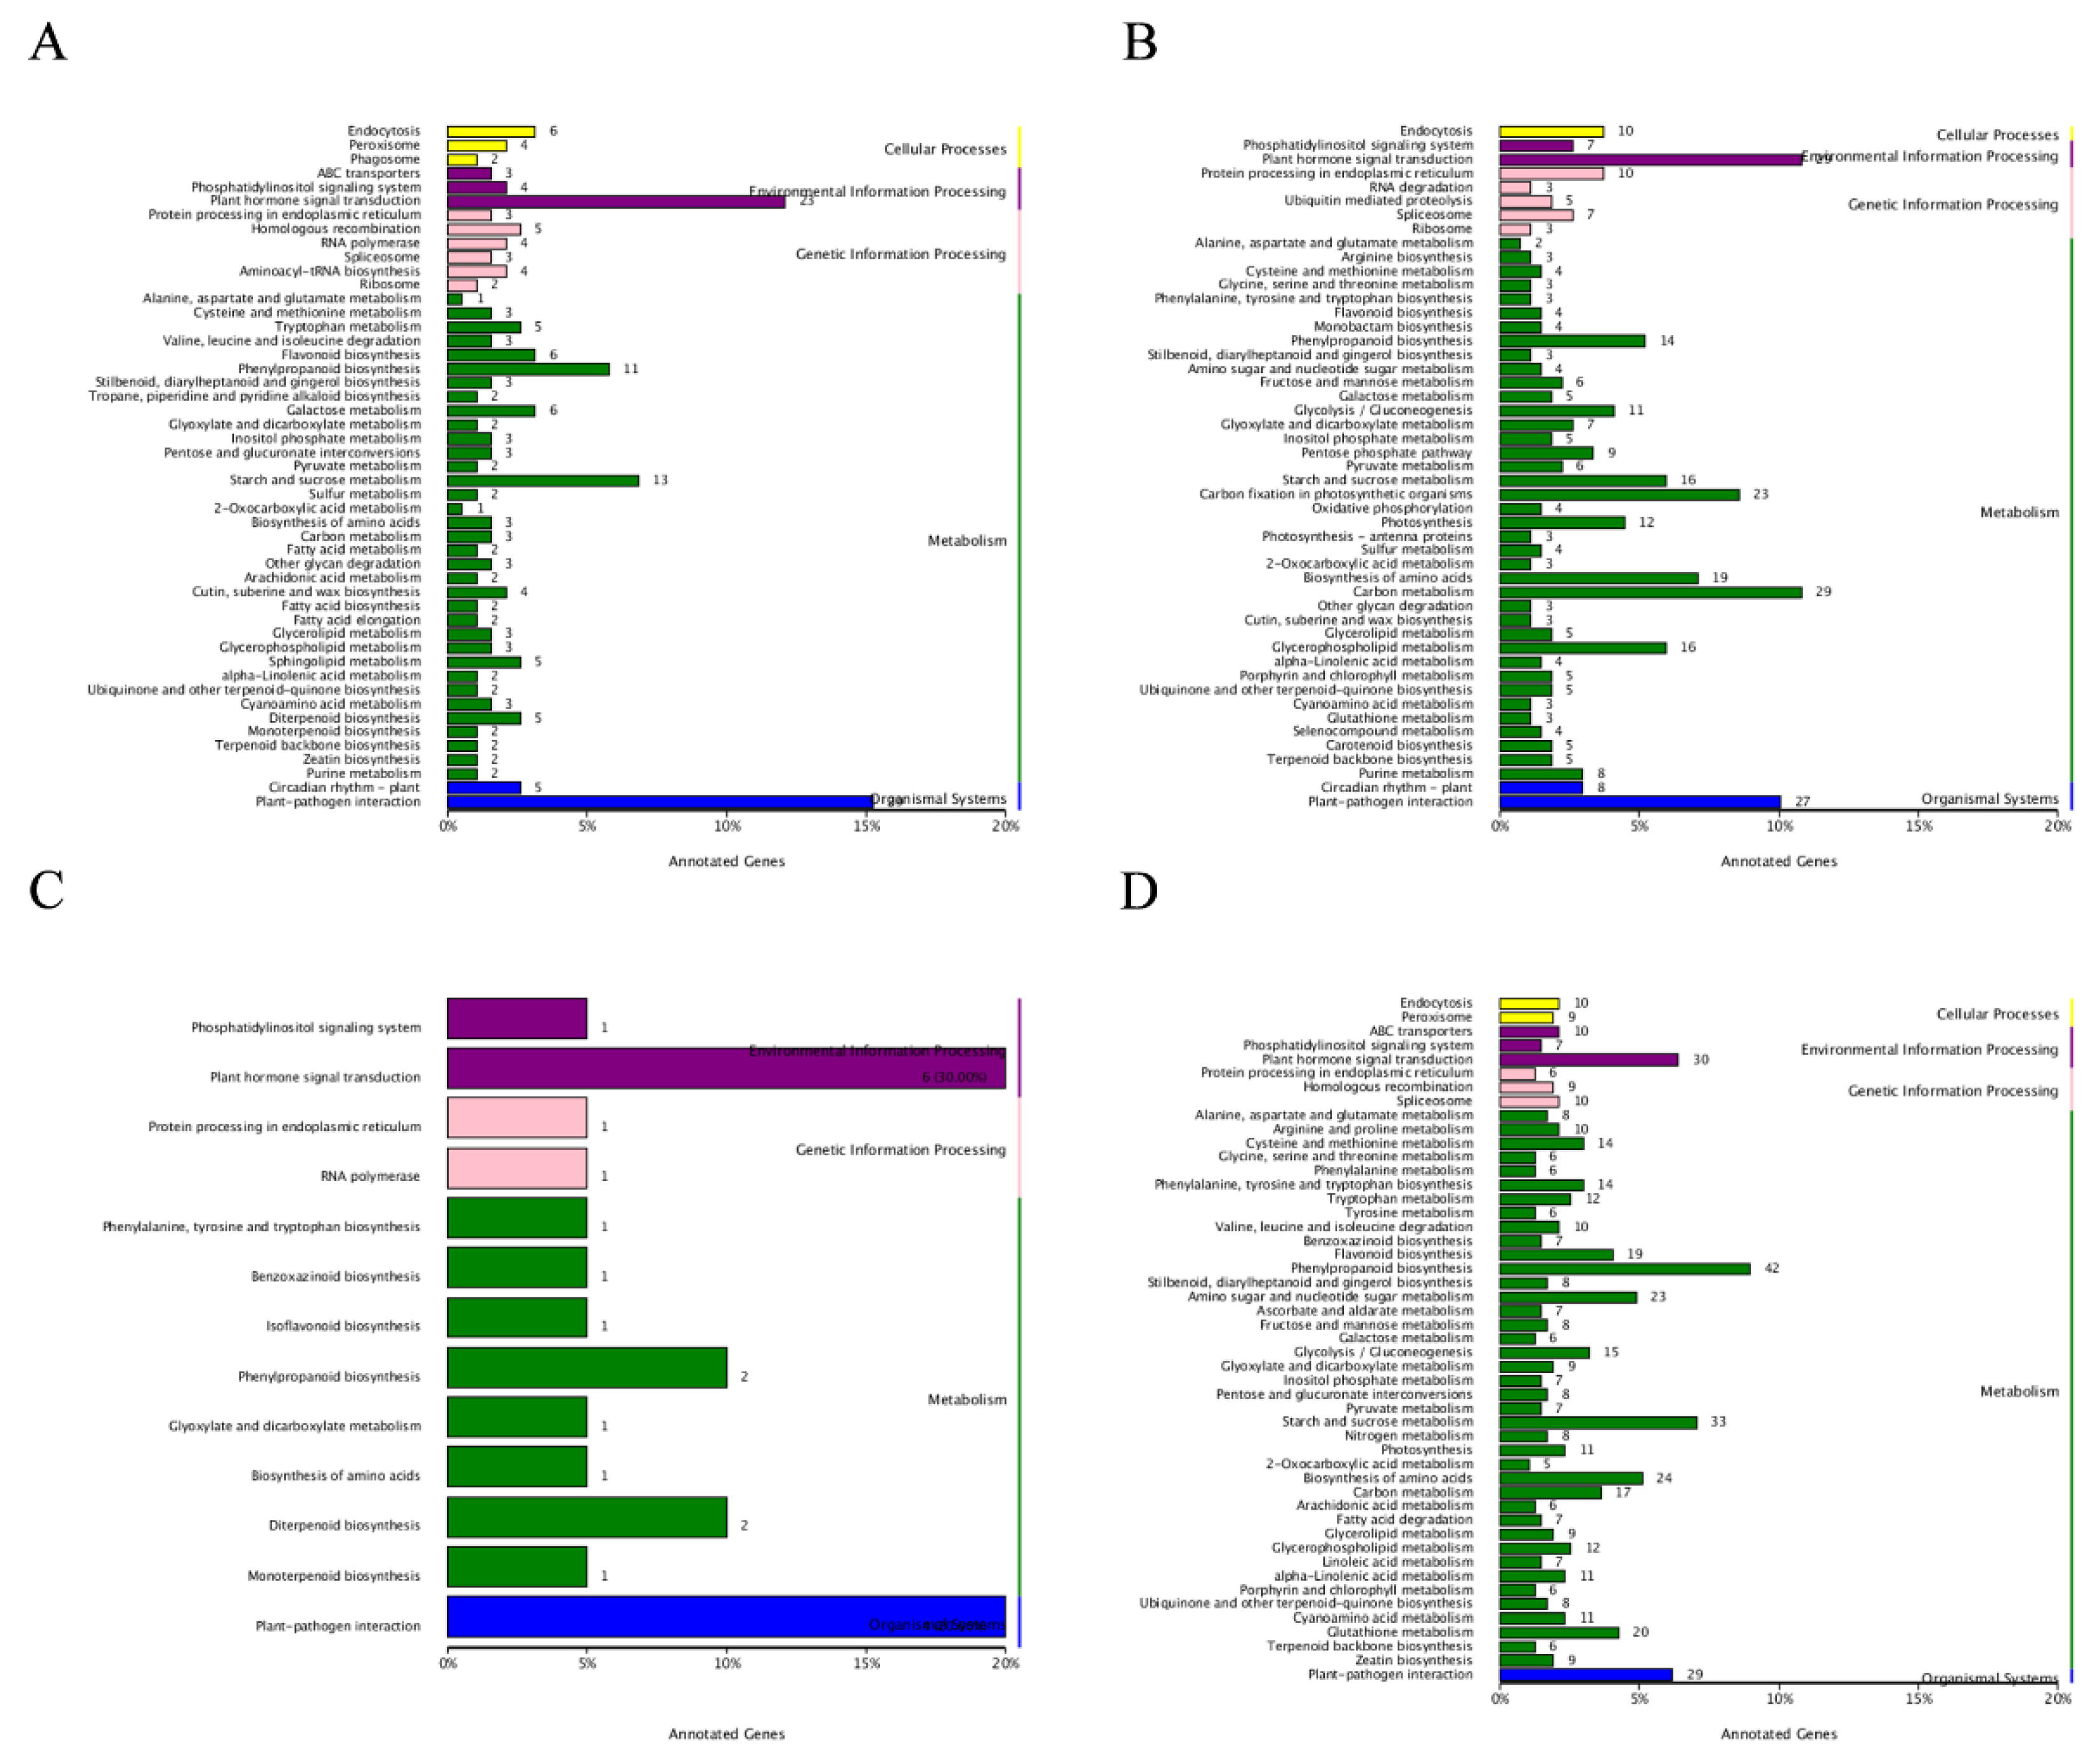
Figure 9.
Co-expression network of target modules. A: Brown module; B: Blue module; C: Pink module; D: Black module. The inner circle represents the core genes within the module, while the outer circle represents the associated genes of the core genes. The correlation between genes is connected by edges (lines).
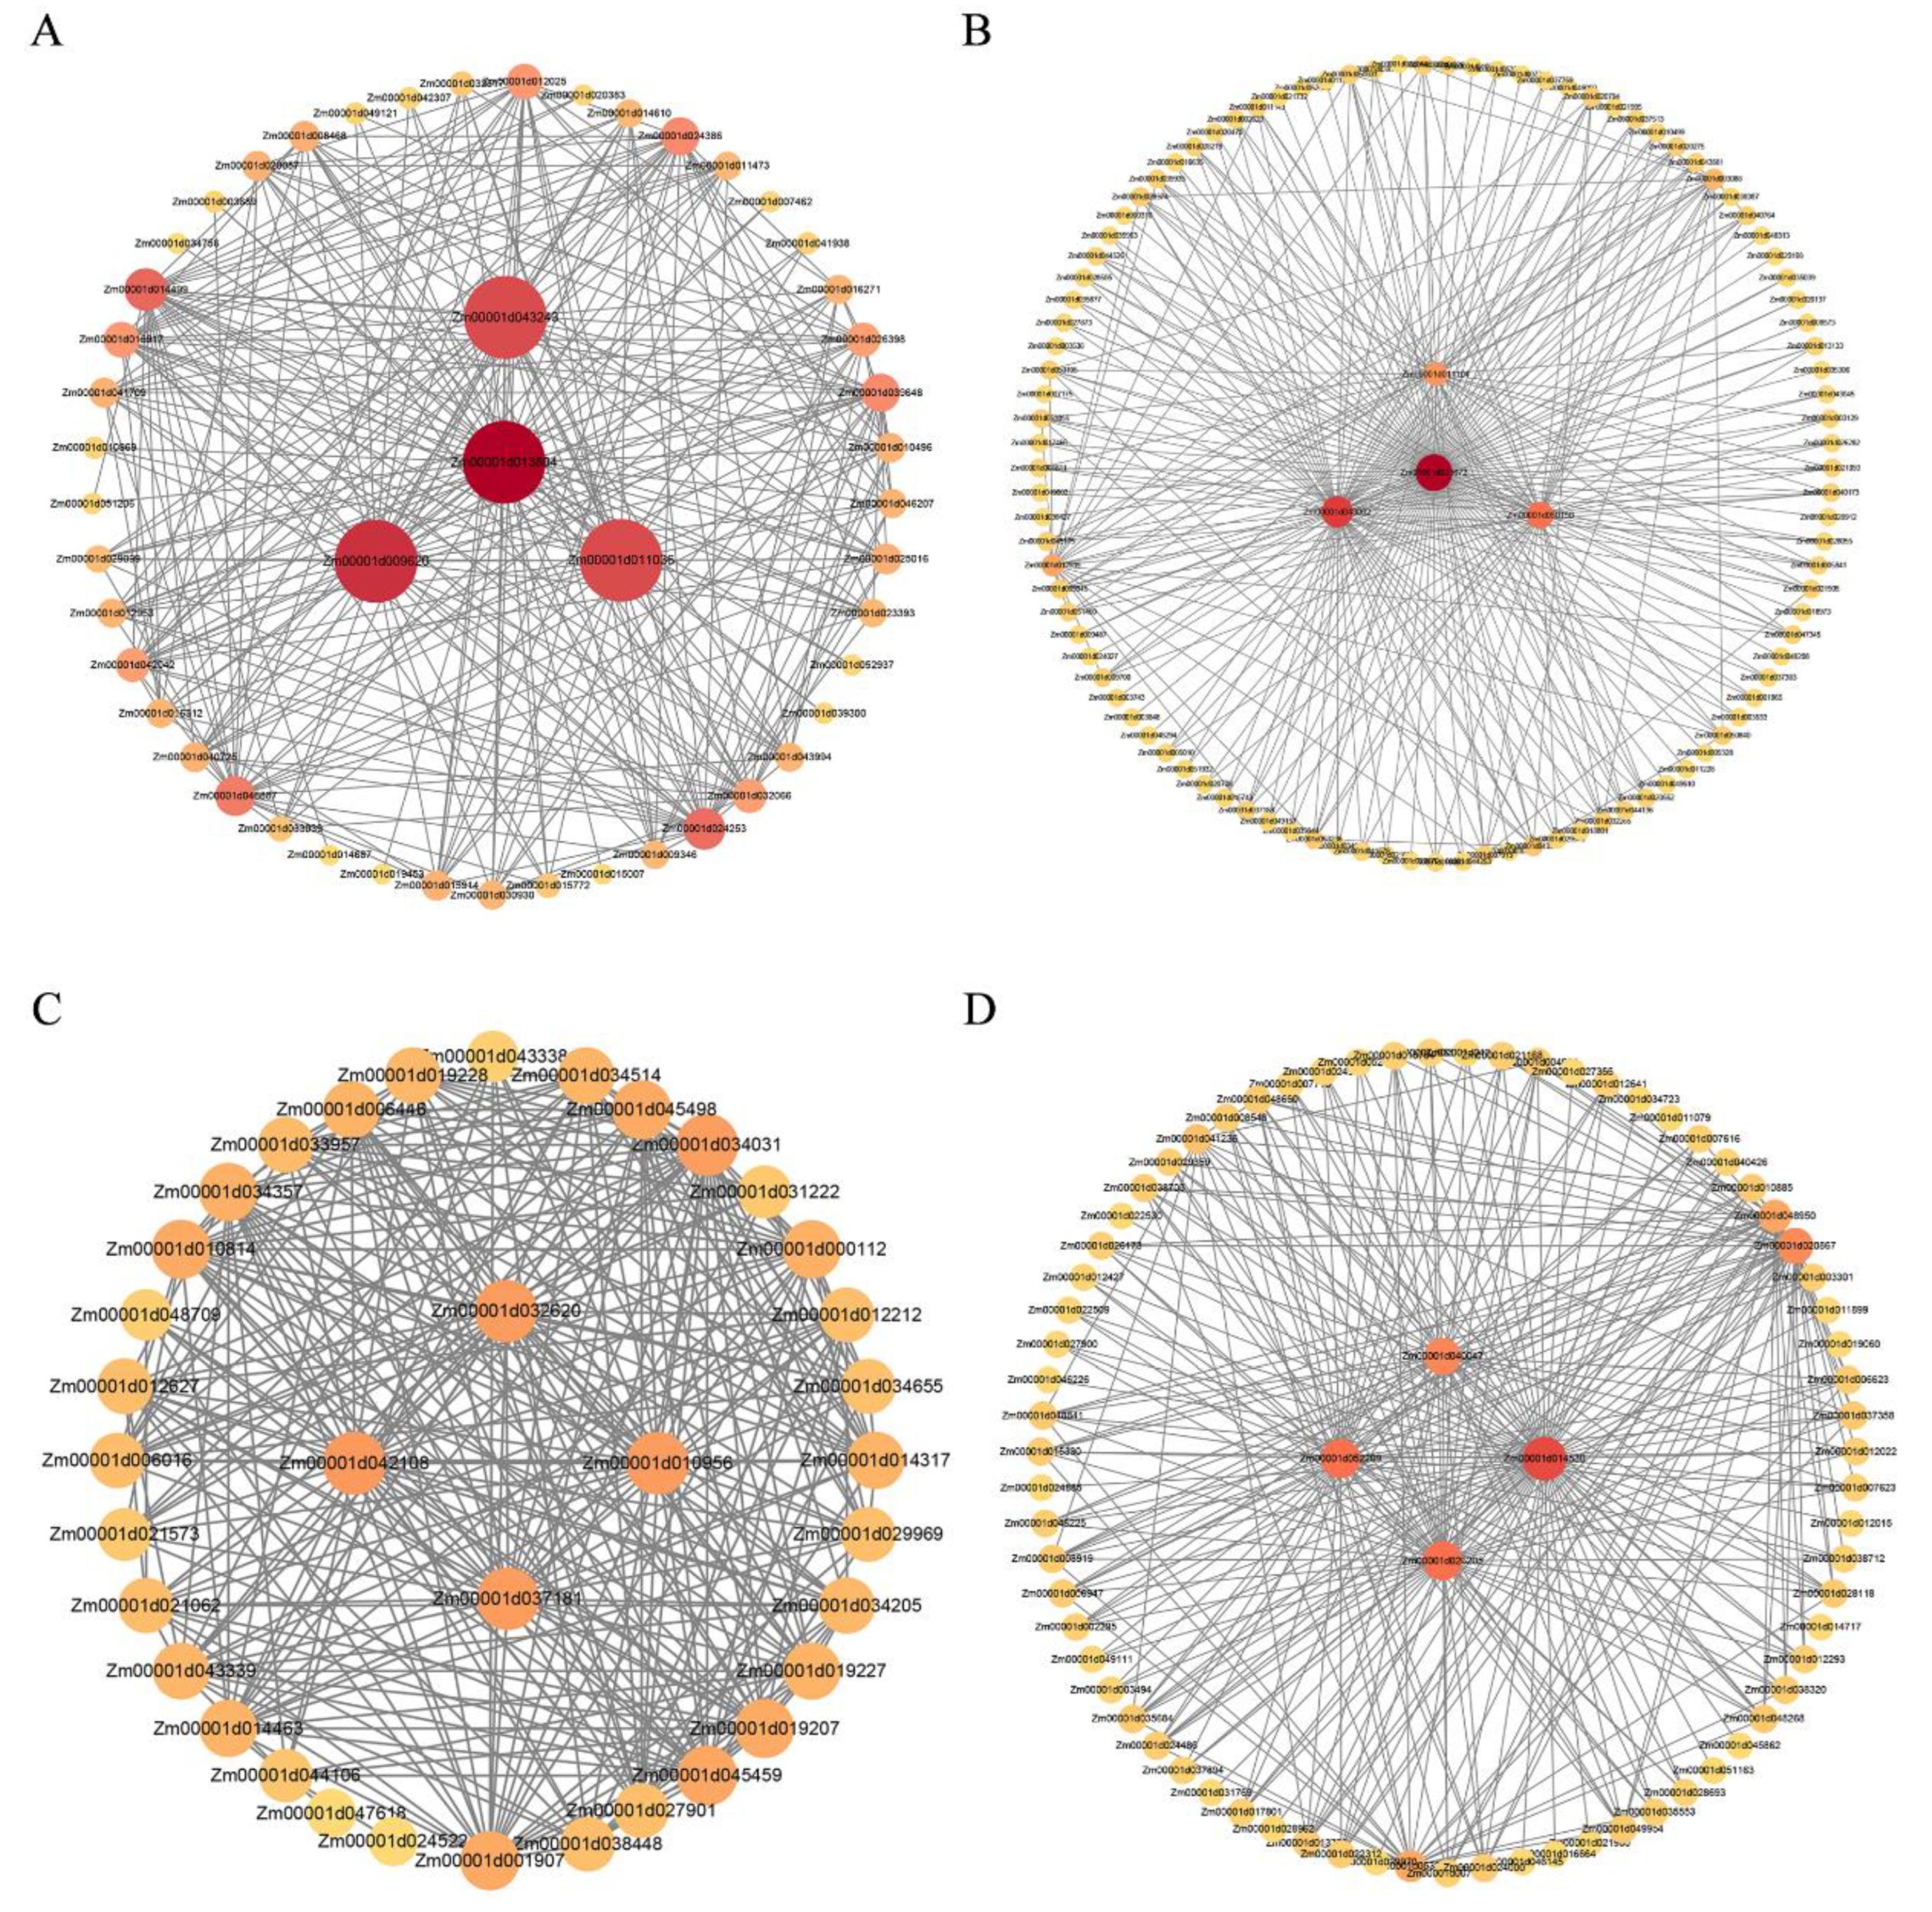
Figure 10.
Schematic diagram of the mechanism of JA regulating maize resistance to U. maydis.
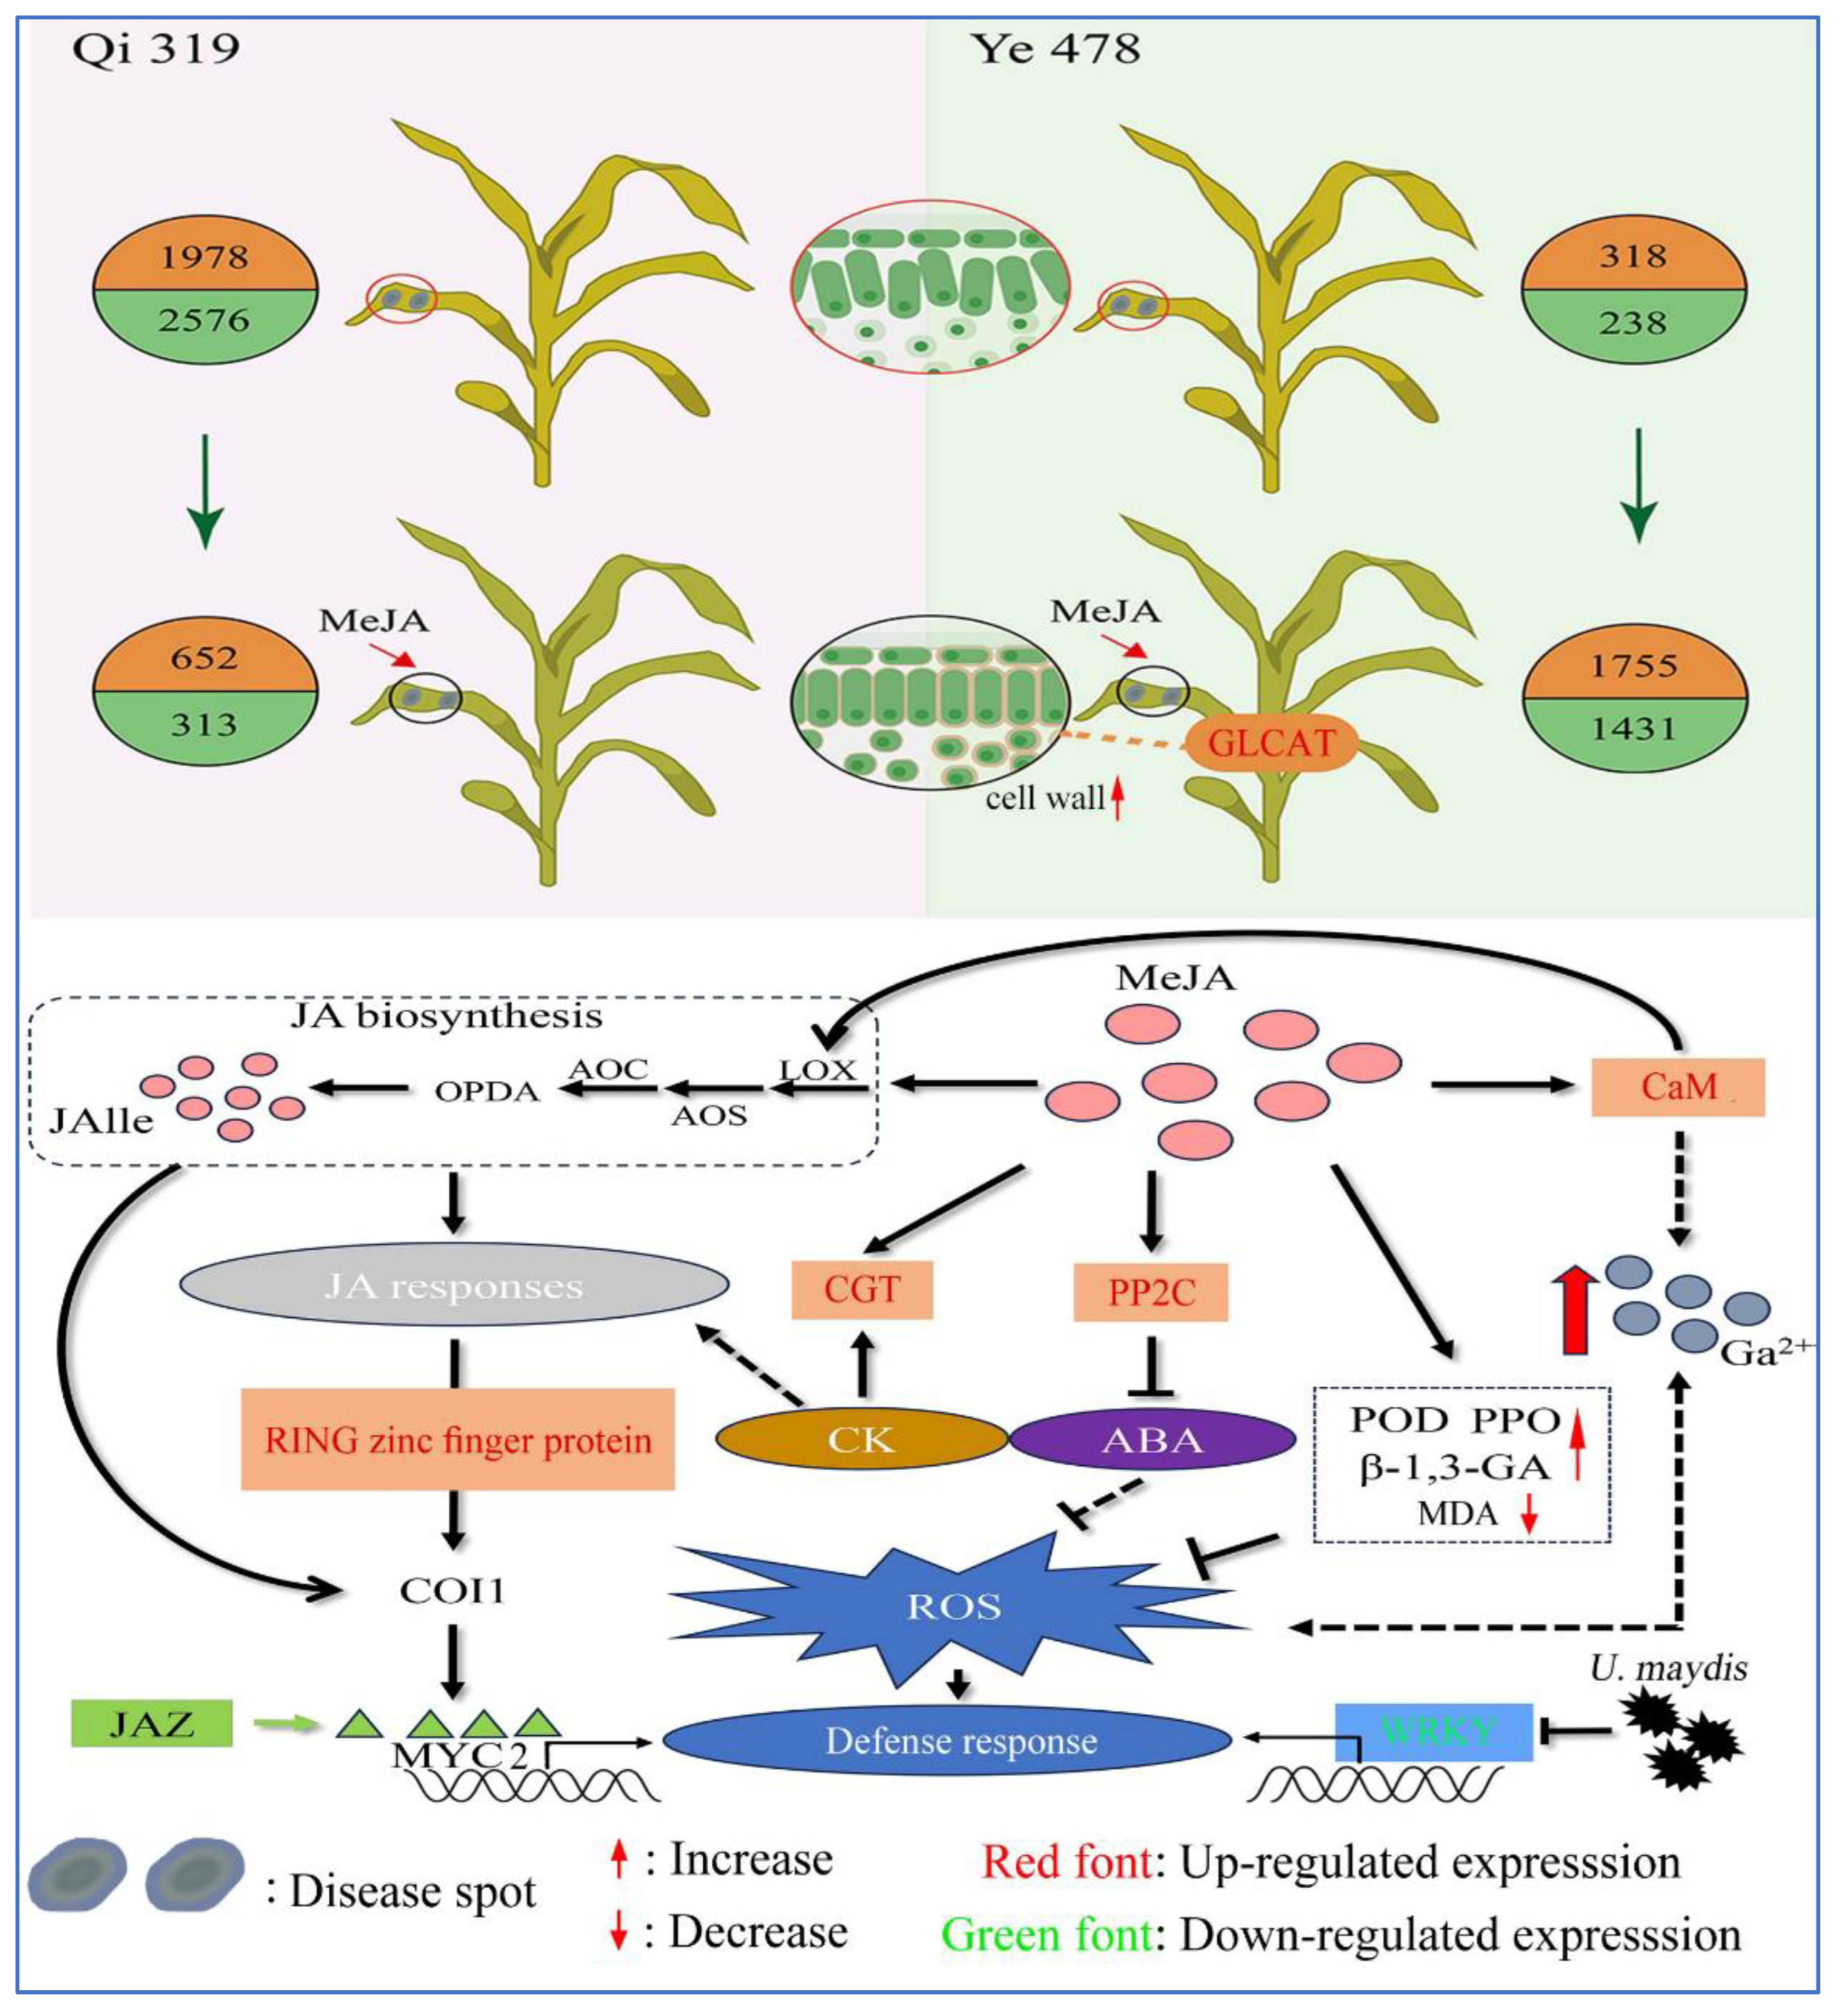

Table 1.
Candidate genes and their functional annotations
| Gene ID | Gene Name | Gene Annotation |
| Zm00001d009620 | PP2C | Protein phosphatase 2C |
| Zm00001d043062 | WRKY | transcription factor |
| Zm00001d052209 | CGT | Cytokinin-O-glucosyltransferase |
| Zm00001d040047 | GLCAT | β-glucuronosyltransferase |
| Zm00001d051460 | RING zinc finger protein | RING zinc finger protein |
| Zm00001d047618 | CaM | calmodulin |
Table 2.
qRT-PCR primer sequence.
| Gene | Forward primer (5'-3') | Reverse primer (5'-3') |
| Actin | TGAAACCTTCGAATGCCCAG | GATTGGAACCGTGTGGCTCA |
| Zm00001d032854 | CTATGGAGTCCTCTTTAGCG | ACTTCTGAATGATGGAGTCG |
| Zm00001d007753 | GGATTCACCACTTTCCTCAA | AATACACGGCAGTACAAGTT |
| Zm00001d013610 | GAGCTACGAGATCACCTTCT | TATACGTACGCAAACACGAG |
| Zm00001d028303 | ACCGTGTATAGCTAGTGGTA | CTCCGGCCGTAGCCA |
| Zm00001d006117 | TGTGCAAAGACACCTTATGA | TATTTCCACAGTTCCACCAG |
| Zm00001d047618 | GTGCGGAGTACTGTATTCTT | GCCATCATGCGAACTTTTTA |
Disclaimer/Publisher’s Note: The statements, opinions and data contained in all publications are solely those of the individual author(s) and contributor(s) and not of MDPI and/or the editor(s). MDPI and/or the editor(s) disclaim responsibility for any injury to people or property resulting from any ideas, methods, instructions or products referred to in the content. |
© 2025 by the authors. Licensee MDPI, Basel, Switzerland. This article is an open access article distributed under the terms and conditions of the Creative Commons Attribution (CC BY) license (http://creativecommons.org/licenses/by/4.0/).
Copyright: This open access article is published under a Creative Commons CC BY 4.0 license, which permit the free download, distribution, and reuse, provided that the author and preprint are cited in any reuse.


