Submitted:
22 May 2025
Posted:
23 May 2025
You are already at the latest version
Abstract
The present study aimed to construct and evaluate the psychometric properties of the Envy Questionnaire (ENV-25) in a sample of 446 secondary school students from the city of Trujillo, aged between 13 and 17 years. The instrument was designed based on theoretical foundations that conceptualize envy as a multidimensional emotion, composed of cognitive, emotional, and behavioral dimensions. Content validity was assessed through expert judgment using Aiken's V coefficient, obtaining values greater than 0.80 for all items. Exploratory and confirmatory factor analyses were conducted, which supported a three-factor structure with 15 items, presenting adequate fit indices (CFI = 0.927; RMSEA = 0.0685). Internal consistency, assessed using the Omega coefficient, was 0.905 for the total scale. Percentile standards were established for the interpretation of the results. The ENV-25 has proven to be a valid and reliable instrument for assessing envy in adolescents, making it useful for educational and psychological interventions aimed at strengthening socioemotional well-being in school settings.
Keywords:
Envy
; adolescents
; psychometrics
; validation
; school psychology
; instrument development
1. Introduction
Envy is a complex social emotion that emerges from processes of social comparison, in which an individual perceives a disadvantage compared to another person’s achievements, attributes, or possessions. This emotion, often denied or misinterpreted, can have significant consequences for self-esteem, emotional health, and interpersonal relationships, especially at developmental stages such as adolescence. According to Navarro-Carrillo et al. (2017), envy combines cognitive, affective, and behavioral components, and its expression is determined by both personal factors and the sociocultural context in which it develops. In adolescents, this emotion can be intensified by social pressure, the desire to belong to a group, and constant exposure to comparisons, especially in competitive academic environments or those influenced by social media.
Envy has been defined as a negative social emotion that arises when a person lacks a desired quality, achievement, or possession that another person possesses. This emotion can be expressed cognitively, through thoughts of comparison with others; emotionally, through feelings of frustration or resentment; and behavioral, in the form of hostile or avoidant attitudes (Carrillo et al., 2016; Navarro-Carrillo et al., 2017). From this multidimensional perspective, envy can not only be destructive—when accompanied by hostility, low self-esteem, and deterioration of social relationships—but can also manifest itself constructively, serving as a source of motivation for personal improvement (Martínez Mares, 2021). This duality makes it necessary to rigorously address its dimensions, especially in contexts where healthy emotional development is sought.
During adolescence, students face challenges related to their personal identity, self-image, and social acceptance. In this process, feelings of inferiority and envy commonly emerge, especially in contexts where success or appearance are overvalued. Research such as that by Alcázar Durán (2020) in Metropolitan Lima has shown that more than 50% of adolescents experience envy in academic and social situations, affecting their self-esteem and emotional well-being. Internationally, Menzies and Menzies (2020) found that adolescents with high levels of envy were 22% more likely to present symptoms of anxiety and depression, reinforcing the importance of studying this emotion as a risk factor for mental health.
In the city of Trujillo, there are no current studies that offer a rigorous psychometric evaluation of this emotion in adolescent schoolchildren. This lack of knowledge limits the ability of mental health and education professionals to adequately identify and address the effects of envy on students’ psychosocial development. Considering the potential impact of this emotion, it is essential to have valid, reliable, and culturally adapted instruments that allow for accurate assessment in local school contexts. Furthermore, this need is framed within Sustainable Development Goal (SDG) 3: Good Health and Well-being, specifically target 3.4, which seeks to reduce risks associated with mental health by 2030 through the prevention and timely treatment of psychoemotional factors that affect well-being.
Given this scenario, the following research question was posed: What are the psychometric properties of the Envy Questionnaire (ENV-25) in high school students in the city of Trujillo? In response to this question, the study’s general objective was to construct and determine the psychometric properties of the Envy Questionnaire (ENV-25) in this population. Consequently, the following specific objectives were proposed: to construct the instrument specifications table; to establish evidence of validity based on the questionnaire content; to conduct a descriptive analysis of the items; to determine the validity of the internal structure; to establish validity with other external variables; to evaluate reliability by internal consistency using the omega coefficient; and finally, to construct norms and cutoff points for the ENV-25 in adolescent schoolchildren in Trujillo.
This research was justified by its scientific, social, and educational value. From an academic perspective, it provided a measurement instrument for envy adapted to the adolescent population of Trujillo, useful for both future research and practical interventions. Socially, the research sought to promote students’ emotional well-being by enabling early detection of this emotion and its appropriate management. Educationally, it offered teachers, counselors, and school psychologists a tool to.
2. Method
This research was quantitative in approach, based on the statistical analysis of data obtained from a representative sample using a questionnaire designed to measure envy in adolescents. This was a basic study, as its main purpose was the theoretical and methodological development of a psychometric instrument, with no immediate application in clinical or educational contexts. The design adopted was non-experimental and cross-sectional, as no variables were manipulated and data were collected at a single time point. Furthermore, it was an instrumental study, aimed at constructing and validating a measurement tool in accordance with the guidelines of the American Psychological Association (APA), the American Educational Research Association (AERA), and the National Council on Measurement in Education (NCME, 2014).
The central variable of the study was envy, defined as a complex emotion manifested by an unfavorable social comparison and which can involve thoughts of inferiority, feelings of frustration, and behaviors of rejection or criticism toward others. The study was approached from a three-dimensional perspective, comprised of cognitive, emotional, and behavioral dimensions, each operationalized in specific items within the questionnaire.
The population consisted of 41,221 high school students from public and private educational institutions in the city of Trujillo, according to data from the National Institute of Statistics and Informatics (INEI, 2024). The sample was selected using non-probability convenience sampling, based on accessibility and availability criteria. Students between the ages of 13 and 17, enrolled in the current school year, who voluntarily agreed to participate and presented authorization signed by their parents or guardians were included. Adolescents with a previous diagnosis of psychological disorders that could interfere with understanding or responding to the items were excluded.
Data collection was conducted using a survey technique, using the Envy Questionnaire (ENV-25), designed by the study authors. The questionnaire consisted of 25 items distributed across three dimensions: cognitive, emotional, and behavioral. Responses were organized on a 4-point Likert-type scale: Never (1), Rarely (2), Almost Always (3), and Always (4). The questionnaire was administered collectively, in physical format, and took an average of 5 to 10 minutes per participant.
The content validity of the instrument was assessed using expert judgment. Eight psychology specialists with master’s or doctoral degrees analyzed each item based on the criteria of clarity, coherence, relevance, and pertinence. Aiken’s V coefficient was used as a statistical indicator, accepting only items with values greater than 0.80, as indicated by Merino and Livia (2009) and Penfield and Giacobbi (2004).
Internal structural validity was assessed using two procedures. First, an exploratory factor analysis (EFA) was performed using the least squares method and oblique rotation (Oblimin), eliminating items with factor loadings below 0.40. Subsequently, a confirmatory factor analysis (CFA) was conducted, examining the model’s overall fit indices: the comparative fit index (CFI), the goodness-of-fit index (GFI), the root mean square error of approximation (RMSEA), and the root mean square standardized residual (SRMR). CFI and GFI values greater than 0.90 were considered adequate, as were RMSEA and SRMR values less than 0.08, and a χ2/df ratio less than 5.0, as recommended by Ferrando and Lorenzo-Seva (2014).
The instrument’s reliability was determined using the omega coefficient, a robust measure of internal consistency, with values equal to or greater than 0.75 considered adequate. This statistic allowed for the internal stability of the dimensions evaluated, demonstrating that the questionnaire items consistently measured the construct of envy in adolescents.
Finally, the ethical aspects established by the César Vallejo University Research Ethics Code were taken into account. The study was approved by the corresponding ethics committee and complied with the principles of beneficence, respect, and justice. Data confidentiality, voluntary participation, anonymity of respondents, and integrity in the processing and reporting of the results obtained were guaranteed.
3. Results
Table 1 shows the content validity assessment of the Envy Questionnaire (ENV-25) under the evaluation criterion of 08 expert judges, using Aiken’s V coefficient, in the criteria of clarity, coherence and relevance, showing adequate scores V>.80 and with adequate confidence intervals, considering it valid and acceptable, showing that all the items were within the acceptable value. According to Aiken (1985), values of the V coefficient greater than 0.80 indicate an adequate degree of agreement among the judges, which supports the content validity of the items evaluated.
Table 2 shows the content validity analysis of the Envy Questionnaire (ENV-25) from items 11 to 20, under the evaluation criteria of 08 expert judges using Aiken’s V coefficient, in clarity, coherence and relevance, showing adequate scores V>.80 and with adequate confidence intervals, considering it valid and acceptable, showing that all items were within the acceptable value. Likewise, Merino and Livia (2009) point out that the use of confidence intervals improves the precision in the interpretation of the V coefficient, strengthening the evidence of validity of the items evaluated.
Table 3 shows the content validity analysis of the Envy Questionnaire (ENV-25) from items 21 to 30, under the evaluation criteria of 08 expert judges using Aiken’s V coefficient, in clarity, coherence and relevance, showing adequate scores V>.80 and with adequate confidence intervals, considering it valid and acceptable, showing that all items were within the acceptable value. According to Merino and Livia (2009), values of the V coefficient above 0.80 reflect adequate consistency between evaluators, while the use of confidence intervals allows a more precise and robust interpretation of the content validity of the items.
Table 4 shows that the response frequency of the items in the ENV-25 questionnaire ranges between 6% and 51.6%, without exceeding the F<80% threshold, indicating that there are no alternatives with excessive predominance, suggesting an adequate distribution of responses (Muñiz, 2018). The means obtained a result that varies between 1.8 and 2.15, while the standard deviations are between 0.93 and 1.05, indicating a low dispersion of the data. In relation to the asymmetry and kurtosis values, these results fluctuate between 0.90 and -1.06, falling within the acceptable range of ±1.5, which allows assuming an approximately normal distribution (George & Mallery, 2012). Likewise, the corrected homogeneity index (IHC) exceeds the value of 0.30, which is considered an adequate indicator of internal consistency and shows that the items measure the same variable (Domínguez-Lara, 2018). On the other hand, with respect to the communalities (h2), it is observed that some items have values lower than 0.50, which according to Lloret-Segura et al. (2014) could indicate an insufficient representation of the common factor, affecting the adequacy of the factorial model.
In Table 5 (Domínguez-Lara, 2018), the means range between 1.74 and 2.17, and the standard deviations range between 0.92 and 0.06, suggesting a low dispersion in the responses, showing a certain homogeneity in the evaluations of the evaluated. Regarding the skewness and kurtosis values, which are between 0.95 and -1.14, these are within the accepted range of ±1.5, a criterion that indicates an approximately normal distribution (George & Mallery, 2012; Villegas, 2014). However, in this specific case, no characteristics of normality are evident. On the other hand, the corrected homogeneity index (IHC) shows that the response frequency of the items in the ENV-25 questionnaire varies between 6% and 50.8%, without exceeding 80%, indicating that there are no alternatives selected by a significant majority, allowing adequate item discrimination) exceeds the minimum acceptable value of 0.30, which suggests adequate internal consistency and that the items measure the same dimension or construct (Domínguez-Lara, 2018). Finally, it is observed that the communalities (h2) are greater than 0.50, which, although usually considered adequate, in this case suggests a possible inadequate correlation between the factors of the instrument, as Lloret-Segura et al. (2014) warn in studies on exploratory factor analysis.
Table 6 shows that the response frequency for the items in the ENV-25 questionnaire ranges from 4.8% to 49.2%, without exceeding 80%. This indicates that there are no alternatives chosen by the majority of participants, which favors variability in the responses and avoids centralized tendency (Domínguez-Lara, 2018). The means range between 1.73 and 2.9, while the standard deviations are between 0.92 and 1.08, which denotes low dispersion, that is, the responses are relatively consistent (Villegas, 2014). Regarding asymmetry and kurtosis, the values are between 1.21 and -1.05. These results are within the accepted range of ±1.5 to assume an approximately normal distribution, although certain values close to the extremes could indicate slight deviations from normality (George & Mallery, 2012; Lloret-Segura et al., 2014). Regarding the corrected homogeneity index (IHC), all items present values greater than .30, which shows that they consistently measure the same dimension or construct (Domínguez-Lara, 2018). Finally, the communalities (h2) present values greater than .50, which according to Lloret-Segura et al. (2014) reflects an adequate relationship between the items and the underlying factors of the questionnaire, allowing an appropriate representation of the latent structure of the instrument.
Table 7 shows the results of the Exploratory Factor Analysis (EFA) of the instrument, using the principal axis factoring method with oblique rotation (promax), based on the theoretical distribution of the items by dimensions. The final model yielded a 3-factor structure with 15 items, which was selected for its best comparative fit. The chi-square value (X2 = 6.798) was significant and is within the acceptable parameters for a well-adjusted model. Regarding the fit indices, the CFI = 0.947 and the TLI = 0.912 exceed the minimum recommended value of 0.90, indicating a good fit of the model, as proposed by Hu and Bentler (1999) and Brown (2015). Regarding the error rates, the SRMR = 0.075 and RMSEA = 0.075 are below the critical threshold of 0.08, which is considered an acceptable fit according to the criteria established by Hair et al. (2014). These indicators, together, allow us to consider that the obtained model adequately reflects the theoretical structure of the questionnaire.
Table 8 presents the factor loadings for the three theoretical dimensions of the ENV-25 questionnaire: cognitive, emotional, and behavioral. The factor loadings ranged from 0.877 to 0.942, values considered high, which demonstrates good saturation of the items with respect to their respective factors (Lloret-Segura et al., 2014; Hair et al., 2014). Furthermore, the total explained variance was 40%, exceeding the minimum threshold of 30%, which is considered acceptable for psychological instruments in the validation stage (Ruiz et al., 2010). Regarding the sampling adequacy indicators, the KMO index was 0.918, which is excellent according to Kaiser’s (1974) classification, while Bartlett’s test of sphericity yielded a p-value < .01, indicating that the data are suitable for factor analysis (Ferrando & Anguiano-Carrasco, 2010). On the other hand, the item loadings within each dimension showed values between 0.357 and 0.826, which is considered acceptable for instruments under development, since loadings higher than 0.30 are admissible in exploratory studies (Lloret-Segura et al., 2014).
3.1. Diagram of the factors comprising the instrument
Figure 1 shows the structure of the cognitive, emotional, and behavioral dimensions that make up the Envy Questionnaire (ENV-25). Three factors can be seen, which make up the instrument.
Table 9 presents the Confirmatory Factor Analysis (CFA) of the Envy Questionnaire (ENV-25), which compares two structural models: one unidimensional and the other three-factor, both composed of 15 items. Although both models showed statistical significance in the chi-square test (p < .001), the fit indices clearly favored the three-factor model. This model presented a better fit with values of X2/df = 3.09, CFI = 0.927, TLI = 0.912, SRMR = 0.0418 and RMSEA = 0.0685, all within the acceptable ranges established in the literature (Hu & Bentler, 1999; Brown, 2015). In contrast, the unidimensional model showed a slightly poorer fit (CFI = 0.921, TLI = 0.908, RMSEA = 0.070, SRMR = 0.0432), indicating a less robust structure. These findings support the model derived from Exploratory Factor Analysis (EFA), confirming the existence of three distinct dimensions of the envy construct. According to Byrne (2012) and Kline (2016), a multidimensional model that presents better fit indices not only reflects a better theoretical representation of the construct, but also allows for a more precise and differentiated assessment of the variable under study, optimizing its diagnostic and interpretive usefulness.
Table 10 shows that factor loadings reflect the correlation between items and underlying factors, so their values usually range between -1 and 1. Values above 0.30 are generally considered acceptable to indicate that an item contributes significantly to the dimension it represents, while values above 0.50 are interpreted as strong (Hair, Black, Babin, Anderson, 2014). Extreme values outside this range, such as those close to absolute zero or excessively high, may indicate errors in data extraction or presentation and should be carefully reviewed to ensure the validity of the factor analysis.
3.2. Diagram of the factors comprising the instrument
Figure 2 shows the structure of the cognitive, emotional, and behavioral dimensions that make up the Envy Questionnaire (ENV-25). Three factors can be seen, which make up the instrument.
Table 11 shows a weak and non-significant correlation between the ENV-25 Questionnaire and the Envy Scale for Adults (CEA), with a Spearman Rho coefficient = 0.017 (p < .001), indicating an absence of relevant association between both measures, which calls into question the convergent validity of the ENV-25. According to Campbell and Fiske (1959), convergent validity requires that an instrument shows moderate to strong correlations with other measures that assess similar constructs. Similarly, Marsh, Hau, and Wen (2004) emphasize that low coefficients suggest a lack of concurrent consistency, questioning the validity of the instrument. Furthermore, the minimal effect size (r2 = 0.000289) reinforces the conclusion that the CEA Scale does not significantly predict the results of the ENV-25, which is consistent with Cohen’s (1988) recommendations on the interpretation of effect sizes in correlations.
Table 12 presents the reliability coefficients calculated using the Omega coefficient (ω). A value of ω = .905 was obtained for the total scale, while for the cognitive, emotional, and behavioral dimensions the values were ω = .795, ω = .790, and ω = .717, respectively. These values are considered adequate and acceptable, given that they are within the recommended range of .70 to 1.00, indicating good internal consistency of the instrument (Revelle & Zinbarg, 2009). The Omega coefficient is preferred over Cronbach’s alpha, as it provides a more precise estimate of reliability in scales with multiple factors and different factor loadings (McNeish, 2018).
Table 13 presents the general norms of the envy questionnaire (ENV-25), which evaluates the three dimensions of the instrument: cognitive, emotional, and behavioral, with means of 8.86, 9.2, and 8.71, respectively. The interpretation of the levels is established using percentile ranges, where scores between the 25th and 75th percentiles are considered normal or average, while scores above the 80th percentile indicate high levels of the construct, and those below the 25th percentile reflect low or sporadic levels (Kaplan & Saccuzzo, 2017). This strategy is common in psychological assessment to categorize the intensity or frequency of thoughts, emotions, and behaviors related to the construct evaluated, facilitating a clear and functional interpretation of the results.
4. Discussion
The purpose of this research was to construct and evaluate the psychometric properties of the Envy Questionnaire (ENV-25) among high school students in the city of Trujillo. The results obtained are discussed below based on the specific objectives set.
The ENV-25 questionnaire was constructed based on a solid theoretical foundation, and its items were organized into three dimensions that adequately reflect the psychological phenomenon of envy. This structure is consistent with theoretical approaches that consider envy as a complex emotion of cognitive, emotional, and behavioral nature (Carrillo et al., 2016; Martínez Mares, 2021). This allowed for the development of a 25-item instrument, evenly distributed. This organization was based on updated conceptual references on the phenomenon of envy in school contexts, allowing for an adequate representation of its multidimensionality. The instrument was designed using a four-point Likert-type scale, which facilitates the differentiation of levels of perceived intensity for each item, conforming to appropriate statistical criteria for psychometric analysis. Dividing the questionnaire into these dimensions allowed for the reflection of the components described by authors such as Festinger (1954), who linked social comparison with the emergence of envy, and Navarro-Carrillo et al. (2017), who highlighted the influence of social and hierarchical factors. In theoretical terms, the instrument allows for the operationalization of a construct that has traditionally been approached from qualitative perspectives, offering a valuable quantitative tool for the study of social emotions in adolescents. In practice, its design favors rapid application in school settings. One potential limitation lies in the initial decision on the number of dimensions without prior qualitative analysis, although this was empirically validated. For future research, we suggest exploring the construct from mixed approaches that allow for the integration of local cultural perceptions. Robust evidence of content validity was obtained through the judgment of a panel of eight expert judges, using Aiken’s V coefficient. The results showed values above .80 for most items in terms of clarity, coherence, and relevance (Table 1, Table 2 and Table 3). These findings indicate strong agreement between raters on the relevance of the items to measure the construct, supporting that the questionnaire content adequately reflects the theoretical components of envy in the adolescent population. These results support that the content is appropriate for adolescents, reinforcing the findings of studies such as that of Quinde Saldarriaga (2020), who validated a scale in university students. Unlike that population, the ENV-25 items were semantically and thematically adapted to the school-age group, following the recommendations of Alcázar Durán (2020), who showed how envy in adolescents arises in contexts of academic and social comparison. Theoretically, these results reaffirm that envy can be captured with contextualized items. On a practical level, this validity ensures that the instrument can be used as a basis for psychoeducational interventions in schools. As a limitation, the evaluation focused only on linguistic and theoretical criteria, without initial empirical validation by adolescents. Future studies could consider focus groups with students before administering the questionnaire on a large scale.
The descriptive analysis confirmed the adequate distribution of the items and their internal consistency within each dimension, showing item means ranging from 1.73 to 2.17, with standard deviations between 0.89 and 1.08. The distributions remained within normal parameters, with skewness and kurtosis values between ±1.5 (Table 4, Table 5 and Table 6). Furthermore, the corrected homogeneity indices (CHI) exceeded the minimum cutoff point of .30 for all items, demonstrating that each item contributes to the dimension to which it belongs (Domínguez-Lara, 2018). The communalities (h2), mostly greater than .50, reflect an adequate proportion of common variance explained by the latent factors. The results showed consistent means, low skewness in the distribution of responses, and corrected homogeneity indices (CHI) above .30 (Table 4, Table 5 and Table 6), in line with the recommendations of Domínguez-Lara (2018). These findings coincide with those of Marín-Cortés et al. (2021), who noted that envy is expressed through different types of comparisons, which explains the variability in responses observed in the ENV-25 items. Theoretically, these patterns support the idea that envy does not manifest itself homogeneously, but rather with varying intensity depending on the context and dimension. In practice, this allows for the detection of individual differences useful for personalized interventions. Although the communality values for some items were low, the overall performance was satisfactory. Future studies suggest reviewing and refining items with communality below .50 to strengthen their contribution to the factor model. Exploratory Factor Analysis (EFA) identified a 15-item three-factor structure that showed good overall fit indices (CFI = 0.947; TLI = 0.912; RMSEA = 0.075; SRMR = 0.030), all within acceptable limits (Hu & Bentler, 1999; Hair et al., 2014). These three dimensions align with the initial theoretical proposal and group items with factor loadings greater than .40 (Table 8), indicating a solid internal organization of the instrument. The model was subsequently confirmed through Confirmatory Factor Analysis (CFA), which compared a one-dimensional structure with a three-factor structure. The three-factor model showed a better fit (CFI = 0.927; TLI = 0.912; RMSEA = 0.0685), outperforming the unidimensional model and confirming the adequacy of the proposed theoretical model (Table 9). Exploratory and confirmatory factor analysis supported a three-factor structure, confirming the validity of the instrument’s internal structure. The three-factor solution showed good fit indicators (CFI > .92; RMSEA < .08), comparable to those of similar research such as Ruiz et al. (2010) and Hair et al. (2014), and superior to the unidimensional structures tested. This is consistent with the proposals of Covarrubias et al. (2024), who pointed out that envy has a multifaceted nature that requires a complex structural approach. From a theoretical perspective, an empirical validation of a three-dimensional conception of the construct is provided. In applied terms, it allows for the identification of specific profiles of envy in adolescents, which can guide targeted interventions. A potential limitation was the elimination of items that could have complemented other dimensions; however, this was necessary to achieve greater parsimony in the model. Going forward, we propose testing this structure for factorial invariance in different regions of the country.
Convergent validity was assessed by correlation with the Adult Envy Scale (AES). However, a very low Spearman coefficient was obtained (rho = 0.017; r2 = 0.0003; p < .001), suggesting that there is no significant relationship between the two scales (Table 11). This lack of association may be attributed to differences in the target population (adolescents vs. adults) or to different theoretical approaches, which underscores the importance of designing specific instruments for each age group. Although studies such as that by Quinde Saldarriaga (2020) used the AES to validate scales in adults, in this study the correlation between the AES-25 and AES was low (rho = 0.017), suggesting that measuring envy in adolescents requires specific instruments. This aligns with what Menzies and Menzies (2020) indicated, who noted that envy in young people is related to different factors, such as social networks or academic competence. Theoretically, this underscores the need to develop measures adapted to the developmental stage. On a practical level, it indicates that the results of the ENV-25 should not be compared with instruments designed for adults. Although this finding can be considered a weakness, it also strengthens the justification for the proposed questionnaire. Future research could use scales validated for adolescents as an alternative external criterion or construct new comparable measures.
The internal consistency of the questionnaire, assessed using the Omega coefficient, reached a value of .905 for the 15 selected items. By dimension, the values were .795 for the cognitive dimension, .790 for the emotional dimension, and .717 for the behavioral dimension (Table 12). These results are considered adequate for initial studies and support the internal consistency of the instrument (Revelle & Zinbarg, 2009; McNeish, 2018). These results improve on those reported by Quinde (2020) (ω = .892) and highlight the reliability of the ENV-25 in the school population. From a theoretical perspective, this confirms that the dimensions of the envy construct exhibit internal cohesion. This practically guarantees that the instrument can be safely applied in school psychological assessments. A potential limitation is that other reliability methods, such as test-retest, were not applied; however, the results obtained are robust for a first version of the instrument. It is recommended that other reliability strategies be applied in longitudinal studies.
Finally, percentiles were established to categorize the levels of the construct into low, medium, and high envy (Table 13). Scores between the 25th and 75th percentiles are interpreted as average, while values below the 25th percentile indicate low envy, and those above the 75th percentile indicate high levels. This standard provides a useful framework for the diagnostic and investigative interpretation of the instrument (Kaplan & Saccuzzo, 2017). The means obtained by dimension (between 8.7 and 9.2) allow comparing individuals or groups based on their relative location. These ranges facilitate their use in educational contexts for the detection of cases with high levels of envy, which is important considering studies such as that by Alcázar Durán (2020), which link envy with low self-esteem in adolescents. In theoretical terms, these norms contribute to the standardization of the construct in the Peruvian school population. In practice, they offer school psychologists a quick interpretation tool. One limitation is that the percentiles were constructed using a convenience sample; however, their structure is adequate as a starting point. Validating these cutoff points in more representative and diverse samples is recommended.
5. Conclusions
The psychometric properties of the Envy Questionnaire (ENV-25) were evaluated in a sample of high school students from the city of Trujillo. Strong evidence of validity and reliability was found, indicating that the instrument is suitable for measuring the construct in this population. A specification table was constructed based on a three-dimensional theoretical model, from which a 25-item questionnaire was developed, distributed across the cognitive, emotional, and behavioral dimensions. Subsequently, a group of eight experts evaluated the instrument’s content, and using Aiken’s V coefficient, a high level of content validity was confirmed, exceeding 80% for all items, which allowed the four-point Likert-type scale to be maintained. A descriptive analysis of the items was performed, which revealed a normal distribution, adequate response dispersion, and good intersubject discrimination, demonstrating appropriate psychometric quality at the item level. Exploratory factor analysis identified a three-factor structure grouping 15 items with factor loadings greater than 0.40. This was subsequently confirmed by confirmatory factor analysis, which yielded satisfactory fit indices. Regarding external validity, a low and nonsignificant correlation was observed with another envy scale, reinforcing the need for specific instruments for adolescents. Regarding reliability, an overall Omega coefficient of 0.905 was obtained, and values above 0.70 were obtained in each of the three dimensions, which supports its internal consistency. Finally, percentile norms were constructed for the interpretation of the results, allowing envy levels to be classified as low, medium, and high within the sample evaluated. Future research recommends applying the instrument to larger and more diverse samples and complementing the validation and reliability methods with longitudinal designs and mixed approaches.
Supplementary Materials
The following supporting information can be downloaded at the website of this paper posted on Preprints.org.
References
- Aiken, L. R. (1985). Three coefficients for analyzing the reliability and validity of ratings. Educational and Psychological Measurement, 45(1), 131–142. Sci-Hub | Three Coefficients for Analyzing the Reliability and Validity of Ratings. Educational and Psychological Measurement, 45(1), 131–142. [CrossRef]
- American Educational Research Association, American Psychological Association, & National Council on Measurement in Education. (2014). Standards for Educational and Psychological Testing. Washington, DC: American Educational Research Association.
- Brown, T. A. (2015). Confirmatory Factor Analysis for Applied Research (2nd ed.). The Guilford. https://www.bing.com/ck/a?!&&p=c72a04c8d684fa27b6bb0aa2ebcd3151c391e4e9086a03a28b9bbd0e147076b7JmltdHM9MTc0NzI2NzIwMA&ptn=3&ver=2&hsh=4&fclid=23974bbb-1b4d-6f73-0239-5ffa1af46e9a&psq=Brown%2c+T.+A.+(2015).+Confirmatory+Factor+Analysis+for+Applied+Research+(2nd+ed.).+The+Guilford+Press.&u=a1aHR0cHM6Ly93d3cucmVzZWFyY2hnYXRlLm5ldC9wcm9maWxlL0ltcmFuLUFud2FyLTIvcG9zdC9Db25kdWN0aW5nX0VGQV9hbmRfdGhlbl9DRkFfSnVzdGlmaWNhdGlvbl9MaXRlcmF0dXJlL2F0dGFjaG1lbnQvNjA3OWM5ZGFlYjc3YTMwMDAxNzRkYWMxL0FTJTNBMTAxMzI3MTk0MzQ2MjkxNSU0MDE2MTg1OTQyNjU4NTQvZG93bmxvYWQvJTI4TWV0aG9kb2xvZ3kraW4rdGhlK1NvY2lhbCtTY2llbmNlcyUyOStUaW1vdGh5K0EuK0Jyb3duK1BzeUQrLStDb25maXJtYXRvcnkrRmFjdG9yK0FuYWx5c2lzK2ZvcitBcHBsaWVkK1Jlc2VhcmNoJTJDK1NlY29uZCtFZGl0aW9uLVRoZStHdWlsZm9yZCtQcmVzcyslMjgyMDE1JTI5LnBkZg&ntb=1.
- Campbell, D. T., & Fiske, D. W. (1959). Convergent and discriminant validation by the multitrait-multimethod matrix. Psychological Bulletin, 56(2), 81–105. [CrossRef]
- Chóliz, M. y Gómez, C. (2002). Emociones sociales II (enamoramiento, celos, envidia y empatía). En F.Palmero, E.G: Fernández-Abascal, F. Martínez y M. Chóliz (eds.), Psicología de la Motivación y Emoción (pp. 395-418). Madrid: McGrawHill. Microsoft Word - Emociones sociales _def_.doc.
- Cohen, J. (1988). Statistical power analysis for the behavioral sciences (2nd ed.). Routledge.
- Domínguez-Lara, S. (2018). Índices de consistencia interna en estudios empíricos: conceptos y recomendaciones. Revista Evaluar, 18(1), 96–104. [CrossRef]
- Feria Ávila, H., Matilla González, M., & Mantecón Licea, S. (2020). La entrevista y la encuesta: ¿métodos o técnicas de indagación empírica?. Revista Didasc@lia: D&E, 11(3), 62-79. https://dialnet.unirioja.es/descarga/articulo/7692391.pdf.
- Festinger, L. (1954). A theory of social comparison processes. Human Relations, 7(2), 117-140. https://www.humanscience.org/docs/Festinger%20(1954)%20A%20Theory%20of%20Social%20Comparison%20Processes.pdf.
- George, D., & Mallery, P. (2012). IBM SPSS Statistics 19 Step by Step: A Simple Guide and Reference (12th ed.). Pearson.https://www.taylorfrancis.com/books/mono/10.4324/9780429056765/ibm-spss-statistics-26-step-step-darren-george-paul-mallery.
- Gordillo, F., Mestas, L., Pérez, M. Á., & Arana, J. M. (2020). Una breve historia sobre el origen de las emociones. Revista Electrónica de Psicología de la FES Zaragoza-UNAM, 10(19), 20-27. https://www.researchgate.net/profile/Fernando-Leon-10/publication/342083738_Una_breve_historia_sobre_el_origen_de_las_emociones/links/5f44e49fa6fdcccc43fdefb5/Una-breve-historia-sobre-el-origen-de-las-emociones.pdf#page=20.
- Hair, J. F., Black, W. C., Babin, B. J., & Anderson, R. E. (2014). Multivariate Data Analysis (7th ed.). Pearson Education. https://books.google.com.pe/books/about/Multivariate_Data_Analysis.html?id=VvXZnQEACAAJ&redir_esc=y.
- Hu, L. T., & Bentler, P. M. (1999). Cutoff criteria for fit indexes in covariance structure analysis: Conventional criteria versus new alternatives. Structural Equation Modeling: A Multidisciplinary Journal, 6(1), 1–55. [CrossRef]
- Instituto Nacional de Estadística e Informática. (2024). Sistema de Información Distrital para la Gestión Pública. https://estadist.inei.gob.pe/report.
- Kline, R. B. (2016). Principles and Practice of Structural Equation Modeling (4th ed.). The Guilford Press.
- Lloret-Segura, S., Ferreres-Traver, A., Hernández-Baeza, A., & Tomás-Marco, I. (2014). El análisis factorial exploratorio de los: una guía práctica, revisada y actualizada. Anales de Psicología, 30(3), 1151–1169. ítems El Análisis Factorial Exploratorio de los Ítems: una guía práctica, revisada y actualizada. [CrossRef]
- Marsh, H. W., Hau, K. T., & Wen, Z. (2004). In search of golden rules: Comment on hypothesis-testing approaches to setting cutoff values for fit indexes and dangers in overgeneralizing Hu and Bentler’s (1999) findings. Structural Equation Modeling, 11(3), 320–341. [CrossRef]
- Martínez Mares, S. (2021). De la admiración a la envidia. Algunos problemas en el modelaje moral y la educación del carácter. Revista interdisciplinar de Teoría Mimética. Xiphias Gladius, (4), 1-18. https://riucv.ucv.es/handle/20.500.12466/3296.
- McNeish, D. (2018). Thanks to coefficient alpha, we’ll take it from here. Psychological Methods, 23(3), 412–433. [CrossRef]
- Menzies, R. E., & Menzies, R. G. (2020). The relationship between envy and mental health in adolescents. Journal of Adolescence, 33(4), 567-576. [CrossRef]
- Merino, C., & Livia, J. (2009). Intervalos de confianza para el coeficiente V de Aiken. Revista de Psicología (PUCP), 27(1), 141-156. El temperamento ha sido definido como diferencias individuales.
- Merino, C., & Livia, J. (2009). La validez de contenido: Un enfoque práctico en psicometría. Theoria, 18(1), 61–71. http://www.redalyc.org/articulo.oa?id=299020413005.
- Muñiz, J. (2018). Psicometría. Pirámide. [CrossRef]
- Navarro-Carrillo, G., Beltrán-Morillas, A. M., Valor-Segura, I., & Expósito, F. (2017). ¿Qué se esconde detrás de la envidia? Aproximación desde una perspectiva psicosocial. Revista de Psicología Social, 32(2), 217–245. [CrossRef]
- Navarro-Carrillo, G., Cejudo, J., & Latorre, J. M. (2017). The role of emotional intelligence and social support in predicting subjective well-being. Psicothema, 29(3), 382–388. [CrossRef]
- OECD. (2021). Education at a Glance 2021: OECD Indicators. [CrossRef]
- Ormeño Karzulovic, J. (2018). Envidia, resentimiento e igualdad. https://repositorio.uchile.cl/handle/2250/159354.
- Penfield, R. D., & Giacobbi Jr, P. R. (2004). Evaluating the Replicability of Sample Results: A Tutorial of Double Cross-Validation Methods. [CrossRef]
- Penfield, R. D., & Giacobbi, P. R. (2004). Estimating content validity: A reanalysis of the Aiken’s V and a heuristic for constructing tables for estimating content validity. Measurement in Physical Education and Exercise Science, 8(4), 213–225. [CrossRef]
- Prieto, G., & Delgado, A. R. (2010). Fiabilidad y validez. Papeles del Psicólogo, 31(1), 67-74. https://www.papelesdelpsicologo.es/pdf/1797.pdf.
- Revelle, W., & Zinbarg, R. E. (2009). Coefficients alpha, beta, omega, and the glb: Comments on Sijtsma. Psychometrika, 74(1), 145–154. [CrossRef]
- Rodríguez, J. S. (2022). El resentimiento en la moral y el deseo mimético.: Sobre el vitalismo moral en Mentira romántica y verdad novelesca de René Girard. Revista Interdisciplinar De Teoría Mimética. Xiphias Gladius, (5), 57–78. [CrossRef]
- Smith, J. A., & Kim, S. H. (2007). The painful experience of envy. Journal of Personality and Social Psychology, 92(4), 748-763. (PDF) The Painful Duality of Envy: Evidence for an Integrative Theory and a Meta-Analysis on the Relation of Envy and Schadenfreude.
- Vendrell, Í. (2021). Emoción y moral: el caso de la envidia. En C. Cabrera & M. Szeftel (Eds.), Fenomenología de la vida afectiva (pp. 1-30). SB Editorial. https://d1wqtxts1xzle7.cloudfront.net/68999243/Envidia.Moral.FenomenologiaVidaAffectiva-libre.pdf?1630615917=&response-content-disposition=inline%3B+filename%3DEmocion_y_moral_el_caso_de_la_envidia.pdf&Expires=1740681098&Signature=K7744EDVQKScjb1HJOKrNdCOklmouQdFdkInxUhJTvyDho126iQq56cwkSL4rClStnrXrxKEuSPAeBQd-uGgVkceChPdQ8JHSTSJy~lAvY9F1p-ASCjL~Lvh1h0AiV7Q5U4aWisQPAtii0qwRBfcHeuKD3qfwQoPG~sLI9Ezg4r6dK1t12n0PTDMltoFtFqKOhQ~WEwvK7x5pGRCIwRSGKBgDKiOFeSPs6IE0aryMKZN5yXWzXGqoxHfM3OvGHAM9jX4FQNsZ9WRFTMzaFi8WgsDwRsVcC5Xs8EY1aSFCIujFPgSuEjQtli06Vc7mS139JYK3gk97mjDAtUK56i-cQ__&Key-Pair-Id=APKAJLOHF5GGSLRBV4ZA.
- Villegas, M. J. (2014). Normalidad y distribución de datos en la investigación en psicología. Revista Iberoamericana de Diagnóstico y Evaluación – e Avaliación Psicológica, 1(37), 95–106. [CrossRef]
- Ñaupas Paitán, H., Valdivia Dueñas, M. R., Palacios Vilela, J. J., & Romero Delgado, H. E. (2018). Metodología de la investigación: Cuantitativa-cualitativa y redacción de la tesis. https://edicionesdelau.com/wp-content/uploads/2018/09/Anexos-Metodologia_%C3%91aupas_5aEd.pdf.
Figure 1.
Exploratory factor model of the Envy Questionnaire (ENV-25).
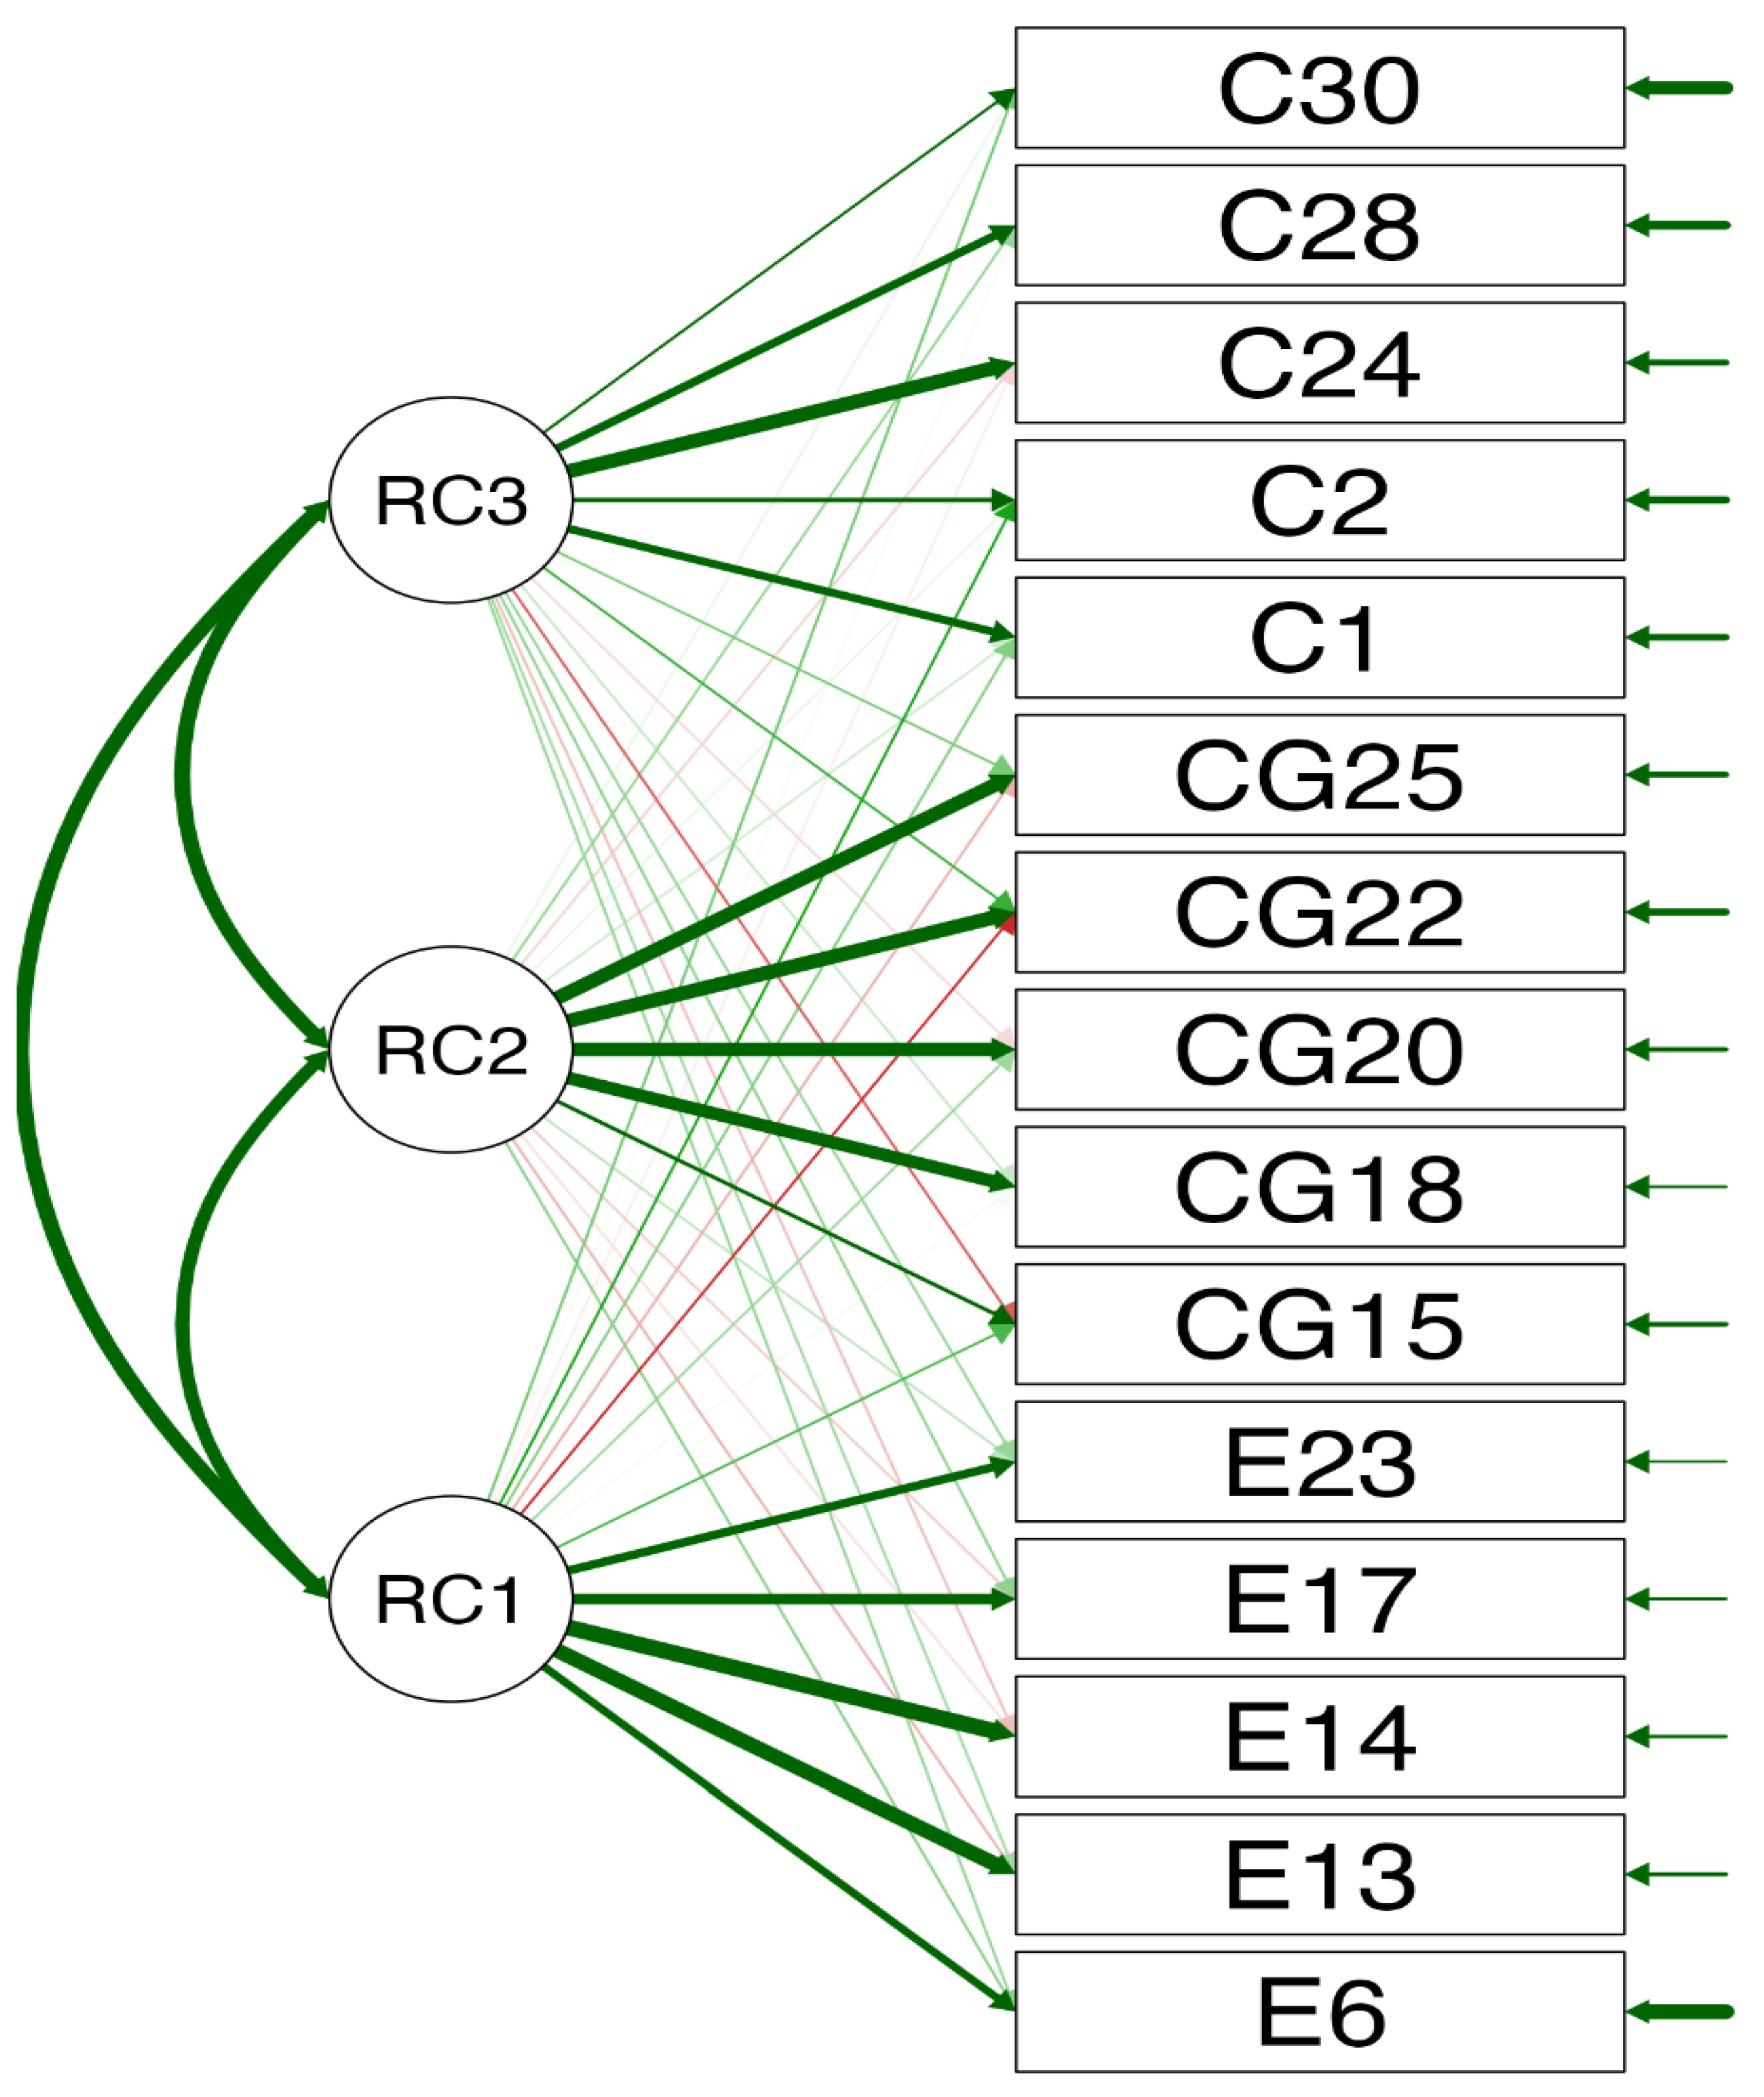
Figure 2.
Confirmatory factor model of the Envy Questionnaire (ENV-25).
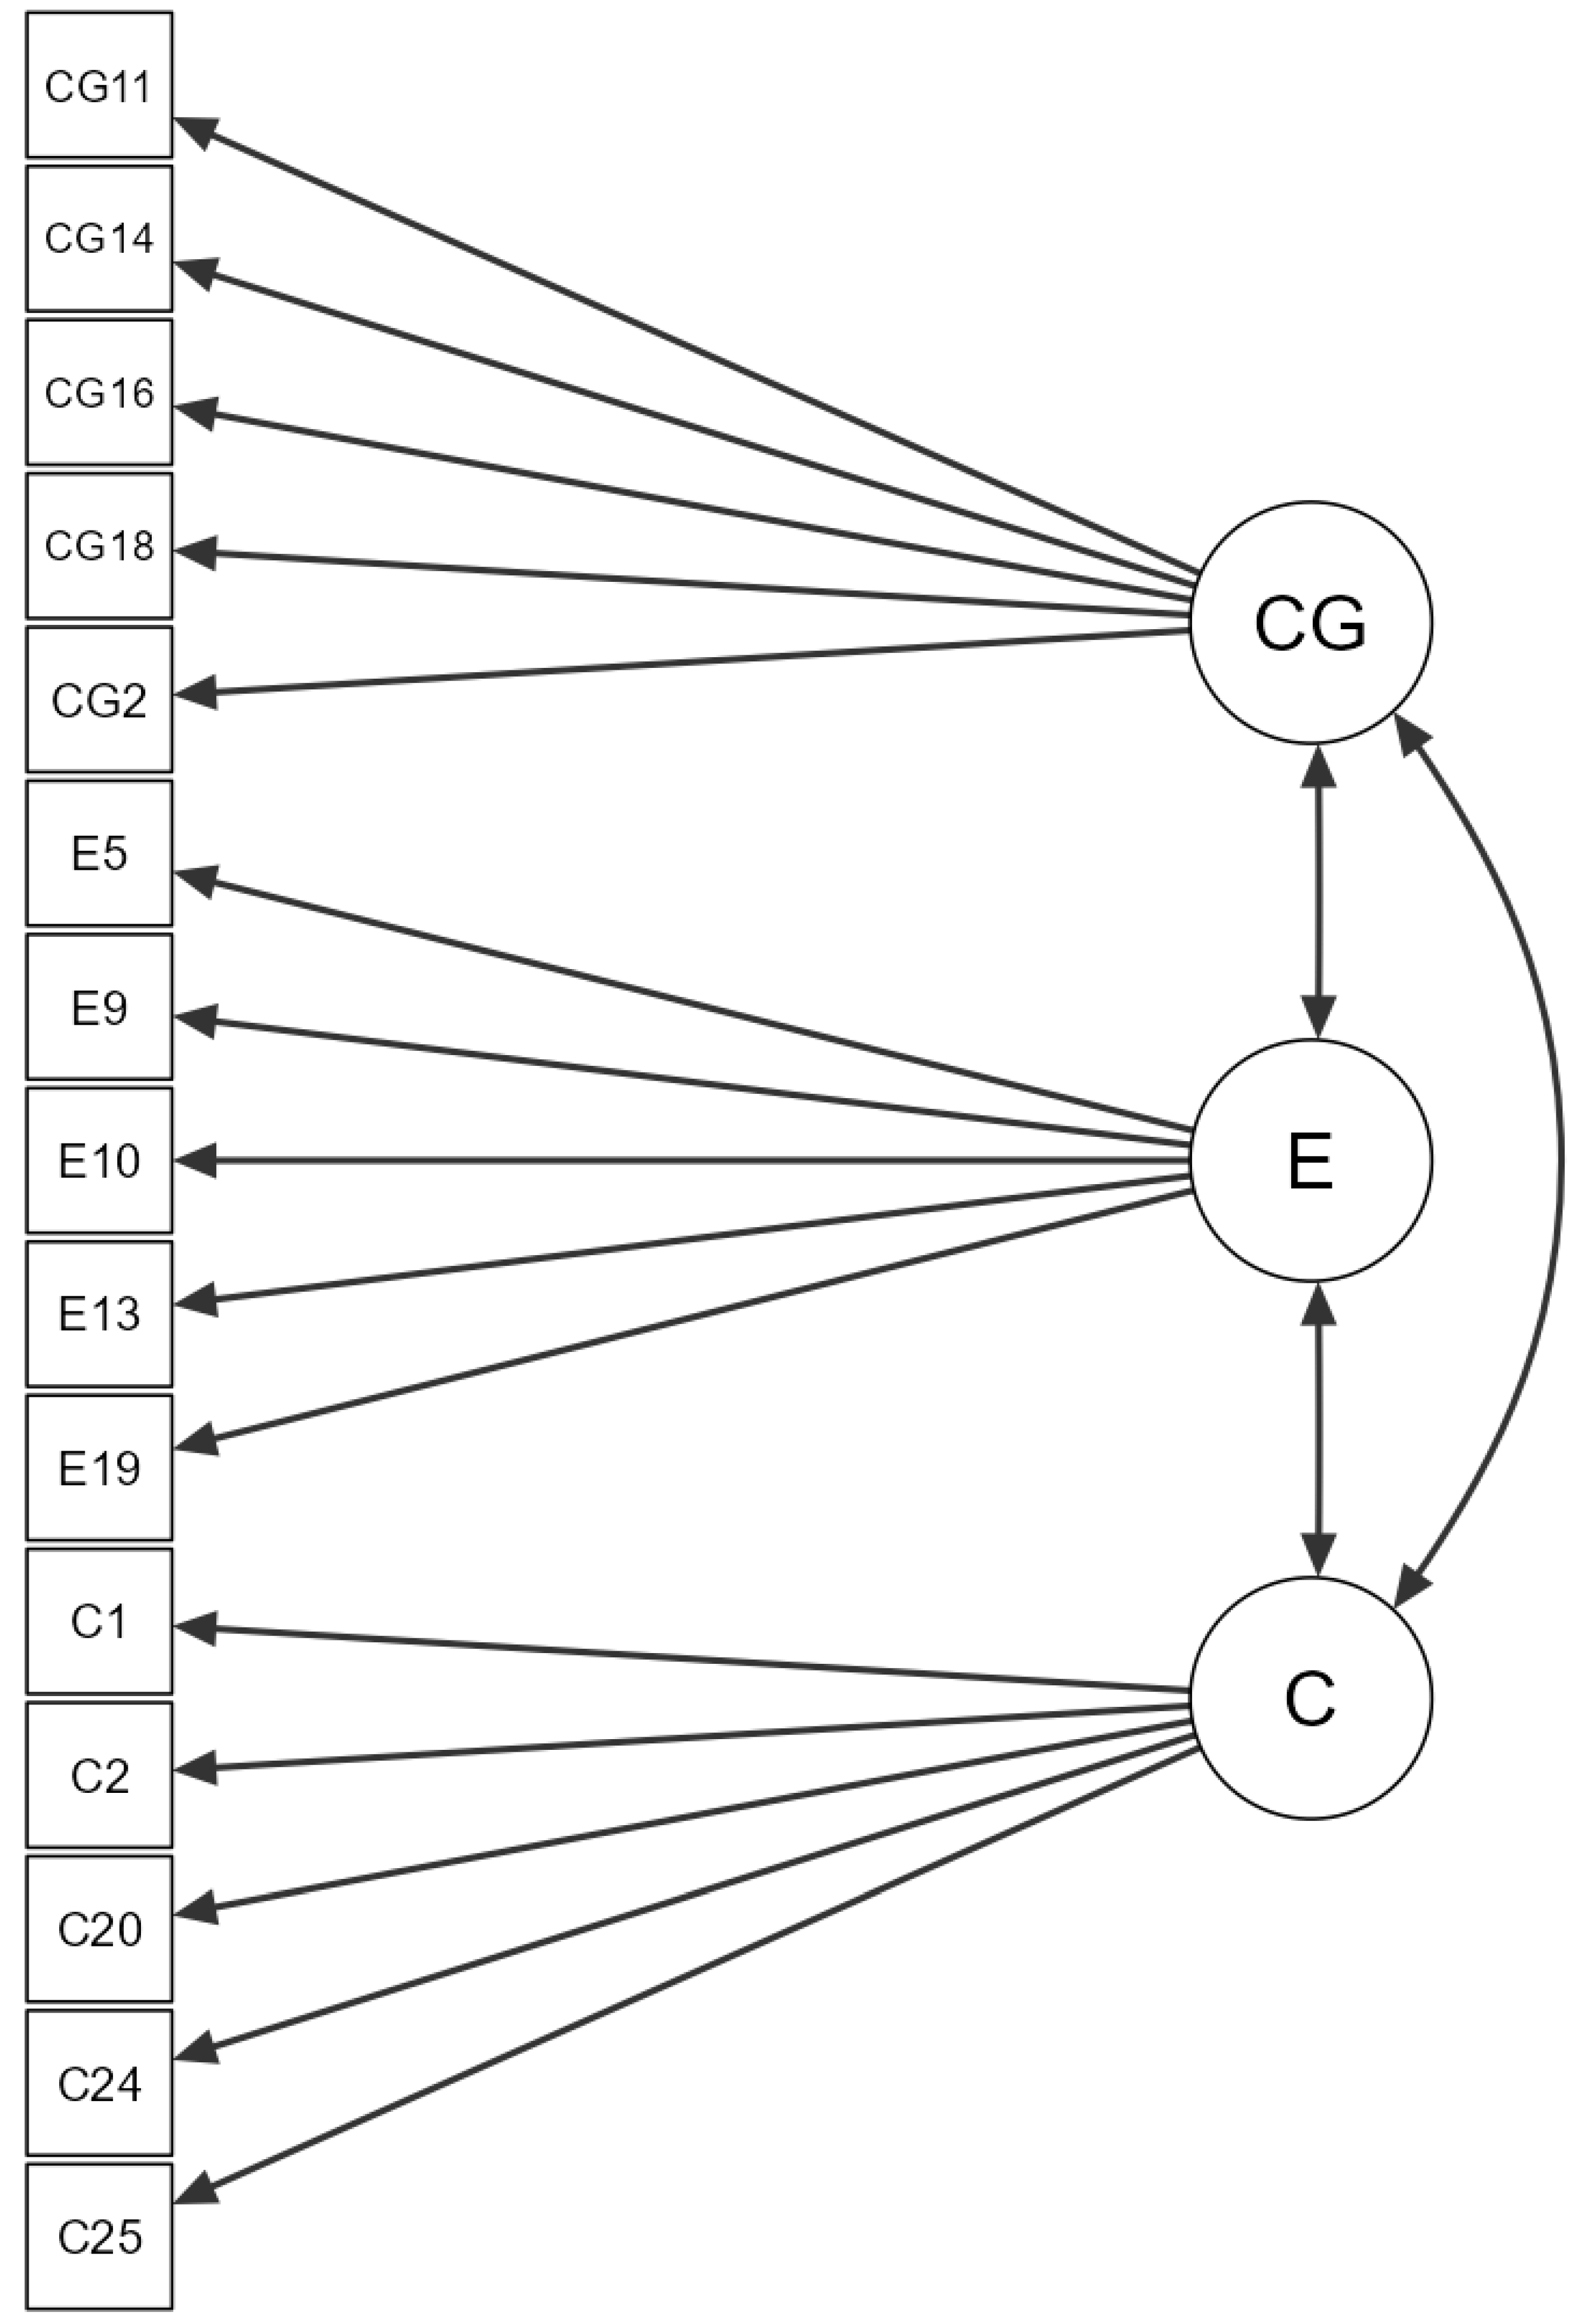

Table 1.
Content validity of the Envy Questionnaire (ENV-25).
| Ítems | Clarity | Coherence | Relevance | ||||||||||||||||||
| M | V | IC 95% | M | V | IC 95% | M | V | IC 95% | |||||||||||||
| L | U | L | U | L | U | ||||||||||||||||
| i1 | 1.0 | 1.0 | [ | 0.57 | - | 1.00 | ] | 1.0 | 1.0 | [ | 0.57 | - | 1.00 | ] | 1.0 | 1.0 | [ | 0.57 | - | 1.00 | ] |
| i2 | 1.0 | 1.0 | [ | 0.57 | - | 1.00 | ] | 1.0 | 1.0 | [ | 0.57 | - | 1.00 | ] | 1.0 | 1.0 | [ | 0.57 | - | 1.00 | ] |
| i3 | 1.0 | 1.0 | [ | 0.57 | - | 1.00 | ] | 1.0 | 1.0 | [ | 0.57 | - | 1.00 | ] | 1.0 | 1.0 | [ | 0.57 | - | 1.00 | ] |
| i4 | 1.0 | 1.0 | [ | 0.57 | - | 1.00 | ] | 1.0 | 1.0 | [ | 0.57 | - | 1.00 | ] | 1.0 | 1.0 | [ | 0.57 | - | 1.00 | ] |
| i5 | 0.9 | 0.8 | [ | 0.44 | - | 0.98 | ] | 0.9 | 0.8 | [ | 0.44 | - | 0.98 | ] | 1.0 | 1.0 | [ | 0.57 | - | 1.00 | ] |
| i6 | 1.0 | 1.0 | [ | 0.57 | - | 1.00 | ] | 1.0 | 1.0 | [ | 0.57 | - | 1.00 | ] | 1.0 | 1.0 | [ | 0.57 | - | 1.00 | ] |
| i7 | 1.0 | 1.0 | [ | 0.57 | - | 1.00 | ] | 1.0 | 1.0 | [ | 0.57 | - | 1.00 | ] | 1.0 | 1.0 | [ | 0.57 | - | 1.00 | ] |
| i8 | 1.0 | 1.0 | [ | 0.57 | - | 1.00 | ] | 1.0 | 1.0 | [ | 0.57 | - | 1.00 | ] | 1.0 | 1.0 | [ | 0.57 | - | 1.00 | ] |
| i9 | 1.0 | 1.0 | [ | 0.57 | - | 1.00 | ] | 1.0 | 1.0 | [ | 0.57 | - | 1.00 | ] | 1.0 | 1.0 | [ | 0.57 | - | 1.00 | ] |
| i10 | 1.0 | 1.0 | [ | 0.57 | - | 1.00 | ] | 1.0 | 1.0 | [ | 0.57 | - | 1.00 | ] | 1.0 | 1.0 | [ | 0.57 | - | 1.00 | ] |
Note: M= mean, V= Aiken, CI= confidence interval, L= lower limit, U= upper limit.
Table 2.
Content validity of the Envy Questionnaire (ENV-25).
| Ítems | Clarity | Coherence | Relevance | ||||||||||||||||||
| M | V | IC 95% | M | V | IC 95% | M | V | IC 95% | |||||||||||||
| L | U | L | U | L | U | ||||||||||||||||
| i11 | 0.9 | 0.8 | [ | 0.44 | - | 0.98 | ] | 1.0 | 1.0 | [ | 0.57 | - | 1.00 | ] | 1.0 | 1.0 | [ | 0.57 | - | 1.00 | ] |
| i12 | 1.0 | 1.0 | [ | 0.57 | - | 1.00 | ] | 0.9 | 0.8 | [ | 0.44 | - | 0.98 | ] | 1.0 | 1.0 | [ | 0.57 | - | 1.00 | ] |
| i13 | 1.0 | 1.0 | [ | 0.57 | - | 1.00 | ] | 0.9 | 0.8 | [ | 0.44 | - | 0.98 | ] | 1.0 | 1.0 | [ | 0.57 | - | 1.00 | ] |
| i14 | 1.0 | 1.0 | [ | 0.57 | - | 1.00 | ] | 1.0 | 1.0 | [ | 0.57 | - | 1.00 | ] | 1.0 | 1.0 | [ | 0.57 | - | 1.00 | ] |
| i15 | 1.0 | 1.0 | [ | 0.57 | - | 1.00 | ] | 1.0 | 1.0 | [ | 0.57 | - | 1.00 | ] | 1.0 | 1.0 | [ | 0.57 | - | 1.00 | ] |
| i16 | 1.0 | 1.0 | [ | 0.57 | - | 1.00 | ] | 1.0 | 1.0 | [ | 0.57 | - | 1.00 | ] | 1.0 | 1.0 | [ | 0.57 | - | 1.00 | ] |
| i17 | 1.0 | 1.0 | [ | 0.57 | - | 1.00 | ] | 1.0 | 1.0 | [ | 0.57 | - | 1.00 | ] | 1.0 | 1.0 | [ | 0.57 | - | 1.00 | ] |
| i18 | 1.0 | 1.0 | [ | 0.57 | - | 1.00 | ] | 1.0 | 1.0 | [ | 0.57 | - | 1.00 | ] | 1.0 | 1.0 | [ | 0.57 | - | 1.00 | ] |
| i19 | 0.9 | 0.8 | [ | 0.44 | - | 0.98 | ] | 1.0 | 1.0 | [ | 0.57 | - | 1.00 | ] | 0.9 | 0.8 | [ | 0.44 | - | 0.98 | ] |
| i20 | 1.0 | 1.0 | [ | 0.57 | - | 1.00 | ] | 1.0 | 1.0 | [ | 0.57 | - | 1.00 | ] | 1.0 | 1.0 | [ | 0.57 | - | 1.00 | ] |
Note: M= mean, V= Aiken, CI= confidence interval, L= lower limit, U= upper limit.
Table 3.
Content validity of the Envy Questionnaire (ENV-25).
| Ítems | Clarity | Coherence | Relevance | |||||||||||||||||||
| M | V | IC 95% | M | V | IC 95% | M | V | IC 95% | ||||||||||||||
| L | U | L | U | L | U | |||||||||||||||||
| i21 | 1.0 | 1.0 | [ | 0.57 | - | 1.00 | ] | 1.0 | 1.0 | [ | 0.57 | - | 1.00 | ] | 1.0 | 1.0 | [ | 0.57 | - | 1.00 | ] | |
| i22 | 1.0 | 1.0 | [ | 0.57 | - | 1.00 | ] | 1.0 | 1.0 | [ | 0.57 | - | 1.00 | ] | 1.0 | 1.0 | [ | 0.57 | - | 1.00 | ] | |
| i23 | 1.0 | 1.0 | [ | 0.57 | - | 1.00 | ] | 1.0 | 1.0 | [ | 0.57 | - | 1.00 | ] | 1.0 | 1.0 | [ | 0.57 | - | 1.00 | ] | |
| i24 | 1.0 | 1.0 | [ | 0.57 | - | 1.00 | ] | 1.0 | 1.0 | [ | 0.57 | - | 1.00 | ] | 1.0 | 1.0 | [ | 0.57 | - | 1.00 | ] | |
| i25 | 1.0 | 1.0 | [ | 0.57 | - | 1.00 | ] | 1.0 | 1.0 | [ | 0.57 | - | 1.00 | ] | 1.0 | 1.0 | [ | 0.57 | - | 1.00 | ] | |
| i26 | 1.0 | 1.0 | [ | 0.57 | - | 1.00 | ] | 1.0 | 1.0 | [ | 0.57 | - | 1.00 | ] | 1.0 | 1.0 | [ | 0.57 | - | 1.00 | ] | |
| i27 | 1.0 | 1.0 | [ | 0.57 | - | 1.00 | ] | 1.0 | 1.0 | [ | 0.57 | - | 1.00 | ] | 1.0 | 1.0 | [ | 0.57 | - | 1.00 | ] | |
| i28 | 1.0 | 1.0 | [ | 0.57 | - | 1.00 | ] | 1.0 | 1.0 | [ | 0.57 | - | 1.00 | ] | 1.0 | 1.0 | [ | 0.57 | - | 1.00 | ] | |
| i29 | 1.0 | 1.0 | [ | 0.57 | - | 1.00 | ] | 1.0 | 1.0 | [ | 0.57 | - | 1.00 | ] | 1.0 | 1.0 | [ | 0.57 | - | 1.00 | ] | |
| i30 | 1.0 | 1.0 | [ | 0.57 | - | 1.00 | ] | 1.0 | 1.0 | [ | 0.57 | - | 1.00 | ] | 1.0 | 1.0 | [ | 0.57 | - | 1.00 | ] | |
Note: M= mean, V= Aiken, CI= confidence interval, L= lower limit, U= upper limit.
Table 4.
Descriptive statistical analysis of the Envy Questionnaire (ENV-25) items.
| Dimensions | Ítems | Frequency | M | DE | g1 | g2 | h2 | IHC | |||
| 1 | 2 | 3 | 4 | ||||||||
| Cognitive | 8 | 37.2 | 28.8 | 24 | 10 | 2.07 | 1.01 | 0.46 | -0.97 | 0.36 | 0.58 |
| 10 | 38 | 37.2 | 18.8 | 6 | 1.93 | 0.90 | 0.65 | -0.45 | 0.57 | 0.59 | |
| 11 | 38 | 34.4 | 16.8 | 10.8 | 2 | 0.99 | 0.66 | -0.63 | 0.68 | 0.49 | |
| 15 | 47.2 | 32.8 | 12.4 | 7.6 | 1.8 | 0.93 | 0.97 | 0.01 | 0.45 | 0.63 | |
| 18 | 51.6 | 22.8 | 18 | 7.6 | 1.82 | 0.99 | 0.86 | -0.51 | 0.44 | 0.66 | |
| 20 | 42.4 | 29.2 | 21.6 | 6.8 | 1.93 | 0.95 | 0.62 | -0.74 | 0.46 | 0.63 | |
| 22 | 41.2 | 29.2 | 18.8 | 10.8 | 1.99 | 1.02 | 0.64 | -0.79 | 0.53 | 0.62 | |
| 25 | 39.6 | 30.8 | 18.4 | 11.2 | 2.01 | 1.02 | 0.63 | -0.78 | 0.51 | 0.65 | |
| 27 | 34 | 28.8 | 25.6 | 11.6 | 2.15 | 1.02 | 0.36 | -1.06 | 0.61 | 0.59 | |
| 29 | 34.4 | 30.8 | 20.4 | 14.4 | 2.15 | 1.05 | 0.45 | -1.02 | 0.64 | 0.55 | |
Note: Response frequency; 1: never; 2: or almost never; 3: almost always; 4: always; M = mean; SD = standard deviation; g1 = Fisher’s coefficient of skewness; g2 = Fisher’s coefficient of kurtosis; IHC = corrected homogeneity index; h2 = communality.
Table 5.
Descriptive statistical analysis of the Envy Questionnaire (ENV-25) items.
| Dimensions | Ítems | Frequency | M | DE | g1 | g2 | h2 | IHC | |||
| 1 | 2 | 3 | 4 | ||||||||
| Emotional | 3 | 47.6 | 31.6 | 13.2 | 7.6 | 1.81 | 0.94 | 0.95 | -0.07 | 0.61 | 0.48 |
| 5 | 42.4 | 28.8 | 18.8 | 10 | 1.96 | 1.01 | 0.67 | -0.74 | 0.39 | 0.69 | |
| 6 | 50.4 | 29.6 | 15.2 | 4.8 | 1.74 | 0.89 | 0.94 | -0.07 | 0.41 | 0.63 | |
| 9 | 46.8 | 31.2 | 14 | 8 | 1.83 | 0.95 | 0.91 | -0.20 | 0.50 | 0.47 | |
| 13 | 42 | 31.2 | 13.2 | 13.6 | 1.98 | 1.05 | 0.75 | -0.67 | 0.39 | 0.67 | |
| 14 | 37.2 | 26.8 | 24 | 12 | 2.11 | 1.04 | 0.43 | -1.07 | 0.50 | 0.63 | |
| 17 | 50.8 | 28.4 | 14.8 | 6 | 1.76 | 0.92 | 0.97 | -0.09 | 0.49 | 0.57 | |
| 19 | 37.2 | 28 | 20.8 | 14 | 2.12 | 1.06 | 0.47 | -1.05 | 0.48 | 0.65 | |
| 21 | 35.2 | 26.8 | 24 | 14 | 2.17 | 1.06 | 0.37 | -1.14 | 0.45 | 0.60 | |
| 23 | 38 | 30 | 18.4 | 13.6 | 2.08 | 1.05 | 0.56 | -0.93 | 0.54 | 0.57 | |
Note: Response frequency; 1: never; 2: or almost never; 3: almost always; 4: always; M = mean; SD = standard deviation; g1 = Fisher’s coefficient of skewness; g2 = Fisher’s coefficient of kurtosis; IHC = corrected homogeneity index; h2 = communality.
Table 6.
Descriptive statistical analysis of the Envy Questionnaire (ENV-25) items.
| Dimensions | Ítems | Frequency | M | DE | g1 | g2 | h2 | IHC | |||
| 1 | 2 | 3 | 4 | ||||||||
| Behavioral | 1 | 41.6 | 30 | 16 | 12.4 | 1.99 | 1.04 | 0.69 | -0.74 | 0.63 | 0.50 |
| 2 | 45.6 | 28.4 | 20.4 | 5.6 | 1.86 | 0.93 | 0.70 | -0.62 | 0.40 | 0.59 | |
| 4 | 35.6 | 30 | 24.4 | 10 | 2.09 | 1.00 | 0.43 | -0.96 | 0.78 | 0.33 | |
| 7 | 40.4 | 24.8 | 24.4 | 10.4 | 2.05 | 1.03 | 0.48 | -1.05 | 0.40 | 0.44 | |
| 12 | 51.6 | 28.8 | 14.8 | 4.8 | 1.73 | 0.89 | 0.98 | -0.01 | 0.62 | 0.52 | |
| 16 | 48 | 31.2 | 14.4 | 6.4 | 1.79 | 0.92 | 0.93 | -0.10 | 0.55 | 0.56 | |
| 24 | 46.4 | 27.6 | 16.4 | 9.6 | 1.89 | 1 | 0.80 | -0.55 | 0.63 | 0.50 | |
| 26 | 49.2 | 29.6 | 13.6 | 7.6 | 1.8 | 0.95 | 0.96 | -0.11 | 0.60 | 0.55 | |
| 28 | 54 | 28.4 | 6.8 | 10.8 | 1.74 | 0.99 | 1.21 | 0.33 | 0.56 | 0.57 | |
| 30 | 44.8 | 24.4 | 17.6 | 13.2 | 1.99 | 1.08 | 0.66 | -0.91 | 0.73 | 0.45 | |
Note: Response frequency; 1: never; 2: or almost never; 3: almost always; 4: always; M = mean; SD = standard deviation; g1 = Fisher’s coefficient of skewness; g2 = Fisher’s coefficient of kurtosis; IHC = corrected homogeneity index; h2 = communality.
Table 7.
Results of the exploratory factor analysis.
| A. GLOBAL | |||||||
| Model | X 2 | gl | p | SRMR | RMSEA | CFI | TLI |
| Three factors (25 ítems) | 2.991 | 300 | < .001 | 0.039 | 0.054 | 0.939 | 0.919 |
| Three factors (15 ítems) | 6.798 | 105 | < .001 | 0.030 | 0.075 | 0.947 | 0.912 |
Note: X2 = Chi square, df = degrees of freedom, p = significance, SRMR = Standardized Root Mean Square Residual, RMSEA = Squared Error of Approximation, CFI = Comparative Goodness of Fit Index and TLI = Tucker-Lewis Index.
Table 8.
Factor loadings of the three dimensions of the Envy Questionnaire (ENV-25).
| Ítems | Cognitive | Emotional | Behavioral |
|---|---|---|---|
| CG15 | 0.396 | ||
| CG18 | 0.713 | ||
| CG20 | 0.733 | ||
| CG22 | 0.764 | ||
| CG25 | 0.746 | ||
| E6 | 0.530 | ||
| E13 | 0.773 | ||
| E14 | 0.826 | ||
| E17 | 0.634 | ||
| E23 | 0.566 | ||
| C1 | 0.546 | ||
| C2 | 0.419 | ||
| C24 | 0.764 | ||
| C28 | 0.552 | ||
| C30 | 0.357 |
Note: Table prepared by the autor
Table 9.
Confirmatory Factor Analysis of the Envy Questionnaire (ENV-25).
| Model | X2 | gl | CFI | TLI | SRMR | RMSEA |
|---|---|---|---|---|---|---|
| One-dimensional (15 ítems) | 287 | 90 | 0.921 | 0.908 | 0.0432 | 0.07 |
| 3 factors (15 ítems) | 269 | 87 | 0.927 | 0.912 | 0.0418 | 0.0685 |
Note: X2 = Chi square, df = degrees of freedom, p = significance, SRMR = Standardized Root Mean Square Residual, RMSEA = Squared Error of Approximation, CFI = Comparative Goodness of Fit Index and TLI = Tucker-Lewis Index
Table 10.
Factor loadings of the three dimensions of the Envy Questionnaire (ENV-25) (ENV-25).
| Ítems | Cognitive | Emotional | Behavioral |
|---|---|---|---|
| CG11 | 4.067 | 5.39e-4 | |
| CG14 | 4.185 | 0.01663 | |
| CG16 | 1.307 | 126.915 | |
| CG18 | 2.808 | 0.01922 | |
| CG21 | 1.037 | 187.103 | |
| E5 | 2.057 | 480.367 | |
| E9 | 0.156 | 7.27e-8 | |
| E10 | 0.144 | 0.04057 | |
| E13 | 5.193 | 388.411 | |
| E19 | 0.912 | 0.00163 | |
| C1 | 54622 | ||
| C2 | 21.330 | ||
| C20 | 242.411 | ||
| C24 | 31.958 | ||
| C25 | 0.442 |
Note: Table prepared by the autor.
Table 11.
Evidence of validity of the envy questionnaire (ENV-25) with another external variable.
| (ENV-25 - CEA) | |||
|---|---|---|---|
| ENVY (ENVI) | Rho de spearman | 0.017 | |
| r2 | 0.000289 | ||
| Sig. (bilateral) | < .001 | ||
| N | 250 | ||
Note. * p < .05, ** p < .01, *** p < .001
Table 12.
Internal consistency reliability of the Envy Questionnaire (ENV-25).
| Dimensions | Coefficient ω | ítems |
|---|---|---|
| Cognitive | .795 | 5 |
| Emotional | .790 | 5 |
| Behavioral | .717 | 5 |
| Total | .905 | 15 |
Note: Reliability; ω: Omega coefficient.
Table 13.
Percentile norms of the Envy Questionnaire (ENV-25).
| PC | Cognitive | Emotional | Behavioral | Total |
|---|---|---|---|---|
| 100 | 20 | 20 | 20 | 60 |
| 95 | 15 | 15 | 14 | 43 |
| 90 | 14 | 14 | 13 | 39 |
| 85 | 13 | 13 | 12 | 37 |
| 80 | 12 | 12 | 11 | 35 |
| 75 | 11 | 11 | 11 | 33 |
| 70 | 11 | 11 | 10 | 31 |
| 65 | 10 | 10 | 10 | 30 |
| 60 | 9 | 10 | 9 | 28 |
| 55 | 9 | 9 | 9 | 26 |
| 50 | 8 | 9 | 8 | 25 |
| 45 | 8 | 8 | 8 | 24 |
| 40 | 7 | 8 | 8 | 23 |
| 35 | 7 | 7 | 7 | 22 |
| 30 | 6 | 7 | 7 | 21 |
| 25 | 6 | 6.25 | 6 | 19 |
| 20 | 6 | 6 | 6 | 18 |
| 15 | 5 | 5 | 6 | 17 |
| 10 | 5 | 5 | 5 | 16 |
| 5 | 5 | 5 | 5 | 15 |
| N | 446 | 446 | 446 | 446 |
| Average | 8.86 | 9.2 | 8.71 | 26.8 |
| Mode | 5 | 5 | 6 | 15 |
| DS | 3.28 | 3.35 | 2.93 | 8.73 |
| Minimum | 5 | 5 | 5 | 15 |
| Maximum | 20 | 20 | 20 | 60 |
Disclaimer/Publisher’s Note: The statements, opinions and data contained in all publications are solely those of the individual author(s) and contributor(s) and not of MDPI and/or the editor(s). MDPI and/or the editor(s) disclaim responsibility for any injury to people or property resulting from any ideas, methods, instructions or products referred to in the content. |
© 2025 by the authors. Licensee MDPI, Basel, Switzerland. This article is an open access article distributed under the terms and conditions of the Creative Commons Attribution (CC BY) license (http://creativecommons.org/licenses/by/4.0/).
Copyright: This open access article is published under a Creative Commons CC BY 4.0 license, which permit the free download, distribution, and reuse, provided that the author and preprint are cited in any reuse.


