
Submitted:
23 May 2025
Posted:
26 May 2025
You are already at the latest version
Abstract
The naturally occurring radioactive gas radon presents a major public health danger mainly affecting people who spend time in poorly ventilated buildings. The periodic table includes radon as a noble gas which forms through uranium decay processes in soil and rock and water. The accumulation of radon indoors in sealed or poorly ventilated areas leads to dangerous concentrations that elevate human health risks of lung cancer. The research examines environmental variables affecting radon concentration indoors by studying geothermal installations and their drilling activities which potentially increase radon emissions. The key findings showed that radon levels peak at cold days where the concentration had a mean value of 41.5 Bq/m³ and maxed at about 95 Bq/m³. The reason was first and foremost poor ventilation and pressure difference. The lowest concentrations were on days with increased human activity with measures that had a mean value of 14.8 Bq/m³, which is about 65% reduced. The results that are presented confirm the hypotheses and the study is making clear that ventilation and human activity are crucial in radon mitigation, especially on geothermal and energy efficient structures.
Keywords:
radon
; air quality
; ventilation
; human activity
; heating
; geothermal
; natural radioactivity
1. Introduction
As the fifth most abundant gas in the earth’s crust, radon (Z = 86) is a noble gas and has been identified as a major source of indoor radiation exposure [1]. It has been established by the World Health Organization that radon is the second most significant cause of lung cancer next to smoking [2]. This is due to the fact that people spend a significant amount of their time indoors, thus it is important to assess the concentration of radon in residential and occupational areas for public health purposes [3].
There are two isotopes of radon, namely, ²²²Rn (from the uranium-238 decay chain via the ²²⁶Ra channel) and ²²⁰Rn, also referred to as thoron from the thorium-232 decay chain via the ²²⁴Ra channel [4]. The half-lives of these two isotopes are 3.8 days for ²²²Rn and 55 seconds for ²²⁰Rn which have a significant impact on their distribution in the environment [4]. Due to its inert nature, radon is emitted from solid matrices like soil, rocks and building materials and is transported in the subsurface as a carrier gas (e.g., CO₂) or through groundwater [5].
The rates of radon emission vary significant and are influenced by temperature, humidity, porosity and mineral composition of soil and rock. The emission coefficients for soil and rock are between 0.1% and 40% [6]. The main sources of radon in homes are:
From the ground and the rocks under the buildings, where the gas enters through cracks, joints and around pipes. It is most dangerous in basements and cellars.
Construction materials, especially those that are naturally mineral based. In temperate climates, the indoor radon concentration from these materials can account for as much as 20% of the total radon concentration in homes [2].
Domestic water supplies, where radon dissolved in groundwater are released when household activities such as showering take place thus increasing the concentration of radon in the air locally [2].
To prevent to prevent the health risks which has been suggested by the WHO to a maximum annual average indoor radon level of 100 Bq/m³, it is possible to determine the level of radon using the active methods (alpha spectrometry) or the passive methods (activated carbon detectors) [7].
As far as the reduction of indoor radon pollution is concerned, it is a big problem. The two major methods of reducing the levels of indoor radon are: (1) reducing the entry of radon into buildings and (2) increasing the rate of air exchange in the indoor environment [8]. To reduce entry from soil and rock interstitial air, a barrier that is impermeable can be placed between the ground and the building foundation. Such methods of sub-slab depressurization systems or other active soil suction techniques can remove radon before it enters the interior space [3,9].
Ventilation works best to reduce radon emissions from building materials and domestic water sources. The combination of natural and mechanical ventilation systems works well to prevent radon accumulation in warm climates. The requirement for energy efficiency in cold climates necessitates mechanical ventilation systems to bring fresh radon-free air into buildings while removing radon-contaminated air [10].
The human body absorbs radon and its short-lived decay products mainly through inhalation and consumption while exposing individuals to serious health threats. Prolonged radon exposure at elevated levels within unventilated houses leads to an increased risk of developing lung cancer [11]. Radon creates no environmental compounds because it is a noble gas and does not bind to microbes or plants or sediments which enables it to easily move from its formation locations into the atmosphere [12].
The process of radon formation takes place within soil mineral grains or organic matter before it diffuses into adjacent air-filled and water-containing pore spaces. Soil water and air partition according to Henry’s law before radon diffuses to the surface through either advective flow or diffusion based on soil permeability [13]. The movement of radon from its source can reach distances of hundreds of kilometers [6,15].
Underneath buildings radon continues to form constantly in the underlying soil. Radon can easily move into indoor areas because even the slightest negative indoor pressure allows it to pass through foundation cracks, joints and pipe penetrations [3]. The concentrations of radon indoors become hundreds of times greater than outdoor radon levels [16]. Workers in underground workplaces face additional exposure dangers because of inadequate ventilation and proximity to radon emission sources. The process of water consumption leads to the release of dissolved radon into indoor air [11].
According to the United Nations Scientific Committee on the Effects of Atomic Radiation (UNSCEAR), radon stands as the leading cause of natural radiation exposure affecting both workers and general population members [11]. The radiation dose received by mine workers comes mostly from radon which comprises about 80% [14]. The general population receives about 50% of their natural radiation exposure from radon present in indoor air. Finland stands out as a country where indoor radon exposure creates more than half of total radiation doses that exceed medical, industrial and nuclear fallout contributions [11]. The exposure of people who consume radon-rich borehole water reaches elevated levels because this group makes up only 4% of the total population [17]. Radiation protection authorities worldwide recognize radon mitigation and public protection as their top priorities because of health concerns and exposure risks.
2. Materials and Methods
2.1. Measurement Site and Setup
A monitoring device was installed in the basement of the plumbing educational building at the Aristotle University of Thessaloniki to evaluate the potential impact of geothermal activity on indoor radon levels since the building is equipped with a geothermal heating system. The location was selected because it was near the geothermal infrastructure to observe radon emissions that could be related to geothermal operations [18].
The device was strategically placed next to the geothermal system’s piping where the highest likelihood of radon leakage was anticipated. The installation site was determined based on structural assessments of the basement layout and consultation with facility engineers to ensure accurate and reproducible measurement conditions. The goal was to obtain representative radon concentrations under real operational conditions to enable a comparative analysis between geothermal proximity and indoor radon activity levels [19].
2.2. Instrumentation and Data Collection Procedure
A high-precision digital radon detector based on a pulsed ionization chamber served as the instrument for this research. The device provides readings within one hour and it refreshes measurements every 10 minutes by using a moving one-hour average. The device provides measurement accuracy of ±10% at 370 Bq/m³ reference concentration while its range extends from 1 to 3700 Bq/m³. The device supports bluetooth data communication which enables real-time monitoring and smartphone application-based data retrieval.
The device received its installation on a flat stable surface inside the plumbing building basement where it is positioned near the geothermal heating system pipes. The monitoring accuracy required all windows and doors to remain closed throughout the period to prevent external airflow from affecting indoor radon concentrations. The device received power from a 12VDC adapter which provided continuous power supply for uninterrupted data acquisition.
2.3. Measurement Protocol
The measurement campaign spanned 150 days while collecting data every week to detect both short-term and long-term radon level changes that might link to geothermal system operation. The measurement site near the geothermal pipes was selected because previous research showed that geothermal systems influence local radon emissions through subsurface fracture networks and elevated temperatures and fluid movements [20].
The measurement unit displayed radon concentration in Becquerels per cubic meter (Bq/m³) to meet international radiological protection standards.[21] The collected data underwent analysis to study time-dependent patterns and system operational cycles for detecting radon spikes when geothermal operations increased [22].
2.4. Environmental and Operational Influences
Environmental and operational elements together with other factors helped to determine the radon measurement results. Radon, which is a radioactive noble gas that develops from uranium decay in rocks and soils enters buildings through floor cracks and pipe gaps and unsealed foundations [23]. People cannot detect this substance because it exists without color or smell, but its presence can be revealed through active measurement [24].
The process of radon migration strongly depends on temperature conditions. Radon entry into buildings increases when pressure differences between indoor and outdoor air develop because of temperature differences between seasons. Natural ventilation through open windows and increased air exchange during warmer months results in reduced indoor radon concentrations [25].
Indoor radon accumulation can be best controlled through proper ventilation systems. Buildings with limited ventilation systems tend to have elevated radon concentrations yet mechanical ventilation systems including HVAC or exhaust fans work to decrease indoor radon concentrations to safer amounts. The systems can create hazardous radon accumulation when they remain inactive or when their maintenance is improper [26].
Heating systems operating with forced air distribution methods help move radon-contaminated air throughout the entire building. Heating operations that cause temperature changes in the air affect pressure gradients which modify radon entry patterns [27].
Measurements of radon concentrations show changes due to human activities that take place inside the building. The movement of people combined with door usage and regular occupancy helps enhance air circulation which leads to decreased radon concentrations. Abandoned spaces along with inactive periods tend to have higher radon levels because their indoor air remains stagnant [28].
The geological features of the measurement location play a vital role in determining radon behavior patterns. Regions containing uranium-rich bedrock along with permeable soils enable more efficient radon migration toward the Earth’s surface [29]. The examination of geothermal activity and radon emissions takes place within this specific environmental context.
To systematically investigate these parameters and their relationships, five unique days were selected from the data set, each representing a different environmental and operational situation. These selected days include a weekday with high occupancy, a Sunday with zero activity, a day with particularly low outdoor temperatures, a day when the heating system was operating, and a typical day showing radon fluctuations. These selections were designed to ensure that the study would capture changes in radon concentration under various ventilation patterns, heating influences, and human activity levels. The selection of these days allows for a comparative analysis showing the extent to which external and internal variables affect radon accumulation and diffusion.
The relationships between radon levels and these environmental variables will be examined in depth using graphical representations depicting their behavior over 24-hour cycles. These diagrams will correspond to the following hypotheses, allowing for comparative data analysis and a better understanding of the dynamic interactions that affect indoor radon concentrations.
H1: Radon concentrations are higher on colder days due to reduced ventilation and increased temperature differences [29].
H2: Periods of low activity, such as vacations or holidays, lead to increased radon accumulation due to stagnant air [30].
H3: The activation of heating systems leads to temporary increases in radon levels due to air mixing and pressure changes [25].
H4: Increased human activity and ventilation reduce radon concentrations by enhancing air circulation [31].
H5: Radon concentrations follow diurnal fluctuations, with higher levels during the night hours due to reduced ventilation and lower values during the day, when human activity and natural ventilation are increased [32].
The aim of the research in evaluating the data from these selected days is to capture the variations in radon levels under various scenarios and environmental conditions. The findings of these investigations will help advance our understanding of the behavior of radon indoors, thereby contributing to efforts to design more effective radon reduction and air quality management measures.
To confirm the hypotheses developed in the previous section, a series of data-driven investigations were carried out using radon measurements collected over a specific period. Five critical days were selected for a full examination, each reflecting a different activity and environmental situation. These include a weekday with high occupancy, a weekend with little activity, a holiday with no human presence, a day with low outdoor temperatures and a day when the heating systems were on.
Changes in radon concentration during these days were graphically depicted in 24-hour cycles. The study focuses on identifying trends, such as the effect of human activity on air circulation, the relationship between heating system operation and radon levels, and the role of ventilation in reducing indoor radon accumulation. Each graph depicts how radon behaves under various conditions, allowing for comparison of different factors that affect it.
The purpose of these diagrams is to assess whether the hypotheses are accurate. The findings will serve as a foundation for the evaluation and conclusions in the next section, where each hypothesis will be assessed for its validity and implications.
Figure 1.
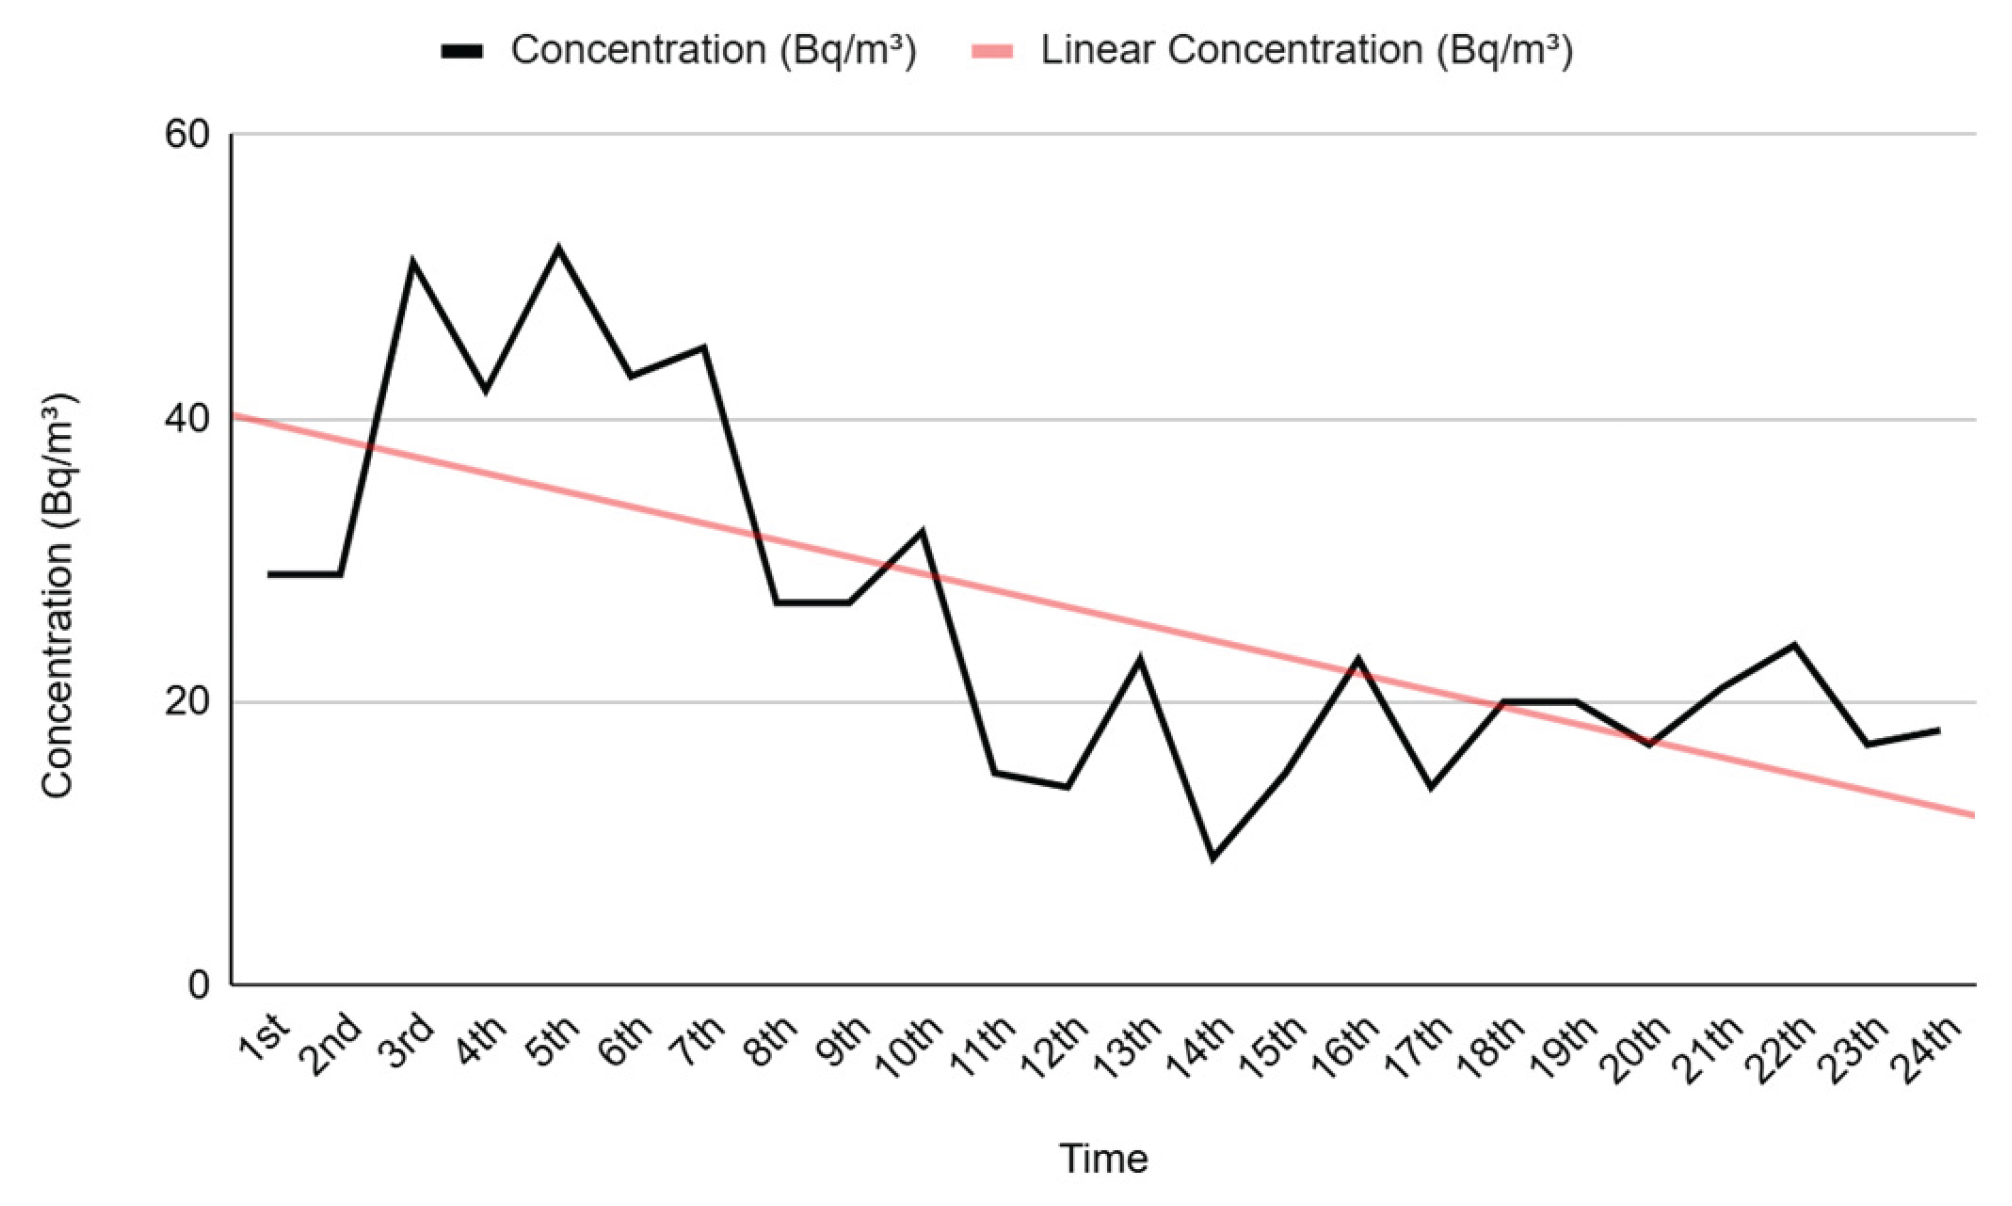
The figure presents the changes in radon concentration during a cold day to test the hypothesis that low temperatures increase radon levels because of reduced ventilation and temperature differences.
Figure 1.
The figure presents the changes in radon concentration during a cold day to test the hypothesis that low temperatures increase radon levels because of reduced ventilation and temperature differences.
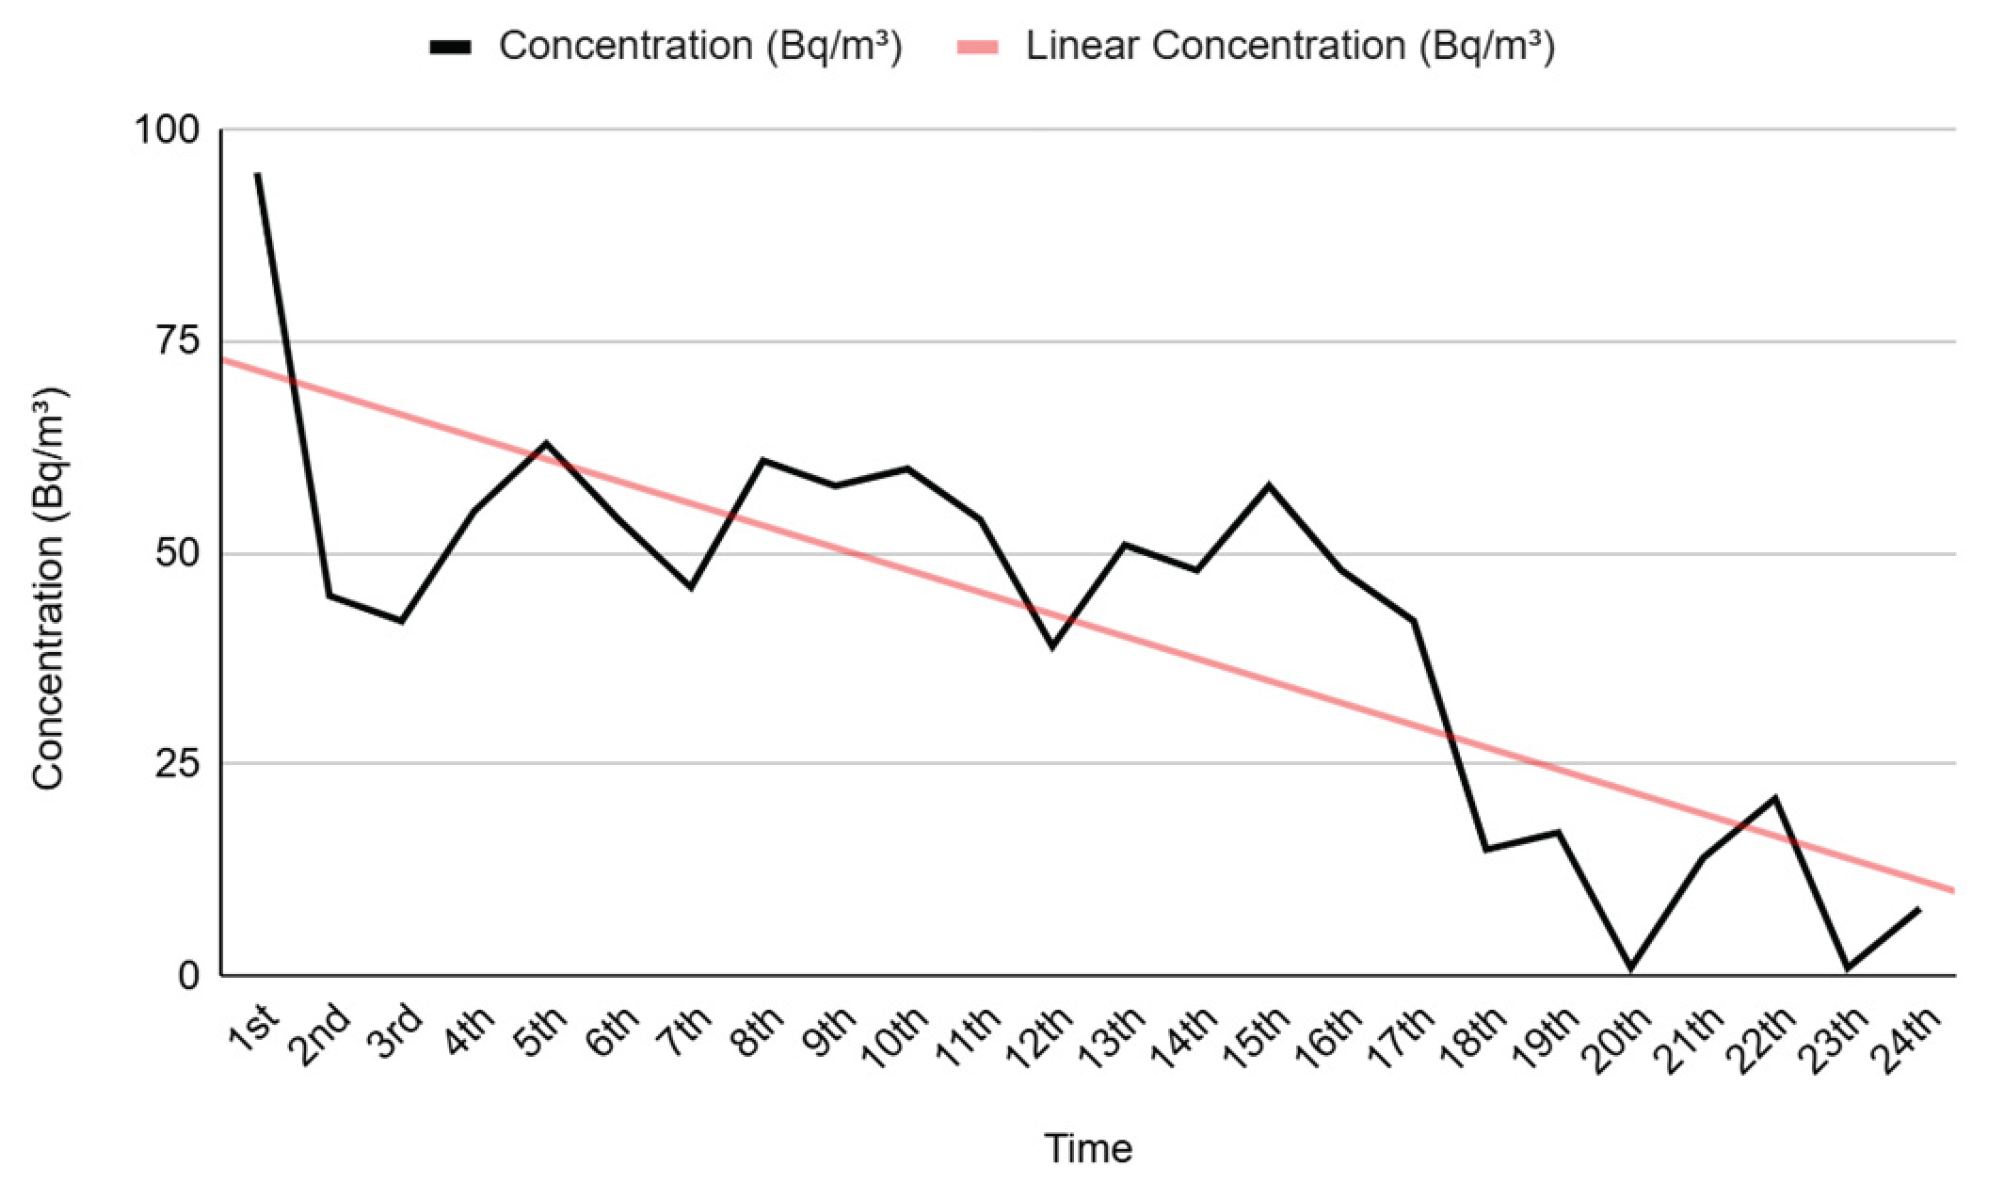
The measurements show that radon concentrations reach their highest levels during the first part of the day. The concentrations decrease gradually after reaching their peak levels in a pattern that matches the linear trend. The radon accumulation at the beginning of the day occurs because the space remains sealed and air exchange rates decrease during nighttime.
The day-by-day reduction in concentrations occurs because brief ventilation episodes and indoor condition modifications enable gas removal. The high initial radon concentrations support the hypothesis that cold temperatures allow radon accumulation because low outdoor temperatures restrict ventilation and create pressure differences that influence radon transport into buildings.
The collected data confirms that radon concentrations rise on cold days thus requiring proper ventilation and indoor air quality control measures.
Figure 2.
The results from diagram 2 show the radon concentration during a holiday, specifically Sunday, and tests the hypothesis that periods of low activity led to increased radon accumulation due to limited air circulation.
Figure 2.
The results from diagram 2 show the radon concentration during a holiday, specifically Sunday, and tests the hypothesis that periods of low activity led to increased radon accumulation due to limited air circulation.
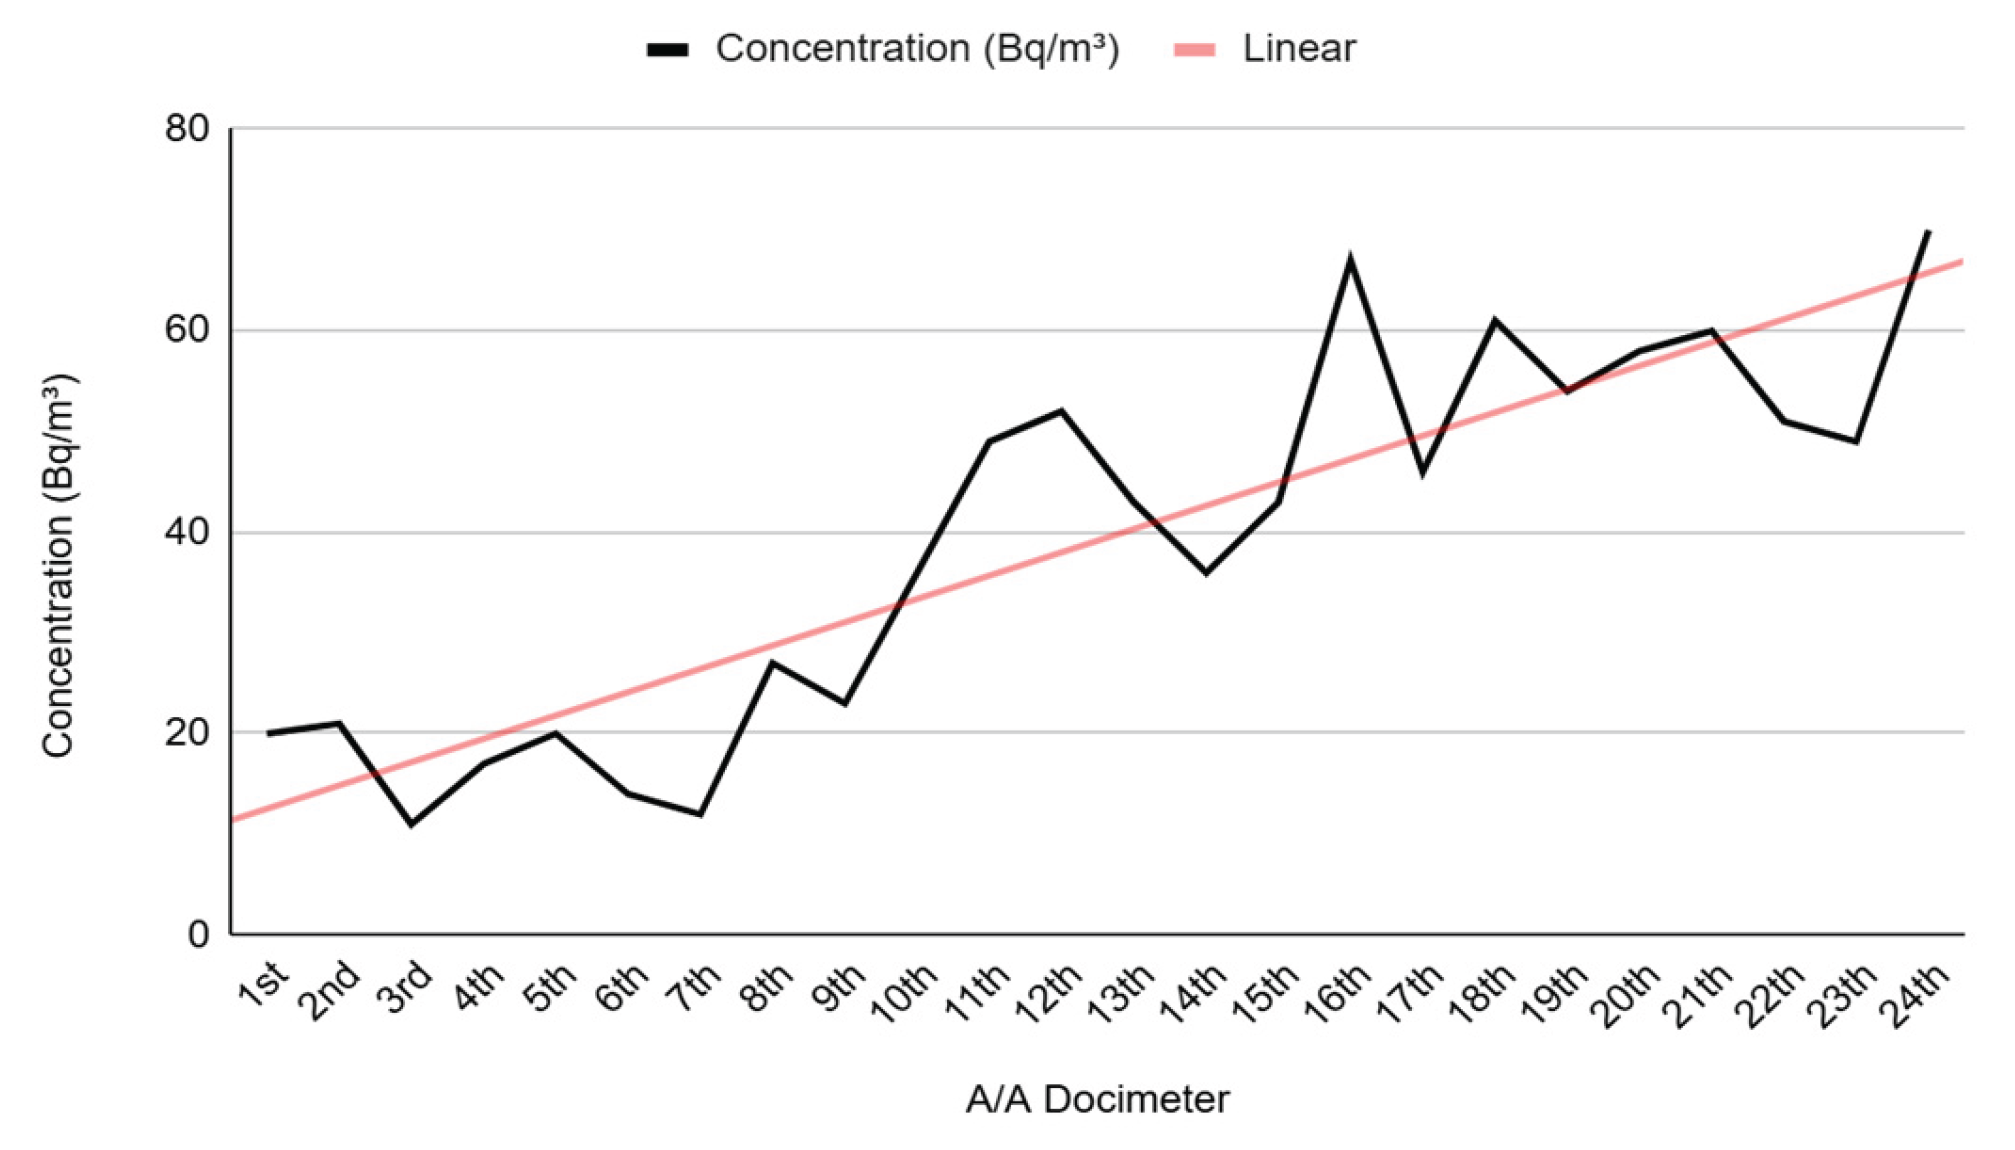
The graph shows radon concentration rising steadily throughout the day while the linear trend shows a positive slope. The observed radon concentration rise matches the hypothesis that reduced air exchange and limited activity and no ventilation during holidays cause radon to build up in indoor spaces.
The concentration shows occasional variations which could stem from brief changes in air circulation patterns or environmental elements. The overall upward trend indicates that both human inactivity and restricted air renewal play essential roles in raising radon concentrations.
These data validate the hypothesis about low activity periods resulting in radon accumulation which supports the requirement for proper ventilation systems during periods of reduced human occupancy.
Figure 3.
Diagram 3 shows the variation of radon concentration during the day, under the influence of the operation of heating systems. The recording of radon concentration shows strong fluctuations during the first hours, with the appearance of several peaks, which suggests that heating may be associated with increased emissions or changes in the concentration of the gas due to turbulence in the indoor air.
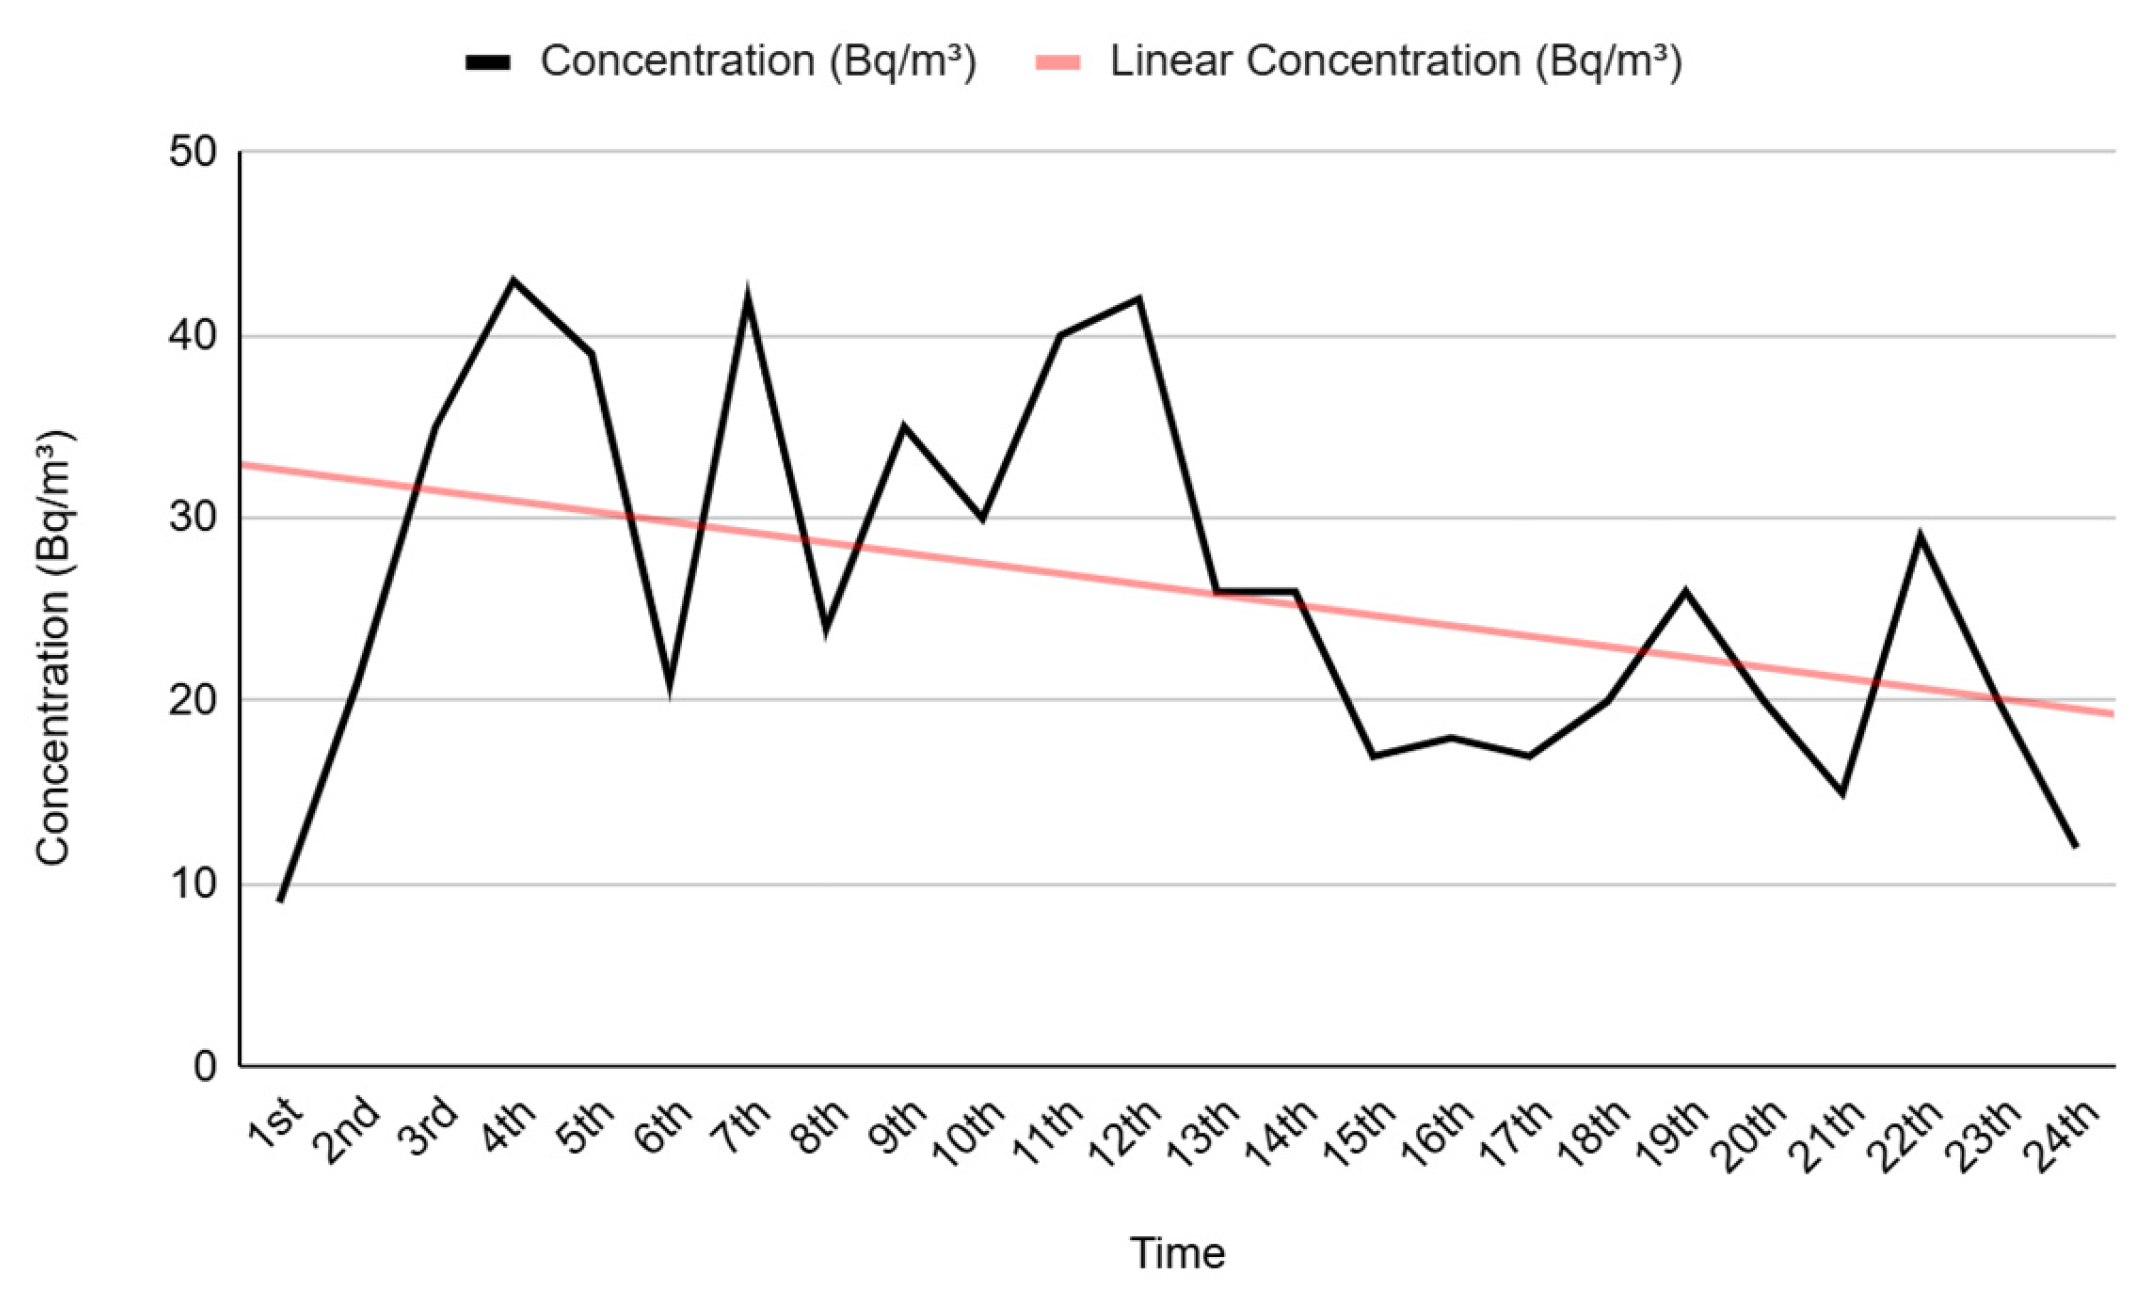
The diagram shows a general decrease in concentration throughout the day through its linear trend. The observed radon concentration decrease may result from the establishment of a dynamic equilibrium between radon concentration and air exchange or modifications in heating operations during daytime hours.
The observed time period shows that warming onset leads to short-term radon concentration increases which align with the hypothesis predictions. Additional research along with environmental and operational factor analysis is needed to determine the specific cause of these concentration variations.
The relationship between human activity and radon concentration shows variations through Figure 4 which presents radon level changes during a busy day. According to Hypothesis 4 the combination of more activity and better ventilation helps decrease radon concentration through improved air circulation.
Figure 4.
1 weekday with high human activity.
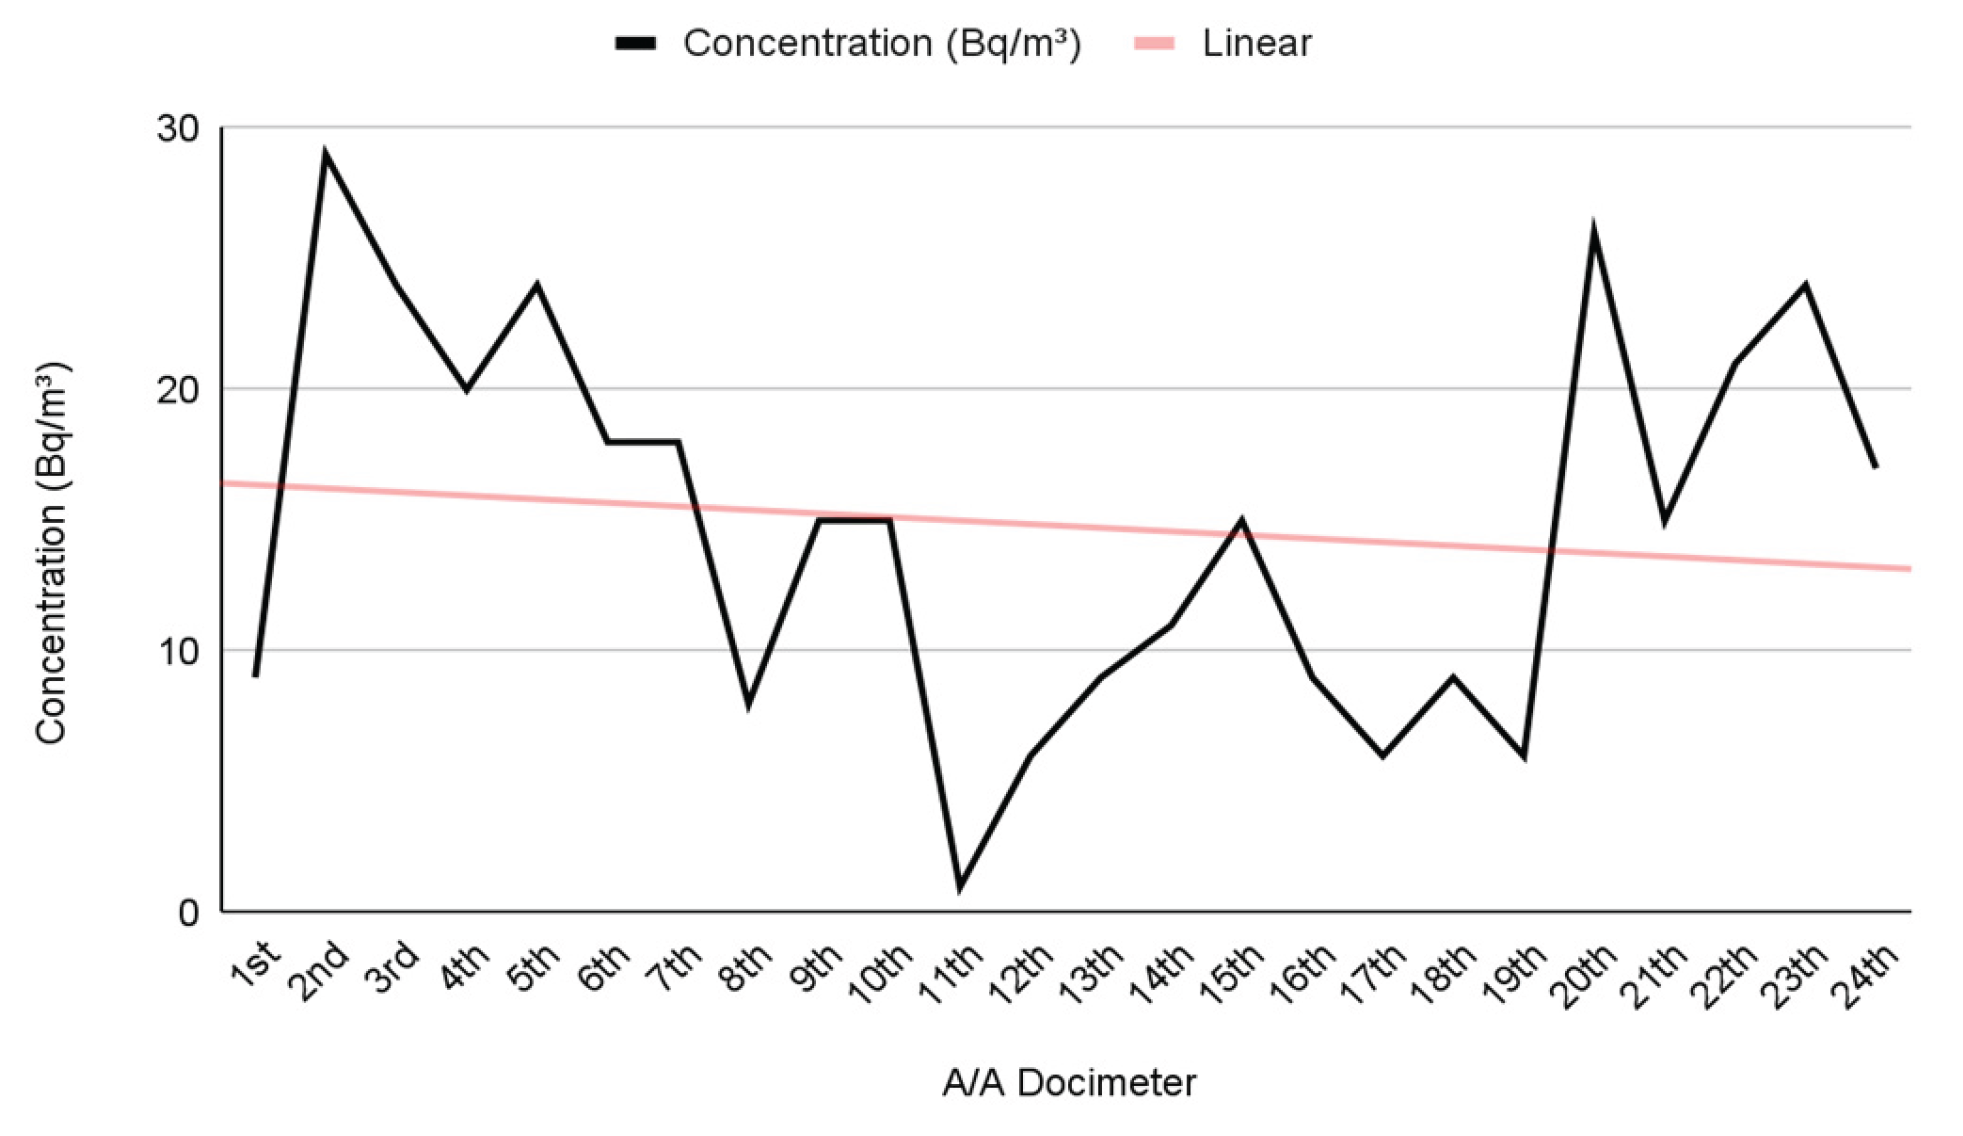
The radon concentration shows distinct changes throughout the day with rising and falling patterns. The minimum radon values appear at various times because continuous air movement creates conditions that decrease radon concentrations inside the building space. The highest radon readings appear at times when ventilation decreases, or air circulation stops.
The diagram shows a straight line that indicates radon levels decrease briefly during increased activity, but this does not produce a steady downward pattern. The ongoing radon emissions from soil and building materials function as counteracting factors that prevent ventilation from eliminating radon presence.
The analysis of data reveals that human activity together with ventilation affects radon concentration, but the effect remains partial. The data supports Hypothesis 4 because radon concentration decreases but the evidence does not show enough support to prove ventilation eliminates radon from the indoor space.
Figure 4.
The graph demonstrates the typical 24-hour radon concentration pattern which matches the theoretical prediction of increased radon levels at night and decreased levels during daytime.
Figure 4.
The graph demonstrates the typical 24-hour radon concentration pattern which matches the theoretical prediction of increased radon levels at night and decreased levels during daytime.
The radon concentrations begin the 24-hour period at elevated levels which show multiple fluctuations because the gas accumulated during hours with minimal ventilation. The initial peaks in radon concentration appear because ventilation remains poor, and air stagnates within indoor spaces.
The radon concentration decreases steadily throughout the day because human activity increases and natural or artificial ventilation becomes more effective. The downward trend shown in the dotted line demonstrates that radon concentration levels decrease throughout the day.
The middle section of the 24-hour period shows minor variations because air circulation patterns might shift, or heating and air conditioning systems could be operating. The values show stabilization or a minor increase during the last part of the period because ventilation decreases during evening hours.
The diagram supports the investigated hypothesis by demonstrating that radon concentrations increase at night because of poor ventilation while they decrease throughout the day because of better air circulation.
Figure 5.
Correlation 1 & 2.
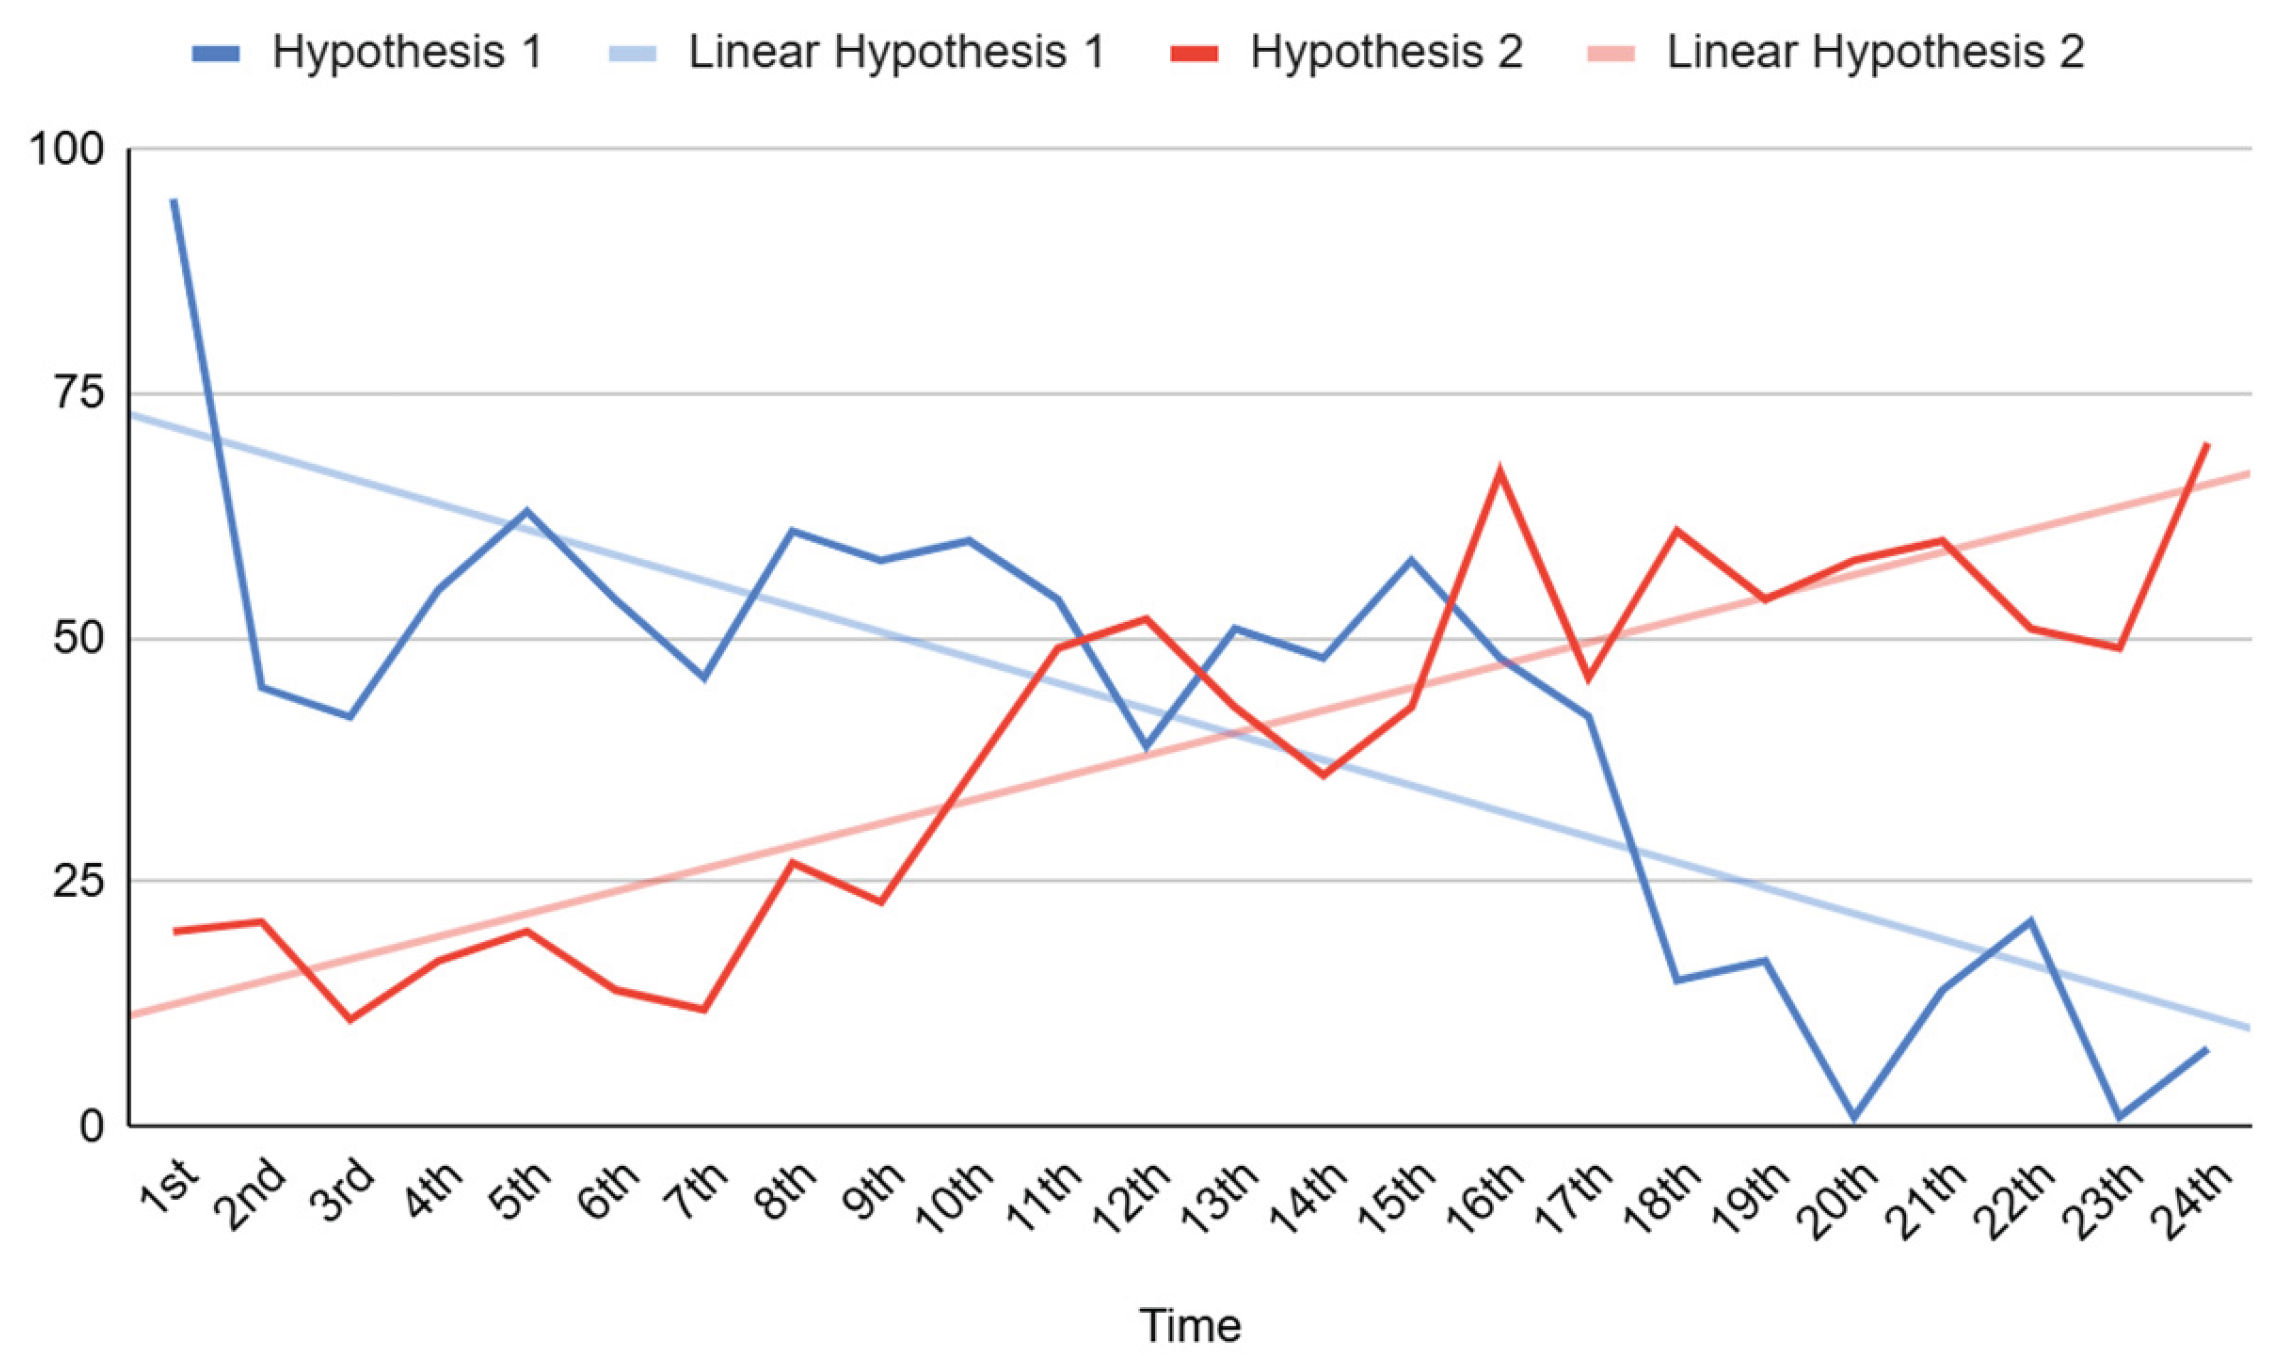
The correlation analysis presented in Figure 6 demonstrates opposing patterns between the two hypotheses regarding radon concentrations. The first hypothesis proposes that radon levels increase on colder days because ventilation decreases, and temperature differences become more pronounced. The second hypothesis states that radon accumulation rises during holidays because the air remains stagnant.
Figure 6.
Correlation 1 & 3.
The graphical illustration demonstrates that the first hypothesis curve decreases which suggests radon concentration levels decrease because of enhanced air exchange throughout the day. The second hypothesis curve demonstrates an upward direction which shows that radon concentrations rise when human activities decrease.
The opposing patterns between these two mechanisms could be caused by different factors that affect radon concentration levels. The gas retention indoors becomes more effective during cold temperatures and ventilation limitations during off-season periods lead to increased gas concentration. The different trends between these two hypotheses indicate that understanding radon accumulation requires analyzing temperature and ventilation conditions together.
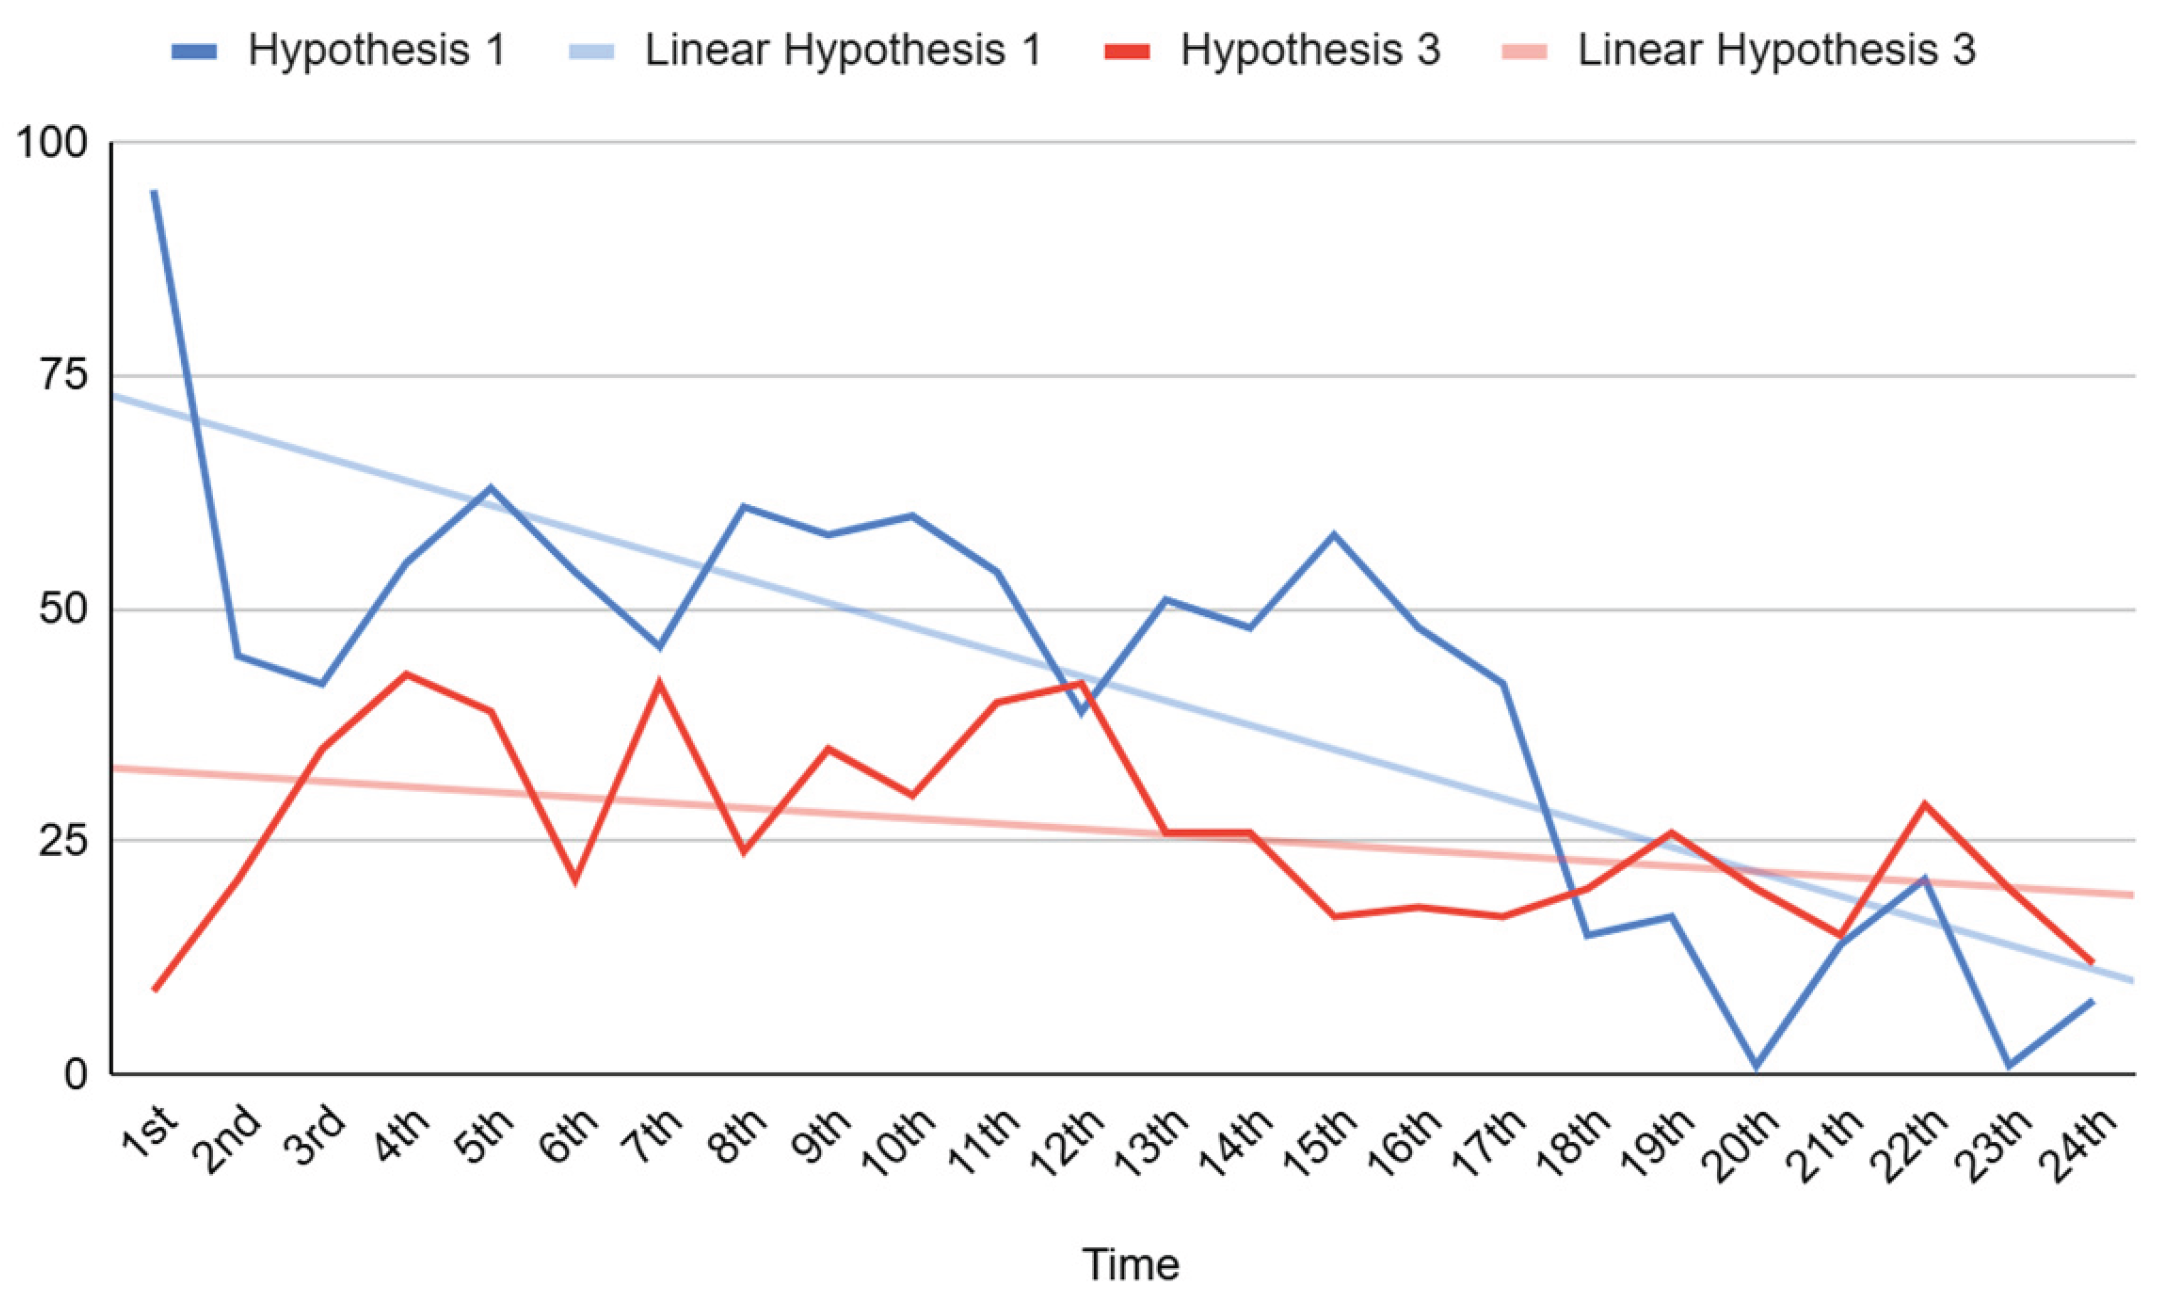
The connection between hypotheses 1 and 3 investigates the relationship between temperature fluctuations and heating system operation on radon concentration levels. Hypothesis 1 predicts that radon concentrations increase when temperatures drop because ventilation decreases while temperature differences enhance radon gas transport between buildings and the ground. Hypothesis 3 proposes that heating system activation leads to brief radon increases because of air circulation and pressure variations.
The curve of hypothesis 1 in diagram 7 demonstrates elevated radon concentrations at the start of the day which then decreases progressively to show radon accumulation patterns during cold temperatures. The curve of hypothesis 3 demonstrates minor variations which represent the impact of heating on gas distribution patterns. The trend lines demonstrate that radon levels rise from both factors, yet the cold environment maintains stable concentrations while heating produces brief variations.
Low temperatures elevate the standard radon concentration while heating system activation produces brief peaks because of air circulation and internal pressure variations. The general decline in both cases appears to result from increased daily ventilation or equalization of atmospheric pressure.
Figure 6.
Correlation 2 & 4.
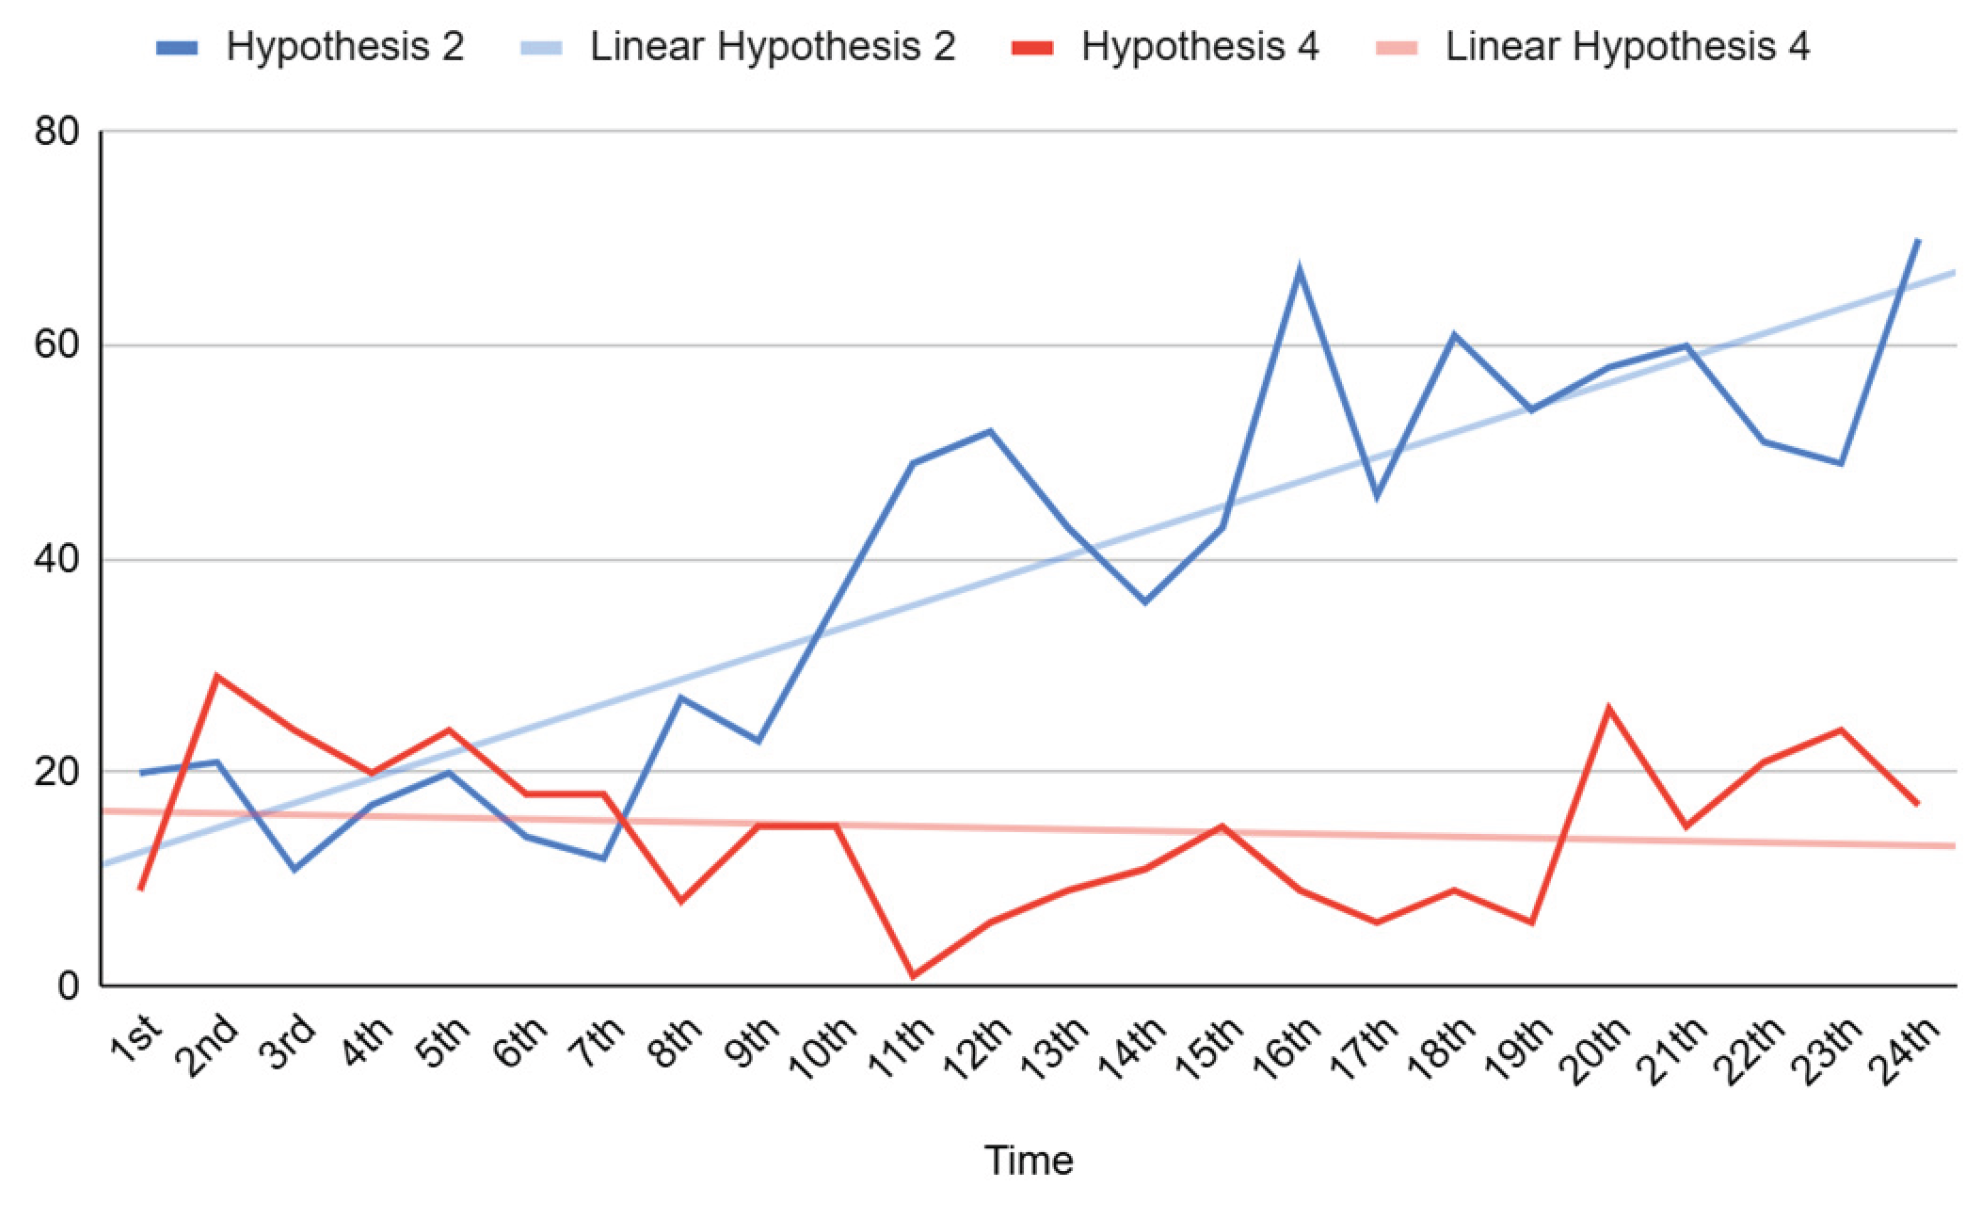
Figure 7.
Correlation 3 & 5.
The graph in Figure 8 shows radon concentration measurements between low human activity times and high human activity times with improved ventilation systems. Radon concentration shows a steady rise in the first scenario because of the lack of ventilation and decreased air movement enabling the gas to build up inside indoor spaces.
Figure 8.
Correlation 4 & 5.
The high human activity conditions result in stable and significantly lower radon concentrations which supports the hypothesis that ventilation together with air mobility work as radon removal systems. The first case shows a linear trend that increases steadily which supports the idea that enclosed spaces with air will cause radon concentrations to rise continuously.
The analysis of these two hypotheses shows how human activity affects radon levels and proves that ventilation systems both natural and artificial play a crucial role in controlling indoor gas concentrations.
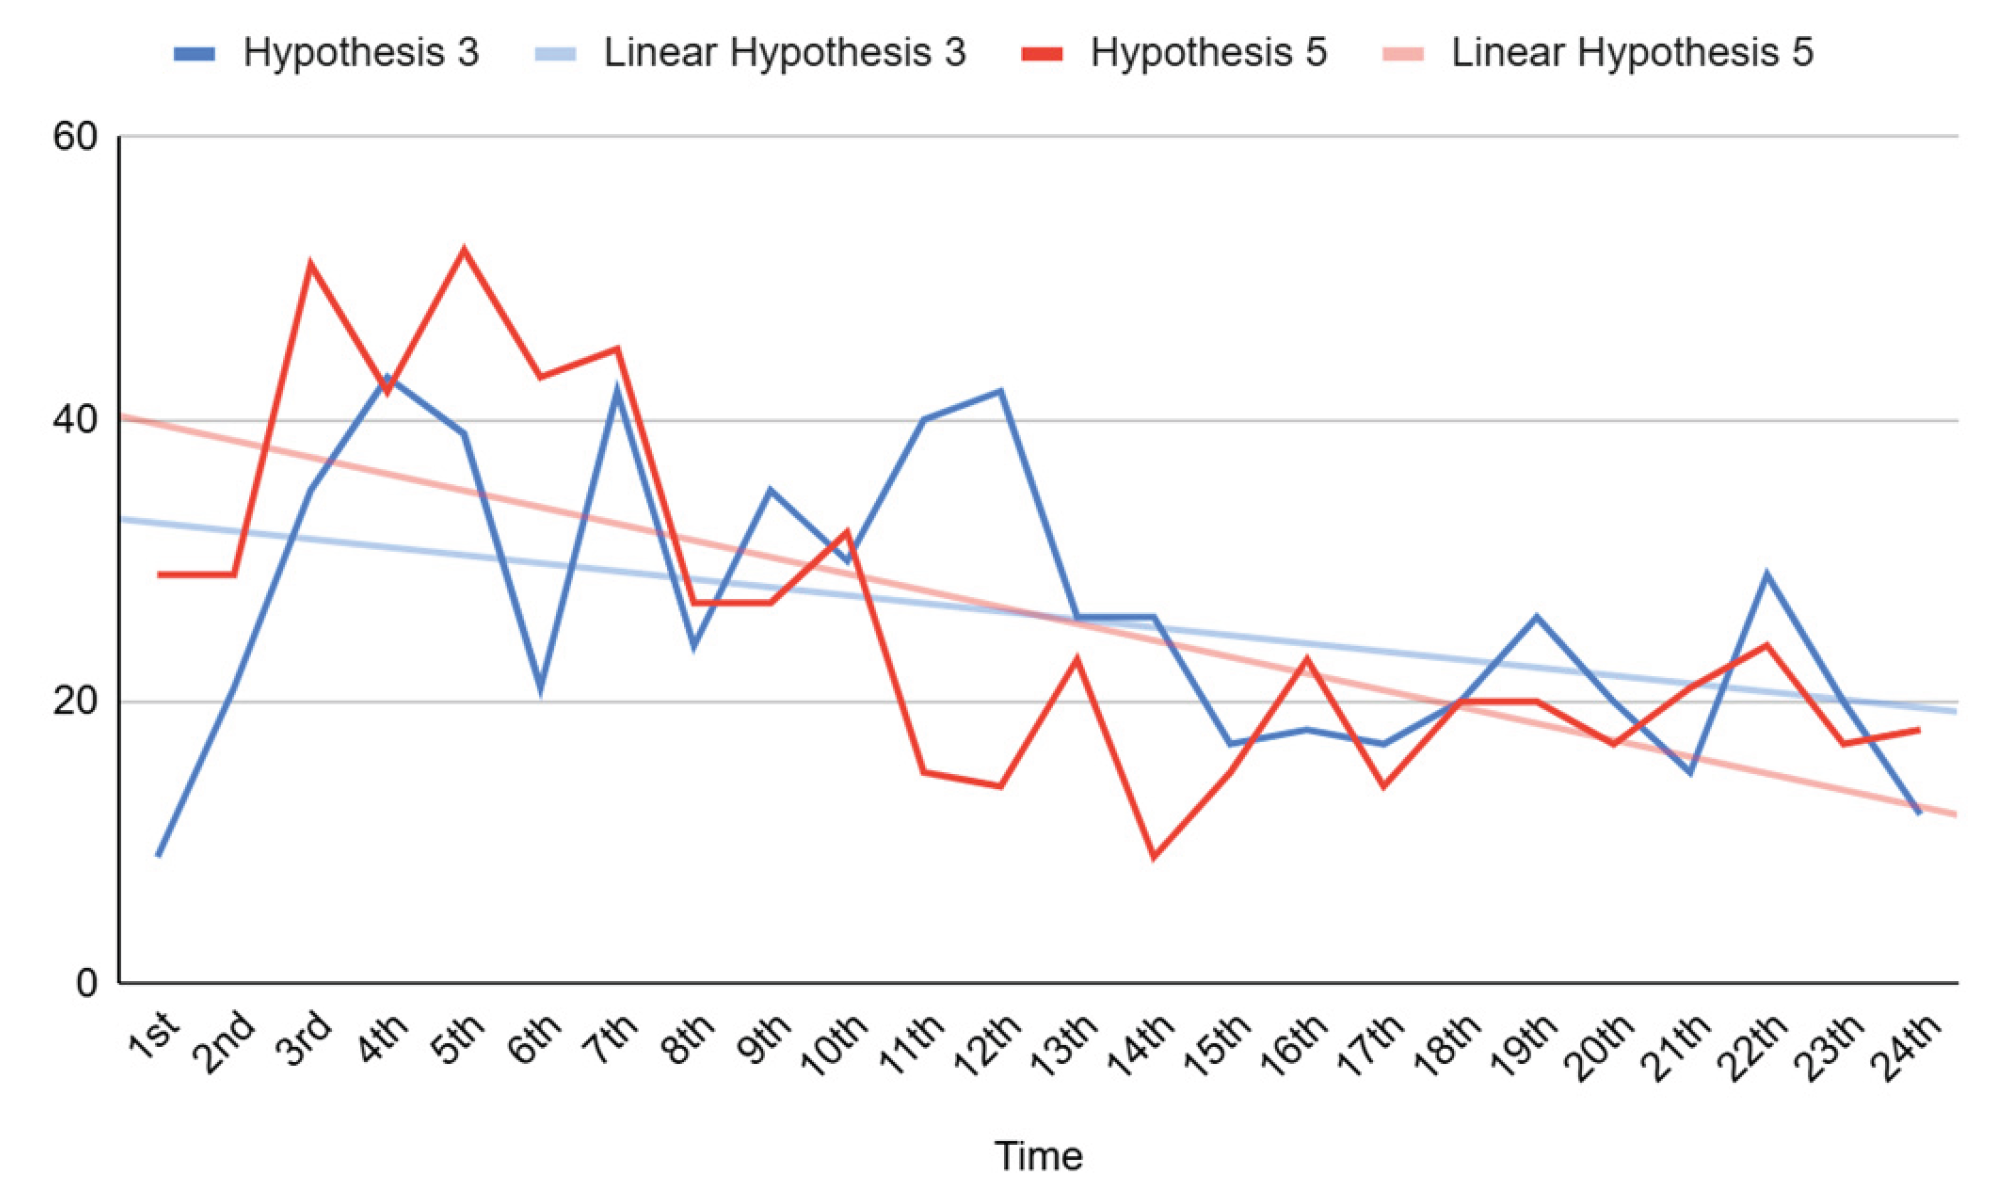
The comparison between hypotheses 3 and 5 in Figure 9 demonstrates how radon concentration changes when environmental conditions differ. The activation of heating systems under hypothesis 3 leads to short-term radon level increases because of air recirculation and pressure changes. The fifth hypothesis studies how radon concentrations change throughout the day by showing higher nighttime values because of reduced ventilation and lower daytime values because of increased human activity.
The diagram displays significant changes in radon concentration through its visual presentation of both hypotheses. The early morning hours produce peaks in hypothesis 5 which matches the theoretical explanation of nighttime radon concentration elevation due to minimal air renewal. The time series data in hypothesis 3 demonstrates sudden spikes which support the hypothesis that heating system activation produces these effects.
The two data trend lines demonstrate a general decline in both cases but with different steepness. The observed decrease could stem from ventilation growth alongside the diminishing heating effects that occur after a specific period. The data comparison reveals that the two factors interact because heating-related air recirculation strengthens or transforms the natural daily patterns of radon concentrations.
The analysis of this data confirms that radon concentrations follow dynamic patterns because of thermal and environmental factors which validate both hypotheses.
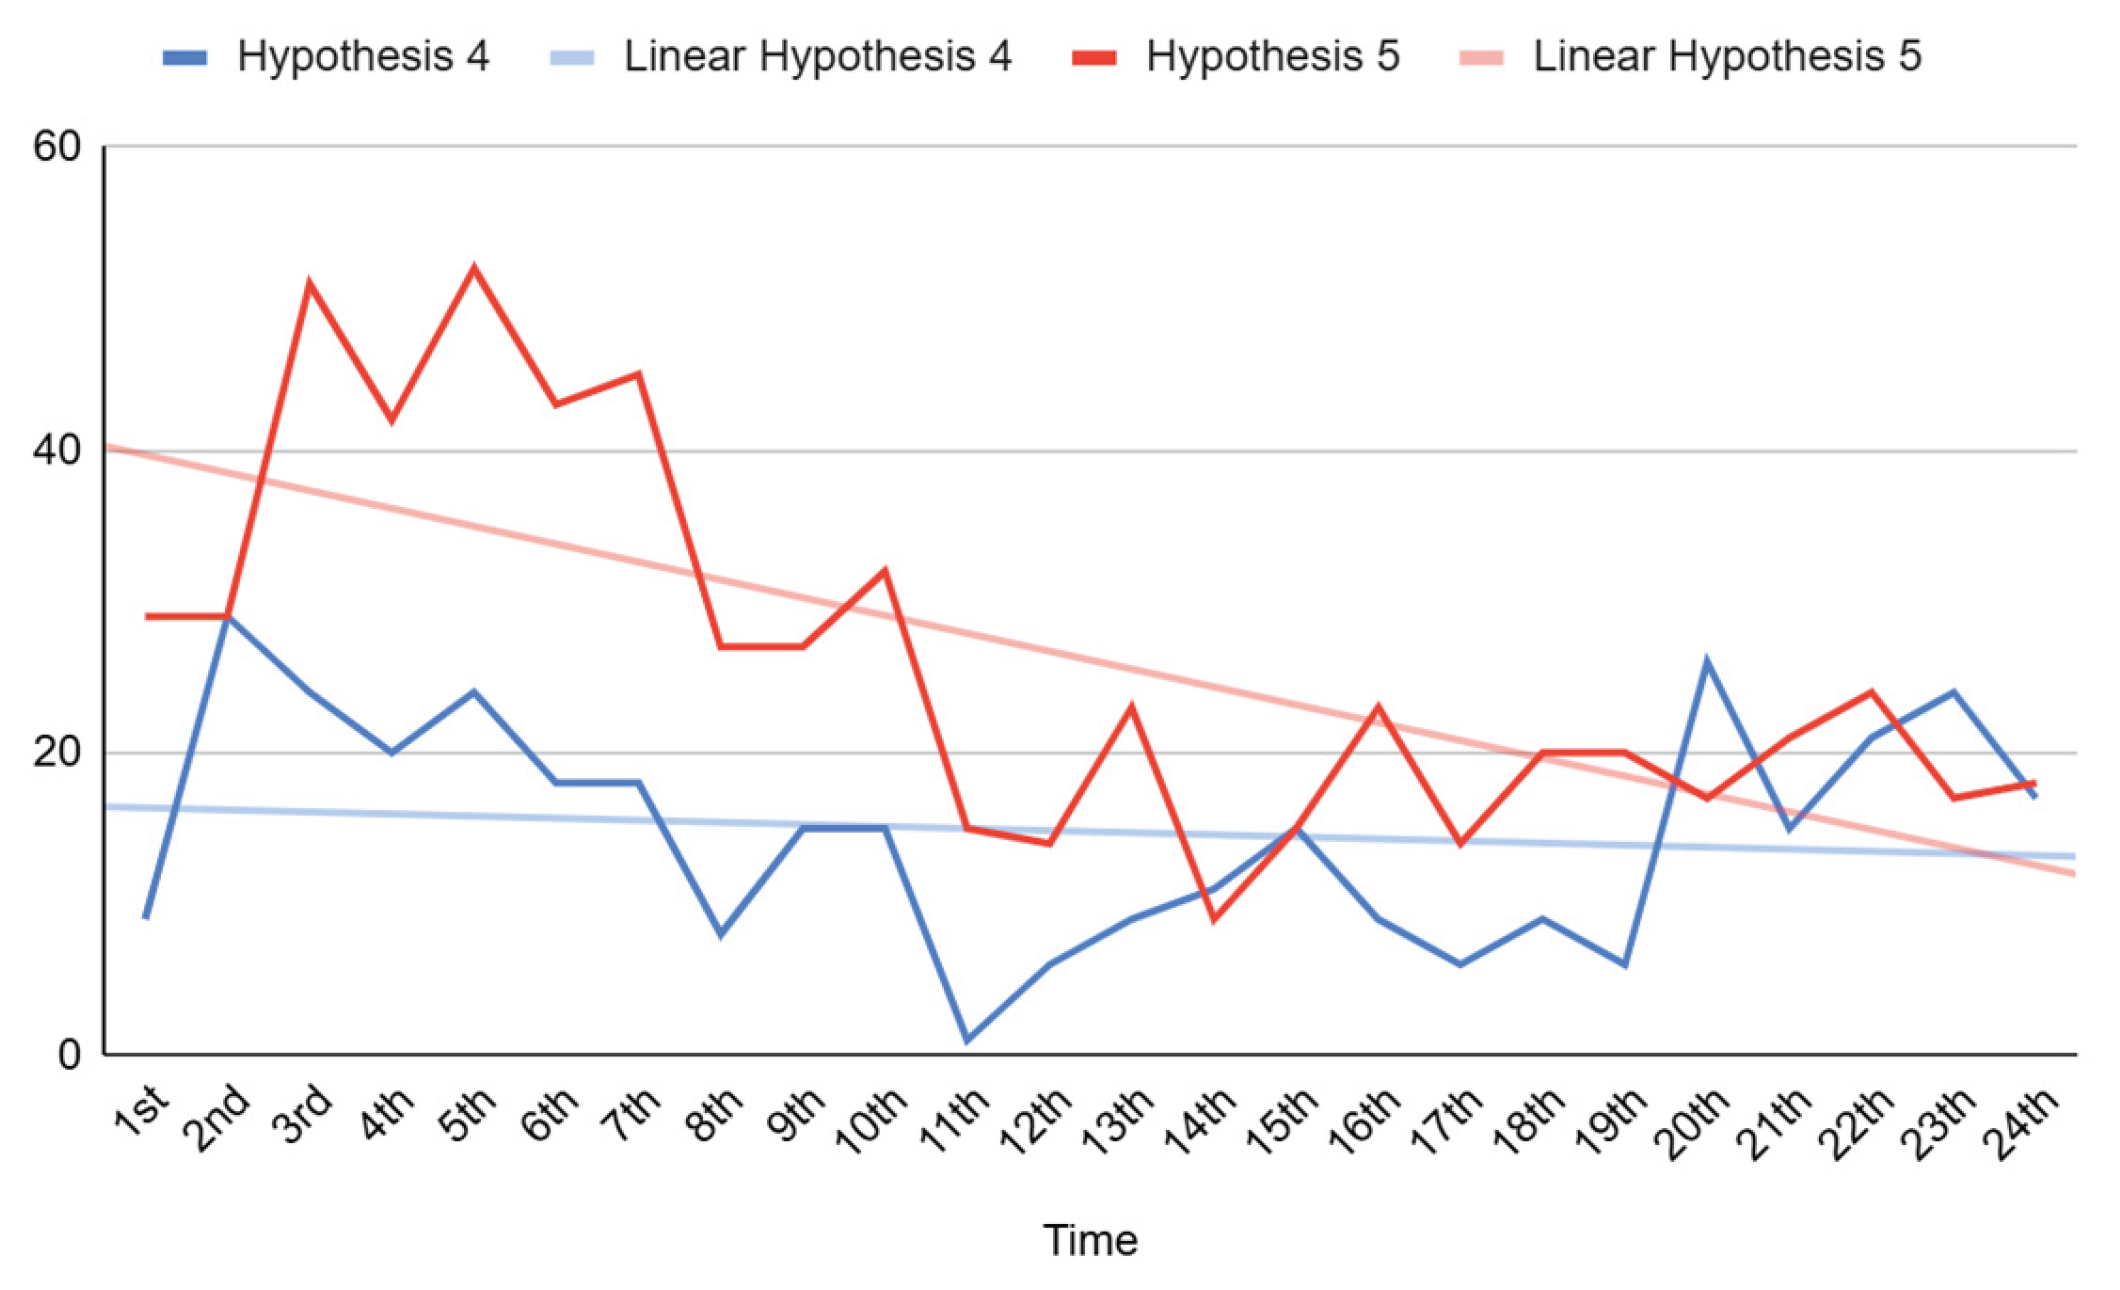
The data presented in Figure 10 demonstrates how human activity together with ventilation affects indoor radon concentrations between hypotheses 4 and 5. According to hypothesis 4 the combination of human activity and ventilation leads to decreased radon concentrations because it promotes better air circulation. The fifth hypothesis examines diurnal radon variations by showing elevated nighttime radon levels because of decreased ventilation and reduced daytime radon levels because of increased human activity.
The two hypotheses present data patterns that do not match each other well. The initial radon concentration values in hypothesis 5 decrease gradually throughout the observation period in accordance with the predicted daily pattern. The data distribution in hypothesis 4 remains stable while showing minimal variations because human activity and ventilation work to keep radon levels low.
The downward trend in both data points exists but Case 5 demonstrates more significant variations between its values. The data shows that radon levels decrease throughout the day but there are occasional spikes which could result from changes in ventilation or human activities.
3. Results
The results validate that human activity and natural ventilation are key to radon removal from indoor environments although radon concentrations increase at night because of decreased air circulation. Multiple hypotheses comparison demonstrates that sufficient air replacement emerges as the essential factor for lowering radon concentration.
The evaluation of indoor radon concentration measurements revealed crucial factors which affect gas behavior and movement patterns in different situations. The systematic evaluation of the proposed hypotheses revealed both correct statements and partial confirmation together with new relationships between variables.
Hypothesis 1: Low Outdoor Temperatures and Radon Levels
The analysis showed that colder days lead to increased radon levels because ventilation is low while temperature gradients help radon migration from subsoil into buildings. There were some cases where human presence and sufficient air exchange managed to limit the growth of radon concentrations. This shows that although temperature is an important factor, it is not the only one and other factors also can play a role.
Hypothesis 2: Low Human Activity and Radon Accumulation
Research evidence supports the fact that periods with little human interaction like holidays lead to higher radon concentrations. The lack of movement together with the lack of natural ventilation leads to the formation of stagnant air and gas accumulation which underlines the need for mechanical ventilation systems during such periods.
Hypothesis 3: Heating Systems and Radon Fluctuations
Data revealed that heating may lead to short-term increases in radon levels possibly because of changes in pressure and air movement. At the same time, there were some cases where heating decreased concentration, possibly because of better circulation. Thus, the effect of heating is not a consistent factor for increasing or decreasing radon levels but instead depends on the overall ventilation conditions.
Hypothesis 4: Human Activity and Reduced Radon Levels
The hypothesis was fully confirmed. The results of the analysis revealed that higher occupancy and natural ventilation led to lower radon levels which confirms that human activity and frequent air exchange are effectively affecting the reduction of radon levels.
Hypothesis 5: Diurnal Fluctuations in Radon Levels
Radon concentrations tend to rise at night when ventilation is usually lower and falls during the day when there is more activity and flow. However, this motif was altered sometimes by other affecting elements such as heating or unsteadiness in the occupancy.
- Correlation Analysis
H1 & H2: Although low temperature and low activity are also factors that lead to higher radon, it seems that the main reason is the lack of ventilation. On days with low temperatures but high occupancy rates, radon levels did not rise.
H1 & H3: The relationship between heating and low temperature is variable. In some instances, heating worked against the effects of low temperature through enhancing convection.
H2 & H4: Human involvement is very crucial in the process of reducing radon. Though there is a tendency for gas to accumulate during low activity, there is evidence that increased movement and ventilation help to counteract this.
H3 & H5: The daily fluctuations in radon levels are to some extent dependent on heating. There were instances where heating led to temporary increase in levels and instances where heating was beneficial and led to better air movement.
H4 & H5: Ventilation is the most important factor. The daily patterns and human activity are closely related; activity seems to be the key to better air quality and lower radon levels.
In conclusion, the analysis of the data suggests that the factors that influence radon levels are interrelated, and that ventilation is the main one. Radon variations are not strictly linear, and factors like temperature, heating and occupancy may either add to or reduce them. Therefore, it can be concluded that measures that guarantee good ventilation and proper functioning of heating systems are critical in minimizing radon concentrations and enhancing indoor air quality.
4. Discussion
This work validates the correlation between radon concentration levels and their corresponding environmental and operational factors for underground thermal energy storage systems applications. More specifically, this research is aligned with earlier findings stating that low temperatures combined with minimal ventilation and infrequent human activity result in higher radon concentrations, while frequent ventilation in combination with increased human presence can potentially lead to opposite results [31]. The study indicates ventilation as a dominant control factor and confirms subsurface radon mitigation models under pressure-driven conditions especially during colder periods.
Although the research mostly proved the fundamental hypotheses, it also revealed more complex radon concentration behavior particularly in heating systems. These systems can cause fluctuations on radon concentration measurements through pressure changes and airflow paths. Previous research supports these dual effects thus demonstrating the requirement to study heating and ventilation system interactions more thoroughly for complete radon level comprehension [34].
Finally, it should be noted that concentration patterns based on human activity and ventilation have experienced occasional unpredictable changes throughout the day. The unexpected behavior indicates potentially unidentified factors such as building architectural elements or local air circulation routes and structural permeability.
To conclude, the research highlights that temperature gradients alongside subsurface thermal conditions control radon mitigation, however additional long-term studies are necessary for better understanding of repeated thermal cycling effect, while the predictive accuracy of radon mitigation models would increase together with the long-term viability of thermal energy storage systems through the integration of geological data and seasonal monitoring.
Future research should focus on the following areas:
- Research should perform extended observations of thermal cycling to determine its prolonged impact on radon movement.
- Studies should compare radon diffusion across various geological sites to evaluate the effects of soil composition combined with moisture content and permeability.
- Research needs to perform detailed studies on heating and ventilation system designs to evaluate their influence on radon accumulation and removal.
- Advanced computational models which could use machine learning should be developed to enhance risk assessment and optimize radon management in underground thermal energy storage systems.
This research contributes to the expanding understanding of indoor radon behavior specifically in underground thermal energy storage facilities. The evidence supports integrated multidisciplinary approaches to protect such systems from radon risks and enhance their efficiency and safety.
Author Contributions
Conceptualization, C.V.; methodology, D.-A.K., A.V.M.; investigation, D.-A.K.; data curation, D.-A.K. and A.T.; writing—original draft preparation, D.-A.K.; validation, S.P., I.S.; writing—review and editing, A.T., I.S., S.P.; supervision, C.V., A.V.M. All authors have read and agreed to the published version of the manuscript.
Funding
This research received no external funding.
Data Availability Statement
The data presented in this study are available on request from the corresponding author.
Conflicts of Interest
The authors declare no conflicts of interest.
Abbreviations
The following abbreviations are used in this manuscript:
| HVAC | Heating, Ventilation, and Air |
| WHO | World Health Organization |
| Rn | Radon |
| Ra | Radium |
| CO2 | Carbon Dioxide |
| Bq/m³ | Becquerels per cubic meter |
References
- Dalui, T. , & Mondal, A. Radon: The Hidden Killer. International Journal of Current Microbiology and Applied Sciences 2020, 9, 251–257. [Google Scholar] [CrossRef]
- Liu, Y. , Xu, Y., Xu, W., He, Z., Fu, C., & Du, F. Radon and lung cancer: Current status and future prospects. Critical Reviews in Oncology/Hematology 2024, 198, 104363. [Google Scholar] [CrossRef] [PubMed]
- Field, R. W. Radon: A Leading Environmental Cause of Lung Cancer. American Family Physician 2018, 98, 280–282. [Google Scholar]
- Adrović, F. (2017). Introductory Chapter: Radon Phenomenon. In Radon. InTech. [CrossRef]
- Grzywa-Celińska, A. , Krusiński, A., Mazur, J., Szewczyk, K., & Kozak, K. Radon—The Element of Risk. The Impact of Radon Exposure on Human Health. Toxics 2020, 8, 120. [Google Scholar] [CrossRef]
- Riudavets, M. , Garcia de Herreros, M., Besse, B., & Mezquita, L. Radon and Lung Cancer: Current Trends and Future Perspectives. Cancers 2022, 14, 3142. [Google Scholar] [CrossRef]
- Ting, D. S. WHO Handbook on Indoor Radon: A Public Health Perspective. International Journal of Environmental Studies 2010, 67, 100–102. [Google Scholar] [CrossRef]
- Maroni, M. Health Effects of Indoor Air Pollutants and their Mitigation and Control. Radiation Protection Dosimetry 1998, 78, 27–32. [Google Scholar] [CrossRef]
- Rahman, N. M. , & Tracy, B. L. Radon control systems in existing and new construction: a review. Radiation Protection Dosimetry 2009, 135, 243–255. [Google Scholar] [CrossRef]
- Withers, C. Considerations for providing healthy, comfortable, energy-efficient whole-house mechanical ventilation during humid weather in near zero energy homes. IOP Conference Series: Materials Science and Engineering 2019, 609, 032043. [Google Scholar] [CrossRef]
- Reddy, A. , Conde, C., Peterson, C., & M Nugent, K. Residential radon exposure and cancer. Oncology Reviews 2022, 16. [Google Scholar] [CrossRef]
- Radford, E. P. Potential health effects of indoor radon exposure. Environmental Health Perspectives 1985, 62, 281–287. [Google Scholar] [CrossRef] [PubMed]
- Nielson, K. K. , Rogers, V. C., & Gee, G. W. Diffusion of Radon through Soils: A Pore Distribution Model. Soil Science Society of America Journal 1984, 48, 482–487. [Google Scholar] [CrossRef]
- Field, R. W. (2011). Radon: An Overview of Health Effects. In Encyclopedia of Environmental Health (pp. 745–753). Elsevier. [CrossRef]
- Keith S, Doyle JR, Harper C, Mumtaz M, Tarrago O, Wohlers DW, Diamond GL, Citra M, Barber LE. Toxicological Profile for Radon. Atlanta (GA): Agency for Toxic Substances and Disease Registry (US); 2012 May. [PubMed]
- Howe, S. How radon gas enters homes. University of Nevada, Reno Extension. 2019. Available online: https://extension.unr.edu/publication.aspx?PubID=2645.
- Shu’aibu, H. K. , Khandaker, M. U., Baballe, A., Tata, S., & Adamu, M. A. Determination of radon concentration in groundwater of Gadau, Bauchi State, Nigeria and estimation of effective dose. Radiation Physics and Chemistry 2021, 178, 108934. [Google Scholar] [CrossRef]
- Ciolini, R. , & Mazed, D. Indoor radon concentration in geothermal areas of central Italy. Journal of Environmental Radioactivity 2010, 101, 712–716. [Google Scholar] [CrossRef]
- Adelikhah, M. , Imani, M., & Kovács, T. Measurements and computational fluid dynamics investigation of the indoor radon distribution in a typical naturally ventilated room. Scientific Reports 2023, 13, 2064. [Google Scholar] [CrossRef]
- Nunes, L. J. R. , Curado, A., & Lopes, S. I. The Relationship between Radon and Geology: Sources, Transport and Indoor Accumulation. Applied Sciences 2023, 13, 7460. [Google Scholar] [CrossRef]
- National Research Council (US) Committee on Evaluation of EPA Guidelines for Exposure to Naturally Occurring Radioactive Materials. Indoor-Radon Guidelines and Recommendations. In Evaluation of Guidelines for Exposures to Technologically Enhanced Naturally Occurring Radioactive Materials. National Academies Press (US). 1999. Available online: https://www.ncbi.nlm.nih.gov/books/NBK230646/.
- Kruger, P. , Stoker, A., & Umaña, A. Radon in geothermal reservoir engineering. Geothermics 1977, 5, 13–19. [Google Scholar] [CrossRef]
- Urrutia-Pereira1, M. , Miguel Chatkin2, J., José Chong-Neto3, H., & Solé4, D. Radon exposure: a major cause of lung cancer in nonsmokers. Jornal Brasileiro de Pneumologia 2023, 49, e20230210. [Google Scholar] [CrossRef]
- Anderson, J. L. , Zwack, L. M., & Brueck, S. E. Exposure to Radon and Progeny in a Tourist Cavern. Health Physics 2021, 120, 628–634. [Google Scholar] [CrossRef]
- Haker Høegh, B. , & Valdbjørn Rasmussen, T. Efficiency of the chimney effect controlling radon levels indoor. MATEC Web of Conferences 2019, 282, 02029. [Google Scholar] [CrossRef]
- Angell, W. J. (2011). Indoor Radon Prevention and Mitigation. In Encyclopedia of Environmental Health (pp. 208–217). Elsevier. [CrossRef]
- Bakaeva, N. v, & Kalaydo, A. v. Modelling the source and mechanism of radon entry into the building. IOP Conference Series: Earth and Environmental Science 2021, 864, 012013. [Google Scholar] [CrossRef]
- Mareș, I.-C. , Catalina, T., Istrate, M.-A., Cucoș, A., Dicu, T., Burghele, B. D., Hening, K., Popescu, L. L., & Popescu, R. S. Research on Best Solution for Improving Indoor Air Quality and Reducing Energy Consumption in a High-Risk Radon Dwelling from Romania. International Journal of Environmental Research and Public Health 2021, 18, 12482. [Google Scholar] [CrossRef]
- Ruano-Ravina, A. , Martin-Gisbert, L., Kelsey, K., Pérez-Ríos, M., Candal-Pedreira, C., Rey-Brandariz, J., & Varela-Lema, L. An overview on the relationship between residential radon and lung cancer: what we know and future research. Clinical and Translational Oncology 2023, 25, 3357–3368. [Google Scholar] [CrossRef]
- Beyari, H. The Relationship between Social Media and the Increase in Mental Health Problems. International Journal of Environmental Research and Public Health 2023, 20, 2383. [Google Scholar] [CrossRef]
- Stanley, F. K. T. , Irvine, J. L., Jacques, W. R., Salgia, S. R., Innes, D. G., Winquist, B. D., Torr, D., Brenner, D. R., & Goodarzi, A. A. Radon exposure is rising steadily within the modern North American residential environment, and is increasingly uniform across seasons. Scientific Reports 2019, 9, 18472. [Google Scholar] [CrossRef]
- Kokotti, H. , Kalliokoski, P., & Raunemaa, T. Short and long term indoor radon concentrations in buildings with different ventilation systems. Environmental Technology Letters 1989, 10, 1083–1088. [Google Scholar] [CrossRef]
- Vogiannis, E. G. , & Nikolopoulos, D. Radon Sources and Associated Risk in Terms of Exposure and Dose. Frontiers in Public Health 2015, 2, 207. [Google Scholar] [CrossRef]
- Marley, Frederick. INVESTIGATION OF THE AIR PRESSURE CHARACTERISTICS INFLUENCING THE VARIABILITY OF RADON GAS AND RADON PROGENY IN DOMESTIC VERNACULAR BUILDINGS. Health Physics 2001, 81, 57–69. [Google Scholar] [CrossRef]
Disclaimer/Publisher’s Note: The statements, opinions and data contained in all publications are solely those of the individual author(s) and contributor(s) and not of MDPI and/or the editor(s). MDPI and/or the editor(s) disclaim responsibility for any injury to people or property resulting from any ideas, methods, instructions or products referred to in the content. |
© 2025 by the authors. Licensee MDPI, Basel, Switzerland. This article is an open access article distributed under the terms and conditions of the Creative Commons Attribution (CC BY) license (http://creativecommons.org/licenses/by/4.0/).
Copyright: This open access article is published under a Creative Commons CC BY 4.0 license, which permit the free download, distribution, and reuse, provided that the author and preprint are cited in any reuse.


