
Submitted:
22 May 2025
Posted:
23 May 2025
You are already at the latest version
Abstract
Depending on the importance of hydromorphic vegetation formations of high mountain areas were established relations between the attributes of these grasslands and botanical composition of the diet of grey-breasted seedsnipe (Thinocorus orbignyianus), brown hares (Lepus europaeus), and horses (Equus ferus caballus). Hares showed greater dietary diversity (J) than horses and grey-breasted seedsnipes, factor that was correlated in all three cases, negatively with vegetation diversity patch. Same response amplitude was found when analyzing food web. The dietary diversity for all species showed no relation to the dry matter productivity vegetable patches. While correlation the abundance of two species of Cyperaceae in the meadow with the presence of the same in the diet of herbivores, we found a negative relationship between the abundance of Carex sp and grey-breasted seedsnipe diet, and a positive relationship between the Eleocharis pseudoalbibracteata species abundance and frequency in the diet of hares and horses. About the group of species content of graminoids in the diet, it was determined an overlap of 30% dietary animal species assessed, depending on that, it could identify the existence of interspecific competition between herbivores, this would be conditioned by the response of individuals to the environment.
Keywords:
Cyperaceae
; dietary diversity
; hydromorphic grassland
1. Introduction
The high-Andean grasslands of Chile are distributed from Atacama to the Araucania region in high-altitude areas of the Andes Mountains. These ecosystems are considered natural or altered systems, whose forage production can be utilized from mid-spring to summer [1]. The use of these high-altitude wetlands for seasonal livestock grazing involves the coexistence of domestic, introduced, and wild herbivorous vertebrates. Competitive interactions among these species are expected to intensify during these periods when food resources are scarce [2]. However, in Chile, there are few studies on this type of interaction and its intensity in these environments. Among the wild herbivores using these ecosystems are guanacos (Lama guanicoe), hares (Lepus europaeus), Andean geese (Chloephaga melanoptera), and grey-breasted seedsnipes (Thinocorus orbignyianus). The latter three species primarily utilize hydromorphic grasslands (wet grasslands), as do domestic livestock—mainly horses (Equus ferus caballus)—which occupy these areas during the summer months [3].
Given this, it is evident that forage resources are shared by both resident and occasional herbivores, a situation where a high trophic niche overlap among studied herbivores has been identified [4,5]. This phenomenon depends on the type and abundance of forage resources, which, in high mountain environments, vary according to soil moisture availability. This is influenced by three combined factors: topographic conditions, wind exposure, and winter snow cover. These gradients determine the formation of a mosaic of plant communities [6]. The ability of herbivores to modify dietary components based on the temporal abundance of plant species in a patch distinguishes animal species that are efficient in resource use [7]. Thus, the goal is to establish relationships between diet and foraging area attributes as a first step toward understanding interactions in these environments [8]. These findings could facilitate inferences about niche overlaps or differentiation in at least one dimension of the trophic niche [9], enabling the coexistence of species competing for the same resource in a non-random manner, primarily based on nutritional aspects [10,11].
2. Materials and Methods
2.1. Study Area
The study was conducted at eight high-altitude wetland sites in the southern Andes of Cuncumén, Salamanca, in the Coquimbo Region of Chile (31°52’–32°02’ S; 70°19’–70°26’ W; 3,025–3,729 meters above sea level) (Figure 1).
Evaluations of the botanical composition of hydromorphic grasslands were carried out in March of 2011 and 2012. The climate in the area corresponds to the Steppe Province with a very Cold Dry Summer or Mountain Summer Ecoregion, which, according to Köeppen [12], is classified as BSsk’ climatic type. The hydric azonally distributed grasslands (“high-altitude wet grasslands”), which develop on hydromorphic soils, are the main source of high-quality forage for herbivores. These grasslands are dominated by graminoid species (families Cyperaceae and Juncaceae), notably Eleocharis pseudoalbibracteata S. González & Guagl. and Carex gayana E. Desv. These species are considered key components of this type of grassland [2]. The bromatological analysis of both species is presented in Table 1:
2.2. Dry Matter Production in the Grassland
At each site in the plain and associated with each transect, dry matter (DM) production was estimated, which was measured by harvesting 31 exclusion plots of 3x3 m and 7.29 m2 of usable area. At the beginning of the growing season, the remaining DM from the previous season was removed from each of the plots and at the end of the season, the phytomass accumulated during the growing season was harvested at ground level, which was subsequently dried in a forced air oven at 60ºC for 48 hours, in order to express the forage production of the plot in terms of DM (kg ha-1).
2.3. Evenness of Plant Species in the Grassland
To estimate the evenness of plant species in the wet grasslands, their botanical composition was determined by evaluating 31 20 m transepts, arranged in eight sectors representative of this type of grassland. In each transept, the modified Point Quadrat method was used [13,14], which allows determining the relative participation of the different plant species in the community. With this information and in each evaluated line, the Shannon-Wiener diversity index was calculated [15]:
This index was expressed as relative diversity or evenness (Jp) [16], according to the following equations:
In the previous equations, pi is the proportion of i species in the grassland, and n is the number of species in it. Hmax represents the value H would have if all species found in the grassland had the same frequency.
2.3. Evenness of the Diet
In each wet grassland site, fresh feces samples were collected from horses (Equus ferus caballus), hares (Lepus europaeus), and grey-breasted seedsnipes (Thinocorus orbignyianus). The samples (between 15 to 20 samples per herbivore) consisted of a set of 10 to 15 fresh fecal sub-samples from each animal species, obtained through a “cross-country” traversal of the wet grassland site. After collecting the samples, these were dehydrated in a forced-air oven at 60°C for 48 hours and stored in airtight jars until further processing. The botanical composition of the diet was determined through micro-histological analysis of feces [17,18,19]. This method is based on the microscopic identification of plant epidermal fragments that have characteristics allowing for the differentiation of plant species [20,21].
The results of the microscopic reading were expressed as the relative frequency for each plant species, which is considered a good estimator of dry weight in mixtures of known composition [22]. Subsequently, this frequency was converted into density using the tables of Fracker and Brischle [17,23]. The identified plant species were grouped into five categories: annual grasses (Poaceae), perennial grasses, graminoids (Cyperaceae and Juncaceae), dicotyledonous herbs, and shrub species.
With the botanical composition of each herbivore’s diet established, its relative evenness (Jd) was determined using the same equations employed to calculate the evenness of the grassland (Eqs. 1, 2, and 3). The Jd index ranges between 0 (very low dietary evenness) and 1 (all species in the diet have the same abundance). Generally, when Jd values are below 0.3, it indicates highly specialized diets, while values above 0.6 suggest a generalist diet [24,25]
Finally, to determine the trophic niche overlap among the three herbivores studied, in terms of the relative contribution of graminoid species in the diet, Pianka’s Index (O) [26] was calculated using the following equation:
where pᵢ corresponds to the frequency of species i in the diet of herbivore A, and qᵢ corresponds to the frequency of the same species i in the diet of herbivore B. Like the evenness index, this variable ranges from 0 to 1. Values equal to or greater than 0.7 indicate a high dietary overlap.
2.4. Statistical Analysis
As this study was observational, an “a priori” experimental design was not carried out. Nevertheless, an analysis of variance (ANOVA) was carried out on the dietary evennes results (Jd) and trophic niche range (Best), with a totally randomized design, with its correspondent assumptions taking into account the herbivore species as the only source for variation [27]. The differences among herbivores were determined through the Tukey test with a 5% level of significance. The association among the assessed variables were determined through the estimation of the Pearson correlation with a 5% level of significance and a regression analysis. All of the statistical analysis was done using the STATGRAPHICS Centurion XVI® software (Statgraphics Technologies, Inc.,Virginia, VA, USA).
3. Results
3.1. Evenness of the Diet
The relative evenness index (Jd), which accounts for the similarity in the proportions of plant species that make up the diet, observed a significant effect attributed to the type of herbivore (p = 0.0006), with the diets of hares and horses being the most diverse, with values of 0.759 ± 0.028 and 0.750 ± 0.026), respectively. The above values were statistically similar to each other, differing significantly from that found in the partridge diet in which Jd obtained a significantly lower value (0.593 ± 0.032) (Figure 2).
3.2. Diet Evenness and Its Relationship with Grassland Patch Evenness and Dry Matter Production
The evenness of the partridge diet was negatively correlated with the evenness of the patch used as a food resource (r= -0.708; p= 0.022), while in the case of hares this correlation was lower and of lesser significance (r= -0.528; p= 0.064). In the case of equines this correlation was even lower, lacking statistical significance (r= -0.212; p= 0.449) (Figure 3).
No linear correlation was found between the evenness of the diet of equines and hares with the dry matter production of the patch, however, in the case of the dietary evenness of partridge, it observed a quadratic trend, which turned out to be significant (p= 0.05) and with an R2 of 0.713 (Figure 4).
3.3. Presence of Indicator Plant Species in the Diet
The grassland “indicator” plant species, the graminoids C. gayana and E. pseudoalbibracteata, contributed to the botanical composition of the grasslands with percentages that varied between 48 and 59%, depending on the grassland site. These two species together were present in the diet of the grey-breasted seedsnipe, hares and horses in a percentage of 44.6 ± 7.4; 35.8 ± 6.5 and 43.8 ± 6.0%, respectively, figures that were not statistically different from each other (p = 0.579). Given the importance of these species in the diet of the herbivores studied, the percentage contribution of the two “indicator” species in the diet was correlated with the percentage contribution of the same in each grassland patch. In the case of the grey-breasted seedsnipe, the result was negative, (r = -0.758; p= 0.011). Thus, as the percentage presence of this plant species in the plain increases, its content in the diet decreases, a relationship to which an exponential decline model could be adjusted (Figure 5).
For both hares and horses, this correlation was low and lacking statistical significance (Figure 6).
When relating the content of E. pseudoalbibracteata present in the diet of the grey-breasted seedsnipe with the content of this graminoid in the wet grassland, a linear correlation coefficient of 0.624 (p = 0.072) was determined, which could indicate a tendency to an increase in the consumption of this plant species as its presence in the diet of this bird increases, this relationship being rather of the exponential type (Figure 7A). A linear response was found in the case of hares and equines, where the correlation coefficients were 0.578 (p = 0.039) and 0.737 (p = 0.003), respectively (Figure 7B and 7C).
3.4. Dietary Overlap
Based on the relative importance of graminoids in the diet of the three herbivores, the dietary overlap for this item was determined using Pianka’s index, with the results shown in Table 2. The magnitude of the overlap reached more than one-third for all analyzed species, tending to be higher between Lepus europaeus and Thinocorus orbignyianus.
4. Discussion
It is complex to assess interspecific competition in vertebrates [28], given the difficulty of controlling all the factors that would be influencing such interactions. Currently, there are no studies that clearly demonstrate the trophic competition that might exist among these three species; however, the degree of similarity in the botanical composition of their diets could provide indications of the existence of this phenomenon [3,4,24]. The evenness (Jd) (homogeneity) of the diets of the three herbivores is considered medium to high, which could indicate that they are species with generalist feeding strategies [11], especially in the case of Lepus europaeus and Equus caballus. Studies conducted on rodents (Dolichotis patagonum) in Argentine Patagonia corroborate that such species would be generalists in their food selection [29]. Meanwhile, for equines, it is well known that their grazing behavior allows for equitable selection of the plant species that make up their diet [30]. Castellaro et al. [3] reported a dietary evenness index of around 0.77 for horses in this same environment. Thinocorus orbignyianus exhibited the least diverse (most homogeneous) diet, tending to consume a greater proportion of a specific plant species at the expense of others. Korzun et al. [31] conducted a study on the anatomy of birds of the genus Thinocorus, describing the morphology of their skulls, which could offer an explanation for the dietary preferences these animals exhibit in qualitative terms. However, most of these birds exhibit marked dietary preferences, which have been better studied in granivorous and frugivorous types [32]. Orellana et al. (2021) [33] found Jd values ranging from 0.49 to 0.70 in the diets of wild geese (Chloephaga melanoptera) in high Andean environments, with graminoid species dominating their diets. The values obtained for dietary breadth indicate that hares and equines have a broader range in this attribute compared to the grey-breasted seedsnipe, a pattern similar to that found in the study by Rodríguez and Dacar [29] on Dolichotis patagonum. Horses showed dietary evenness similar to that of hares, but different from that observed in the grey-breasted seedsnipe, which could be due to lower ease in harvesting food based on bite size. While this allows them to select the grazing area, it limits their ability to separate one species from the others growing alongside it. Each herbivore species has anatomical adaptations that allow them to better select and obtain specific parts of the plant to consume, as well as physiological adaptations that enable them to process these plants effectively [34,35]. The narrower trophic niche breadth of Thinocorus orbignyianus, reflected in a lower relative evenness index, suggests greater specificity in the selection of forage resources [36], ending toward less generalist dietary habits [25], though not reaching the level of specialization. This behavior could be due to morphophysiological differences among herbivores [7,35], as the bird’s oral apparatus would allow for more rigorous food selection.
As the evenness of plant communities in the hydromorphic grassland (Jp) increased, the dietary evenness in the grey-breasted seedsnipe and hares decreased. This observation could be explained by the evenness in species frequency within the wet grassland, which would increase the animals’ ability to select specific plant species. The animals tend to focus on those plant species that provide the greatest nutritional benefit [36]. In the case of horses, this behavior was not observed, as their Jd was unaffected by the increase in plant species evenness in the grassland.
It was not possible to establish a relationship between dietary evenness and the availability of plant dry matter, suggesting that an increase in grassland productivity does not necessarily indicate greater species richness [18].
It is evident that, both spatially and temporally, the three evaluated herbivores utilize the same resource, as confirmed by the significant presence of graminoid species in their diets, with a minimum value of 30%. Abrams [37] suggests that interaction among herbivores can be demonstrated if at least some dimensions of their ecological niches overlap, necessitating an evaluation of resource dynamics in relation to each feeding strategy. One species identified as an “indicator” was C. gayana, whose frequency decreased in the diet of the grey-breasted seedsnipe as the abundance of this plant species increased in the patch. This pattern suggests that consumption of this resource may be modulated by anti-apostatic selection [38], wherein consumers avoid more abundant resources in favor of less common ones. Such behavior is rare in birds but has been documented in some wild marine species [39]. In contrast, no relationship was found between the frequency of C. gayana in the diets of the other two herbivores and its abundance in the grassland. Evaluating the dietary preferences of horses and hares, and how these change in response to resource availability is crucial due to the potential impact of species selection on the ecosystem [40]. Studies on the effects of introduced ungulates in New Zealand have concluded that herbivory can lead to a reduction in floristic evenness, attributable to the lack of defenses in certain plant species [41].
An increase in the abundance of E. pseudoalbibracteata corresponded with a higher presence of this species in the diets of all three evaluated herbivores, particularly in the grey-breasted seedsnipe and horses. This suggests that selection of this resource could be characterized as apostatic [42], where consumers prefer more common resources. The consumption of this species in relation to its abundance may also explain its high frequency in the evaluated grasslands. Nutritionally, this plant species differs from C. gayana, especially in its cell wall content (NDF), which could be significant for these herbivores. This is particularly relevant for the grey-breasted seedsnipe, which generally may have a lower capacity to digest fibrous plant material compared to lagomorphs and equines [35].
Based on the provided data and the estimation of dietary overlap using Pianka’s index, a potential competition between hares and equines can be inferred, with a trophic niche overlap associated with graminoid species of approximately 30%. This figure is lower than that reported for rabbits and cattle in the Argentine pampas, and lower than that determined between these same herbivores by Castellaro et al. [3] in this environment. The interaction between the grey-breasted seedsnipe and horses over the same resource is around 32%, while the overlap between hares and grey-breasted seedsnipes reaches nearly 40%. However, given the magnitude of these dietary overlaps, the potential trophic competition among the three studied herbivores would be considered medium to low [18].
5. Conclusions
According to our results, the trophic niche breadth suggests that the diets of the three studied herbivores are composed of a limited number of plant species, particularly in the case of the grey-breasted seedsnipe. However, these diets are relatively balanced, a trait more evident in equines and hares, which also exhibit more pronounced generalist feeding habits. Only in the case of the grey-breasted seedsnipe was an association observed between dietary evenness and the evenness of plant species in the grassland patch. This indicates that, for this bird, as the evenness in the frequency of plant species in the grassland increases, the likelihood of selecting specific plant species also increases, resulting in a decrease in the evenness of its diet. The availability of dry matter (DM) in the grassland does not influence the herbivores’ ability to select more diverse diets. An exception may be the grey-breasted seedsnipe, for which a quadratic trend was observed—dietary evenness tends to be higher at very low or very high relative values of DM availability. Among the key species in the hydromorphic grassland, only E. pseudoalbibracteata was relevant as a modulator of diet composition in the three studied herbivores, showing a positive association: as its abundance in the pasture increases, its contribution to the herbivores’ diet also increases, playing a significant nutritional role in maintaining physiological processes. In the case of C. gayana, its dietary contribution becomes important when its presence in the pasture is low, and this is only relevant for the grey-breasted seedsnipe. Based on the feeding strategy that results in low dietary overlap, a low probability of interspecific trophic competition among the studied herbivore species can be expected.
Author Contributions
Conceptualization, methodology, data analysis and manuscript draft by G.C., C.L.O., J.P.E. and C.N.E; execution of field experiments by G.C., C.L.O. and J.P.E. All authors have read and agreed to the published version of the manuscript.
Funding
This research was funded by the Project “CS-1650 MLP-CEA—Characterization Study of the Wetlands of the South Cordillera of Cuncumén”. Antofagasta Minerals Los Pelambres-CEA S.A.
Institutional Review Board Statement
Ethical review and approval for this study was waived, due to the stool samples used in the dietary analysis by microhistology, were collected from the ground surface, without requiring any manipulation of the animals.
Data Availability Statement
The data presented in this study is available on request from the corresponding author.
Conflicts of Interest
The authors declare no conflict of interest.
References
- Ahumada, M. y F m & l Faúndez (2001) Guía descriptiva de las praderas naturales de Chile. Ministerio de Agricultura, Servicio Agrícola y Ganadero, Santiago, Chile. 98 p.2.
- Chesson, P. and N. Huntly. The roles of harsh and fluctuating conditions in the dynamics of ecological communities. Am. Nat. 1997, 150, 519–553. [Google Scholar] [CrossRef] [PubMed]
- Castellaro, G.; Orellana, C.L.; Escanilla, J.P. 2021. Summer Diet of Horses (Equus ferus caballus Linn.) Guanacos (Lama guanicoe Müller), and European Brown Hares (Lepus europaeus Pallas) in the High Andean Range of the Coquimbo Region, Chile. Animals 2021, 11, 1313. [Google Scholar] [CrossRef] [PubMed]
- Bonino, N. Interacción trófica entre el conejo silvestre europeo y el ganado doméstico en el noroeste de la Patagonia Argentina. Ecol. Austral 2006, 16. [Google Scholar]
- Iranzo, E. 2011. Abundancia y selección de hábitat del guanaco (Lama guanicoe) en Torres del Paine (Chile): coexistencia con el ganado en el entorno de un espacio natural protegido. Tesis de Maestría en Ecología. Facultad de Biología. Universidad Autónoma de Madrid, España.
- Guzmán, C. 1984. Estado actual de las veranadas de un sector de la comuna de San José de Maipo (Región Metropolitana) y su relación con el manejo histórico de la masa animal. Memoria para optar al título profesional de Ingeniero Agrónomo. Santiago, Universidad de Chile, Facultad de Ciencias Agronómicas. 95 p.
- García, J. and B. Arroyo. 2005. Food-niche differentiation in sympatric Hen Circus cyaneus and Montagu’s Harriers Circus pygargus. Ibis 2005, 147, 144–154. [Google Scholar] [CrossRef]
- Mayneiro, R. 2000. Análisis del nicho trófico de tres especies de anfibios en un grupo de cuerpos de agua lénticos. Tesis de maestría en biología. Facultad de Ciencias. Universidad de la República, Montevideo. Uruguay.
- Fedriani, J. Fuller, R. Sauvajot and E. York. Competition and intraguild predation among three sympatric carnivores. Oecologia 2000, 125, 258–270. [Google Scholar] [CrossRef]
- Green, W. 1984. A review of ecological studies relevant to management of the common brushtail possum. In Possums and gliders, ed. A. P. Smith & I. D. Hume. Surrey Beatty & Sons, Chipping Norton, NSW, pp. 483-99.
- Linares, L. Linares, G. Mendoza, F. Pelaez, E. Rodriguez y A. Phum. 2010. Preferencias alimenticias del guanaco (Lama guanicoe cacsilensis) y su competencia con el ganado doméstico en la Reserva Nacional de Calipuy, Perú. Scientia Agropecuaria 2010, 1, 225–234. [Google Scholar] [CrossRef]
- Köeppen, W. Climatología; Fondo de Cultura Económica: Carretera Picacho-Ajusco, Mexico, 1948; p. 478. [Google Scholar]
- Passera, C. B. , Dalmasso, A. D. and O. Borsetto. 1983. Método de “Point Quadrat Modificado”. In Taller de Arbustos Forrajeros para Zonas Áridas y Semiáridas, 2nd ed. Subcomité Asesor del Árido Subtropical Argentino. Amawald. S. A.: Buenos Aires, Argentina, p. 107.
- Daget, PH. et J. Poissonet. Une méthode d’analyse phytologique des prairies, critères d’application. Ann. Agron 1971, 22, 5–41. [Google Scholar]
- Smith, R. y T. Smith. 2012. Elements of Ecology., 8th Ed. Pearson Educación. Boston, USA. 612 p.
- Pielou, 1974. Population and community ecology: principles and methods. New York (NY): Gordon and Breach.
- Spark, D. and J. Malechek. Estimating percentage dry weight in diets using a microscope technique. J. Range Management 1968, 21, 264–265. [Google Scholar] [CrossRef]
- Holechek, J. L. , Pieper, R.D. and C. H. Herbel. 2011. Range Management, Principles and Practices. 6th Edition. Prentice Hall, New Jersey. 444 p.
- Garnick, S. S. Barboza, and J. W Walker. 2018. Assessment of Animal-Based Methods Used for Estimating and Monitoring Rangeland Herbivore Diet Composition. Rangeland Ecology & Management 2018, 71, 449–457. [Google Scholar]
- Castellaro, G. Squella, T. Ullrich, F. Leon y A Raggi. Algunas técnicas microhistológicas utilizadas en la determinación de la composición botánica de la dieta de herbívoros. Agricultura Técnica (CHILE) 2007, 67, 86–93. [Google Scholar]
- Catán, A., C. Degano y L. Larcher. 2003. Modificaciones a la técnica microhistológica de Peña-Neira para especies forrajeras del Chaco Argentino. Quebracho. Revista de Ciencias Forestales. Diciembre Nº 010. Universidad Nacional de Santiago del Estero. Santiago del Estero, Argentina, pp. 71-75.
- Holechek, J. and B. Gross. Evaluation of different calculation procedures for microhistological analysis. J. Range Management 1982, 35, 721–726. [Google Scholar] [CrossRef]
- Ortega, I., M. Berger y M. Flores. 1993. Manual de técnica microhistológica. 48 p. IBTA 113/Textos y Manuales 04/Rumiantes Menores (SR-CRSP) 05/ 1993. La Paz, Bolivia.
- Krebs, C. 1999. Ecologycal methodology. Addison Wesley Longman, Inc., CA., USA. 620 pp.
- Román-Palacios, C. and C. Román-Valencia. Hábitos tróficos de dos especies sintópicas de carácidos en una quebrada de alta montaña en los Andes colombianos. Revista Mexicana de Biodiversidad 2015, 86, 782–788. [Google Scholar] [CrossRef]
- Pianka, E. R. The structure of lizard communities. Annual Review of Ecology and Systematics 1973, 4, 53–74. [Google Scholar] [CrossRef]
- Kaps, M.; Lamberson, Y.W. Biostatistics for Animal Science; CABI Publishing: Oxfordshire, UK, 2004; 445p. [Google Scholar]
- Schoener, T. Field experiments on interspecific competition. The American Naturalist. 1983, 122, 240–285. [Google Scholar] [CrossRef]
- Rodríguez, D. y M. Dacar. Composición de la dieta de la mara (Dolichotis patagonum) en el sudeste del monte pampeano (La Pampa, Argentina). Mastozoología Neotropical 2008, 15, 215–220. [Google Scholar]
- Gordon, I. and W. Lindsay. Could mammalian herbivores “manage” their resources. Oikos 1990, 59, 270–280. [Google Scholar] [CrossRef]
- Korzun, L. , Érard, C. , Gasc, J. P. and Dzerzhinsky, F. Adaptation of seedsnipes (Aves, Charadriiformes, Thinocoridae) to browsing: a study of their feeding apparatus. Zoosystema 2009, 31, 347–368. [Google Scholar] [CrossRef]
- Loiselle, A. and J. Blake. Diets of understory fruit-eating birds in Costa Rica: Seasonality and resource abundance. Vegetatio 1990, 107/108, 177–189. [Google Scholar] [CrossRef]
- Orellana, C. , Castellaro, G. and Escanilla, J. Dieta estival del piuquén (Chloephaga melanoptera Eyton, 1838) en praderas hidromórficas de la Cordillera Andina de la Región de Coquimbo, Chile. IDESIA (Chile). 2021, 39, 77–85. [Google Scholar] [CrossRef]
- Church, D. 1993. El rumiante: fisiología digestiva y nutrición de los rumiantes. Zaragoza, España: Editorial Acribia.
- Cheeke, P.R.; Dierendfeld, E.S. Comparative Animal Nutrition and Metabolism; CABI: Carson, CA, USA, 2010; 339p. [Google Scholar]
- Granado-Lorecio, C. 2002. Ecología de peces. Universidad de Sevilla, Sevilla, España.
- Abrams P Some comments on meosuring niche overlap. Ecology 1980, 61, 44–49. [CrossRef]
- Allen, J. Raison and M. Weale. The influence ofdensity on frequency-dependent selection by wild birds feeding on artificial prey. Proc. R. Soc. Lond. B 1998, 265, 1031–1035. [Google Scholar] [CrossRef]
- Allen, J. and M. Weale. Anti-apostatic selection by wild birds on quasi-natural morphs of the land snail Cepaea hortensis: a generalised linear mixed models approach. 2005, 108, 335–343. [Google Scholar]
- DeCesare, N. Hebblewhite, H. Robinson and M. Musiani. Endangered, apparently: the role of apparent competition in endangered species conservation. 2010, 13, 353–362. [Google Scholar]
- Forsyth, D. Coomes, G. Nugentg and M. Hall. Diet and diet references of introduced ungulates (Order: Artiodactyla) in New Zealand. 2000, 29, 323–343. [Google Scholar]
- Endler, J.A. Frequency-dependent predation, crypsis andaposematic colorations. Phil. Trans. Roy. Soc. Lond. B 1988, 319, 505–523. [Google Scholar]
Figure 1.
Location of the area where the study was carried out.
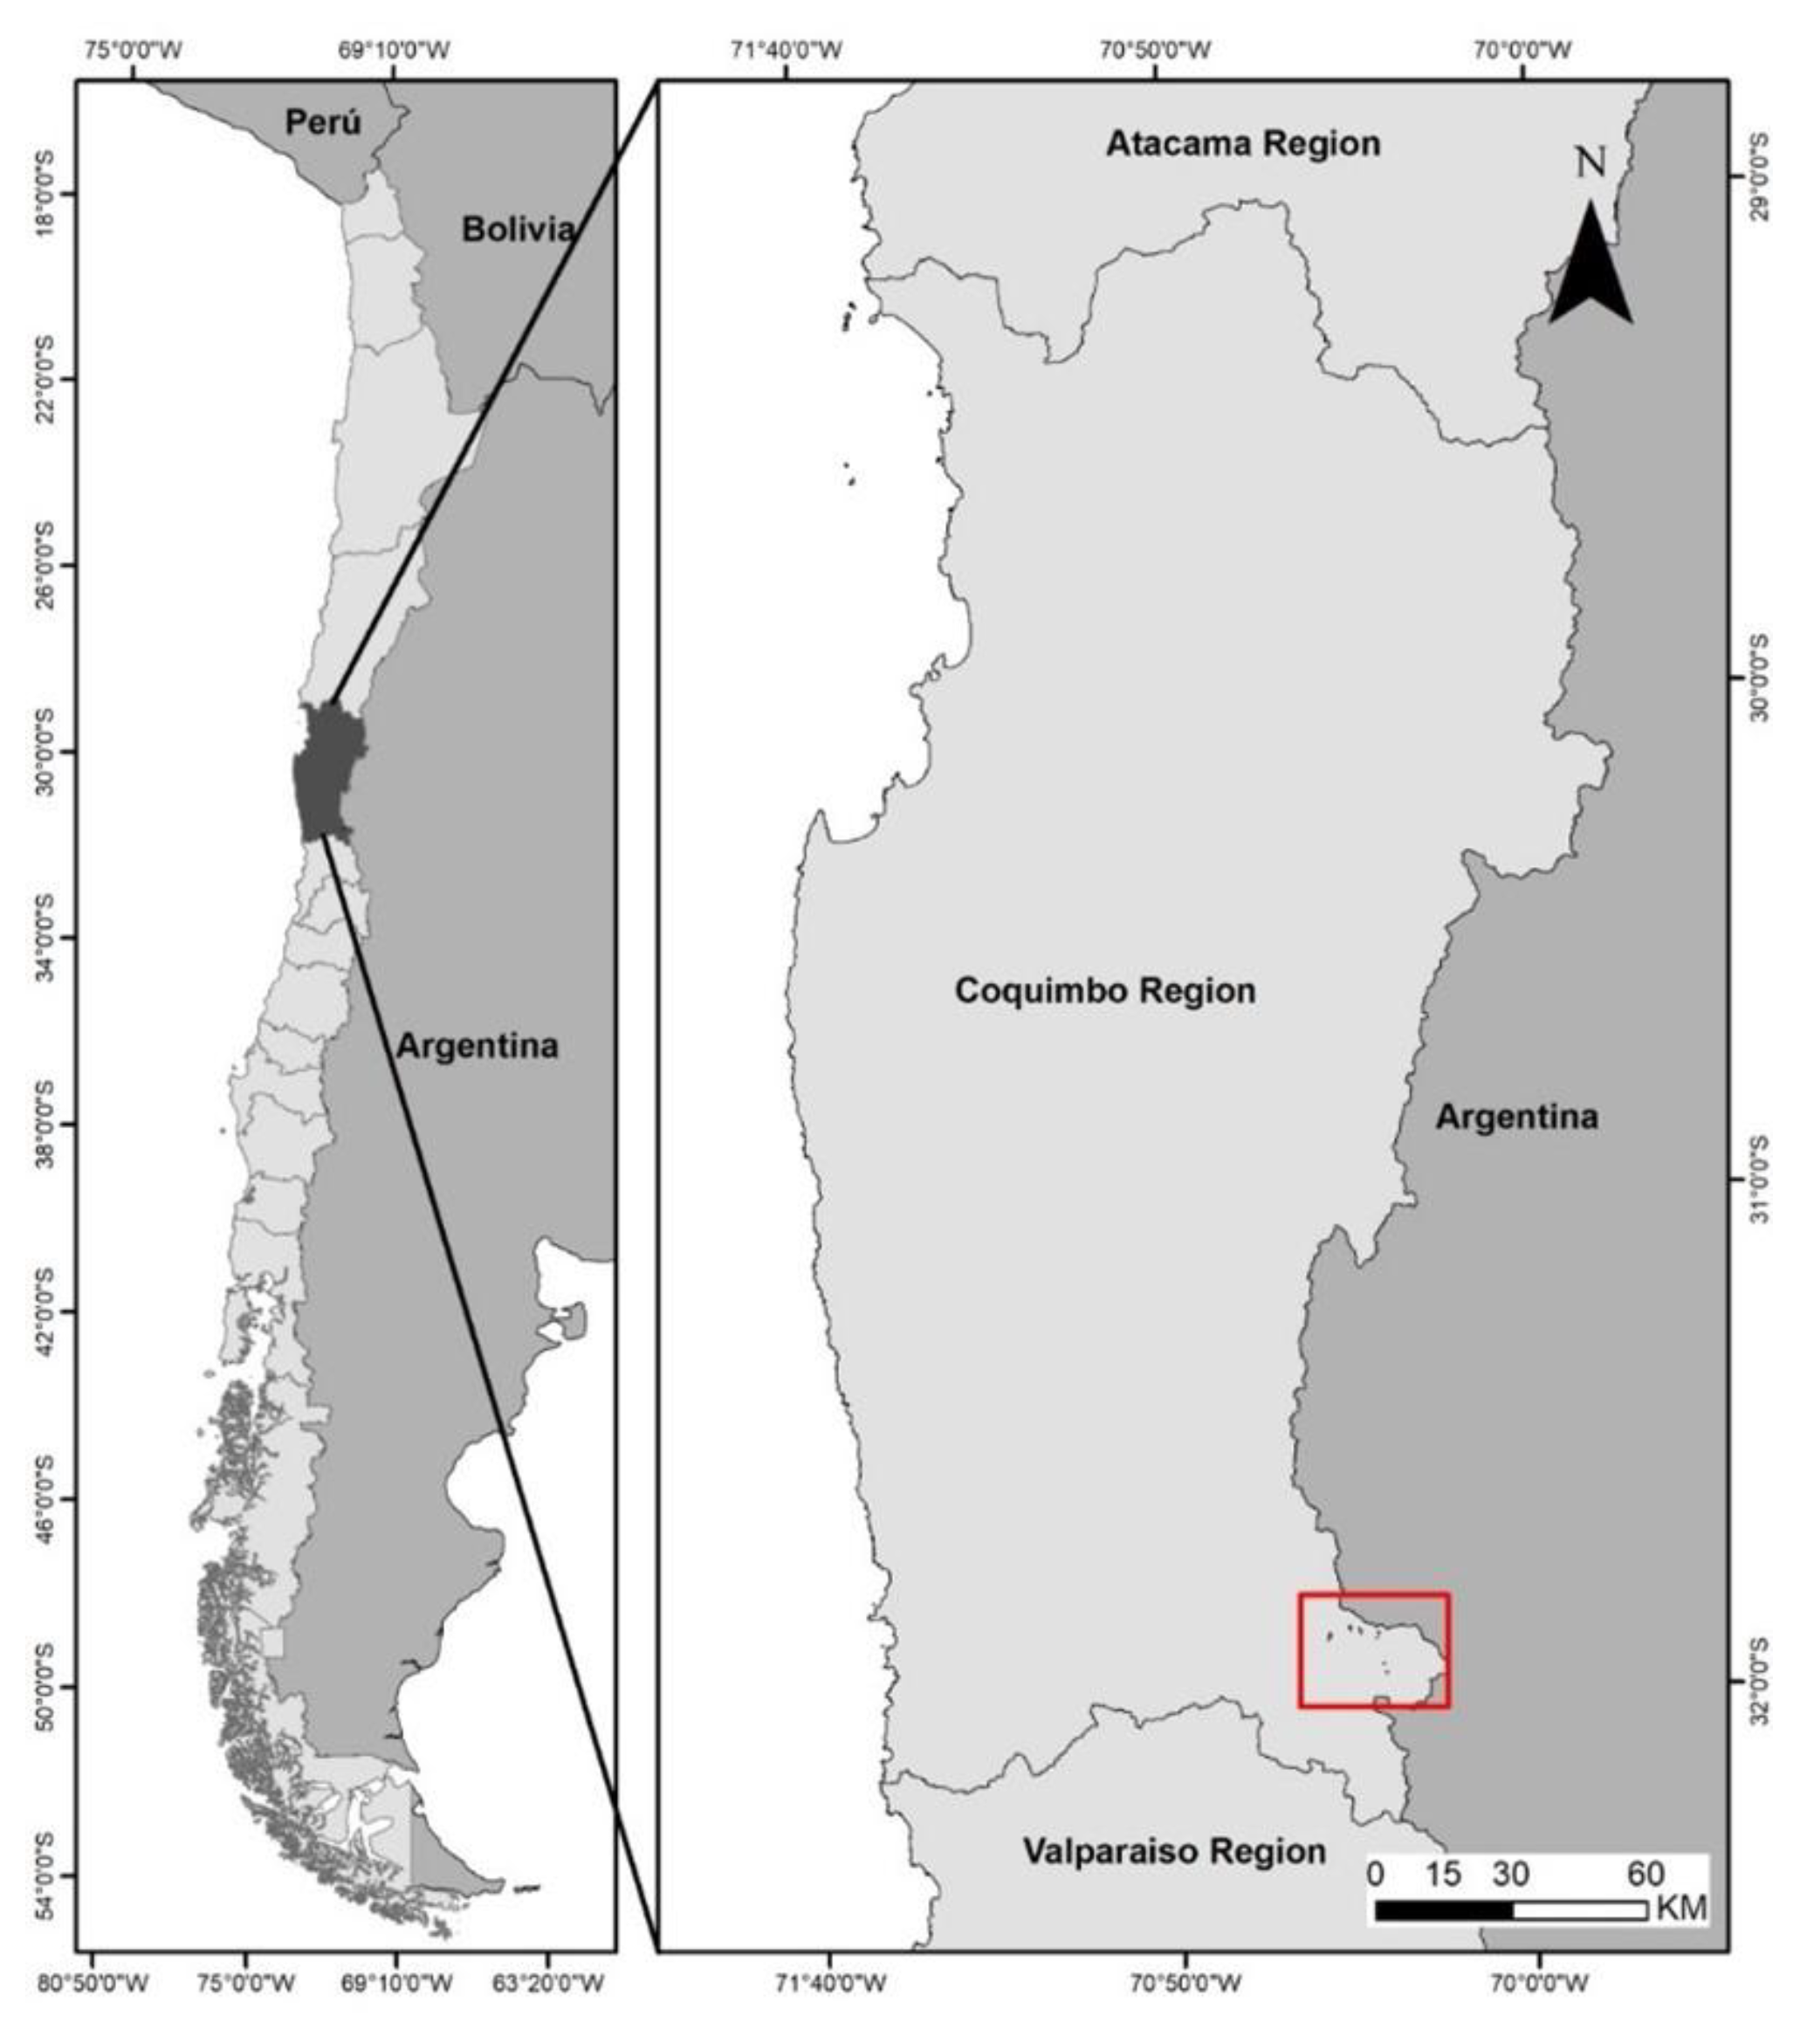
Figure 2.
Relative evenness indices (Jd) for Thinocorum orbignyianus, Lepus europaeus and Equus ferus caballus, in high mountain hydromorphic grasslands. The bar around the mean value indicates +/- one standard error. Different letters above the bars indicate significant difference at Tukey’s test at 5%.
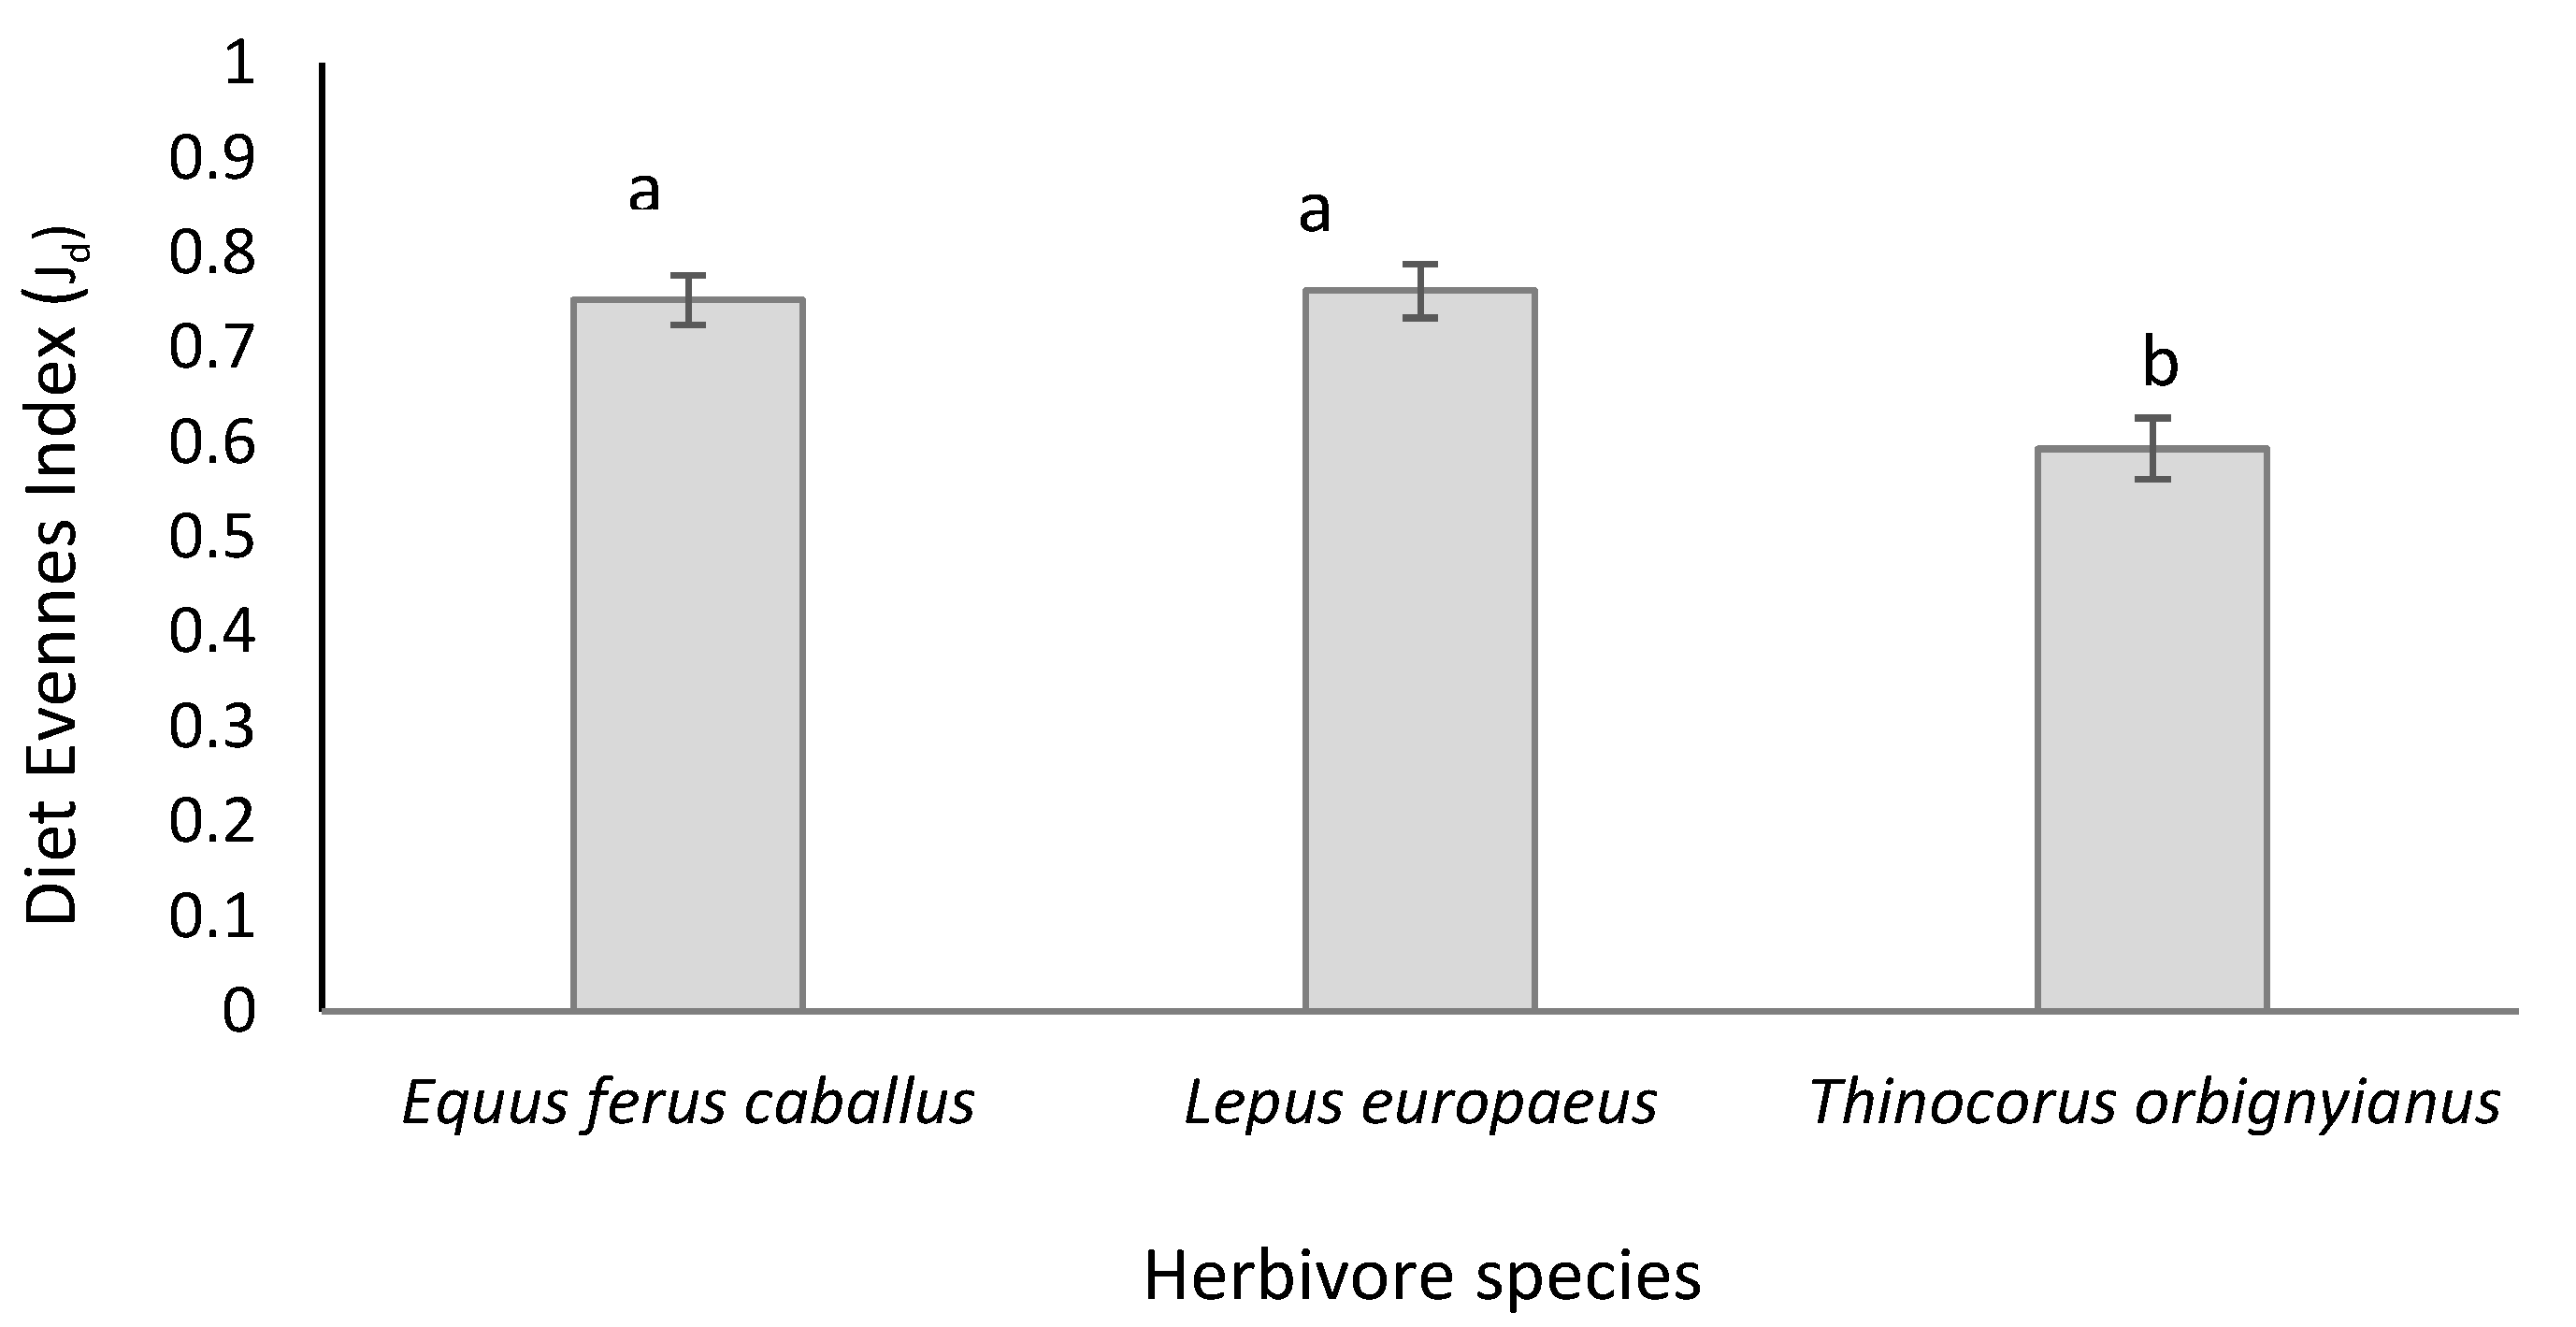
Figure 3.
Relationship between diet evenness index (Jd) and grassland patch evenness (Jp) for (A) Thinocorum orbignyianus, (B) Lepus europaeus and (C) Equus ferus caballus, in high mountain hydromorphic grasslands.
Figure 3.
Relationship between diet evenness index (Jd) and grassland patch evenness (Jp) for (A) Thinocorum orbignyianus, (B) Lepus europaeus and (C) Equus ferus caballus, in high mountain hydromorphic grasslands.
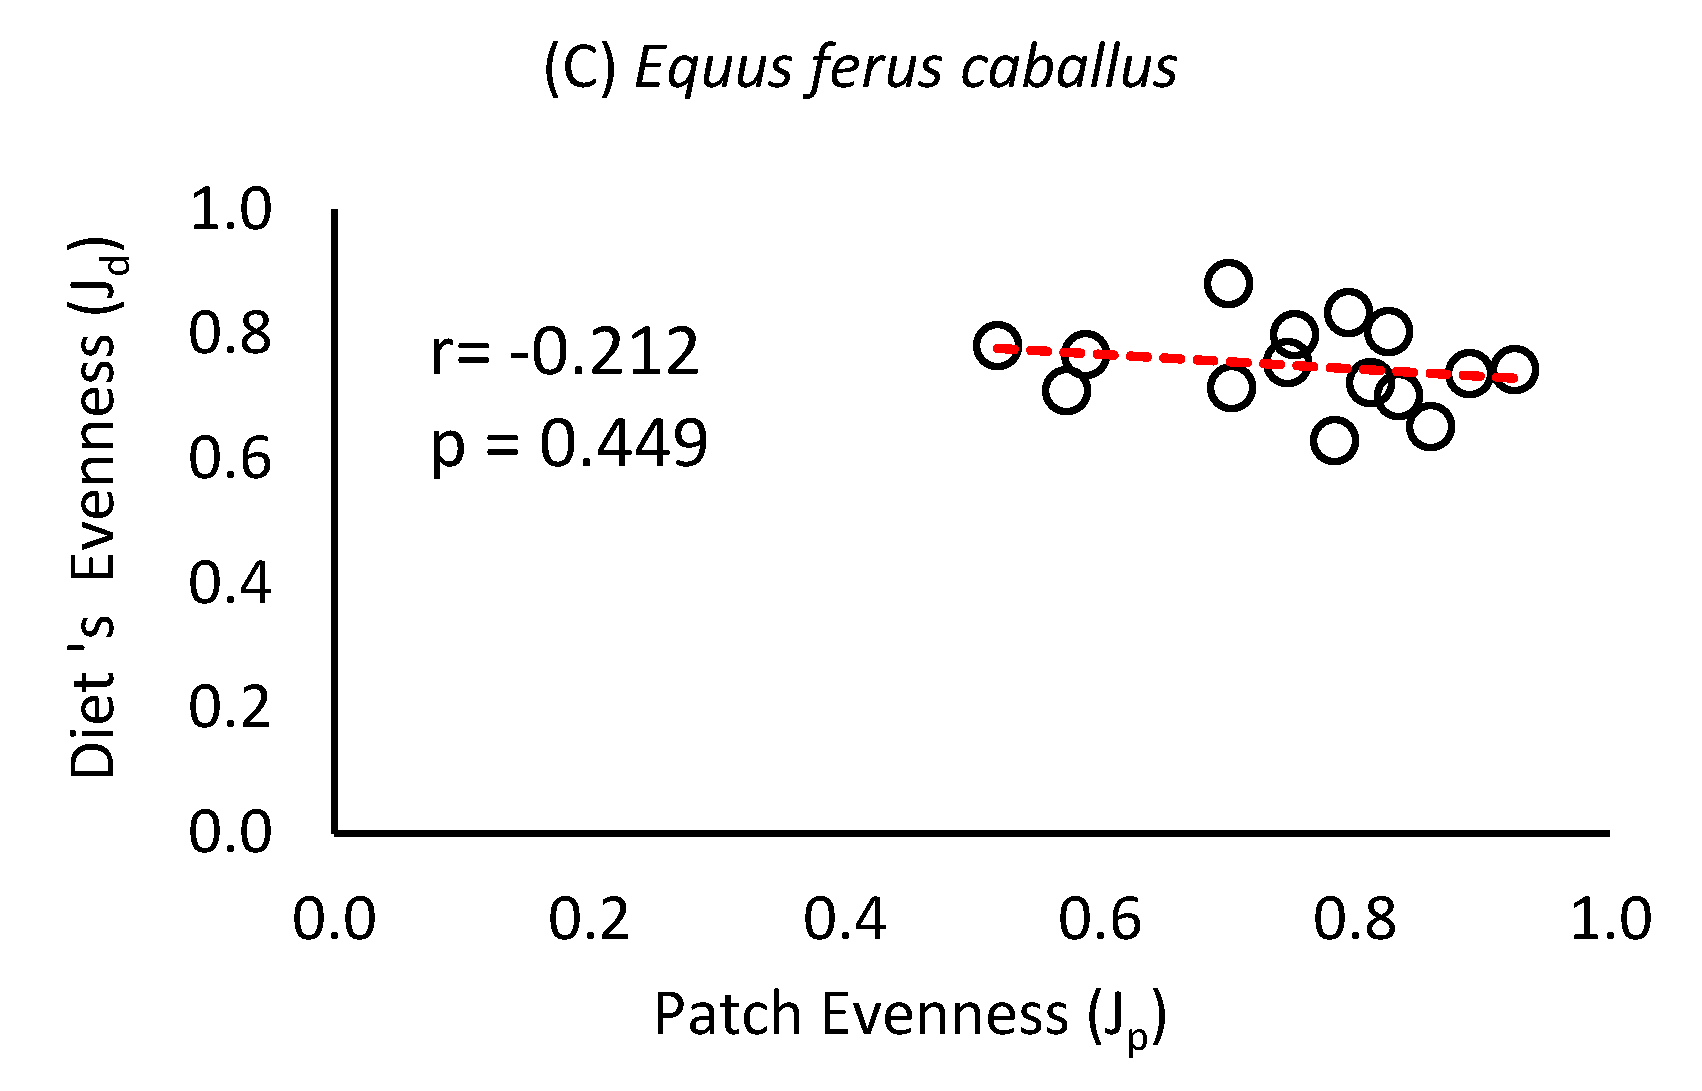
Figure 4.
Relationship between the diet evenness index of Thinocorum orbignyianus (Jd) and the dry matter production of the grassland patch (kg DM ha-1) in high mountain hydromorphic grasslands.
Figure 4.
Relationship between the diet evenness index of Thinocorum orbignyianus (Jd) and the dry matter production of the grassland patch (kg DM ha-1) in high mountain hydromorphic grasslands.
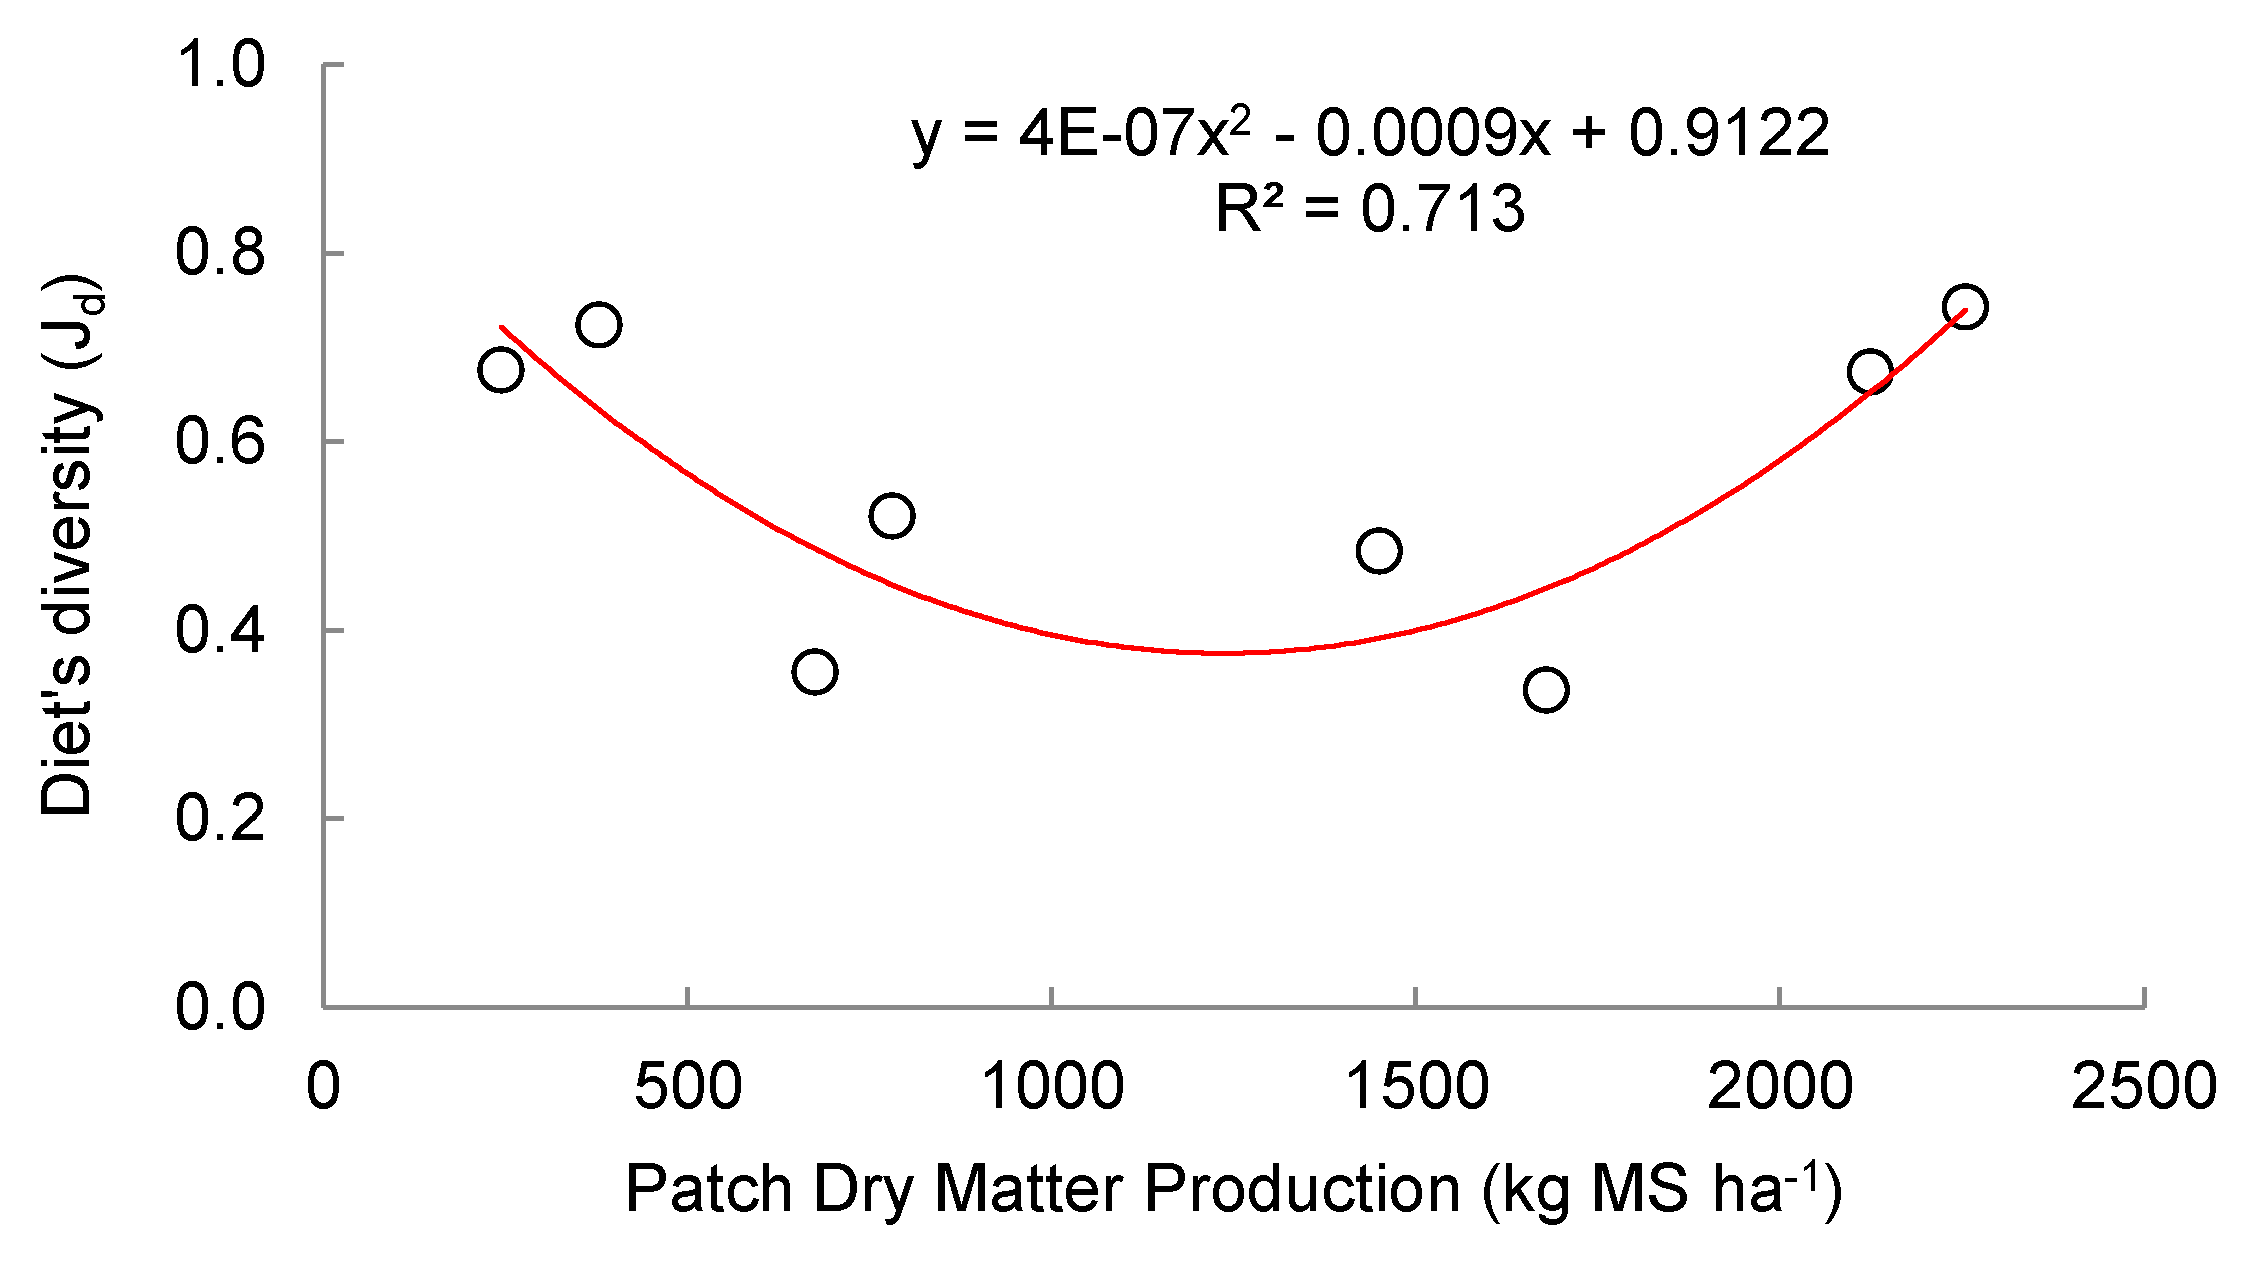
Figure 5.
Relationship between abundance of Carex gayana in the diet of Thinocorum orbignyianus (%) and the abundance of C. gayana in the grassland patch (%), in high mountain hydromorphic grasslands.
Figure 5.
Relationship between abundance of Carex gayana in the diet of Thinocorum orbignyianus (%) and the abundance of C. gayana in the grassland patch (%), in high mountain hydromorphic grasslands.
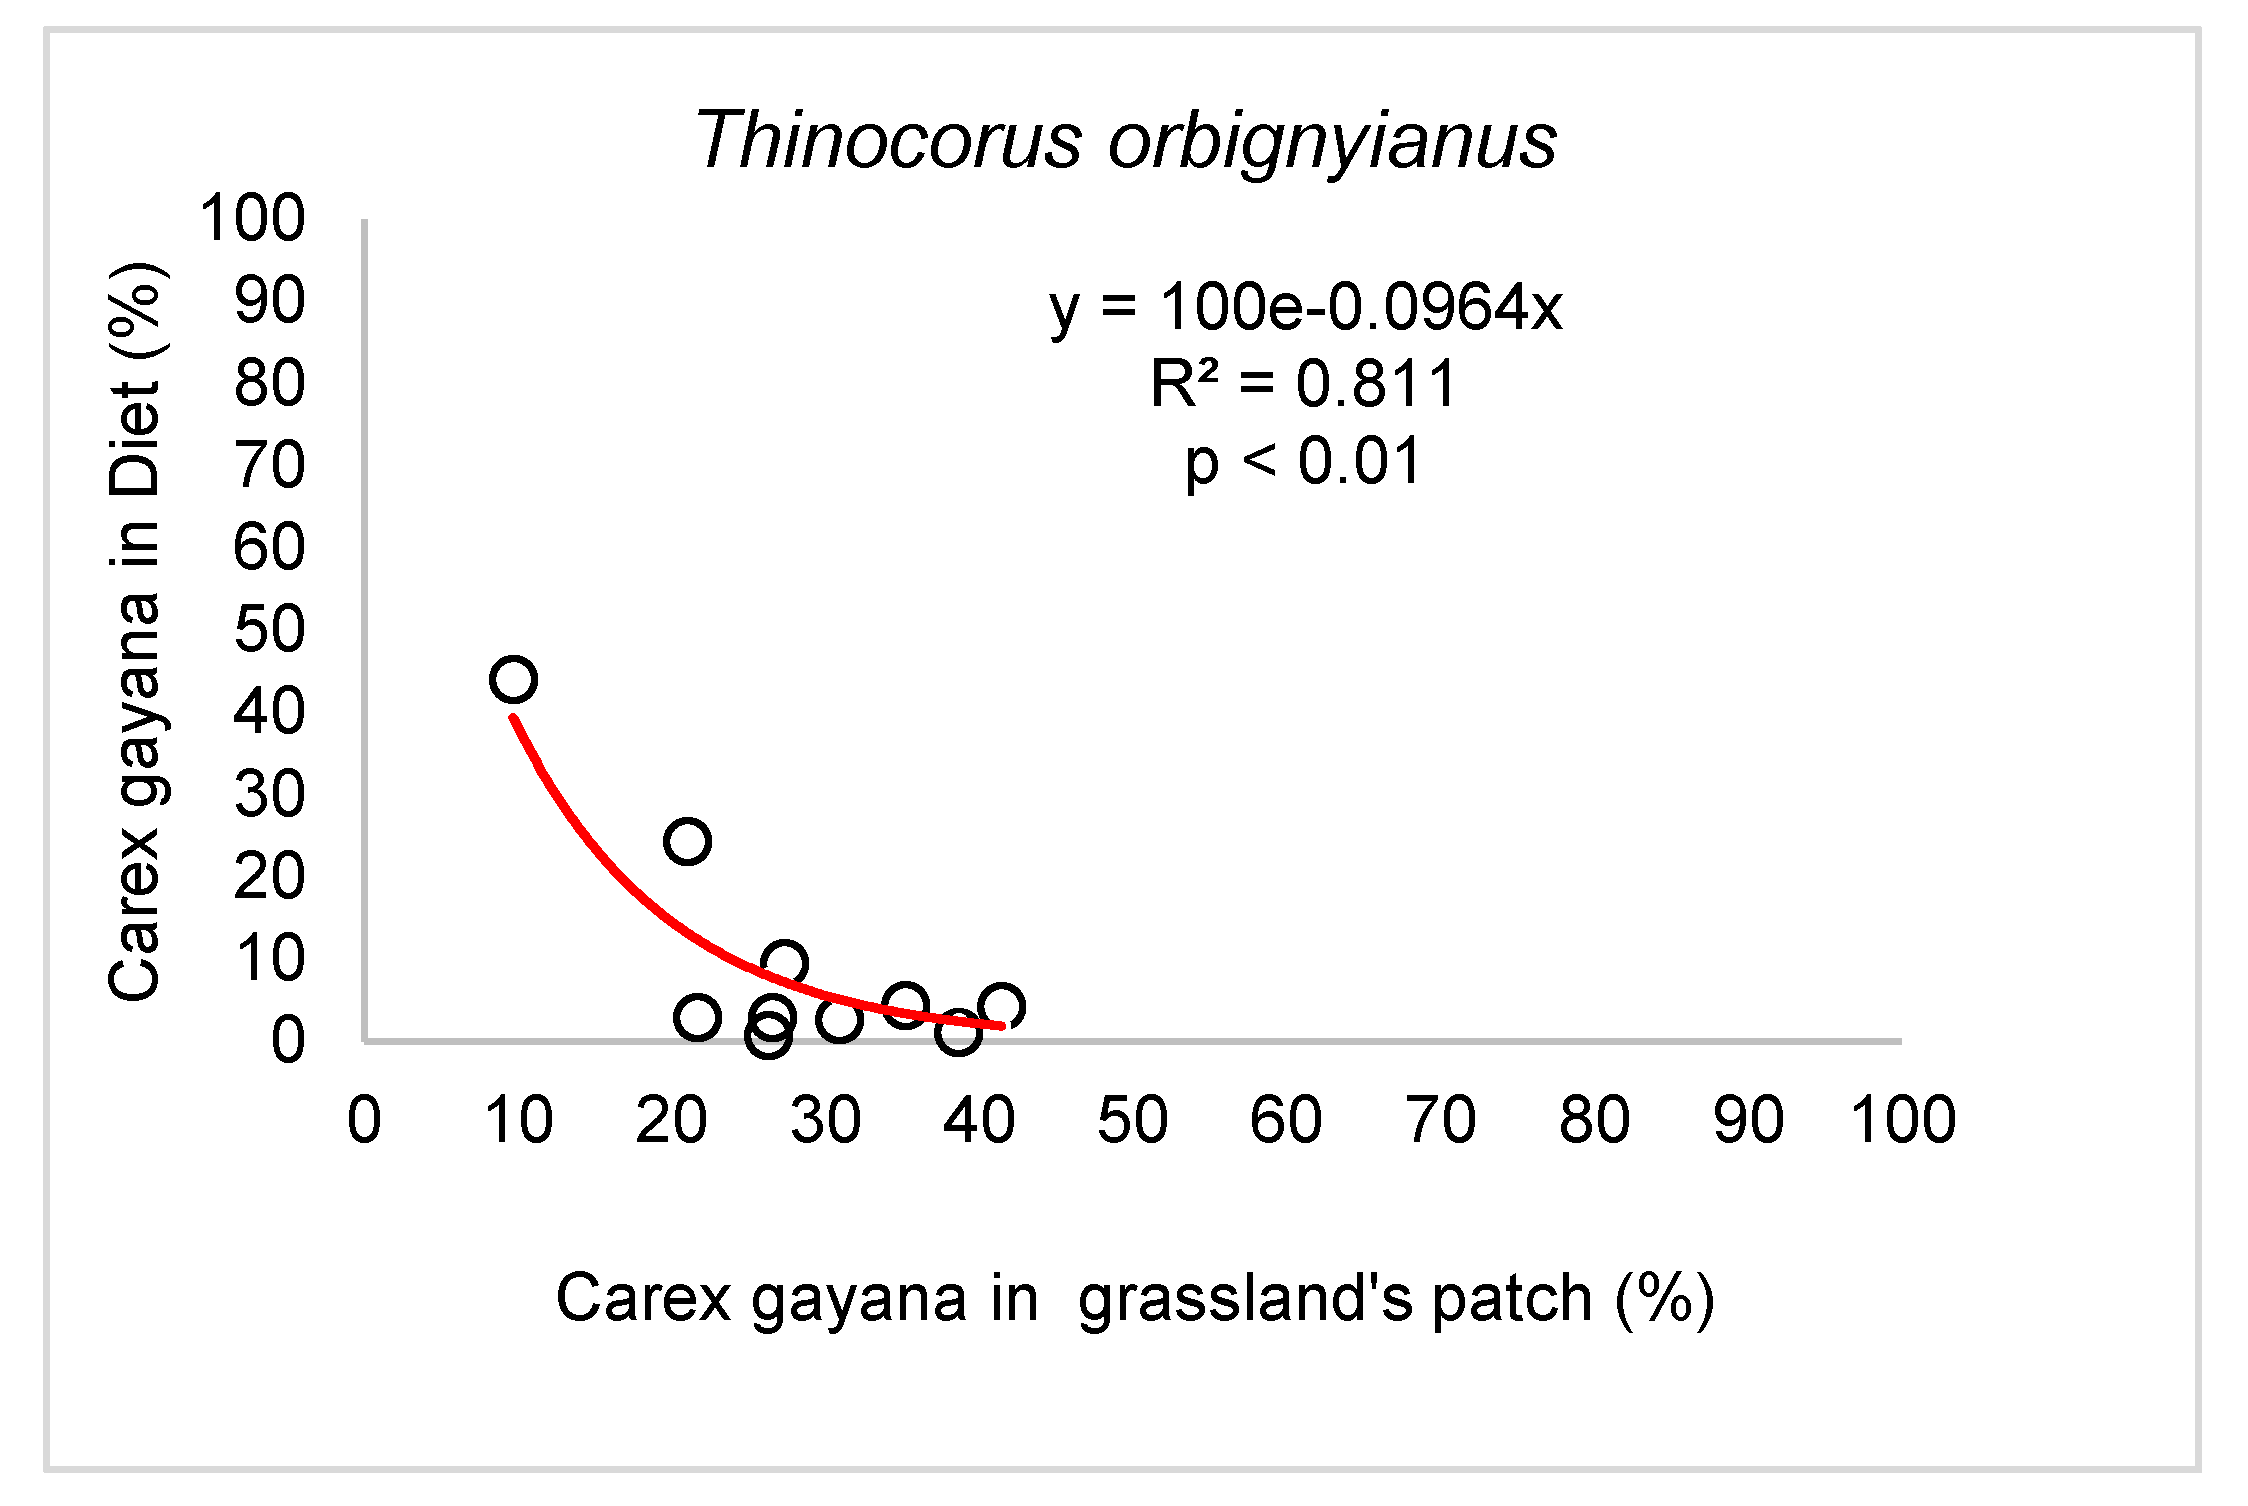
Figure 6.
Relationship between abundance of Carex gayana in the diet (%) and abundance of C. gayana in the grassland patch (%), for Lepus europaeus and Equus ferus caballus, in high mountain hydromorphic grasslands.
Figure 6.
Relationship between abundance of Carex gayana in the diet (%) and abundance of C. gayana in the grassland patch (%), for Lepus europaeus and Equus ferus caballus, in high mountain hydromorphic grasslands.
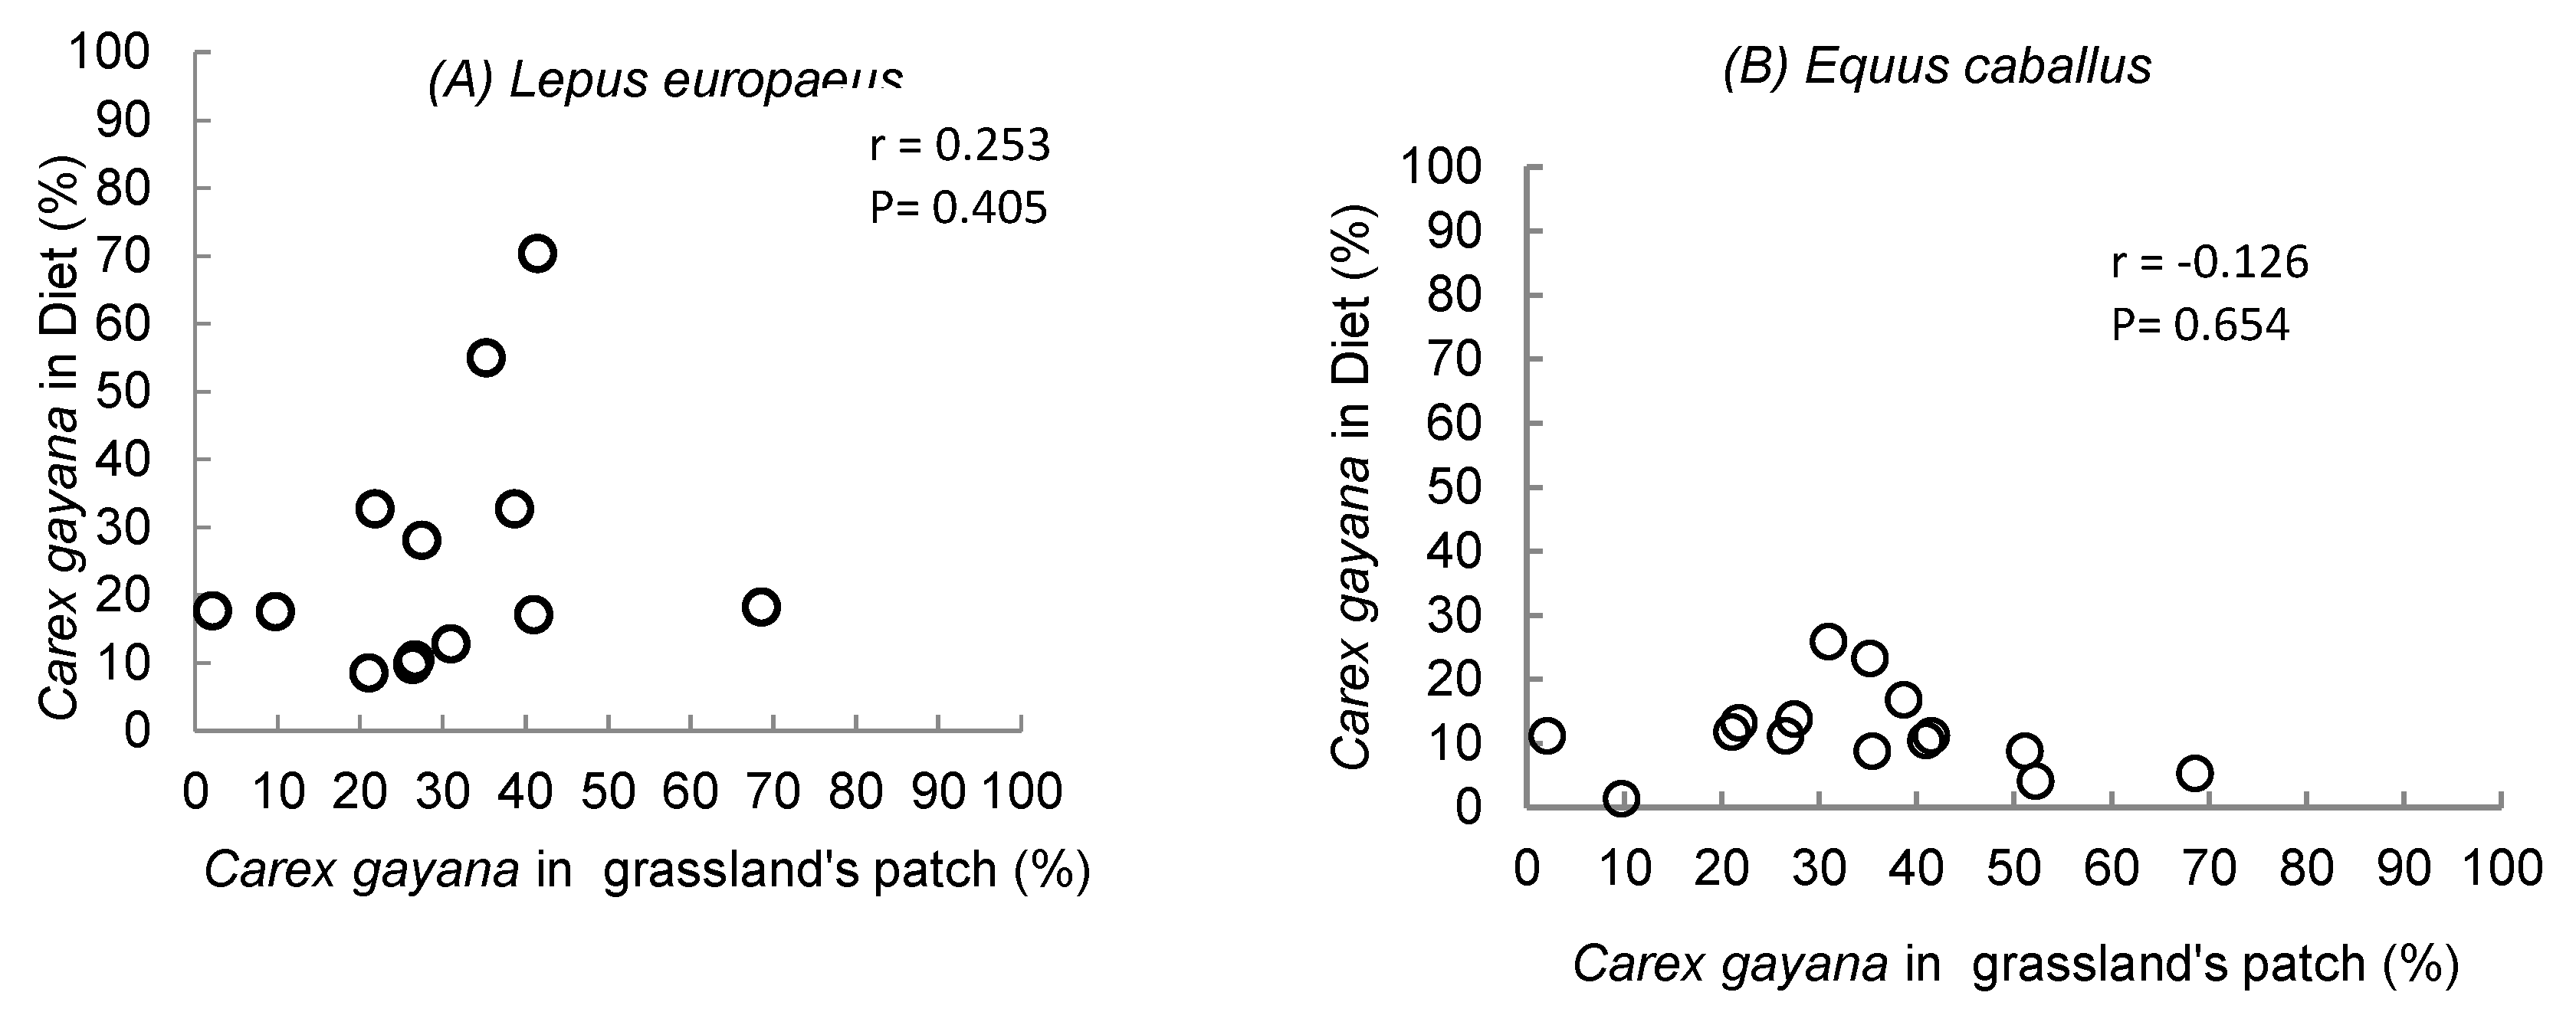
Figure 7.
Relationship between the abundance of Eleocharis pseudoalbibracteata in the diet (%) and the abundance of E. pseudoalbibracteata in the grassland patch (%), for (A) Thinocorus orbignyianus, (B) Lepus europaeus, and (C) Equus ferus caballus, in high-altitude hydromorphic grasslands.
Figure 7.
Relationship between the abundance of Eleocharis pseudoalbibracteata in the diet (%) and the abundance of E. pseudoalbibracteata in the grassland patch (%), for (A) Thinocorus orbignyianus, (B) Lepus europaeus, and (C) Equus ferus caballus, in high-altitude hydromorphic grasslands.
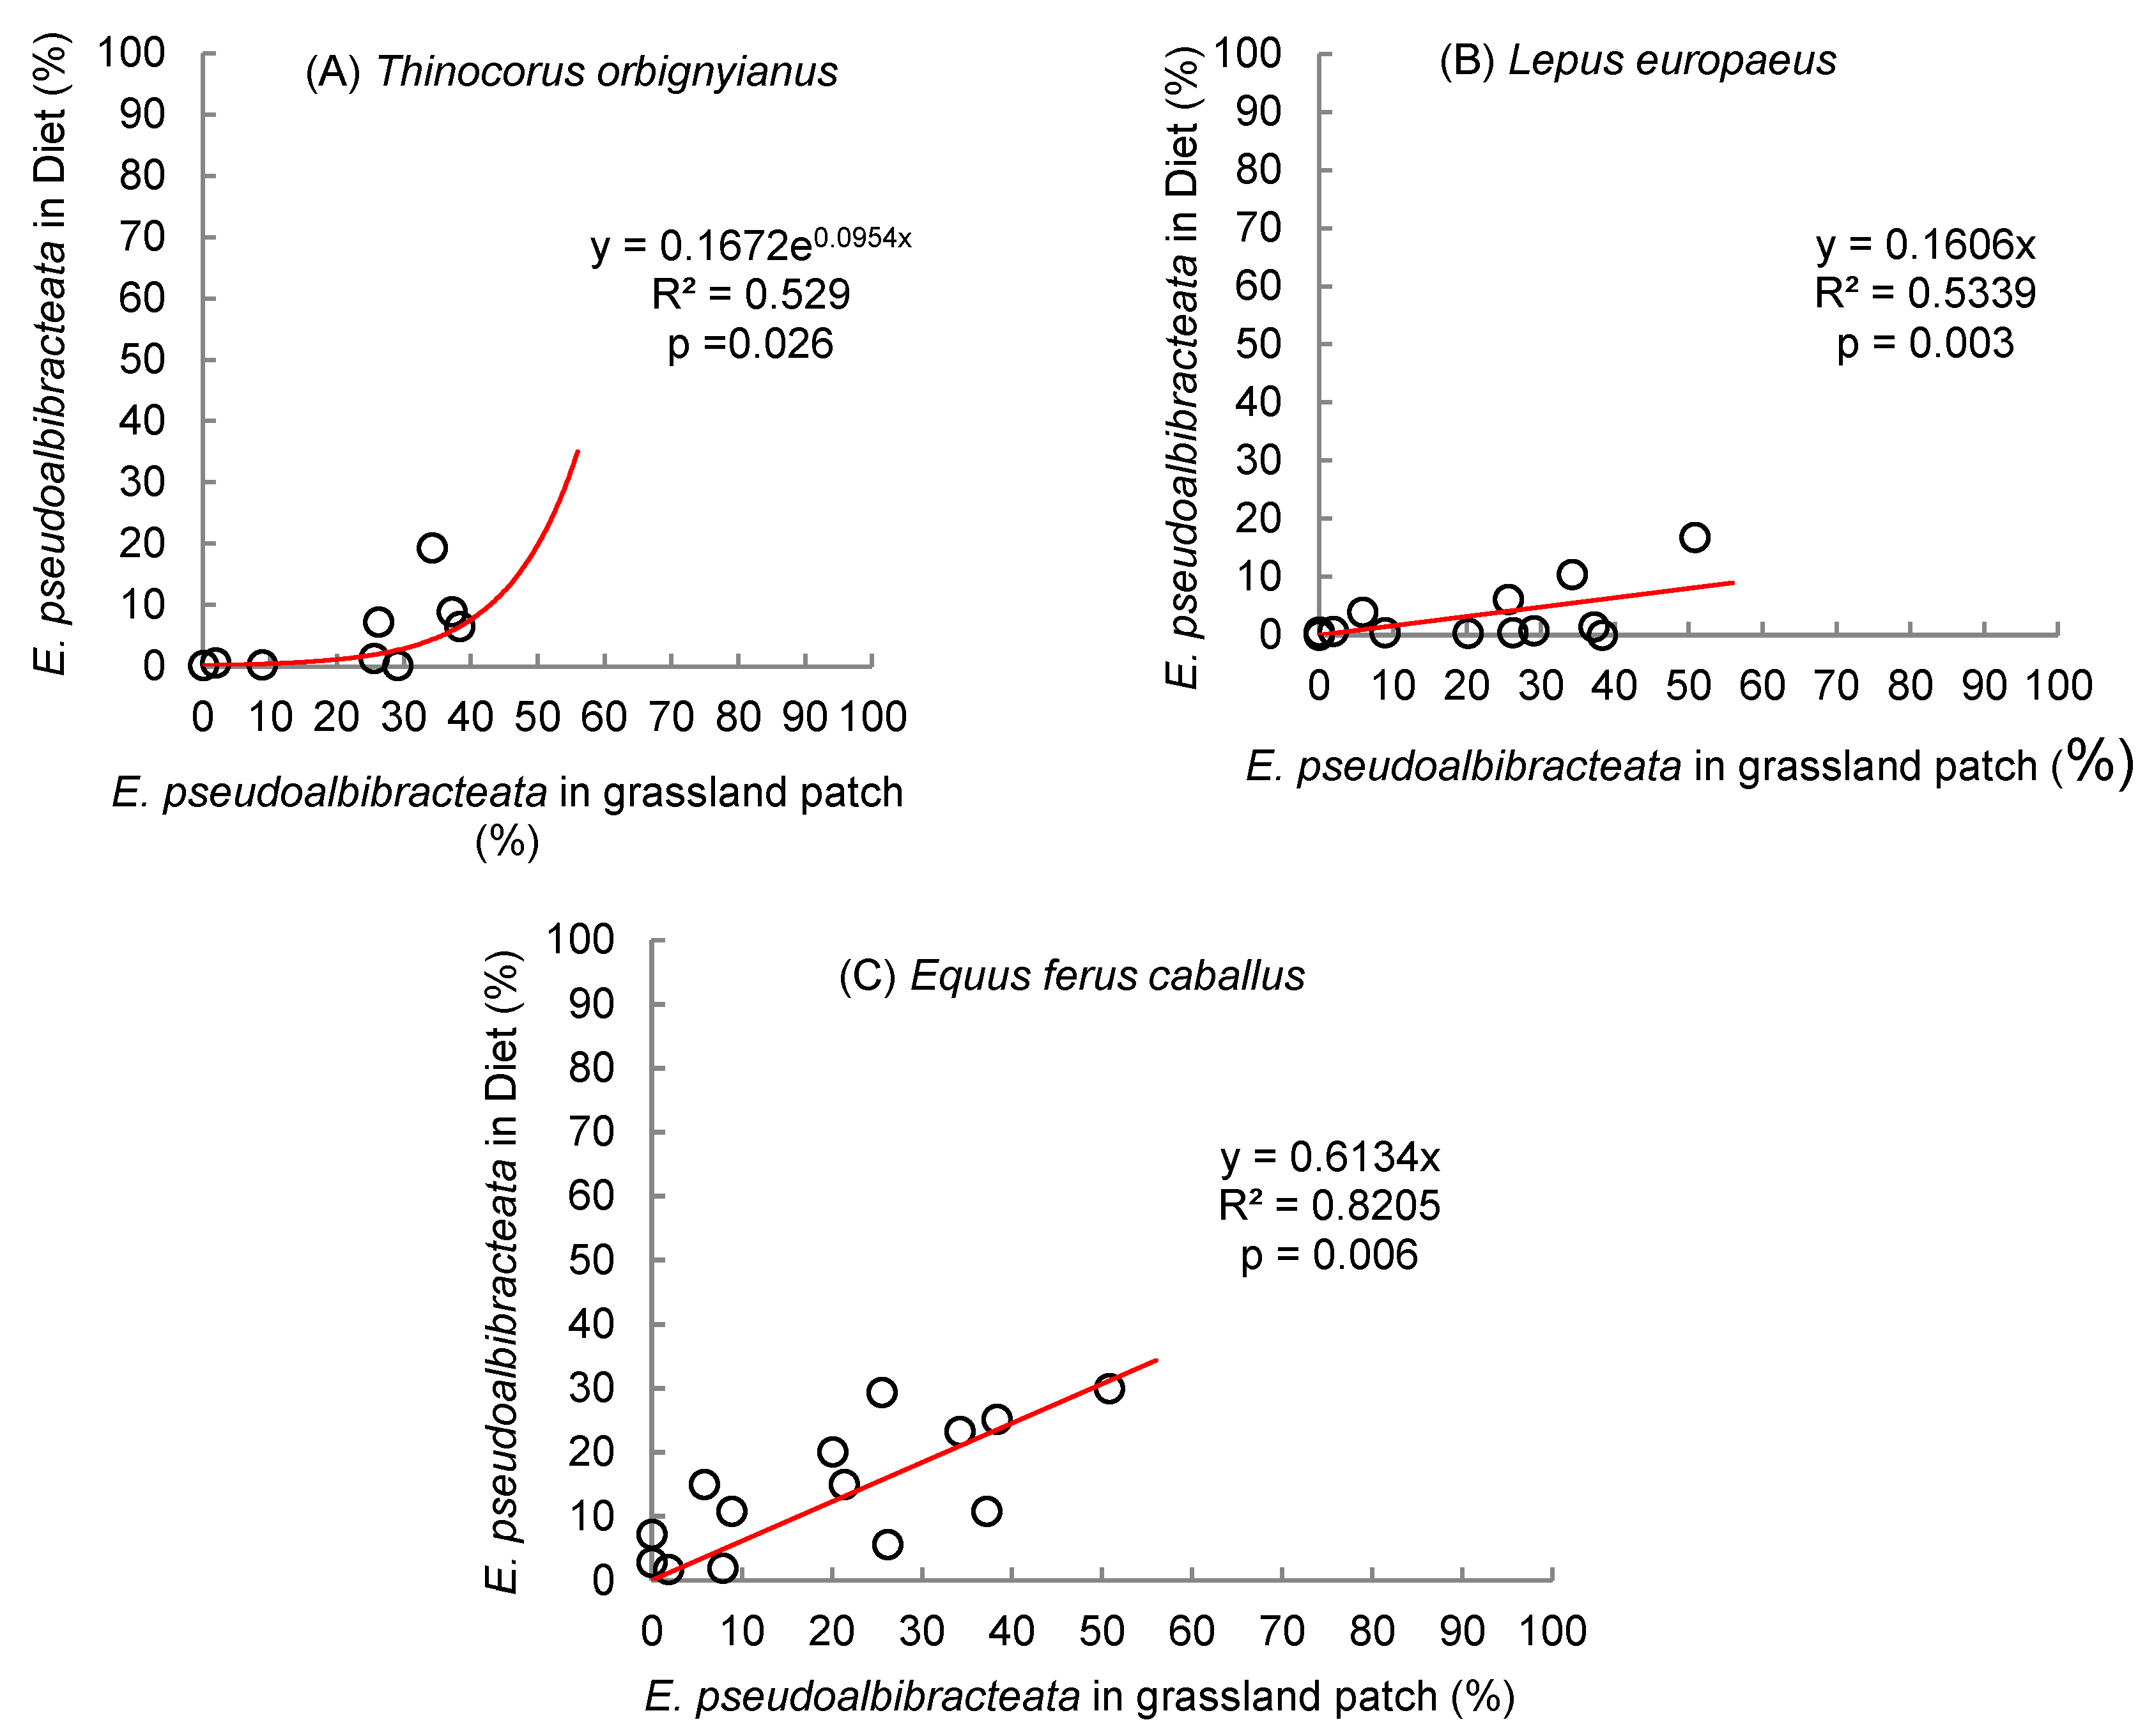

Table 1.
Bromatological analysis of the plant species Carex gayana and Eleocharis pseudoalbibracteata, which provide details the content of neutral detergent fiber (NDF, %), acid detergent fiber (ADF, %), crude protein (CP, %), dry matter digestibility (DMD, %), and metabolizable energy concentration (ME, MJ kg⁻¹).
| Plant species |
NDF (%) |
ADF (%) |
CP (%) |
DMD (%) |
ME (MJ kg-1) |
| C. gayana | 55.89 | 26.52 | 8.89 | 68.24 | 10.03 |
| E. pseudoalbibracteata | 50.48 | 30.70 | 8.63 | 64.98 | 9.47 |
Source: Animal Nutrition Laboratory. Agronomic Sciences Faculty. University of Chile.
Table 2.
Pianka’s dietary overlap index (0–1) for graminoid functional types among Thinocorus orbignyianus, Lepus europaeus, and Equus ferus caballus in high-altitude hydromorphic grasslands.
Table 2.
Pianka’s dietary overlap index (0–1) for graminoid functional types among Thinocorus orbignyianus, Lepus europaeus, and Equus ferus caballus in high-altitude hydromorphic grasslands.
| Herbivore species | Thinocorum orbignyianus | Lepus europaeus | Equus ferus caballus |
|---|---|---|---|
| Thinocorus orbignyianus | --- | 0.397 | 0.328 |
| Lepus europaeus | 0.397 | --- | 0.303 |
| Equus ferus caballus | 0.328 | 0.303 | --- |
Disclaimer/Publisher’s Note: The statements, opinions and data contained in all publications are solely those of the individual author(s) and contributor(s) and not of MDPI and/or the editor(s). MDPI and/or the editor(s) disclaim responsibility for any injury to people or property resulting from any ideas, methods, instructions or products referred to in the content. |
© 2025 by the authors. Licensee MDPI, Basel, Switzerland. This article is an open access article distributed under the terms and conditions of the Creative Commons Attribution (CC BY) license (https://creativecommons.org/licenses/by/4.0/).
Copyright: This open access article is published under a Creative Commons CC BY 4.0 license, which permit the free download, distribution, and reuse, provided that the author and preprint are cited in any reuse.


