
Submitted:
21 May 2025
Posted:
22 May 2025
You are already at the latest version
Abstract
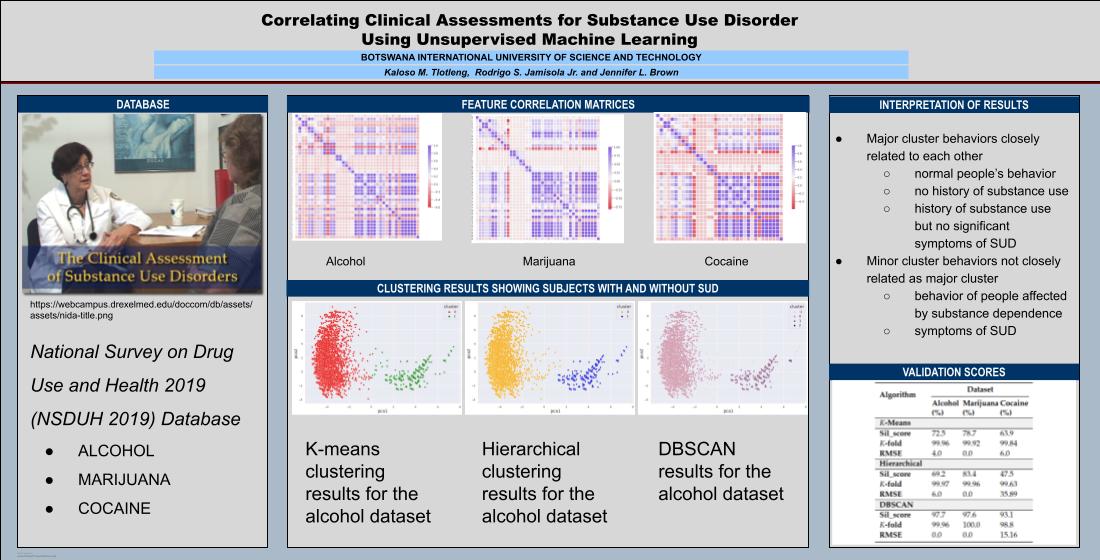
This paper investigates the state of substance use disorder (SUD) and the frequency of substance use by utilizing three unsupervised machine learning techniques, based on the Diagnostic and Statistical Manual 5 (DSM-5) of mental health disorders. We used data obtained from the National Survey on Drug Use and Health (NSDUH) 2019 database with random participants who had undergone clinical assessments by mental health professionals and whose clinical diagnoses are not known. This approach classifies SUD status by discovering patterns or correlations from the trained model. Our results are analyzed and confirmed by a mental health professional. The three unsupervised machine learning techniques that we used are k-means clustering, hierarchical clustering, and Density-Based Spatial Clustering of Applications with Noise (DBSCAN) applied to alcohol, marijuana, and cocaine datasets. The clustering results were validated using the silhouette score, k-fold cross-validation, and root mean squared error (RMSE). The results from this study may be used to supplement psychiatric evaluations.
Keywords:
Substance use disorder
; diagnostic and statistical manual (DSM)
; unsupervised machine learning
; k-means clustering
; hierarchical clustering
; DBSCAN
1. Introduction
Substance use disorder (SUD) is a major concern to the health sector due to the many harmful effects it causes the affected individual. Drugs reinforce negative behaviors that include drug-seeking and drug-taking [4], which greatly impact brain activity and the resulting behavior. There are distinct differences in how SUD affects the body, and as well as correlating effects of different substances on particular human behaviors. Many related studies have adopted means to diagnose SUD based on some deterministic and predefined sets of characteristics. These are standardized by the Diagnostic and Statistical Manual (DSM) of mental disorders [11] that is used as a guide in analyzing clinical data for SUD. Due to the serious consequences for the users of these substances, it is imperative to implement analytical measures that can help manage individual behavior. Machine learning is becoming a popular analytical tool in psychiatry given the clinical data of drug SUD [3]. With the given new data, the user can be diagnosed from the machine learning model which has been created from available data.
In the following paragraphs, we discuss studies in mental health disorders using unsupervised machine learning, the algorithms used to model mental health disorders, and the corresponding datasets used. Only one of the studies presented used DSM criteria. These studies are summarized in the first part of Table 1. The study [5] established a method that utilized the application of various machine learning algorithms to identify the state of mental health in a target group. It modeled the subjects’ answers to a questionnaire using unsupervised machine learning. It formed relevant clusters that were verified by mean opinion score. Classification models were labeled that predicted the mental health of individuals. The study adopted k-means, hierarchical, and k-medoids clustering techniques. Due to the limited availability of practical guidance to measure the prediction strength of unsupervised machine learning cluster models, [9] proposed an extension of the cross-validation procedure to evaluate the quality of the clustering algorithm and to predict cluster membership for new data points. This paper focuses on understanding, “how good the model is” or “to what extent has the model correctly assigned new data points to a relevant cluster”, and also measures the prediction strength of the model. It uses k-fold cross-validation to calculate the probability of the occurrence of the labels in both the training and testing data. The study further utilizes root mean squared error (RMSE) and mean absolute percentage error (MAPE) to evaluate the prediction strength of the algorithm. Calinski-harabasz score was used to obtain the optimal number of clusters and the model was tested using k-means. It identified three clusters for the Emotions dataset, four clusters for the Chronic Disease dataset, and five clusters for the Yeast dataset. The research showed promising results with an overall RMSE of less than 0.075 and MAPE of less than 12.5% for the three datasets. Identification and analysis of behavioral phenotypes in autism spectrum disorder (ASD) were carried out by [10] in which an unsupervised machine learning model was applied to ASD subgroups and their taxonomic relationships. In this study, a Gaussian mixture model was implemented which revealed 16 subgroups from a sample of n=1034, which was a subset of N=2400 for children with ASD. This portion of the trial was used as retrospective treatment data and the responses were examined using linear regression to understand how each sub-unit responded to varying treatment intensity. Hierarchical agglomerative clustering was performed before fitting the data into the regression model. The results revealed two overlying behavioral phenotypes. Within these patterns, unique and significantly low profiles contained sub-groups that differed in severity. The high variance shown by regression models indicated that clustering provides a basis for similarity which would be ideal for administering treatment based on these cluster memberships. Lastly, we present in the last paragraphs, studies that have established the application of supervised machine learning to SUDs and the corresponding datasets. All of these studies used DSM-5 criteria. A summary of these studies is shown in the last part of Table 1. According to [35], machine learning was used to identify health, psychiatric, psychological, and contextual features that are essential for the prediction of SUD. These behavioral markers were also utilized to predict individuals with a high risk of developing SUD. A total of 600 participants ( 494 male and 206 female ) were recruited and administered a questionnaire across several assessment waves that were carried out at the ages of 10-12, 12-14, 16, 19, and 22. The study used a random forest classifier to examine the characteristics that are mostly associated with SUD. Thirty of those variables strongly emerged as the strongest predictors for SUD. The results showed that in 10-12-year-old youths, the features predicted SUD with an average of 74% which increased to 86% for those at the age of 22. Compared to other machine learning algorithms, the random forest classifier had the best performance in predicting individuals at risk of developing SUD between the ages of 10-22. The examination of clinical and functional characteristics as predictors of AUD levels was carried out by [36]. The study establishes the extent of alcohol use, comorbidity, and impairment on the mild, moderate, and severe AUD levels. A total of 588 participants aged 18 and above recruited from 2016 to 2019 were assessed for DSM 5 AUD for current substance use. In this work, multinomial logistic regression was used to examine the association between potential validators, psychiatric disorders, functional impairment, and the three AUD levels. The results indicated that craving, binge-drinking frequency, problematic use, and harmful drinking had a more significant possibility of being associated with the three AUD levels compared to the reference group that had no AUD or any other substance use. It was reported that all the potential validators were also associated with severe effects of AUD more than the mild and moderate effects of AUD. By using 2015-2019 NSDUH data, [37] proposed a method to evaluate gaps in care for persons with AUD. The framework was developed on adults based on the following measures: their prevalence of AUD, the proportion of those who received health care in the past year and were screened for alcohol use, those with AUD who received brief intervention for misusing alcohol, those that were informed of alcohol misuse treatment, and lastly, those who received treatment. The results were classified according to alcohol severity and the cascades showed that most individuals with AUD received health care in the past year. It was also reported that a minority of individuals received intervention, treatment referral, and health aid. In classifying the severity of AUD, similar patterns were observed across the cascades of care and it was observed that people with AUD normally do not receive treatment even after screening for alcohol use. A study by [32] proposed a method to assess the degree of the existing relationships between the older and newer generations of illicit and prescription drugs. A total of 36,309 adults from wave 3 of the National Epidemiologic Survey on Alcohol and Related Conditions (NESARC-III) dataset aged 18 and above were assessed to evaluate the occurrence of comorbidity between DSM 5 CoUD, DSM 5 SUD, and substance use. Multivariable logistic regression results indicated that persons with current DSM 5 CoUD are more prone to using all examined drugs for a lifetime including a year of several newer class illicit and prescription stimulant-based substances. It was also found that the current DSM 5 CoUD could be related to the different DSM 5 SUDs with high comorbidity existing between them. In general, there are considerable studies on SUDs using machine learning but they discuss different types of SUD, different machine learning methods, and different datasets. Further, these studies have to consider the different elements of the previous SUD studies in order to make a contribution. This is what our proposed method is trying to achieve. The problem to be solved by the method presented in this paper is to be able to automatically classify people with SUD against people without, using clinical assessment data gathered in NSDUH. This database assesses behaviors that would be evaluated by mental health professionals trying to establish a DSM diagnosis. The efficacy of our proposed method is validated by a mental health professional. This tool will be very helpful in terms of creating a fast and accurate classification process that is not influenced by human errors. In this work, our contribution is the use of unsupervised machine learning with data from the NSDUH 2019 based on the DSM 5. To the best of our knowledge, this is the only work that processed data from NSDUH 2019 and used unsupervised machine learning to model them.
- Unsupervised machine learning is important in this kind of study because it allows the model to create its classification based on data correlations, instead of assigning the classifications beforehand.
- At the time of the study, NSDUH 2019 was a more recent database with 56,137 entries and half of the data size was used. DSM 5 is more current and is widely used by mental health professionals in classifying SUDs.
- The result of our study is an automated classification in terms of SUD based on DSM 5 and is validated by a mental health professional.
The reason for choosing unsupervised machine learning over the supervised method is that the data provided does not have class labels or target variables, in terms of SUD or non-SUD. The unsupervised method therefore allows us to make classifications based on data correlations without the need to predefine classifications before processing. If we had chosen to use supervised machine learning, then we would have labeled the data beforehand. However, we do not have the necessary information to be able to label correctly. Thus, unsupervised machine learning was the better choice. Section 2 of this paper describes the proposed methodology of our study and Section 3 introduces the materials and methods used. Section 4 focuses mainly on results and discussion while Section 5 outlines the analysis and machine learning interpretation of our results. The last section discusses the main conclusion drawn from the study along with future recommendations.
2. Methodology
The flowchart in Figure 1 depicts the logical sequence of our proposed methodology, which has four components: data, preprocessing, cluster analysis, and validation. The input to the methodology is the raw data from NSDUH and the output is the unsupervised machine learning model.
3. Materials and Methods
In this section, we describe the tools and outline the process we used to derive the required output, as outlined in the methodology.
3.1. Dataset
Data used for the study was obtained from a large online database containing critical details regarding the use of illicit drugs, tobacco, and alcohol. The NSDUH database has publicly available datasets and is a source of statistical information [13] which covers aspects of drug and substance use while also providing questionnaires from the DSM to assess mental health disorders associated with relevant addictive substances [12]. The questionnaire considered is based on the latest manual which is the DSM-5 and was published in 2013. Data from N=56,137 subjects was collected for clinical assessment, where each participant had to go through a psychiatric evaluation to diagnose their level of SUD. The participants in the survey are adolescents aged 12 to 17 years old and adults aged 18 years or older in the United States [34]. The method of data collection was random, as the questionnaire was given to different families without prior knowledge of their exposure to illicit substances. Therefore, their classification of either addicted or not addicted is not known. We considered variables from the sections: self-administered substance use, risk availability for that particular substance, and substance abuse and dependence. The last measure was used to diagnose the patients to find their level of SUD. All the features have variable code names.
3.2. Data Preprocessing
Upon review of the large online dataset, it was noticed that the collection of data included ten types of drugs plus alcohol, and tobacco but the main focus of this study will be on alcohol, marijuana, and cocaine SUD. The relevant features included answers to the questionnaire and based on DSM 5 criteria for substance use disorder.
3.2.1. Data Cleaning
This is a data treatment technique whose main purpose is to deal with missing data, in order to avoid both bias and overestimation of the prediction accuracy in psychiatric research [22]. Most of the features included missing data, indicating that some of the questions during the psychiatric assessment were not answered by participants while some dropped out of the survey [14]. We observed that the values in the dataset were missing completely at random (MCAR) because the probability of missing data is not dependent on either observed or unobserved data [24]. Since our data type is MCAR, mean imputation is necessary to prevent bias and keep variability between the input labels constant. This will reduce the magnitude between the largest and smallest values of the sample.
3.2.2. Feature Correlation
Feature Correlation is performed on the raw data with complete information. This is the second necessary step to find correlations of features from the raw data. The method here uses a linear relationship between features which can help discard irrelevant and redundant data to improve computational time [16,23].
3.2.3. Feature Scaling
Feature scaling puts the data into a range of values that will equalize the strength of each data entry. This is the necessary third step that involves the computation of data values, with completed information and devoid of redundant or irrelevant data. This method will standardize the varying magnitude of the subject’s responses during the survey [17], to scale down the minimum and maximum values to a common measure.
3.2.4. Dimensionality Reduction
This technique deals with high-dimensional and multivariate data [15] to visualize a multi-dimensional space into a lower-dimensional space, e.g., 2D. This is the last necessary step in our data preprocessing to help us with data visualization by considering only the two most important components. There were 40 features for the alcohol and cocaine datasets and 35 features for the marijuana dataset.
3.3. Cluster Analysis
We used three clustering techniques, namely, k-means, hierarchical, and DBSCAN. After performing dimensionality reduction, we fed the data into these models to create 2-D visualization of the results. According to [27], the clustering techniques can be of three types, namely, partitioning, density-based, and hierarchical-based.
3.3.1. K-means Clustering
3.3.2. Hierarchical Clustering
We used agglomerative hierarchical clustering for this technique where each point is considered an individual cluster initially until similar clusters are merged to form one big cluster. As with k-means, we need a predefined number to obtain optimal clusters and we make use of the technique called dendrogram that follows a bottom-up structure where each data point is initially an individual cluster.
3.3.3. DBSCAN
DBSCAN algorithm relies on the density of data-point distribution and uses two parameters epsilon (eps) and minimum points (minPts) to identify the density of data and then classify data points as either core point, border point, or an outlier [21].
3.4. Validation
To confirm our cluster results, we incorporated metrics in our study that checked for the prediction accuracy and error deviation of our three algorithms. We used silhouette score for internal validation and k-fold cross-validation, and root mean squared error for external validation.
3.4.1. Internal validation
The objective is to assess the quality of the clustering structure between the data itself and help us choose the best clustering algorithm as it relies on the information presented in the data [9]. Silhouette score is used to evaluate clustering quality and how clusters compare to each other within the algorithm.
3.4.2. External Validation
4. Results and Discussion
In this section, we present graphical visualizations of our results from the three clustering algorithms. We start with k-means, followed by hierarchical clustering, and DBSCAN. Our clustering results showed similar visualizations across the three algorithms in classifying SUD for the three substances, and are validated using silhouette score, k-fold cross-validation, and RMSE.
4.1. Alcohol Dataset
We proceed with k-means clustering using two clusters as shown in Figure 2. The structure shows very tightly spaced data points within each cluster while a few are scattered around indicative of a larger Euclidean distance from the mean. It is noted that the green cluster has a longer range along the pca1 axis compared to the red cluster, while the red cluster has a longer range along the pca2 axis compared to the green cluster. The red cluster, being denser within its region, clearly suggests it is most likely classified correctly. The more points present in the same region support the consistency of the computed results, thus confirming the commonality of answers by several respondents. The green cluster is less dense than the red cluster, but its denser region can be virtually recognized from the graph. The reason for this is that the classification of SUD can be categorized into two major classifications, with one classification consisting of the majority of the respondents. It is noted that the region of the green cluster is around two-thirds the size of the red cluster which can be attributed to the questions given to the respondents which are uniform, while the answers depend on the respondents’ experience. Thus, the cluster regions are defined by the features that are based on the answers to the survey. However, the green region is lesser because it consists of fewer respondents whose answers can be less diverse compared to when the respondents who provide much more information. On our graph, the data points in the orange cluster are closer to each other and have shorter cluster distances. We can say that the data points are dense and well-distributed throughout the entire range. We can also say that the orange cluster consists of a much larger number of respondents compared to the green cluster. For the green cluster, the data points near the boundary between the clusters are denser but dispersed further along the x-axis. This can be attributed to the distances between the data points in the green cluster which are larger compared to the distances between points in the orange cluster, thus confirming that the orange cluster is much denser than the green cluster. For DBSCAN, the graph visualization, in general, showed similar results to k-means and hierarchical clustering. The centroid of the clusters and their boundaries are roughly similar in all three methods as shown in Figure 4. However, in the results shown, there are four clusters with two major clusters that are similar in form to k-means and hierarchical clustering. If we choose to have only two clusters in the DBSCAN, then the results would be very much similar to k-means and hierarchical clustering.
The k-means clustering results for the marijuana dataset are shown in Figure 5. The red cluster shows more data point distribution with a majority of dense data points compared to the green cluster. This algorithm finds it difficult to deal with outliers, explaining why they form part of the clusters. As observed on the graph, a couple of data points are far from the centroid yet still classified under respective groups. We can observe large intra-cluster distances and fewer data point density on the orange cluster compared to the green cluster. The first data points are closely correlated but the distances increase as we move up the hierarchy. The green cluster shows more data point distribution and density with a wider range. Hierarchical clustering results for the marijuana dataset are shown in Figure 6. In the figure, the clusters are clearly distinguished. The orange cluster has dispersed data points with larger intra-cluster distances as only a few data points have minimal separation. The cluster is less dense than the blue cluster which has more data point distribution, and less dispersion. We can observe that this data is classified between two unique classes with the majority of respondents belonging to the blue cluster. The results of hierarchical clustering show very similar results to that of k-means. The DBSCAN results for the marijuana dataset are shown in Figure 7 with two major clusters and four other minor clusters. In general, cluster classification is similar to k-means and hierarchical clustering. The only difference is that the four minor clusters with centroids lying far from the centroids of the two major clusters can be absorbed by them resulting only in two major clusters.
4.2. Cocaine Dataset
The k-means clustering results for the cocaine dataset are shown in Figure 8. There is a clear distinction between the two clusters and a much greater Euclidean distance. The red cluster indicates a close relationship between its members as most of the data points are located around the centroid at a much lesser distance. For the green cluster, the majority of the data points are far from each other by some degree but still share similar characteristics. The major difference between these results and the previous results for alcohol, and marijuana is that our clusters occupy a large scope/range of values in the pca1 and pca2 axis. The hierarchical clustering results for the cocaine dataset are shown in Figure 9. The cluster classification for this algorithm is similar to k-means clustering in terms of data point density per cluster. The DBSCAN results for the cocaine dataset are shown in Figure 10 with two major and four minor classifications. The clustering structure is similar to k-means and hierarchical clustering, but the difference is that it has overlapping data points and groups. Overall, six clusters are plotted on the graph. We can observe the minor clusters formed within these main clusters and their centroids are closer to the centroids of the main clusters.
4.3. Validation Results
Table 2 presents the validation scores obtained for each algorithm. We test the performance of the three techniques for each dataset and outline the results as percentages. These metrics were used to assess the cluster relationship, prediction accuracy, and error deviation.
In the following paragraphs, we discuss the internal and external validation results obtained using the classical methods.
The silhouette score obtained for k-means under alcohol dataset was 72.5% which means that the clusters are separated and data points are assigned satisfactorily. Based on the prediction accuracy and error, the performance of the model was very good as it managed to predict 99.96% of the possible assignment of clusters for our test dataset with an error of 4%. We noticed a percentage reduction for the silhouette score of 69.2% under hierarchical clustering compared to k-means while the error deviation increased by 2% as referenced in Table 2. The prediction accuracy obtained was 99.97% which remained the highest recorded for the three algorithms. The validation results for DBSCAN under the alcohol dataset showed very impressive values for the three metrics, as we obtained 99.96% and 0% prediction accuracy and error respectively with a silhouette score of 97.7%. Generally, the performance of the clustering algorithms was much better under marijuana, as it recorded silhouette scores of 78.7% for k-means, 83.4% for hierarchical clustering, and 97.6% for DBSCAN. The prediction accuracy was 99.92% for k-means, 99.96% for hierarchical clustering, and 100% for DBSCAN while the prediction error remained 0% for all three algorithms. Cocaine recorded the lowest silhouette scores for k-means and hierarchical clustering which are 63.9% and 47.5% respectively. It also recorded the highest prediction errors of 6% and 35.89% for the two algorithms. For DBSCAN, we obtained a silhouette score of 93.1%, prediction accuracy of 98.8%, and prediction error of 15.16%. These results indicated the worst performance overall under cocaine for intra-cluster correlation and error deviation. The only approximately consistent scores are the prediction estimates for our model in which all of them were at least 99.9% as presented in Table 2. We discuss, in the following paragraph, the comparison of the internal and external validation results between the classical and state-of-the-art methods.
As can be seen from the Table 2 and Table 3, the state-of-the-art algorithm results are not far from the results of the classical algorithms. It is notable that for the most part, the classical methods perform better than the state-of-the-art. The interpretation is that state-of-the-art algorithms do not necessarily result in better performance and that the results can also be dependent on the type of data that is considered. In this case, the data gathered from the respondents in the survey related to SUD prove to be processed better by the classical methods.
5. Interpretation of Results
In this section, we discuss our interpretation of the data that is being modeled and analyzed using machine learning. We present two types of interpretation: one that is based purely on the machine learning model and another that is based on the interpretation by a mental health professional.
5.1. By Machine Learning
The machine learning interpretations are based on the graph visualizations by outlining all the observed trends in our clustering model. We compare the results by regions of the density of the clusters, the range of coverage, and lastly by the boundaries between the clusters. In all the clustering results, we observe two major classifications: a major cluster and a minor cluster. The major cluster is a dense region and the minor cluster is a less dense region. We interpret the major cluster as the behaviors of persons with no significant symptoms of SUD. In this case, they cover significantly large variations of activities and are closely related to each other. We further interpret this as related to the everyday activities of persons with no SUD which is significantly similar to others with no SUD. The minor cluster is interpreted as the behaviors of persons showing symptoms of SUD. In this case, each person has a unique response to SUD that somehow restricts them from performing normal activities, such that these activities are significantly different from the other persons with symptoms of SUD. This results in a less dense cluster because the person’s activities are now limited and are different from others with SUD. We can observe that the major and the minor clusters of the alcohol dataset are closest to each other compared to the major and minor clusters of marijuana and cocaine. The distance between the cluster centroids is the smallest in the alcohol dataset compared to the other two substances. Thus we can interpret that it is easier for a person to move from non-AUD to AUD compared to moving from independence to dependence on marijuana or cocaine, and vice versa. We can further interpret that the rehabilitation efforts needed for the person to become free from AUD require the least efforts compared to CaUD or CoUD. The major and minor clusters of the marijuana dataset are farther from each other compared to the alcohol dataset. The distance between the cluster centroids in the marijuana dataset is more than the distance between the cluster centroids in the alcohol dataset. We can interpret that, it is more difficult to move from non-CaUD to CaUD compared to non-AUD to AUD, and vice versa. We can also say that an individual can become dependent or independent from marijuana at a slower rate compared to alcohol. Furthermore, the behavior of an individual dependent on marijuana is more distinct from normal behavior compared to alcohol. In the cocaine dataset, the major and the minor clusters are farthest away from each other compared to the alcohol and marijuana datasets. The distance between the cluster centroids is the largest in the cocaine dataset compared to the other two substances. We can, therefore, interpret that, moving from non-CoUD to CoUD is the most difficult compared to moving from non-AUD to AUD or non-CaUD to CaUD, and vice versa. Thus, one can become dependent or independent on cocaine at the slowest rate compared to alcohol and marijuana. These interpretations could mean that the rehabilitation efforts needed for the person to become free from SUD will take the biggest efforts in the case of CoUD, followed by CaUD, and lastly AUD. For the alcohol dataset, we can observe that the major cluster behaviors have a wider coverage compared to the minor cluster. Based on this observation, we can interpret that the major cluster has a wider range of everyday activities and consists of normal people’s behavior who are non-users, moderate users, or low-risk users of alcohol. We can conclude that these individuals have no significant symptoms of AUD because their everyday behavior is not affected by alcohol. The minor cluster behaviors have a lesser range of coverage compared to the major cluster. It consists of people affected by alcohol dependence resulting in a lesser range of everyday activities. These individuals include extreme binge drinkers or heavy drinkers who are projecting symptoms of AUD because their behavior is limited due to the effects of alcohol. At the boundary between the clusters, lie the behavior of people who can swing from independence to dependence on alcohol, and vice versa. The behaviors at the boundary of the major and the minor clusters consist of individuals who may have large alcohol consumption but are not considered dependent or are not very dependent. This drinking pattern is normally found in binge drinkers. In the marijuana and cocaine datasets, we can also observe a wider range of coverage in the major clusters and a smaller range of coverage in the minor clusters. We can thus, interpret that, the major clusters have a wider range of activities that consist of normal people’s behavior. These individuals may be regarded as non-users or low-risk users of marijuana or cocaine and have no significant symptoms of CaUD or CoUD. The minor clusters have a smaller range of activities and can be interpreted as the behaviors of people affected by marijuana or cocaine dependence, who are showing symptoms of CaUD or CoUD such that their everyday activities are constrained within a lesser range. Comparing all three substances, we can observe that the region for CaUD covers the widest range, followed by AUD, and lastly CoUD. We can say that the behaviors of people with CaUD are the least restrictive such that, their everyday activities are the least constrained. This makes individuals with CaUD more functional and their behavior is closer to people with no SUD, compared to people with AUD or CoUD. Thus the manifestation of SUD is less obvious with CaUD, followed by AUD, and the most obvious manifestation of SUD is CoUD. Our results complement the existing research that risk perceptions related to the use of marijuana are becoming more non-restrictive across all ages, especially in adults, emerging adults, and middle adults [44]. In addition, we can also observe that the distance between the cluster boundaries in the alcohol dataset is the least, followed by marijuana, and lastly cocaine. We can say that the behaviors of the people at the cluster boundaries of AUD and non-AUD are similar to each other. Thus, it is difficult to distinguish AUD and non-AUD behaviors at the boundaries. The distance at the cluster boundaries of the marijuana dataset is farther compared to the alcohol. This means that the behaviors of people at the cluster boundaries of CaUD and non-CaUD are more distinct compared to alcohol dataset. Thus, the difference in the behaviors of CaUD and non-CaUD is observable. And lastly, the distance at the cluster boundaries of the cocaine dataset is farthest compared to alcohol and marijuana. This shows that the behaviors of people at the cluster boundaries of CoUD and non-CoUD are the most distinct compared to alcohol and marijuana. Thus, the difference in behaviors is most observable between CoUD and non-CoUD compared to the two other substances. We concluded that in the DBSCAN results for the alcohol dataset, the smallest cluster represents respondents with severe symptoms of AUD who can be regarded as heavy drinkers, while for the DBSCAN results in the marijuana, and cocaine datasets, participants are projecting heterogeneous symptoms for potential poly-substance use disorder. This is because a study by [43] suggests marijuana dependence and cocaine dependence are related to the increased likelihood of binge drinking. It is also possible that our model has detected potential endophenotypes for CaUD and CoUD since according to [28] both of these drugs are heritable by at least 50%. Our approach contributes to mental health disorders through a computational model that automatically classifies people with or without SUD, which is validated by a mental health professional. This tool can help supplement psychiatric evaluation to speed up the diagnostics process and perform the necessary interventions accordingly. In addition, we provided an analysis of the severity of the SUD for each substance and how to possibly manage interventions. Lastly, our model is also able to discover patterns of mental health disorders that may be related to the degree of severity of SUD or poly-SUD.
5.2. By a Mental Health Professional
Machine learning results point to different patterns in the classifications of substance use disorders (i.e., the group classified as addicted) when examining alcohol, marijuana, and cocaine in the NSDUH data. The major cluster behaviors are closely related to each other, pointing to people not meeting the criteria for DSM-5 SUD. Individuals may not meet the criteria due to no history of substance use, and alternatively, one may have a history of substance use but not meet the criteria for SUD. In the minor cluster, the behaviors of people are not as closely related as the behaviors of people in the major cluster. This is because individuals with SUD may engage in a variety of behaviors, as reported in the NSDUH, that would align with meeting the criteria for a given SUD. Compared to marijuana and cocaine, alcohol is a commonly used substance, and there is considerable engagement in alcohol use behaviors among those who drink. There is greater variability in the behaviors (e.g., tolerance, withdrawal, and negative consequences of alcohol use) among those who do or do not meet the diagnostic criteria for AUD. In this sense, individuals may modify patterns of alcohol use more readily (relative to the other two substances), which in turn affects whether or not they meet the diagnostic criteria for AUD. This is to say, individuals can consume alcohol to varying degrees, but consumption alone does not determine whether someone meets the diagnostic criteria for AUD. In the case of marijuana, a greater proportion of individuals who report using marijuana will meet the diagnostic criteria for CaUD relative to those reporting alcohol use and meeting the diagnostic criteria for AUD. The NSDUH assessments demonstrate a greater alignment between behaviors and meeting the diagnostic criteria for CaUD. Individuals using higher levels of marijuana are more likely to meet the diagnostic criteria for CaUD than those using alcohol at higher levels. Compared to alcohol and marijuana, individuals using cocaine are more likely to meet the DSM-5 criteria for Stimulant use disorder. Cocaine is associated with a greater likelihood of DSM-5 Stimulant use disorder criterion relative to alcohol or marijuana, which may be due to the differences in the psychopharmacological properties between the three substances. In conclusion, we can say that individuals can engage in a greater range of alcohol behaviors, and some will meet the DSM-5 criteria for AUD while others will not. Relative to alcohol, those using marijuana at higher rates will be more likely to meet the DSM-5 criteria for CaUD. Furthermore, individuals using cocaine will be more likely to meet DSM-5 criteria for stimulant use disorder compared to those using alcohol or marijuana.
6. Conclusions
This paper has presented a model for examining the extent of substance use disorder using data from the National Survey on Drug Use and Health online database that is based on DSM-5 criteria for SUD. We used unsupervised machine learning using three algorithms, k-means, hierarchical clustering, and DBSCAN. These algorithms result in consistent clustering of two major clusters, namely, respondents with substance use disorder and without substance use disorder. Based on the results of data visualization, we analyze and interpret the point of view of machine learning. The interpretation based on numerical results is validated by a mental health professional. For future work, we plan to implement the proposed methods to understand the cognitive and neurobiological activity of potential SUD individuals.
Author Contributions
Kaloso M. Tlotleng: Conceptualization, Methodology, Software, Formal analysis, Writing - Original Draft, Visualization, Funding acquisition Rodrigo S. Jamisola Jr.: Conceptualization, Methodology, Validation, Resources, Writing - Review & Editing, Supervision, Project administration, Funding acquisition Jennifer L. Brown: Validation, Resources, Writing - Review & Editing.
Funding
This research was funded by the Department of Mechanical, Energy, and Industrial Engineering, grant number S00304.
Institutional Review Board Statement
Not applicable
Informed Consent Statement
Not applicable
Data Availability Statement
The data presented in this study is a publicly available dataset
Acknowledgments
I want to acknowledge the BIUST Office of Research, Development, and Innovation for their funding support under project code S00304, which has allowed me to have the necessary equipment to develop my research study
Conflicts of Interest
The authors declare that they have no known competing financial interests or personal relationships that could have appeared to influence the work reported in this paper.
References
- Ahn, W.-Y.; Vassileva, J. Machine-learning identifies substance-specific behavioral markers for opiate and stimulant dependence. Drug and Alcohol Dependence 2016, 161, 247–257. [Google Scholar] [CrossRef]
- Al Sukar, M.; Sleit, A.; Abu-Dalhoum, A.; Al-Kasasbeh, B. Identifying a drug addict person using artificial neural networks. International Journal of Computer and Information Engineering 2016, 10(3), 611–616. [Google Scholar]
- Mak, K.K.; Lee, K.; Park, C. Applications of machine learning in addiction studies: A systematic review. Psychiatry Research 2019, 275, 53–60. [Google Scholar] [CrossRef]
- Robbins, T.W.; Clark, L. Behavioral addictions. Current Opinion in Neurobiology 2015, 30, 66–72. [Google Scholar] [CrossRef]
- Srividya, M.; Mohanavalli, S.; Bhalaji, N. Behavioral modeling for mental health using machine learning algorithms. Journal of Medical Systems 2018, 42(5), 1–12. [Google Scholar] [CrossRef]
- Kharabsheh, M.; Meqdadi, O.; Alabed, M.; Veeranki, S.; Abbadi, A.; Alzyoud, S. A machine learning approach for predicting nicotine dependence. International Journal of Advanced Computer Science and Applications 2019, 10(3), 179–184. [Google Scholar] [CrossRef]
- Ebrahimi, A.; Wiil, U.K.; Andersen, K.; Mansourvar, M.; Nielsen, A.S. A predictive machine learning model to determine alcohol use disorder. In 2020 IEEE Symposium on Computers and Communications (ISCC) (pp. 1-7); IEEE, 2020. [Google Scholar]
- Stinchfield, R.; McCready, J.; Turner, N.E.; Jimenez-Murcia, S.; Petry, N.M.; Grant, J. ... & Winters, K. C. Reliability, validity, and classification accuracy of the DSM-5 diagnostic criteria for gambling disorder. Journal of Gambling Studies 2016, 32(3), 905–922. [Google Scholar] [CrossRef]
- Tarekegn, A.N.; Michalak, K.; Giacobini, M. Cross-validation approach to evaluate clustering algorithms: An experimental study using multi-label datasets. SN Computer Science 2020, 1(5), 1–9. [Google Scholar] [CrossRef]
- Stevens, E.; Dixon, D.R.; Novack, M.N.; Granpeesheh, D.; Smith, T.; Linstead, E. Identification and analysis of behavioral phenotypes in autism spectrum disorder via unsupervised machine learning. International Journal of Medical Informatics 2019, 129, 29–36. [Google Scholar] [CrossRef]
- American Psychiatric Association. Diagnostic and statistical manual of mental disorders (DSM-5®); American Psychiatric Pub, 2013. [Google Scholar]
- Hasin, D.S.; O’Brien, C.P.; Auriacombe, M.; Borges, G.; Bucholz, K.; Budney, A. .. & Petry, N.M. DSM-5 criteria for substance use disorders: Recommendations and rationale. American Journal of Psychiatry 2013, 170(8), 834–851. [Google Scholar]
- Substance Abuse and Mental Health Services Administration. (2019). National survey on drug use and health. Available online: https://www.samhsa.gov/data/ (accessed on 1 January 2023).
- Chowdhry, A.K.; Gondi, V.; Pugh, S.L. Missing data in clinical studies. International Journal of Radiation Oncology* Biology* Physics 2021. [Google Scholar] [CrossRef] [PubMed]
- Kherif, F.; Latypova, A. Principal component analysis. In Machine Learning (pp. 209-225); Elsevier, 2020. [Google Scholar]
- Cai, J.; Luo, J.; Wang, S.; Yang, S. Feature selection in machine learning: A new perspective. Neurocomputing 2018, 300, 70–79. [Google Scholar] [CrossRef]
- Ali, P.J.M.; Faraj, R.H.; Koya, E.; Ali, P.J.M.; Faraj, R.H. Data normalization and standardization: A technical report. Mach Learn Tech Rep 2014, 1(1), 1–6. [Google Scholar]
- Chakraborty, S.; Paul, D.; Das, S.; Xu, J. Entropy regularized power k-means clustering. arXiv preprint 2020, arXiv:2001.03452. [Google Scholar]
- Saha, T.D.; Chou, S.P.; Grant, B.F. The performance of DSM-5 alcohol use disorder and quantity-frequency of alcohol consumption criteria: An item response theory analysis. Drug and Alcohol Dependence 2020, 216, 108299. [Google Scholar] [CrossRef] [PubMed]
- Alcohol, Research; Staff, C.R.E. Drinking patterns and their definitions. Alcohol Research: Current Reviews 2018, 39(1), 17. [Google Scholar]
- Zhang, M. Use density-based spatial clustering of applications with noise (DBSCAN) algorithm to identify galaxy cluster members. In IOP Conference Series: Earth and Environmental Science (Vol. 252, No. 4, p. 042033); IOP Publishing, 2019. [Google Scholar]
- Iniesta, R.; Stahl, D.; McGuffin, P. Machine learning, statistical learning and the future of biological research in psychiatry. Psychological Medicine 2016, 46(12), 2455–2465. [Google Scholar] [CrossRef]
- Hauke, J.; Kossowski, T. Comparison of values of Pearson’s and Spearman’s correlation coefficient on the same sets of data. Quaestiones Geographicae 2011, 30(2), 87–93. [Google Scholar] [CrossRef]
- Pedersen, A.B.; Mikkelsen, E.M.; Cronin-Fenton, D.; Kristensen, N.R.; Pham, T.M.; Pedersen, L.; Petersen, I. Missing data and multiple imputation in clinical epidemiological research. Clinical Epidemiology 2017, 9, 157–165. [Google Scholar] [CrossRef]
- Wong, T.-T.; Yang, N.-Y. Dependency analysis of accuracy estimates in k-fold cross validation. IEEE Transactions on Knowledge and Data Engineering 2017, 29(11), 2417–2427. [Google Scholar] [CrossRef]
- Salkind, N.J. Root mean square error. Encyclopedia of Research Design. 2010.
- Sarker, I.H. Machine learning: Algorithms, real-world applications and research directions. SN Computer Science 2021, 2(3), 1–21. [Google Scholar] [CrossRef]
- Wetherill, L.; Agrawal, A.; Kapoor, M.; Bertelsen, S.; Bierut, L.J.; Brooks, A. .. & others. Association of substance dependence phenotypes in the COGA sample. Addiction Biology 2015, 20(3), 617–627. [Google Scholar]
- Choi, J.; Jung, H.T.; Choi, J. Marijuana addiction prediction models by gender in young adults using random forest. Online Journal of Nursing Informatics (OJNI) 2021, 25(2). [Google Scholar]
- Choi, J.; Chung, J.; Choi, J. Exploring impact of marijuana (cannabis) abuse on adults using machine learning. International Journal of Environmental Research and Public Health 2021, 18(19), 10357. [Google Scholar] [CrossRef]
- Grant, B.F.; Saha, T.D.; Ruan, W.J.; Goldstein, R.B.; Chou, S.P.; Jung, J. ; ... & others. Epidemiology of DSM-5 drug use disorder: Results from the National Epidemiologic Survey on Alcohol and Related Conditions-III. JAMA Psychiatry 2016, 73(1), 39–47. [Google Scholar]
- Hayley, A.C.; Stough, C.; Downey, L.A. DSM-5 cannabis use disorder, substance use and DSM-5 specific substance-use disorders: Evaluating comorbidity in a population-based sample. European Neuropsychopharmacology 2017, 27(8), 732–743. [Google Scholar] [CrossRef]
- Mumtaz, W.; Vuong, P.L.; Xia, L.; Malik, A.S.; Rashid, R.B.A. An EEG-based machine learning method to screen alcohol use disorder. Cognitive Neurodynamics 2017, 11(2), 161–171. [Google Scholar] [CrossRef] [PubMed]
- Substance Abuse and Mental Health Services Administration. (2020). Key substance use and mental health indicators in the United States: Results from the 2019 National Survey on Drug Use and Health. Available online: https://www.samhsa.gov/data/ (accessed on 1 January 2023).
- Jing, Y.; Hu, Z.; Fan, P.; Xue, Y.; Wang, L.; Tarter, R.E. .. & Xie, X.-Q. Analysis of substance use and its outcomes by machine learning I. Childhood evaluation of liability to substance use disorder. Drug and Alcohol Dependence 2020, 206, 107605. [Google Scholar] [PubMed]
- Mannes, Z.L.; Shmulewitz, D.; Livne, O.; Stohl, M.; Hasin, D.S. Correlates of mild, moderate, and severe Alcohol Use Disorder among adults with problem substance use: Validity implications for DSM-5. Alcoholism: Clinical and Experimental Research 2021, 45(10), 2118–2129. [Google Scholar] [CrossRef]
- Mintz, C.M.; Hartz, S.M.; Fisher, S.L.; Ramsey, A.T.; Geng, E.H.; Grucza, R.A.; Bierut, L.J. A cascade of care for alcohol use disorder: Using 2015-2019 National Survey on Drug Use and Health data to identify gaps in past 12-month care. Alcoholism: Clinical and Experimental Research 2021, 45(6), 1276–1286. [Google Scholar] [CrossRef]
- Wang, Y.; Zhao, Y.; Therneau, T.M.; Atkinson, E.J.; Tafti, A.P.; Zhang, N. .. & Liu, H. Unsupervised machine learning for the discovery of latent disease clusters and patient subgroups using electronic health records. Journal of Biomedical Informatics 2020, 102, 103364. [Google Scholar]
- Lopez, C.; Tucker, S.; Salameh, T.; Tucker, C. An unsupervised machine learning method for discovering patient clusters based on genetic signatures. Journal of Biomedical Informatics 2018, 85, 30–39. [Google Scholar] [CrossRef] [PubMed]
- Jiang, X.; Ma, J.; Jiang, J.; Guo, X. Robust feature matching using spatial clustering with heavy outliers. IEEE Transactions on Image Processing 2019, 29, 736–746. [Google Scholar] [CrossRef] [PubMed]
- Birant, D.; Kut, A. ST-DBSCAN: An algorithm for clustering spatial-temporal data. Data & Knowledge Engineering 2007, 60(1), 208–221. [Google Scholar]
- Franzwa, F.; Harper, L.A.; Anderson, K.G. Examination of social smoking classifications using a machine learning approach. Addictive Behaviors 2022, 126, 107175. [Google Scholar] [CrossRef]
- Dell, N.A.; Srivastava, S.P.; Vaughn, M.G.; Salas-Wright, C.; Hai, A.H.; Qian, Z. Binge drinking in early adulthood: A machine learning approach. Addictive Behaviors 2022, 124, 107122. [Google Scholar] [CrossRef]
- Waddell, J.T. Age-varying time trends in cannabis- and alcohol-related risk perceptions 2002-2019. Addictive Behaviors 2022, 124, 107091. [Google Scholar] [CrossRef]
- Mishra, P.; Biancolillo, A.; Roger, J.M.; Marini, F.; Rutledge, D.N. New data preprocessing trends based on ensemble of multiple preprocessing techniques. TrAC Trends in Analytical Chemistry 2020, 132, 116045. [Google Scholar] [CrossRef]
- Khatun, J.; Azad, T.; Seaum, S.Y.; Jabiullah, M.I.; Habib, M.T. (2020, November). Betel nut addiction detection using machine learning. In 2020 4th International Conference on Electronics, Communication and Aerospace Technology (ICECA); IEEE, 2020; pp. 1435–1440. [Google Scholar]
- Bleeker, S.E.; Moll, H.A.; Steyerberg, E.W.; Donders, A.R.T.; Derksen-Lubsen, G.; Grobbee, D.E.; Moons, K.G.M. External validation is necessary in prediction research: A clinical example. Journal of Clinical Epidemiology 2003, 56(9), 826–832. [Google Scholar] [CrossRef]
- Saha, T.D.; Chou, S.P.; Grant, B.F. The performance of DSM-5 alcohol use disorder and quantity-frequency of alcohol consumption criteria: An item response theory analysis. Drug and Alcohol Dependence 2020, 216, 108299. [Google Scholar] [CrossRef]
Figure 1.
The framework showing our proposed model structure and the sequence of our approach where preprocessing, cluster analysis, and validation algorithms were applied consecutively for each dataset.
Figure 1.
The framework showing our proposed model structure and the sequence of our approach where preprocessing, cluster analysis, and validation algorithms were applied consecutively for each dataset.
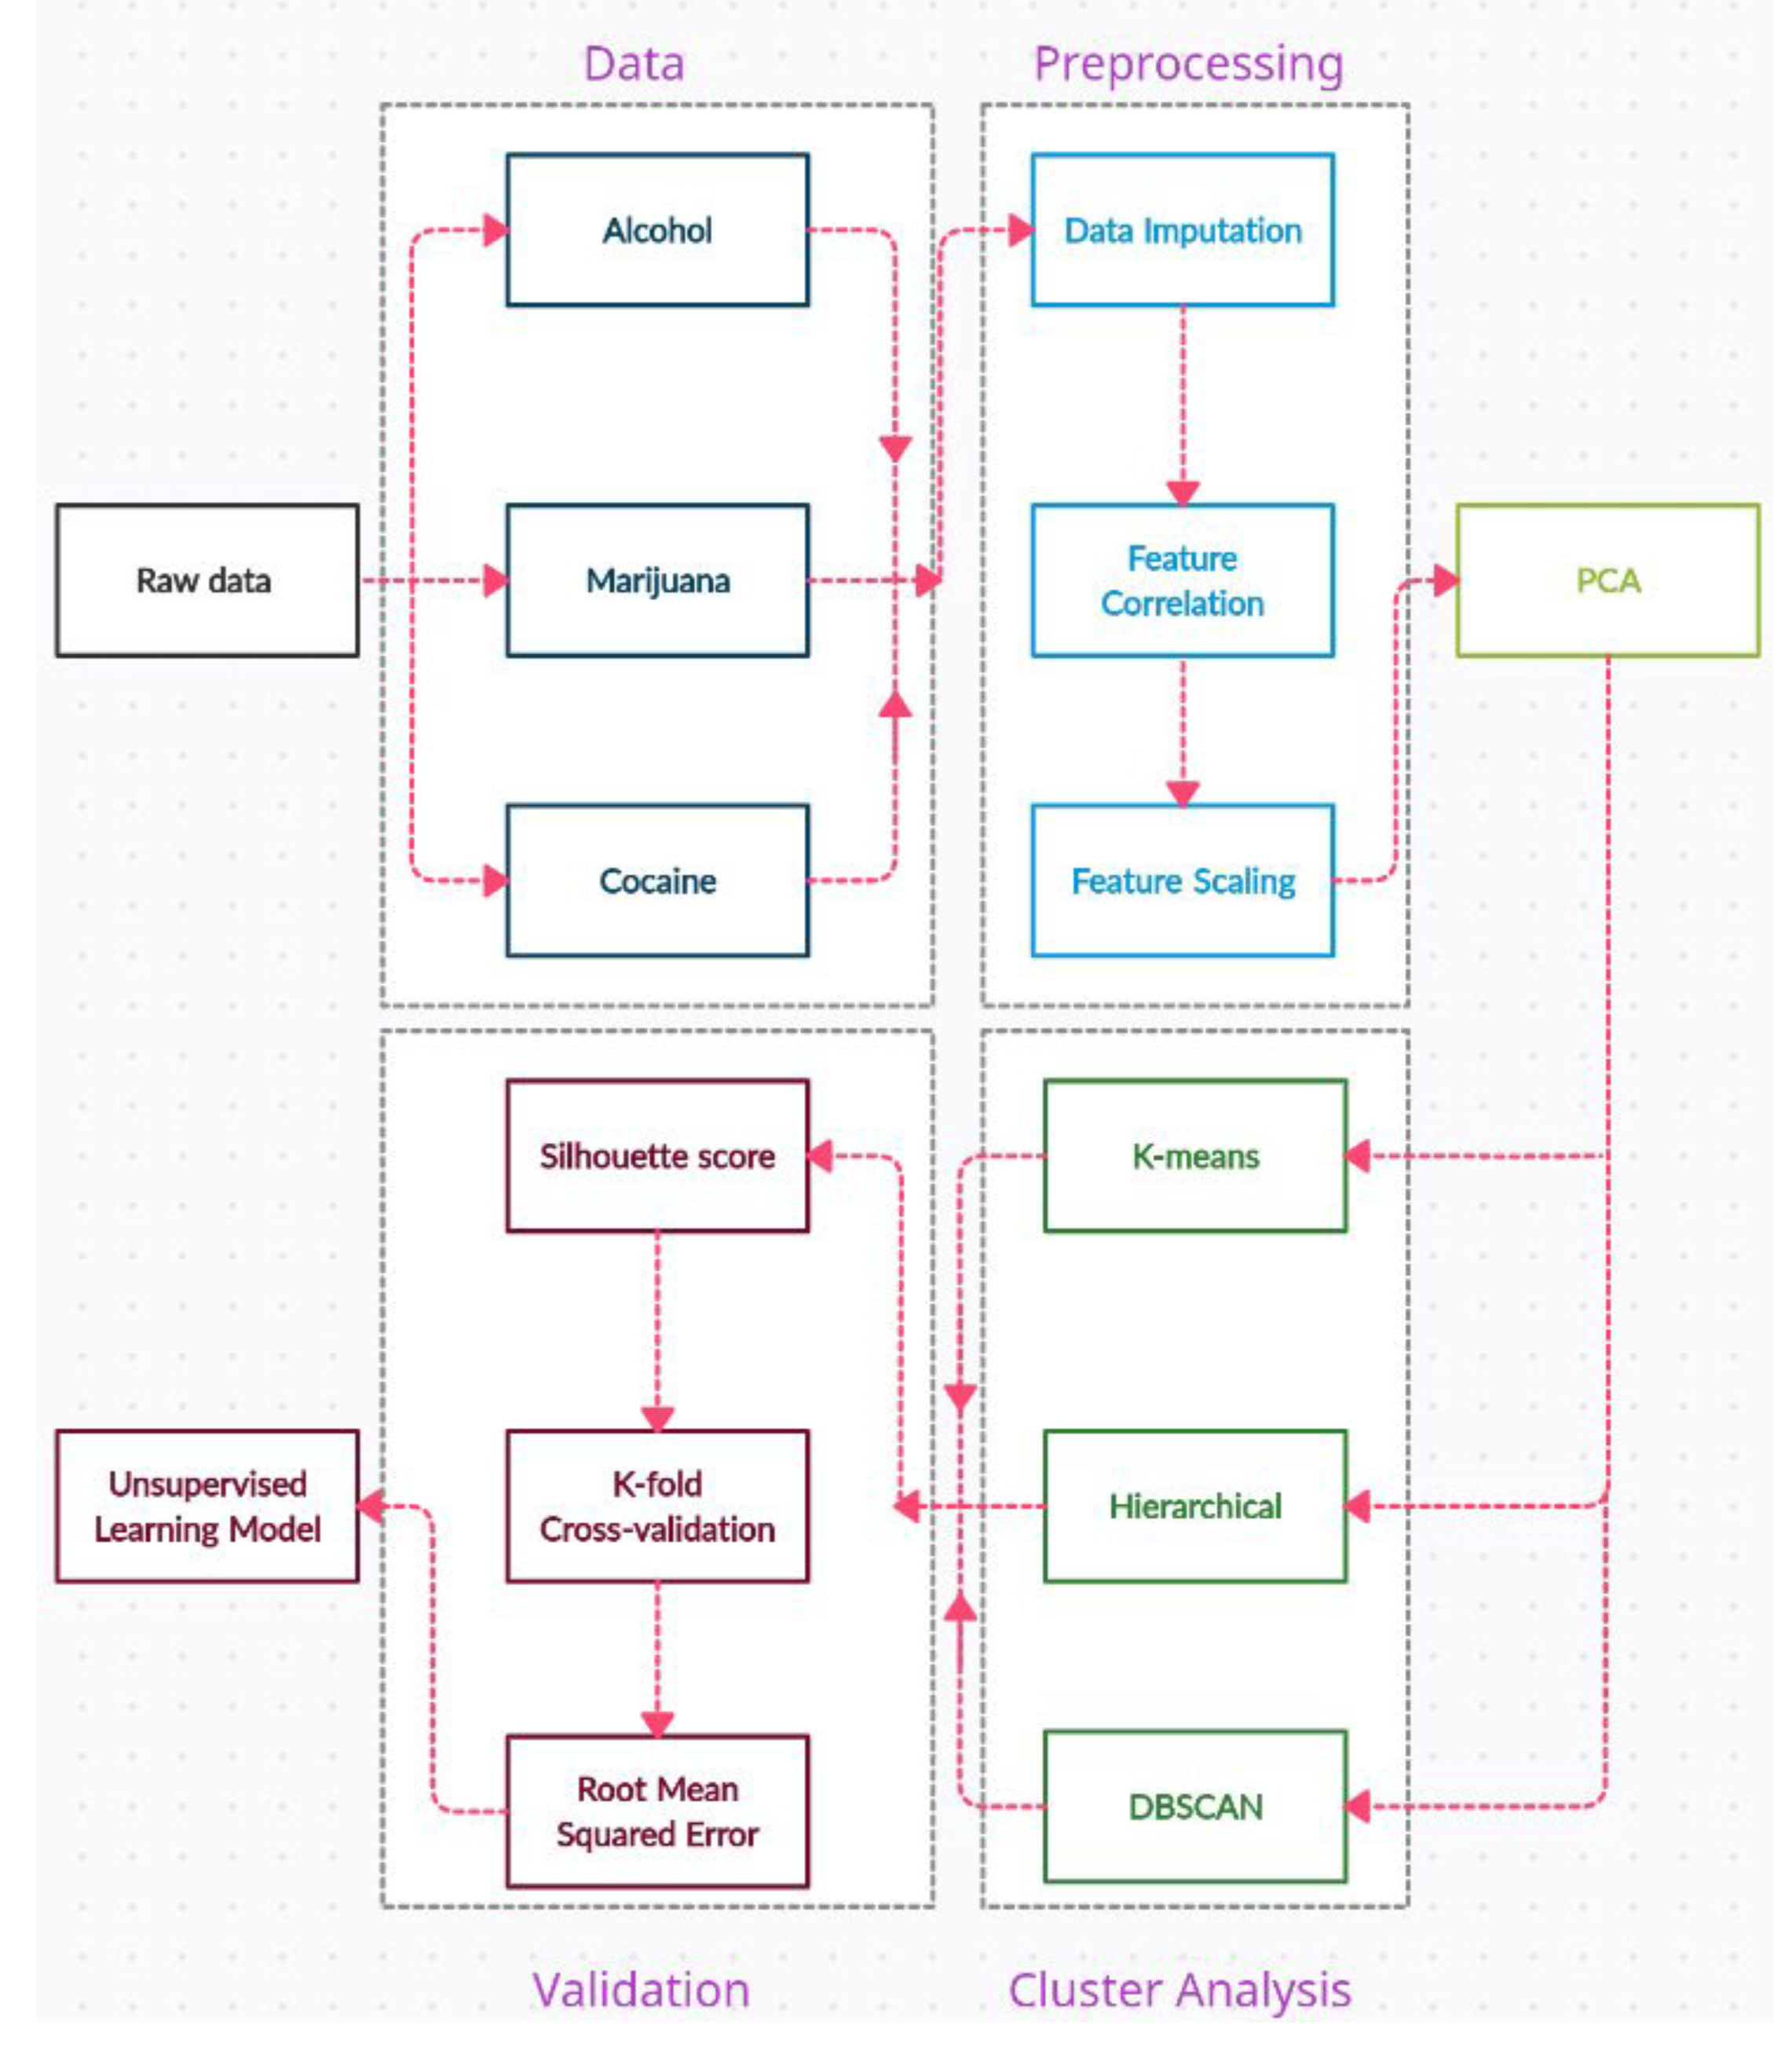
Figure 2.
The figure represents k-means clustering for the alcohol dataset. The graph shows two distinct groups of data points as per the elbow method.
Figure 2.
The figure represents k-means clustering for the alcohol dataset. The graph shows two distinct groups of data points as per the elbow method.
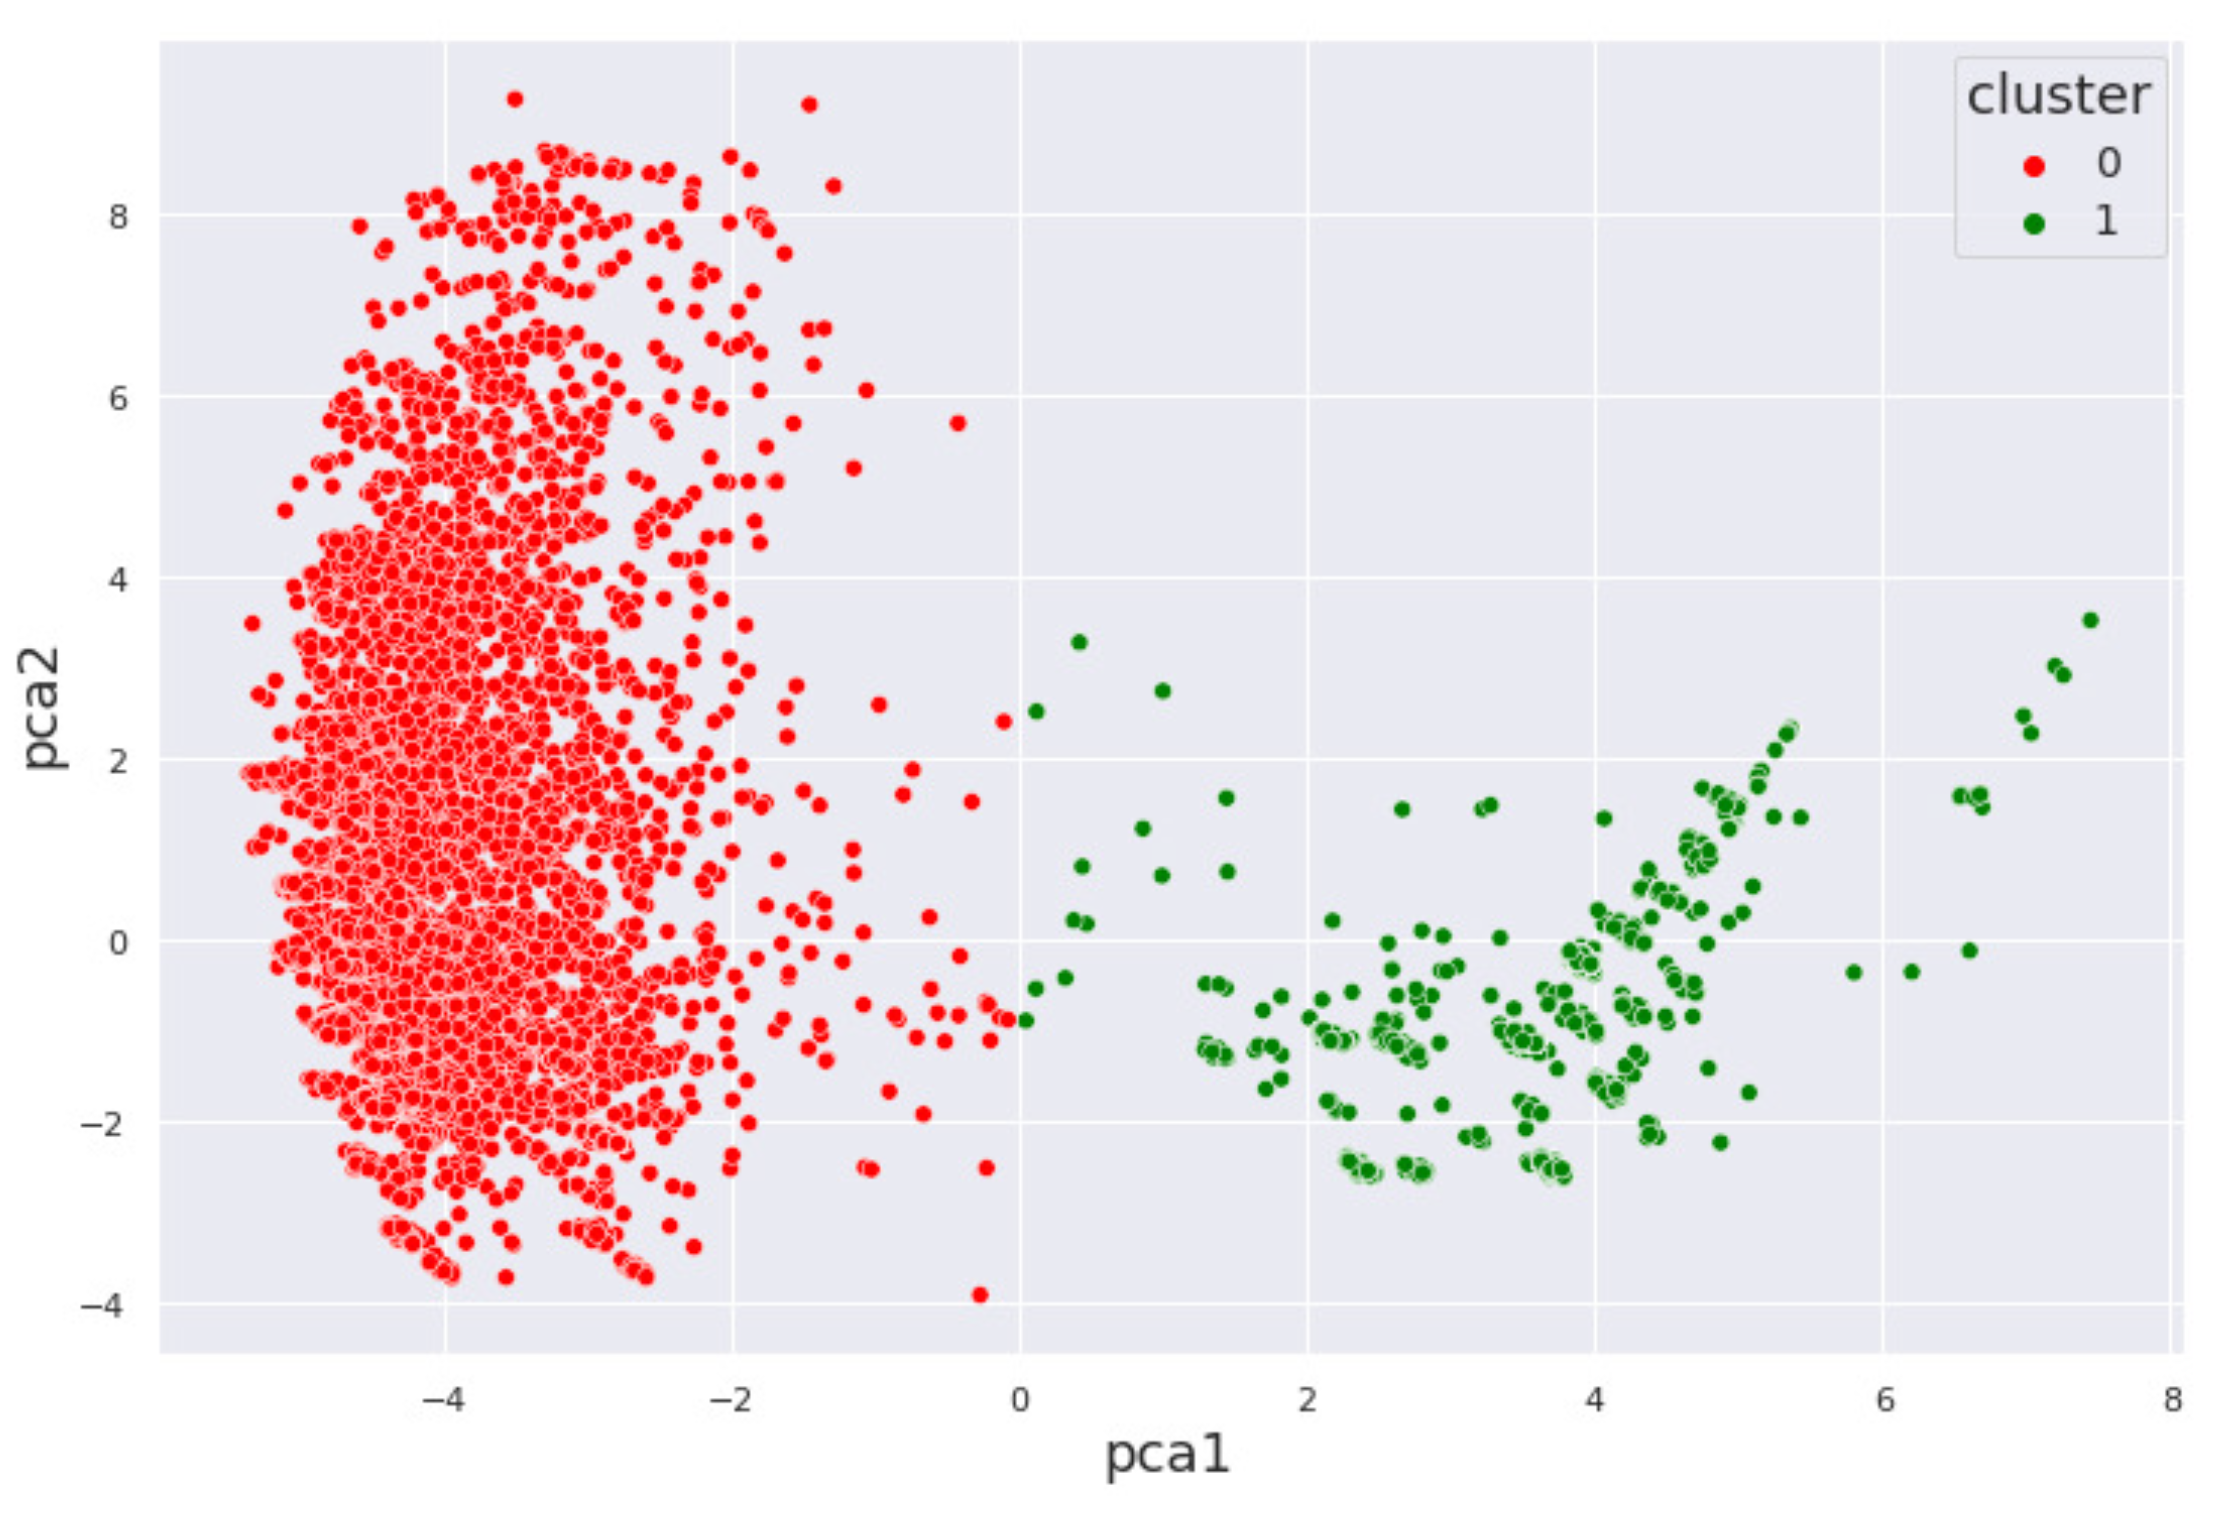
Figure 3.
The hierarchical clustering for the alcohol dataset is shown indicating more data points in the orange than the blue clusters.
Figure 3.
The hierarchical clustering for the alcohol dataset is shown indicating more data points in the orange than the blue clusters.
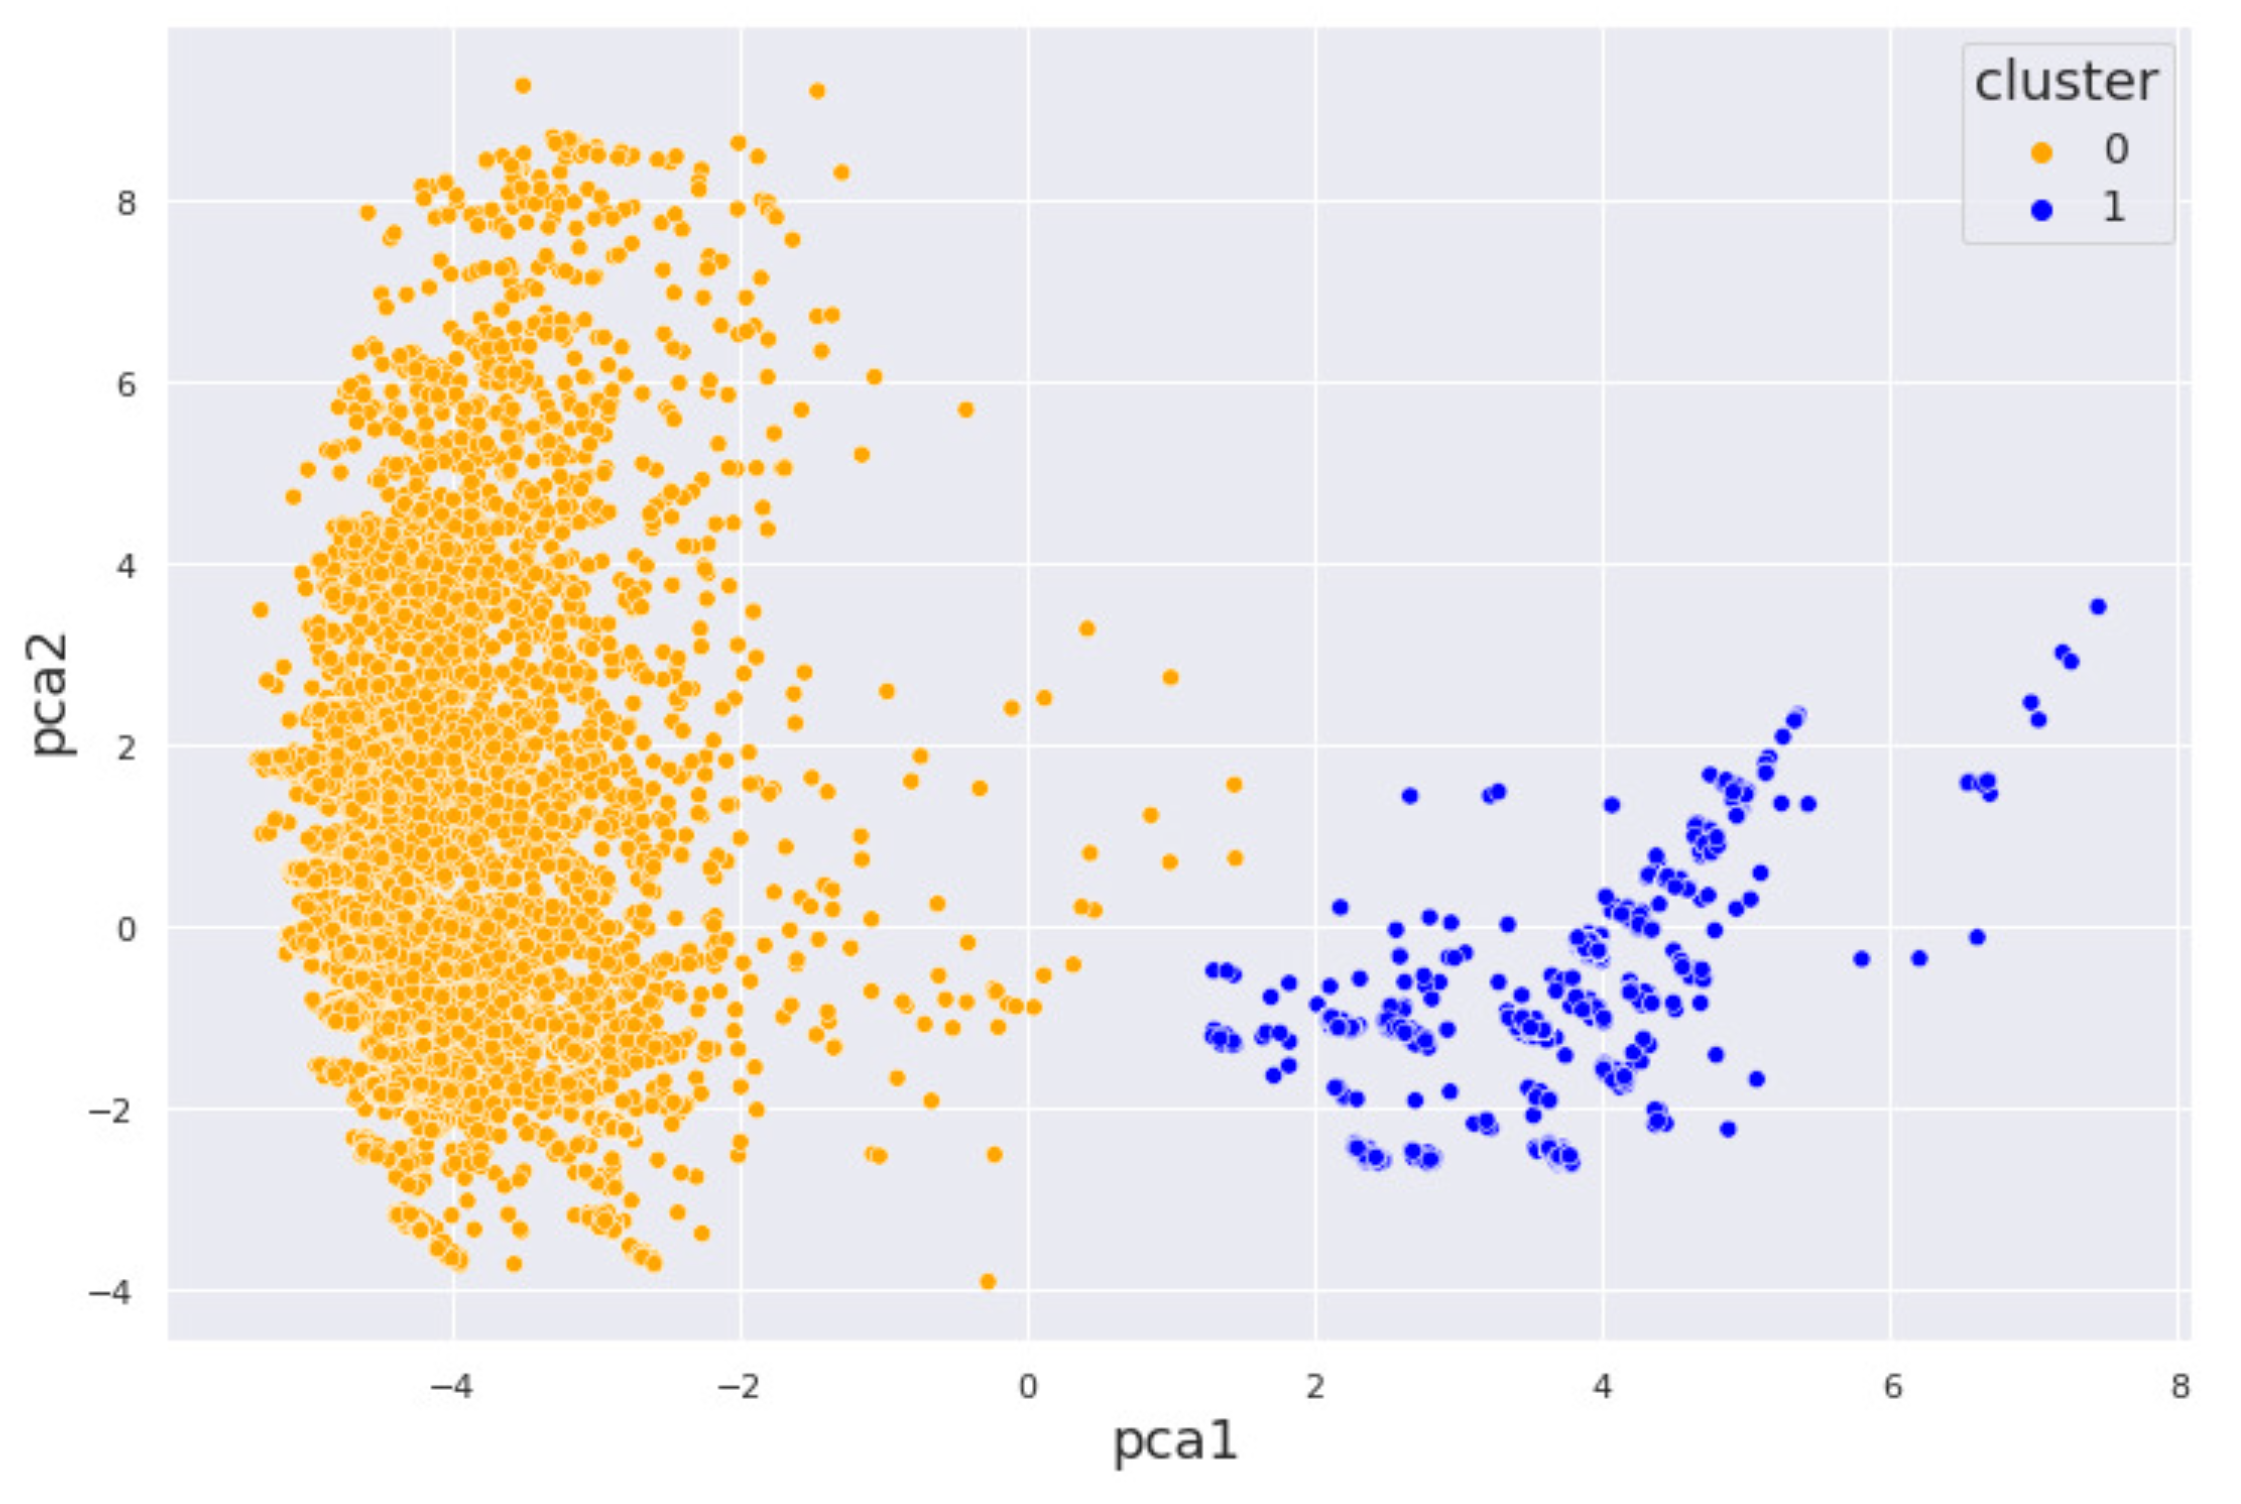
Figure 4.
DBSCAN results for the alcohol dataset showing three distinct clusters with noise. The structure of the data points distribution has not changed for all three algorithms.
Figure 4.
DBSCAN results for the alcohol dataset showing three distinct clusters with noise. The structure of the data points distribution has not changed for all three algorithms.
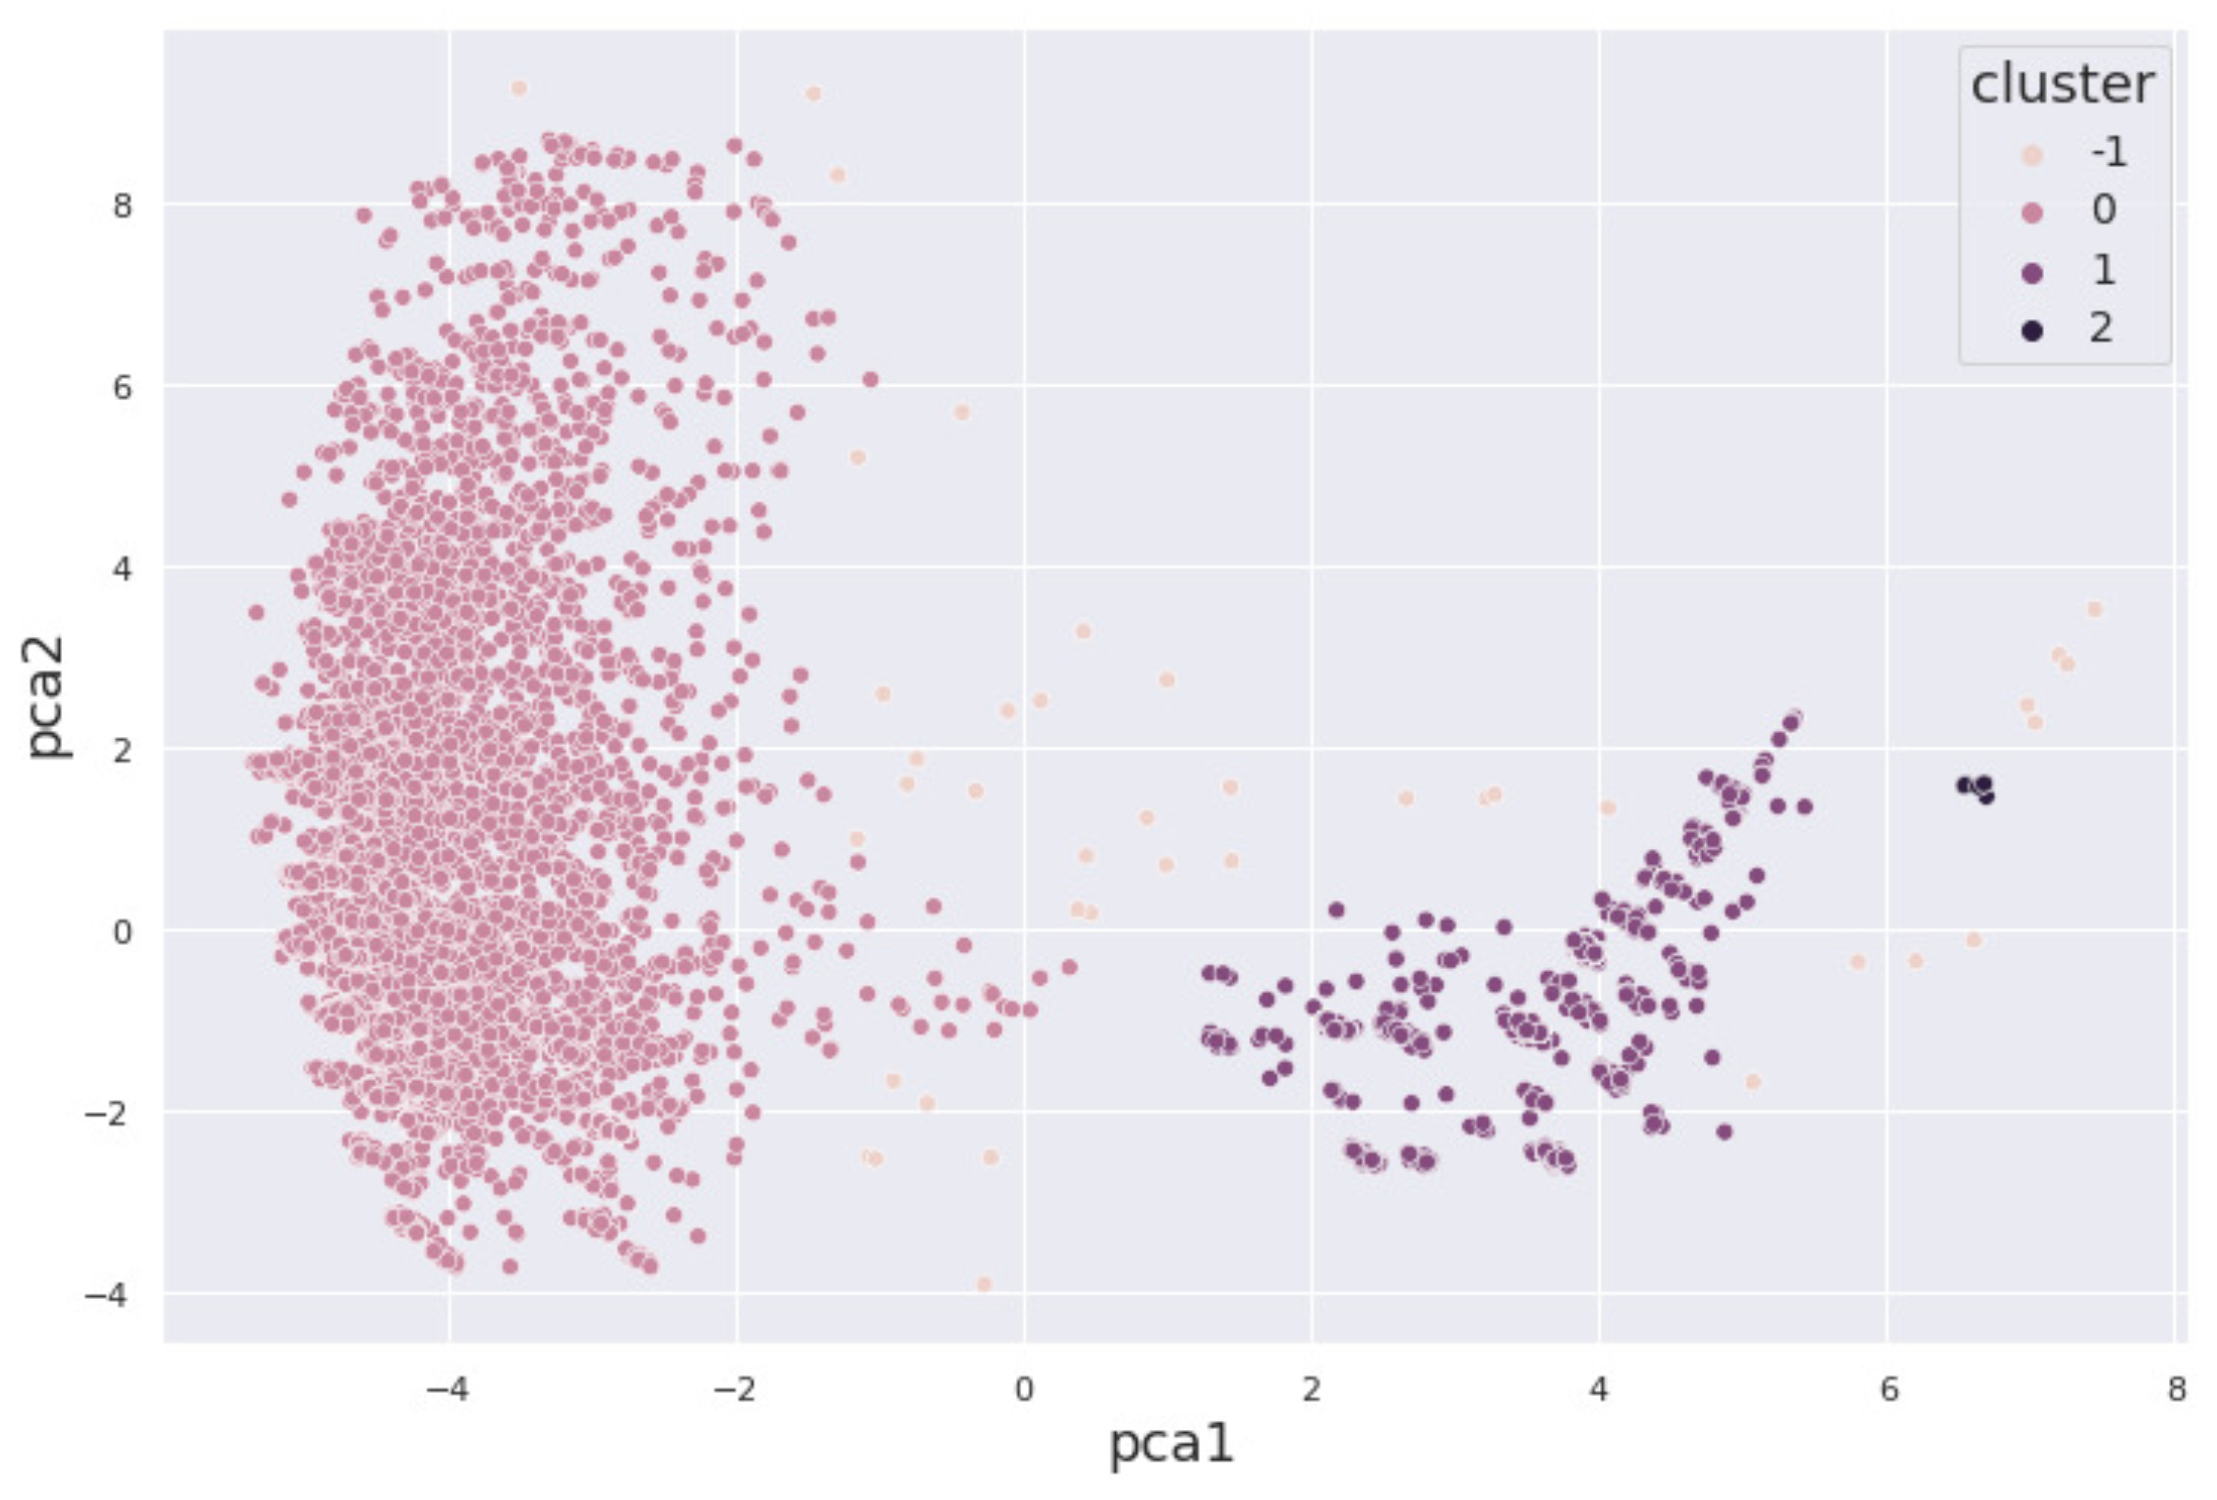
Figure 5.
Our k-means cluster results for the marijuana dataset are shown. The few points between the clusters have greater Euclidean distance.
Figure 5.
Our k-means cluster results for the marijuana dataset are shown. The few points between the clusters have greater Euclidean distance.
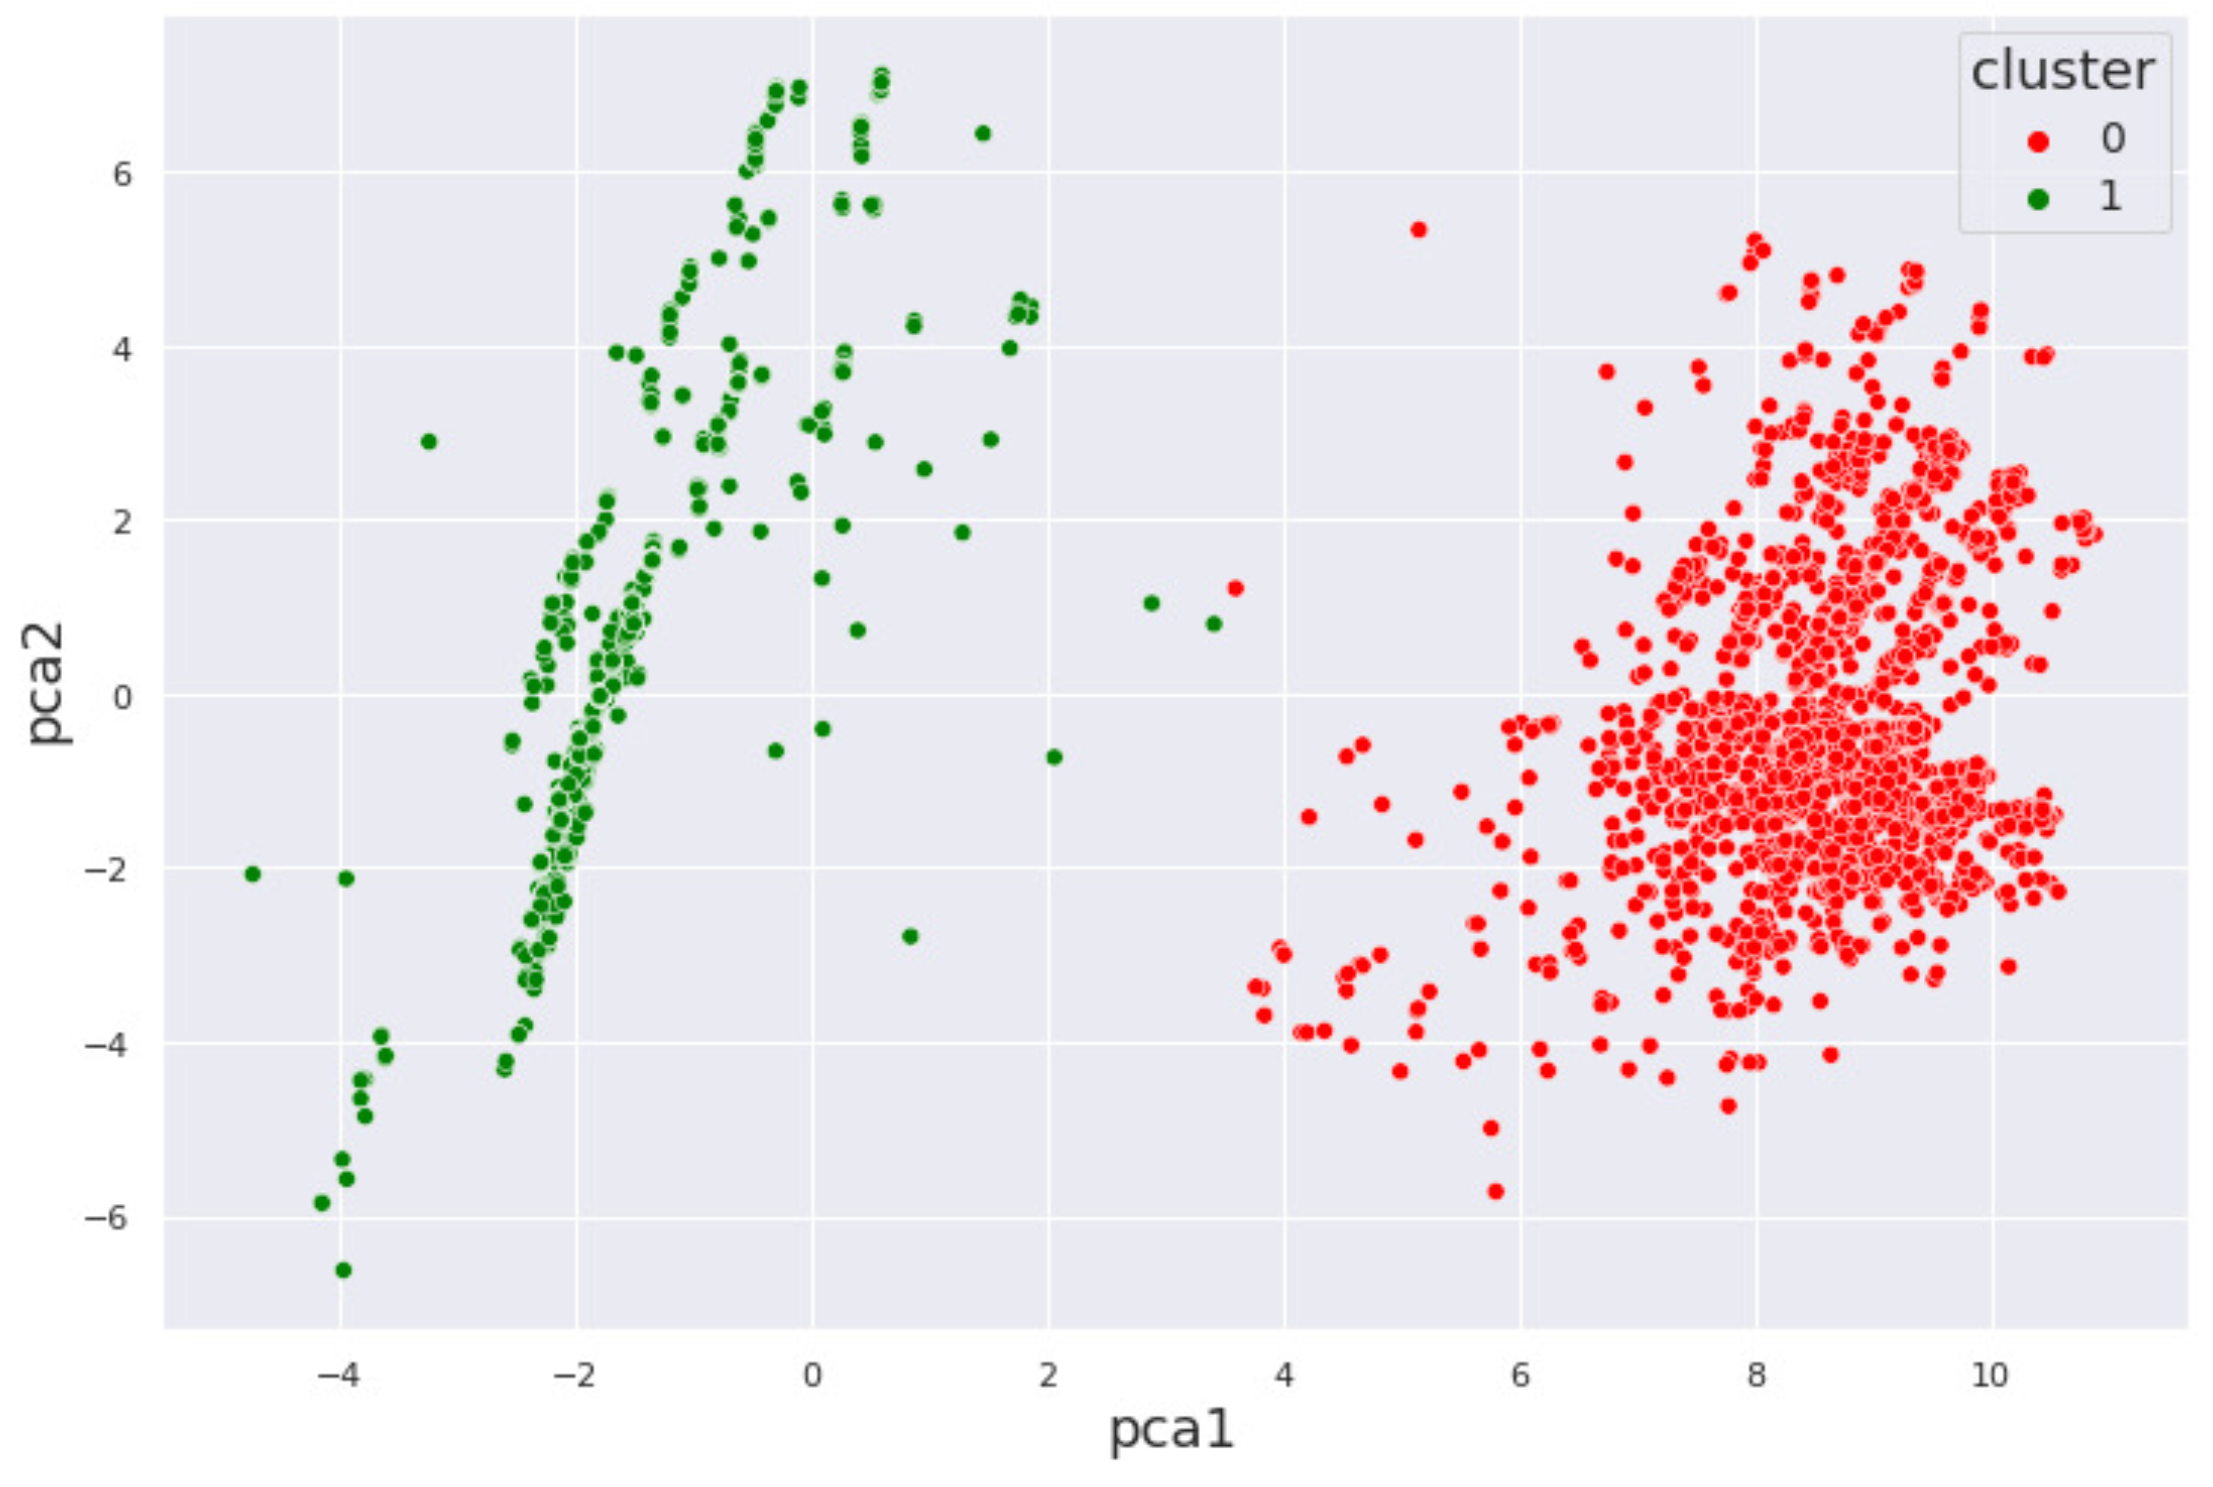
Figure 6.
Hierarchical clustering results for the marijuana dataset is shown. Unlike for k-means, the two clusters are not bounded around 0.
Figure 6.
Hierarchical clustering results for the marijuana dataset is shown. Unlike for k-means, the two clusters are not bounded around 0.
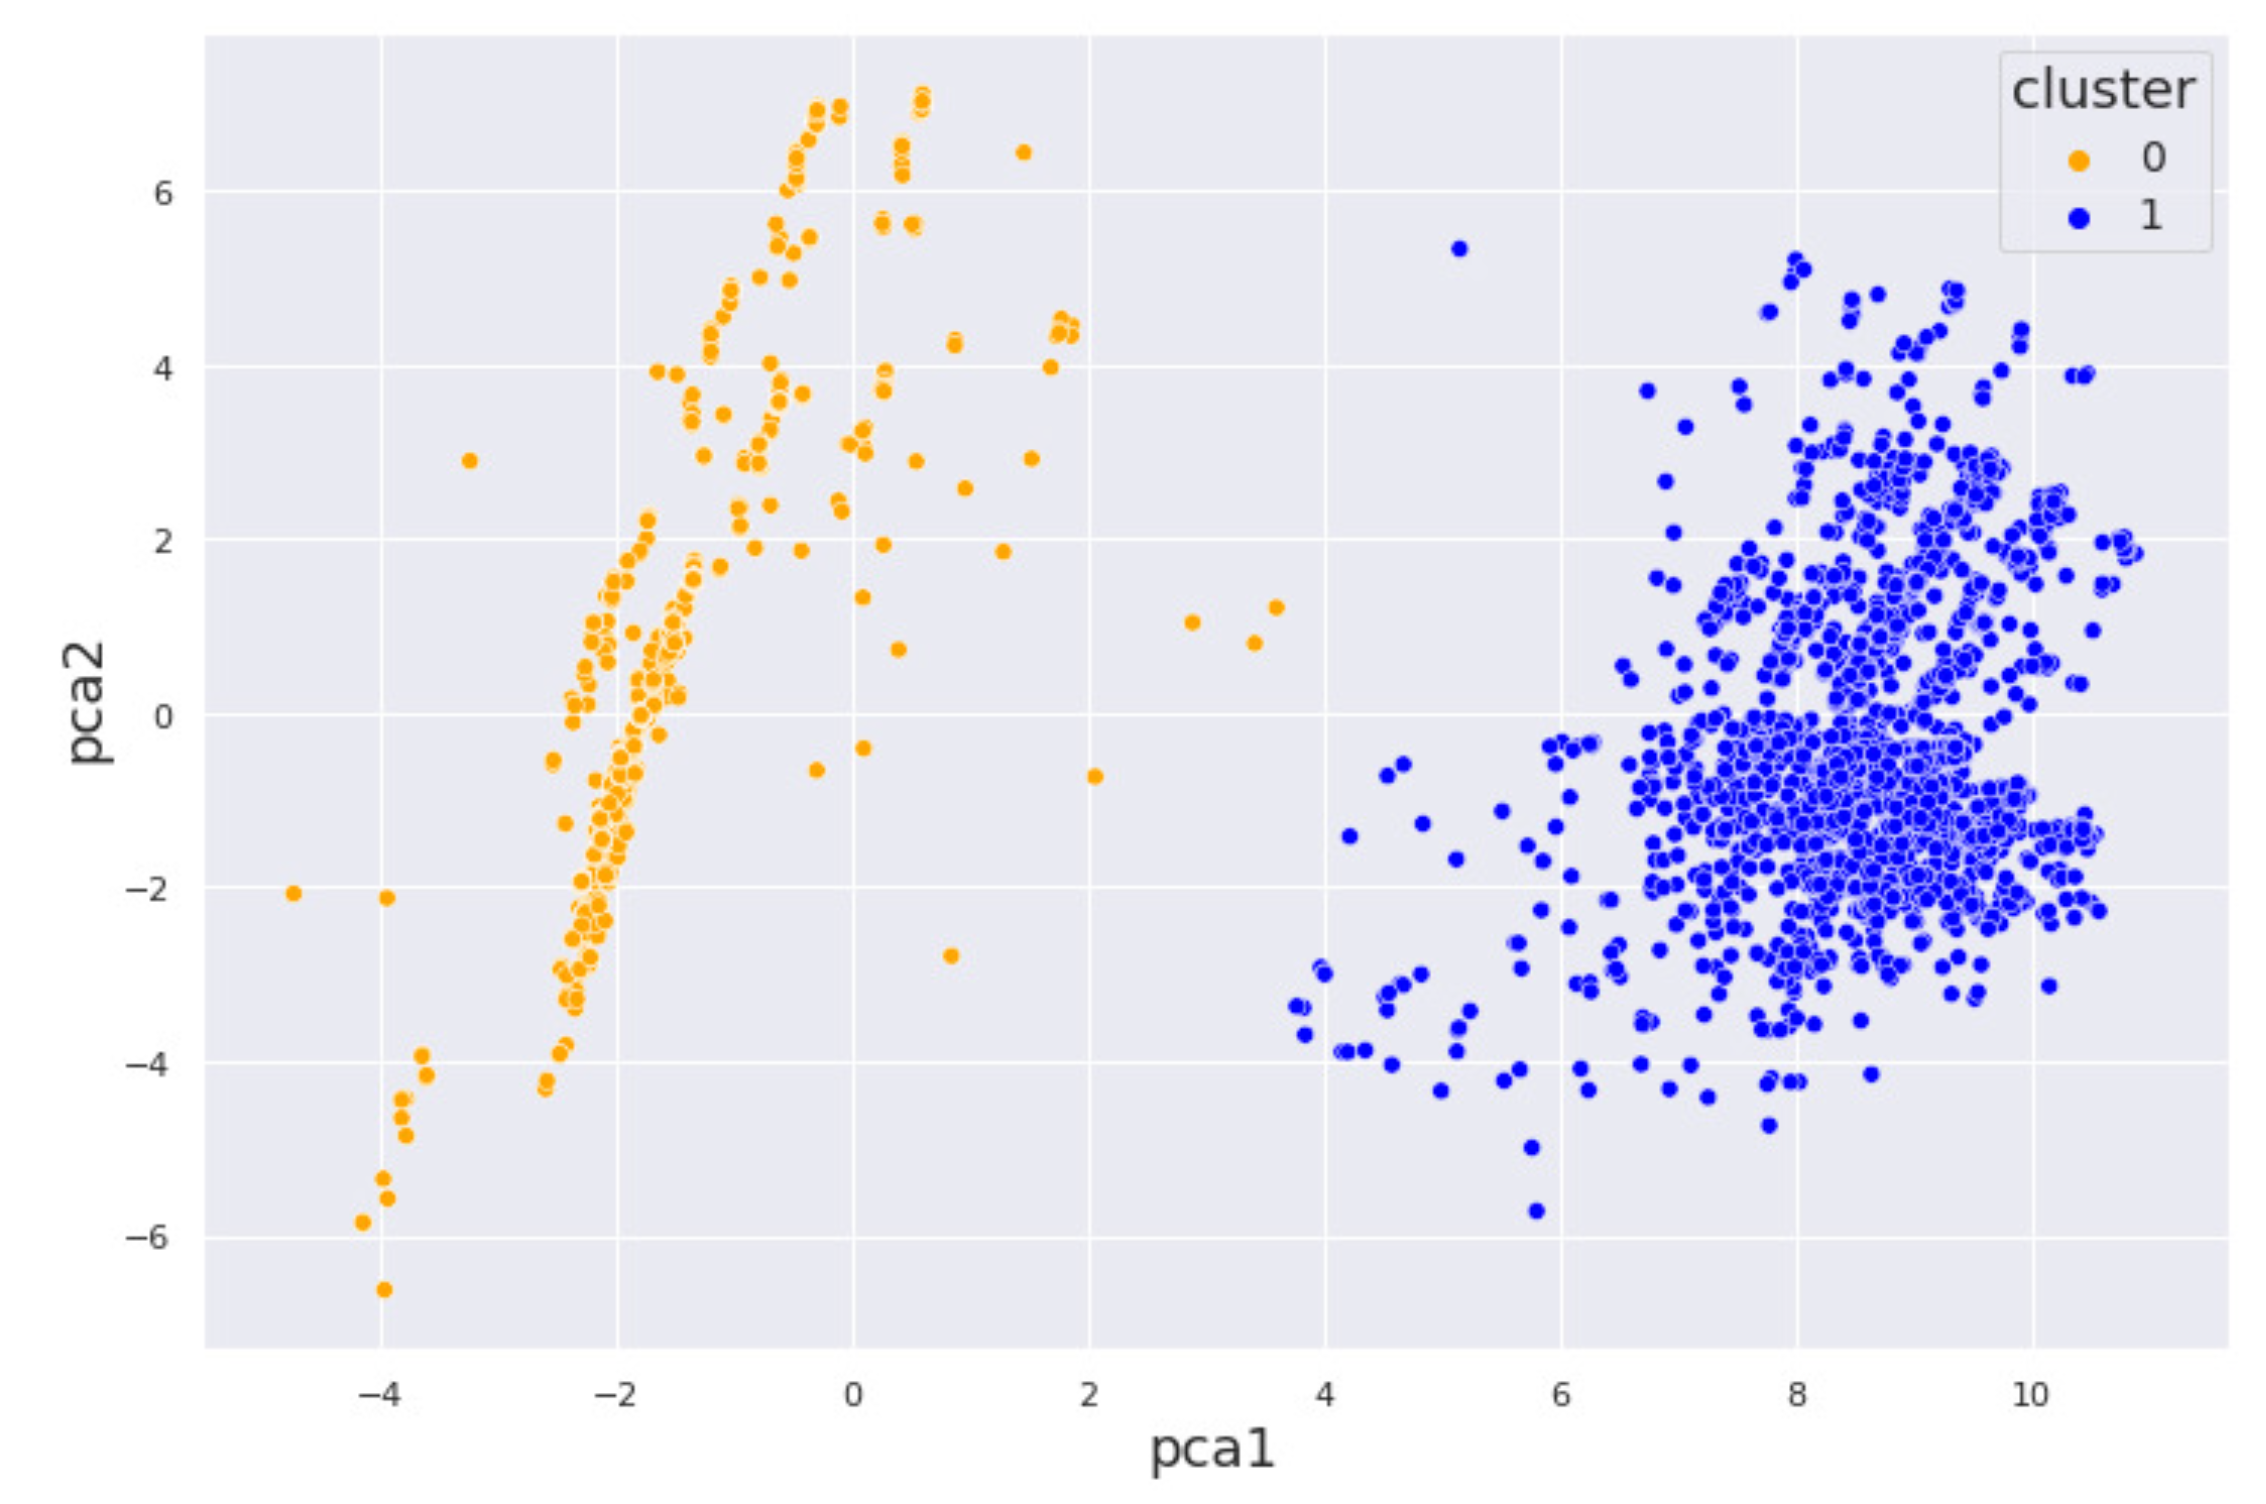
Figure 7.
DBSCAN for the marijuana dataset is shown in the figure. There is no noise cluster meaning that we have no outliers in the dataset.
Figure 7.
DBSCAN for the marijuana dataset is shown in the figure. There is no noise cluster meaning that we have no outliers in the dataset.

Figure 8.
The k-means clustering results for the cocaine dataset are shown with well-spaced clusters. The intra-cluster distances however are more spaced in the green cluster.
Figure 8.
The k-means clustering results for the cocaine dataset are shown with well-spaced clusters. The intra-cluster distances however are more spaced in the green cluster.
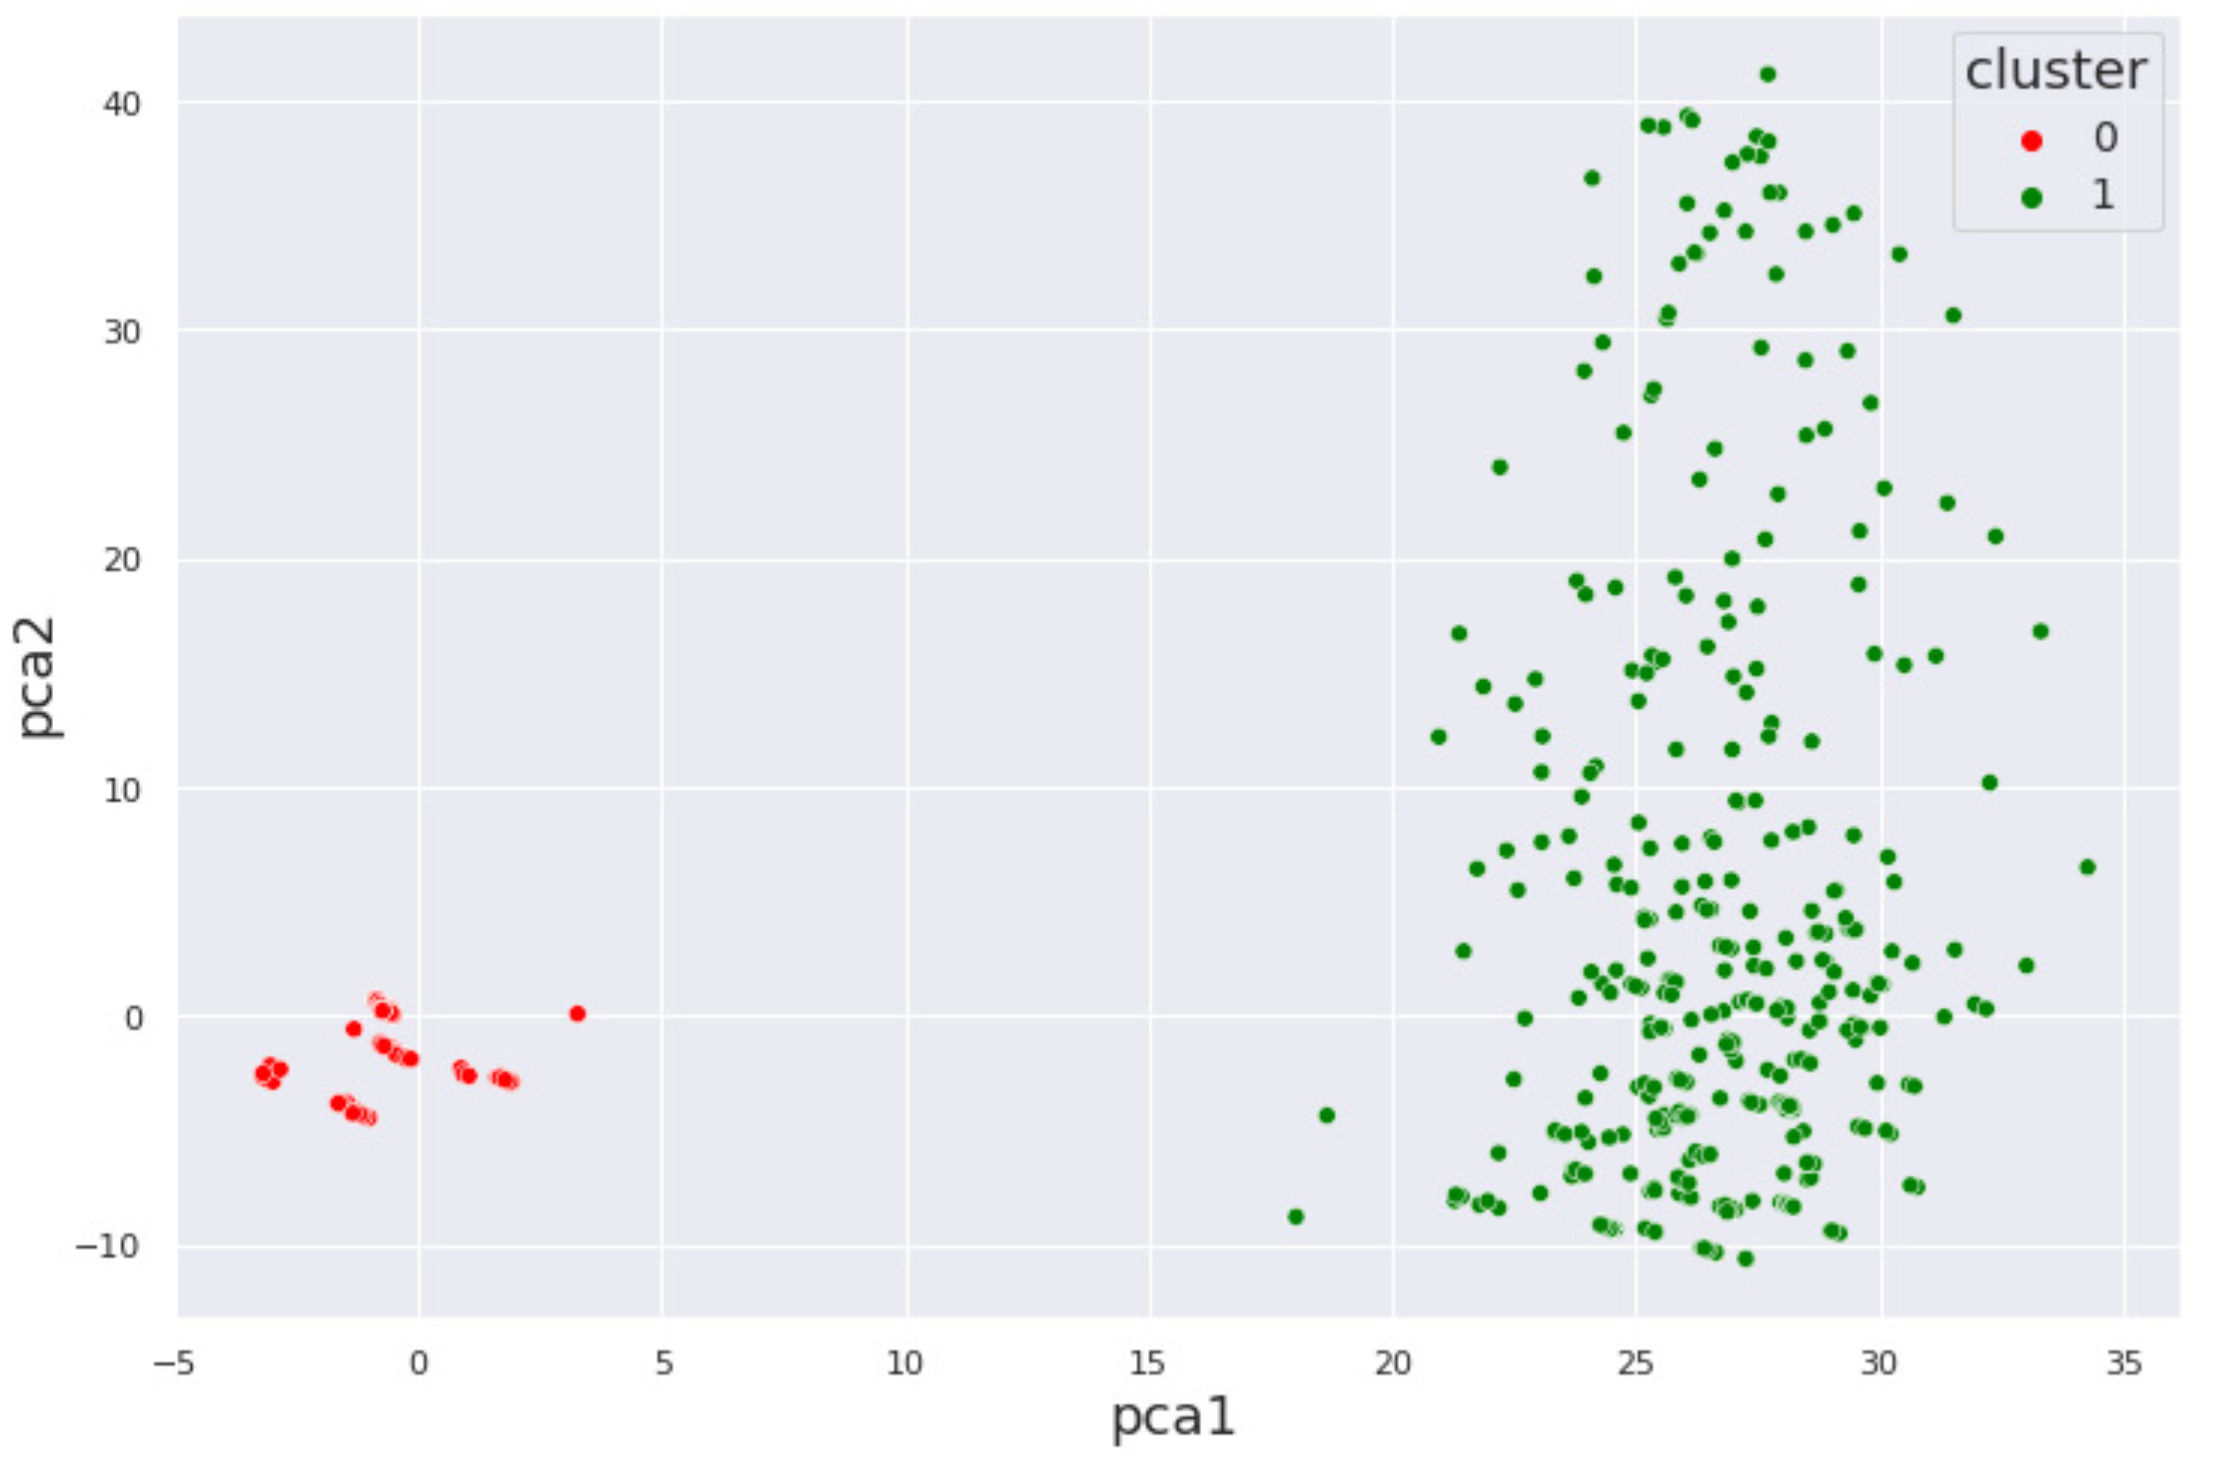
Figure 9.
Hierarchical clustering for the cocaine dataset with a high density of points in the first cluster.
Figure 9.
Hierarchical clustering for the cocaine dataset with a high density of points in the first cluster.
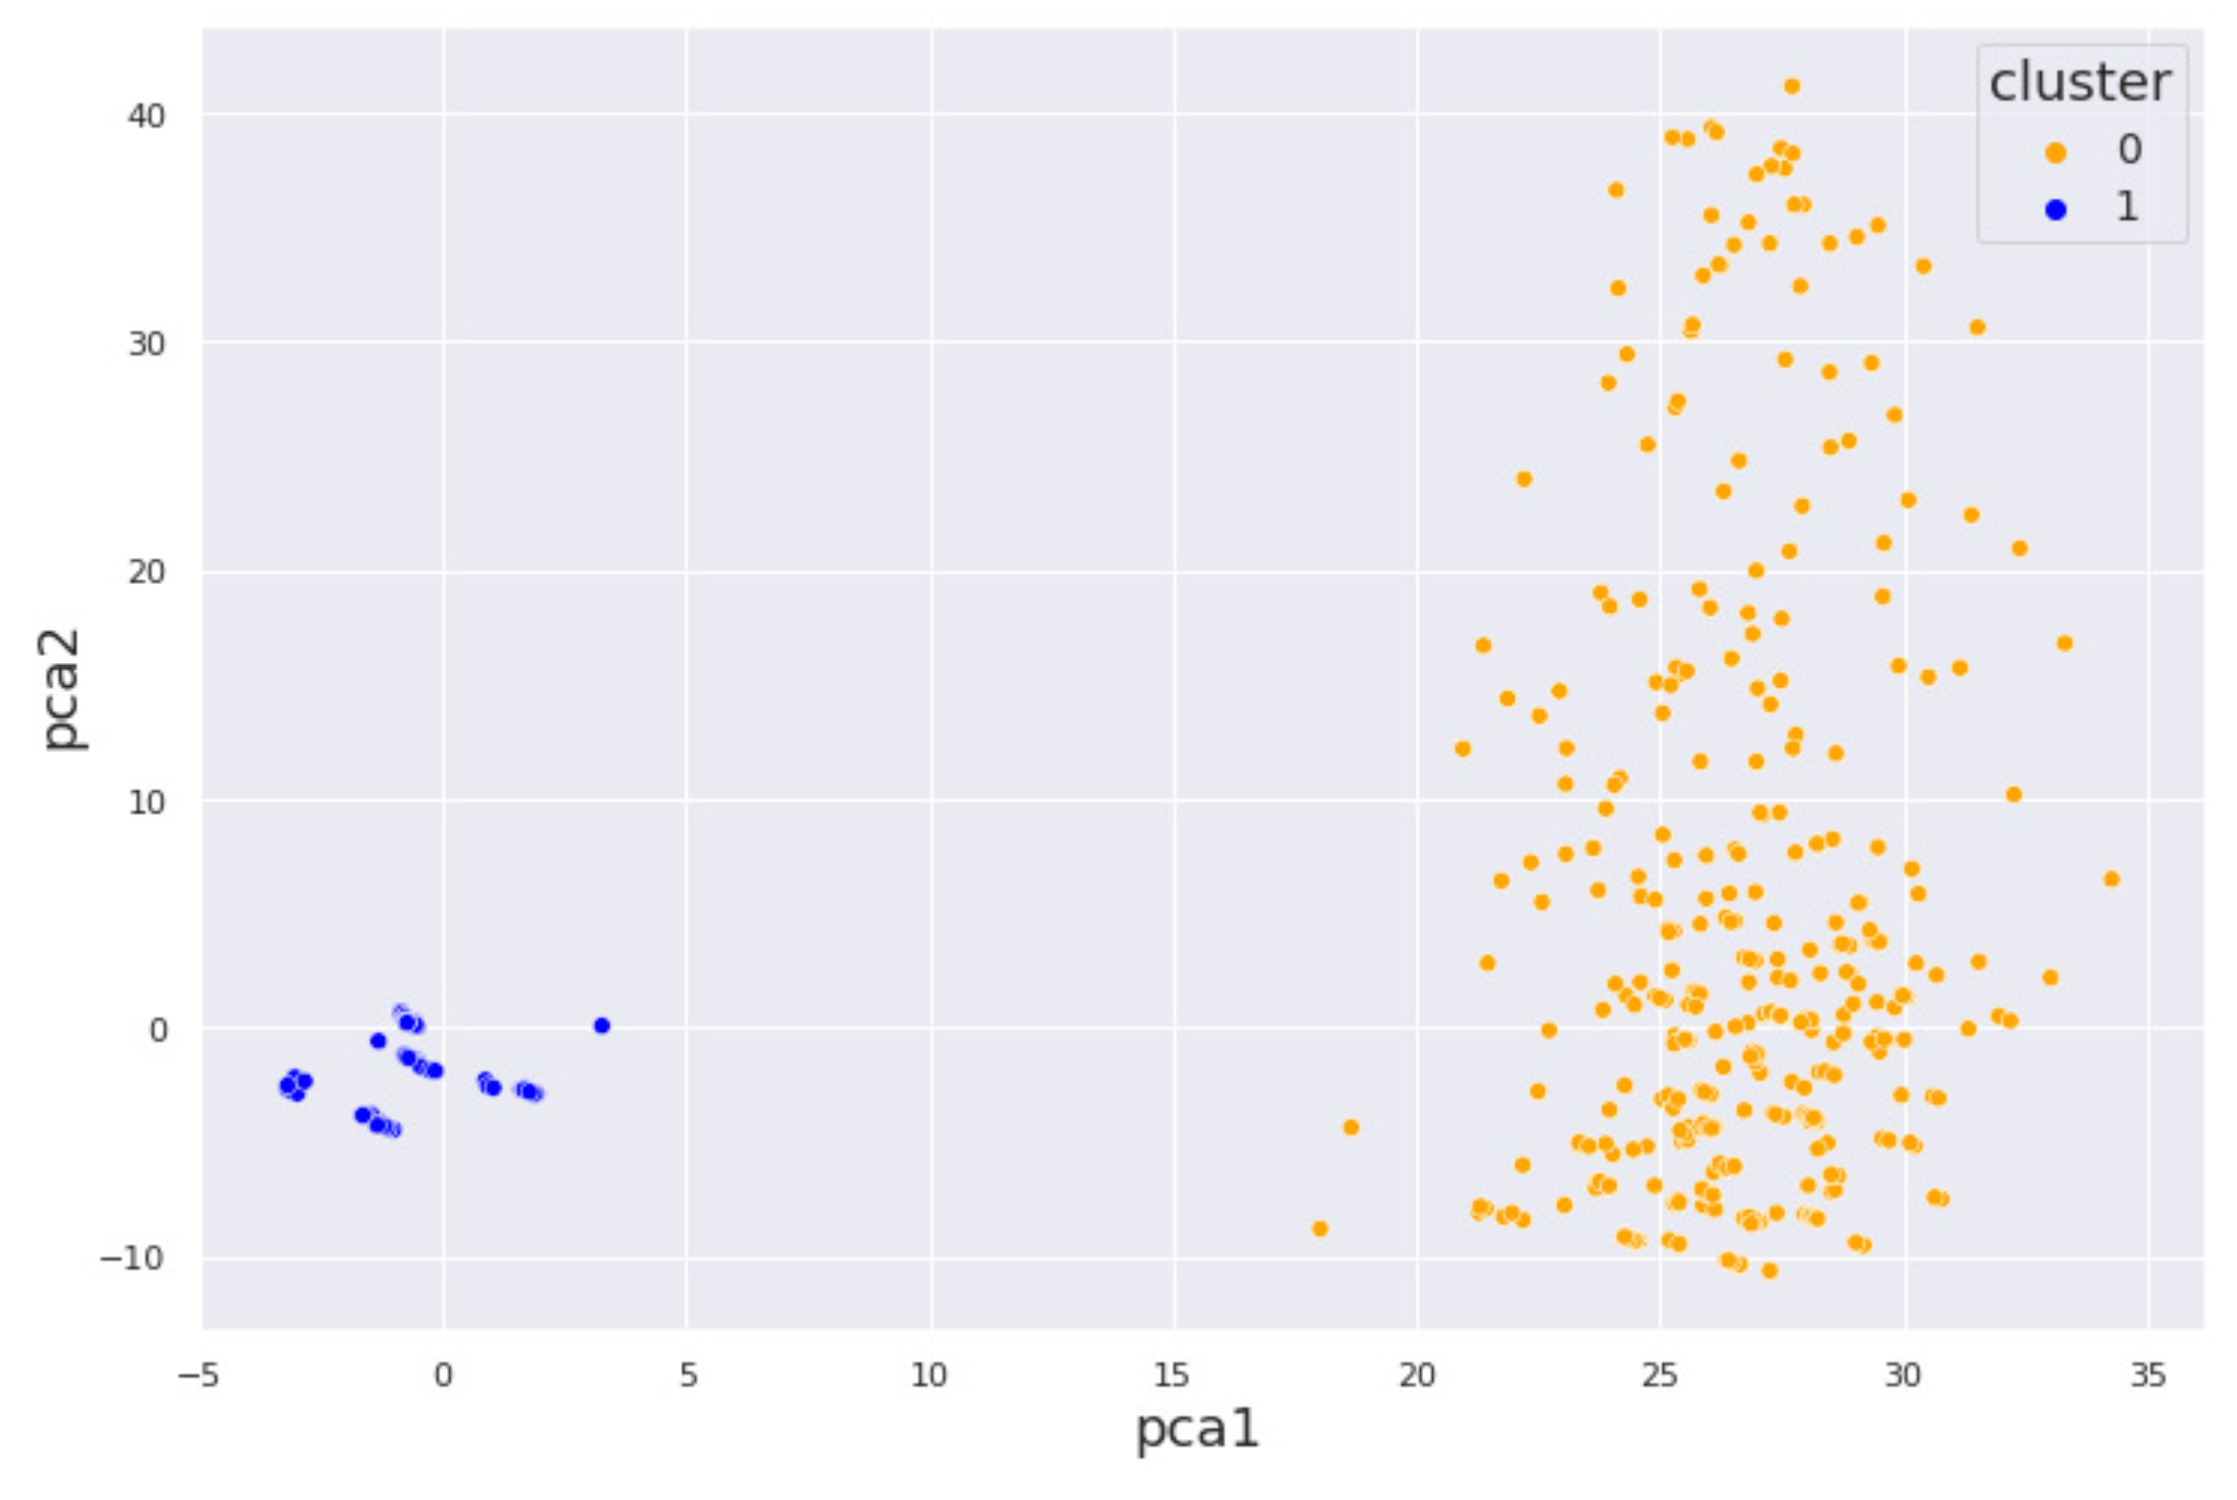
Figure 10.
DBSCAN for the cocaine dataset is clearly shown. The results indicate that many clusters are assigned very close to each other.
Figure 10.
DBSCAN for the cocaine dataset is clearly shown. The results indicate that many clusters are assigned very close to each other.


Table 1.
Summary of related literature on the application of machine learning for substance use disorder.
Table 1.
Summary of related literature on the application of machine learning for substance use disorder.
| Author & Year | Title (First Three Words) | Mental Health Issue | Machine Learning Model Used | Dataset used |
|---|---|---|---|---|
| Srividya et al., 2018 | Behavioral Modeling Mental | State of mental health | Unsupervised learning, Supervised learning, SVM, Naive Bayes, KNN, Logistic Regression | Survey (20 questions), Population 1: 300 subjects, Population 2: 356 subjects |
| Tarekeng et al., 2018 | Cross-Validation Approach | No specific mental health issue analyzed | Unsupervised learning, K-means, K-fold cross-validation, RMSE, MAPE | Chronic diseases, Emotions, Yeast dataset |
| Stevens et al., 2020 | Identification Analysis Behavioral | Autism Spectrum Disorder | Unsupervised learning, Hierarchical clustering | 2400 children from community centers across the U.S. |
| Jing et al., 2020 | Analysis of Substance Use | Substance Use Disorder (SUD) | Supervised learning, Random Forest | Recruited via advertisement, public service announcements, random digital calls, posters; Age: 10-22 years |
| Mannes et al., 2021 | Correlates of Mild, Moderate | Alcohol Use Disorder (AUD) | Supervised learning, Statistical analysis, Multinomial Logistic Regression | 150 participants (suburban inpatient addiction treatment), 438 participants (urban medical center), Age: 18+ years |
| Mintz et al., 2021 | A Cascade of Care for Alcohol | Alcohol Use Disorder (AUD) | Supervised learning, Statistical analysis, Multinomial Logistic Regression | 150 participants (suburban inpatient addiction treatment), 438 participants (urban medical center), Age: 18+ years |
| Hayley et al., 2017 | DSM-5 Cannabis Use Disorder | Cannabis Use Disorder (CaUD) | Supervised learning, Logistic Regression | NESARC-III (n=36,309), Age: 18+ years |
Abbreviations: ANN – Artificial Neural Network, DNN – Deep Neural Network, KNN – K-Nearest Neighbors, MAPE – Mean Absolute Percentage Error, NESARC – National Epidemiologic Survey on Alcohol and Related Conditions, RMSE – Root Mean Squared Error, SVM – Support Vector Machine.
Table 2.
Internal and External validation scores: Classical algorithms.
| Algorithm | Dataset | ||
|---|---|---|---|
| Alcohol (%) | Marijuana (%) | Cocaine (%) | |
| K-Means | |||
| Sil_score | 72.5 | 78.7 | 63.9 |
| K-fold | 99.96 | 99.92 | 99.84 |
| RMSE | 4.0 | 0.0 | 6.0 |
| Hierarchical | |||
| Sil_score | 69.2 | 83.4 | 47.5 |
| K-fold | 99.97 | 99.96 | 99.63 |
| RMSE | 6.0 | 0.0 | 35.89 |
| DBSCAN | |||
| Sil_score | 97.7 | 97.6 | 93.1 |
| K-fold | 99.96 | 100.0 | 98.8 |
| RMSE | 0.0 | 0.0 | 15.16 |
Table 3.
Internal and External validation: State-of-the-art algorithms.
| Algorithm | Dataset | ||
|---|---|---|---|
| Alcohol (%) | Marijuana (%) | Cocaine (%) | |
| K-Means++ | |||
| Sil_score | 78.7 | 83.4 | 95.56 |
| K-fold | 99.99 | 99.99 | 100 |
| RMSE | 0.0 | 0.0 | 0.0 |
| BIRCH | |||
| Sil_score | 68.7 | 61.2 | 96.6 |
| K-fold | 99.6 | 99.87 | 98.8 |
| RMSE | 8.9 | 8.0 | 15.12 |
| HDBSCAN | |||
| Sil_score | 38.2 | 23.7 | 37.1 |
| K-fold | 93.7 | 92.3 | 86.4 |
| RMSE | 7.5 | 19.5 | 57.4 |
Disclaimer/Publisher’s Note: The statements, opinions and data contained in all publications are solely those of the individual author(s) and contributor(s) and not of MDPI and/or the editor(s). MDPI and/or the editor(s) disclaim responsibility for any injury to people or property resulting from any ideas, methods, instructions or products referred to in the content. |
© 2025 by the authors. Licensee MDPI, Basel, Switzerland. This article is an open access article distributed under the terms and conditions of the Creative Commons Attribution (CC BY) license (http://creativecommons.org/licenses/by/4.0/).
Copyright: This open access article is published under a Creative Commons CC BY 4.0 license, which permit the free download, distribution, and reuse, provided that the author and preprint are cited in any reuse.


