Submitted:
22 May 2025
Posted:
22 May 2025
You are already at the latest version
Abstract
The post-combustion technology is a new kind of low-nitrogen combustion technology. To achieve the combined removal of nitrogen oxides (NOx) and sulfur dioxide(SO2) emissions, the post-combustion technology combined with the sorbent injection in the furnace and post-combustion chamber is proposed and experiments about the effects of the sorbent addition in post-combustion chamber and post-combustion air arrangement on NOx and SO2 emissions were conducted in a 0.1 MWth circulating fluidized bed test platform. In addition, a comparative analysis of the NOx and SO2 emissions under both combined removal methods was also performed. The results indicated that adding sorbent to the post-combustion chamber can reduce SO2 emissions, but further increasing the amount of sorbent will not significantly improve the desulfurization effect. The injection position of the post-combustion air will affect the emissions of NOx and SO2 in the flue gas. When three-stage distribution of post-combustion air is adopted, the further back the third nozzle is distributed, the lower the temperature in post-combustion chamber, which is beneficial to the control of NOx and SO2 emissions. Compared with the conventional combined removal method, the NOx emissions were significantly reduced under new combined removal method. Through the secondary desulfurization in the furnace and post-combustion chamber, and the oxygen-deficient combustion in the furnace can achieve the combined removal of NOx and SO2.
Keywords:
circulating fluidized bed
; post-combustion
; NOx
; SO2
; combined removal
1. Introduction
In China, circulating fluidized bed boilers(CFBs) are one of the main coal fired tools due to its obvious characteristics, such as low pollution emissions and fuel flexibility [1,2,3]. Under the ultra-low emission standard [4], CFB boilers have to apply the flue gas denitrification technology like selective non-catalytic reduction technology (SNCR) [5,6] and flue gas desulfurization technology like wet desulfurization technology [7,8,9]. The application of SNCR and wet desulfurization technology results in very high removal costs of emissions and secondary pollution.
To reduce the NOx emissions, the post-combustion technology of CFBs [10], a new low-nitrogen combustion technology, was proposed by the Institute of Engineering Thermophysics of the Chinese Academy of Sciences. Zhou et al. [11] found when the air stoichiometric ratio in furnace is 0.96 under post-combustion technology, the NOx emission was reduced to 48.7 mg/Nm3. Song et al. [12] found the NOx emission was reduced to 38 mg/Nm3 during combustion of coal slime under post-combustion technology. The post-combustion technology could meet the ultra-low NOx standard without SNCR, reducing the cost of NOx removal dramatically. Wang et al. [13,14] found post-combustion technology can reduce the NOx emission largely, but lead to a slight increase in SO2 emission. In addition, the NOx and SO2 emissions can be reduced to 47.10 mg/Nm3 and 92.09 mg/Nm3 by the post-combustion technology combined with the sorbent injection in the furnace, which has realized the ultra-low NOx emission standard and low SO2 emission. However, how to achieve the ultra-low NOx and ultra-low SO2 emissions under the post-combustion technology requires further study.
A CFB furnace is under a weakly reducing atmosphere and a post-combustion chamber is under oxidizing conditions at post-combustion technology [14]. Theoretically, the sorbent injection into post-combustion chamber can further reduce the SO2 emissions. Therefore, a new combined removal approach is proposed, that is, post-combustion technology united with the sorbent injection in the furnace and post-combustion chamber. This paper studies the effects of the sorbent addition in post-combustion chamber and the post-combustion air arrangement on the NOx and SO2 emissions. In addition, a comparative analysis of the NOx and SO2 emissions under both combined removal methods is also performed.
2. Experimental Section
2.1. Fuel Characteristics
The fuel used in the experiments is Shenmu coal [14]. Table 1 shows the proximate and ultimate analyses. The obvious characteristics of Shenmu coal are the high volatile matter and less sulfur content. Figure 1 shows the particle size distribution of coal. The 90%, 50%, and 10% cut mean diameters (d90, d50, and d10) are 603.07 μm, 293.04 μm, and 29.44 μm.
The bed material was quartz sand. There are two kinds of sorbents used in the experiments, which are limestone and hydrated lime. Table 2 and Table 3 shows the composition analysis of limestone and hydrated lime. The CaO content in limestone and hydrated lime is 52.79% and 74.10%. The particle size of both sorbents was 75 μm.
2.2. Test Platform
Figure 2 shows a 0.1 MWth CFB test platform [13]. There are six thermocouples in the CFB furnace and eight five thermocouples in post-combustion chamber. Six post-combustion air nozzles are equally arranged in post-combustion chamber, four nozzles in horizontal section and two nozzles in vertical section of post-combustion chamber, and these nozzles can be freely combined. The sorbent is mixed with coal and added into the CFB furnace with coal, while the sorbent is added into post-combustion chamber by screw feeder.
2.3. Measurements
The focus is combustion temperature and emissions in the flue gas during the experiments. Combustion temperature is monitored by thermocouples. The flue gas is measured by The Fodisch MCA14m analyzer with its error less than 1%, and it can continuously monitor NO, NO2, SO2, CO and O2 in the flue gas.
2.4. Experimental Conditions
Table 4 lists the experiment conditions. λCFB is the air stoichiometric ratio in the CFB furnace; λPCC is the air stoichiometric ratio in the post-combustion chamber; and λ is the total excess air coefficient; the formula is as follows [13]:
where AStoic is the gas flow rate with stoichiometric complete burnout, m3/h. APr is the airflow rate of the primary air; ARe, ACa, and APo are the airflow rates of returning air, carrying coal air, and post-combustion air, m3/h, respectively. O2 is the actual value in the flue gas.
3. Results and Discussion
3.1. Effects of the Amount of Sorbent Addition in Post-combustion Chamber on NOx and SO2 Emissions
3.1.1. Temperature Distribution at Different Amount of Sorbent Addition
Figure 3 displays the temperature distributions in CFB furnace and post-combustion chamber at different amount of sorbent addition in post-combustion chamber. In Figure 3 (a), Ca/S=0, 1.25 and 1.5~2 represent the amount of limestone addition in the post-combustion chamber. As can be seen from Figure 3 (a), the temperature in the furnace is almost the same under the three operating conditions, that is, along the direction of the air flow, the temperature first rises rapidly, reaches the maximum temperature at T3, and then decreases slowly. Since the variable studied in this group is the amount of sorbent addition in post-combustion chamber, the operating conditions in the furnace are the same, so the temperature is also the same. The lowest temperature is at T1 in the furnace because of the addition of the cooler gases and solid particles at the bottom furnace and they absorb a lot of heat [15]. The rapid increase in temperature from T1 to T3 is due to the rapid combustion of volatile matter from the decomposition of coal at high temperatures. The temperature is highest at T3, which indicates that the precipitated volatiles and char is mainly combusted at this point. The temperature of T3 to T6 gradually decreases due to heat absorption by the water-cooled tube in the upper part of the furnace.
Figure 3 (b) displays the temperature distribution in the post-combustion chamber at different quantity of sorbent addition different. As can be seen from Figure 3 (b), the temperature in the post-combustion chamber under the three operating conditions has a similar trend, which is a rapid decrease first, then a slow increase, then a gradual decrease, and finally a rapid decrease. The post-combustion air with lower temperature first absorbs a lot of heat after entering into the post-combustion chamber, resulting in a rapid drop in temperature. When the combustible components that escaping from the cyclone outlet meet post-combustion air, a secondary combustion occurs at high temperatures, generating a certain amount of heat, so that the temperature at the t3 to t5 positions rises slightly. As the combustible components burn out, the temperature drops rapidly. When the sorbent addition into the post-combustion chamber is 0, the temperature is slightly lower than that in the other two operating conditions, because the top temperature in the furnace is lower than T6, which leads to a slightly lower overall temperature in the post-combustion chamber. Comparing case 1-2 and case 1-3, it can be found that the temperature of t2 in case 3 is higher than that in case 1-2, but the temperature in t3-t7 is lower than the corresponding temperature of case 1-2, because the amount of sorbent added in case 1-3 is more, and the sorbent enters the furnace for decomposition reaction, which will absorb more heat.
3.1.2. NOx and SO2 Emissions at Different Amount of Sorbent Addition
Figure 4 shows the NOx and SO2 emissions under different amount of sorbent addition in the post-combustion chamber. From Figure 4, when the amount of sorbent addition in post-combustion chamber is 0, that is, only the sorbent is added in the furnace, and the SO2 emission is 861mg/Nm3, which indicates that the desulfurization effect in the furnace is very poor at high temperature under the post-combustion condition. This is because the sulfur fixation products undergo a decomposition reaction at high temperatures, releasing SO2 [16,17]. When the amount of sorbent addition in the post-combustion chamber is 1.25, the SO2 emission was reduced to 552 mg/Nm3, and the extent of the decrease is 36%, which indicated that the addition of sorbent into the post-combustion chamber can reduce the SO2 emission. The atmosphere in a post-combustion chamber was oxidizing, and sulfur removal can be carried out through the following reaction:
CaO + SO2 + 1/2O2→CaSO4
By further increasing the amount of sorbent in the post-combustion (Ca/S about 1.5~2), the SO2 emission was reduced to 497 mg/Nm3, which was reduced by 10%, and the desulfurization effect was not significantly improved.
From Figure 4, the addition of sorbent into the post-combustion chamber will result in a slight increase in NOx emissions. Specifically, when the amount of sorbent into the post-combustion chamber is 0, the NOx emission is 150 mg/Nm3, and the amount of sorbent in the post-combustion chamber is 1.25, the NOx emission increases to 173 mg/Nm3, and the extent of the increase is 15%. This is because of the heterogeneous catalysis of the sorbent, and it can lead to the conversion of NH3 and HCN to NO [18]:
NH3 + O2→NO + N2
HCN + O2→NO + N2
Further increasing the amount of sorbent (Ca/S about 1.5~2), the NOx emission increased to 176 mg/Nm3, and the extent of the increase is 2%. From the above analysis, the addition of sorbent in the post-combustion chamber can reduce SO2 emissions. Under post-combustion conditions, the desulfurization effect in the furnace is very poor at high temperature due to the decomposition of sulfur fixation products. In addition, the addition of sorbent in the post-combustion chamber will lead to an increase in NOx emissions, but the extent of the increase is not significant.
3.2. Effects of Post-combustion Air Arrangement on NOx and SO2 Emissions
3.2.1. Temperature Distribution at Different Post-Combustion Air Arrangement
Since the atmosphere in CFB furnace is reducing, the nitrogen-containing and sulfur-containing gaseous products in CFB furnace will enter into a post-combustion chamber [14], and a secondary combustion occurred when they meet the post-combustion air. Besides, the mixture of sorbent post-combustion air and gases from CFB furnace depends on the post-combustion air arrangement, which affects the NOx and SO2 emissions. Since the changing trends of temperature in the furnace at case 2-1~2-8 is the same, the temperature distribution is not displayed. In addition, in order to better demonstrate the temperature changes in in post-combustion chamber at different post-combustion air arrangement, the eight working conditions were divided into two groups, as shown in Figure 5 (a) and (b).
Figure 5 (a) shows the temperature distribution in post-combustion chamber at case 2-1~ 2-4. From Figure 5 (a), the temperatures in post-combustion chamber decline rapidly first, reach the lowest point, then rise slowly, and finally slowly decrease. In addition to case 2-4, case 2-1, case 2-2 and case 2-3 have very similar temperature changes. This is because nozzle 1, nozzle 2 and nozzle 3 are close to each other, and nozzle 1, nozzle 2 and nozzle 3 are distributed in the horizontal section of post-combustion chamber. The temperature at case 2-4 is obviously different from that at the other three cases, because the nozzle 6 is far away from the nozzle 1, the nozzle 2 and the nozzle 3, and it is distributed in the vertical section of post-combustion chamber. In addition, the temperature gradually decreases along the direction of the air flow, so the temperature at t4 is lower. Figure 5 (b) shows the temperature distribution in post-combustion chamber for case 2-5~ 2-8. From Figure 5 (b), the temperature in post-combustion chamber also decreases rapidly, then rises slowly, and finally decreases slowly. The difference between case 2-5, 2-6, 2-7 and 2-8 is nozzle 3, 4, 5 and 6, which are arranged sequentially along the direction of the airflow. The further back the third nozzle is distributed, the lower the temperature at t4~t5.
3.2.2. NOx and SO2 Emissions at Different Post-combustion Air Arrangement
Figure 6 shows the NOx and SO2 emissions under different arrangement of post-combustion air during simultaneous desulfurization in the furnace and in the post-combustion chamber under post-combustion conditions. For case 2-1~case 2-4, it can be seen from Figure 6 that the NOx emission at case 2-4 is the lowest, which is due to the lower combustion temperature in the post-combustion chamber in case 2-4. The SO2 emission is the lowest at case 2-3, because the nozzle 3 is on the same section as the sorbent addition port in post-combustion chamber, so the mixing effect of the post-combustion air and sorbent is better, and the desulfurization effect is also the best.
Comparing the NOx and SO2 emissions at case 2-5~2-8, the NOx and SO2 emissions at case 2-7 and case 2-8 are relatively low, among which the NOx and SO2 emissions at case 2-8 are the lowest, are 110 mg/Nm3 and 387 mg/Nm3, respectively, because the combustion temperature in the post-combustion chamber is relatively low, and the post-combustion air is mixed with hot flue gas after injection, and the temperature is rapidly reduced to reach the lowest point, and then burned at a lower temperature, so that the NOx emission is lower. In addition, at lower temperatures, the desulfurization efficiency is higher, resulting in lower SO2 emissions. From the above analysis, when desulfurization in the furnace and the post-combustion chamber are performed at the same time, the selection of nozzle 1, 2 and 5 or nozzle 1, 2 and 6 is the most beneficial for control of NOx and SO2 emissions. Therefore, when three-stage distribution of post-combustion air is adopted, the further back the third nozzle is distributed, the lower the temperature in post-combustion chamber, which is beneficial to the control of NOx and SO2 emissions.
3.3. NOx and SO2 Emissions: New Combined Removal Approach Vs. Conventional Combined Removal Approach
3.3.1. Temperature Distribution in the CFB Furnace and Post-Combustion Chamber
New combined removal approach is post-combustion technology united with the sorbent injection in the furnace and post-combustion chamber, and conventional combined removal approach is conventional circulating fluidized bed combustion united with the sorbent injection in furnace. Figure 7 shows the temperature distribution in CFB furnace and post-combustion chamber under two combined removal approaches. From Figure 7(a), the change trend of temperature in the furnace is the same under the two approaches, that is, along the direction of the air flow, the temperature first rises rapidly and then decreases slowly, and the maximum temperature is reached at the T3 position. The corresponding temperature at conventional approach is higher before reaching the maximum temperature, while the temperature is higher at new approach after the maximum temperature. This is because a primary air is injected into the furnace from the bottom, and the oxygen concentration in the furnace is higher under conventional combustion, and the combustion is more sufficient, so the temperature below the T3 position at conventional combustion is higher. The opposite is true under the post-combustion condition, a lot of combustible components move up along the air flow due to insufficient combustion, therefore, after the T3 position, the temperature is higher under the post-combustion condition. Figure 7(b) shows the temperature distribution of the post-combustion chamber. T5 is the temperature intersection point of the two working conditions, the temperature at each point is lower under the post-combustion condition before t5, and the temperature at each point is higher after t5 under the post-combustion condition.
3.3.2. NOx and SO2 Emissions Under Both Combined Removal Methods
Figure 8 shows the NOx and SO2 emissions for both new combined removal approach and conventional combined removal approach. From Figure 8, the NOx under conventional combined removal approach is up to 241 mg/Nm3. There are two reasons: one is the original NOx emission is high under conventional circulating fluidized bed combustion; the other is injecting the sorbent into the furnace can lead to an increase in NOx emissions due to the heterogeneous catalysis of the sorbent. Compared with conventional combined removal approach, the NOx emission is significantly reduced under new combined removal approach. Specifically, the NOx emission is only 108 mg/Nm3 under new approach, reduced by 55%. The atmosphere in CFB furnace is reducing under new approach. The amount of NOx generated in CFB furnace during the combustion is scarce or very lower [13]. Besides, the minor amount of NOx generated is very easy to be reduced to N2. Finally, the adverse impact of the sorbent addition on the NOx emission is not important [19].
For SO2 emissions, as can be seen from Figure 8, the SO2 emissions can be reduced to 193 mg/Nm3 by conventional sorbent addition in the furnace, while the SO2 emissions can be reduced to 176 mg/Nm3 by the sorbent addition into the furnace and the post-combustion chamber under post-combustion conditions, and the SO2 emissions are lower. This is because desulfurization reactions will occur twice under new approach through the following reactions [20,21]:
CFB furnace: CaO + H2S→CaS + H2O
Post-combustion Chamber: CaO + SO2 + 1/2O2→CaSO4
Although more sorbent is added under new combined removal approach, this scheme is still feasible. Form the above analysis, the post-combustion technology united with the sorbent injection in the furnace and post-combustion chamber can realize the combined removal of NOx and SO2 at low costs.
4. Conclusions
A new approach to the combined removal of NOx and SO2 emissions proposed in this study was the post-combustion technology united with the sorbent injection in the furnace and post-combustion chamber, and the potential of combined removal of the NOx and SO2 emissions under new approach was explored. The main conclusions from the experiments can be formed:
a) Adding sorbent to the post-combustion chamber can reduce SO2 emissions, but further increasing the amount of sorbent will not significantly improve the desulfurization effect. In addition, the addition of sorbent in the post-combustion chamber will lead to an increase in NOx emissions, but the extent of the increase is not significant.
b) The injection position of the post-combustion air will affect the emissions of NOx and SO2 in the flue gas. When three-stage distribution of post-combustion air is adopted, the further back the third nozzle is distributed, the lower the temperature in post-combustion chamber, which is beneficial to the control of NOx and SO2 emissions.
c) Compared with the conventional combined removal method, the NOx emissions were significantly reduced under new combined removal method. Through the secondary desulfurization in the furnace and post-combustion chamber, and the oxygen-deficient combustion in the furnace can achieve the combined removal of NOx and SO2.
Author Contributions
Formal analysis, C.W.; Investigation, C.W.; Data curation, C.W.; Writing—original draft, C.W.; Writing—review & editing, C.W.; Supervision, Q.L. All authors have read and agreed to the published version of the manuscript.
Funding
This research received no external funding.
Data Availability Statement
The original contributions presented in this study are included in the article. Further inquiries can be directed to the corresponding author.
Conflicts of Interest
The authors declare no conflict of interest.
References
- Yang, H.; Guangxi, Y.; Lu, J.; Zhang, H. An update of circulating fluidised bed combustion (CFB) technology in China. VGB Power Tech. 2012, 92, 75–79. [Google Scholar]
- Yue, G.; Cai, R.; Lu, J.; Zhang, H. From a CFB reactor to a CFB boiler—The review of R&D progress of CFB coal combustion technology in China. Powder Technol. 2017, 316, 18–28. [Google Scholar]
- Koornneef, J.; Junginger, M.; Faaij, A. Development of fluidized bed combustion—An overview of trends, performance, and cost. Prog. Energy Combust. Sci. 2007, 33, 19–55. [Google Scholar] [CrossRef]
- Shuangchen, M.; Jin, C.; Kunling, J.; Lan, M.; Sijie, Z.; Kai, W. Environmental influence and countermeasures for high humidity flue gas discharging from power plants. Renew. Sustain. Energy Rev. 2017, 73, 225–235. [Google Scholar] [CrossRef]
- Emis. Selective Non-Catalytic Reduction. 2018. Available online: https://emis.vito.be/en/techniekfiche/selective-non-catalytic-reduction (accessed on 11 April 2024).
- Li, Z.; Liu, X.M.; Yang, D.H.; Qin, W.J. Research of the SNCR Process and its Application. Adv. Mater. Res. 2014, 953, 1307–1314. [Google Scholar] [CrossRef]
- IEA. Flue Gas Desulfurization (FGD) for SO2 Control. 2006. Available online: http://www.iea-coal.org.uk/ (accessed on 11 April 2024).
- Warych, J.; Szymanowski, M. Optimum values of process parameters of the “wet limestone flue gas desulfurization system”. Chem. Eng. Technol. 2015, 25, 427–432. [Google Scholar] [CrossRef]
- Li, X.; Han, J.; Liu, Y.; Dou, Z.; Zhang, T.-A. Summary of research progress on industrial flue gas desulfurization technology. Sep. Purif. Technol. 2022, 281, 119849. [Google Scholar] [CrossRef]
- Wang, C.; Song, G.; Yang, Z.; Xiao, Y.; Yang, X.; Ji, Z.; Lyu, Q. Influence of limestone addition on combustion and emission characteristics of coal slime in the 75 t/h CFB boiler with post-combustion chamber. J. Therm. Sci. 2023, 32, 1849–1857. [Google Scholar] [CrossRef]
- Zhou, T.; Lu, Q.; Cao, Y.; Wu, G.; Li, S. Study on the combustion and NOx emission characteristics of low rank coal in a circulating fluidized bed with post-combustion. Can. J. Chem. Eng. 2017, 95, 2333–2340. [Google Scholar] [CrossRef]
- Song, G.; Xiao, Y.; Yang, Z.; Yang, X.; Lyu, Q.; Zhang, X.; Pan, Q. Operating characteristics and ultra-low NOx emission of 75 t/h coal slime circulating fluidized bed boiler with post-combustion technology. Fuel 2021, 292, 120276. [Google Scholar] [CrossRef]
- Wang, C.; Song, G.; Chen, R.; Jiang, Y.; Lyu, Q. Influence of operating parameters on NOx and SO2 emissions in circulating fluidized bed with post-combustion. J. Therm. Sci. 2023, 32, 1858–1867. [Google Scholar] [CrossRef]
- Wang C, Lyu Q. Combined Removal of NOx and SO2 in Circulating Fluidized Beds with Post-Combustion. Processes. 2025, 13(5):1496.
- Basu, P.; Fraser, S.A. Circulating Fluidized Bed Boilers; Elsevier Science: Amsterdam, The Netherlands, 1991. [Google Scholar]
- Meng L, Zhang X, Li N, et al. Study on sulfur transformation during the drying of Lignite and sulfur distribution in pyrolysis [J]. Journal of Analytical and Applied Pyrolysis, 2024, 180: 106535.
- Wang Y, Ye L, Chen Y, et al. Sulfur migration and conversion during co-combustion of sewage sludge and coal slime [J]. Renewable Energy, 2024, 237: 121646.
- Jensen, A.; Johnsson, J.E.; Dam-Johansen, K. Nitrogen chemistry in FBC with limestone addition. Symp. Combust. 1997, 26, 3335–3342. [Google Scholar] [CrossRef]
- Åmand, L.E.; Leckner, B.; Dam-Johansen, K. Influence of SO2 on the NO/N2O chemistry in fluidized bed combustion: 1. Full-scale experiments. Fuel 1993, 72, 557–564. [Google Scholar]
- Chen, R.; Zhang, T.; Guo, Y.; Wang, J.; Wei, J.; Yu, Q. Recent advances in simultaneous removal of SO2 and NOx from exhaust gases: Removal process, mechanism and kinetics. Chem. Eng. J. 2021, 420, 127588. [Google Scholar] [CrossRef]
- Liu, Y.; Li, B.; Lei, X.; Liu, S.; Zhu, H.; Ding, E.; Ning, P. Novel method for high-performance simultaneous removal of NOx and SO2 by coupling yellow phosphorus emulsion with red mud. Chem. Eng. J. 2022, 428, 131991. [Google Scholar] [CrossRef]
Figure 1.
Particle size distribution of coal [13].
Figure 1.
Particle size distribution of coal [13].
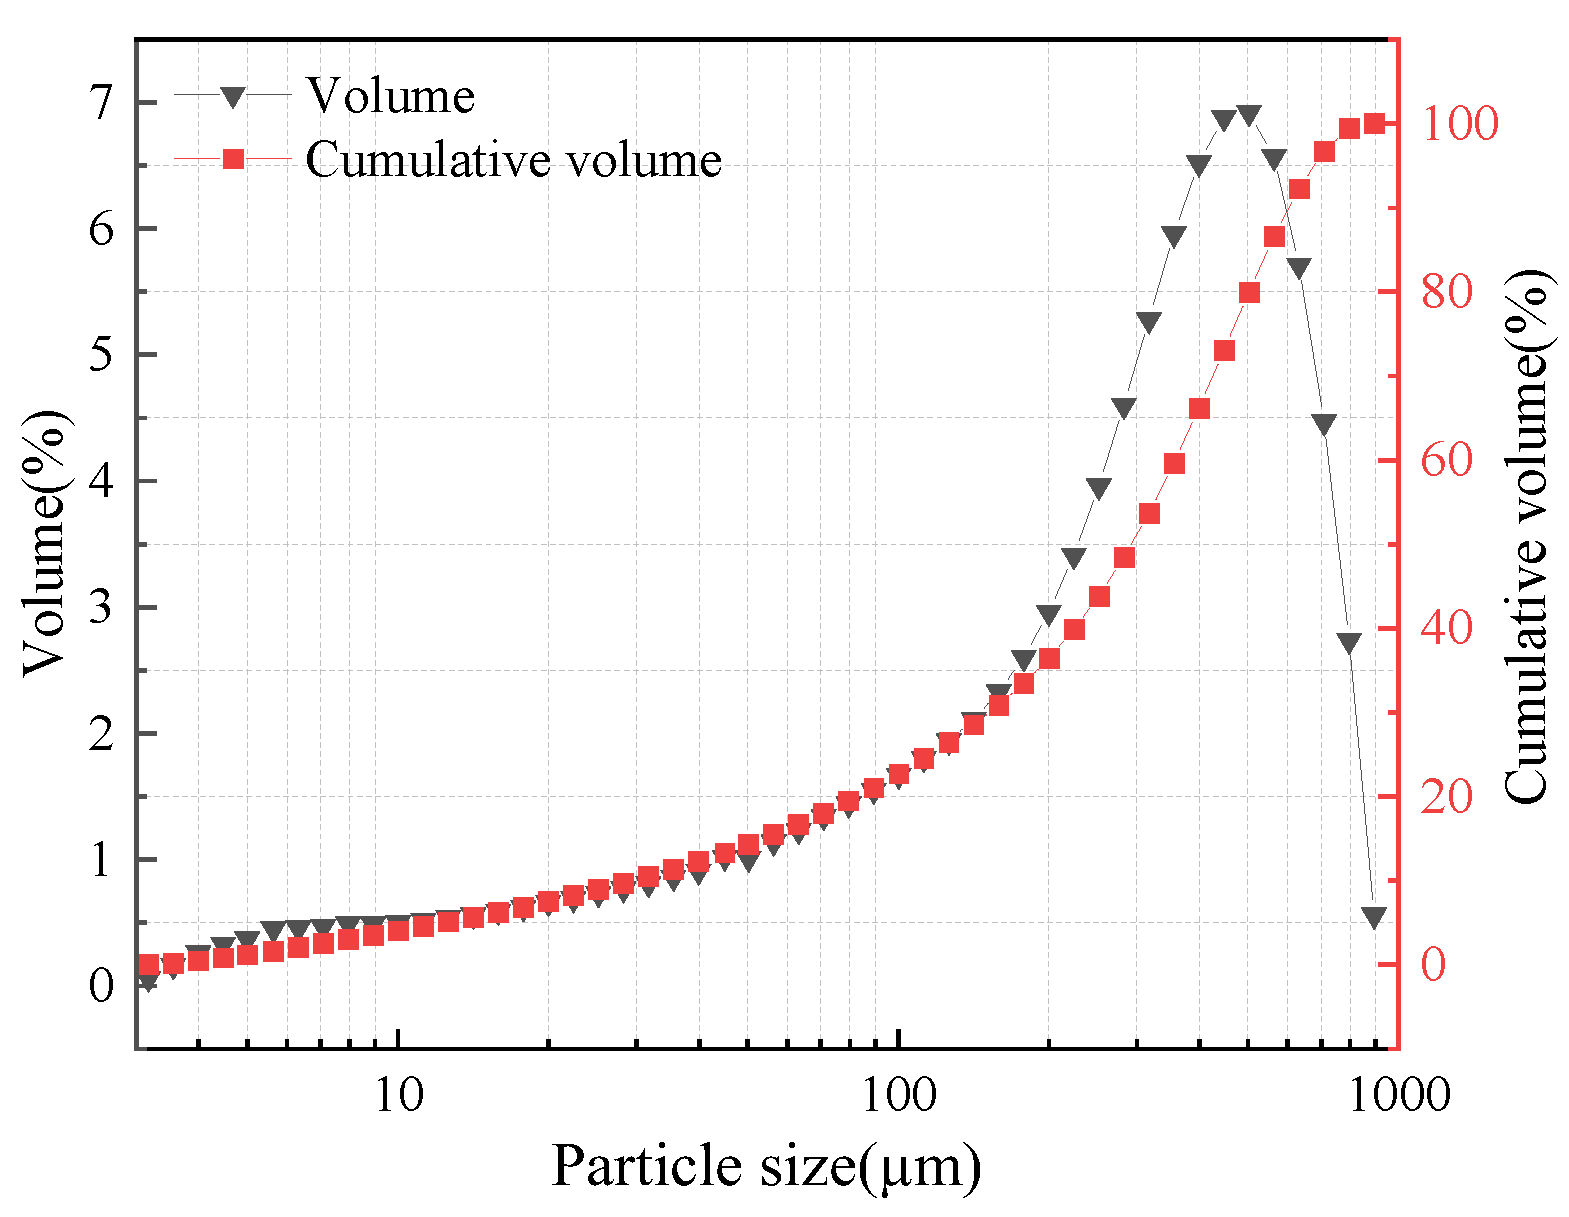
Figure 2.
0.1 MWth CFB test platform. a. Furnace of CFB; b. cyclone; c. Seal loop; d. post-combustion chamber; e. post-combustion air preheater; f. primary air preheater; g. bag-type dust collector.
Figure 2.
0.1 MWth CFB test platform. a. Furnace of CFB; b. cyclone; c. Seal loop; d. post-combustion chamber; e. post-combustion air preheater; f. primary air preheater; g. bag-type dust collector.
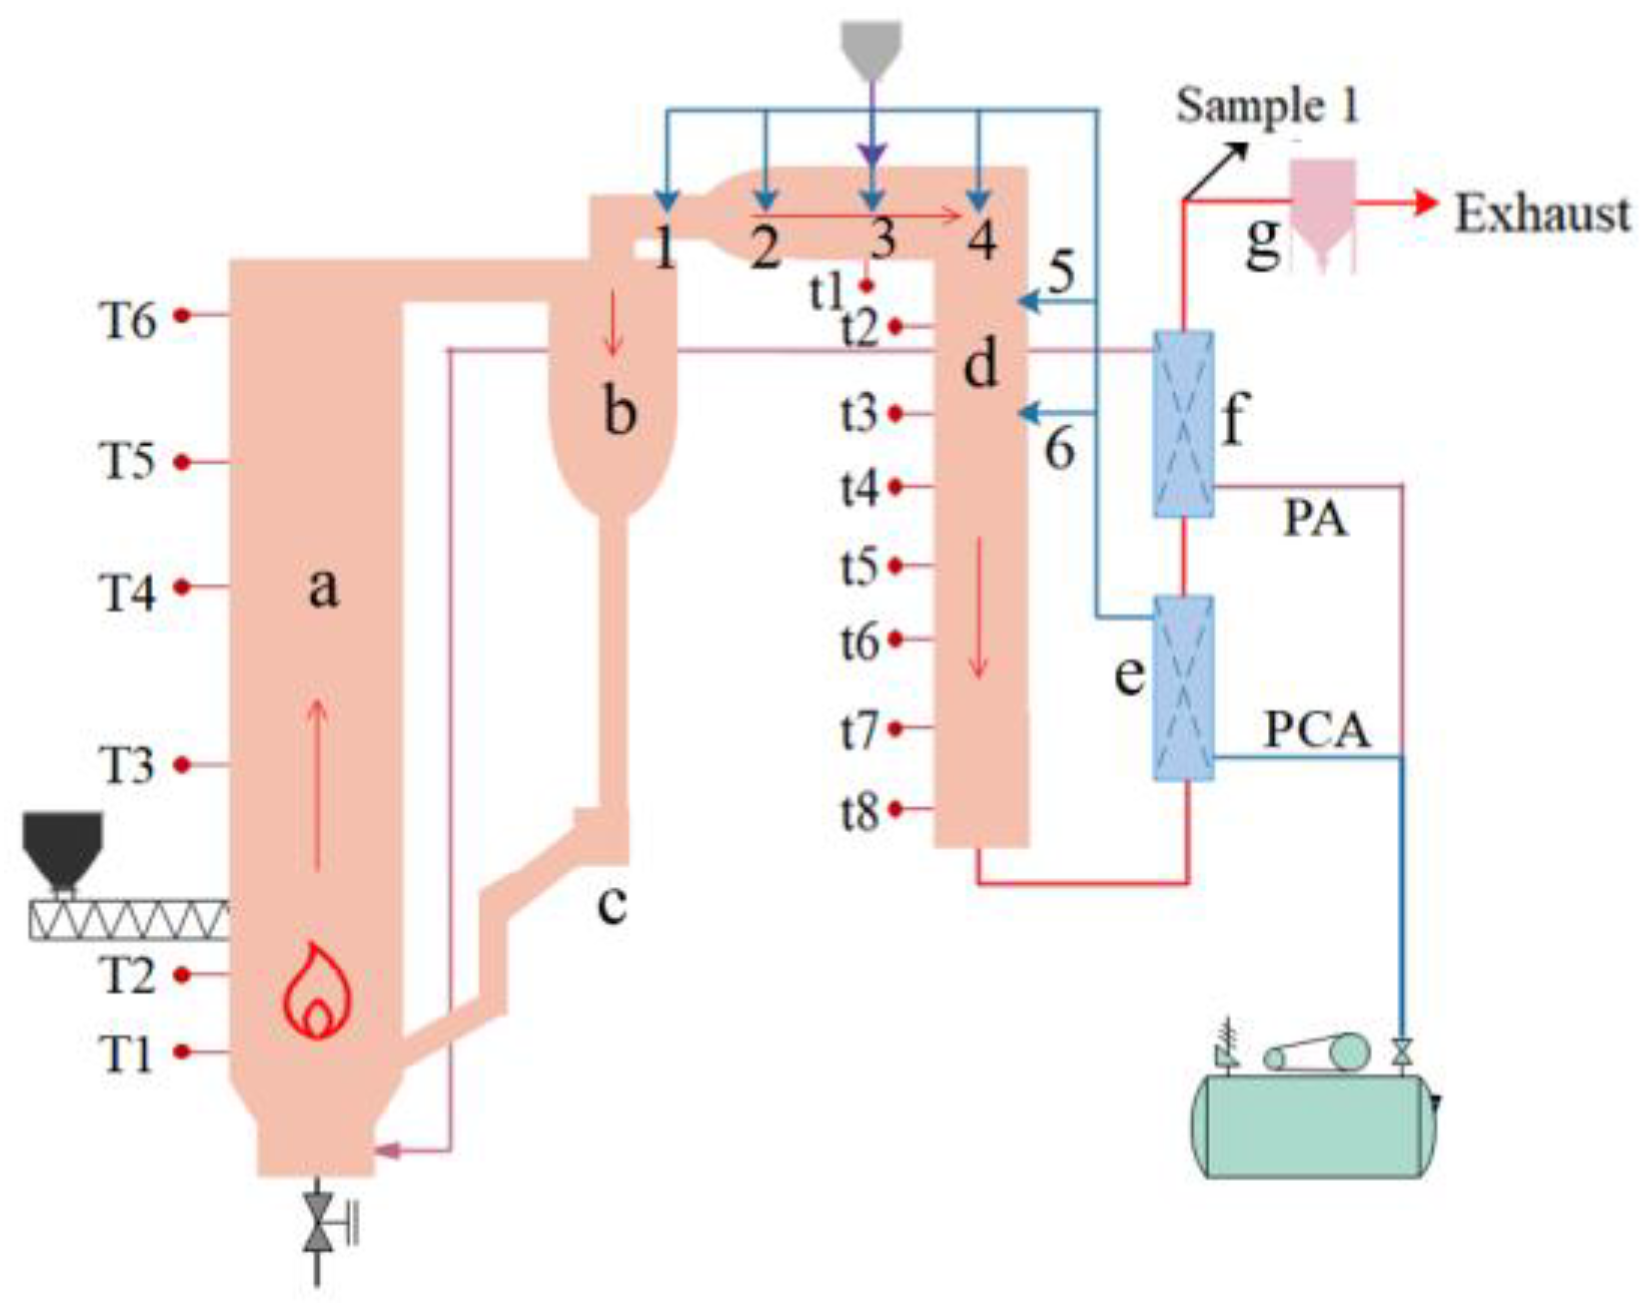
Figure 3.
Temperature distribution in CFB furnace and post-combustion chamber.
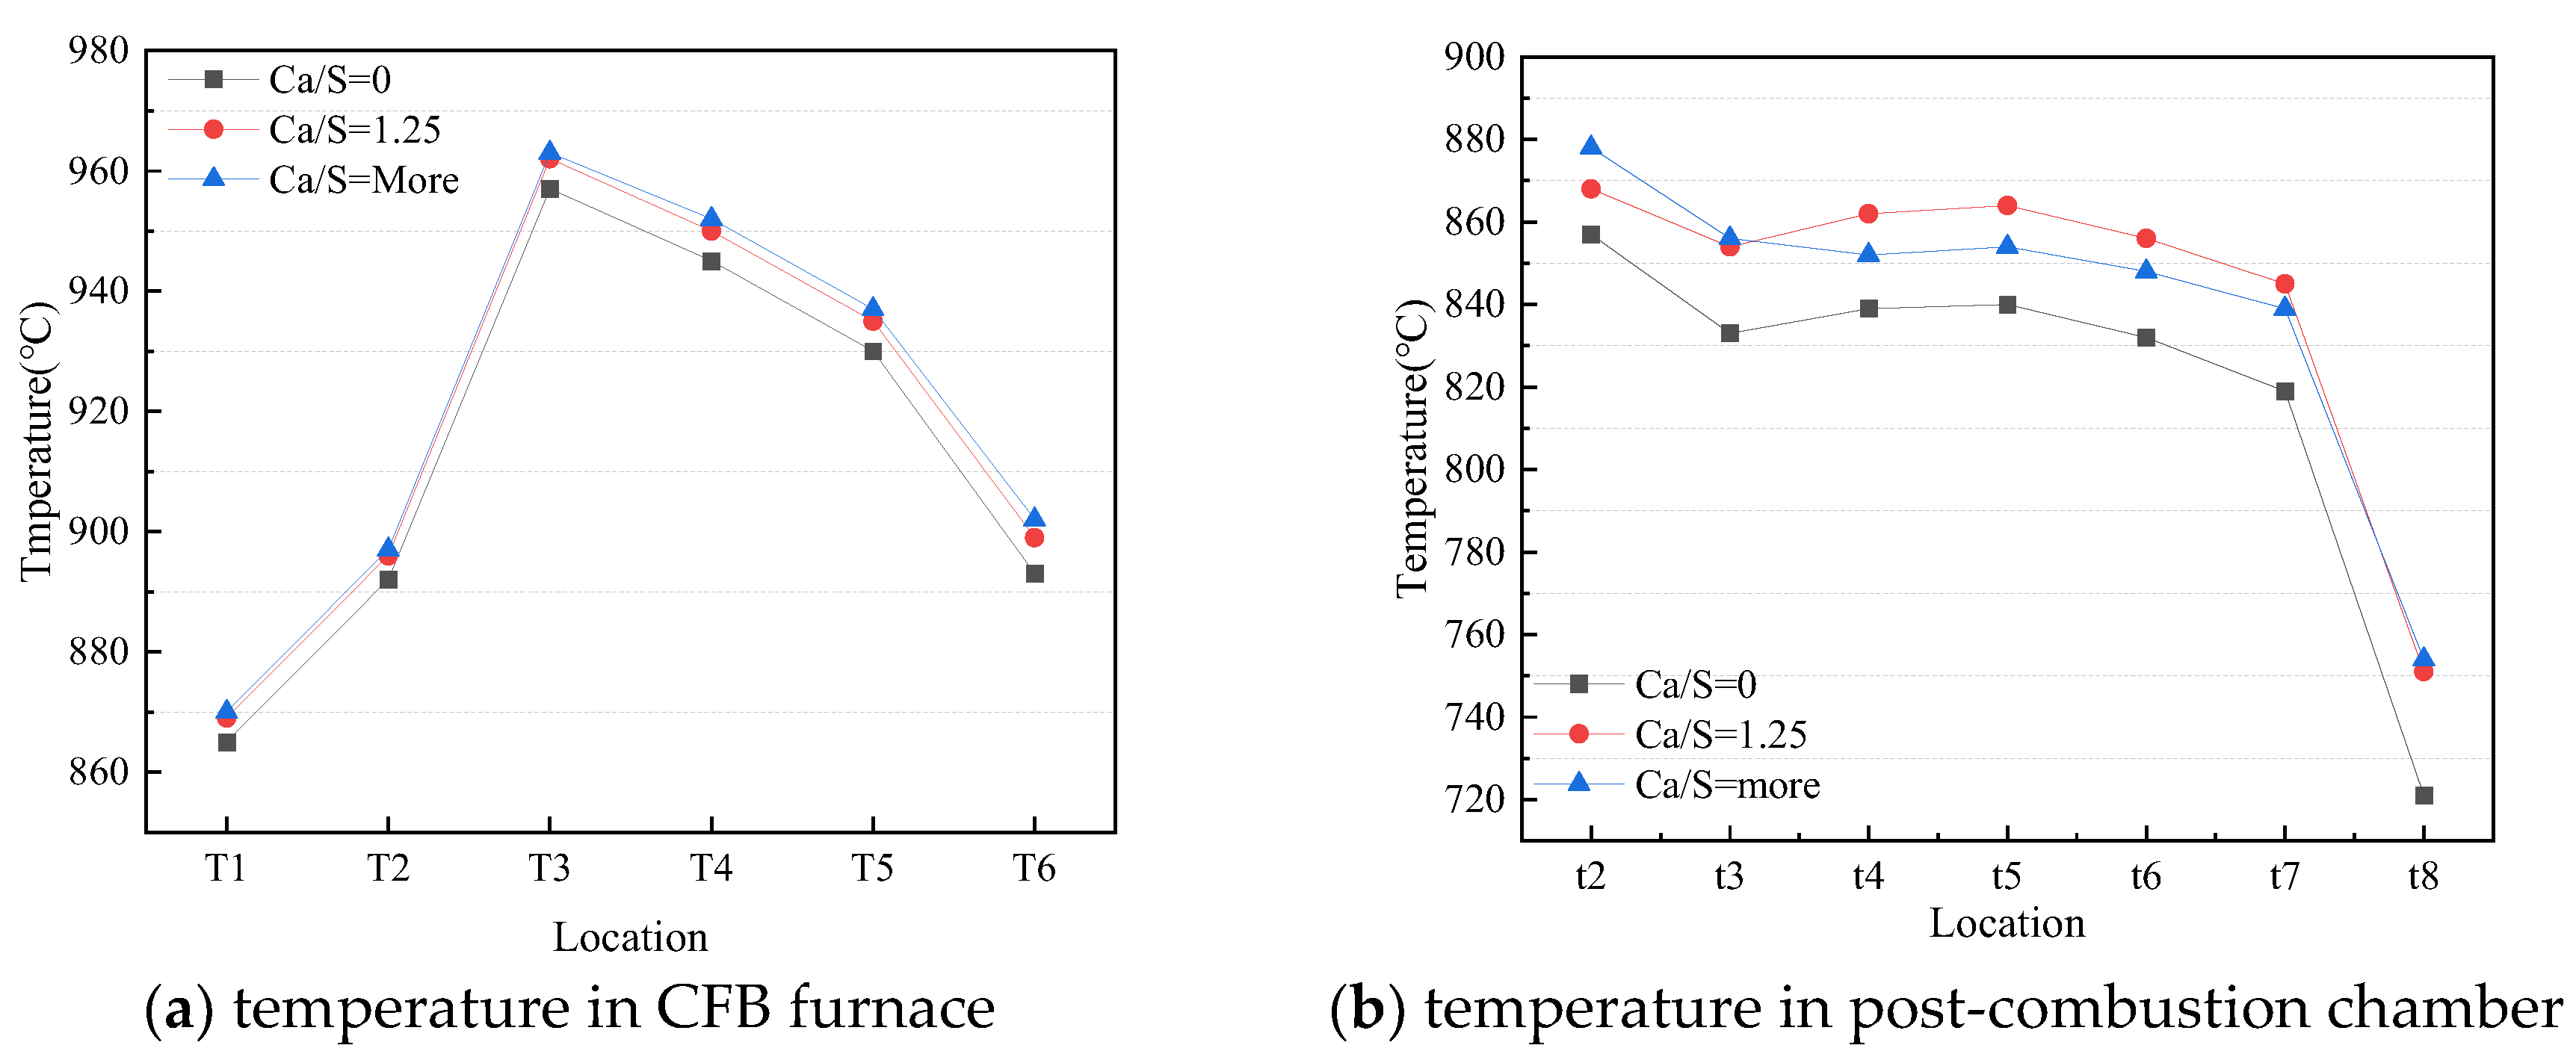
Figure 4.
NOx and SO2 emissions at different amount of sorbent addition.
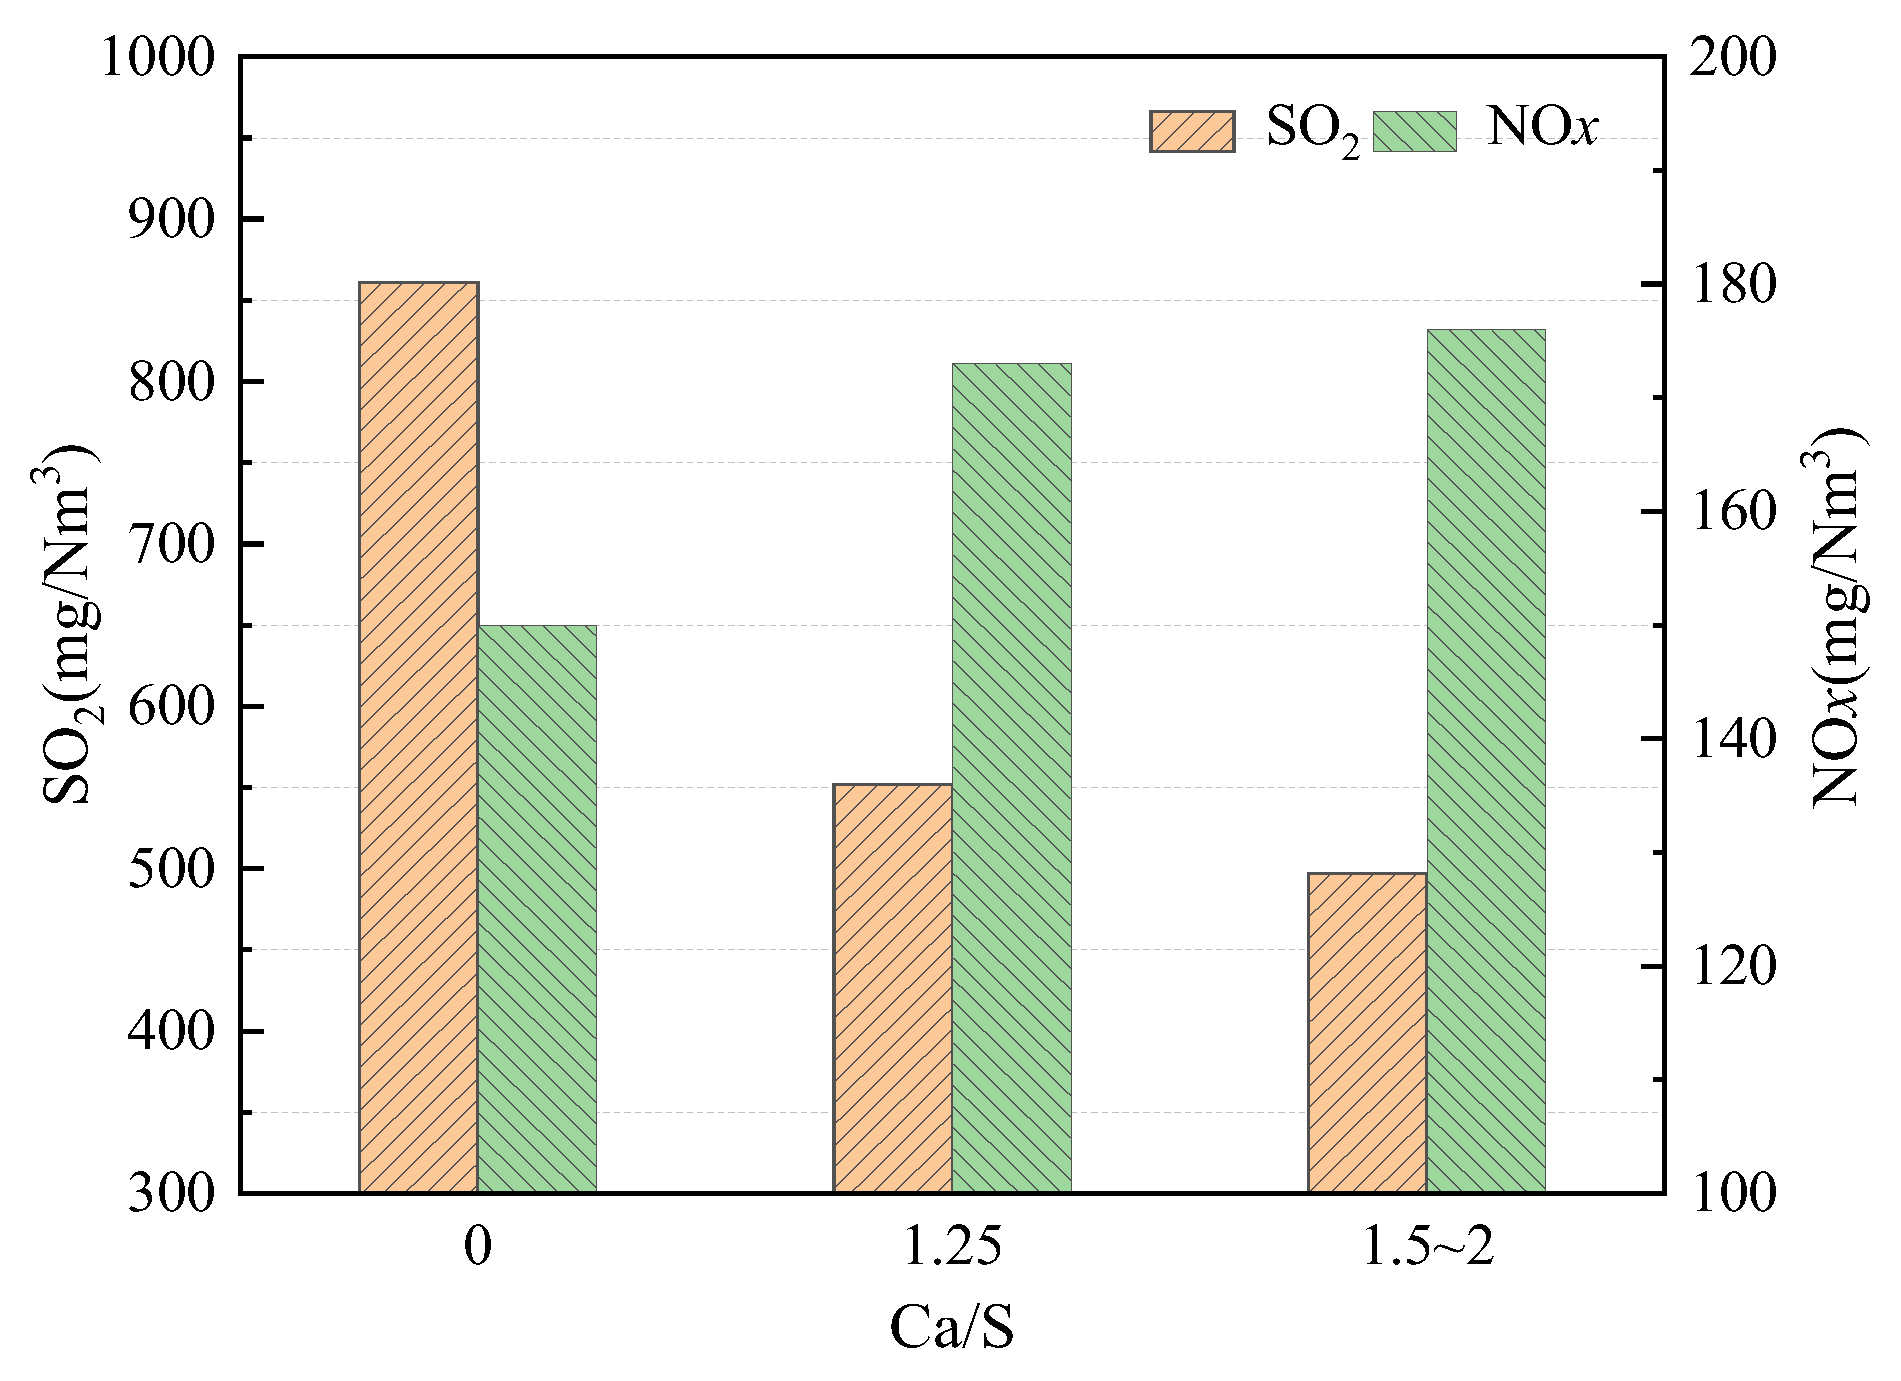
Figure 5.
Temperature distribution in post-combustion chamber.
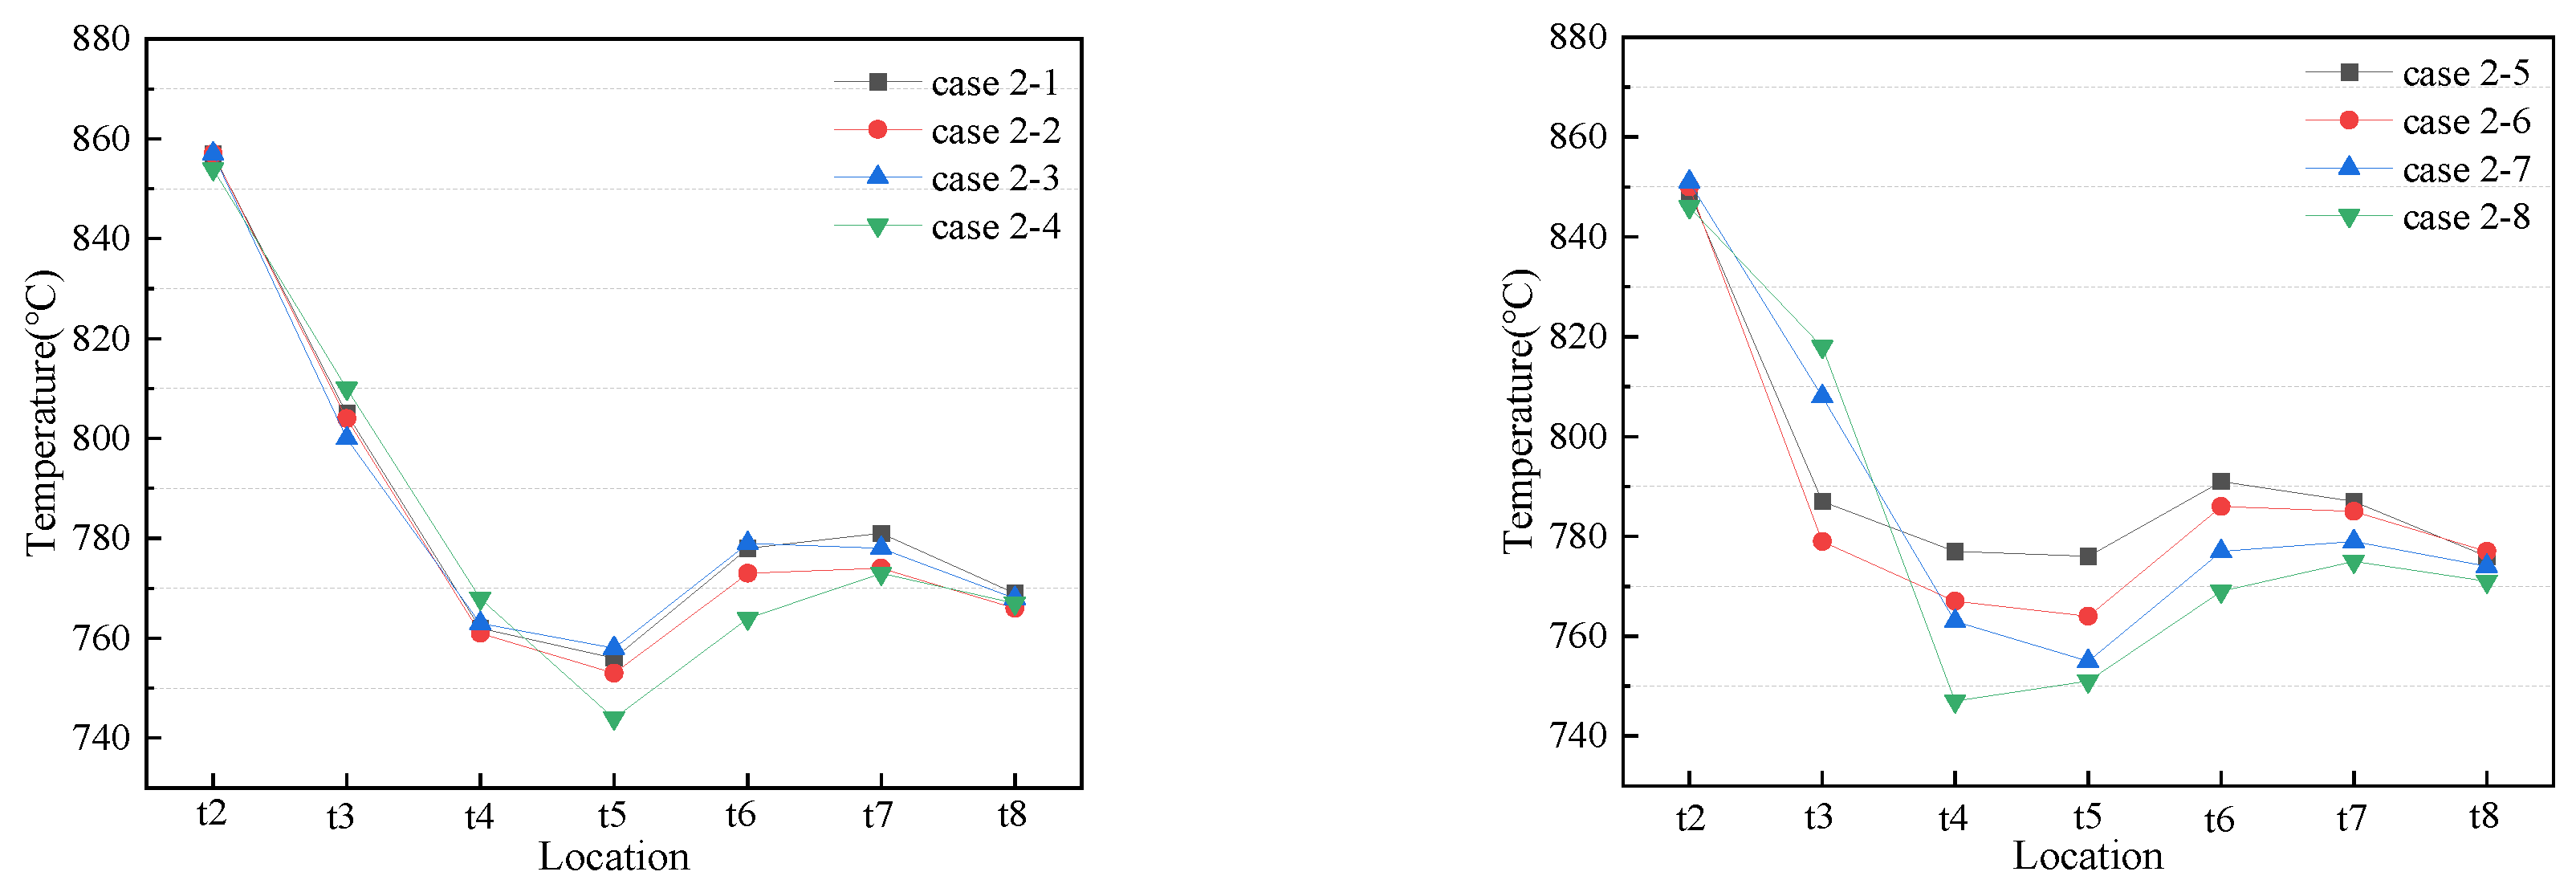

Figure 6.
NOx and SO2 emissions at different post-combustion air arrangement.
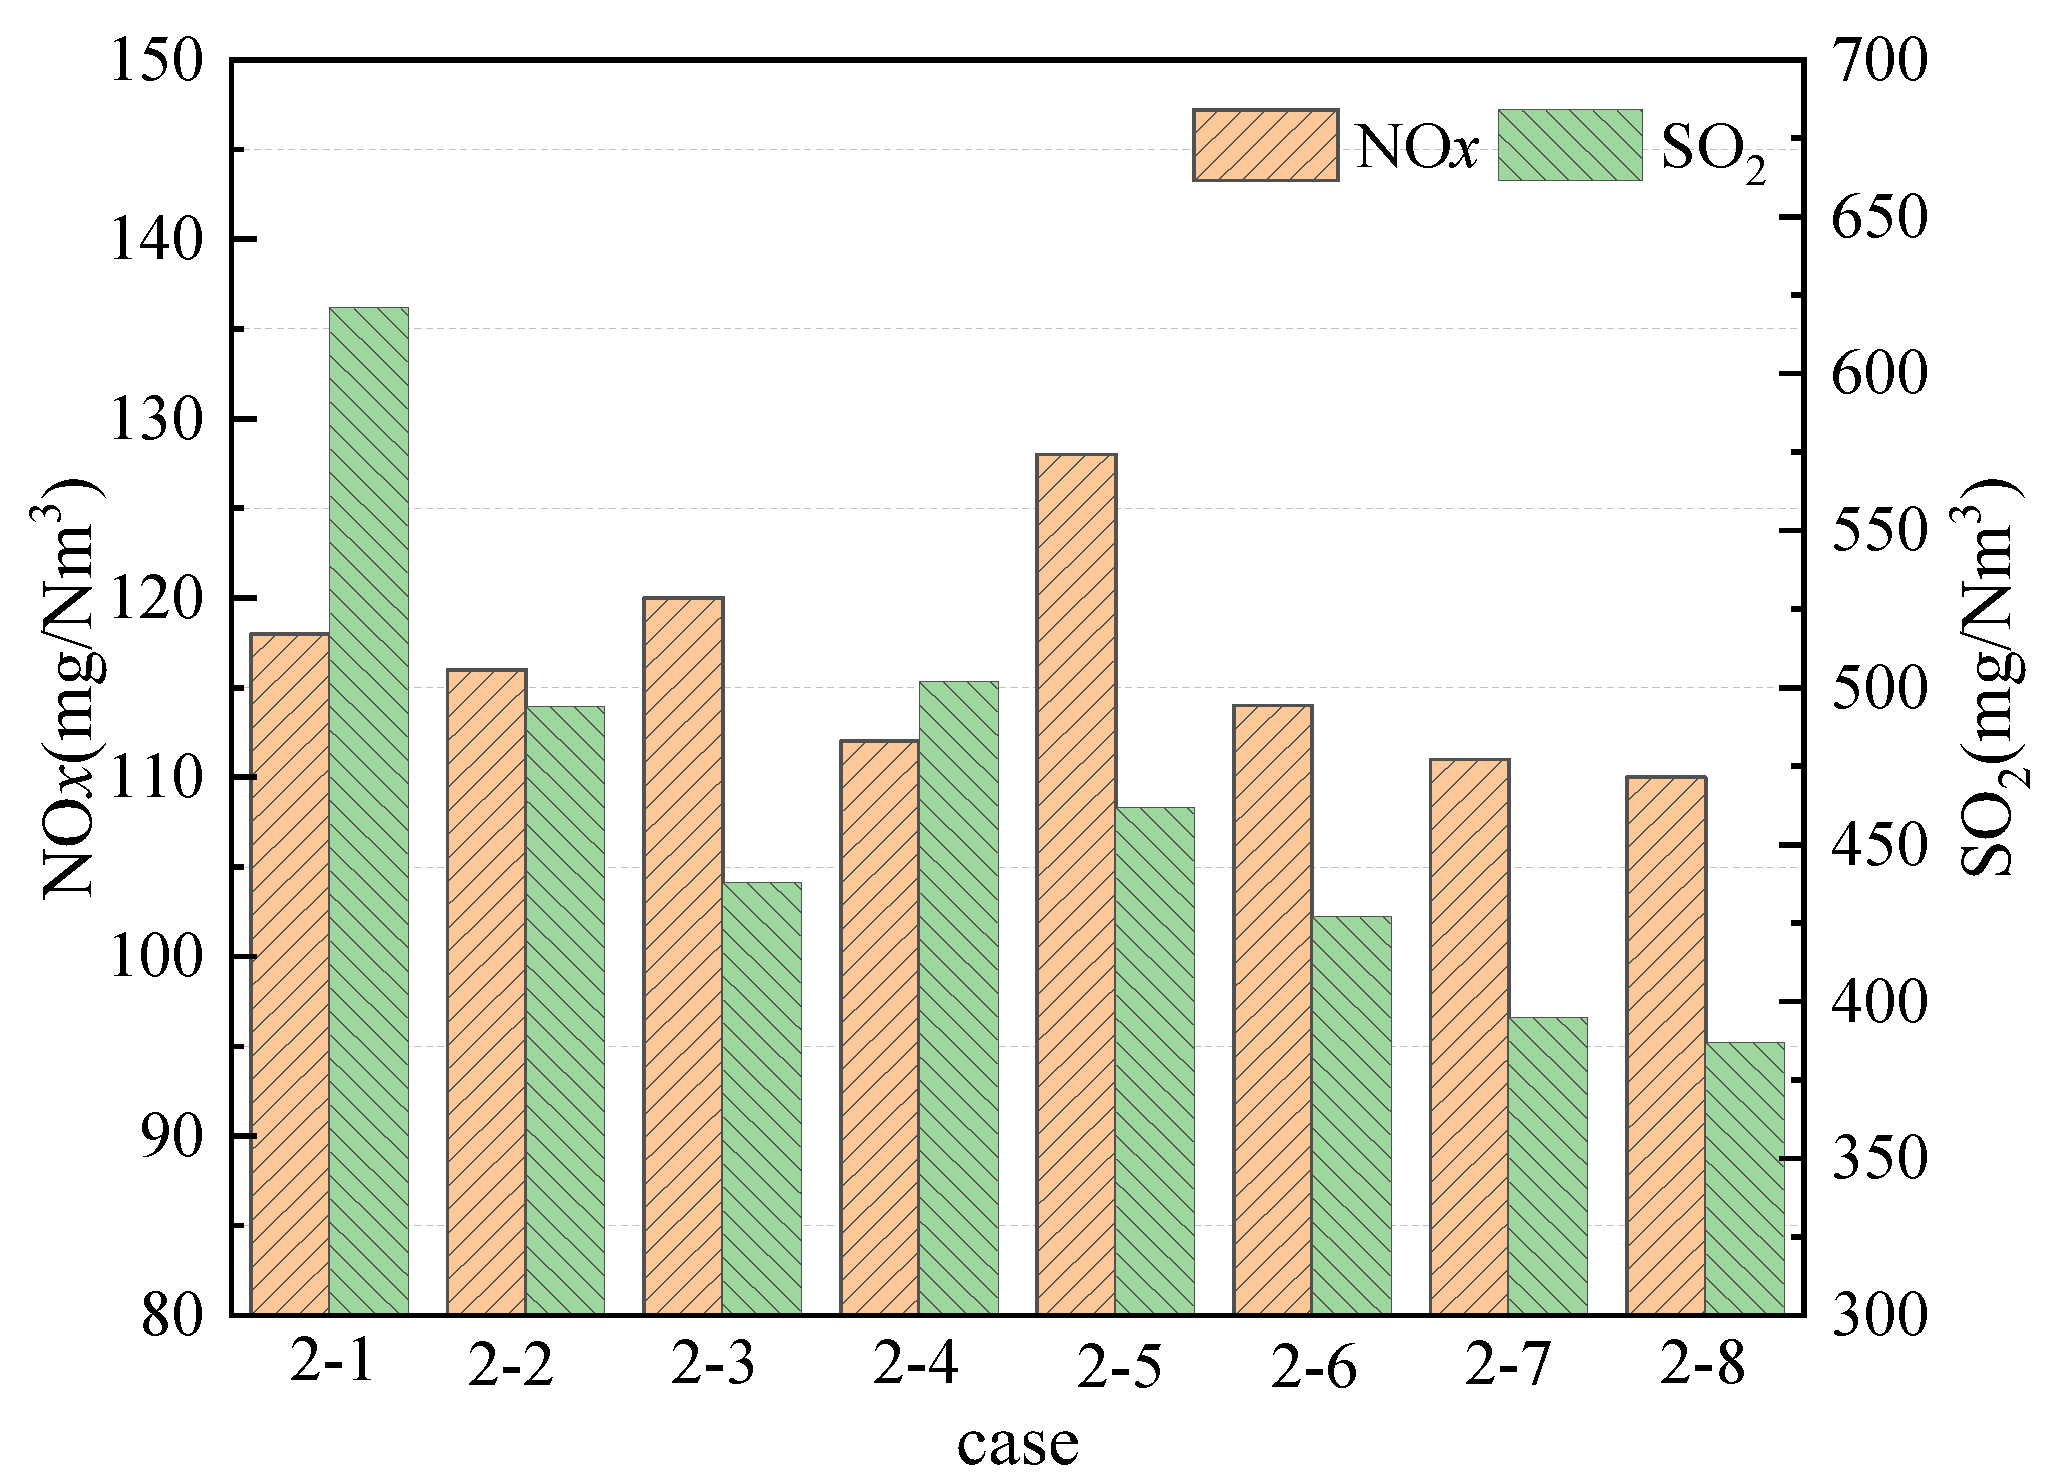
Figure 7.
Temperature distribution in CFB furnace and post-combustion chamber.
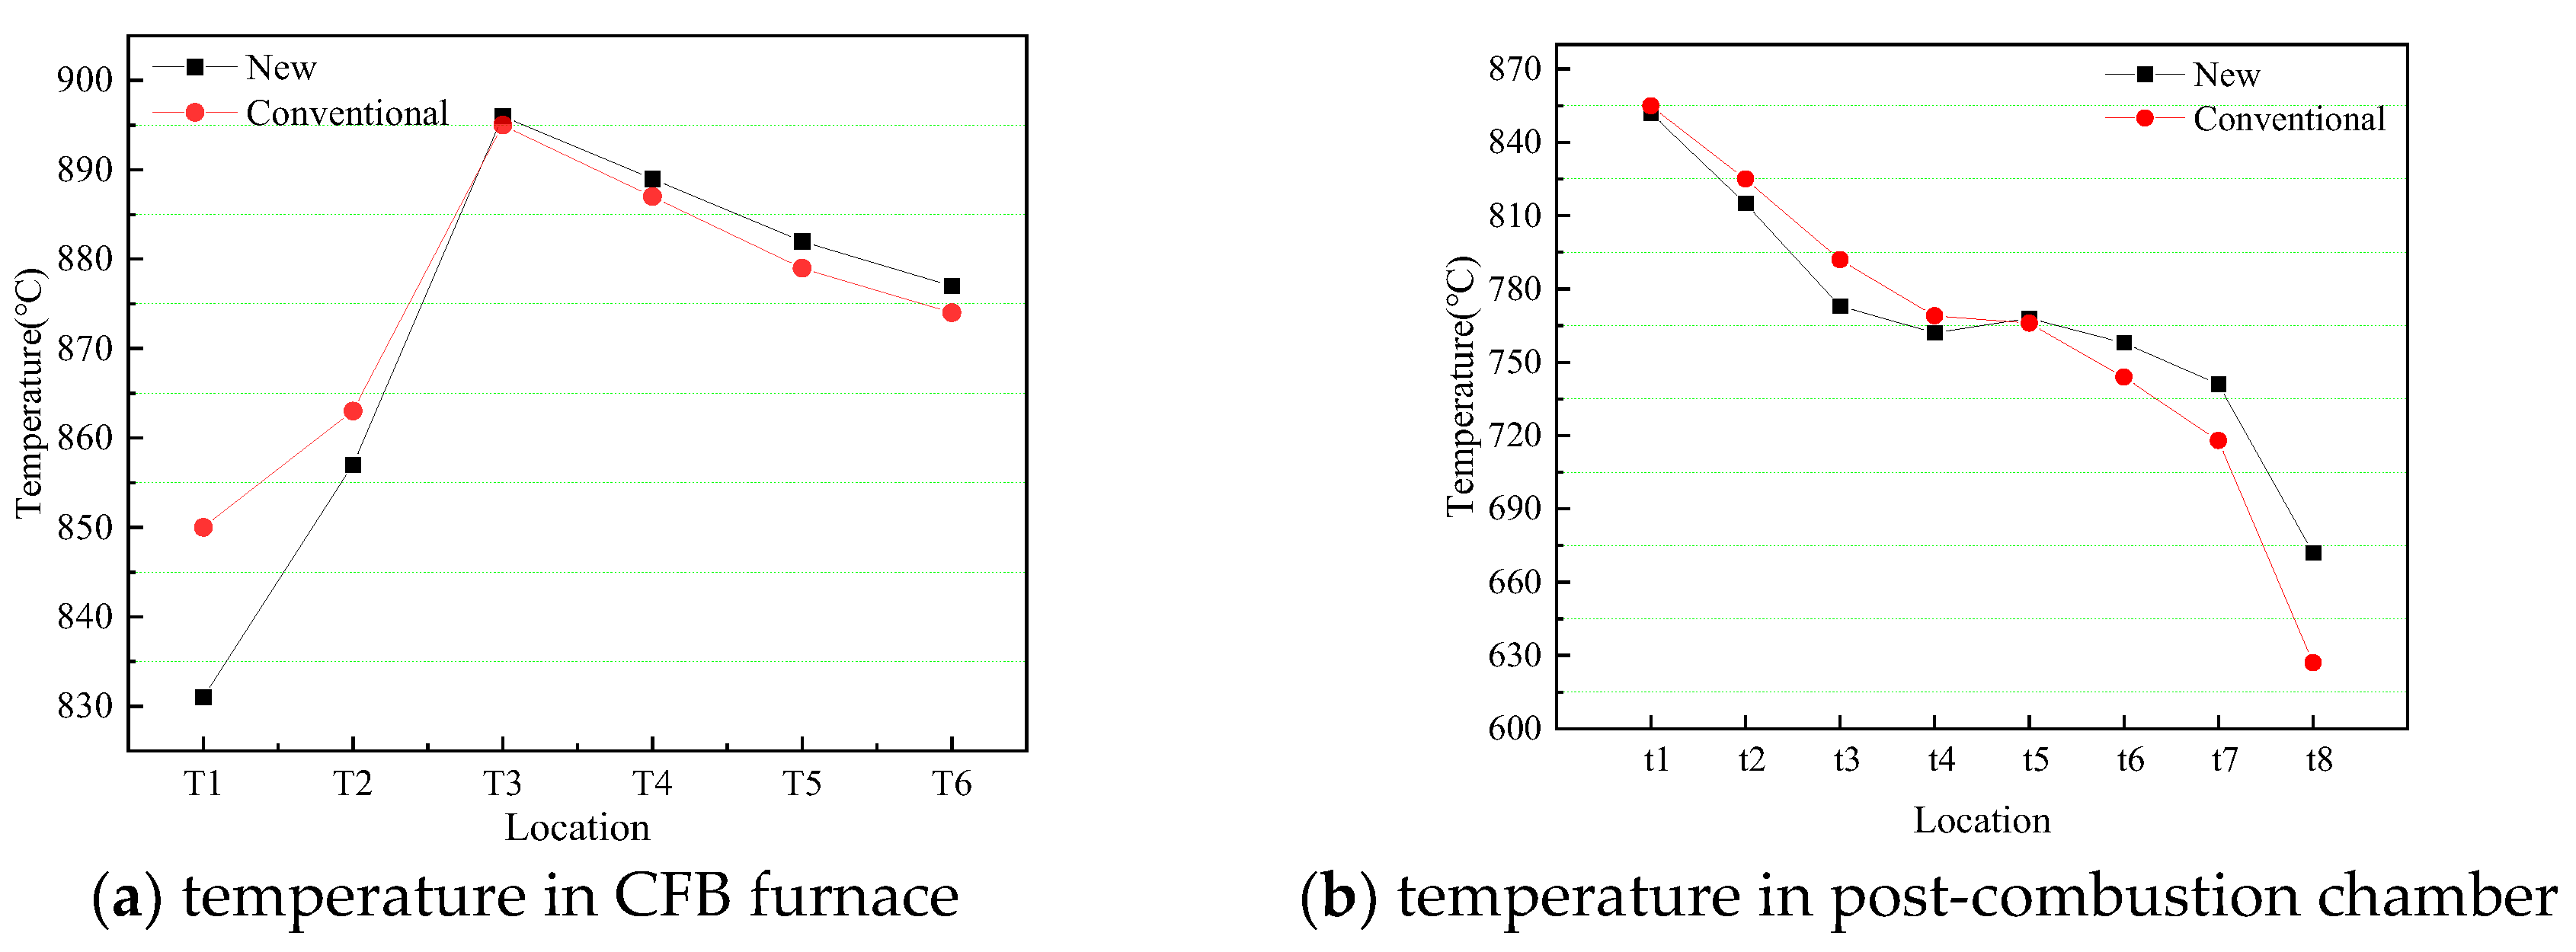
Figure 8.
Effects of temperature on NOx and SO2 under new combined removal approach and conventional combined removal approach.
Figure 8.
Effects of temperature on NOx and SO2 under new combined removal approach and conventional combined removal approach.
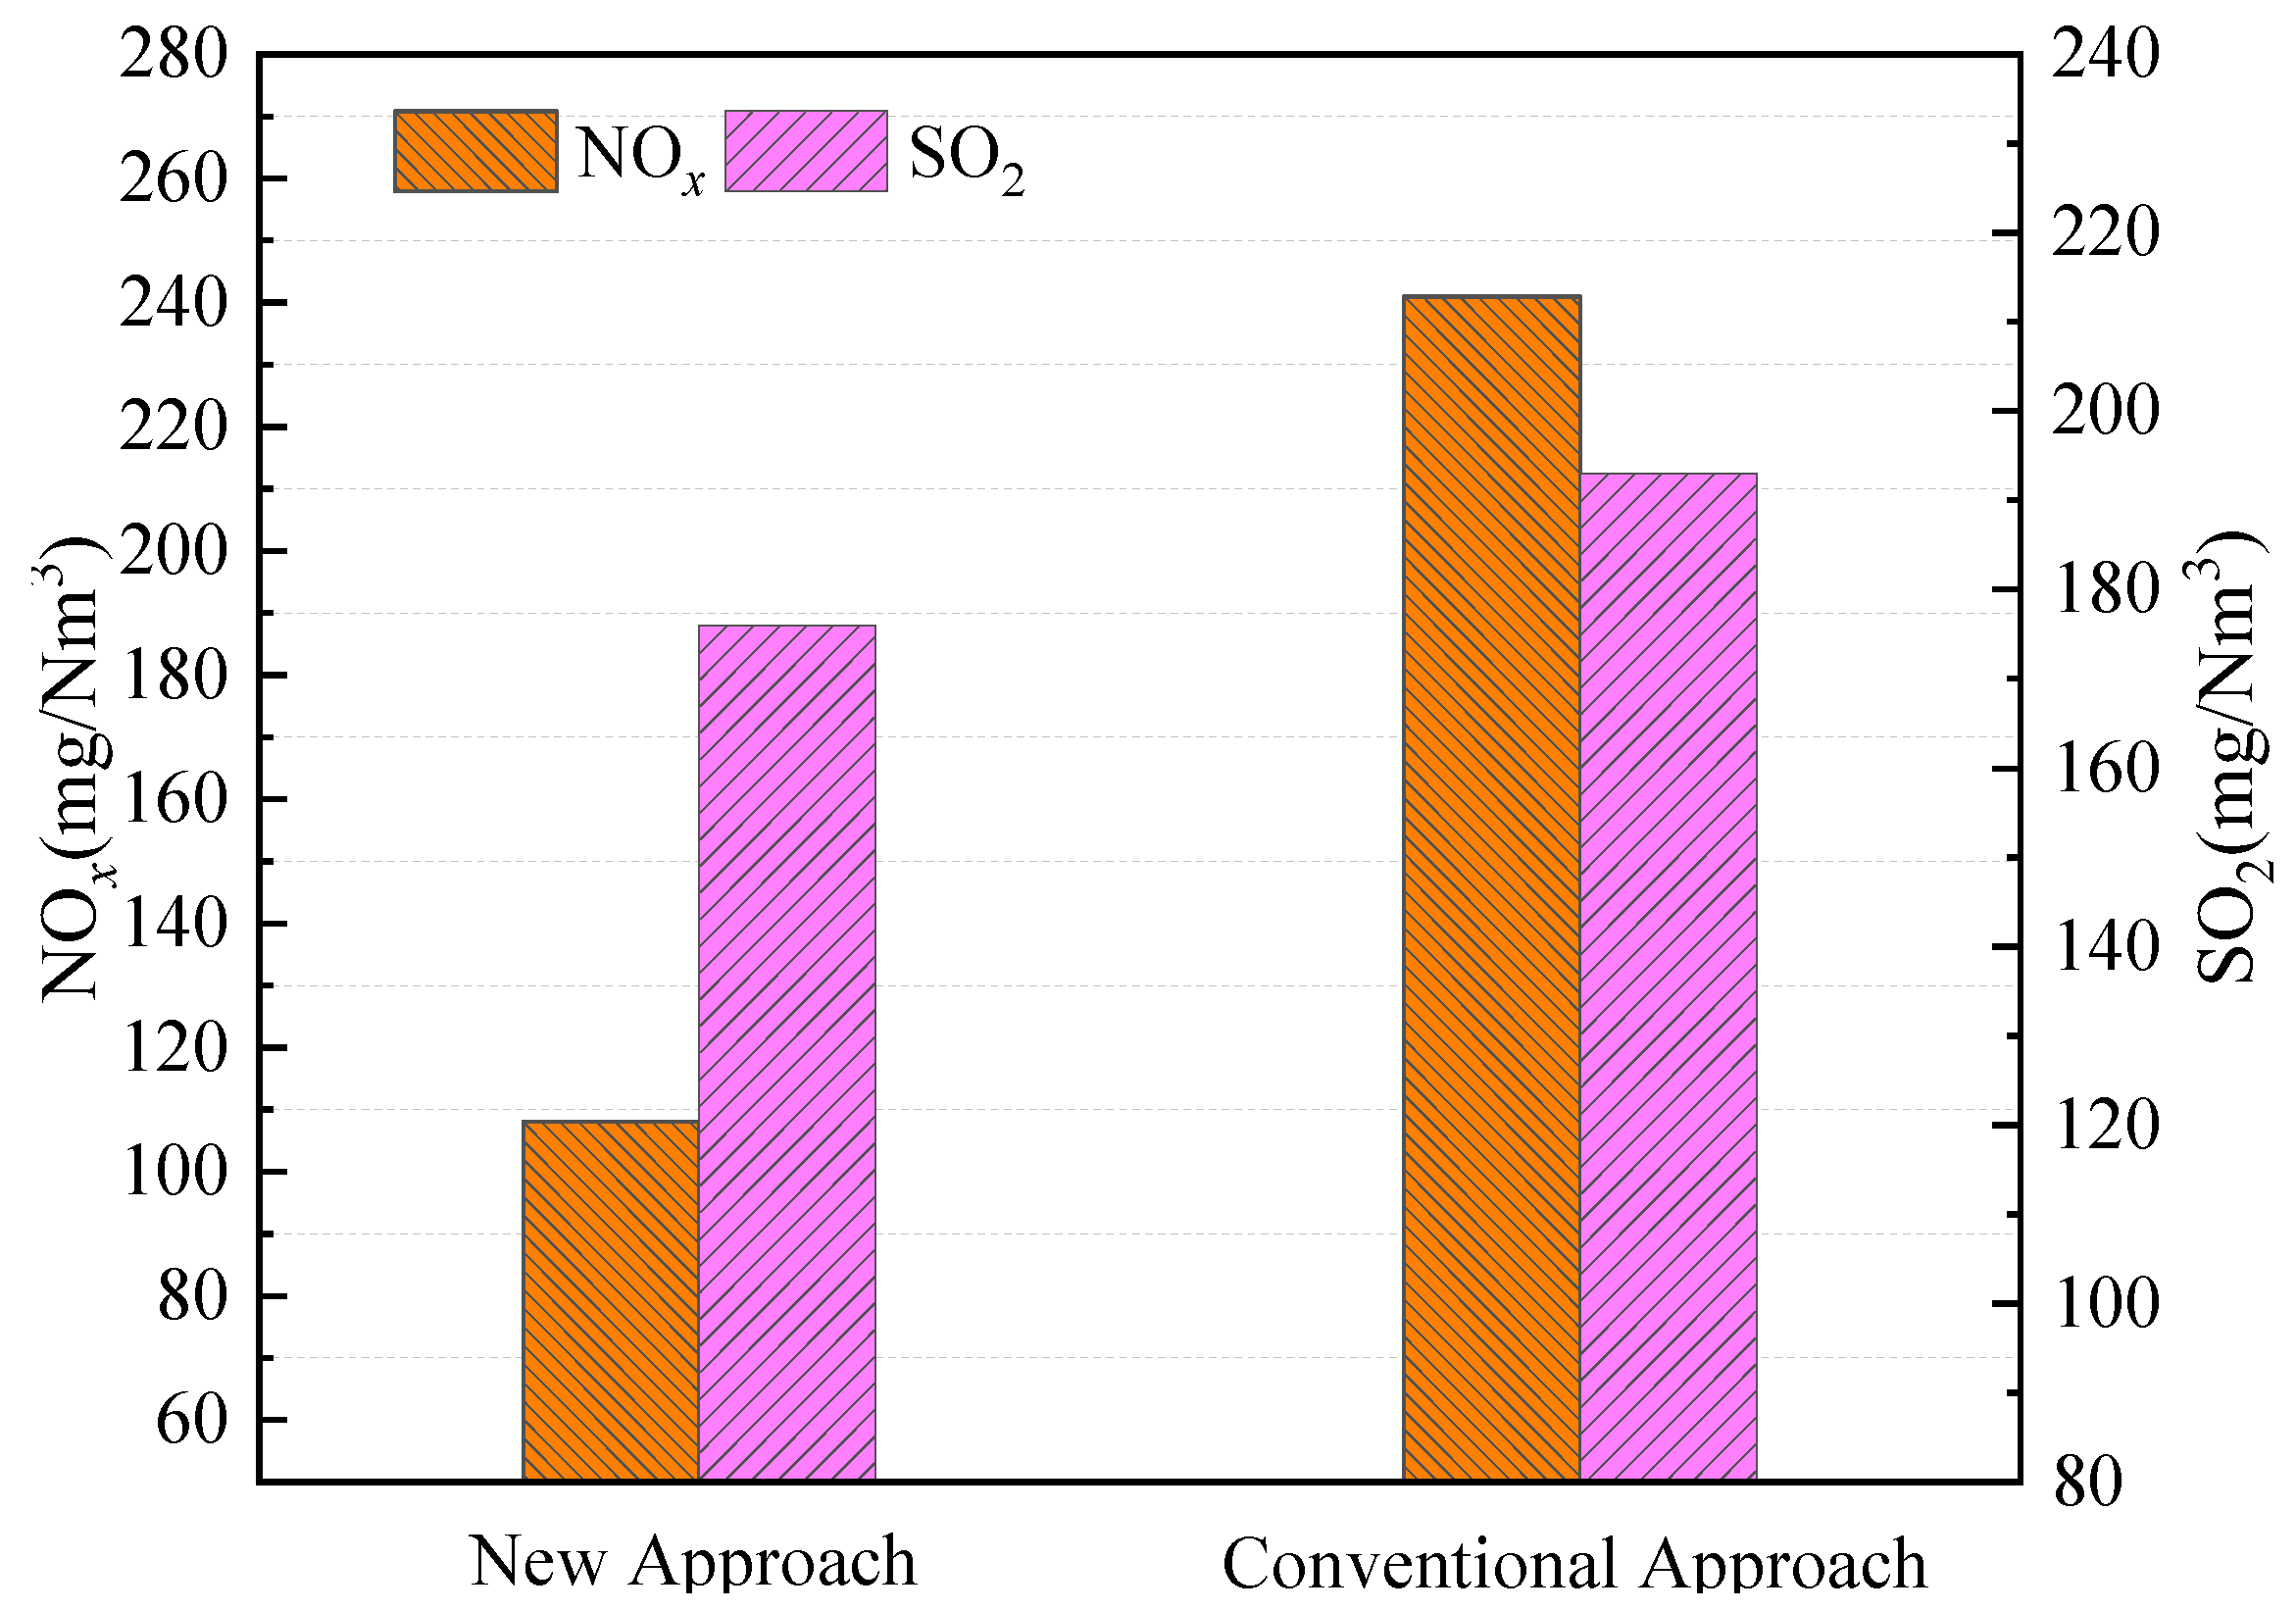

Table 1.
Proximate analysis and ultimate analysis [13].
Table 1.
Proximate analysis and ultimate analysis [13].
| Item | Proximate Analysis (wt %, ad) | Ultimate Analysis (wt %, ad) | Low Heating Value (MJ/kg) | |||||||
| Moisture | Ash |
VolatileMatter |
Fixed Carbon |
Carbon | Hydrogen | Nitrogen | Oxygen | Sulfur | ||
| Shenmu coal | 11.80 | 9.82 | 39.01 | 47.80 | 62.94 | 3.88 | 0.98 | 10.18 | 0.40 | 24.52 |
The “ad” indicates the abbreviation of “air dry basis”.
Table 2.
Limestone composition.
| Composition | CaO | MgO | SiO2 | Fe2O3 | Al2O3 | K2O | SrO | TiO2 | P2O5 | Cl | SO3 | CuO |
| Content (wt, %) | 52.79 | 3.13 | 1.21 | 0.71 | 0.41 | 0.09 | 0.07 | 0.07 | 0.02 | 0.01 | 0.01 | 0.01 |
Table 3.
Hydrated lime composition [14].
Table 3.
Hydrated lime composition [14].
| Composition | CaO | MgO | Fe2O3 | SiO2 | Al2O3 | SO3 | K2O | MnO | Cl | P2O5 | ZnO |
| Content (wt, %) | 74.10 | 0.96 | 0.39 | 0.38 | 0.19 | 0.06 | 0.04 | 0.03 | 0.02 | 0.01 | 0.01 |
Table 4.
Experimental condition.
| Case | T (°C) | FCa/S | PCa/S | Nozzles | λ | λCFB | Primary Air (m3/h) | Post-Combustion Air (m3/h) | Other Air(m3/h) | Feeding Coal (kg/h) |
| 1-1 | 950 | 1.25 | 0 | 1/4/5 | 1.15 | 0.9 | 29.4 | 9.78 | 6 | 6.24 |
| 1-2 | 950 | 1.25 | 1.25 | 1/4/5 | 1.15 | 0.9 | 29.4 | 9.78 | 6 | 6.24 |
| 1-3 | 950 | 1.25 | 1.5-2 | 1/4/5 | 1.15 | 0.9 | 29.4 | 9.78 | 6 | 6.24 |
| 2-1 | 900 | 1.25 | 1.25 | 1/4/5 | 1.15 | 0.9 | 27 | 9.12 | 6 | 5.94 |
| 2-2 | 900 | 1.25 | 1.25 | 2/4/5 | 1.15 | 0.9 | 27 | 9.12 | 6 | 5.94 |
| 2-3 | 900 | 1.25 | 1.25 | 3/4/5 | 1.15 | 0.9 | 27 | 9.12 | 6 | 5.94 |
| 2-4 | 900 | 1.25 | 1.25 | 4/5/6 | 1.15 | 0.9 | 27 | 9.12 | 6 | 5.94 |
| 2-5 | 900 | 1.25 | 1.25 | 1/2/3 | 1.15 | 0.9 | 27 | 9.12 | 6 | 5.94 |
| 2-6 | 900 | 1.25 | 1.25 | 1/2/4 | 1.15 | 0.9 | 27 | 9.12 | 6 | 5.94 |
| 2-7 | 900 | 1.25 | 1.25 | 1/2/5 | 1.15 | 0.9 | 27 | 9.12 | 6 | 5.94 |
| 2-8 | 900 | 1.25 | 1.25 | 1/2/6 | 1.15 | 0.9 | 27 | 9.12 | 6 | 5.94 |
| 3-1 | 900 | 2.5 | 1~1.5 | 1/2/5 | 1.15 | 0.9 | 27 | 9.12 | 6 | 5.94 |
| 3-2 | 900 | 2.5 | 0 | 1/2/5 | 1.15 | 1.15 | 27 | 0 | 6 | 5.94 |
Notes: “T” is the highest temperature in the furnace; other air include returning air and carrying coal air; FCa/S and PCa/S indicates the amount of sorbent addition in CFB furnace and post-combustion chamber. The sorbent at case1-1~1-3 and case 2-1~2-8 is limestone; the sorbent at case 3-1and 3-2 is hydrated lime.
Disclaimer/Publisher’s Note: The statements, opinions and data contained in all publications are solely those of the individual author(s) and contributor(s) and not of MDPI and/or the editor(s). MDPI and/or the editor(s) disclaim responsibility for any injury to people or property resulting from any ideas, methods, instructions or products referred to in the content. |
© 2025 by the authors. Licensee MDPI, Basel, Switzerland. This article is an open access article distributed under the terms and conditions of the Creative Commons Attribution (CC BY) license (http://creativecommons.org/licenses/by/4.0/).
Copyright: This open access article is published under a Creative Commons CC BY 4.0 license, which permit the free download, distribution, and reuse, provided that the author and preprint are cited in any reuse.


