Submitted:
21 May 2025
Posted:
22 May 2025
You are already at the latest version
Abstract
This paper proposes a novel XRD analysis method for precisely orienting the [111] axis of large-size calcium fluoride (CaF2) single crystal lenses. By leveraging the geometric characteristics of the [111] axis, we first define the X, Y, Z axes and the tilting angles (ф, ω, θ). The outgoing X-ray is leveled in the XOZ diffraction plane to maximize photon intensity at 0°. Subsequently, ω/2θ and Ф scans are performed to align the [111] axis within the diffraction plane. To address the limitations of direct XRD on the [111] axis, higher-order crystal planes are scanned, ensuring compliance with diffrac-tion geometry requirements. The feasibility of the method is validated through XRD pattern analysis, achieving precise orientation of the [111] axis with an accuracy of 0.1°. This approach offers a cost-effective and efficient solution for the orientation of large-size single crystal lenses, with po-tential applications in deep ultraviolet excimer laser lithography.
Keywords:
large-size CaF2 single crystal
; [111] crystal orientation
; X-ray diffraction (XRD)
; precise orientation
; higher-order crystal planes
1. Introduction
With the development of deep ultraviolet excimer laser lithography, the available light source wavelengths of have been extended from 193 nm to 157 nm. However, the transmittance of quartz glass, a key optical element in lithography machines, significantly decreases at wavelengths below 200 nm. Additionally, the increasing power of lasers raises the damage threshold of optical windows. Calcium fluoride (CaF2) has emerged as a superior alternative due to its wide light transmittance range (0.125 µm to 12 µm), excellent ultraviolet transmittance, high laser damage resistance, low stress birefringence, and low refractive index[1,2,3,4]. These properties make CaF2 an ideal material for optical lenses in deep ultraviolet lithography. In 2001, the National Institute of Standards and Technology (NIST) revealed experimentally and theoretically that for wavelength λ <200nm, CaF2 crystals exhibit distinct intrinsic birefringence, which is equal to 0 in the [100], [010], [001] and [111] directions[5,11]. The transmittance and damage resistance threshold are highest when the laser travels along the [111] axis[5,6,7]. Therefore when the CaF2 crystal is used to make optical lens, [111] is generally used, when the light deviates from CaF2,the magnitude of the temporal birefringent index of the crystal [111] increases rapidly[12,13,14,15,16]. Oblique cutting can be adopted to make the angle between the [111] axis and the lens normal equal to the angle of the laser incident, so as to ensure the laser incident along the [111] axis, achieving a high damage resistance threshold, and the effect of birefringence is equal to 0. When using CaF2 single-crystal lens element in the design of optical path, it becomes particularly important to find the exact location of the [111].
The orientation of CaF₂ single crystals is typically determined using the following methods: Laue back-reflection method[7], 2)Single-crystal orienter technique[11],3) Laue orientation system[12],4)X-ray diffraction crystal orientation analysis[13],5)Intelligent Laue alignment approach[12],6)XRD butterfly pattern analysis[14]. Among them, Laue orientation method requires continuous X-ray light source, and two-dimensional X detector, which not only needs complex calculation, but is also time-consuming. The intelligent Laue method is an upgrade of the calculation program of the Laue photographic method. Although the operation is simple, the complex instrument requires high accuracy, and the accuracy of the diffractometer method can only reach 0.5°. Single crystal orientation method is generally suitable for large size single crystal with regular shape, and different analysis methods are suitable for different single crystal shapes. XRD butterfly diagram method is a rotational orientation method proposed by the Analysis and Testing Center of Northwest University in 2002. It is also a simple single crystal orientation method. Many single crystal orientations are based on this method, but the above method is only suitable for [111] crystal direction, which is not convenient to operate, time-consuming, a great amount of measurement data, needing to determine Ф first, which is not suitable for simple, fast and accurate orientation. In this paper, we propose a new method to rotate CaF2 by leveling first, and then fixing θ/2θ and rotating Ф, letting the crystal [111] axis enter the diffraction plane, Ф was fixed for ω/2θ scan; for ω at the peak position, and fixing ω to perform Ф scan until ω and Ф do not change, where the angle of CaF2 [111] to be measured is arrived.
The accuracy of this method can reach 0.1° compared with other methods, less time-consuming, can simultaneously direct ω, Ф, not easy to misdetermine, with less scanning, fast orientation, and low cost, which only needs to add a three-dimensional rotating table to the X-ray (X-ray diffraction equipment (Rigaku Smartlab, Cu-Kα at 50kV-300mA) with beam through, and PDF card no. 00-012-0248 (CaF2, cubic). Moreover, even if the ω/2θ scan is performed, the angle of the incident X-ray is less than that between the crystal surface and the sample surface. Beyond the test range, the diffraction angle of the higher index crystal surface can still be used to conduct θ/2θ scanning by selecting 47.11°, corresponding to the selected (333) crystal surface, to achieve the purpose of testing.
2. Results and discussion
The large-size CaF2 single crystal lens used in this study has a diameter of 300 mm and a thickness of 10 mm, with an angle of 35.26°±1°. The experiments were conducted in two modes: PB (parallel beam) mode and BB (Bragg-Brentano) mode. In PB mode, a multilayer film mirror was used with the following parameters: outgoing slit of 0.2 mm, anti-scatter slit of 0.6 mm, receiving slit of 0.2 mm, and a light source power of 40 kV at 40 mA. In BB mode, the same slit settings were used, but without the multilayer film reflector.
2.1. Definition of tilt and CaF2[110] and [111] crystal direction
CaF2 crystal is a cubic crystal, by definition of reciprocal space, the direction is always perpendicular to the plane, a universal relationship valid for all crystal systems (triclinic, monoclinic, orthorhombic, tetragonal, trigonal, hexagonal and cubic. CaF₂ single crystals were supplied by Beijing Keyi Hongyuan Co., Ltd using Modified Bridgman-Stockbarger Method
Due to the effect of symmetry extinction, CaF2 crystal only has diffraction peak corresponding to the (220) crystal surface without the corresponding (110) direction peak. In order to facilitate the elaboration of the direction and Angle between different crystal surfaces, it is necessary to define the single crystal lens rotation and rotation axis. First of all, the Cartesian coordinate system is used to determine the direction of the single crystal lens. As shown in Figure 1, Figure 1(a) X-ray alignment configuration with a blank substrate, showing rotations ω (X-axis), χ (Y-axis), and φ (Z-axis). Figure 2(b) Optical laser deflection setup with a plano-convex lens, illustrating beam deflection via crystal lattice interaction. Tilt angles ω (X-axis), χ (Y-axis), and φ (Z-axis) are defined for optical alignment. Axes X, Y, Z are labeled in both subfigures.
the central axis normal on the lens surface is the Z axis, the arrow in the lens marking the central line is the X axis direction, and the direction perpendicular to the X and Z axis is the Y axis direction. The reason for this marking is that in practical use, the laser enters the lens surface at a certain angle in the XZ plane, during the X-ray diffraction test, the X-ray also enters the lens surface at a specific angle inside the XZ plane.
It is worth noting that if the lens rotates, the ω and χ axes of the instrument are unchanged in the X-ray diffraction, because the diffraction plane is in the XOZ plane and the sum axis of the sample changes accordingly, which is because the crystal surface normal is following the Ф rotation. Therefore, attention should be paid to the axis of the diffractometer or the axis of the sample.
Figure 2 shows the single crystal lens, all CaF₂ crystals were cut with[111] as surface normal (Z-axis), with [220] (equivalent to [110]) as the primary axis. The [220] crystal direction is perpendicular to the sample surface, the angle between [111] and [110] is 35.26° (Note: [220] is the second harmonic of [110]).
Since the angle between the single crystal [111] and [220] of CaF2 is 35.26°, to achieve the angle between the [111] crystal direction and the mirror normal reaches the set value of 35.26 °± 1°, the CaF2 single crystal was cut 1° along the (220) crystal surface, cutting into one of the [111] axes and the mirror normal at 35.26°, and the Ф direction was determined as "↑". And in the process of cutting, it is difficult to accurately cut along the specified direction, that is to say, there is error in the cutting, accurate orientation is needed at this stage.
For the verification of the CaF2 and the cutting effect of the single crystal lens, X-ray diffraction is needed to determine the accuracy of the calibration "↑" position Ф, and CaF2[111], and the precise angle between the crystal direction and the mirror normal. Its principle is, when a beam of monochromatic X-ray is incident to crystal, as the crystal is composed of regular arrangement atoms, the atomic distance and the incident X-ray wavelength has the same order of magnitude, so it is easy to satisfy the x-ray interference, for diffraction in some special direction orientation.
As shown in Figure 3, the angle between the lens blank surface and the (111) crystallographic plane (theoretical value: 35.26°) is equivalent to the angle between the crystal orientation and the normal vector of [111]. To ensure ω > 0° and prevent X-ray blockage, the θ angle must satisfy θ > 35.26°. According to the PDF card of CaF₂ (00-012-0248), the (111) plane corresponds to a diffraction peak at 2θ = 28.27°, meaning the angle between the incident X-ray and the crystal plane is 14.13° (= 28.27°/2). Since this value is below the critical angle of 35.26°, the (111) diffraction peak cannot be used to determine the [111] crystal direction.
Therefore, we turn to the analysis of higher-index planes: While the (333) plane's diffraction angle 2θ = 47.11° corresponds to θ = 23.56° (still <35.26°), the cumulative diffraction effect (nλ=2d sinθ) yields an effective diffraction angle: θeff = arcsin(3λ/2d₃₃₃) = 47.11° > 35.26°.Geometrically, this allows us to determine the equivalent [111] direction via the [333] direction (in cubic crystal systems, [333] ≡ [111]).
The diffraction peak corresponding to the (333) is required to test the position of the [111] crystal. The angle between the incident X-ray and the crystal surface of an ideal system without skew is 47.11°, and the Angle with the sample plane is 11.85°; the angle between the reflected X-ray and the crystal plane is 47.11°. First, put the CaF2 lens to be tested on the Smartlab 3D rotating table, and then conduct leveling, which ensures that the maximum number of the outgoing X-ray photon is in the leveling position.

Table 1.
Calcium fluoride XRD card information.
| NO. | 2-Theta | (hkl ) |
| 1 | 28.266 | [111] |
| 2 | 32.760 | [200] |
| 3 | 47.004 | [220] |
| 4 | 55.763 | [311] |
| 5 | 58.457 | [222] |
| 6 | 68.672 | [400] |
| 7 | 75.848 | [331] |
| 8 | 78.181 | [420] |
| 9 | 87.370 | [422] |
| 10 | 94.214 | [333] |
For the CaF2 to be tested, the above characteristics of the single crystal lens are adopted to determin the lens [111] crystal axis calibration as the "↑" position. The detail of this method is shown in Figure 4. Since the [111] crystal direction passes through the diffraction plane of the XOZ during Ф scanning, at the 2θ position it can detect the diffraction line within the (111) plane. Although initially the ω/2θ is fixed according to the true value corresponding to the [111] axis without oblique cutting, since the X ray has a width, parts of the X-ray light that is not at the maximum light intensity can still satisfy the Bragg diffraction condition, the detector can still receive diffracted light, satisfying the crystal surface to inspection (111). However, not the strongest part of the X-ray light source corresponds to the diffraction light path of the crystal surface to be inspected (111). Therefore, it is not possible to determine the ω and Ф corresponding to the [111] axis. In addition, because the position of [111] crystal is determined by ω and Ф, we set a fixed ω, to find the Ф corresponding to the maximum light intensity, and then determine ω for fixed Ф; and finally satisfy the diffraction equation of the crystal surface of the (111) at the strongest outgoing X-ray direction, and obtaining the Ф and ω of the [111] crystal axis.
From the above idea, we designed the following method. First, check the CaF2 single crystal calibration, "↑" is directed at the X axis direction of the 3D rotating table, and calibrate the lens, letting the reflected light θ/2θ at 0.00°/0.00° and the direct through light at 0.25°/05° to ensure that the sample surface is parallel to the direct through light. This is also equivalent to zero point calibrating, ensuring the maximum emission diffraction intensity at 0.00°. Then ω/2 is fixed at 11.85°/94.21°, and Ф scanning is performed. Then we measure φ1 when assigning the maximum Ф value as the [111] position. Fixing φ at φ1, perform ω scanning by setting 2θ=94.21°, then obtain the ω1 value when achieving maximum at [111]. Again, setting ω at ω1, fixing 2θ at 94.21°, perform the φ scan, and assign the Ф as [111] at the maximum φ, and measure φ2. Finally, fixing φ at φ2, and set 2θ at 94.21°, to perform ω scan, and obtain ω2 at the maximum ω. Comparing ω1 and ω2, we will find ω1=ω2, that is, ω2 is the accurate ω value [111] axis corresponds, and Ф2 is the accurate Ф, which is also the Ф when 3D rotating table at the 0.00°. Knowing that the angle between incident X ray and the(111)crystal surface is 47.11o, by subtracting ω2 from 47.11o, we can obtain the angle between the(111)surface and the sample plane, that is also the angle between the [111] axis and the sample normal. Hereto we calibrated the φ2 and ω2, that is the orientation of CaF2 [111] direction.
3. Results and Discussion
Based on the above-mentioned arguments and analyses, we follow the experiments and measurements steps below.
(1) Use the built-in alignment module for sample alignment. The last two Omega scans with Chi (χ) scans are shown in Figure 5, with the strongest light intensity at around 0°, indicating that the sample surface is already completely parallel to the X-ray.
(2) Fixing ω/2θ at 11.85°/94.21°, and the XRD map is obtained by Ф scanning. Shown in Figure 6, it can be seen that diffraction is strongest at Ф =93.1°. Therefore, after putting the lens on the 3D sample table, it should be turned from Ф to 93.1° to the calibrated "↑" position. We also see that at the peak position, the diffraction intensity, 20593, is not very intense, indicating some deviation between the measured Ф (93.1°)and the ideal Ф value. This is because,when Ф is rotated to the diffraction plane, when fixing ω/2θ at 11.85°/94.21°, the angle between the X ray and the(111)surface is the sum of 11.85° and the angle between mirror surface and the(111)surface. That is, the angle between the X ray and the(111)surface equals 11.85° +34.26°±1° ,which ≠47.11°, as X ray has some width, for so some parts of the X ray, ω=11.85°± some constant a, which is a continuous quantity, and until to a position where X ray at the widest position, where we have (34.26°±1°)+(11.85°±a°)=47.11°, and diffraction occurs. While this diffraction peak is not at the zero calibrating position. So in the following, Ф is fixed at 93.1°, and ω/2θ scan is performed to find the new ω value.
(3) Ф is set at 93.1° and 2θ is fixed at 94.21° to perform ω scan, the results are shown in Figure 7. The maximum peak position is ω =11.36°, with intensity of 833841, indicating that ω =11.36°, Ф =93.1° meets the diffraction geometry, and this ω =11.36° is more accurate than ω =11.85°. At this time, the corresponding diffraction light path is closer to the maximum outgoing X-ray satisfying the diffraction light path of the (111) crystal surface. However, the rotation of Ф will affect the ω Angle, so the accuracy of Ф will also affect the accuracy of ω measurement, so we scan many times until the peak of the ω, Ф value is unchanged, that is, the normal X-ray meets the ω + sample surface and (111) crystal surface angle (34.26 °± 1°) =47.11°, completing the accurate determination of ω, Ф measurement of [111] axis.
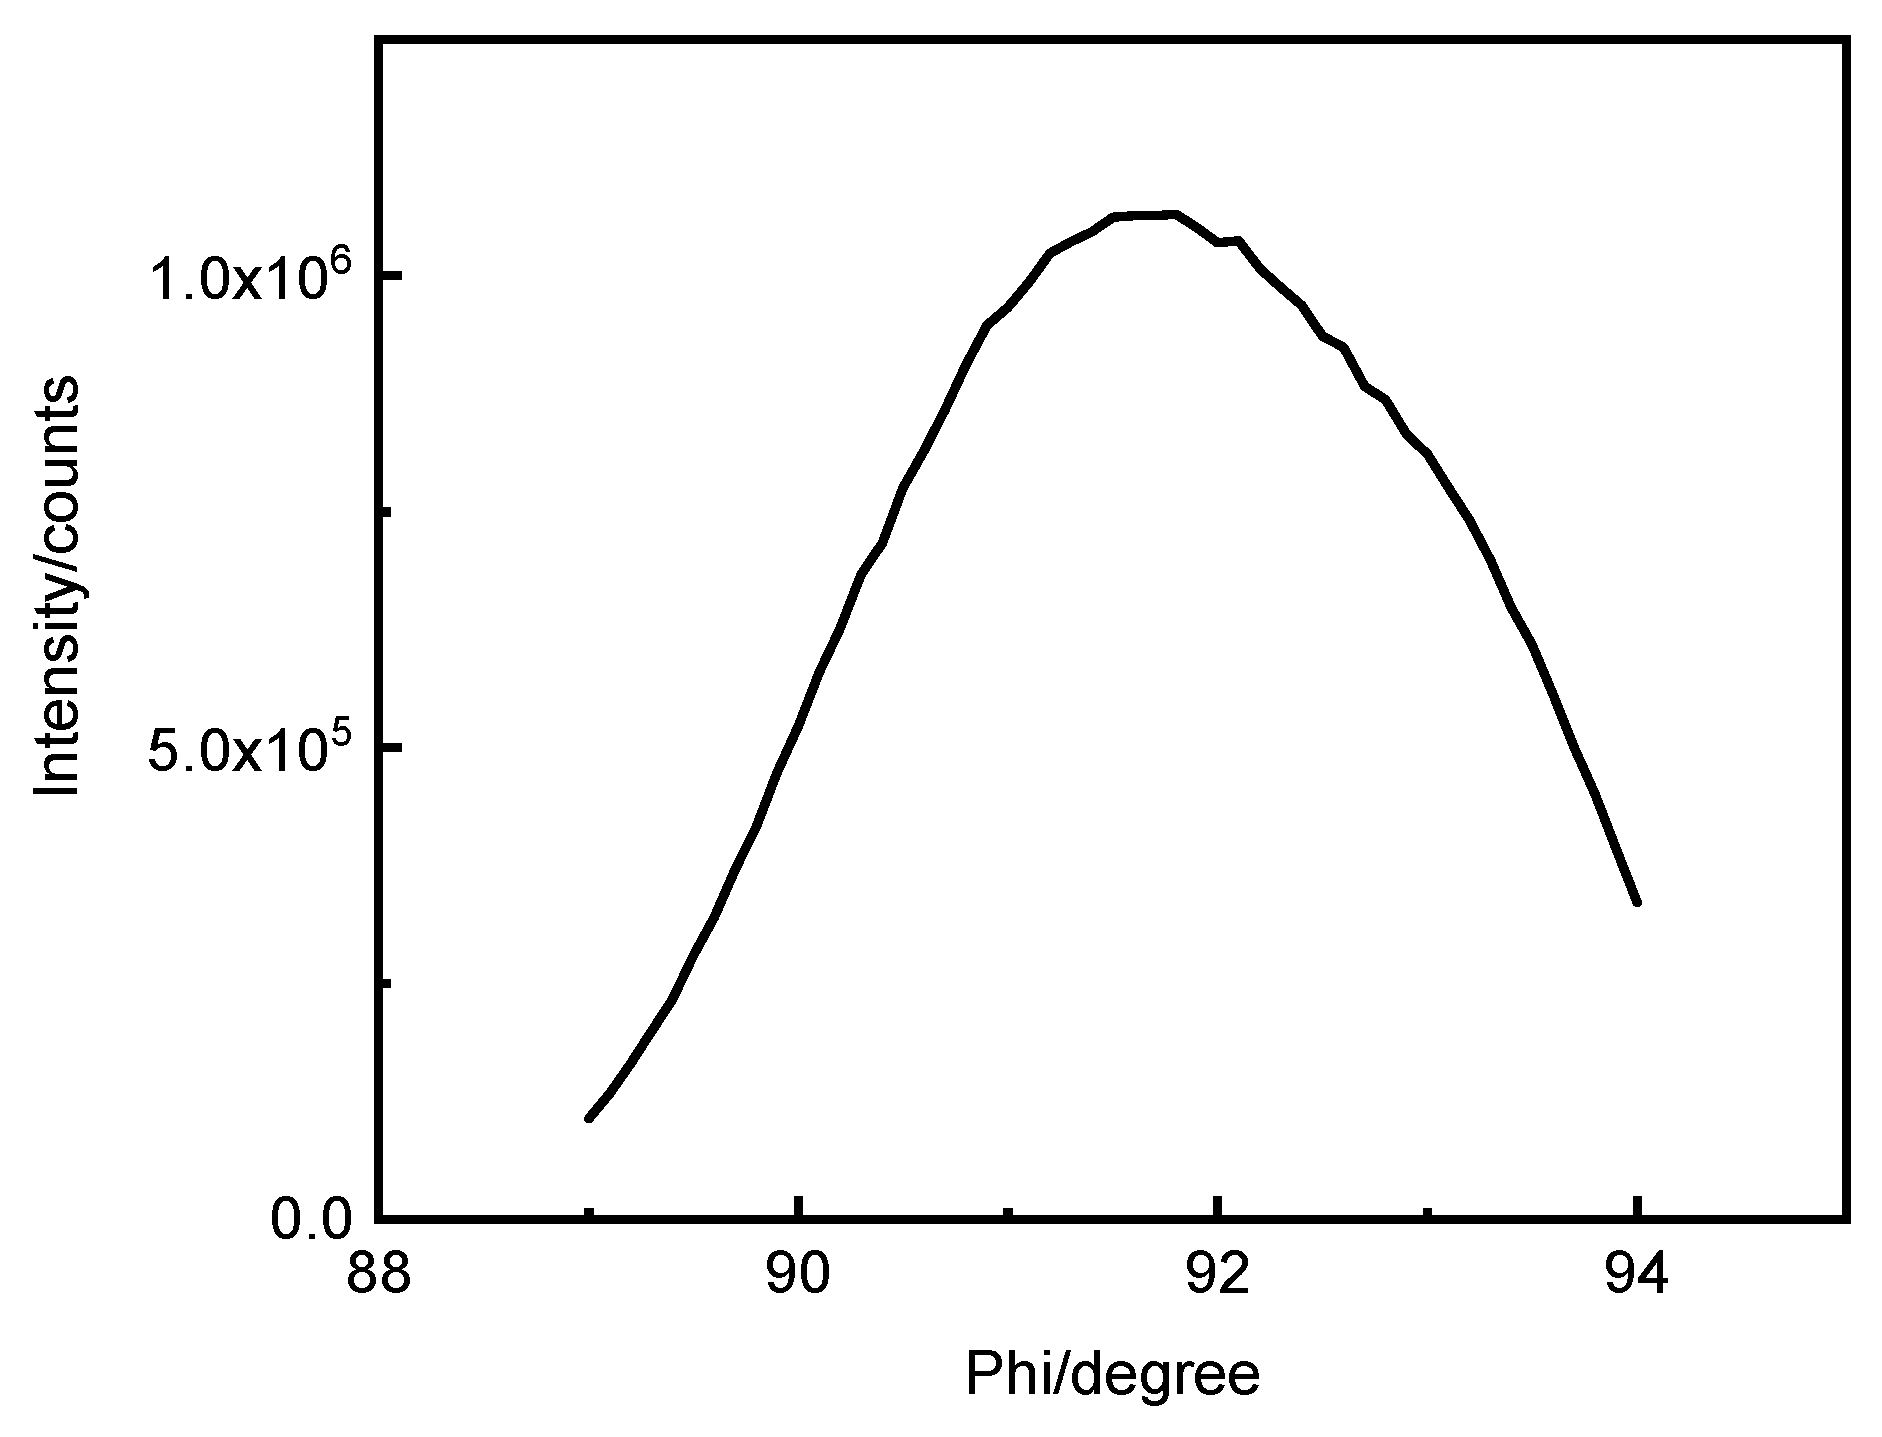
(4) Fixing ω/ 2θ at 11.36° / 94.21°, and Ф scan is performed with the results shown in Figure 8. The more accurate peak is achieved at Ф =91.6°, with intensity of 1077426, which is greater than 833841, indicating that Ф =91.6° is more accurate than Ф =93.1°.
(5) Ф scan is performed by fixing ω at 91.6° and θ2 at 94.21°. The results are shown in Figure 9 , with maximum peak ω =11.36°, while at fixed Ф of 93.1°, the peak is ω =11.36° for ω scanning. At this point, ω =11.36° is the exact value of the measurement.
(6) Ф scan is performed by fixing ω/ θ2 at 11.36° / 94.21°, and the results are shown in Figure 10, and the more accurate peak is achieved at Ф =91.6°, i. e., ω =11.36° and Ф =91.6° as the exact value, which is the final result of the large-size CaF2 the [111] axis orientation.
4. Conclusion
This paper presents a novel XRD-based method for precisely orienting the [111] axis of large-size CaF2 single crystal lenses. By defining the X, Y, Z axes and the tilting angles (Ф, ω, θ), we successfully aligned the [111] axis within the diffraction plane using a combination of ω/2θ and Ф scans. The use of higher index crystal planes addressed the limitations of direct XRD using the [111] axis, achieving an orientation accuracy of 0.1°. The X, Y, Z axes, and Ф, ω, and θ angles of the single crystal lens are first defined. Next, according to the characteristics of the range of outgoing X-ray, using Smartlab, diffraction instrument, adjusting the maximum light intensity of the flat outgoing X-ray at 0°, Ф scanning is performed by fixing ω/2θ , and fixing Ф for ω scanning, so that the strongest X-ray meets the crystal surface diffraction of CaF2 (111), achieving accurate positioning of the [111] axis. In view of the problem concerning the XRD θ/2θ scan (111), the method of measuring [333] by using high index surface θ/2θ scan to meet the diffraction geometry requirements is proposed and performed to find the [111] crystal axis, because [111] and ω, Ф, are related to the gradual measurement of accurate ω, Ф. When largest number of photons are achieved at some ω, Ф, the scan peak at Ф is unchanged, the exact ω and Ф of the [333] surface can be found, thus achieving the perfect determination when the maximum photon count is achieved at specific ω and Ф angles with stable Ф-scan peaks, the optimal orientation of [333] surface can be determined with ±0.05° uncertainty, thereby enabling high-precision determination of [111] direction (<0.03° deviation). And the measurement accuracy is influenced by: X-ray flux fluctuation: ±0.02° ,and Mechanical hysteresis: ±0.01° .. This method offers a cost-effective and efficient solution for the precise orientation of large-size single crystal lenses, with potential applications in deep ultraviolet lithography.
Acknowledgments
The authors acknowledge the financial support from Fund Project Jilin Provincial Department of Science and Technology No.20240402057GH, No.20250205042GH State Administration of Foreign Experts Affairs, No. D20240079 and D20240241, and National Natural Science Foundation of China (62204095).
Conflicts of Interest
There are no conflicts to declare.
References
- Minako Azumi, Eiichiro Nakahata, Study of relation between crystal structure and laser damage of Calcium Fluoride, Proc. of SPIE Vol. 7842 78421U-1,2010.
- I. Masada, T. Nawata, Y. Inui, T. date, et al, Structure and Optical property of Large Size CaF2 Single Crystals Grown by the CZ method Proc. of SPIE Vol. 6154 61542P-1,2006.
- N. Senguttuvan, M. Aoshima, K. Sumiya, H. Ishibashi, Oriented growth of large size calciumfluoride single crystals for optical lithography, Journal of Crystal Growth 280,462–466,2005.
- Yan, J., Tamaki, J., Syouji, K. and Kuriyagawa, T.,Single-point diamond turning of CaF2 for nanometer surface, Int J Adv Manuf Technol., 24/9:640,2004.
- J. H. Burnett, Z. H. Levine, E. L. Shirley et al:Symmetry of spatial-dispersion-induced birefringence and its implications for CaF2 ultraviolet optics, Journal of Microlithography,Microfabrication, and Microsystems, 1-3, 213/224( 2002).
- Dmitry S. Zheleznov, Aleksey V. Starobor, Oleg V. Palashov,Characterization of the terbium-doped calcium fluoride single crystal, Optical Materials 46 526–529,2015.
- Y. Kitamura, N. Miyazaki, T. Mabuchi and T. Nawata : Birefringence simulation of annealed ingot of magnesium fluoride single crystal, Journal of Crystal Growth, 311-15, 3954/3962,2009.
- Z. H. Levine, J. H. Burnett and E. L. Shirley : Photoelastic and elastic properties of the fluorite structure materials, LiF, and Si,Physical Review B, 68, 155120, 2003.
- ZongHuiwen,ZhaoJiangshan,SongXingliang,et al.Development of Research on Damage Characteristics of Calcium Fluoride Crystal Under Deep Ultraviolet Laser Irradiation, Laser & Optoelectronics Progress,56(19),19002-1,2019.
- K. Niki, G. Mochimaru, and H. Shindo, "Participation of {100} Slip System in Sliding Friction at (001), (111), and (110) Surfaces of Fluorite (CaF₂) Crystal," Tribol. Online, 7, 81–86, 2012.
- Jian Yijian, Wang Xiangnan, Chen Haiping,Intelligent Method of Crystal Laue Orientation, Journal of Beijing University of Technology,20(1), 12.1994.
- Wang, & Baoliang.. Linear birefringence in CaF2 measured at deep ultraviolet and visible wavelengths. Journal of Microlithography Microfabrication and Microsystems, 3(1), 115-121,2004.
- M. A. Lodes, A. Hartmaier, M. Göken, and K. Durst, "Influence of Dislocation Density on the Pop-In Behavior and Indentation Size Effect in CaF₂ Single Crystals: Experiments and Molecular Dynamics Simulations," Acta Mater., 59, 4264–4273,2011.
- Burnett J, Levine Z , Shirley E . Intrinsic birefringence in calcium fluoride and barium fluoride[J]. Physical Review B, 64(24):241102, 2001.
- Lv, Y. W. , Yu, X. D., Tan, C. W. et al. Preparation and characterization of tungsten single crystals coating by chemical transport method. Journal of Synthetic Crystals, 39, 258-263, 2010.
Figure 1.
Right coordinate system establishment and definition of ω, Ф, χ, θ tilted. Figure 1: (a) X-ray alignment configuration with a blank substrate, showing rotations ω (X-axis), χ (Y-axis), and φ (Z-axis). (b) Optical laser deflection setup with a plano-convex lens, illustrating beam deflection via crystal lattice interaction. Tilt angles ω (X-axis), χ (Y-axis), and φ (Z-axis) are defined for optical alignment. Axes X, Y, Z are labeled in both subfigures.

Figure 2.
Schematic of [111] -axis along calcium fluoride (110) by X-ray diffraction.
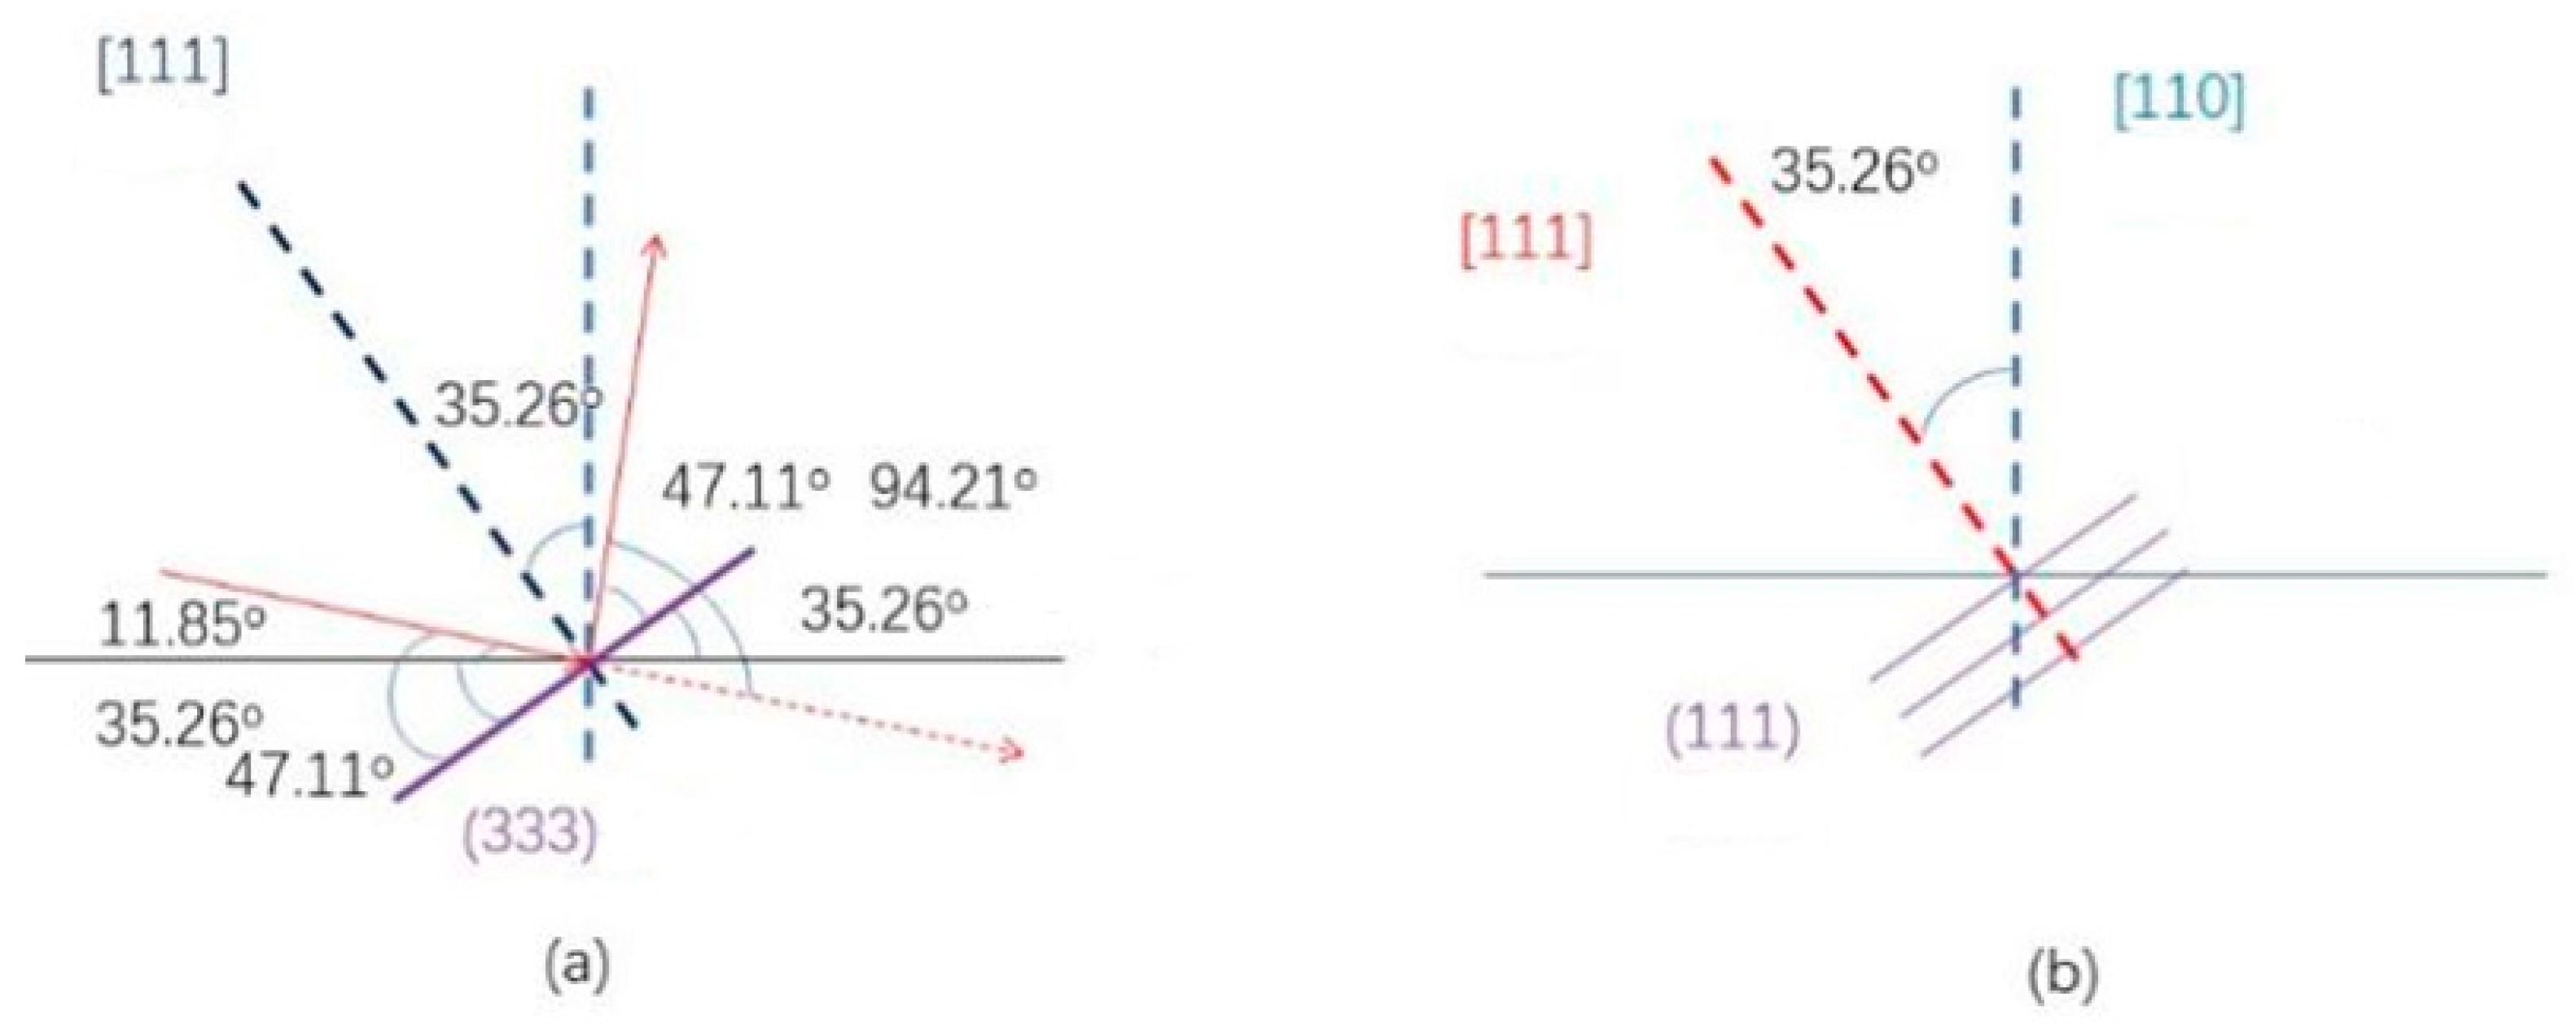
Figure 3.
Crystal distribution of calcium fluoride single crystal lens under inspection.
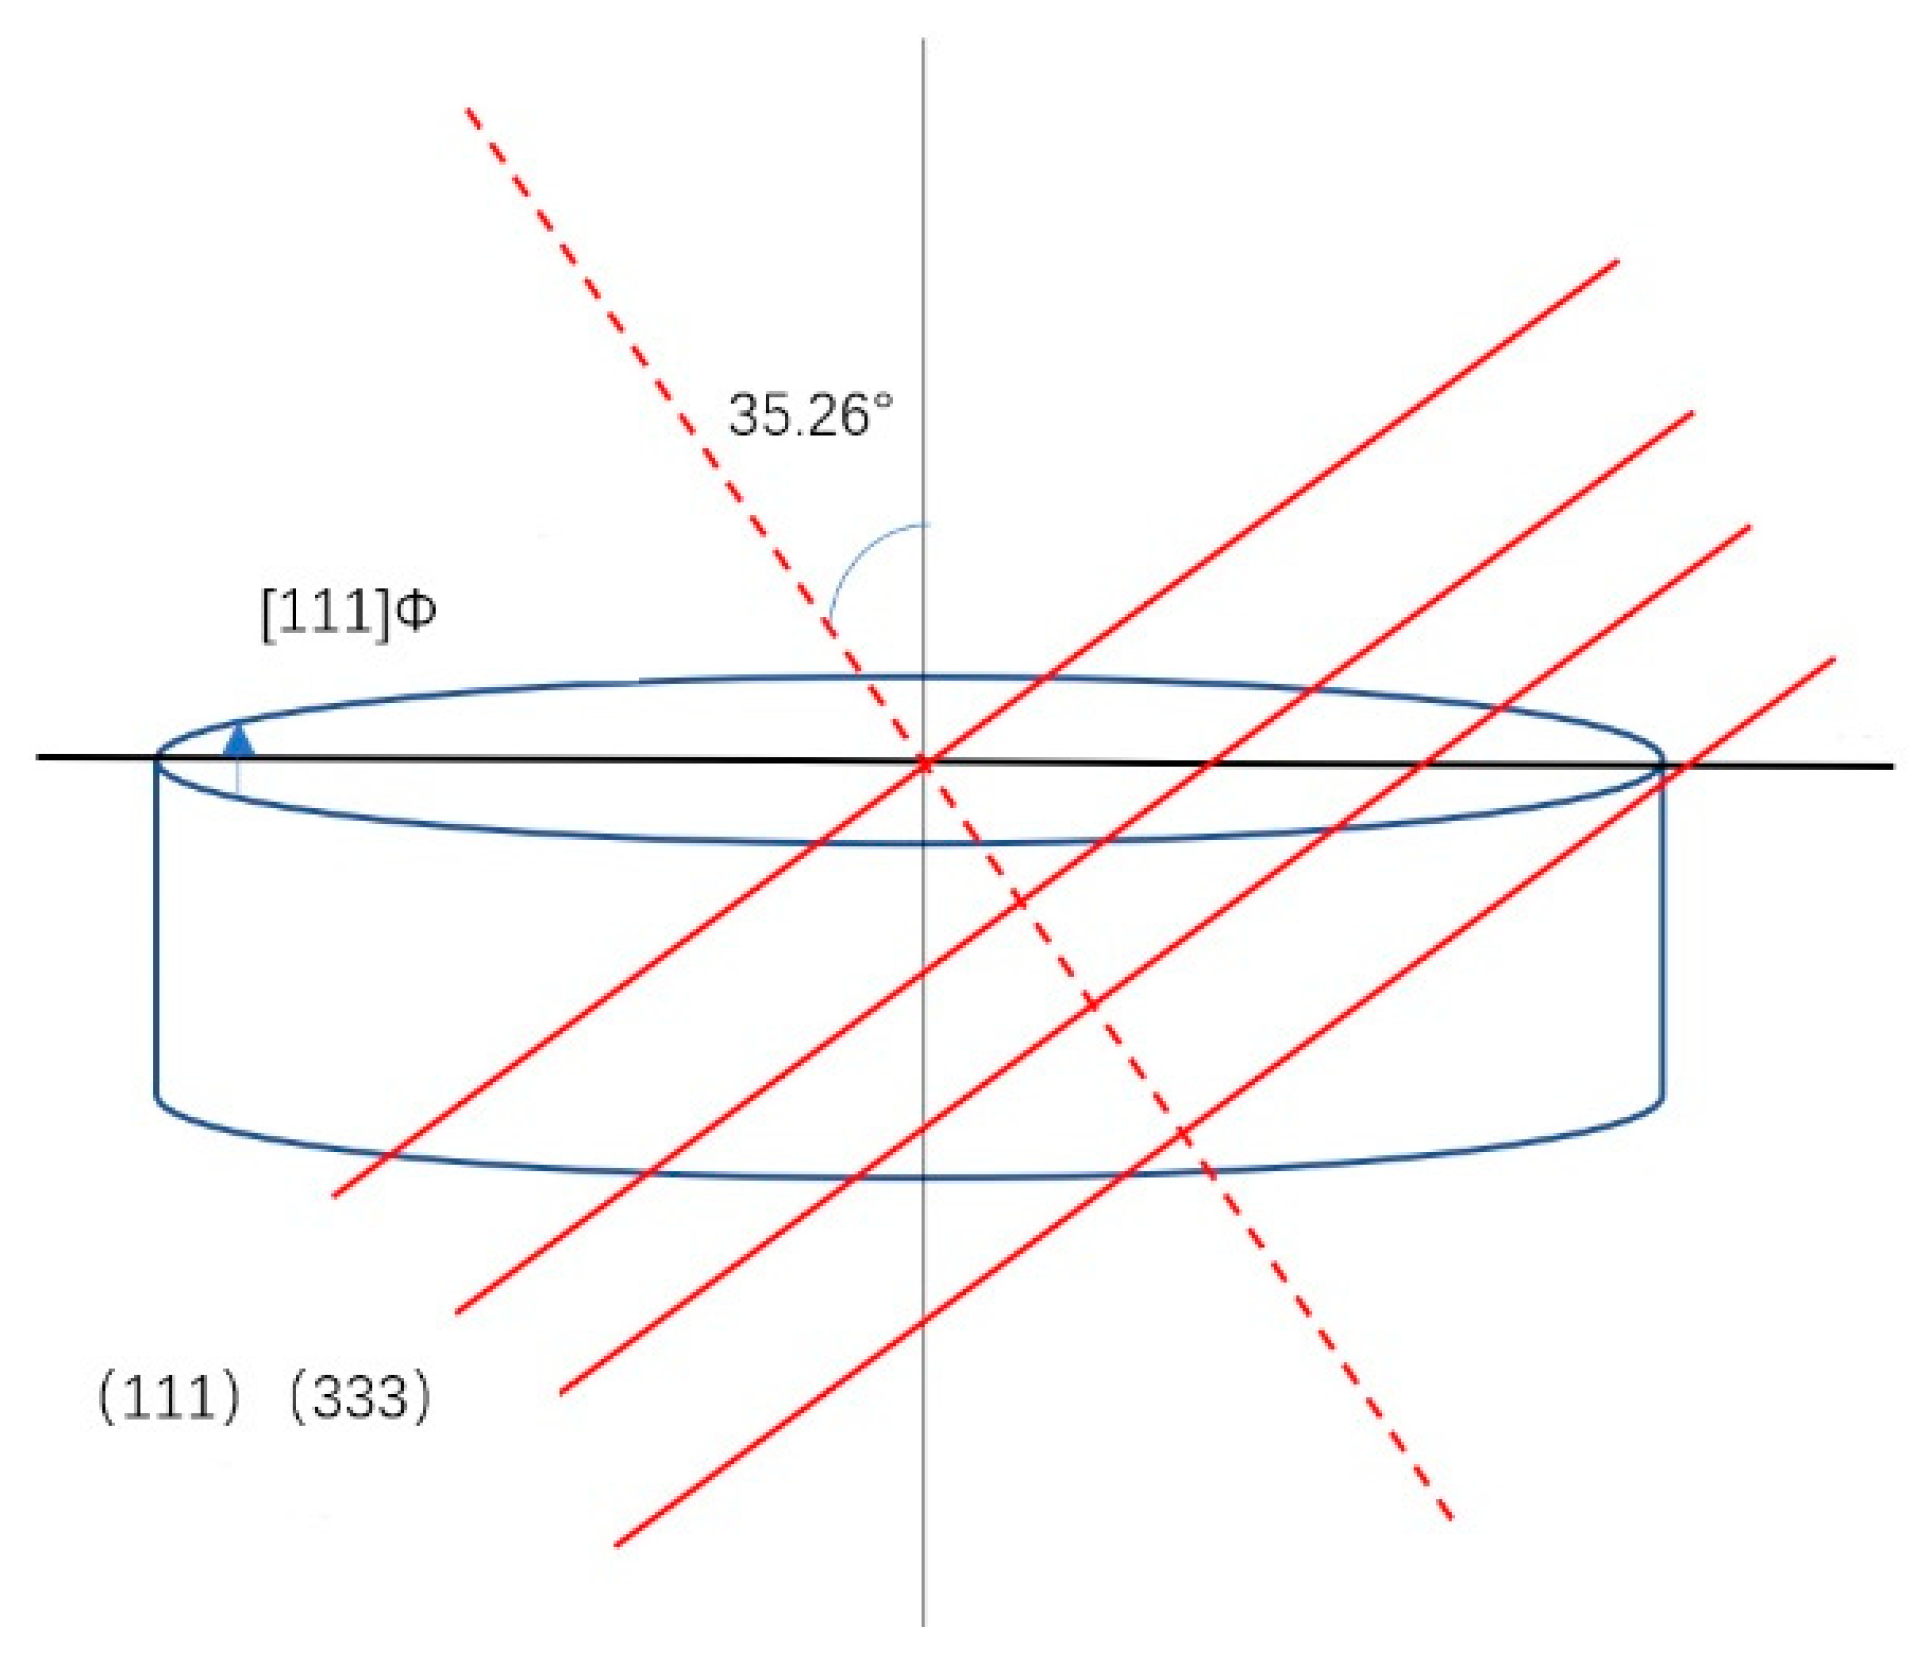
Figure 4.
Schematic diagram of the [111] -direction detection of the CaF2 lens.
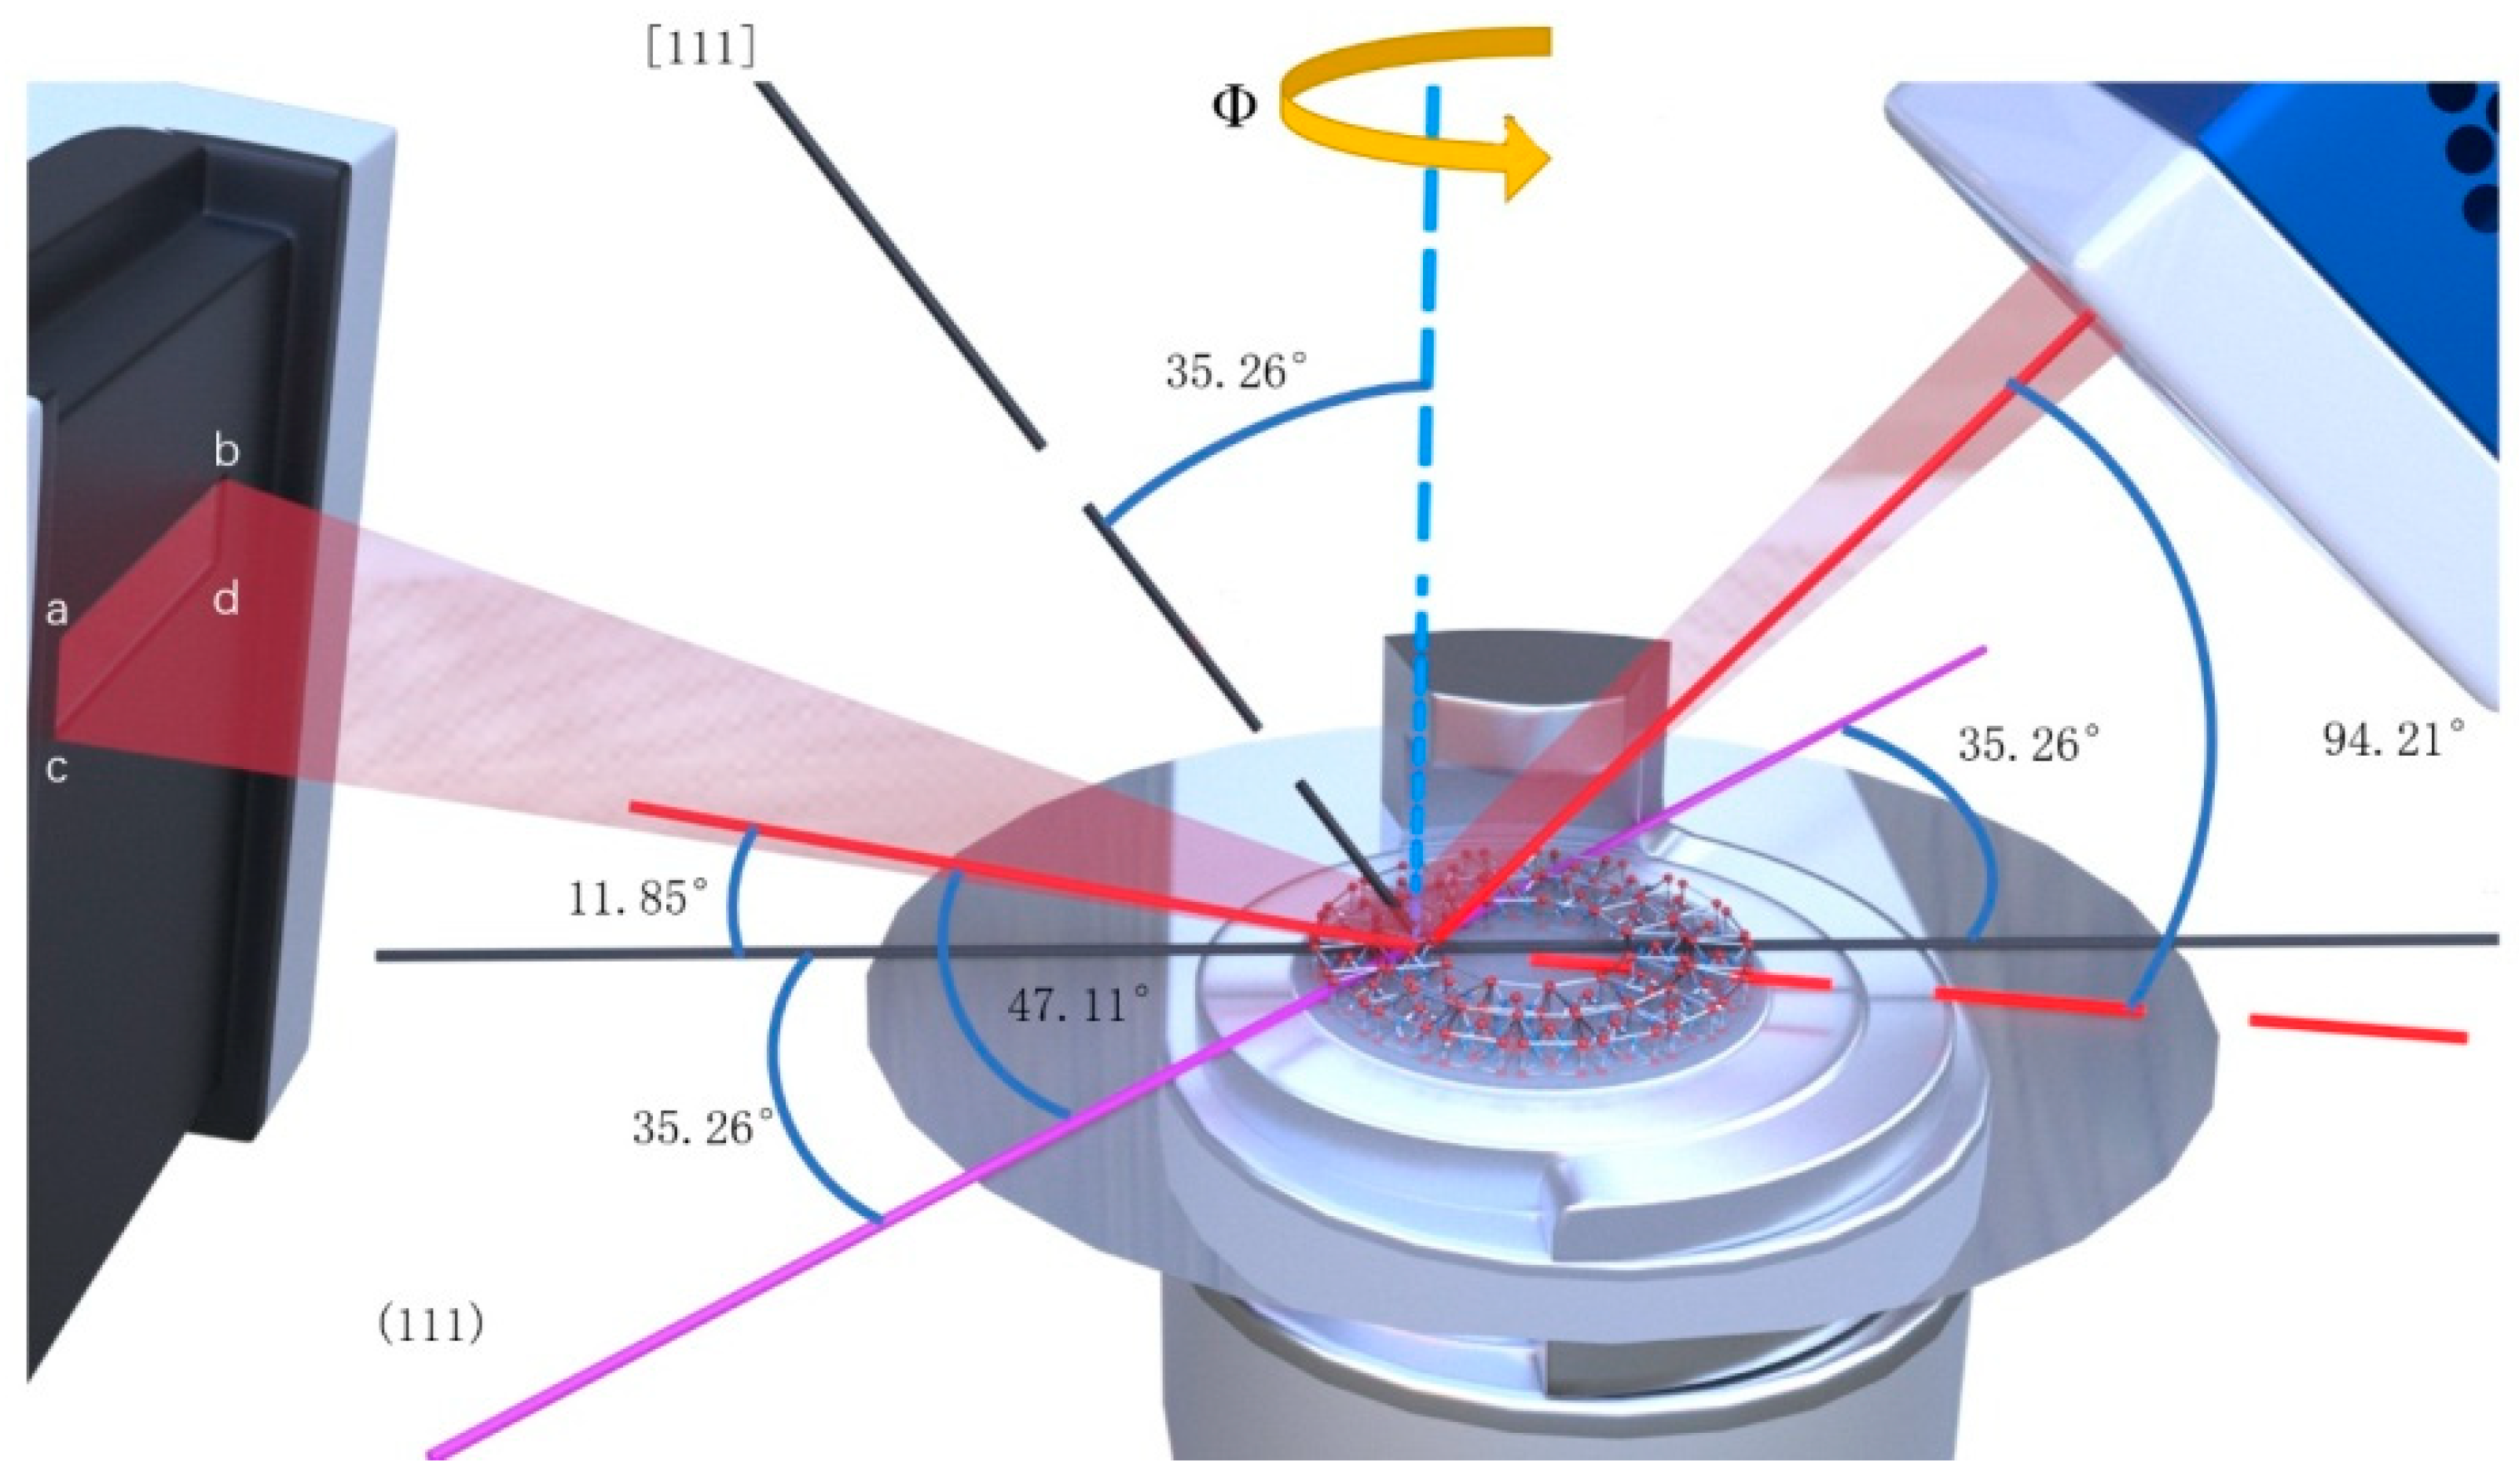
Figure 5.
Optical leveling XRD for CaF2 (a) leveling ω = 0 XRD, (b) leveling χ = 0 XRD.
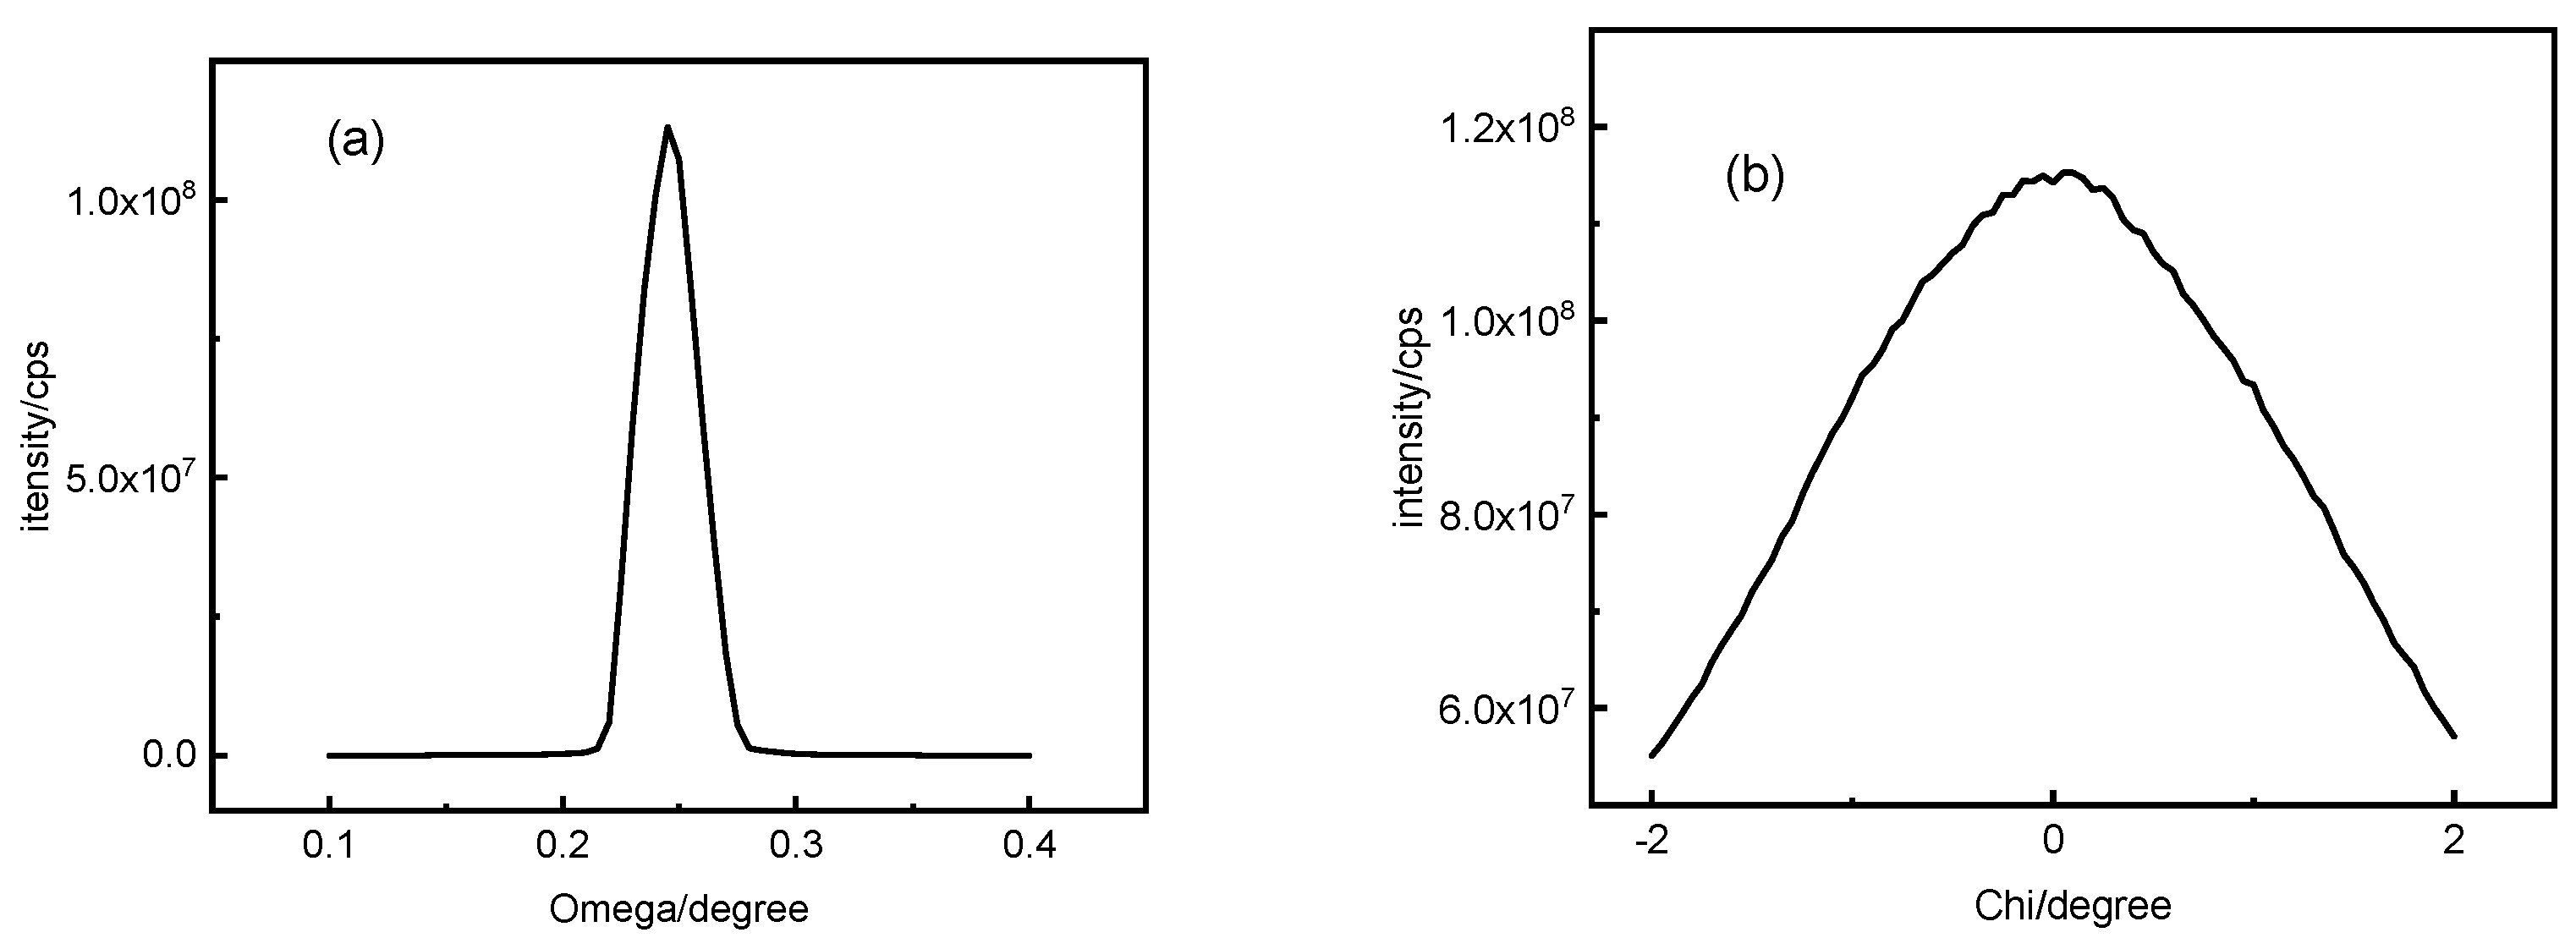
Figure 6.
ω / 2 θ at 11.85° / 94.21°.
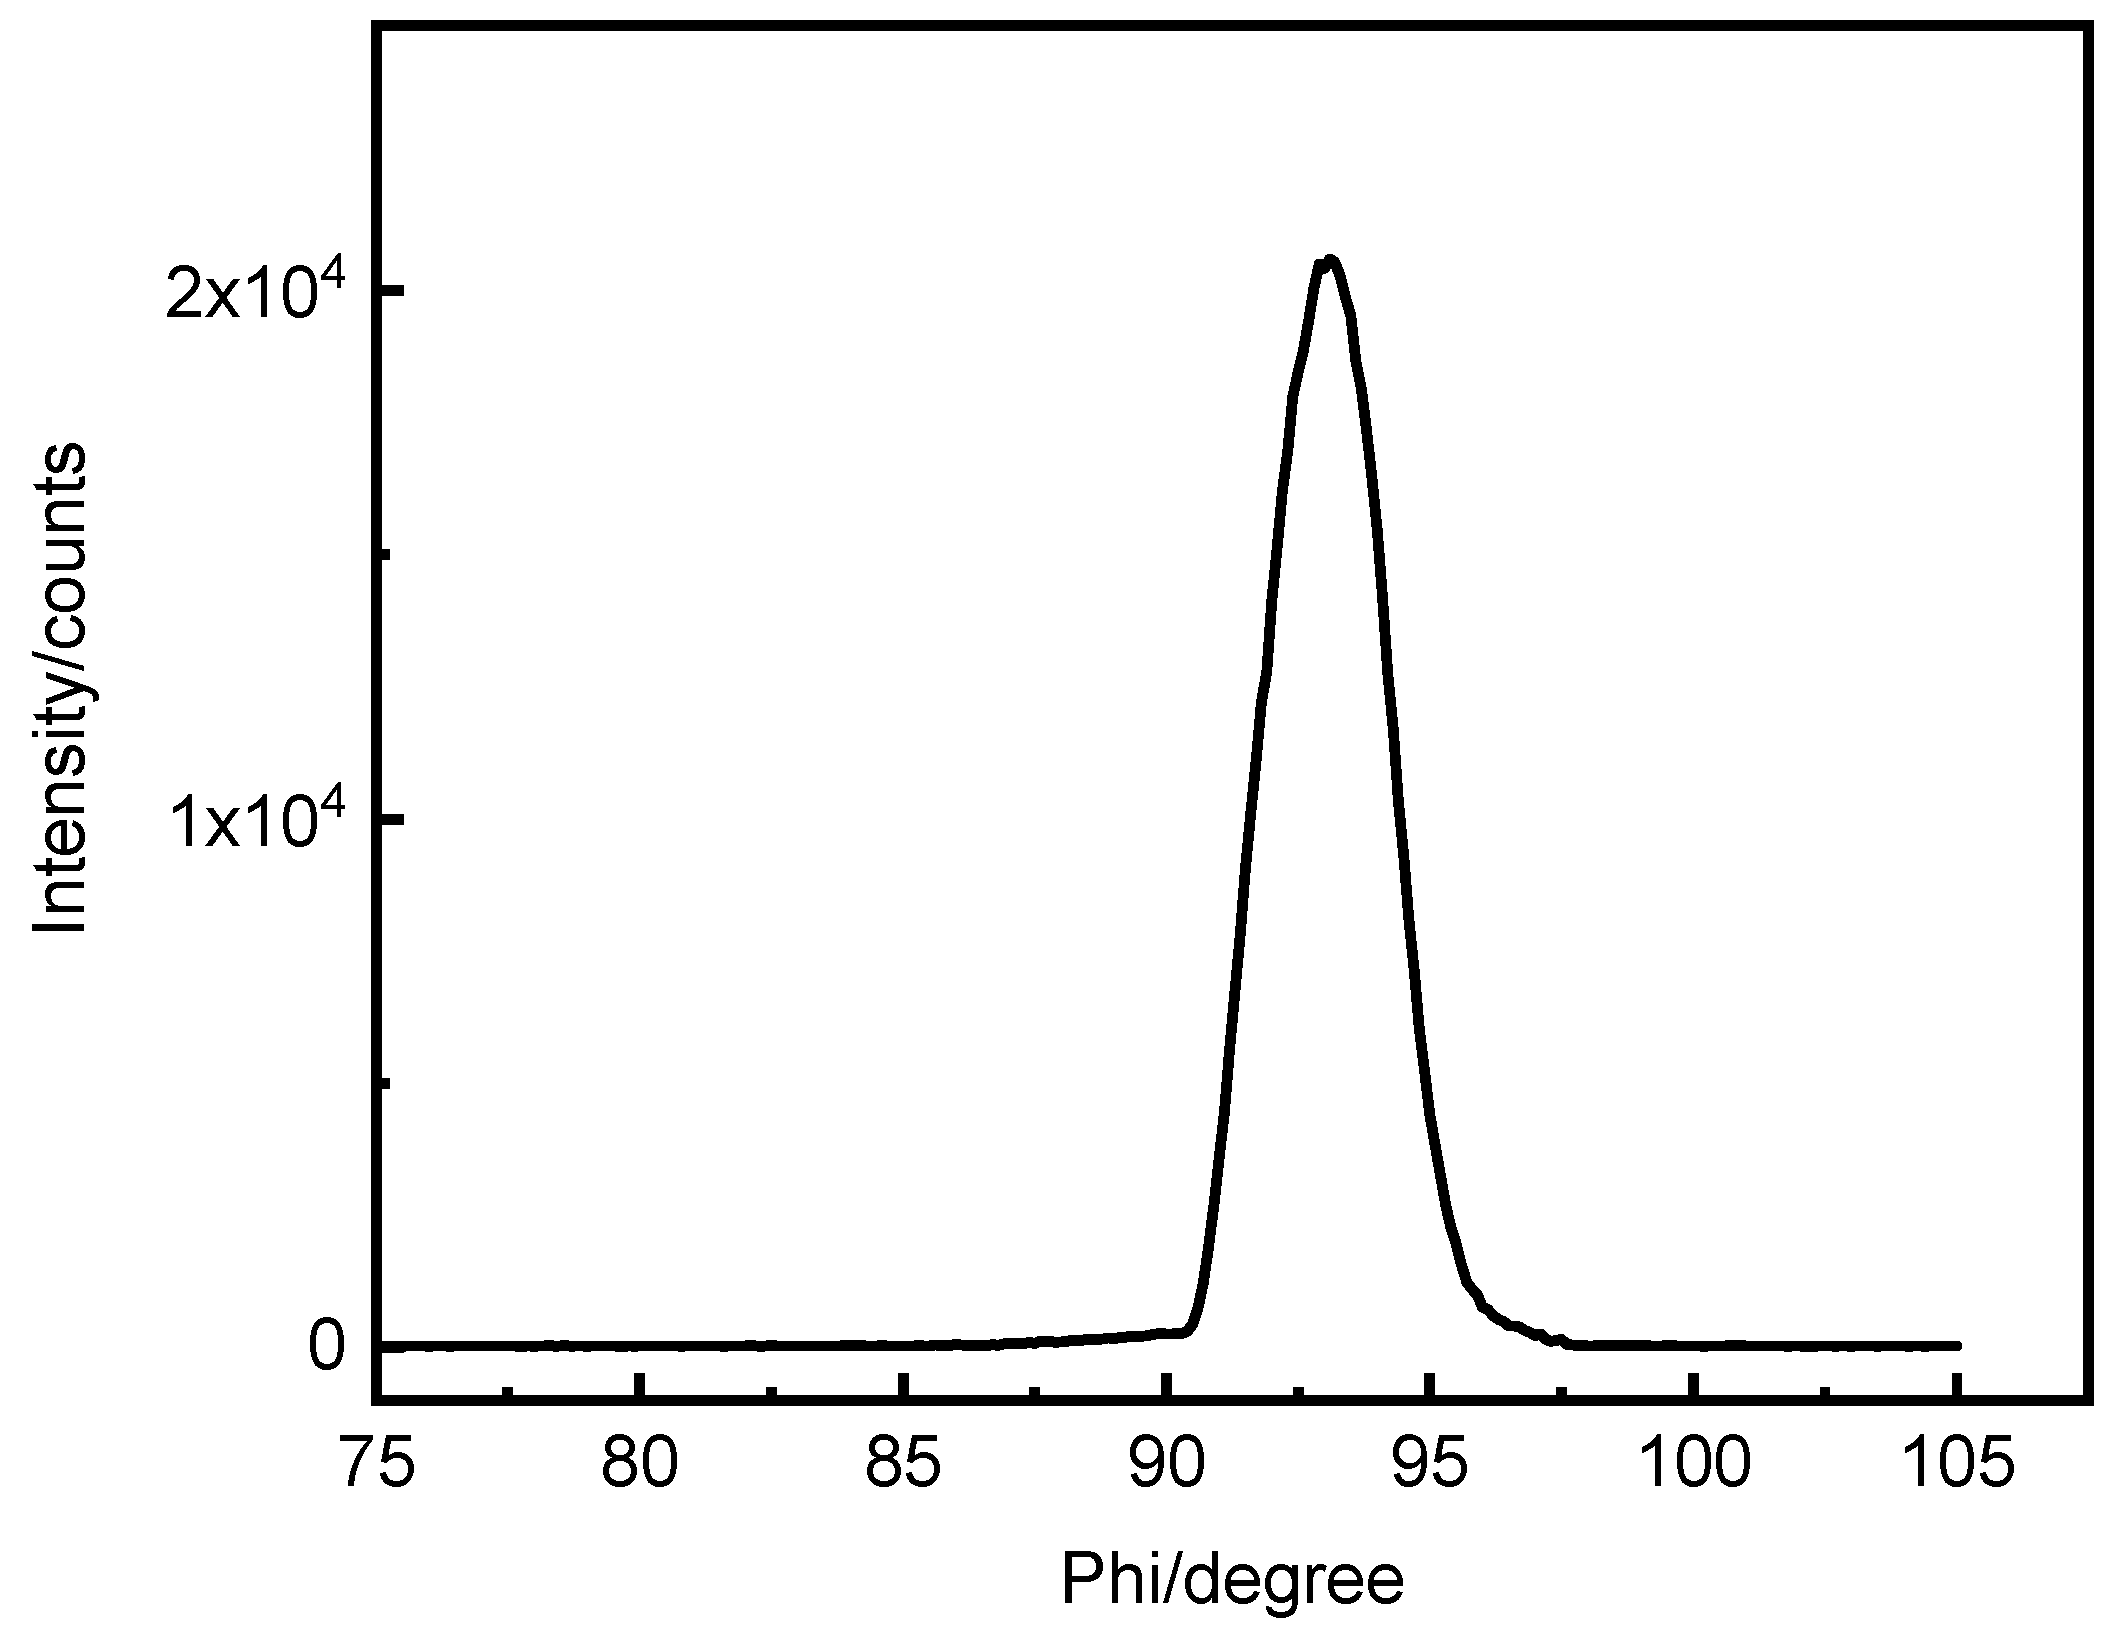
Figure 7.
The XRD profile of ω scans at fixed Ф / 2 θ at 93.1° / 94.21°.
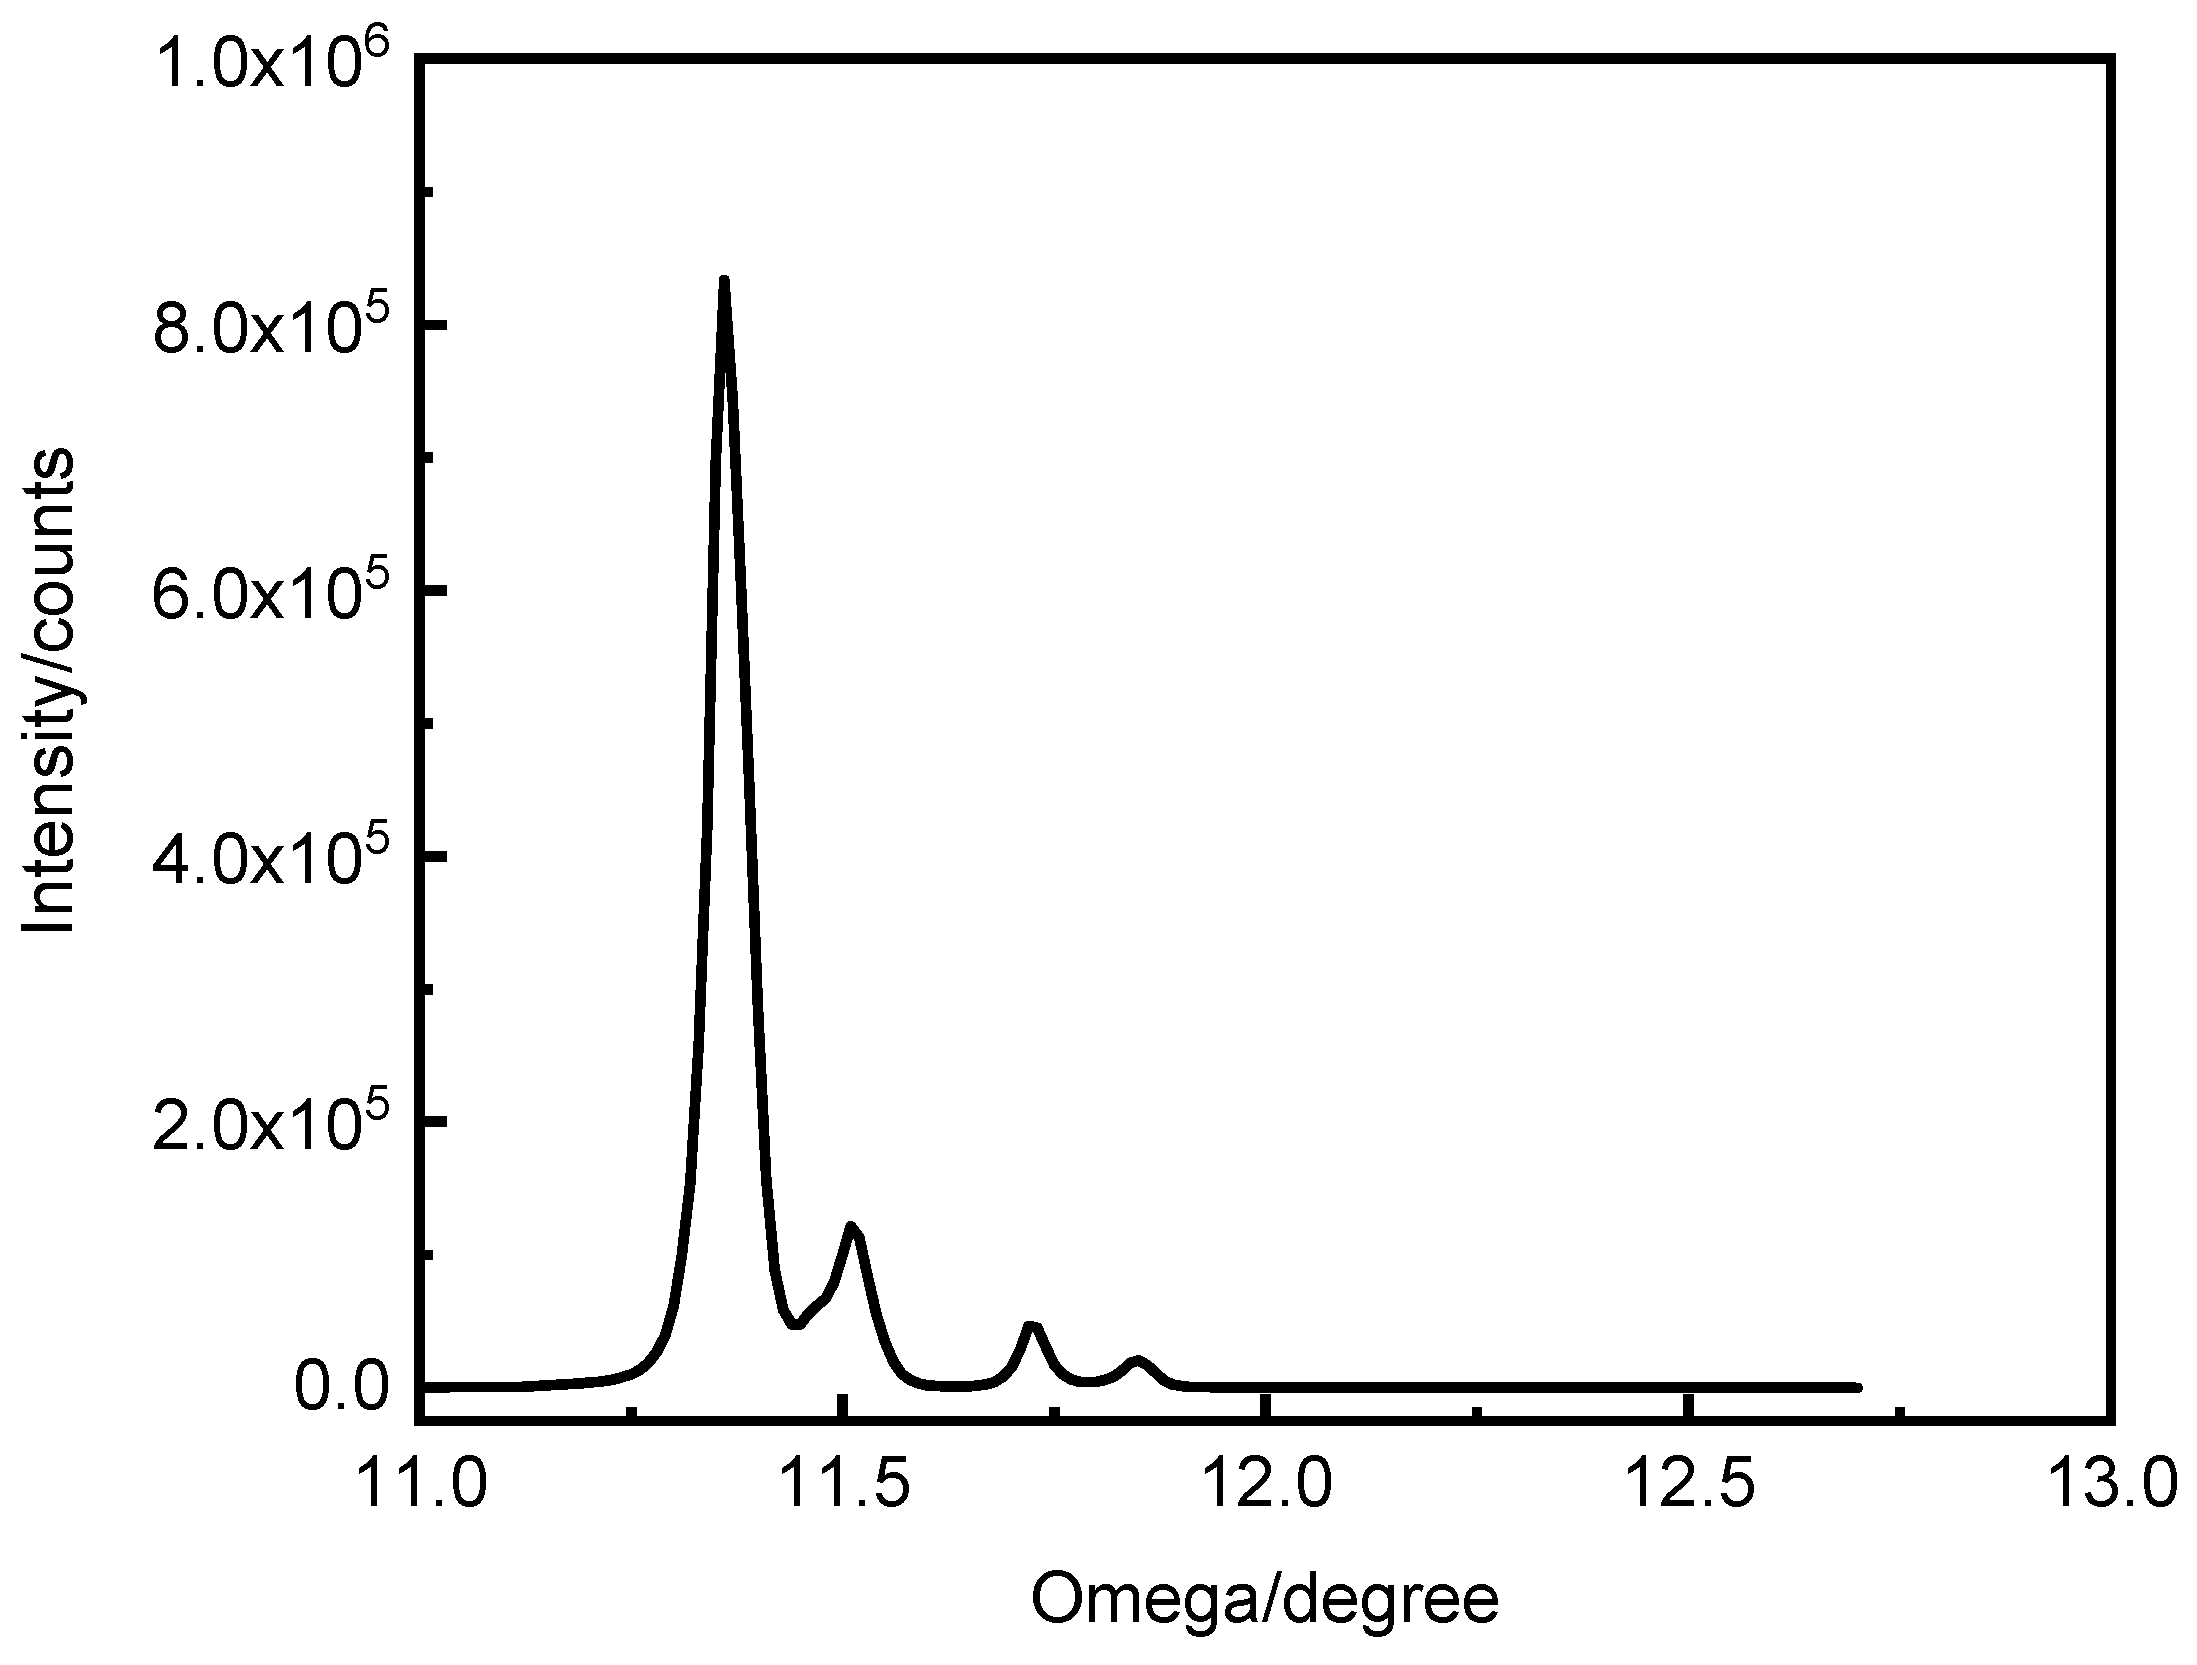
Figure 8.
The XRD profile of the fixed ω / 2 θ at 11.36° / 94.21 °Ф scan.
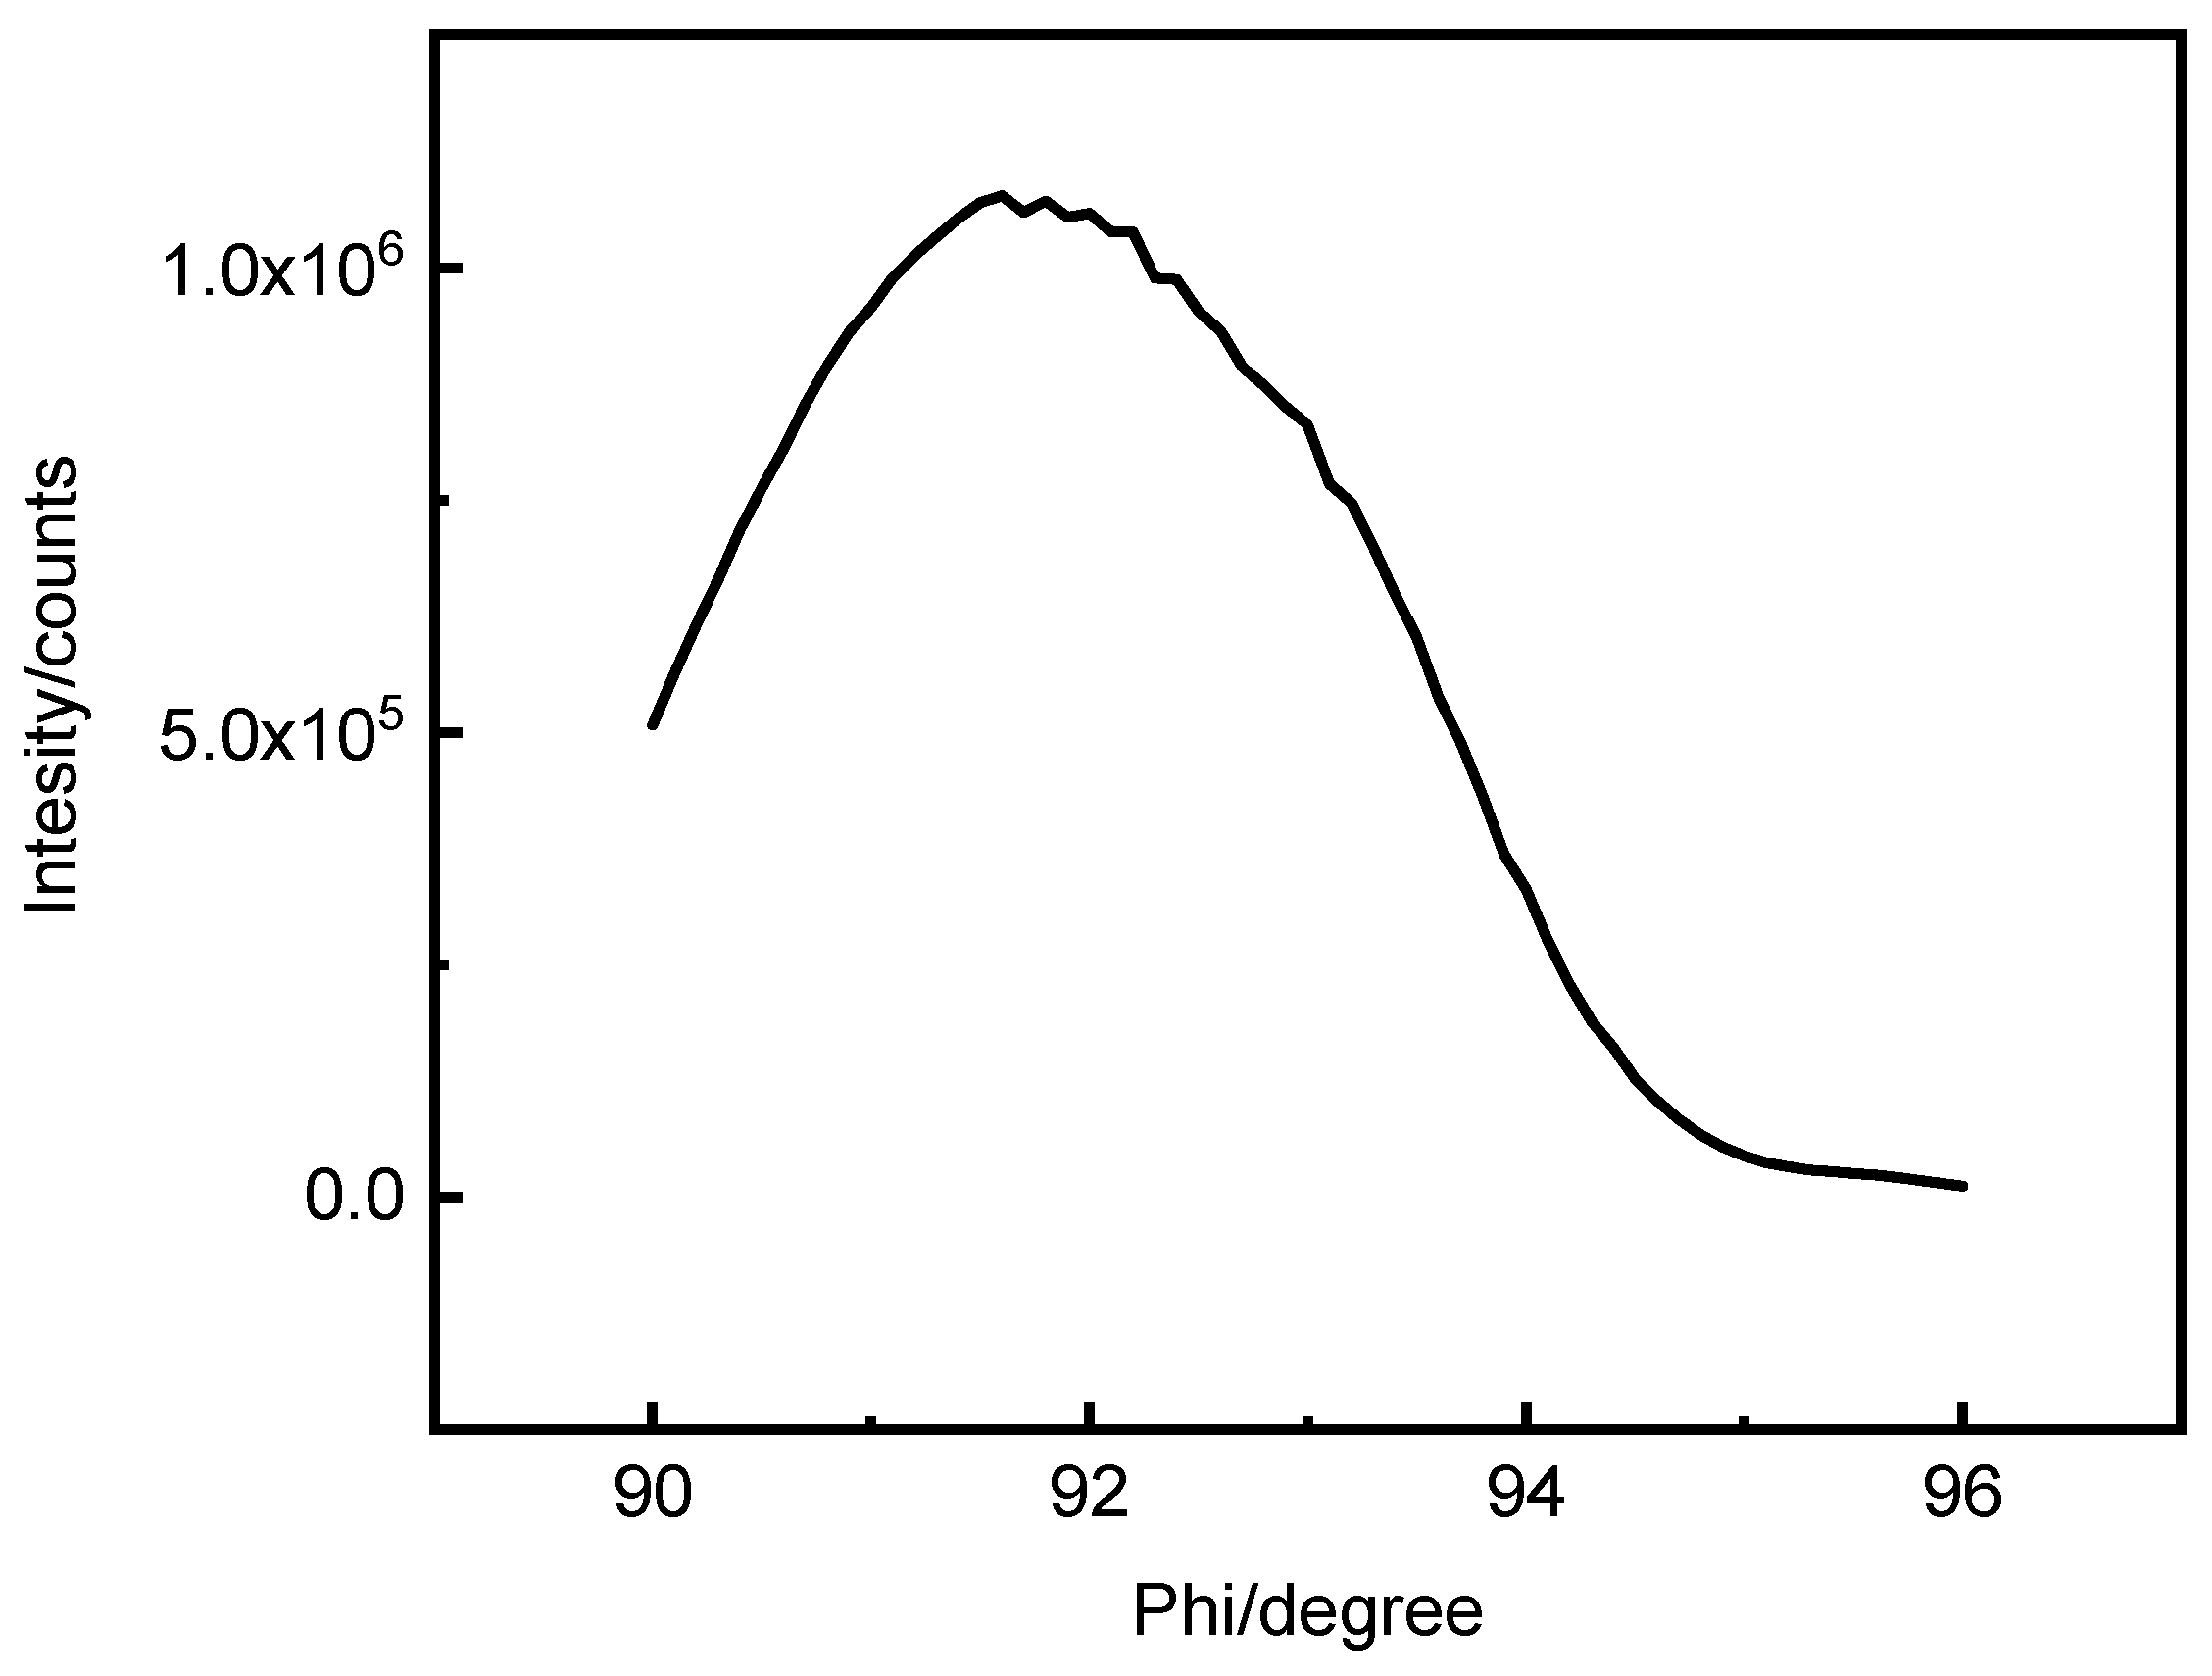
Figure 9.
The XRD profile of ω scans at fixed Ф / 2 θ at 91.6° / 94.21°.
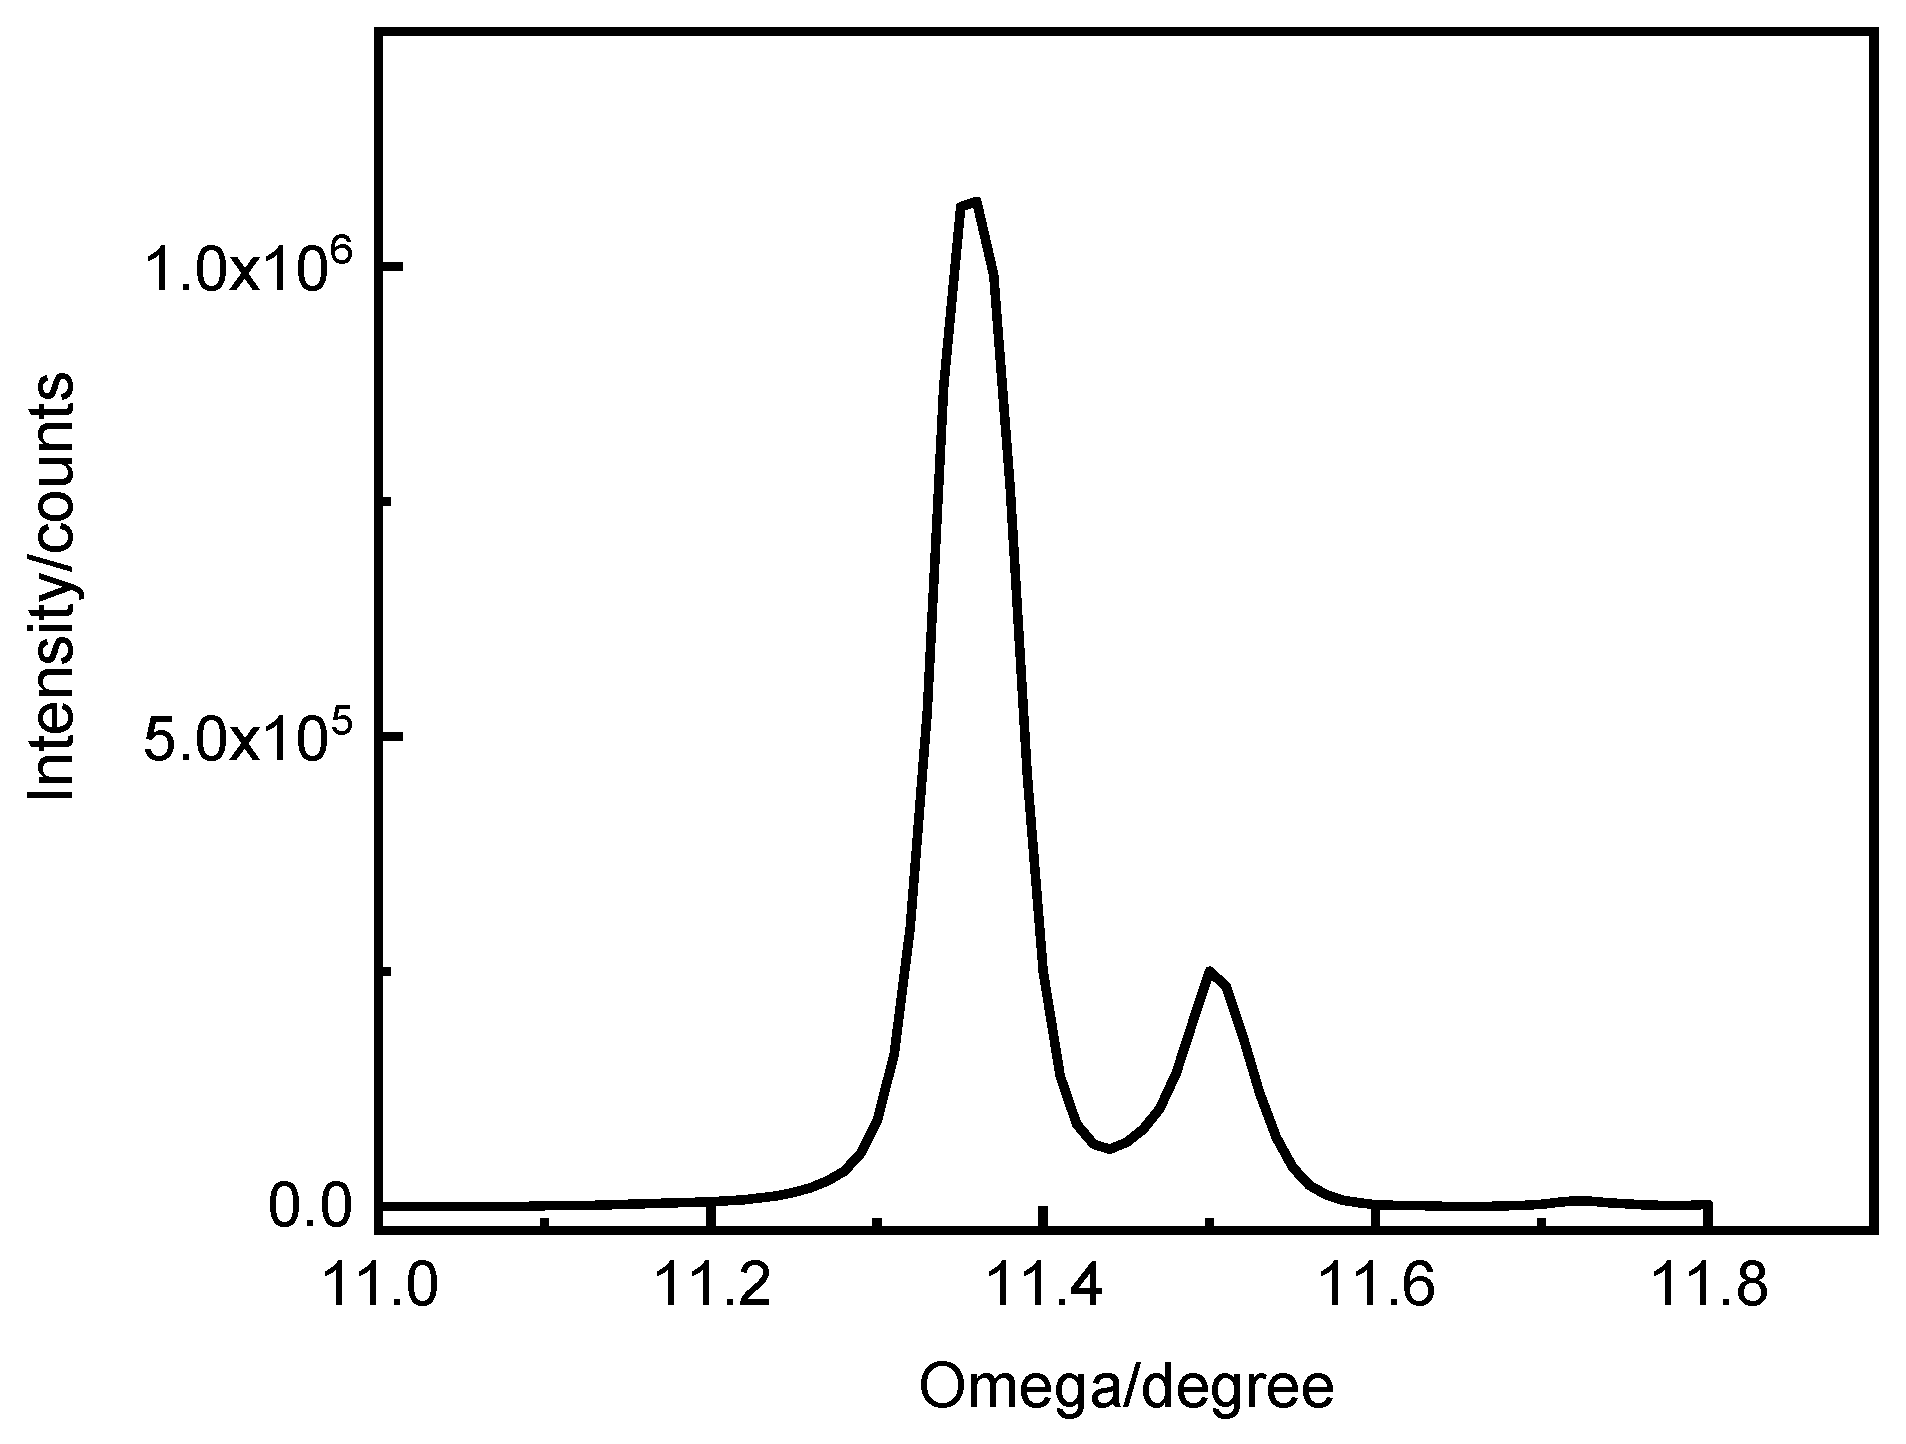
Figure 10.
The XRD profile of the fixed ω / 2 θ at 11.36° / 94.21 °Ф scan.
Disclaimer/Publisher’s Note: The statements, opinions and data contained in all publications are solely those of the individual author(s) and contributor(s) and not of MDPI and/or the editor(s). MDPI and/or the editor(s) disclaim responsibility for any injury to people or property resulting from any ideas, methods, instructions or products referred to in the content. |
© 2025 by the authors. Licensee MDPI, Basel, Switzerland. This article is an open access article distributed under the terms and conditions of the Creative Commons Attribution (CC BY) license (http://creativecommons.org/licenses/by/4.0/).
Copyright: This open access article is published under a Creative Commons CC BY 4.0 license, which permit the free download, distribution, and reuse, provided that the author and preprint are cited in any reuse.


