
Submitted:
20 May 2025
Posted:
21 May 2025
You are already at the latest version
Abstract
Chronic noise is an environmental risk factor leading to a number of pathologies at different levels of the organism, including the brain. The pathological changes induced by noise have been mainly studied in the regions of classical auditory system. However, neuroanatomy of sound processing is extremely complex as this process is supporting by not only classical auditory system, but brain regions outside the classical auditory pathways, including limbic areas. In the present study, we compare biochemical and ultrastructural alterations, provoked by 30 days’ loud noise in classical auditory and limbic regions of adult male rat brain: the central nucleus of inferior colliculus, basolateral amygdala and the hippocampus. We have shown that 30 days’ loud noise exposure leads to biochemical and ultrastructural alterations in these regions. Depending on the area, significant changes were demonstrated for the protein components of synaptic vesicles (synaptophysin), imflammosomes (AIM2 and NLRP3) and mitochondrial oxidative phosphorylation system (succinate dehydrogenase complex iron sulfur subunit B). Lipid oxidative degradation product - malondialdehyde protein adducts are significantly increased in the central nucleus of inferior colliculus. Some of these changes could be of a compensatory nature. The central nucleus of the inferior colliculus demonstrates moderate and severe ultrastructural alterations. The ultrastructure of limbic regions was more preserved. The data convincingly indicate the interrelated molecular and morphological changes after long-term loud noise exposure in classical auditory and limbic regions of the brain. Observed changes may lead to the pathological processes harming normal functioning of the brain.
Keywords:
prolonged loud noise
; the inferior colliculus
; limbic region
; neurotransmission
; neuroinflammation
; MDA‐protein adducts
; oxidative phosphorylation
; ultrastructural changes
1. Introduction
Chronic loud noise is an essential part of the physical environment in urban, military and industrial areas. As an environmental risk factor, noise produces a number of pathologies at different levels of the organism, having a profound impact on health [1,2]. According to the World Health Organization, about 1.6 million healthy life-years are lost yearly from unwanted loud noise in Western Europe [3,4]. Auditory system and related components of central nervous system (CNS) are the most vulnerable to the damaging effects of noise. Recent studies highlight the CNS effects of chronic noise via molecular pathways and the changes of brain [5,6]. However, many questions regarding molecular and structural mechanisms of noise effects remain unresolved. Valuable information has been mainly obtained from the classical auditory pathways, such as inferior colliculus, medial geniculate body or auditory cortex, which play the vital role in the sense of hearing and sound localization [7,8]. However, the functional neuroanatomy of sound processing is complex as this process is supporting by not only classical auditory system, but brain regions outside the classical auditory pathways, including limbic areas, reticular activating system and cerebellum [9,10]. To fully understand the consequences of noise on the brain, it is important to carefully analyze multifaced changes provoked by noise in all brain areas, involved in sound processing.
In the present study, we evaluate biochemical and ultrastructural alterations produced by 30 days (d) loud noise in the central nucleus of inferior colliculus (CNIC), basolateral amygdala (BLA) and hippocampus of adult male Wistar rats. All three regions participate differently in sound processing. CNIC, located at the posterior surface of the brainstem, is a channel for almost all auditory signals and the site of auditory signal integration, frequency recognition and pitch discrimination [11]. BLA, as responsible for emotional processing, plays valuable role in auditory fear conditioning, regulation of acoustic startle response and the modulation of auditory cortex plasticity [12,13]. Besides, BLA integrates acoustic inputs with the information from other senses and organisms’ internal state [14]. “Hearing hippocampus” [15] has wide auditory interactions, which is consistent with its extensive contributions to the perception [15,16]. In these regions of normal and noise-exposed rats, we evaluated the levels of proteins: (i) involved in synaptic exocytosis - synaptophysin, syntaxin1 and SNAP-25 [17,18]; (ii) associated with oxidative stress and inflammatory processes - AIM2, NLRP; (iii) implicated in oxidative phosphorylation and (iv) malondialdehyde (MDA)-protein adducts - markers of lipid peroxidation [19,20]. In addition, using electron microscopy (EM), in abovementioned regions, we evaluated the effect of noise on the ultrastructure of different types of neurons, glial cells and synapses. As far as we know, this is the first comparative study of ultrastructural and biochemical alterations provoked by chronic loud noise in the classical auditory structure and limbic regions of the brain.
2. Materials and Methods
2.1. Animals and Experimental Design
A total of 24 adult male Wistar rats (P137-142; weight -110-115) were used. The animals were provided by Animal Center of Ivane Beritashvili Center of Experimental Biomedicine. 16 animals were used for biochemical studies, 8 animals – for EM analysis. The rats were divided randomly into experimental (n = 12) and control groups (n = 12). Before and during experiments, the animals were kept in wire-meshed cages, three per cage, in controlled environment (room temperature 20− 22 ◦C; 12 h light/dark cycle; humidity 55–60 %). Standard food pellets and tap water were ad libitum. The study was conducted in accordance with guidelines formulated by the European Council. The protocol was approved by Committee of Ethics of Ilia State University and Animal Care Committee of Ivane Beritashvili Center of Experimental Biomedicine. Protocol number: N01/10.02.2025.
2.2. Noise Exposure
In general, the process of noise exposure was the same as described in our earlier studies. The difference was only in the term of noise exposure: experimental rats were subjected to 100 dB for thirty consecutive days (1 h per day), instead of 10 days as in our previous studies [21,22]. Two Paradigm Signature S1 P- Be loudspeakers (Paradigm Electronics Inc., Canada) were used. Four speakers were mounted 55 cm above the floor of the cages. Each speaker affected two cages. Sound levels were constantly monitored using two microphones, suspended in a line 45 cm above the cage. The exposure to noise was performed in the daytime between 11.00 – 13.00. Biochemical and EM studies were done immediately after 30 d of noise exposure, in the daytime: 12.00 – 14. 00.
2.3. Biochemical Analysis
The biochemical experiments were conducted on brain regions isolated from a group of 8 male control and 8 noise-exposed rats (synaptophysin, SNAP25 and syntaxin studies). Unanesthetized animals were killed by decapitation and the regions of interest were identified [23]. Dissected tissue samples were stored at -700C until processing.
- Fraction preparation.
Frozen tissue samples were rapidly homogenized in a buffer of the following composition: 20mM Tris-HCl (pH 7.4), 0.32M sucrose, 1mM sodium orthovanadate, 1mM ethylendiamintetraacetic acid, 0.5mM ethylene glycol-bis(2-aminoethylether)-N,N,N’,N’- tetraacetic acid,10mM sodium pyrophosphate, and a cocktail of protease inhibitors (Sigma, P8340). A concentrated solution of sodium dodecyl sulfate (SDS) was added to the whole homogenate fraction to give a final concentration of 5% and heated at 950C for 5 minutes.
Protein Determination. Protein concentrations of individual samples were determined (four technical repeats) by a micro bicinchoninic acid protein assay (23235, Pierce/ThermoFisher Scientific).
- 1-D Electrophoresis and Western Blotting.
Aliquots containing 30 micrograms of total protein in 30 microliters of SDS sample buffer were used for SDS gel electrophoresis and Western blotting [24]. Proteins were transferred from polyacrylamide gels onto nitrocellulose membranes and membranes were stained with the Ponceau S solution 0.1% (w/v). To confirm successful transfer and uniform loading of the gel the stained membranes were next digitized and analyzed using LabWorks 4.0 (UVP). The membranes were destained with PBS+0.05% Tween 20. Where the difference between molecular weights of target proteins allowed simultaneous treatment of nitrocellulose membranes with different antibodies the membranes were cut according to the molecular weight standards in different parts and treated separately. The standard immunochemical staining was conducted with peroxidase labeled secondary antibodies and the Super-Signal West Pico Chemiluminescent substrate (Pierce, 34580). To achieve the linearity of response, the nitrocellulose membranes were exposed with intensifying screens to X-ray films, which had been pre-flashed with Sensitize (RPN2051, Amersham, Amersham, UK). The following antibodies were used: (1) For the quantitation of components of the oxidative phosphorylation system (OXPHOS), Total OXPHOS rodent WB antibody cocktail (ab110413, Abcam, UK), (2) Anti-NLRP3 antibody [EPR23094-1] (ab263899, Abcam, UK), (3) Anti-AIM2 antibody (ab119791, Abcam, UK), (4) Anti-Malondialdehyde antibody [11E3] (ab243066, Abcam, UK), (5) anti-synaptophysin (ab32127, Abcam, UK), (6) anti-SNAP25 (ab109105, Abcam, UK), (7) anti-syntaxin 1a (ab41453, Abcam, UK). The optical density of the respective protein bands was measured using LabWorks 4.0 (UVP). For the calibration of autoradiographs, we included four internal protein standards in each of the gels. These standards comprise the homogenate fraction isolated from the brain of control rats. The same standards were used in all experiments conducted; they contained 15, 30, 45, and 60 μg of total protein, respectively. For all studied proteins and in all brain regions optical densities were directly proportional to the amount of loaded proteins (Supplementary Figures S1-S15). The corresponding measures (Figure 1, Figure 2, Figure 3, Figure 4, Figure 5, Figure 6 and Figure 7) were obtained by dividing the individual optical band densities of a given sample (e.g., amygdala of noise-treated animals) by the optical density, which, from the calibration of the same autoradiograph, corresponded to 30 μg of total protein in the standard. The data obtained by this normalization are referred as the” relative amount” of protein. These densities of the respective protein bands were not normalized to any cellular housekeeping proteins, such as actin, since it cannot be assumed that such reference proteins remain unchanged under experimental conditions. Accordingly, to rule out any unreliability that might arise from normalization to housekeeping proteins [25,26], we consistently validate proper sample loading by Ponceau S staining as well as by the calibration with the mentioned protein standards.
2.4. EM Study. Perfusion and Brain Processing
EM studies were done immediately after 30 d of noise exposure. From each group, 4 animals were evaluated. For perfusion and brain processing, routine protocol, usually applied in our laboratory was used [22]. Briefly, following pentobarbital injection (100 mg/kg, IP), the rats underwent transcardiac perfusion with 0.9% NaCl, followed by 500 ml of 4% paraphormaldehyde and 2.5% glutaraldehyde in 0.1 M PB, pH – 7.4, at a perfusion pressure 120 mm Hg. The brains were removed from skull and placed in the same fixative overnight. The left hemispheric tissue blocks containing areas of interest were cut into 400 micron-thick coronal slices, washed in 0.1 M PB and post-fixed in 1% osmium tetroxide for 2 h. CNIC, BLA and CA1 area were identified with an optical microscope Leica MM AF, cut out from the slices, dehydrated in graded series of ethanol and acetone and embedded in araldite. From araldite blocks, 70–75 nm thick sections were prepared with an ultra-microtome Leica EM UC7. The sections were placed on 200- mesh copper grids, double-stained with uranyl-acetate and lead citrate and examined with JEM 1400 (JEOL, Japan). From each rat, every fifth section, totaling 10 sections were evaluated.
2.5. Statistical Analysis—Biochemical Study
The data for the CNIC, BLA and the hippocampal area were analyzed separately. One-way ANOVA with factor – “Treatment” was applied. In the case of significant effect an unpaired Student’s t-test was used unless stated differently. All statistical tests conducted were two-tailed and the differences reaching a significance level of at least p < 0.05 were reported. Throughout the manuscript, data on the figures are reported as mean± standard error of the mean (sem).
3. Results
3.1. Immunostaining
Antibodies against synaptophysin, SNAP25, syntaxin, AIM2 and NLRP reacted with protein bands of 34, 25, 33, 39 and 110 kDa respectively. A cocktail of antibodies against components of oxidative phosphorylation and ATP synthase F1 subunit alpha immunostained protein bands of 55, 48, 40, 30 and 20 kDa molecular weight corresponding to ATP5A, UQCRC2, MTCO, SDHB and NDUFB8 respectively. Antibodies against MDA reacted with different protein molecules (Figure 1, Figure 2, Figure 3, Figure 4, Figure 5, Figure 6 and Figure 7, Supplementary Figures S1-15). Four standards, 15, 30, 45, and 60 μg of homogenate protein corresponding to 0.5, 1.0, 1.5 and 2.0 relative amounts of protein, respectively, were loaded on each gel. For all studied proteins the optical densities of these internal standards were plotted against the amount of protein. For all measurements least-squares regression showed a perfect fit to a straight line (Supplementary Figures S1-S15).
3.2. Proteins Involved in Synaptic Vesicle Exocytosis—Long-Term Exposure to Loud Noise Induces Upregulation of Synaptophysin in the Hippocampal REGION
3.2.1. Synaptophysin
The effect of factor treatment was significant only in the hippocampal region (F1,15=22.96, P=0.001). The mean amount of synaptophysin was significantly higher in the noise-exposed group as compared to control (T=4.79, P=0.001, DF=14, Figure 1, For CNIC and BLA see Supplementary Figures S3, S4, Supplementary Table S1).
3.2.2. SNAP25 and Syntaxin
No significant effect of treatment was observed for either of this protein in brain regions studied (Supplementary Figures S5-S10, Supplementary Tables S2-S3).
3.3. Proteins Involved in Neuroinflammation—Long-Term Exposure to Loud Noise Increases the Level of These Proteins in CNIC and Decreases in BLA
3.3.1. AIM2
CNIC
The effect of treatment was significant (F1,11=7.65, P=0.02). The level of AIM2 in noise-exposed group was significantly higher as compared to control (T=2.77. P=0.020, DF=10, Figure 2).
BLA
The effect of treatment was significant (F1,11=34.28, P=0.0001). However, in comparing with CNIC, the difference is opposite: AIM2 protein level was less in noise-exposed group as compared to control (T=86, P=0.001, DF=10, Figure 3).
The Hippocampal Area
No differences were detected in the hippocampal area (Supplementary Figure S11, Supplementary Table S4)
3.3.2. NLRP3
CNIC
The amount of this inflammasome component was significantly affected by continuous loud noise (F1,11=21.42, P=0.001. In noise-exposed group, the level of NLRP3 was significantly higher as compared to control (T=4.63, P=0.001, DF=10, Figure 4).
BLA
The effect of noise exposure was significant (F1,11=6.14, P=0.033). The level of NLRP was higher in the control group (T=2.48, P=0.033, DF=10, Figure 5).
The Hippocampus
No significant differences were revealed in the hippocampal region (Supplementary Figure S12, Supplementary Table S12).
In conclusion: The proteins involved in neuroinflammation (components of inflammasome) are significantly changed after chronic noise exposure. These changes are opposite in CNIC and BLA: the level of proteins was increased in CNIC and decreased in BLA.
3.4. Long-Term Exposure to Loud Noise Increases the Level of MDA-Protein Adducts in CNIC
In all three regions several major and minor MDA-protein adducts were identified (Figure 6, Supplementary Figures S123, S134). Some of major MDA-protein adducts, by molecular range are similar between the brain regions (e.g. 42-44, 32, 26, 22-24 kDa protein bands).
CNIC
The effect of treatment was only significant in CNIC (F1,11=16.26, P=0.002): the total amount of MDA-protein adducts in noise-exposed group was significantly higher as compared to control (T=4.03, P=0.002, DF=10, Figure 6). Separate analysis of major MDA-protein adducts has shown that the MDA-protein adducts with the molecular weights 162, 89, 57, 50, 44, 26, 24, 21 kDa, are significantly increased in the CNIC of noise-exposed animals as compared to control (Figure 6, Supplementary Table S4).
3.5. Long-Term Exposure to Loud Noise Affects the Level of Proteins Involved in Oxidative Phosphorylation and ATP Synthase FoF1 Complex—Deficiency of Succinate Dehydrogenase Complex in the Hippocampal Area of Noise-Exposed Rats
Using a targeted approach, we inquired if there are any differences in the relative expression levels of respiratory chain complexes I, II, III, and IV or the ATP synthase FoF1 complex in the abovementioned brain regions of noise-exposed and control groups of rats. By a special antibody cocktail the following proteins were quantitatively assessed: (1) NADH: ubiquinone oxidoreductase subunit B8 (NDUFB8), complex I; (2) succinate dehydrogenase complex iron sulfur subunit B (SDHB), complex II; (3) ubiquinol-cytochrome C reductase core protein 2 (UQCRC2, alternate name cytochrome B-C1 complex subunit 2), complex III; (4) cytochrome c oxidase subunit 1 (MTCO1), complex IV; (5) ATPsynthase F1 subunit alpha (ATP5A). These proteins were selected for the following reason: they are labile components of the corresponding complexes when they are assembled. Therefore, the measurement of these subunits provides detailed information about the relative levels of individual complexes (https://www.abcam.com/total-oxphos-rodent-wb-antibody-cocktail-ab110413.html). The sample immunostaining pattern for CA1 region is provided on Figure 7A. The sample immunostaining patterns for CNIC and BLA are presented on Figures S14-S15.
3.5.1. ATP5A, UQCRC2, MTCO1 and NDUFB8
No significant effects were detected in either brain region studied. No differences were observed between the groups.
3.5.2. SDHB
The effect of treatment was significant only in hippocampus (F,1,11=12.56, P=0.006): the level of SDHB was significantly decreased in noise-exposed rats (T=6,28, P=0,001, DF=10, Figure 7B).
3.6. EM Study—Long-Term Exposure to Loud Noise Affects the Ultrastructure of CNIC, BLA and the Hippocampus
In comparing with control, in CNIC of noise-exposed animals, 16% of cells (a total of 98 were analyzed), namely medium- and large-sized disk-shaped neurons, were damaged. In 9% of such cells, the modifications were moderate and included slightly diluted components of endoplasmic reticulum and Golgi complex, mitochondria with partially destructed cristae, or small myelin-/membrane-like cytoplasmic inclusions. In some neurons mild chromatolysis – reactive changes in perikaryon of injured neuron, involving the rearrangement of rough endoplasmic reticulum and polyribosomes – were observed. In other 7% of modified neurons substantial pathologies, like apoptosis (identified by shrinkage of cell, nuclear fragmentation and phagocytosis by glial cells) (Figure 8A), central chromatolysis (injured cells, which never may again synthesize normal level of proteins, or may be atrophied and died) (Figure 8B), neurons with electron lucent cytoplasm and nucleus, significantly destroyed cytoplasmic organelles, large vacuoles, myelin-like cytoplasmic inclusions, or even the signs of cell autophagy were identified. Presynaptic terminals of some axo-dendritic synapses were swollen or contained slightly destructed mitochondria. Some astrocytes were slightly swollen, contained small pathological inclusions or somewhat damaged organelles. In a few cases, the processes resembling dark microglia and signs of autophagy were observed. In comparing with control, demyelinated axons were relatively common (Figure 8C).
In BLA of noise-exposed rats, approximately 11% of cells (a total of 89 were analyzed), mostly pyramidal neurons, were modified. About 6% of such cells were significantly damaged. Specifically, apoptosis, neurons with destructed mitochondria or other organelles or neurons with neurons with electron lucent cytoplasm and nucleus were found (Figure 9A). In others, moderate modifications (mild chromatolysis, moderate widening of components of endoplasmic apparatus and Golgi body, slightly damaged mitochondria, small vacuoles or small myelin/membrane-like inclusions) were identified. Swollen presynaptic terminals and altered astrocytes were relatively rare (Figure 9B).
In the hippocampal CA1 area, 97 cells were analyzed. 8% of such cells – mostly pyramidal neurons - showed pathologies, but substantial changes were detected only in 4% of modified cells. The modifications were similar to those observed in CNIC and BLA but altered mitochondria were relatively numerous (Figure 8 F).
4. Discussion
Earlier we reported that 10 d intermittent exposures to chronic intensive noise provokes measurable morphological alterations in mitochondria, synaptic vesicles and porosome complex of auditory and limbic regions of rat and cat brain [22,27]. Therefore, we had suggested that chronic noise alters the level of proteins involved in neurotransmission, inflammation and oxidative stress. The present study was performed in order to demonstrate if 30 d exposure to chronic loud noise affects (i) the level of such proteins, and (ii) the ultrastructure of auditory classical and limbic regions of brain. Our biochemical and EM data convincingly demonstrate region-specific changes of proteins. In all brain areas mostly principal/projection cells were damaged. Therefore, we propose that the main alterations develop in projective pathways, which bi-directionally connect cortical and subcortical auditory and other structures. In CNIC, BLA and the hippocampal CA1 area, non-specific alterations that are usually observed in different types of neurological pathologies were detected. As we expected, the most noticeable modifications were found in classical component of auditory system, CNIC. The second region was BLA, limbic structure, which receives multiple sensory signals, including auditory stimuli. The most preserved was the hippocampus. The data indicate that 30 d exposure to extensive noise produces more significant structural abnormalities than 10 d noise. This is in accordance with suggestion that the noise-associated changes significantly depend from the duration of noise exposure [28,29]. The discussion of data is done bellow.
4.1. Biochemical Alterations
4.1.1. Synaptic Vesicles
We have studied quantitative changes in three proteins involved in different aspects of synaptic vesicle exocytosis and recycling: SNAP25, syntaxin 1 and synaptophysin. These proteins are known to be differently distributed between synaptic vesicles and synaptic plasma membranes: SNAP25 and syntaxin 1 are synaptic plasma membrane proteins, whereas synaptophysin is a major constituent of synaptic vesicular membranes, regardless of the identity of neurotransmitter [30]. Significant alterations were revealed only for synaptophysin, the amount of which was increased in the hippocampal CA1 area of noise-exposed animals. In general, biochemical findings suggest that chronic loud noise augments neurotransmission in the hippocampal CA1 area. Our early EM data also suggest the effect of noise on neurotransmission. Specifically, using the same experimental paradigm, we noticed only moderate effect of 10 d intermittent loud noise on the ultrastructure of the hippocampus. However, measurable changes in different components of synapses, namely, significant increase of the area of presynaptic mitochondria was noticed [22]. In the present study, in the hippocampus relatively numerous swollen presynaptic terminals have been detected. This may be indicative to the altered neurotransmission. It is noteworthy that according modern data, noise-induced hearing loss is associated with the changes in gene expression in cochlea. One of the candidate genes is SV2A – synaptic vesicle glycoprotein 2A, which is involved in the regulation of neurotransmitter release [31].
4.1.2. Neuroinflammation
According to our data, continuous loud noise significantly affects the expression of the inflammasome components. These effects vary in different brain regions. Namely, in the CNIC the expression of such components is increased, whereas in BLA the expression is decreased. Generally, inflammasomes are considered as the central regulators of innate immunity, involved in the host defense against stress conditions [32]. Any significant deviation (up- or down-regulation) from the normal levels of its components could be considered as pathological or compensatory conditions. Excessive or prolonged inflammasome activation can contribute to damaging and destructive environment, resulting in the development of inflammatory disorders, including neurodegenerative diseases [32,33]. Based on above-mentioned mechanisms, we propose that prolonged exposure to loud noise results in long-term inflammation and the increase of the components of inflammasome in the CNIC. Our studies of increased level of MDA protein adduct in this zone support this view (see below). On the contrary, the decrease in the components of inflammasome is known to have a beneficial effect on the cell loss after status epilepticus [SE]. For example, the knock down of NLRP3 significantly decreases neuronal loss in the CA1 and CA3 areas of the hippocampus at 6 weeks after SE [34]. Therefore, the decrease in the AIM2 and NLRP3 in the BLA may be considered as a compensatory response, which could counteract the detrimental effects of noise in this area of the brain.
4.1.3. MDA-Protein Adducts
Significant changes in MDA-protein adducts are detected only in CNIC. This parallels the upregulation of inflammasome components in the same region. Western blot analysis indicates that increased MDA-protein adducts are detected for defined protein molecules and is not ubiquitous for all modified proteins. MDA may serve as a hapten to form neoantigens and evoke immunological response mechanisms. This process may represent a pathway by which lipid peroxidation could produce tissue damage via an immune mechanism [35]. Therefore, elevated MDA protein adducts in the CNIC after noise exposure may lead to the increased neuroinflammation and inflammasome activity, which is documented by observed expression of inflammasome components - NLRP3 and AIM.
4.1.4. Mitochondria
From the brain regions studied, only in the hippocampal area significant changes were detected by the panel of antibodies for the evaluation of OXPHOS levels. The expression of SDHB is decreased after exposure to noise. These changes indicate the decreased functioning of succinate dehydrogenase complex. Recently it was shown that the inhibition of mitochondrial complex II in neuronal cells, leads to autophagy and neurodegeneration [36]. We cannot rule out the possibility of other changes in mitochondrial proteome. In the hippocampus and neocortex of mouse model of Rett syndrome, no changes were observed by the panel of antibodies used in this study, though the levels of numerous mitochondrial proteins are altered [24]. The processes of synaptic plasticity including memory are associated with the increased expression of components of oxidative phosphorylation, other components of mitochondrial proteome and elevated mitochondrial dynamics [26,37,38]. EM analysis also shows altered mitochondria in all three regions, including the hippocampal CA1 area. Based on above mentioned finding, we propose that the exposure to chronic loud noise could lead to perturbation of synaptic plasticity processes by mitochondrial damage.
4.1.5. Possible Сross Talk Between Neuroinflammation, Lipid Peroxidation and Mitochondrial Dysfunction After Chronic Exposure to Loud Noise Could Lead to the Major Pathological Changes
Based on biochemical results, we propose that in addition to apoptosis [22,39,40,41], one of the major consequences of prolonged loud noise in defined brain regions may be ferroptosis. Ferroptosis, an iron-dependent form of non-apoptotic cell death, is often associated with neurological disorders [42,43]. Ferroptosis is closely links two pathological processes - oxidative stress and inflammatory responses, connected with iron and lipid metabolism [44,45]. The activation of inflammation through the stimulation of multiple inflammation-related signaling pathways, leads to ferroptosis [46]. Particularly interesting might be the vulnerabilities of mitochondria, as mitochondria associative ROS-production and metabolic changes are mandatory for ferroptosis [47,48]. Indeed, our biochemical results indicate to the deficit of SCDH complex after repeated loud noise exposure, which could lead to profound changes in mitochondrial metabolism. Our EM data might be another, indirect confirmation of potential involvement of ferroptosis in noise induced pathologies. Namely, the most notable EM features of ferroptotic cells are the changes in mitochondrial morphology. For example, such cells typically often possess shrunken mitochondria with creased membrane density [49]. Different types of damaged mitochondria are often found in our material. Additional hallmark of ferroptotic cells is electron lucent nucleus and cytoplasm, possible defect of cytoplasm integrity [50,51]. The same type of pathologies is a common feature of necroptosis [50,52]. However, another EM peculiarity of necroptosis, diluted perinuclear space, was not detected in our material. One more indirect indication of the involvement of ferroptosis could be the presence of the signs of autophagy [53,54]. Recent studies indicate to the link between autophagy and ferroptosis [47,55,56]. Moreover, the crosstalk between autophagy and ferroptosis is considered as a potential therapeutic target for auditory and some other pathologies. However, the mechanism of such interrelation still remains to be determined [53,56,57]. The contribution of glia is crucial in mediating iron toxicity [35,58]. However, reaction of glia, observed in our material, could not be considered as a glial response to noise as it is common for different types of pathologies. Of special interest was the presence of dark processes, resembling “dark” microglia, in classical auditory region, CNIC. This type of microglia, the sign of cellular stress, is believed to be more active than “usual” microglia [58,59,60,61].
In general, our data indicate that chronic exposure to loud noise leads to different morphological and biochemical changes in auditory and limbic brain regions of adult male Wistar rats. Most of the changes may lead to the pathological processes impairing synaptic plasticity and normal functioning of the brain.
Supplementary Materials
The following supporting information can be downloaded at the website of this paper posted on Preprints.org: Supplementary Figure S1. Calibration plots of optical density of internal standards with the amount of loaded protein for: A-Synaptophysin, Hippocampus; B-AIM2, CNIC; C-AIM2, BLA and D-NLRP3, CNIC. Supplementary Figure S2. Calibration plots of optical density of internal standards with the amount of loaded protein for: A-NLRP3, BLA; B-MDA-protein adducts, CNIC and C- SDHB, CA1. Supplementary Figure S3. Western blot image (A) calibration plot (B) and mean relative amounts ±sem of Synaptophysin in BLA in control and noise-exposed groups of male Wistar rats (C). Supplementary Figure S4. Western blot image (A) calibration plot (B) and mean relative amounts±sem of Synaptophysin in CNIC in control and noise-exposed groups of male Wistar rats (C). Supplementary Figure S5. Western blot image (A) calibration plot (B) and mean relative amounts ±sem of SNAP25 in CA1 in control and noise-exposed groups of male Wistar rats (C). Supplementary Figure S6. Western blot image (A) calibration plot (B) and mean relative amounts ±sem of SNAP25 in BLA in control and noise-exposed groups of male Wistar rats (C). Supplementary Figure S7. Western blot image (A) calibration plot (B) and mean relative amounts ±sem of SNAP25 in CNIC in control and noise-exposed groups of male Wistar rats (C). Supplementary Figure S8. Western blot image (A) calibration plot (B) and mean relative amounts ±sem of Syntaxin1a in CA1 in control and noise-exposed groups of male Wistar rats (C). Supplementary Figure S9. Western blot image (A) calibration plot (B) and mean relative amounts ±sem of Syntaxin1a in BLA in control and noise-exposed groups of male Wistar rats (C). Supplementary Figure S10. Western blot image (A) calibration plot (B) and mean relative amounts ±sem of Syntaxin1a in CNIC in control and noise-exposed groups of male Wistar rats (C). Supplementary Figure S11. Western blot image (A) calibration plot (B) and mean relative amounts ±sem of AIM2 in CA1 in control and noise-exposed groups of male Wistar rats (C). Supplementary Figure S12. Western blot image (A) calibration plot (B) and mean relative amounts ±sem of NLRP3 in CA1 in control and noise-exposed groups of male Wistar rats (C). Supplementary Figure S13. Western blot image (A) calibration plot (B) and mean relative amounts ±sem of MDA-protein adducts in BLA in control and noise-exposed groups of male Wistar rats (C). Supplementary Figure S14. Western blot image (A) calibration plot (B) and mean relative amounts ±sem of MDA-protein adducts in CA1 in control and noise-exposed groups of male Wistar rats (C). Supplementary Figure S15. Western blot image (A) calibration plot (B) and mean relative amounts ± sem of components of mitochondrial oxidative phosphorylation and ATP synthase F1 subunit alpha in CNIC in control and noise-exposed groups of male Wistar rats (C). Supplementary Figure S16. Western blot image (A) calibration plot (B) and mean relative amounts ± sem of components of mitochondrial oxidative phosphorylation and ATP synthase F1 subunit alpha in BLA in control and noise-exposed groups of male Wistar rats (C). Supplementary Table-S1. Mean relative amounts of Synaptophysin in CNIC, Hippocampus and BLA. Supplementary Table S2. Mean relative amounts of SNAP25 in CNIC, Hippocampus and BLA. Supplementary Table S3. Mean relative amounts of Syntaxin in CNIC, Hippocampus and BLA. Supplementary Table S4. Mean relative amounts of AIM2 and NLRP3 in CNIC, Hippocampus and BLA. Supplementary Table S5. Mean relative amounts of different MDA-Protein adducts in IC. Figure S1: title; Table S1: title;
Author Contributions
Conceptualization, M.Z.; methodology, R.S. and M.Z; software, L.C. and L.T.; validation, N.J. and G.L.; formal analysis, N.P., L.C. and L.T.; investigation, F.R. and E.G.; resources, M.Z, and R.S.; data curation, N.P. and G.L.; writing - original draft preparation, M.Z, and R.S.; writing - review and editing, M.Z, and R.S.; visualization, F.R. and E.G.; supervision, M.Z, and R.S.; project administration, M.Z.; funding acquisition, M.Z. All authors have read and agreed to the published version of the manuscript.
Funding
This research was funded by Shota Rustaveli National Science Foundation. Project # FR-21-1501.
Data Availability Statement
The original contributions presented in this study are included in the article/supplementary material. Further inquiries can be directed to the corresponding authors.
Conflicts of Interest
The authors declare no competing interests.
References
- Krenz, K., Dhanani, A., McEachan, R.R.C., Sohal, K., Wright, J., Vaughan, L. Linking the Urban Environment and Health: An Innovative Methodology for Measuring Individual-Level Environmental Exposures. Int. J. Environ. Res. Public Health. 2023, 20;20(3):1953. [CrossRef]
- Le Prell, C.G., Clavier, O.H., Bao, J. Noise-induced hearing disorders: Clinical and investigational tools. J. Acoust. Soc. Am. 2023, 153(1):711. [CrossRef]
- Kempen, E.V., Casas, M., Pershagen, G., Foraster, M. WHO Environmental Noise Guidelines for the European Region: A Systematic Review on Environmental Noise and Cardiovascular and Metabolic Effects: A Summary. Int. J. Environ. Res. Public Health. 2018, 22;15(2):379. [CrossRef]
- Münzel, T., Daiber, A., 2013. Vascular Redox Signaling, Endothelial Nitric Oxide Synthase Uncoupling, and Endothelial Dysfunction in the Setting of Transportation Noise Exposure or Chronic Treatment with Organic Nitrates. Antioxid. Redox Signal. 2013, 13-15, 1001-1021. [CrossRef]
- Arjunan, A., Rajan, R. Noise and brain. Physiol. Behav. 2020, Dec 1;227:113136. [CrossRef]
- Cho, I., Kim, J., Jung, S., Kim, S.Y., Kim, E.J., Choo, S., Kam, E.H., Koo, B.N. The Impact of Persistent Noise Exposure under Inflammatory Conditions. Healthcare (Basel). 2023, Jul 19;11(14):2067. [CrossRef]
- Almasabi, F., van Zwieten, G., Alosaimi, F., Smit, J.V., Temel, Y., Janssen, M.L.F., Jahanshahi, A., 2022. The Effect of Noise Trauma and Deep Brain Stimulation of the Medial Geniculate Body on Tissue Activity in the Auditory Pathway. Brain Sci. 2020, Aug 18;12(8):1099. [CrossRef]
- Natarajan, N., Batts, S., Stankovic, K.M. Noise-Induced Hearing Loss. J. Clin. Med. 2023, 17;12(6):2347. [CrossRef]
- Aime, M., Augusto, E., Kouskoff, V., Campelo, T., Martin, C., Humeau, Y., Chenouard, N., Gambino, F. The integration of Gaussian noise by long-range amygdala ininputs in frontal circuit promotes fear learning in mice. Elife. 2020 Nov 30;9:e62594. [CrossRef]
- McLachlan, N.M., Wilson, S.J. The Contribution of Brainstem and Cerebellar Pathways to Auditory Recognition. Front. Psychol. 2017, 20;8:265. [CrossRef]
- Oberle, H.M., Ford, A.N., Czarny, J.E., Rogalla, M.M., Apostolidis, P.F. Recurrent Circuits Amplify Corticofugal Signals and Drive Feedforward Inhibition in the Inferior Colliculus. J. Neurosci. 2023, 43, 5642-5655. [CrossRef]
- Gruene, T., Flick. K., Rendall, S., Cho, J.H., Gray, J., Shansky, R. Activity-dependent structural plasticity after aversive experiences in amygdala and auditory cortex pyramidal neurons. Neuroscience, 2016, 22;328:157-64. [CrossRef]
- Tempest, G.D., Parfitt, G. Prefrontal oxygenation and the acoustic startle eye blink response during exercise: A test of the dual-mode model. Psychophysiology, 2017, 54, 1070-1080. [CrossRef]
- Asokan, M.M., Watanabe, Y., Kimchi, E.Y., Polley, D.B. Potentiated cholinergic and corticofugal inputs support reorganized sensory processing in the basolateral amygdala during auditory threat acquisition and retrieval. bioRxiv [Preprint]. 2023, Feb 2:2023.01.31.526307. [CrossRef]
- Billig, A.J., Lad, M., Sedley, W., Griffiths, T.D. The hearing hippocampus. Prog. Neurobiol. 2022, Nov;218:102326. [CrossRef]
- Cusinato, R., Alnes, S.L, van Maren, E., Boccalaro, I., Ledergerber, D., Adamantidis, A., Imbach, L.L., Schindler, K., Baud, M.O., Tzovara, A. Intrinsic Neural Timescales in the Temporal Lobe Support an Auditory Processing Hierarchy. J. Neurosci. 2023, 17, 3696-3707. [CrossRef]
- Jena, B.P. Role of SNAREs in membrane fusion. Adv. Exp. Med. Biol. 2011, 713, 13-32. [CrossRef]
- Rizo, J. Molecular Mechanisms Underlying Neurotransmitter Release. Annu. Rev. Biophys. 2022, 51, 377-408. [CrossRef]
- Platnich, J.M., Muruve, D.A. NOD-like receptors and inflammasomes: A review of their canonical and non-canonical signaling pathways. Arch. Biochem. Biophys. 2019, 30, 4-14. [CrossRef]
- Wang, W., Zhang, L.S., Zinsmaier, A.K., Patterson, G., Leptich, E.J., Shoemaker, S.L, Yatskievych, T.A., Gibboni, R., Pace, E., Luo, H., et al. Neuroinflammation mediates noise-induced synaptic imbalance and tinnitus in rodent models. PLoS Biol. 2019, 17(6):e3000307. [CrossRef]
- Gogokhia, N., Japaridze, N., Tizabi, Y., Pataraya, L., Zhvania, M.G. Gender differences in anxiety response to high intensity white noise in rats. Neurosci. Lett. 2021, Jan 18;742:135543. [CrossRef]
- Zhvania, M., Gogokhia, N., Tizabi, Y., Japaridze, N., Pochkidze, N., Lomidze, N., Rzayev, F., Gasimov E. Behavioral and neuroanatomical effects on exposure to White noise in rats. Neurosci. Lett. 2020, 29;728:134898. [CrossRef]
- Paxinos, G. and Watson, C. (2006) The Rat Brain in Stereotaxic Coordinates. Sixth Edition, Academic Press, Cambridge.
- Golubiani, G., van Agen, L., Tsverava, L., Solomonia, R., Müller, M. Mitochondrial Proteome Changes in Rett Syndrome. Biology (Basel). 2023, Jul 3;12(7):956. [CrossRef]
- Dittmer, A., Dittmer, J. Beta-actin is not a reliable loading control in Western blot analysis. Electrophoresis. 2006, 27, 2844-5. [CrossRef]
- Meparishvili, M., Nozadze, M., Margvelani, G., McCabe, B.J., Solomonia, R.O. A Proteomic Study of Memory After Imprinting in the Domestic Chick. Front. Behav. Neurosci. 2015, 9:319. [CrossRef]
- Pochkhidze, N., Gogokhia, N., Japaridze, N., Lazrishvili, I., Bikashvili, T., Zhvania, M.G. 2021. Electron microscopy demonstrating noise exposure alters synaptic vesicle size in the inferiorcolliculus of cat. Noise Health. 2021, 23, 51-56. [CrossRef]
- Rogers, C.M., Palmerton, H., Saway, B., Tomlinson, D., Simonds, G. Effect of Various OR Noise on Fine Motor Skills, Cognition, and Mood. Surg. Res. Pract. 2019, Jul 4;2019:5372174. [CrossRef]
- Thompson, R., Smith, R.B., Bou Karim, Y., Shen, C., Drummond, K., Teng, C., Toledano, M.B. Noise pollution and human cognition: An updated systematic review and meta-analysis of recent evidence. Environ. Int. 2022, Jan;158:106905. [CrossRef]
- Bera, M., Radhakrishnan, A., Coleman, J., Venkat, R., Sundara, K., R.V., Ramakrishnan, S., Pincet, F., Rothma, J.E. Synaptophysin chaperones the assembly of 12 SNAREpins under each ready-release vesicle. Proc. Natl. Acad. Sci. USA. 2023, Nov 7;120(45):e2311484120. Epub 2023 Oct 30. Erratum in: Proc Natl Acad Sci U S A. 2024 Feb 6;121(6):e2400216121. doi: 10.1073/pnas.2400216121. [CrossRef]
- Lavinsky, J., Kasperbauer, G., Bento, R.F., Mendonca, A., Wang, J., Crow, A.L., Allayee, H., Friedman R.A. Noise exposure and distortion product otoacoustic emission suprathreshold amplitudes: a genome-wide association study. Audiol. Neurootol. 2021, 26, 1–9. [CrossRef]
- Voet S, Srinivasan S, Lamkanfi M, van Loo G. Inflammasomes in neuroinflammatory and neurodegenerative diseases. EMBO Mol Med. 2019 Jun;11(6):e10248. [CrossRef]
- Lamkanfi, M., Dixit, V.M. Inflammasomes and their roles in health and disease. Annu. Rev. Cell. Dev. Biol. 2012, 28, 137-61. [CrossRef]
- Meng, X.F., Tan, L., Tan, M.S., Jiang, T., Tan, C.C., Li, M.M., Wang, H.F., Yu, J.T. Inhibition of the NLRP3 inflammasome provides neuroprotection in rats following amygdala kindling-induced status epilepticus. J. Neuroinflammation. 2014, 17;11:212. [CrossRef]
- Liang, P., Zhang, X., Zhang, Y., Wu, Y., Song, Y., Wang, X., Chen, T., Liu, W., Peng, B., Yin, J., et al. Neurotoxic A1 astrocytes promote neuronal ferroptosis via CXCL10/CXCR3 axis in epilepsy. Free Radic. Biol. Med. 2023, 195, 329-342. [CrossRef]
- Ranganayaki, S., Jamshidi, N., Aiyaz, M., Rashmi, S.K., Gayathri, N., Harsha, P.K., Padmanabhan, B., Srinivas Bharath, M.M. Inhibition of mitochondrial complex II in neuronal cells triggers unique pathways culminating in autophagy with implications for neurodegeneration. Sci. Rep. 2021, 11(1):1483. [CrossRef]
- Solomonia, R.O., Kunelauri, N., Mikautadze, E., Apkhazava, D., McCabe, B.J., Horn, G. Mitochondrial proteins, learning and memory: biochemical specialization of a memory system. Neuroscience. 2011, 194, 112-23. [CrossRef]
- Margvelani, G., Meparishvili, M., Tevdoradze, E., McCabe, B.J., Solomonia, R. Mitochondrial fusion and fission proteins and the recognition memory of imprinting in domestic chicks. Neuroreport 2018, 29,128-133. [CrossRef]
- Chen, D., Jia, G., Zhang, Y., Mao, H., Zhao, L., Li, W., Chen, Y., Ni, Y. Sox2 overexpression alleviates noise-induced hearing loss by inhibiting inflammation-related hair cell apoptosis. J. Neuroinflammation. 2022, Feb 28;19(1):59. [CrossRef]
- Op de Beeck, K., Schacht, J., Van Camp, G. Apoptosis in acquired and genetic hearing impairment: the programmed death of the hair cell. Hear Res. 2011, 281, 18-27. [CrossRef]
- Wu, J., Ye. J., Kong. W., Zhang, S. Zheng, Y. Programmed cell death pathways in hearing loss: A review of apoptosis, autophagy and programmed necrosis. Cell Prolif. 2020, Nov;53(11):e12915. [CrossRef]
- Oshitari, T. Neurovascular Cell Death and Therapeutic Strategies for Diabetic Retinopathy. Int. J. Mol. Sci. 2023, 24(16):12919. [CrossRef]
- Tang, D., Ch. X., Kang, R., Kroemer, G. Ferroptosis: molecular mechanisms and health implications. Cell Res. 2020, 31, 107-125. [CrossRef]
- Guha, L., Singh, N., Kumar, H. Different Ways to Die: Cell Death Pathways and Their Association with Spinal Cord Injury. Neurospine. 2023, 20, 430-448. [CrossRef]
- Hu, X., Xu, Y., Xu, H., Jin, C., Zhang, H., Su, H., Li, Y., Zhou, K., Ni, W. Progress in Understanding Ferroptosis and Its Targeting for Therapeutic Benefits in Traumatic Brain and Spinal Cord Injuries. Front. Cell. Dev. Biol. 2021, 4;9:705786. [CrossRef]
- Chen, Y., Fang, Z.M., Yi, X., Wei, X., Jiang, D.S. The interaction between ferroptosis and inflammatory signaling pathways. Cell Death Dis. 2023, Mar 21;14(3):205. [CrossRef]
- Liu, S., Gao, X., Zhou, S., 2020. New Target for Prevention and Treatment of Neuroinflammation: Microglia Iron Accumulation and Ferroptosis. ASN Neuro. 2020, 14:17590914221133236. [CrossRef]
- Wang, Z.L., Yuan L., Li. W., Li, J.Y. Ferroptosis in Parkinson's disease: glia-neuron crosstalk. Trends Mol, Med. 2022, 28, 258-269. [CrossRef]
- Dixon, S.J, Lemberg, K.M., Lamprecht, M.R., Skouta, R., Zaitsev, E.M., Gleason, C.E., Patel, D.N., Bauer, A.J., Cantley, A.M., Yang, W.S. et al. Ferroptosis: an iron-dependent form of nonapoptotic cell death. Cell. 2012, 149, 1060-72. [CrossRef]
- Costigan, A., Hollville, E., Martin, S.J., 2023. Discriminating Between Apoptosis, Necrosis, Necroptosis, and Ferroptosis by Microscopy and Flow Cytometry. Curr. Protoc. 2023, Dec;3(12):e951. [CrossRef]
- Tan, X., He, Y., Yu, P., Deng, Y., Xie, Z., Guo, J., Hou, Q., Li, P., Lin, X., Ouyang, S. et al. The dual role of FSP1 in programmed cell death: resisting ferroptosis in the cell membrane and promoting necroptosis in the nucleus of THP-1 cells. Mol. Med. 2024, Jul 15;30(1):102. [CrossRef]
- Miyake, S., Murai, S., Kakuta, S., Uchiyama, Y., Nakano, H. Identification of the hallmarks of necroptosis and ferroptosis by transmission electron microscopy. Biochem. Biophys.Res. Commun. 2020, 527, 839-844. [CrossRef]
- Jian, B., Pang, J., Xiong, H., Zhang, W., Zhan, T., Su, Z., Lin, H., Zhang, H., He, W., Zheng, Y. Autophagy-dependent ferroptosis contributes to cisplatin-induced hearing loss. Toxicol. Lett. 2021, 10, 249-260. [CrossRef]
- Tisato, V., Castiglione, A., Ciorba, A., Aimoni, C., Silva, J.A., Gallo, I., D'Aversa, E., Salvatori, F., Bianchini, C., Pelucchi, S. et al. LINE-1 global DNA methylation, iron homeostasis genes, sex and age in sudden sensorineural hearing loss (SSNHL). Hum. Genomics. 2023, 17(1):112. [CrossRef]
- Gao, W., Wang, X., Zhou, Y., Wang, X., Yu, Y. Autophagy, ferroptosis, pyroptosis, and necroptosis in tumor immunotherapy. Sig. Transduct. Target Ther. 2023, Jun 20;7(1):196. [CrossRef]
- Liu, C., Li, Z., Li, B., Liu, W., Zhang, S., Qiu, K., Zhu, W. Relationship between ferroptosis and mitophagy in cardiac ischemia reperfusion injury: a mini-review. PeerJ. 2023, Mar 13;11:e14952. [CrossRef]
- Sun, Y., Zou, S., He, Z., Chen, X. The role of autophagy and ferroptosis in sensorineural hearing loss. Front. Neurosci. 2022, 16:1068611. [CrossRef]
- Wang J, He W, Zhang J. A richer and more diverse future for microglia phenotypes. Heliyon. 2023, Mar 21;9(4):e14713. [CrossRef]
- Bisht, K., Sharma, K.P., Lecours, C., Sánchez, M.G., El Hajj, H., Milior, G., Olmos-Alonso, A., Gómez-Nicola, D., Luheshi, G., Vallières L.et al. Auditory cortex shapes sound responses in the inferior colliculus. Elife. 2020, Jan 31;9:e51890. [CrossRef]
- Flury, A., Aljayousi, L, Park HJ, Khakpour M, Mechler J, Aziz S, McGrath JD, Deme P, Sandberg C, González Ibáñez F, et al. A neurodegenerative cellular stress response linked to dark microglia and toxic lipid secretion. Neuron. 2025 Feb 19;113(4):554-571.e14. [CrossRef]
- St-Pierre, M.K., Bordeleau, M., Tremblay, M.È. Visualizing Dark Microglia. Methods Mol. Biol. 2019, 2034, 97-110. [CrossRef]
Figure 1.
Western blot image (A) and mean relative amounts ± sem of synaptophysin in CNIC of control and noise-exposed groups of male Wistar rats (B). Film contains 16 experimental samples; A: lanes 1-8 control group; lanes 9-16 white noise group. IS1-IS4 internal standards, containing 15, 30, 45, and 60 μg protein corresponding to 0.5, 1.0, 1.5 and 2.0 relative amounts of protein. The difference is significant (P=0.001).
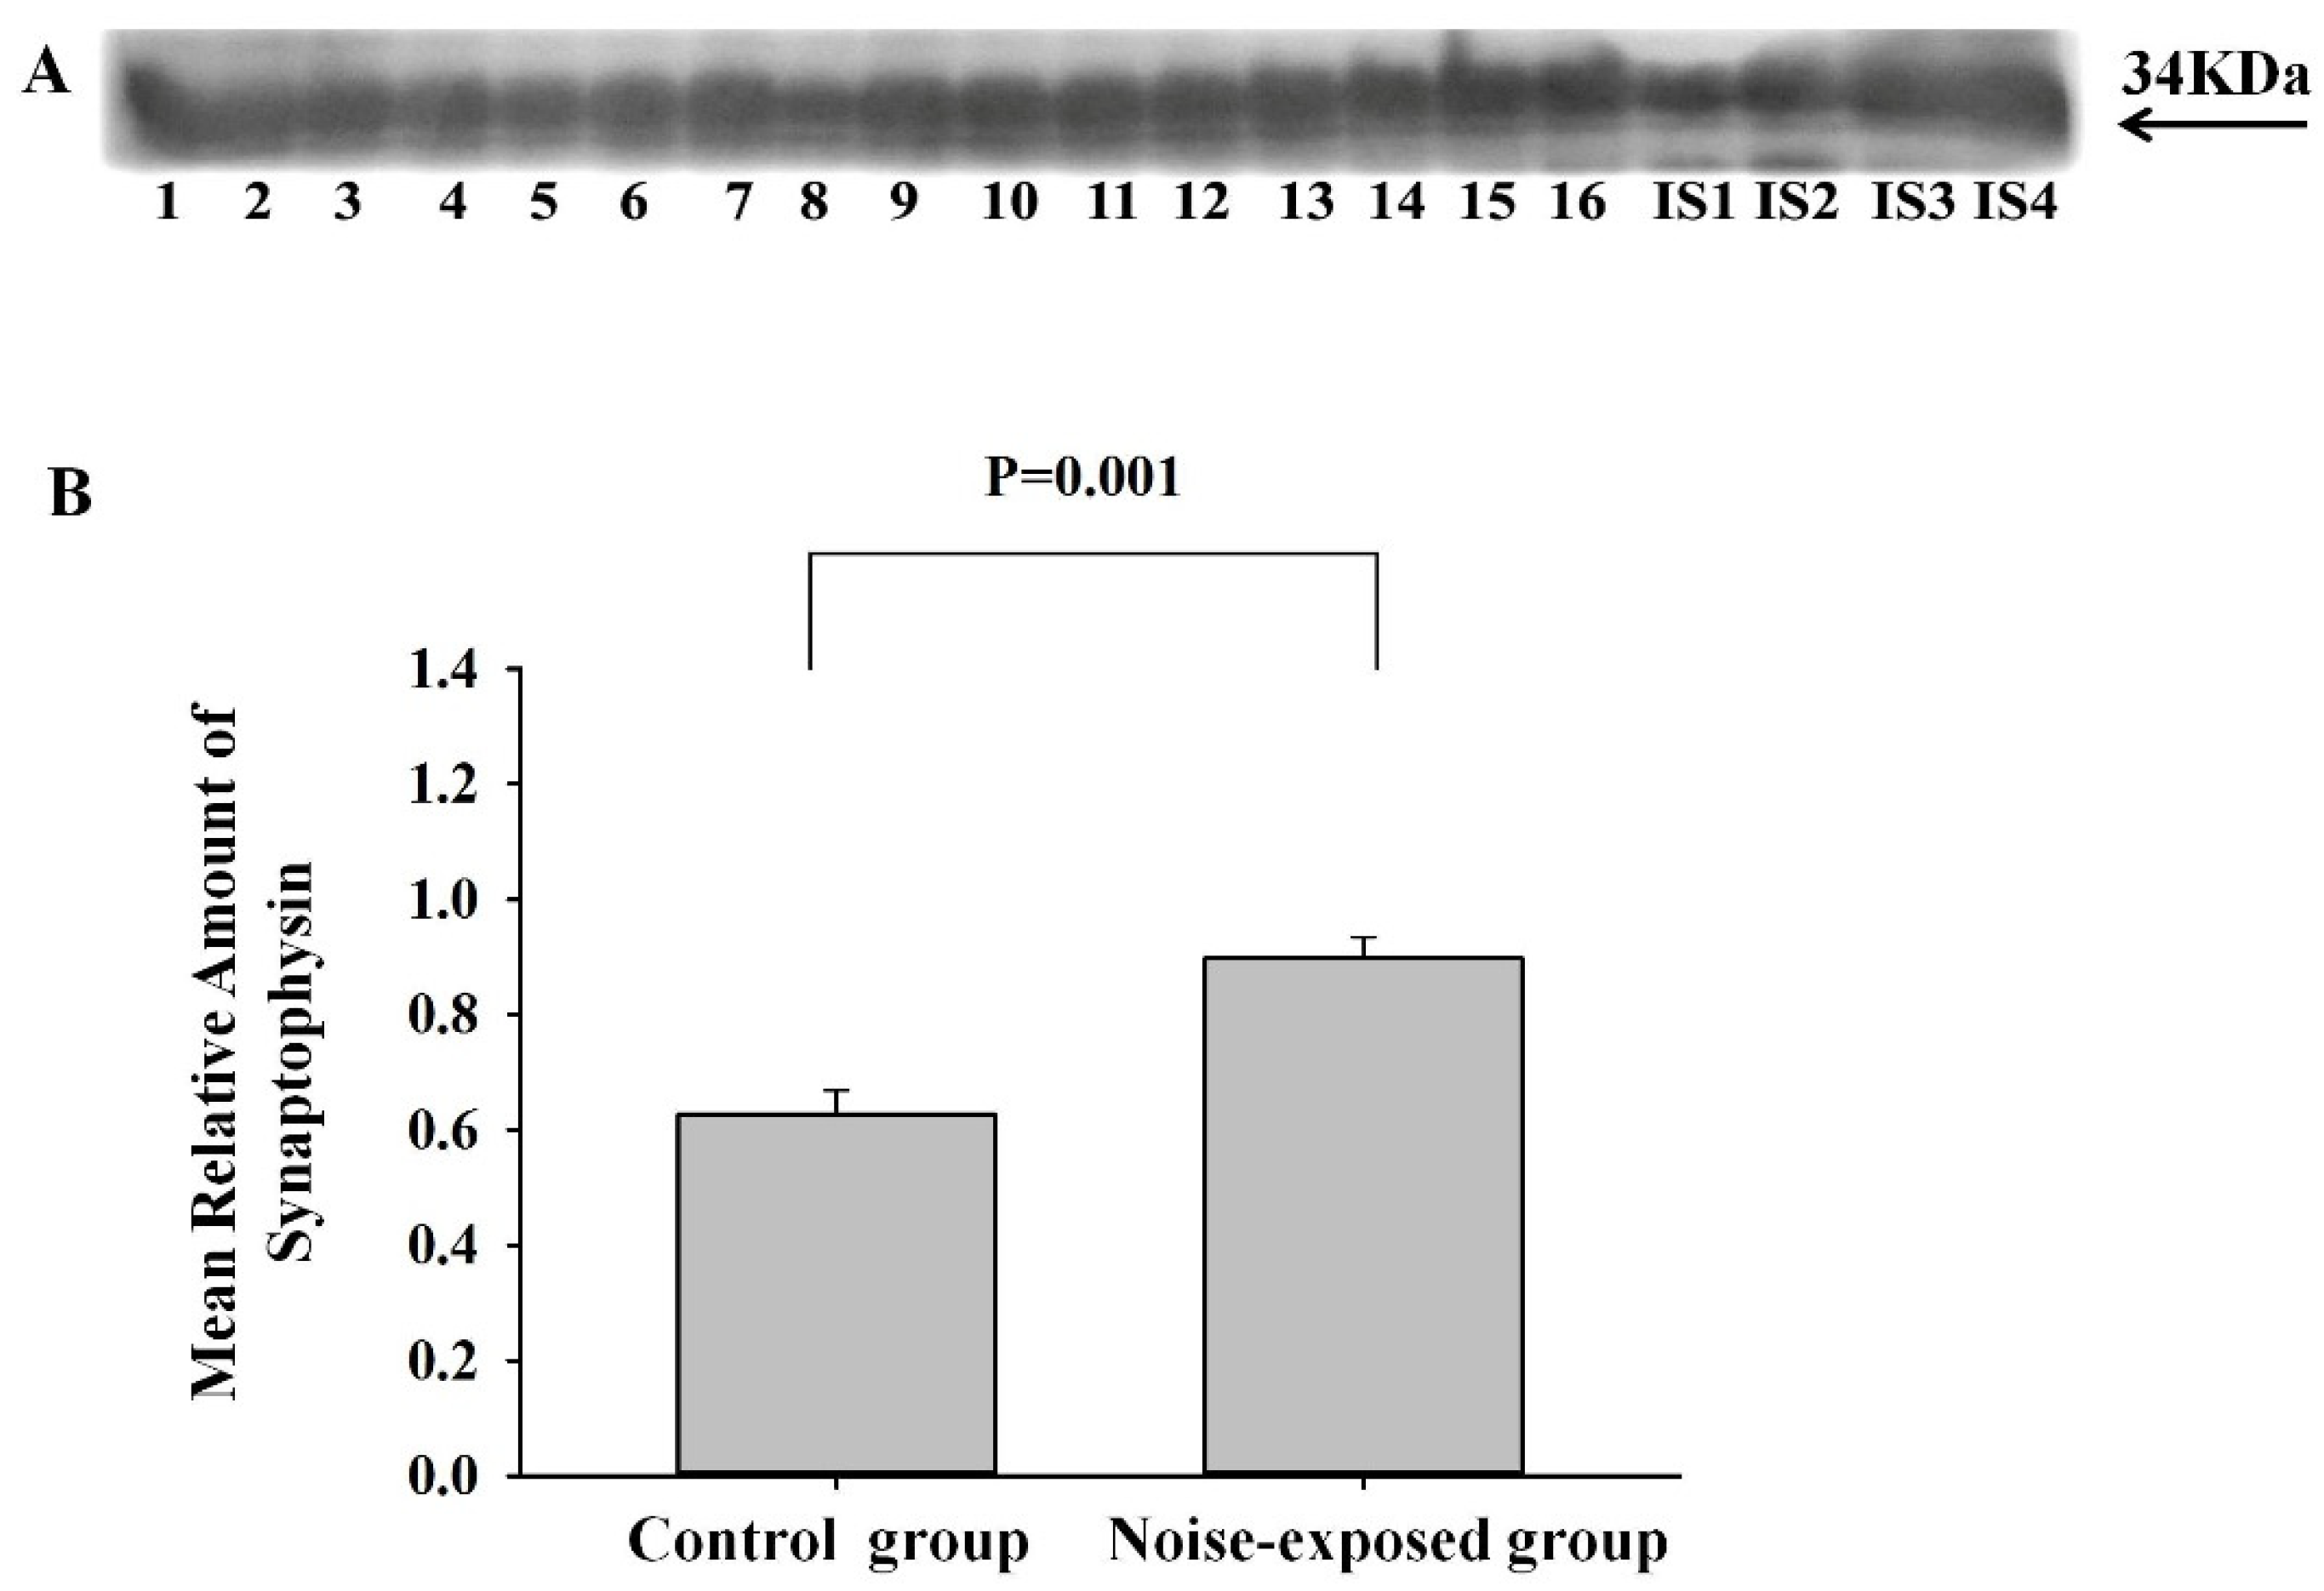
Figure 2.
Western blot image (A) and mean relative amounts ± sem of AIM2 in CNICof control and noise-exposed groups of male Wistar rats (B). Film contains 12 experimental samples; A: lanes 1-6 control group; lanes 7-12 white noise group. IS1-IS4 internal standards, containing 15, 30, 45, and 60 μg protein corresponding to 0.5, 1.0, 1.5 and 2.0 relative amounts of protein. The difference is significant (P=0.02).
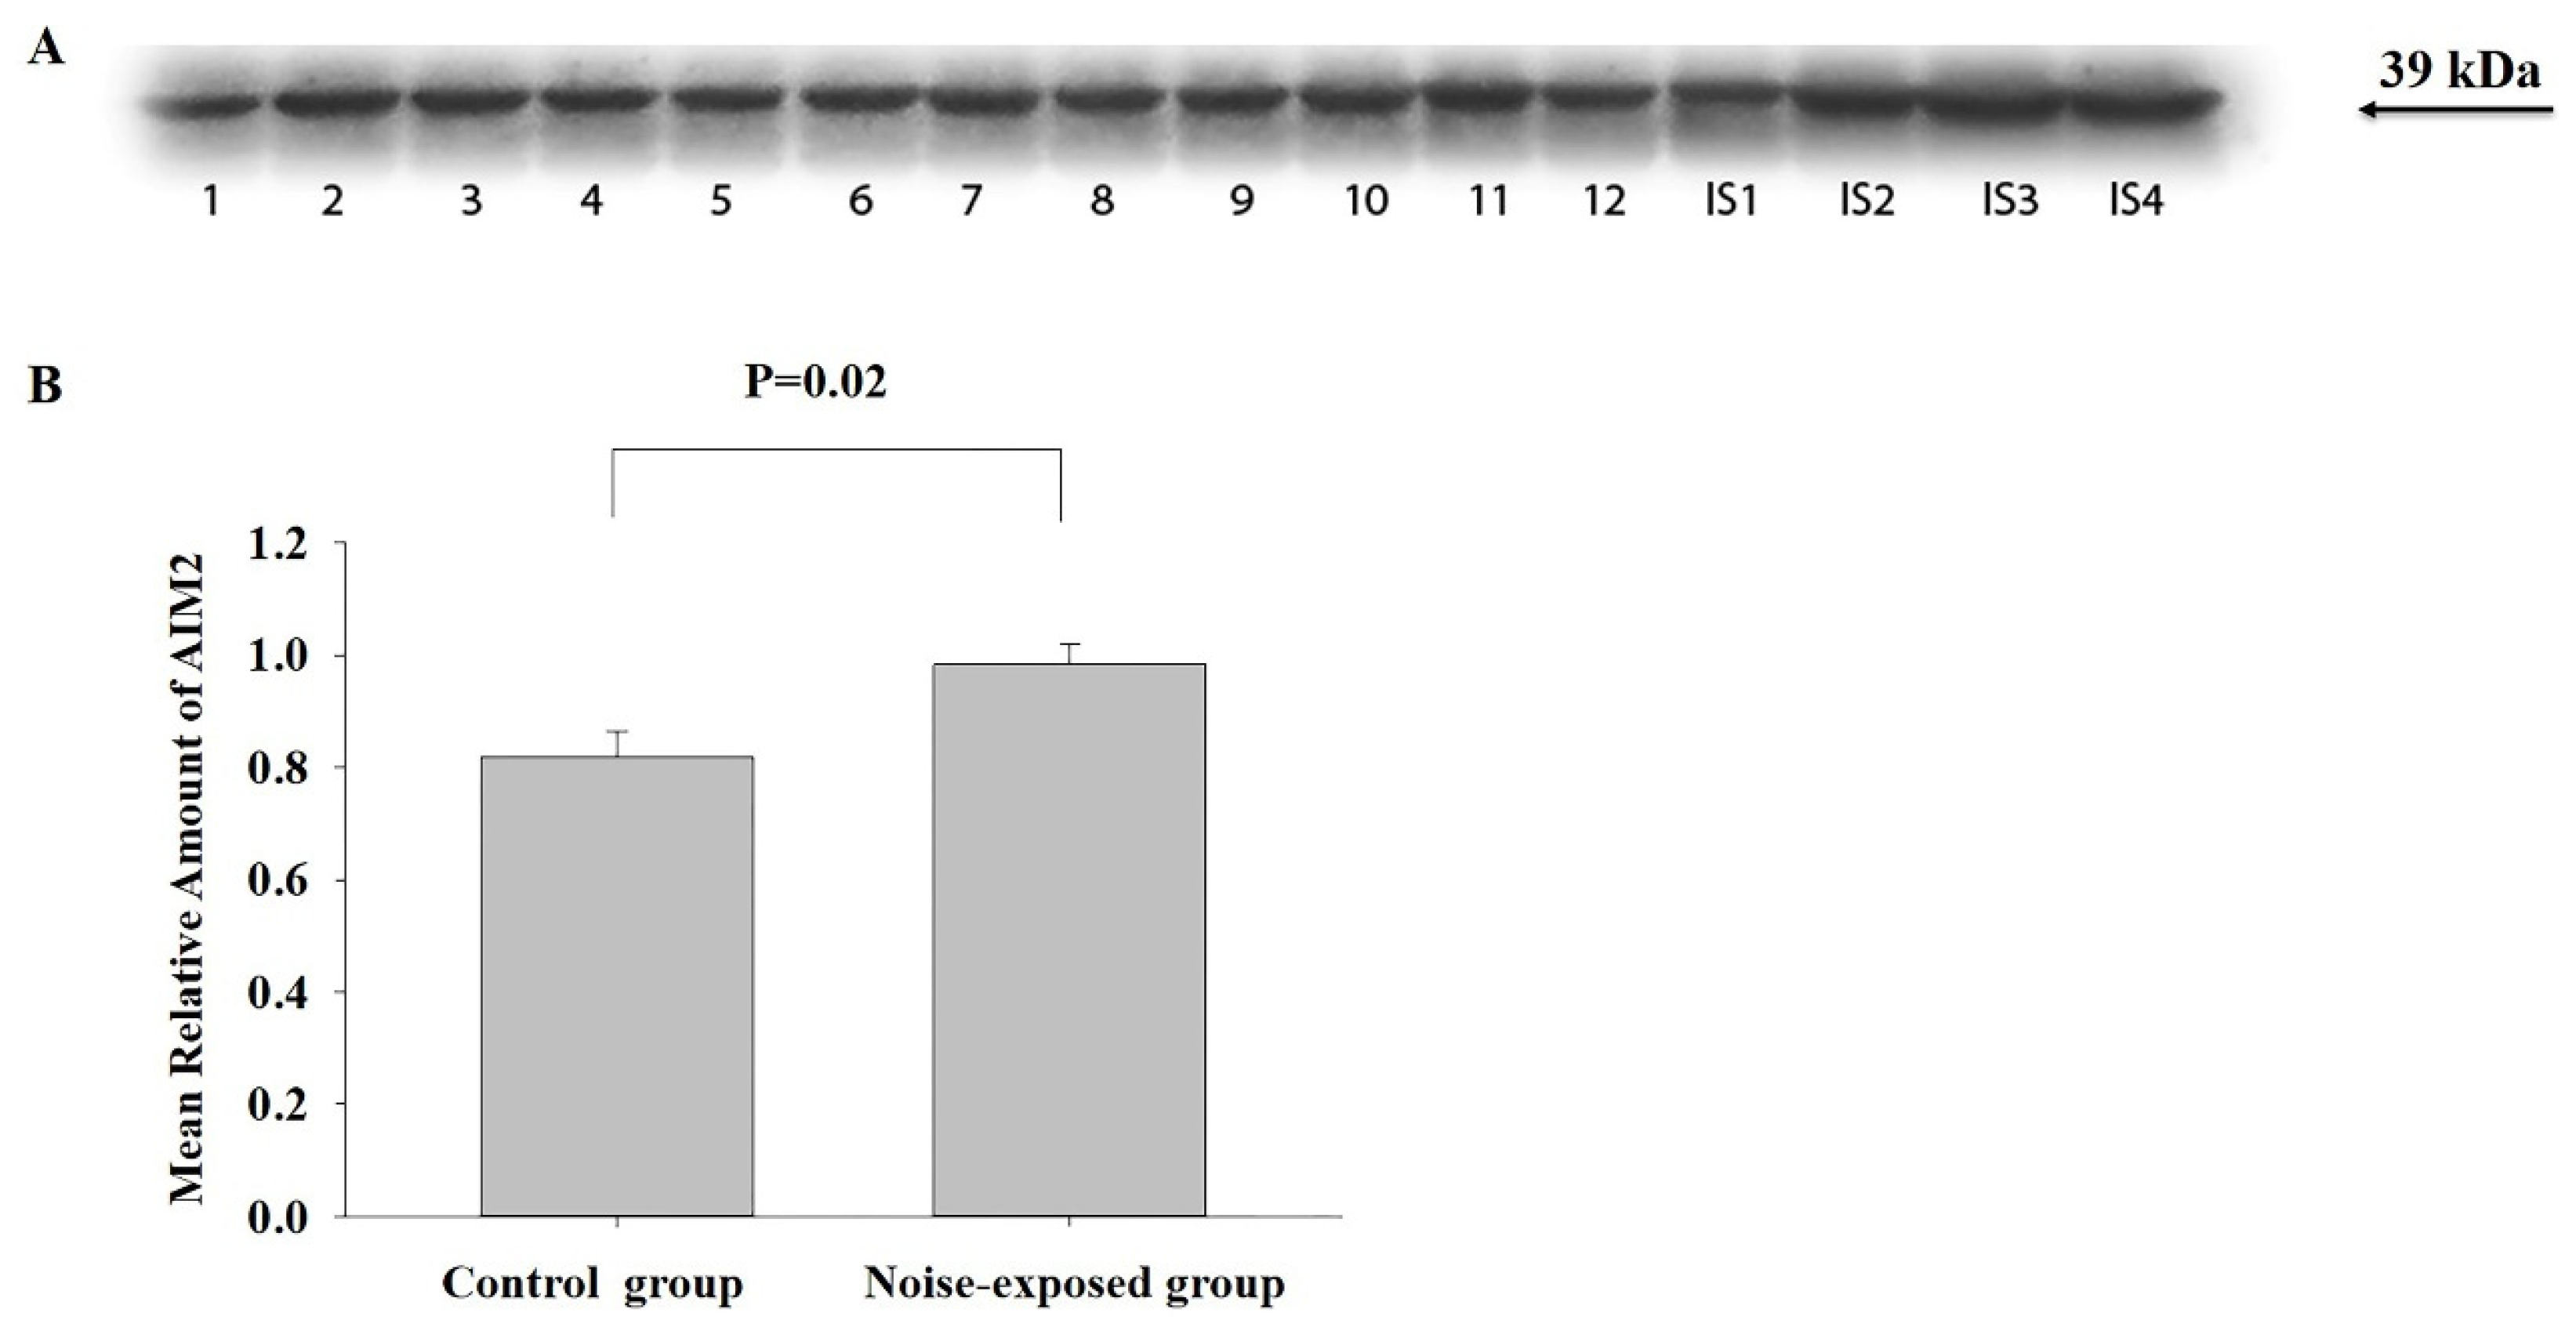
Figure 3.
Western blot image (A) and mean relative amounts± sem of AIM2 in BLA of control and noise-exposed groups of male Wistar rats (B). Film contains 12 experimental samples; A: lanes 1-6 control group; lanes 7-12 white noise group. IS1-IS4 internal standards, containing 15, 30, 45, and 60 μg protein corresponding to 0.5, 1.0, 1.5 and 2.0 relative amounts of protein. The difference is significant (P=0.0001).
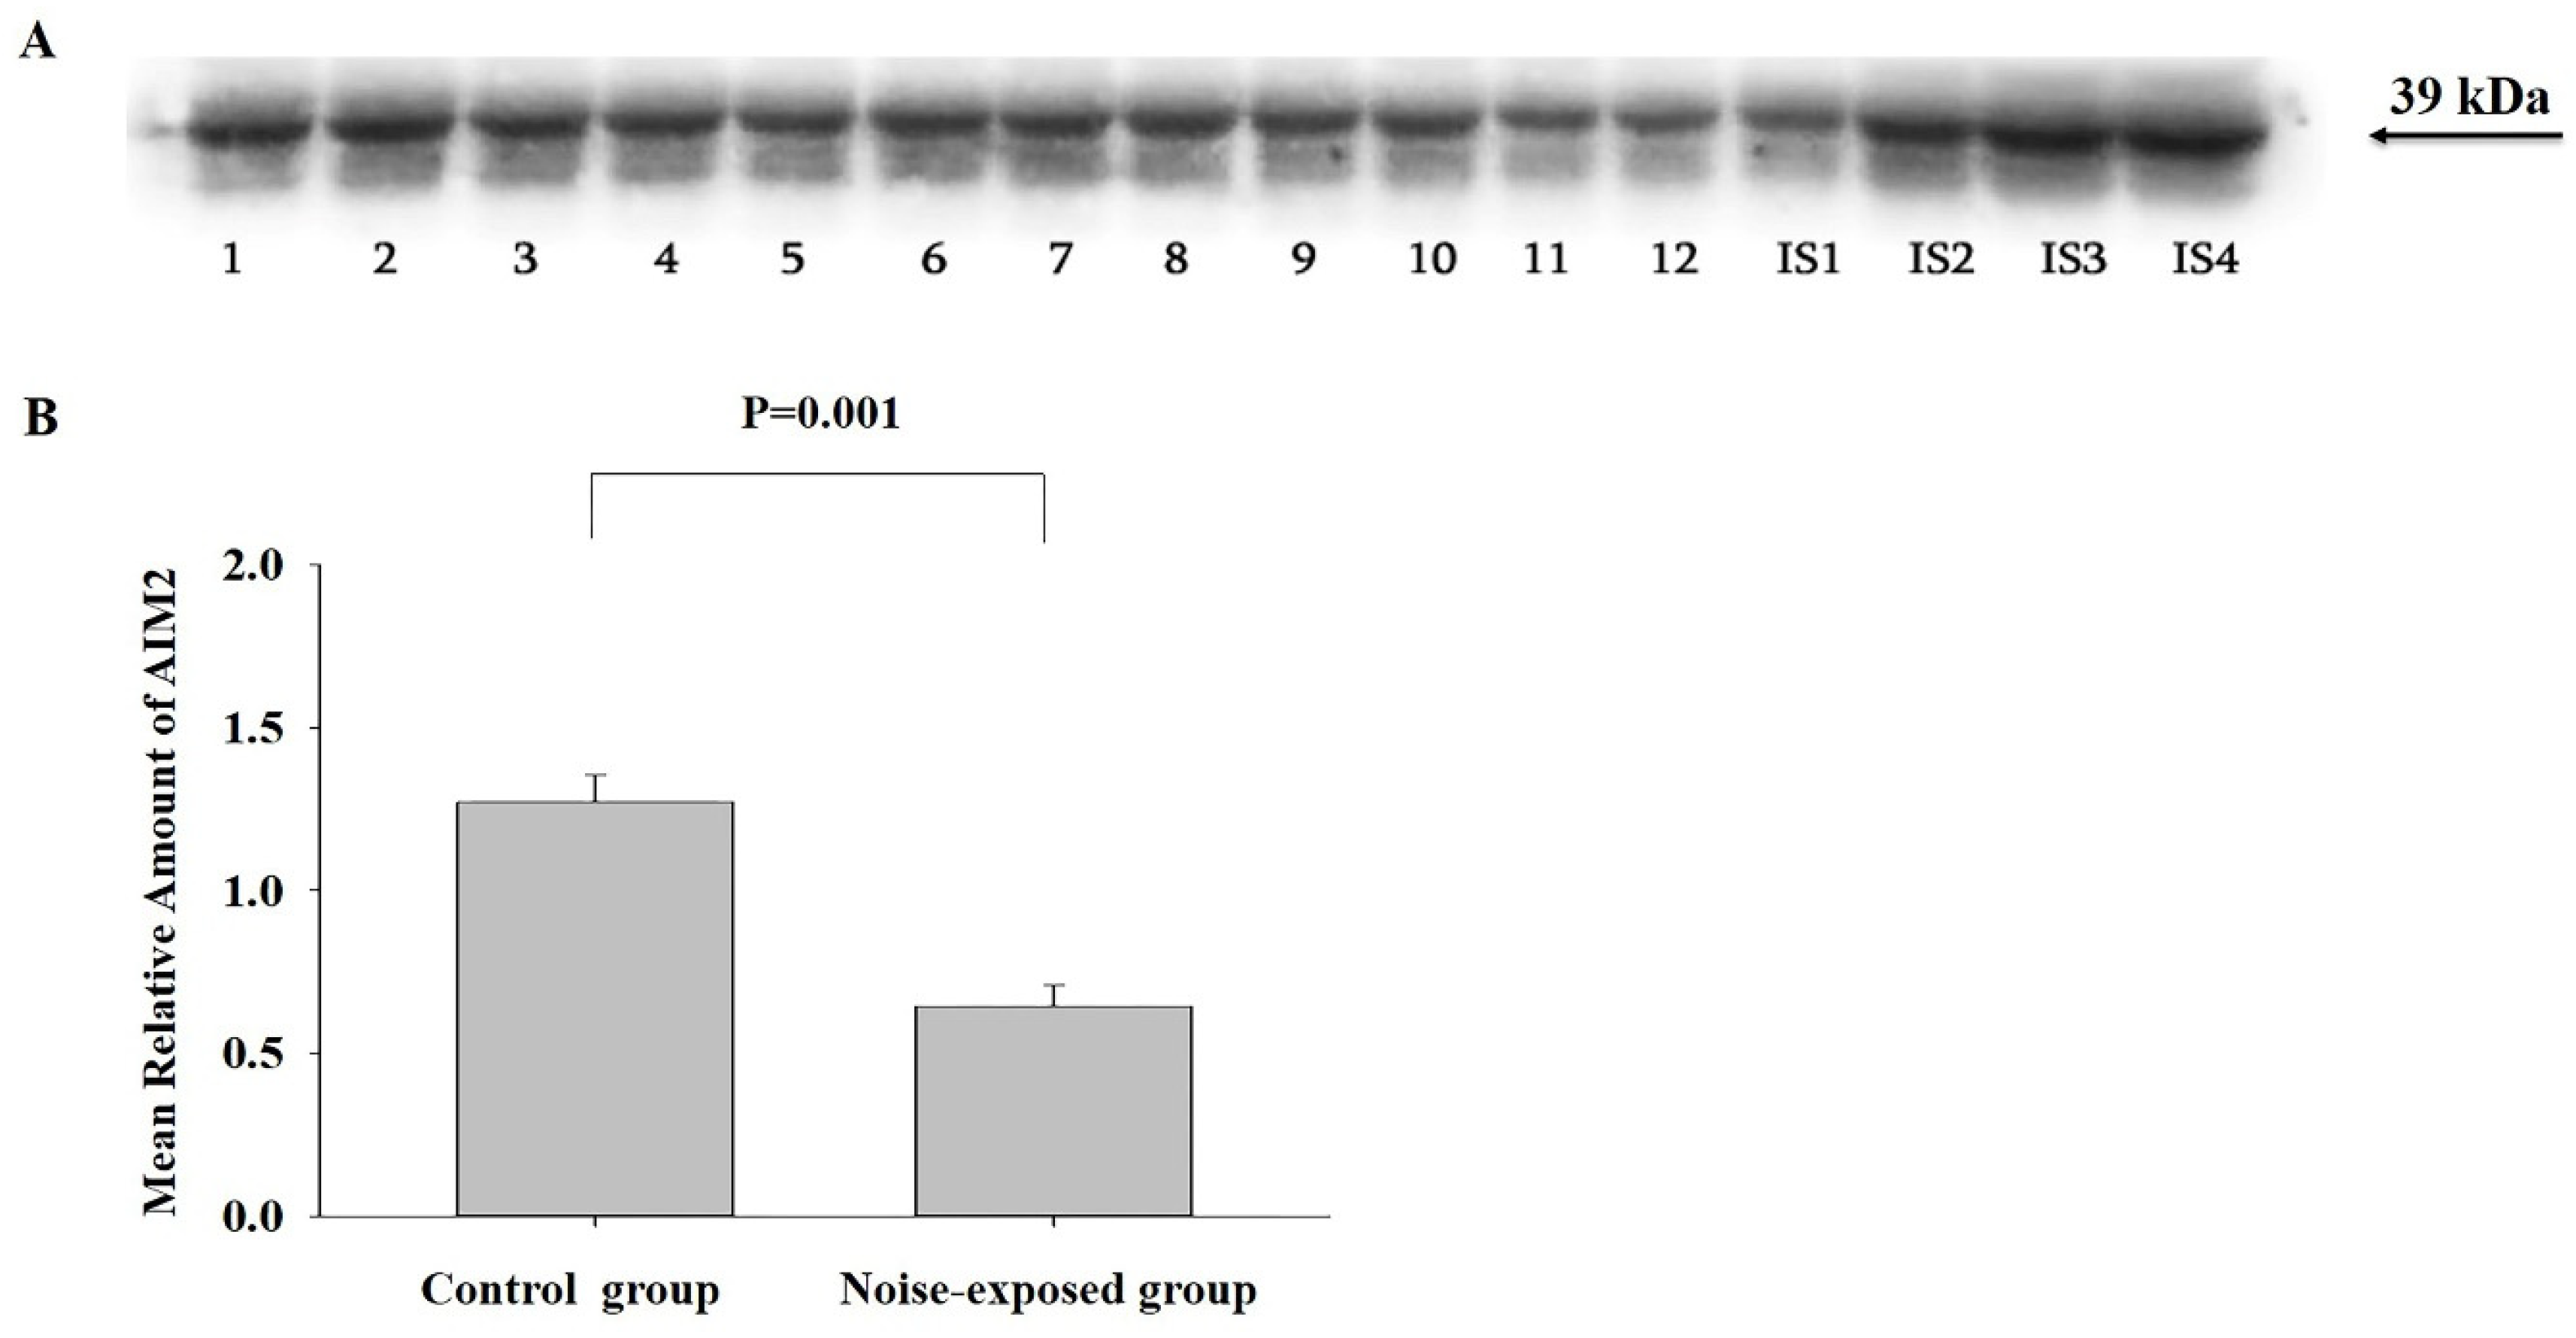
Figure 4.
Western blot image (A) and mean relative amounts± sem of NLRP3 in CNIC of control and noise-exposed groups of male Wistar rats (B). Film contains 12 experimental samples; A: lanes 1-6 control group; lanes 7-12 white noise group. IS1-IS4 internal standards, containing 15, 30, 45, and 60 μg protein corresponding to 0.5, 1.0, 1.5 and 2.0 relative amounts of protein. The difference is significant (P=0.001).
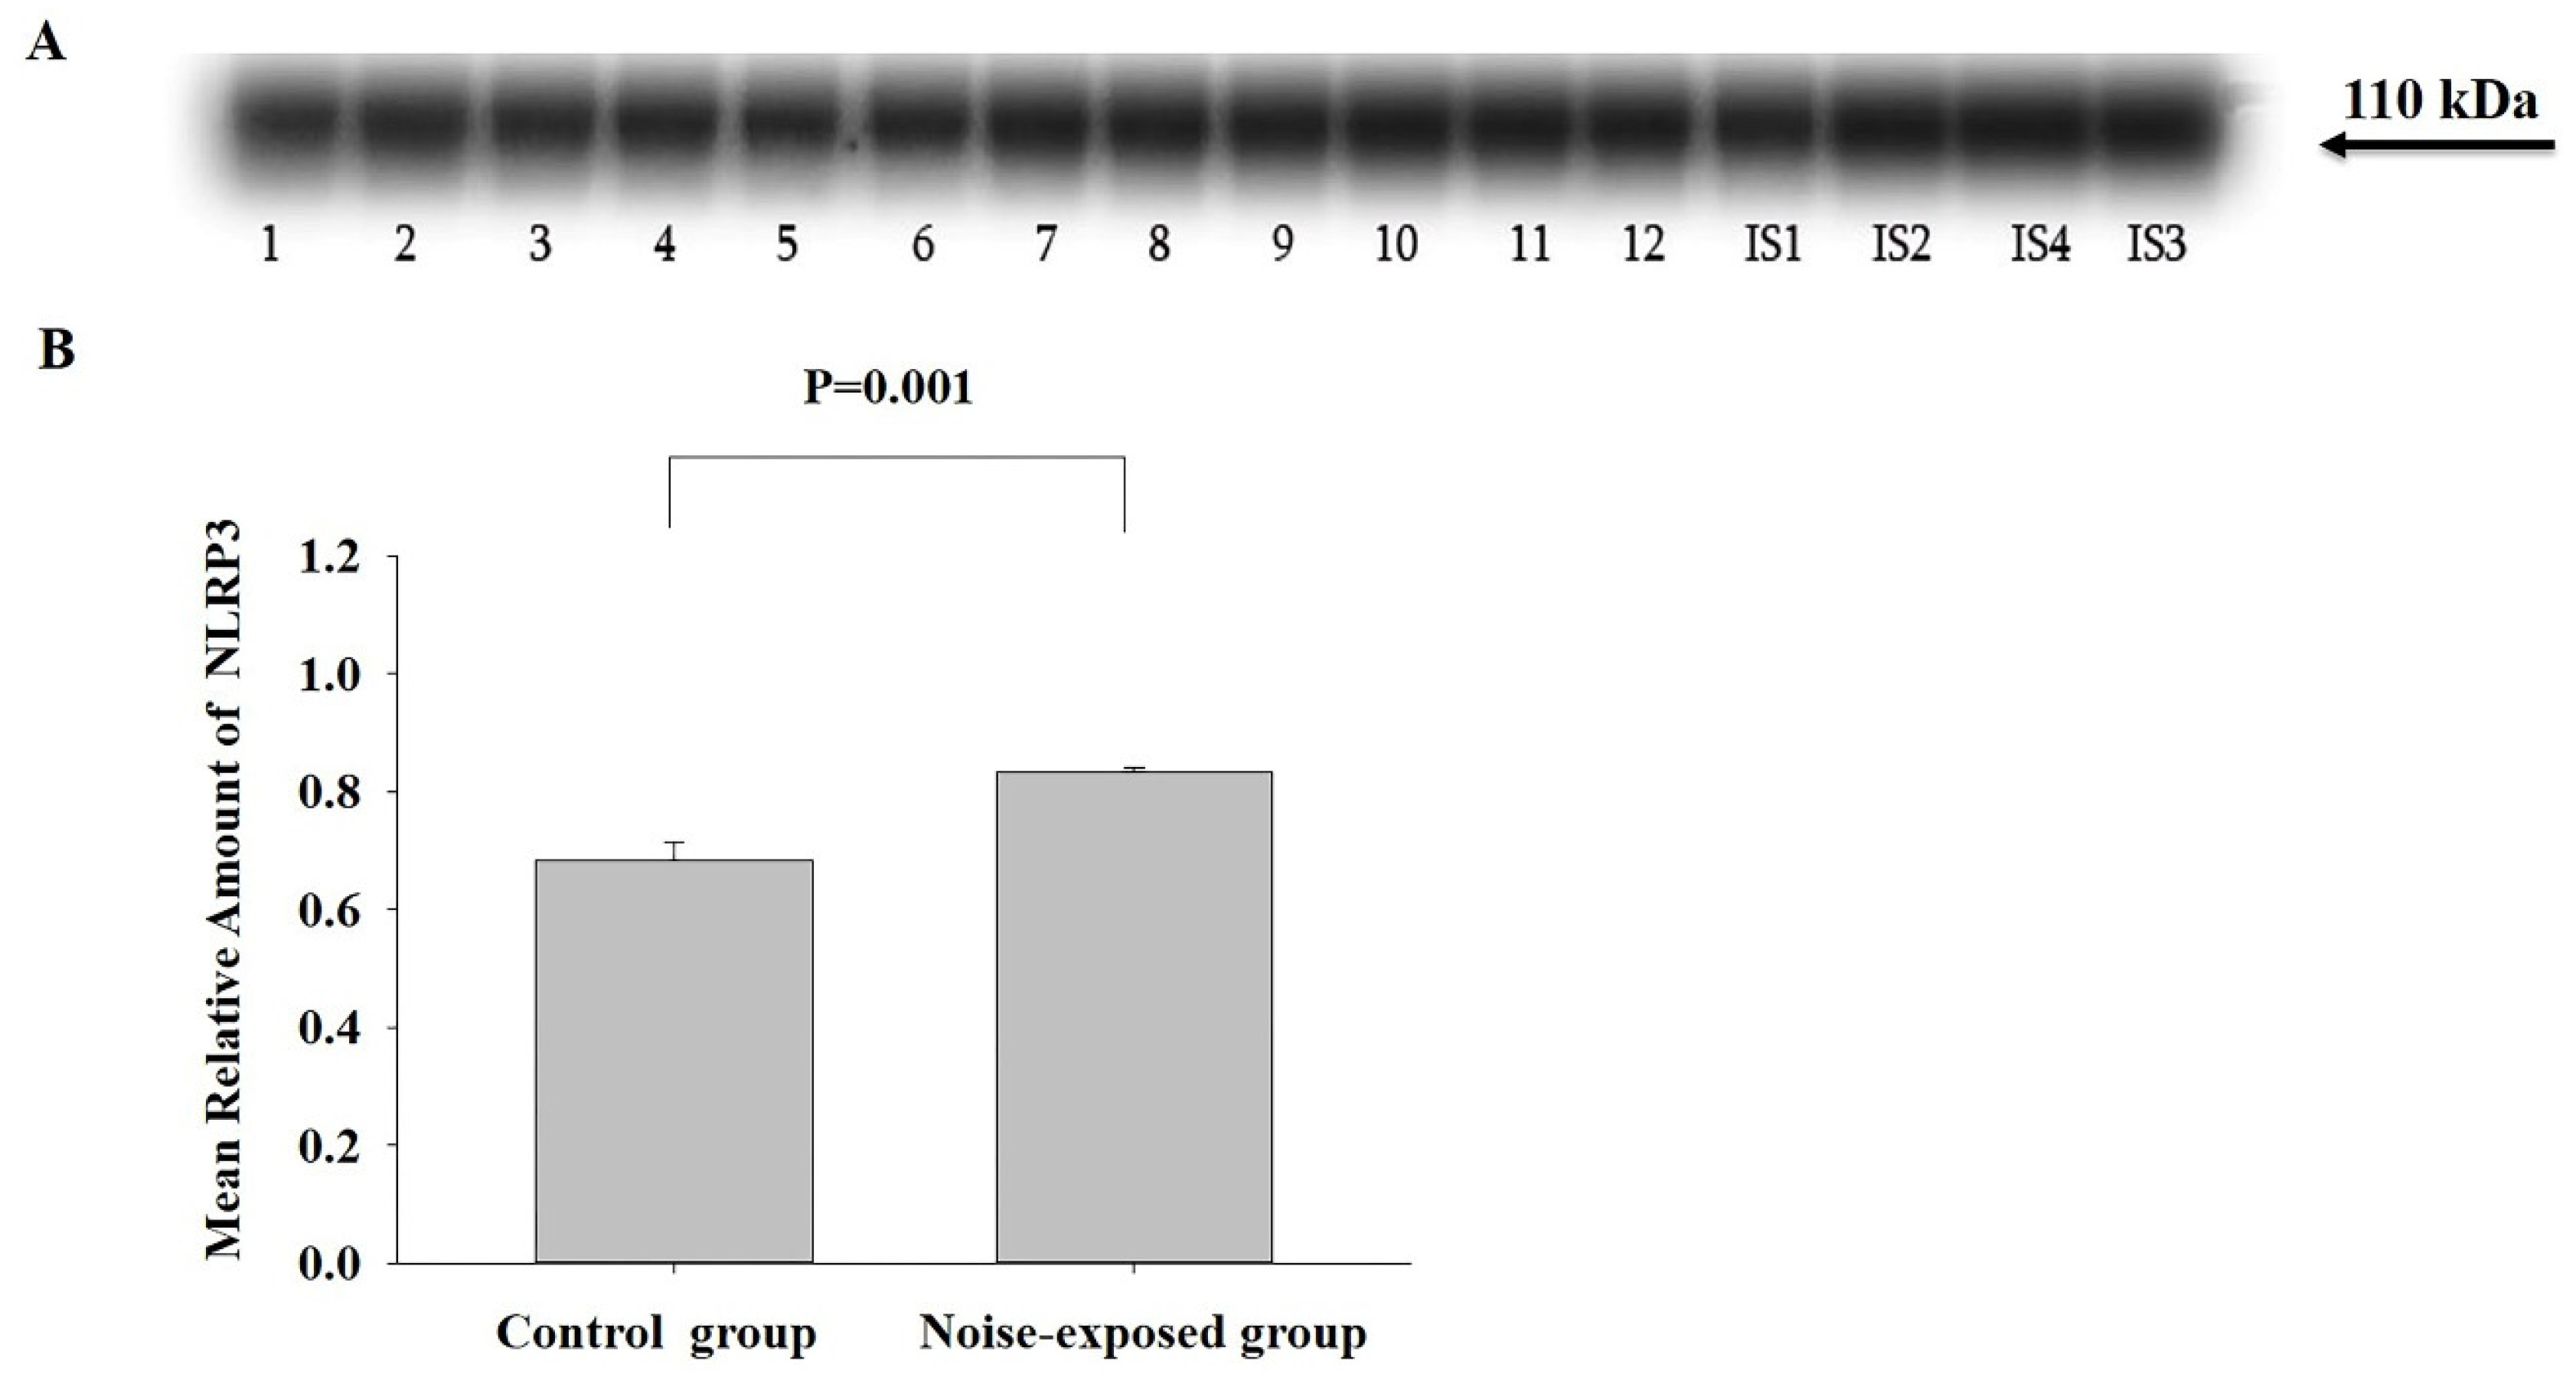
Figure 5.
Western blot image (A) and mean relative amounts± sem of NLRP3 in BLA of control and noise-exposed groups of male Wistar rats (B). Film contains 12 experimental samples: lanes 1-6 control group; lanes 7-12 white noise group. IS1-IS4 internal standards, containing 15, 30, 45, and 60 μg protein corresponding to 0.5, 1.0, 1.5 and 2.0 relative amounts of protein. The difference is significant (P=0.033).
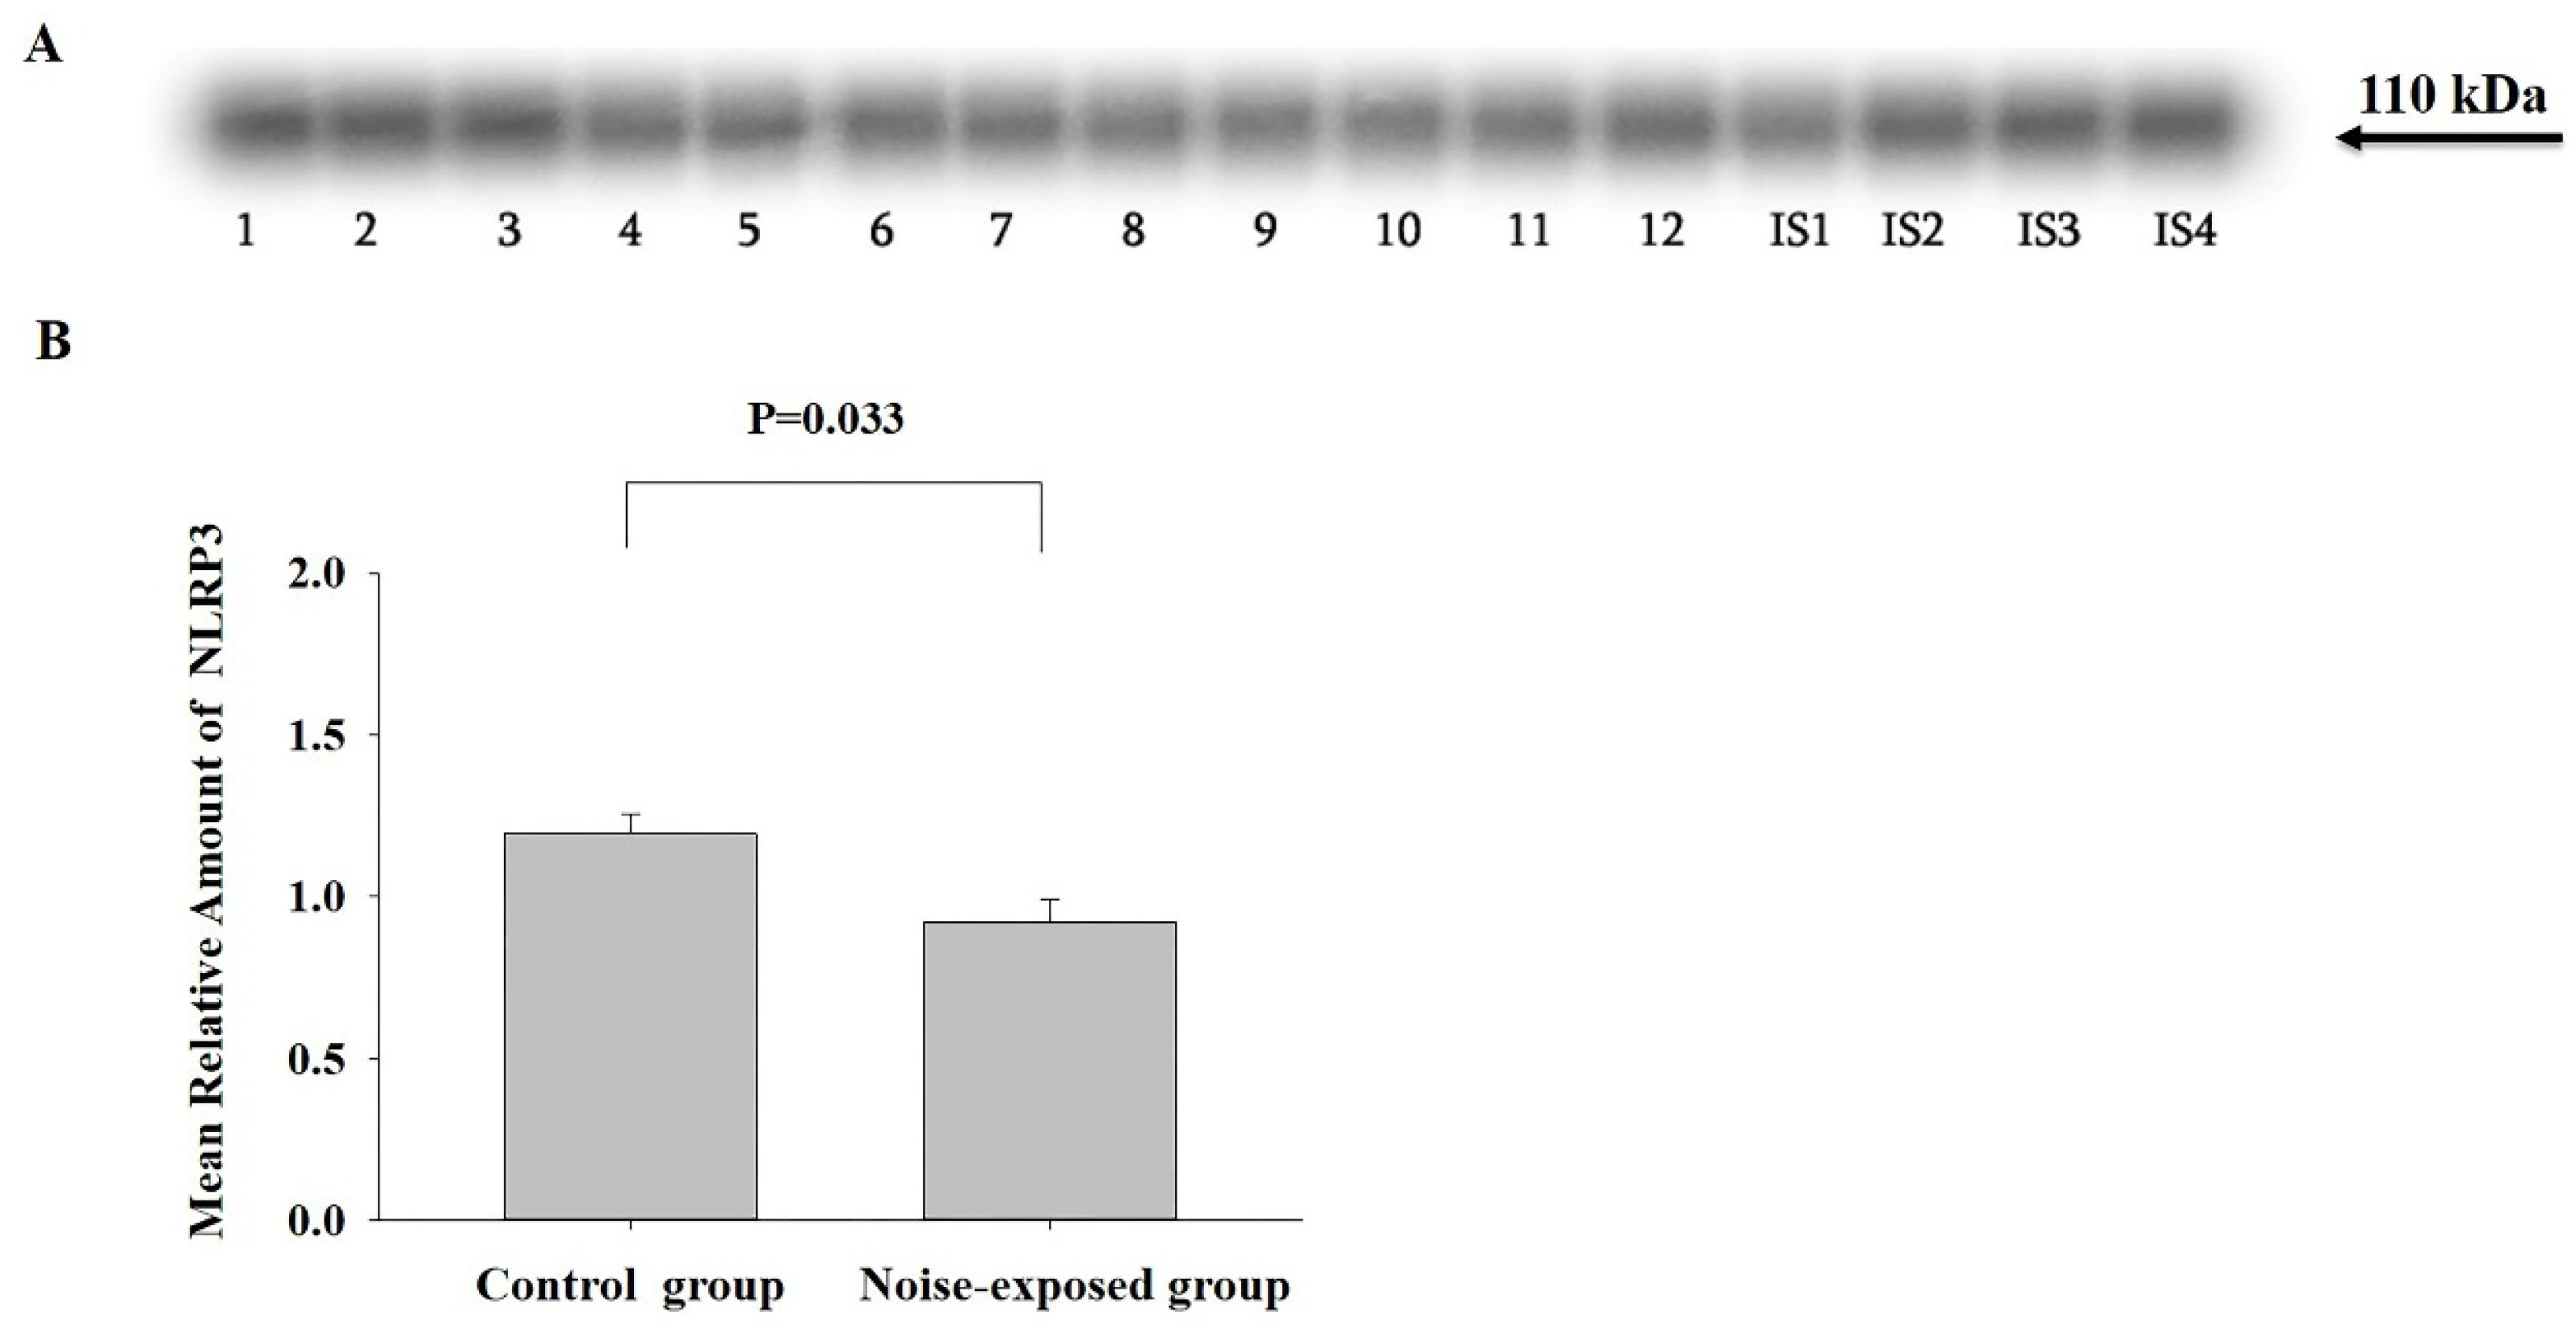
Figure 6.
Western blot image (A) and mean relative amounts± sem of MDA-protein adducts in CNIC in control and noise-exposed groups of male Wistar rats (B). Film contains 12 experimental samples; A: lanes 1-6 control group; lanes 7-12 white noise group. IS1-IS4 internal standards, containing 15, 30, 45, and 60 μg protein corresponding to 0.5, 1.0, 1.5 and 2.0 relative amounts of protein. On the left side of the film the molecular weights of major MDA protein adduct are indicated, whereas on the left side positions of molecular weight standards. The difference is significant (P=0.002).
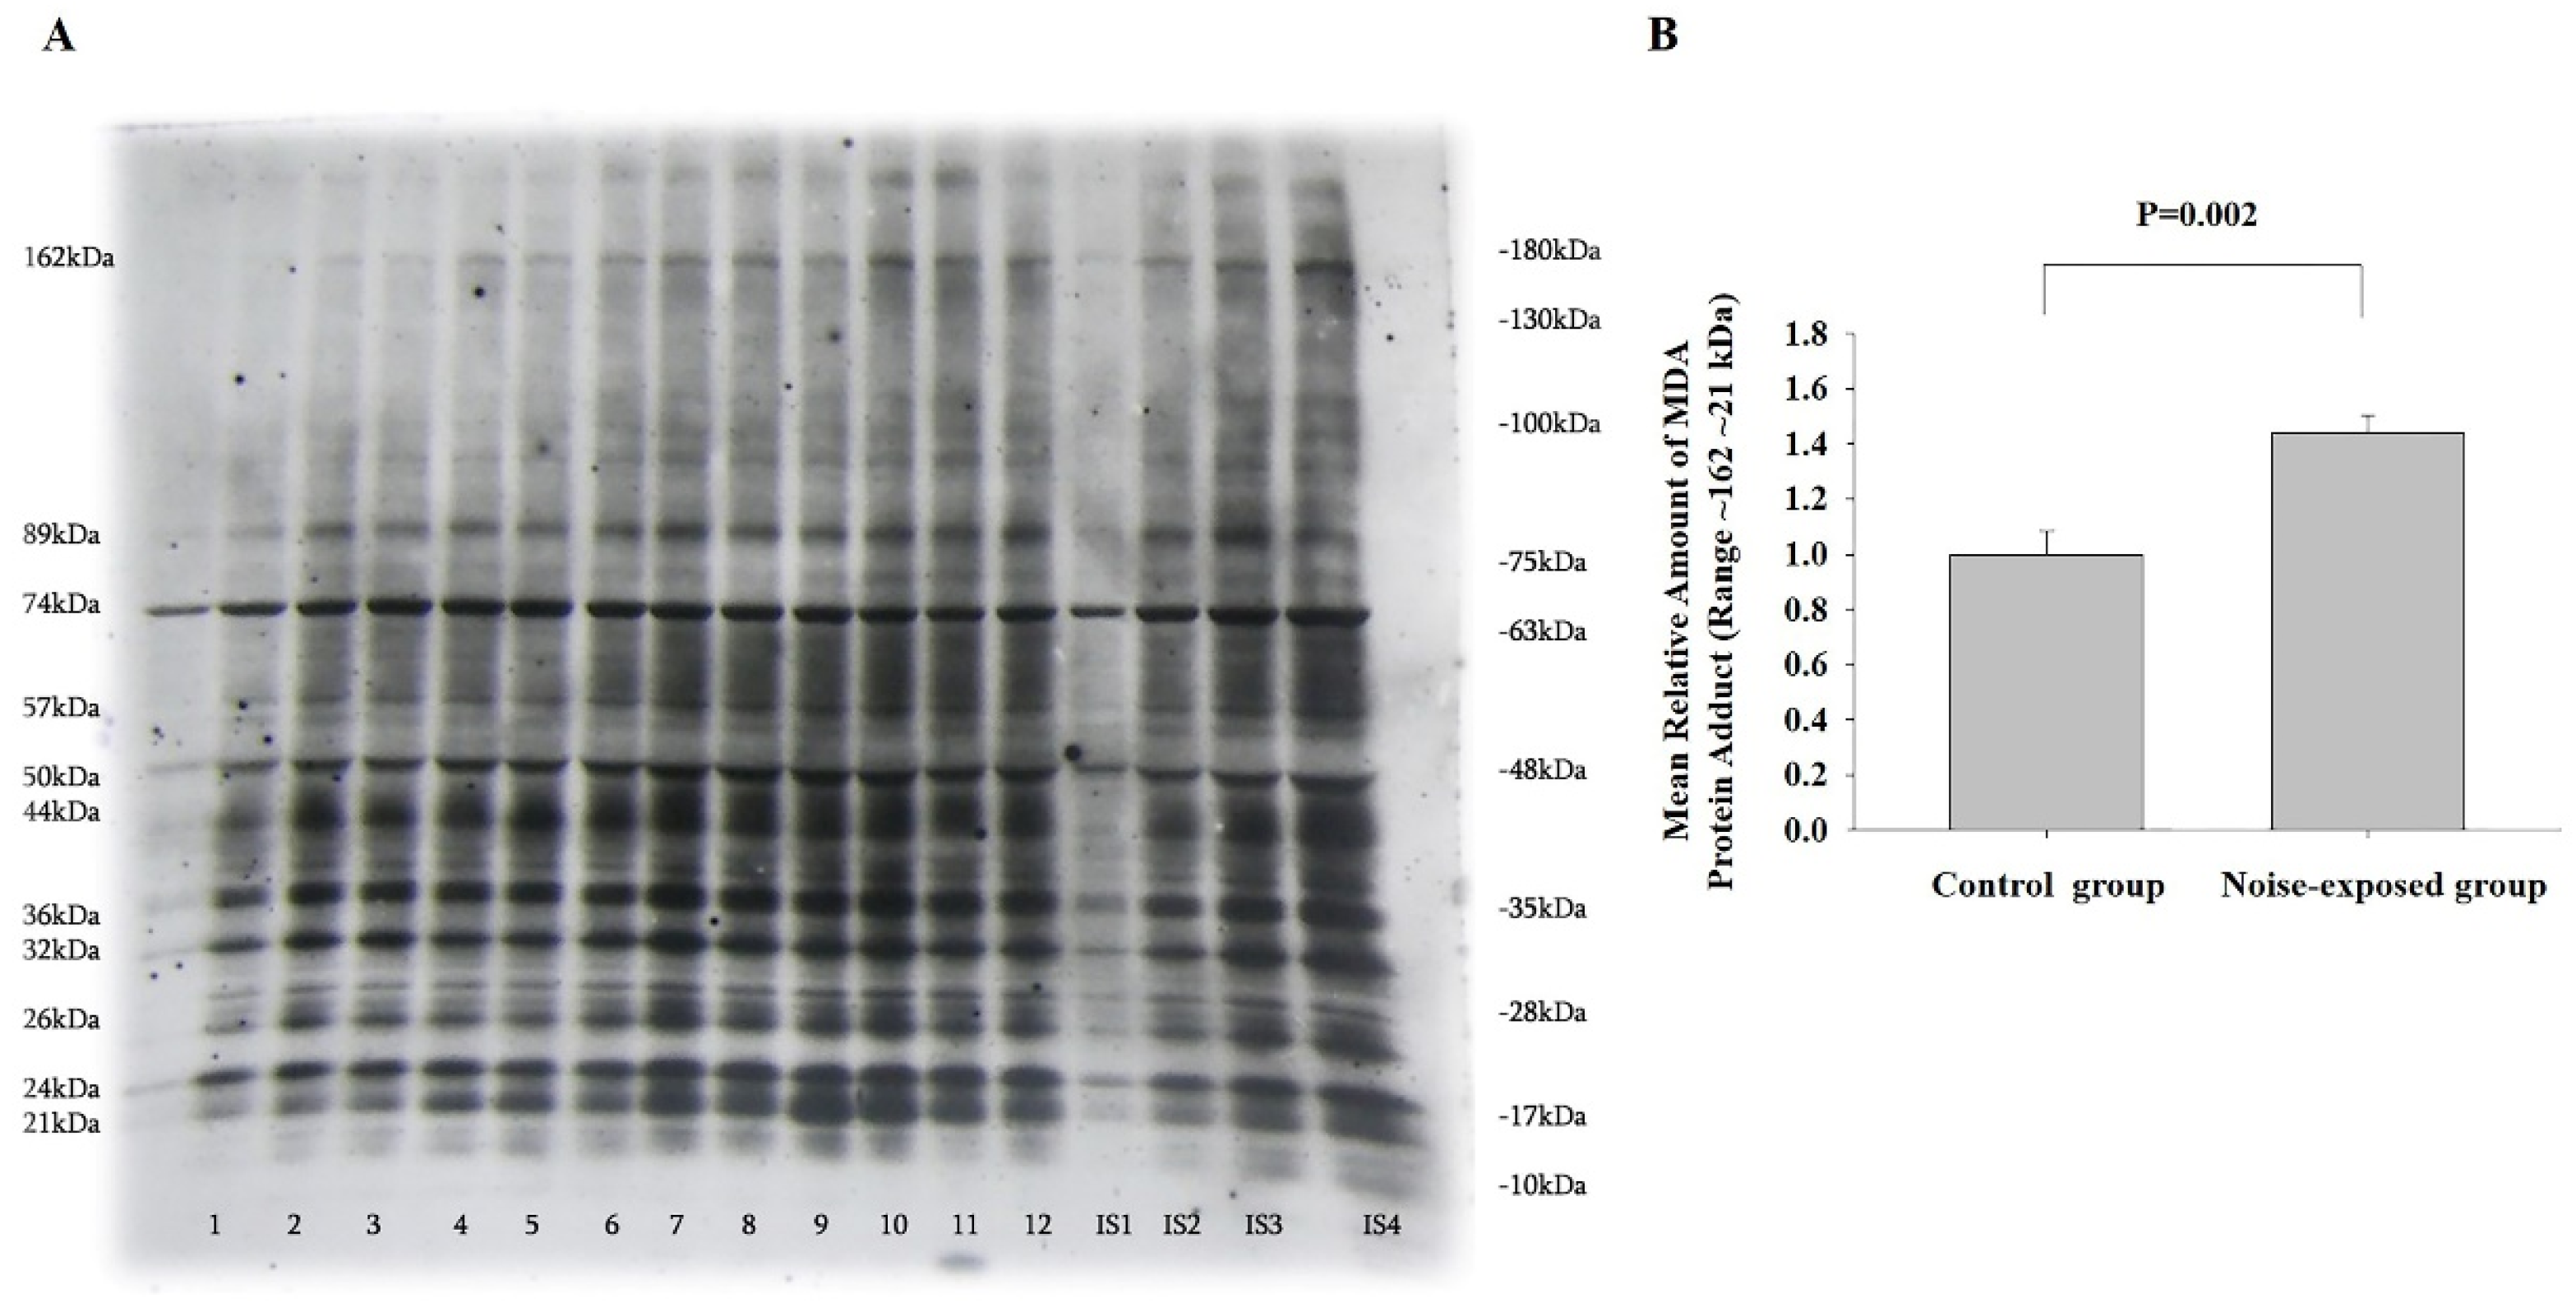
Figure 7.
Expression of selected representative subunits of the mitochondrial OXPHOS system and ATP synthase F1 subunit alpha (ATP5A) in the hippocampal region of control and noise-exposed rats. A-representative image of Western immunoblot. ATP5A-55Kda, UQCRC2-48kDa, MTCO1-40kDa, SDHB-30kDa and NDUFB8-20KdaA: lanes 1-6 control group; lanes 7-12 noise exposed group. IS1-IS4 internal standards, containing 15, 30, 45, and 60 μg protein corresponding to 0.5, 1.0, 1.5 and 2.0 relative amounts of protein. B -The mean amounts ± sem of SDHB; The difference is significant (P=0.001).
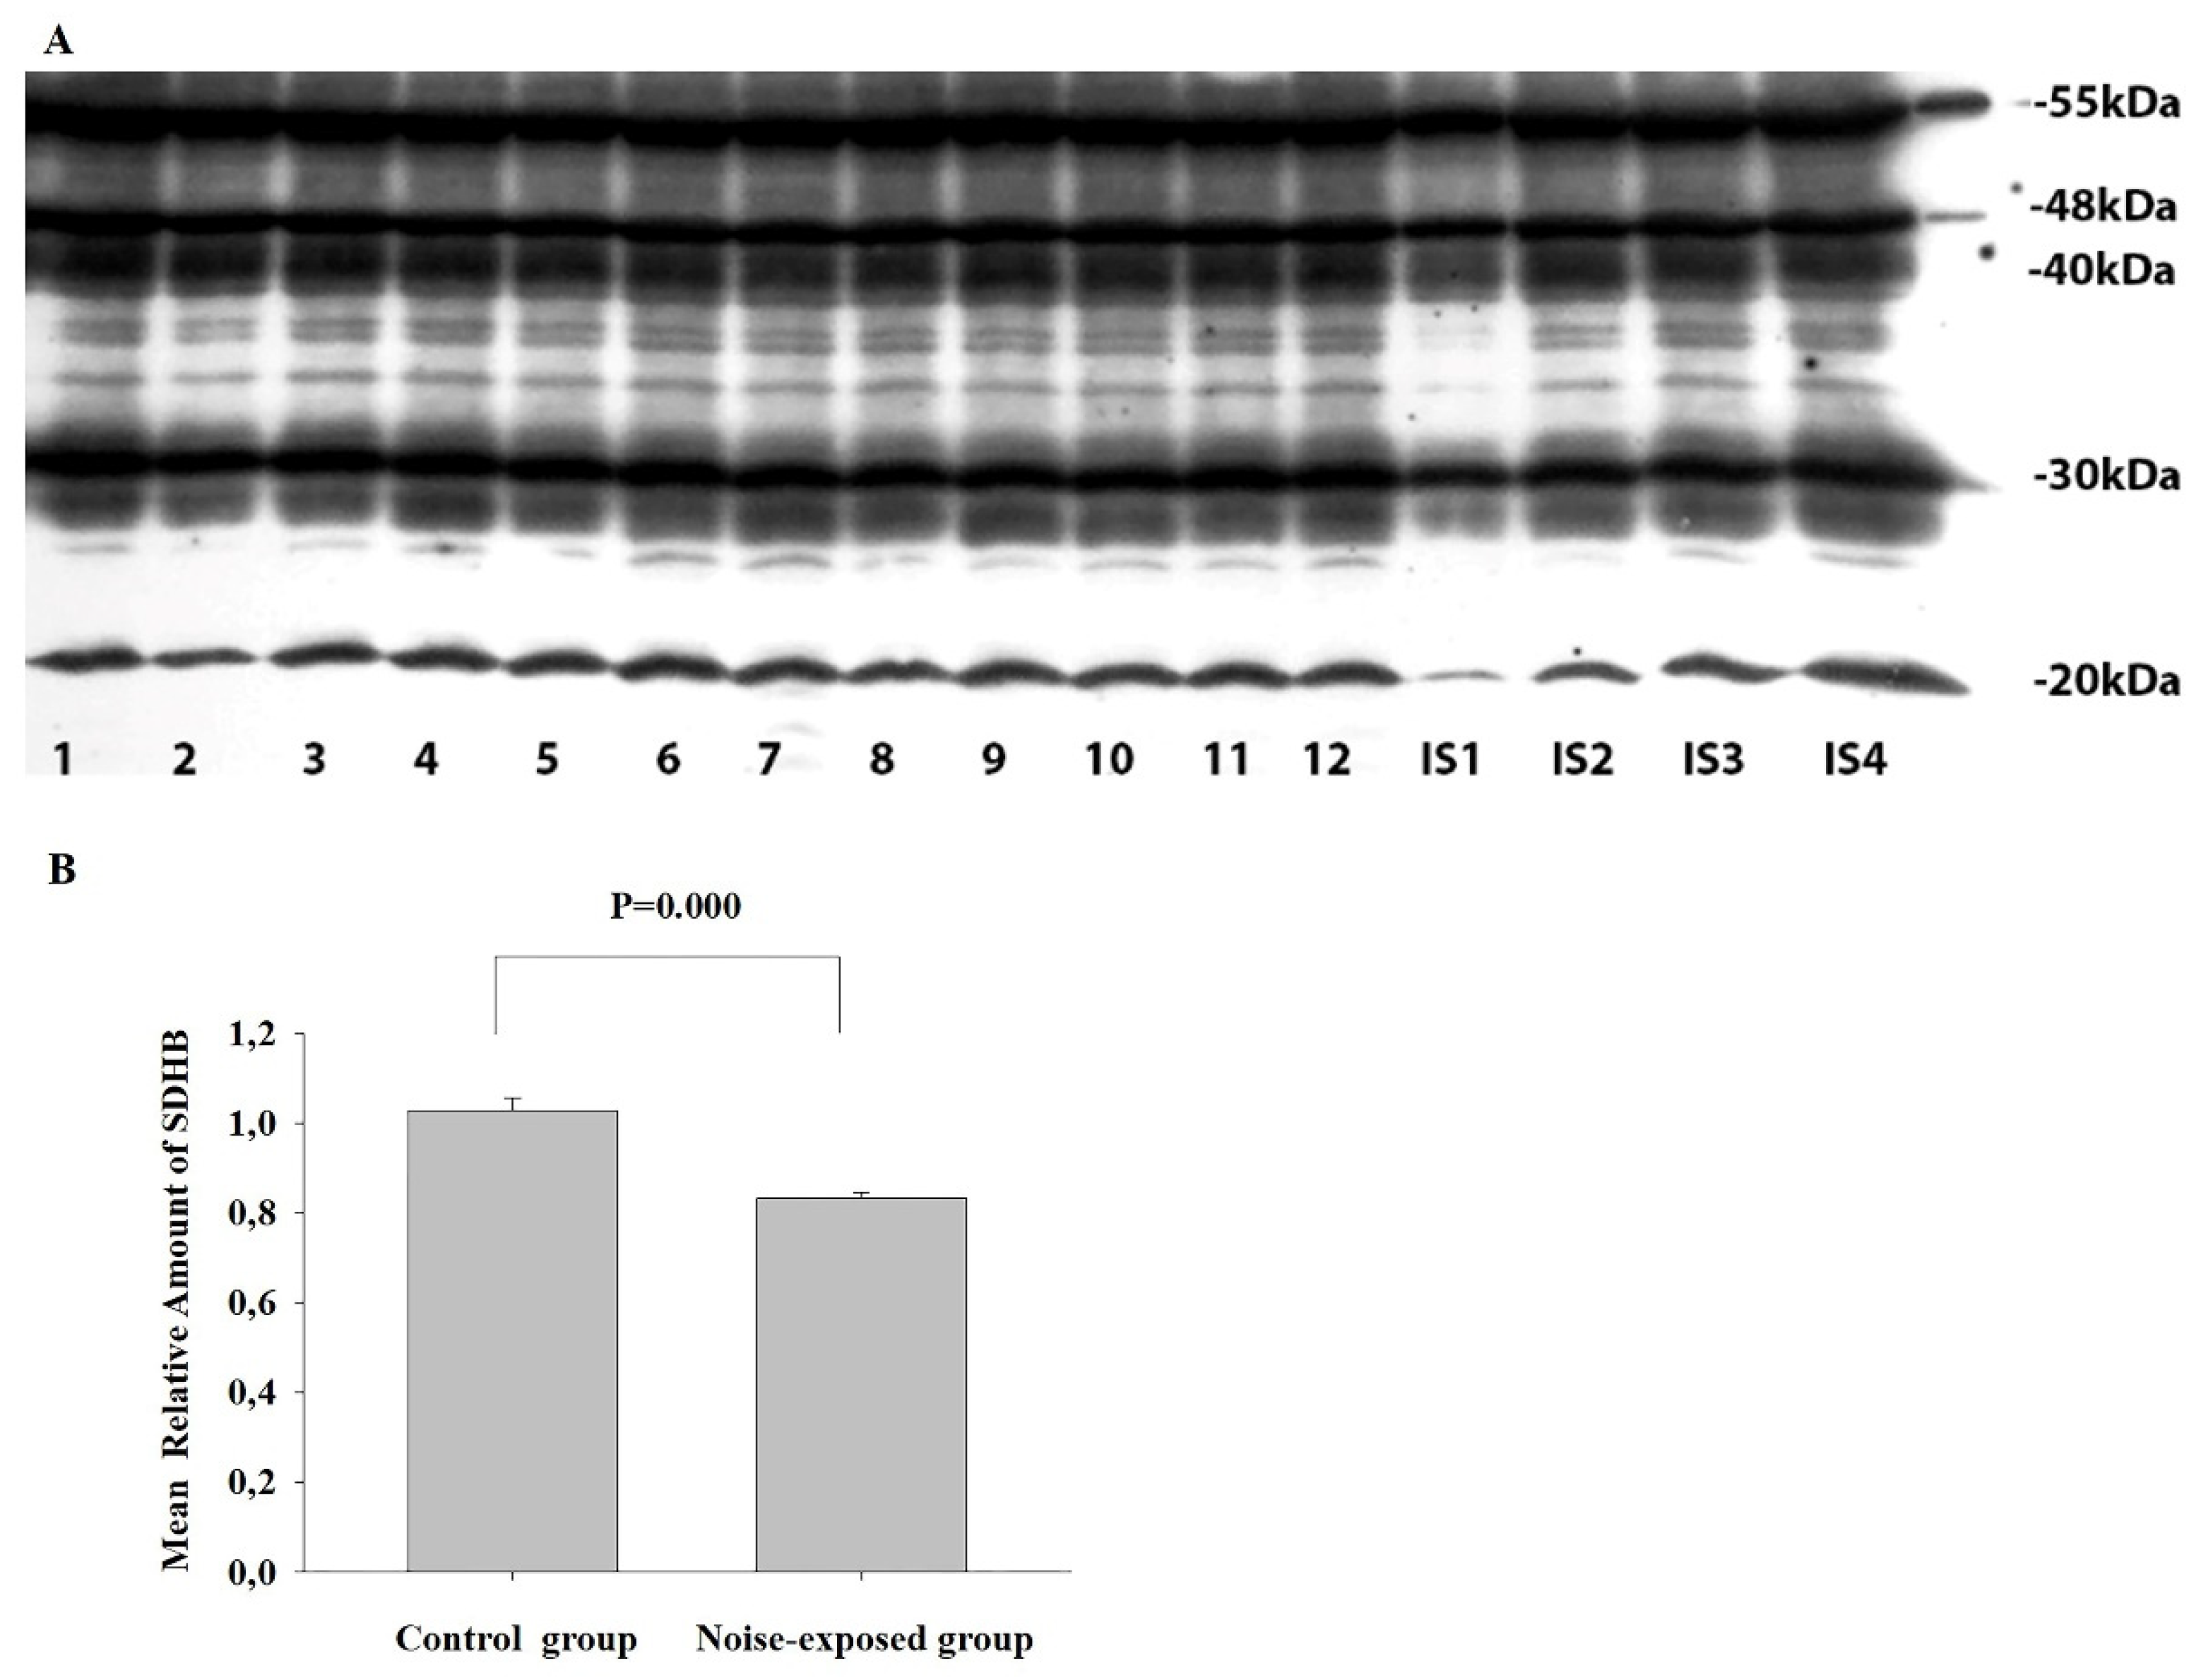
Figure 8.
Representative electron micrographs of neuropil from central nucleus of inferior colliculus of adult male Wistar rat exposed to 30 d chronic loud noise. A – Apoptotic cell (white four-point star), B – Fragment of neuron with electron lucent area (black four-point star), degenerate mitochondria (black arrows) and moderately widened Golgi cisternae (white arrows), C – Moderately demyelinated axon (black arrows).
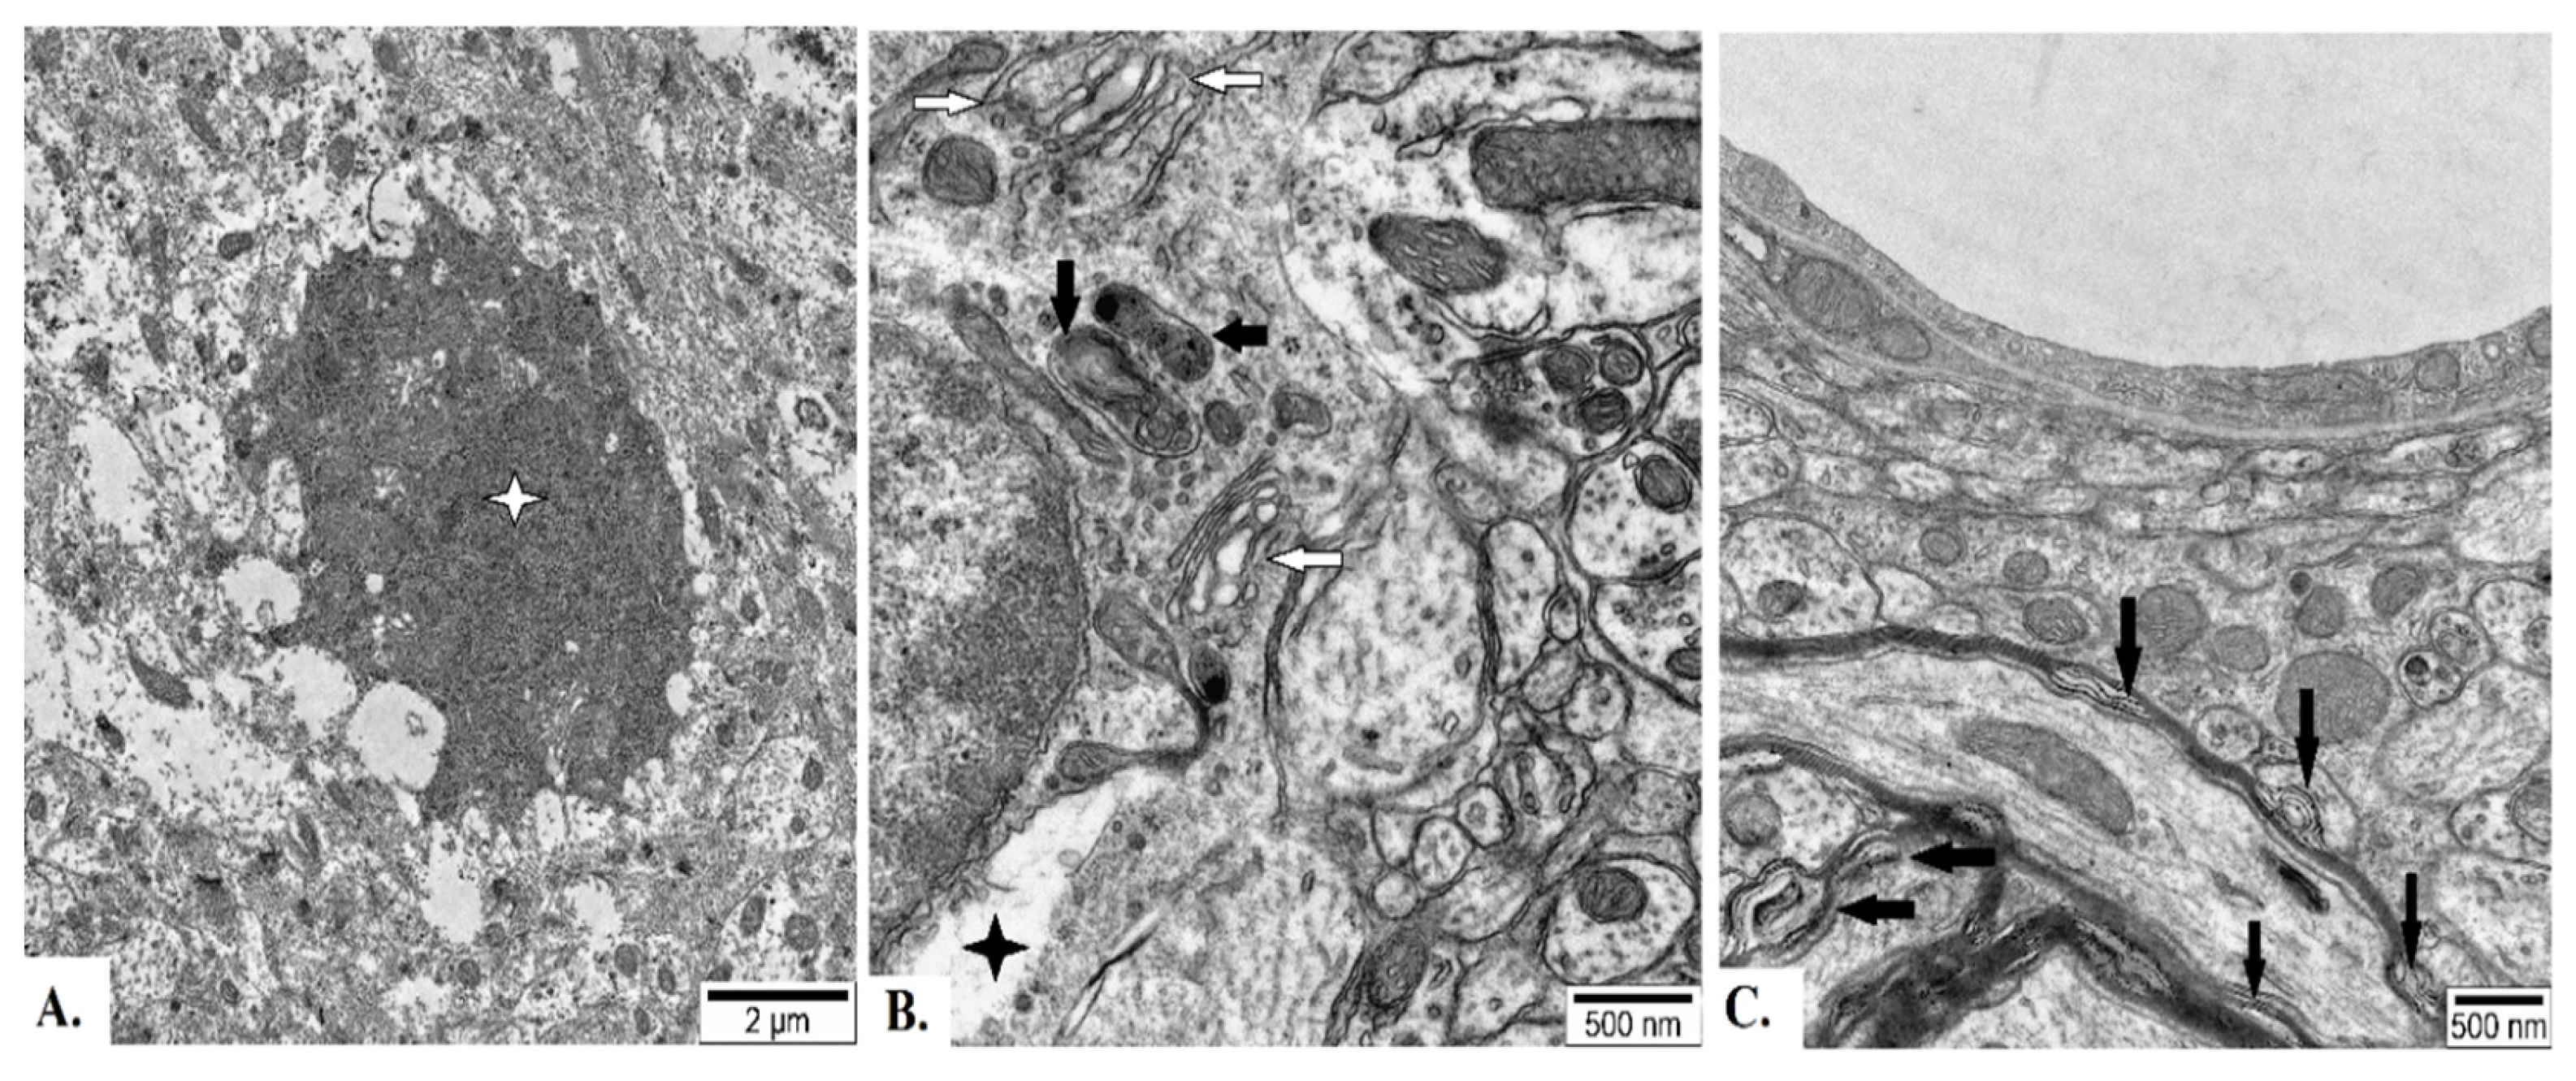
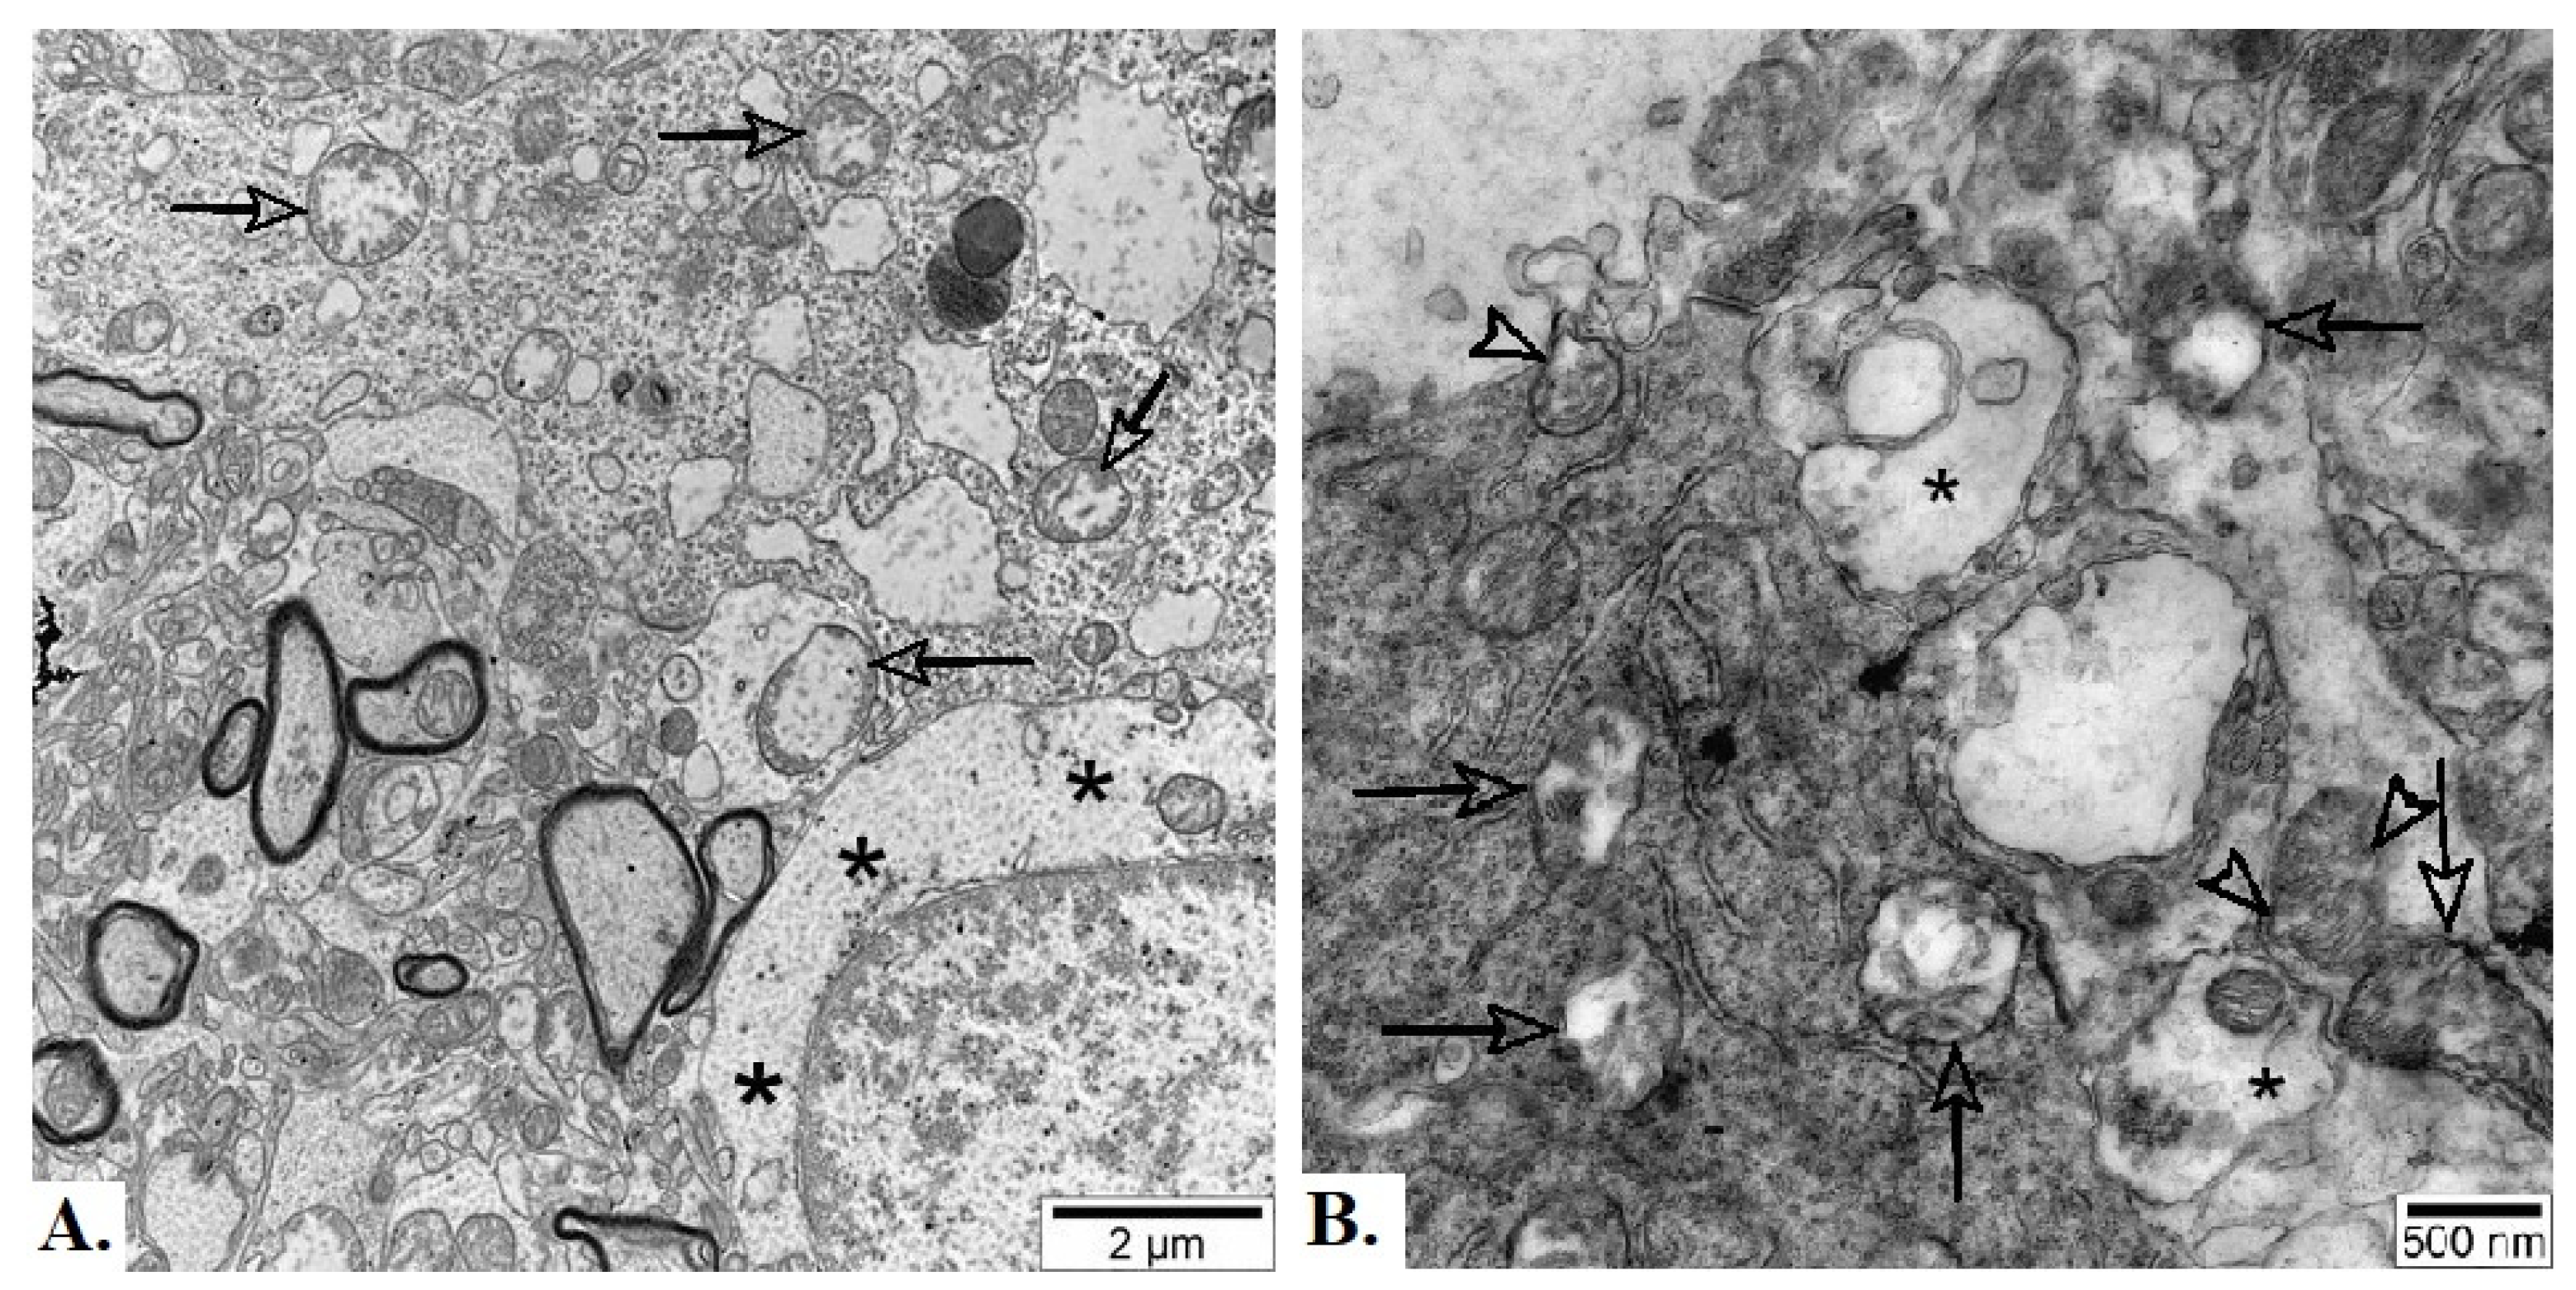
Figure 9.
Representative electron micrographs of neuropil from basolateral nucleus of amygdala of adult male Wistar rat exposed to 30 d chronic loud noise. A – Degenerate mitochondria (arrows) and neuronal chromatolysis (black asterisks), B - Degenerate mitochondria (arrows), mitochondria with protrusions (white arrowheads) and swollen presynaptic terminals (black asterisks).
Disclaimer/Publisher’s Note: The statements, opinions and data contained in all publications are solely those of the individual author(s) and contributor(s) and not of MDPI and/or the editor(s). MDPI and/or the editor(s) disclaim responsibility for any injury to people or property resulting from any ideas, methods, instructions or products referred to in the content. |
© 2025 by the authors. Licensee MDPI, Basel, Switzerland. This article is an open access article distributed under the terms and conditions of the Creative Commons Attribution (CC BY) license (http://creativecommons.org/licenses/by/4.0/).
Copyright: This open access article is published under a Creative Commons CC BY 4.0 license, which permit the free download, distribution, and reuse, provided that the author and preprint are cited in any reuse.


