
Submitted:
18 May 2025
Posted:
19 May 2025
You are already at the latest version
Abstract
The construction industry continues to lag behind other sectors in productivity, largely due to fragmented value streams, inconsistent metrics, and limited uptake of scalable process improvements. To address these shortcomings, the authors developed a novel, four-level hierarchical productivity measurement framework that integrates operational, tactical, strategic, and normative layers through a modular logic. At its core, the framework applies standardized, repeatable process steps—mapped using Value Stream Mapping (VSM)—to capture real-time indicators such as input efficiency, output effectiveness, and First-Time Quality at the operational level. These metrics are aggregated tactically through takt-time adherence, schedule reliability, and workload balance (via coefficient of variation), providing insight into trade synchronization and workflow stability. Strategic productivity is measured using flow efficiency and multi-resource utilization, while the normative level combines these metrics into an Overall Productivity Index (OPI) that also incorporates Environmental, Social, and Governance (ESG) KPIs. This article’s contribution lies in synthesizing existing productivity theories into a physically consistent, multi-scalar ontology for construction, bridging micro-level execution with macro-level decision-making. Unlike prior models that treat construction tasks or projects in isolation, our framework enables bottom-up traceability and cross-project comparability, even in fragmented and highly variable environments. In addition, the framework forms a robust foundation for future automation, robotics, and AI deployment. By structuring productivity data across abstraction levels, it facilitates real-time monitoring, machine learning integration, and intelligent control loops. Applications include sensor-equipped civil works, AI-based activity recognition, and agentic AI systems that autonomously detect bottlenecks, re-sequence workflows, and optimize resource allocation. Finally, this paper contextualizes the framework within over a century of productivity research, offering a critical review of traditional methods and highlighting how digital technologies can unlock transformative gains. The proposed framework not only advances theoretical discourse but also provides a practical measurement architecture to guide investment decisions in construction robotics, digitalization, and platform-based project delivery models.
Keywords:
Construction productivity
; hierarchical productivity framework
; Value Stream Mapping
; standardized process steps
; flow efficiency
; First‑Time Quality
; Overall Productivity Index
; Lean Construction
; modular construction toolkit
; prefabrication and off‑site manufacturing
; takt‑time planning
; workload balance (coefficient of variation)
; Internet of Things sensing
; LiDAR site scanning
; computer‑vision monitoring
; agentic artificial intelligence
; robotics and automation
; digital twins
; resource efficiency (labour
; material
; equipment)
; ESG compliance and sustainability KPIs
1. Introduction
1.1. Current Status of the Construction Sector
The construction sector is one of the largest and most consequential industries globally, essential for delivering infrastructure, housing, and economic stimulus. Despite its societal relevance and significant technological potential, construction remains burdened by persistent inefficiencies, fragmented value chains, and chronic underinvestment in innovation and digitalization [1].
Productivity growth in the construction sector has consistently underperformed compared to other sectors of the economy. Over the past two decades, construction productivity has increased by only 10%, while overall global economic productivity has risen by more than 50% [2]. On average, annual labour productivity growth in construction has remained below 1%, significantly lagging behind the 2.8% annual growth in the overall world economy and the 3.6% observed in manufacturing [2,3]. In the United States, construction productivity—measured through both labour and total factor productivity (TFP)—initially exceeded national averages in the mid-20th century but began a sustained decline in the 1970s, continuing downward for over 50 years [4].
This underperformance is not only an economic concern but also a structural one. As the McKinsey Global Institute emphasized in its landmark report, the construction sector’s productivity problems are deeply rooted in its operational model: high levels of informality, weak process standardization, poor data integration, and a project-based delivery culture that impedes learning and replication across projects [2].
In addition to economic stagnation, the sector faces escalating external pressures. Skilled labour shortages, exacerbated by demographic shifts and declining vocational training uptake, are limiting capacity across many regions [5]. Urbanization and population growth are driving construction demand to unprecedented levels—global construction output is expected to reach $22 trillion annually by 2040 [5]. Simultaneously, the industry is being called upon to decarbonize rapidly, adopt circular economy practices, and align with global climate goals such as the Paris Agreement and the UN Sustainable Development Goals [6,7].
These converging pressures underscore the urgent need for systemic transformation. Without a fundamental shift in how performance is measured, managed, and improved, the construction sector risks falling further behind in both economic and sustainability terms [8].
1.2. The Productivity Gap and Its Root Causes
The productivity gap in construction is not the result of isolated inefficiencies or localized management failures. Rather, it reflects deeply embedded structural characteristics of the industry that limit learning, scalability, and systemic improvement. Most construction projects are delivered by ad hoc, multi-organizational consortia that disband after completion. This temporary and fragmented project logic—often referred to as the “one-off factory” paradigm [9,10] —prevents knowledge transfer, hinders the replication of best practices, and fosters a chronic lack of continuity in processes, technologies, and metrics.
One of the most persistent obstacles to productivity improvement is the absence of standardized measurement practices. Key performance data are rarely captured in a uniform or comparable format across firms or projects. Even when data are collected—often manually and retrospectively—they remain siloed, inconsistent, and poorly integrated into feedback loops. As a result, productivity insights are frequently limited to the local level and cannot scale across organizations, regions, or time.
Critically, the construction industry lacks a coherent measurement ontology that connects micro-level activities (e.g., process steps or trade tasks) with macro-level indicators (e.g., project profitability, carbon performance, or ESG compliance). This structural blind spot makes it exceedingly difficult to track productivity improvements, assess trade-offs, or support data-driven decisions across the value chain. Consequently, most improvement efforts remain fragmented and reactive rather than strategic and scalable.
These systemic limitations are especially concerning given the scale of the challenge ahead. Construction activity is projected to exceed $22 trillion annually by 2040, driven by urbanization, infrastructure renewal, and housing demand [5]. Yet the sector remains ill-equipped to meet this demand efficiently. In parallel, a global shortage of skilled labour continues to deepen, making it increasingly difficult to source qualified workers for even routine construction tasks [11,12]. This shortage negatively impacts project schedules, cost certainty, and quality assurance.
Moreover, safety concerns persist, with high accident rates undermining both workforce stability and project outcomes [13]. As highlighted by Elbashbishy and El-Adaway [14], labor shortages have directly contributed to project delays, cost overruns, and quality defects over the past decade. Simultaneously, the industry faces growing pressure to align with climate goals by reducing its environmental footprint, adopting circular economy principles, and improving carbon performance [6,7].
The cumulative result of these forces—economic, technological, demographic, and ecological—is a sector increasingly constrained in its ability to deliver reliable, affordable, and sustainable outcomes. This reality is starkly illustrated in Figure 1, which compares labor productivity and total factor productivity (TFP) in the U.S. construction sector with those of the broader economy over the past 70 years. While productivity in the overall economy continued to rise, construction stagnated or declined, underscoring the persistent and widening performance gap [4,15].
1.3. Existing Approaches and Their Limitations
Over the past century, various methodologies have been developed to measure and enhance productivity in the construction industry. Traditional tools such as time-and-motion studies [16,17], Gantt charts [18,19], and Earned Value Management (EVM)[20] have provided foundational frameworks for project planning and control. EVM, for instance, integrates scope, time, and cost parameters to assess project performance objectively. However, these methods often fall short in dynamic construction environments due to their reliance on retrospective data and limited adaptability to real-time changes.
The advent of Lean Construction introduced principles [21,22,23,24,25] aimed at reducing waste and improving workflow efficiency. Techniques like the Last Planner System (LPS) [23,26] and takt-time planning [27] have been instrumental in promoting collaborative planning and continuous improvement. LPS emphasizes reliable workflow and commitment-based planning, while takt-time planning aligns production pace with customer demand to ensure steady progress. Despite their benefits, these approaches often operate in silos and lack integration with real-time data analytics, limiting their effectiveness in rapidly changing project conditions [28,29].
Emerging technologies offer promising avenues to overcome these limitations. The integration of Internet of Things (IoT) devices [30] enables real-time monitoring of equipment and environmental conditions on construction sites. LiDAR technology provides precise spatial measurements, facilitating accurate progress tracking [31,32]. Computer vision systems [33,34,35,36,37] can automate the detection and analysis of construction activities, enhancing quality control and safety monitoring. Machine learning algorithms further contribute by predicting project outcomes and optimizing resource allocation based on historical and real-time data [38,39,40,41].
However, the effective deployment of these technologies is often hindered by the absence of a unified data framework. Without standardized protocols for data collection, interpretation, and integration, the insights generated by these advanced tools remain fragmented and underutilized [42,43]. This fragmentation impedes the development of comprehensive performance metrics that can inform decision-making across all levels of a construction project. In light of these challenges, there is a pressing need for a cohesive productivity measurement framework that bridges traditional methodologies with modern technological capabilities [36,44]. Such a framework should facilitate the seamless integration of real-time data analytics into construction workflows, enabling stakeholders to make informed decisions that enhance efficiency, reduce waste, and improve overall project outcomes [45,46].
1.4. Research Contribution: A Hierarchical Framework for Construction Productivity
To address the structural limitations of existing productivity metrics in construction, this article introduces a novel hierarchical productivity measurement framework that establishes a physically consistent, multi-level ontology spanning from task execution to strategic and normative decision-making.
Unlike conventional metrics that operate in isolation—e.g., labor productivity or earned value—the proposed framework integrates four distinct levels of productivity analysis into a modular and scalable architecture:
- Operational Level: Standardized process steps are recorded through Value Stream Mapping (VSM) and analyzed via input efficiency, output effectiveness, and First-Time Quality (FTQ). This granular data foundation enables high-resolution performance diagnostics while preserving traceability across tasks and trades.
- Tactical Level: Metrics such as takt-time compliance, schedule reliability, and workload balance (expressed through the Coefficient of Variation) are used to assess trade synchronization and production flow stability. These KPIs are synthesized across process clusters and work packages.
- Strategic Level: Broader performance indicators—including flow efficiency and multi-resource utilization—capture the coordination of trades, disciplines, and modules across spatial and temporal interfaces within the project environment.
- Normative Level: The framework culminates in a composite Overall Productivity Index (OPI), combining quality, efficiency, and effectiveness metrics with sustainability and ESG considerations to inform organizational learning and capital allocation.
This multi-scalar approach bridges the long-standing gap between micro-level task performance and macro-level governance. It supports both horizontal comparability across projects and vertical integration from the jobsite to the enterprise layer.
The novelty of the framework lies in its ability to provide a bottom-up aggregation pathway, enabling real-time productivity control, cross-project benchmarking, and digital twin integration. By aligning measurement logic with production ontology (Process Step → Component → Module → Project), the system is natively compatible with automation and AI integration.
It establishes the data infrastructure required for intelligent construction systems:
- IoT-based real-time sensing,
- computer vision–enabled activity tracking,
- and agentic AI systems capable of autonomous workflow re-sequencing and predictive bottleneck elimination.
Grounded in systems theory and Lean Production logic, this framework contributes both a conceptual foundation and a practical roadmap for scaling productivity solutions in industrialized and digitized construction settings. It supports evidence-based investment decisions, empirically testable hypotheses, and technology-enabled transformation across project delivery models.
A discussion of framework limitations and planned validation efforts—including simulation environments and empirical use cases—is provided in the final section of this article.
2. Historical Context and Current State of the Research Field, Traditional Methods of Productivity Measurement (the Past 100 Years)
2.1. Early Scientific Management and Time-Motion Studies (1900s–1920s)
Modern productivity analysis in construction traces back to the early 20th century, influenced by scientific management. Pioneers like Frederick W. Taylor and Frank and Lillian Gilbreth applied time-and-motion studies to labour-intensive tasks [47]. By carefully observing and timing each step of work, they established “standard times” and streamlined workflows. A famous example is Frank Gilbreth’s bricklaying study: by eliminating unnecessary motions and optimizing the work setup, he reduced the motions per brick from 18 to 5 (in some cases even 2)[48]. This innovation tripled labour output – bricklayers on a project using Gilbreth’s methods achieved about 350 bricks per hour compared to the typical 120 bricks/hour with older methods [48]. Such early studies demonstrated the huge gains possible through methodical measurement and improvement of work processes. They laid the groundwork for productivity as a science, introducing concepts of work sampling and method engineering to construction. The advantages were clear: managers could establish baselines for how long tasks should take and identify inefficiencies in workers’ motions, leading to improved techniques and training that boosted output. A limitation, however, was that these studies were labour-intensive to conduct and often viewed with scepticism by workers (who sometimes resisted changes to ingrained habits). Despite that, time-and-motion analysis became a foundational practice, evolving into what we now call methods engineering – a widely accepted approach to refine work systems for higher efficiency [47].
2.2. Gantt Charts and Project Scheduling (1910s–1950s)
In parallel with labour-focused studies, construction adopted project management tools to plan and track progress. The Gantt chart, introduced by Henry L. Gantt around 1910, was an early breakthrough [49,50]. It visualized project tasks on a time scale, allowing managers to schedule work and monitor actual progress against the plan. Gantt originally developed this bar-chart schedule to [49]. During World War I, Gantt charts were used on large government projects, and they gained popularity in construction thereafter. Early Gantt charts were drawn by hand, requiring updates to be redrawn entirely – but they provided a powerful overview of project status. By the mid-20th century, Gantt charts (and their successors) had become standard in construction management, and by 1999 they were noted as “one of the most widely used management tools for project scheduling and control” [49,50]. These charts, and later network scheduling methods like CPM/PERT in the 1950s, enabled planners to sequence activities, allocate labour and equipment, and predict project duration. The advantage was a more structured project timeline and the ability to identify critical activities that could bottleneck progress. However, schedules were often maintained separately from day-to-day field data, relying on periodic updates from site personnel. Thus, while Gantt charts greatly improved planning, their effectiveness in measuring actual productivity depended on accurate manual reporting of progress. In practice, superintendents often walked the site (“management by walking around”) to judge how much of a task was complete and then updated the chart. This introduced subjectivity and lag into the process. Still, the Gantt chart and its descendants provided an industry-standard framework for tracking work and became an indispensable traditional tool for productivity analysis at the project level.
2.3. On-Site Observational Methods – Work Sampling and Time Tracking (1940s–1980s)
As construction projects grew in scale, systematic field data collection methods emerged. One widely adopted technique was work sampling, which uses statistical sampling to estimate the proportion of time workers spend in various states (productive work, supportive work, or idle). In a typical work sampling study, an observer makes random visits or observations of workers and records what each person is doing (e.g. “laying bricks” vs. “waiting for materials”). By accumulating thousands of observations, managers can quantify labour utilization – for example, finding that Crew A is productive 50 % of the time, 30 % on support tasks, and 20 % idle. This method, introduced to construction by the mid-20th century, provided an objective, quantitative view of productivity on-site without continuously timing tasks. It highlighted inefficiencies (like frequent waiting or unnecessary travel) that might not be obvious anecdotally. The Method Productivity Delay Model (MPDM), proposed by Adrian and Boyer in 1976 [51], formalized a similar approach of categorizing time losses and measuring “tool time” (direct work time) vs. delays [51]. Supervisors also used simpler variants such as daily activity logs and delay surveys – foremen would note delays or reasons for downtime, and questionnaires gathered craftsmen feedback on issues affecting productivity. All these observational methods evolved into common practice for tracking field productivity. Their advantage was that they identified how labour hours were actually spent, enabling targeted improvements (e.g. adding a materials handler if work sampling showed excessive idle time waiting on supplies). They were also relatively low-tech and adaptable – for instance, by the 1980s an observer might use a handheld counter or an “intervalometer” camera to assist in capturing work sampling data [51]. The limitations included the need for many observations to achieve statistical confidence (on the order of several thousand data points for 95 % confidence [51]), which could be time-consuming. Observers had to be properly trained to avoid bias, and the data provided percentages but not always root causes. Moreover, smaller contractors often skipped formal work sampling due to the effort and cost, instead relying on informal judgements (“eye-balling” crew performance) which could be less accurate. Despite these challenges, work sampling and similar field studies became a staple of construction productivity analysis, and findings from such methods informed project control decisions throughout the late 20th century.
2.4. Unit Rate Tracking and Early Productivity Standards (1960s-1980s)
Alongside direct observations, the industry gravitated to simple quantitative metrics such as unit rates – the work-hours required per unit of work put in place [17]. By tracking how many hours were spent to install a certain quantity (e. g. cubic meters of concrete poured per crew-day), contractors could measure productivity in a straightforward way. Over time, databases of standard production rates were compiled (for example, guides that say a mason can lay X bricks per hour under normal conditions). These became benchmarks for estimating and for evaluating field performance. In the 1960s, large U.S. owners and government agencies pioneered Earned Value Management (EVM) as a project control technique that integrated cost and schedule metrics [20]. EVM introduced the idea of measuring work performed (earned value) against work planned and actual cost, yielding indices that indicate productivity and efficiency. For instance, a cost performance index (CPI) less than 1.0 means the project is using more resources than planned (lower productivity), and a schedule performance index (SPI) less than 1.0 means less work is completed than scheduled (behind pace). By 1967 the U.S. Department of Defense had formalized such approaches (the C/SCSC criteria), and by the 1980s EVM was spreading beyond government contracts as a best practice [20]. Many large construction projects adopted EVM to get early warnings of productivity issues through objective data. The advantage of unit rate tracking and EVM was that they provided quantitative, standardized measures that could be compared across projects and over time. A contractor could quickly see if a crew’s output per day was below the historical norm and investigate why. Likewise, EVM’s integration of scope, time, and cost allowed more holistic productivity assessment at the project level – a significant improvement over looking at costs or schedule in isolation. The limitations were that these methods still relied on accurate data collection (if timesheets or progress reports were wrong, the metrics would be misleading). Early on, there was also a lack of uniform definitions – as a 1977 U.S. Construction Industry Cost Effectiveness (CICE) study found, there was “no common definition of construction productivity” and wildly varying ways to measure inputs/outputs, making comparisons nearly impossible [17]. This realization led to efforts in the 1980s by groups like the Business Roundtable and the newly founded Construction Industry Institute (CII) to standardize productivity measurement. CII’s task force in 1983 adopted a clear definition – productivity = work-hours per unit of work, i. e. a lower value indicates higher productivity [17] – and developed a manual for task-level productivity measurement to guide contractors [17]. These initiatives helped turn ad-hoc company practices into industry standards. By the late 20th century, many contractors had formal productivity tracking systems (often as part of cost control systems), and project managers routinely used metrics like labour hours/quantity and earned value indices to gauge performance. A drawback, however, was that collecting and inputting the data for these systems generated overhead. Indeed, CII found many contractors did not measure labour productivity regularly, often citing the complexity and cost of doing so [17]. Those that did measure tended to do so infrequently or only on select activities, limiting the usefulness of the data for real-time control. In summary, unit rate and earned value methods brought rigor and comparability to productivity analysis, but in practice they were only as good as the (often delayed) data fed into them.
2.5. Evolution into Industry Standards and Lean Practices (1990s–2000s)
Entering the late 20th century, the accumulated traditional methods – time-motion studies, scheduling tools, work sampling, unit rate tracking, and EVM – formed the backbone of construction project controls. These were augmented by the rise of Lean Construction principles in the 1990s, which drew inspiration from Toyota’s lean manufacturing. Lean methods (like the Last Planner System of production planning and techniques such as takt time planning) sought to improve productivity by eliminating waste and smoothing workflow. Although lean is more of a management philosophy than a measurement tool, it introduced its own metrics (for example, Percent Plan Complete, which tracks planning reliability) and it reinforced the practice of continuous monitoring and improvement. By applying lean, many projects saw reduced idle time and better coordination, which translated to higher labour productivity. Traditional observational methods also benefited from technology: for instance, by the 2000s, supervisors could capture field data with handheld devices or use simple programs (spreadsheets with macros) to automate calculations of productivity. Project scheduling moved from paper to software (e. g. Microsoft Project, Primavera), making Gantt charts easier to update and share. These incremental evolutions addressed some limitations – data could be processed faster and with fewer errors – but fundamental challenges remained. Traditional methods were still largely manual, retrospective, and fragmented. Typically, data on work hours, quantities installed, and delays might be compiled at the end of each day or week, then analysed and acted upon after a lag. This meant that by the time poor productivity was recognized (say, a crew falling behind schedule), the project may have already suffered schedule slippage or cost overruns. As one expert noted, many construction managers would only discover problems 4 – 8 weeks after they arose, when those issues had already impacted the project. In essence, traditional practices provided a necessary foundation and significant improvements over unmeasured work, but they often couldn’t keep pace with the dynamic, complex reality of large projects. Recognizing these limits set the stage for the industry’s recent push towards real-time, technology-enhanced productivity measurement.
2.6. Summary of Advantages and Limitations
Traditional productivity measurement methods gave construction management a toolkit to plan, monitor, and improve performance. Advantages included the ability to set clear expectations (through standard time studies and unit rates), organize work efficiently (via Gantt charts and CPM networks), identify and quantify inefficiencies (using work sampling and delay analysis), and track overall project health (with earned value metrics). These methods, many of which became formal industry standards, undoubtedly helped improve productivity over the baseline of unstructured work – for example, lean and workflow optimization efforts have been shown to significantly reduce waste and boost efficiency on projects. However, limitations persisted. Data collection was mostly manual and infrequent, leading to delayed feedback. Measurements were often siloed – one system for schedule, another for cost, another for daily logs – making it hard to get a unified view in real time. Human judgment played a big role in observations and estimates, introducing variability and bias. And despite attempts at standardization, differences in how companies or regions measured productivity made benchmarking difficult [17]. These shortcomings meant that by the early 21st century, construction was still plagued by unpredictable performance and only modest productivity gains. This context created a strong motivation to innovate, paving the way for new technologies and methods in the last decade aimed at more accurate, real-time, and integrated productivity analysis.
3. Review of Existing Productivity Metrics and Frameworks
While Section 1 outlined the systemic roots and practical consequences of the construction productivity gap, this chapter reviews the current landscape of academic and applied research on productivity measurement in the built environment. The aim is to identify conceptual blind spots, methodological fragmentation, and operational constraints that continue to limit the sector’s ability to quantify, compare, and systematically improve productivity performance.
Understanding this persistent gap requires a multi-decade review of how productivity has been defined, operationalized, and interpreted across disciplines. Classical indicators such as labour productivity and Total Factor Productivity (TFP) [52] remain dominant, particularly in macroeconomic and institutional benchmarking. However, these aggregate metrics often fail to capture the complexity and heterogeneity of construction projects, which vary widely in duration, scope, location, and delivery method.
More recent developments have introduced flow-based performance models [22,23,25,53], digital measurement systems [34,37], and efforts to integrate automation and AI into real-time productivity tracking [46,54,55,56]. These innovations offer new possibilities but also raise critical questions. How scalable are flow-based metrics across fragmented project environments? How can automation and robotics be leveraged to improve productivity in both off-site manufacturing and on-site construction activities? And what degree of standardization using production systems is achievable in a sector still dominated by one-off project delivery? This section critically reviews the evolution of productivity measurement in construction, draws on key publications across multiple decades, and highlights areas of contention, including the suitability of TFP in heterogeneous project environments [57], the debated impact of automation and robotics on labour dynamics [58,59], and differing perspectives on the scalability and standardization potential of modular construction [60]. By comparing converging and diverging hypotheses, we aim to provide a balanced synthesis that lays the groundwork for the hierarchical productivity framework proposed in this article. This section synthesizes the evolution of productivity frameworks in construction by juxtaposing foundational theories with emerging digital practices. We highlight tensions and trade-offs between precision and scalability, between system-level KPIs and process-level observations, and between industry aspirations for automation and the reality of deeply entrenched delivery models. Through this critical synthesis, we aim to establish the epistemic and practical gaps that our proposed hierarchical productivity framework—presented in Section 4 of this paper—is designed to address. The review serves not only to position our contribution in relation to existing scholarship but also to outline why a new, multi-scalar, and ontology-driven approach to productivity measurement is both timely and necessary.
3.1. Productivity in Construction: Perceptions, Metrics, and Conceptual Foundations
Productivity in construction remains one of the most contested and complex phenomena in both academic and industry discourse. While the term is widely used, its definitions, measurement units, and interpretation vary considerably across contexts. In general terms, productivity refers to the relationship between output and input, but its operationalization in construction must account for the sector's inherent fragmentation, variability, and project-based delivery logic.
From a macroeconomic perspective, the dominant productivity metrics include:
- Labor productivity, typically expressed as output (e.g., value added) per labor hour;
- Capital productivity, which considers the return on equipment and infrastructure investment;
While these indicators offer high-level benchmarking capabilities, their application in construction is problematic. Heterogeneity in project size, scope, contract type, geography, and work organization undermines the comparability of aggregate productivity data. Moreover, conventional definitions often fail to differentiate between process efficiency („doing things right“) and output effectiveness („doing the right things“), both of which are critical to construction performance but not always aligned.
To further explore how productivity is perceived at the project level, Figure 2 summarizes the results of a recent industry-wide survey conducted by the Royal Institution of Chartered Surveyors (RICS) [62]. The figure shows how practitioners assess the relative impact of various factors on productivity outcomes. Notably, skilled labour availability is overwhelmingly rated as the most critical productivity driver. In contrast, interventions such as construction equipment, tools, and even off-site prefabrication are often perceived as having only moderate or low impact.
This ranking reflects a persistent belief in the primacy of human labour as the dominant performance factor—an assumption that has long shaped managerial priorities in the industry. However, it also reveals a possible misalignment between practitioner perceptions and emerging evidence on the transformative potential of automation, robotics, and AI-based coordination systems. As recent studies suggest, technological interventions can yield significant performance gains—particularly when integrated with modular, data-driven workflows and standardized measurement architectures [34,45,46,53].
Thus, while industry perceptions provide valuable insights into existing mental models and investment preferences, they must be empirically validated against measurable performance outcomes. Understanding this perceptual–empirical gap is crucial for designing productivity frameworks that are both grounded in practice and informed by systemic evidence.
3.2. Measurement Levels and Multi-Scale Productivity Perspectives
Productivity—defined broadly as the ratio of outputs to inputs—is a cornerstone of construction performance analysis [63]. Yet, unlike in manufacturing, its measurement in construction is characterized by heterogeneity in units, levels of observation, and conceptual clarity. Productivity is commonly quantified as labour productivity, typically expressed in terms of output per worker or per labour-hour. This can refer to physical quantities (e.g., square meters of wall built per worker-hour) or financial metrics (e.g., value added per labour-hour) [64]. The practical appeal of such metrics lies in the relative accessibility of labour and output data on construction sites.
Complementary to labour-based metrics is capital productivity, which relates outputs to investments in equipment, machinery, and plant. Both labour and capital productivity, however, capture only partial aspects of construction performance. To provide a more comprehensive picture, researchers increasingly refer to Total Factor Productivity (TFP), which compares total outputs with a weighted aggregate of all major inputs, including labour, capital, materials, and energy [64]. TFP is particularly valuable for assessing efficiency improvements where outputs increase without proportional increases in total input—such as through process innovation or automation.
Importantly, construction productivity operates across multiple levels of granularity:
- At the task or trade level, metrics focus on specific activities (e.g., cubic meters of concrete poured per crew-hour).
- At the project level, broader indices combine labour and cost metrics to reflect overall efficiency (e.g., square meters delivered per euro or per man-day).
- At the industry level, productivity is typically reported through national statistics or macroeconomic surveys based on value added, capital stock, and labour data.
These metrics differ not only in scale but also in the type of insight they provide. While task-level metrics offer detailed process diagnostics, project-level indices link productivity to management and coordination quality. Industry-level indicators support policy benchmarking but are often disconnected from field-level realities.
Moreover, common productivity metrics frequently conflate planned and actual performance or mix units inconsistently—leading to limited comparability and interpretability. To address these issues, Figure 3 introduces a conceptually rigorous and physically coherent productivity model that differentiates between:
- Planned Productivity (PP): The expected output per planned input;
- Actual Productivity (AP): The realized output per actual input;
- Efficiency (η): The ratio of planned input to actual input, indicating resource use;
- Effectiveness (ε): The ratio of actual output to planned output, indicating goal fulfillment;
- Productivity Index (PI): A composite metric defined as η × ε, integrating both dimensions.
This multi-dimensional framework avoids the unit inconsistencies of traditional approaches and provides a logically structured, modular foundation for productivity measurement at multiple levels. It is designed to support both theoretical interpretation and field-level application—serving as a key building block for the hierarchical productivity framework presented in Section 4.
3.3. Challenges in Standardization and Data Coherence
A persistent obstacle in construction productivity research lies in the lack of standardized, consistent measurement systems that are both practically implementable and theoretically robust. Unlike manufacturing—where outputs are repetitive, measurable, and typically uniform—construction delivers heterogeneous, project-specific results. Roads, bridges, hospitals, and residential buildings vary in scope, complexity, and delivery model. Even within similar project types, site conditions, materials, and labour practices introduce variability that undermines benchmark comparability [64].
This diversity creates a fundamental challenge: there is no common unit of output in construction. While a manufacturer can count cars produced, a contractor might quantify outputs in square meters, cubic meters, linear meters—or not at all. Attempts to compare productivity across projects become meaningless without coherent normalization or context-specific reference points. As noted in recent industry studies (e.g., Singapore Construction Productivity Framework), current metrics are often described as "patchy," fragmented, and inconsistently applied [64].
- (1)
- Overreliance on Single-Factor Indicators: Labor productivity remains the most frequently cited metric in both research and practice, yet it captures only one dimension of performance. A crew may appear more productive in labour terms by increasing equipment usage or material throughput, while total resource efficiency may decline. Hence, labour productivity can be misleading if viewed in isolation—especially in capital- or technology-intensive environments [63].
- (2)
- Activity-Level Myopia and Lack of System View: Productivity metrics often focus on individual trades or isolated tasks (e.g., cubic meters of concrete placed per hour). However, construction outcomes result from interdependent workflows. Gains in one area (e.g., faster rebar placement) can disrupt others (e.g., delays in inspections or follow-on trades). This lack of systemic perspective undermines the validity of task-level metrics as proxies for overall project performance [63].
- (3)
- Macro–Micro Disconnect: There is a well-documented disjunction between project-level data and macroeconomic indicators. National or industry-wide productivity reports may show stagnation or decline, while individual projects report local gains—often due to methodological mismatches in data aggregation, output definitions, or sector-level adjustments [63]. This misalignment hampers policy relevance and undermines trust in reported figures.
- (4)
- Absence of Harmonized Data Infrastructure: Unlike manufacturing, construction lacks centralized reporting platforms for performance data. Measurement practices are typically firm-specific, undocumented, and manually conducted. This lack of structured, interoperable datasets impedes benchmarking, comparison across firms or regions, and broader research on best practices [63].
In response to these challenges, researchers have proposed more composite and multi-level productivity models. For example, Ayele and Fayek [57] introduced a Total Productivity Framework for construction that incorporates labour, materials, equipment, and energy at multiple observation levels. Their approach enables more nuanced, resource-agnostic productivity assessment across projects and firms [64]. Similarly, Sacks et al. [66,67] advocate for system-oriented productivity models grounded in Lean Construction and BIM-enabled workflows, which capture process reliability, coordination, and lifecycle performance—rather than just output-input ratios.
Nonetheless, achieving industry-wide standardization remains a formidable challenge. Productivity metrics must balance simplicity for site-level application with comprehensiveness for strategic decision-making. Too much abstraction undermines adoption; too much granularity impedes scalability. Navigating this tension between practicality and precision remains one of the core methodological dilemmas in construction productivity research [63].
3.4. Fragmentation, Silo Thinking, and the One-Off Nature of Projects
A defining characteristic of the construction industry—one that profoundly affects productivity—is its high degree of fragmentation across organizational structures, knowledge domains, and process interfaces. Unlike manufacturing, where integrated firms operate stable, repetitive workflows within vertically coordinated supply chains, construction projects are typically delivered by temporary, project-specific coalitions of independent actors. These include clients, architects, engineers, general contractors, and a host of subcontractors and suppliers, each with their own incentives, information systems, and operational routines [68].
This project-based delivery model, often described as the "one-off factory" paradigm [69], implies that each construction site functions as a bespoke production system—with unique participants, processes, and constraints. After project completion, teams dissolve, knowledge dissipates, and organizational learning is lost. The lack of continuity prevents cumulative innovation, as successful practices from one project are rarely transferred to subsequent ones in a systematic manner. Organizationally, this leads to siloed responsibility and limited collaboration. Traditional procurement methods such as Design–Bid–Build (DBB) reinforce the separation between disciplines and phases. In DBB, the design team is contractually isolated from the construction team, and both may be disconnected from facility operators and users. This transactional fragmentation fosters mistrust, adversarial dynamics, and inefficiencies at the interfaces between design, procurement, and execution [70].
Process-wise, data flows are non-integrated, with information often recreated, lost, or reinterpreted at each handover. As a result, productivity-related insights (e.g., output rates, cost efficiencies, error rates) are rarely captured in reusable formats. Moreover, subcontracting arrangements typically lack transparency and shared KPIs, making system-wide performance monitoring difficult. Epistemically, fragmentation manifests in divergent definitions of productivity across trades and stakeholders. A subcontractor may define success as maximizing crew utilization; a general contractor may focus on schedule adherence; the client may prioritize cost-per-square-meter. Without aligned metrics and shared frameworks, productivity analysis becomes subjective and non-comparable [71,72].
The consequence is a sector structurally resistant to continuous improvement. Innovations such as Lean Construction [21,22,23,53,73,74,75], Integrated Project Delivery (IPD)[76,77,78], and Building Information Modelling (BIM)[43,45,58,79,80] have been proposed to overcome these silos, yet adoption remains inconsistent and context-dependent. Without mechanisms for longitudinal knowledge retention and organizational learning, the sector remains trapped in a cycle of repetition without accumulation—rebuilding not just projects, but also its own inefficiencies. Construction’s endemic fragmentation—organizational, procedural, and cognitive—creates conditions under which productivity cannot be reliably measured, improved, or scaled. Overcoming this requires not only technical solutions, but a reconfiguration of roles, responsibilities, and information structures across the project lifecycle.
3.5. External Variability and Systemic Dependencies
In addition to internal fragmentation and siloed processes, the construction sector is uniquely exposed to a wide range of external variables and systemic interdependencies that can significantly distort productivity measurements and impair performance management. Unlike manufacturing, which operates under tightly controlled conditions, construction unfolds in dynamic, often unpredictable environments, where operating conditions vary daily, seasonally, and across locations [81].
One of the most prominent external influences is weather. Rain, snow, extreme heat, and wind can delay or suspend site activities—particularly those performed outdoors or at height. These weather-induced delays are largely uncontrollable and do not reflect the underlying efficiency of work crews or management. Nonetheless, they reduce output per labour-hour, thereby depressing measured productivity without indicating any process-level failure [64,82].
Beyond meteorological factors, construction depends on interconnected and often fragile supply chains. Projects require timely delivery of diverse materials, components, and equipment—many of which are sourced globally. Disruptions in transportation, customs, or supplier logistics (e.g., due to strikes, port congestion, or raw material shortages) can create downstream bottlenecks that idle on-site resources. In such cases, productivity loss is not a result of local inefficiency, but of systemic vulnerability to supply-side interruptions [83,84].
Site location and logistics further amplify variability. Urban construction projects face access restrictions, delivery windows, and spatial constraints that reduce operational efficiency. In contrast, remote or rural projects may suffer from poor infrastructure and longer lead times for workforce or material mobilization. These geographical conditions directly affect task pacing, buffer times, and crew sequencing—thus distorting productivity baselines across contexts [64].
Regulatory compliance is another often-overlooked factor. Construction must adhere to numerous legal and administrative requirements, including permitting, inspections, environmental controls, and safety regulations. While essential, these procedures frequently introduce non-productive time, waiting periods, and iterative rework—particularly when regulatory frameworks are misaligned or inconsistently enforced across jurisdictions [85].
Finally, the industry’s continued dependence on skilled labour creates exposure to labour market volatility. Shortages of qualified workers, regional wage pressure, and turnover risk can reduce task performance or require reliance on less-experienced substitutes. Extended overtime, while often used to mitigate schedule delays, can further reduce productivity due to fatigue and error propagation [14,71,72].
Together, these external influences create a high degree of contextual variability that complicates both the measurement and management of productivity. Macro-level indicators tend to smooth over these local fluctuations, while micro-level metrics often fail to distinguish between endogenous inefficiencies and exogenous constraints. This misalignment results in a macro–micro disconnect: a project may be executed efficiently under challenging conditions, yet appear unproductive in statistical terms. Addressing this problem requires context-sensitive productivity models that can account for variable baselines, normalize performance against exogenous factors, and distinguish controllable from uncontrollable causes of inefficiency. Without such differentiation, attempts at standardization or benchmarking risk penalizing well-managed projects simply because they operate in more demanding environments [63].
3.6. Lessons from Manufacturing: Flow, Modularity, and Standardization
While the construction sector continues to grapple with stagnant productivity, the manufacturing industry has achieved decades of consistent performance gains. Rather than emphasizing why construction lags, this section distils transferable principles from manufacturing that can inform productivity strategies in the built environment—without neglecting the fundamental differences between the two sectors.
Manufacturing success is largely rooted in four interconnected principles [86]:
- Process standardization to reduce variability and ensure repeatability;
- Modularization and prefabrication to enable efficient assembly and reduce onsite complexity;
- Automation and robotics to increase throughput and minimize human error;
- Integrated supply chains to synchronize material, information, and process flows.
Each of these principles has analogues in construction, but they are applied unevenly due to the project-based, non-repetitive, and geographically dispersed nature of construction delivery systems. Unlike factory production, construction projects are temporary coalitions operating in variable environments with limited feedback loops and fragmented supply structures [86].
Still, modularization and off-site manufacturing offer particularly promising pathways for adaptation. Prefabricated building components, such as volumetric modules, curtain wall systems, and multi-trade assemblies, allow for the relocation of value-adding activities into controlled factory settings, where process improvements can be codified and scaled. This not only reduces rework and weather-related delays but also facilitates the use of automated tools such as robotic welding, CNC-based timber fabrication, and AI-driven quality control [87,88].
Yet, the goal is not to mimic manufacturing’s model wholesale, but to implement context-aware hybridization. For example, while mass production in automotive favours low variability and high volume, construction must remain flexible to accommodate client-specific design, site conditions, and regulatory constraints. Concepts such as mass customization, digital twins, and Lean-driven takt planning allow for adaptable standardization—offering both efficiency and contextual responsiveness [89].
Furthermore, manufacturing teaches the value of systemic integration: when upstream design, procurement, and production are aligned through digital platforms and shared KPIs, waste is reduced and predictability increases. In construction, such integration is possible via BIM-enabled coordination, early contractor involvement, and platform-based industrialization models, where standard interfaces and modular logic govern otherwise custom outcomes [90].
Importantly, successful transfer requires more than technology. It demands organizational change, cultural openness, and capability development across firms and project teams. Without this adaptive infrastructure, even advanced tools remain isolated experiments. Construction can draw valuable lessons from manufacturing—particularly regarding the power of flow-centric thinking, standardized modularity, and digitally integrated systems. These insights lay the conceptual foundation for the hierarchical productivity framework proposed in Section 4, which seeks to reconcile the granularity and variability of construction with the control logic and scalability of industrial systems [5].
4. A Unified Hierarchical Framework for Productivity Measurement in Construction
This section introduces the authors’ original contribution: a hierarchical productivity measurement and control framework developed from first principles through conceptual synthesis, rather than adapted from existing models. Our framework advances the current state of the art in construction productivity research. While prior studies have focused either on micro-level task productivity or macroeconomic indicators at the national or industry level, a cohesive model that structurally integrates these layers has been missing. Our framework addresses this critical gap by systematically linking operational, tactical, strategic, and normative levels through a unified performance ontology.
Whereas conventional productivity models often treat activities in isolation—differentiating between so-called primary and secondary value creation—our framework is grounded in flow-based logic. It rejects this binary distinction and instead conceptualizes all functions as interdependent elements of a continuous production stream. Each layer of the hierarchy contributes to value creation, not through its classification as “core” or “supporting,” but through its role in ensuring flow, quality, and systemic alignment.
The framework further recognizes that productivity manifests differently across scales: at the operational level, efficiency—"doing things right"—is paramount, whereas at the strategic and normative levels, effectiveness—"doing the right things"—becomes the primary driver. Our model unifies these dimensions by embedding them within a scalable, modular structure, making productivity observable, measurable, and controllable across projects, firms, and ecosystems.
This contribution builds on, but extends beyond, existing approaches by explicitly integrating Lean Construction principles, flow optimization metrics, and hierarchical KPI structures into one consistent system. It forms the core theoretical foundation for the control framework and empirical validation strategies discussed in the following sections. In short, this section marks the transition from conceptual critique to architectural proposition: from identifying the productivity gap to formally structuring how it can be closed.
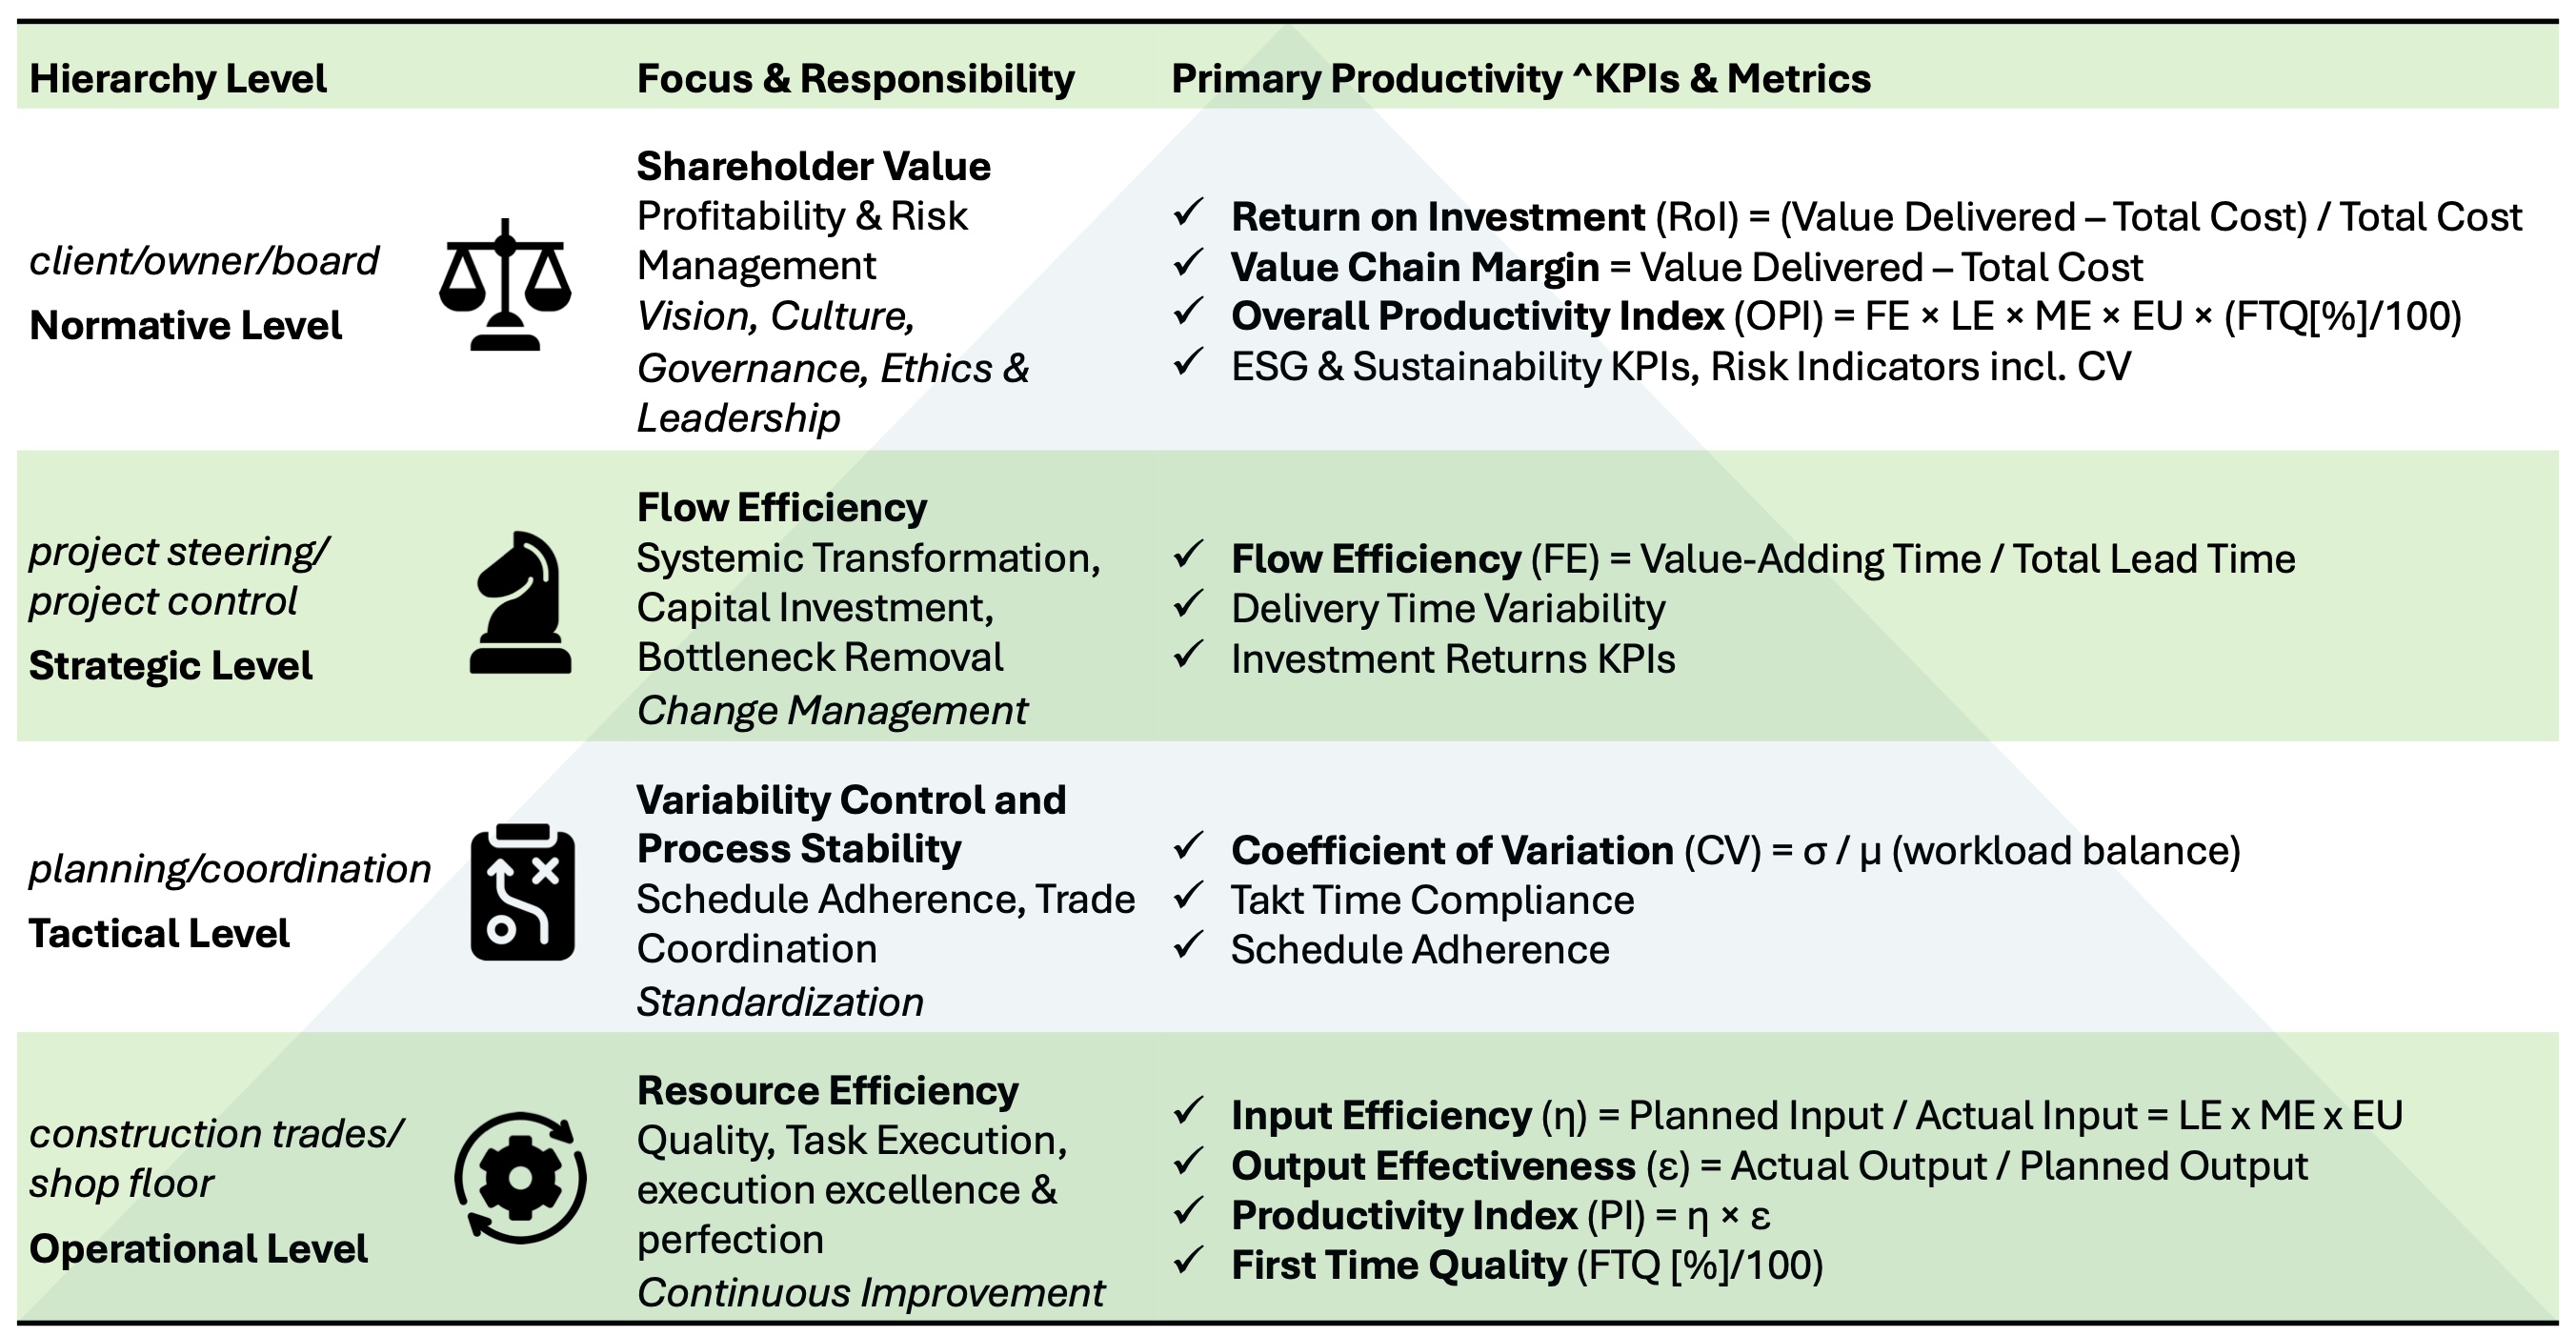
4.1. Operational Level
The starting point for productivity measurement and optimization in construction lies at the operational or shop floor level. This is the level where physical value creation takes place—where materials, labour, and equipment converge to execute planned construction tasks.
Building on a modular-construction toolkit [91], the process-step level—that is, the individual tasks carried out on the shop floor—becomes the anchor point for meaningful productivity measurement. Every onsite activity is broken down into discrete, standardised process steps, such as “position rebar cage”, “place formwork panel”, or “pour concrete”. These steps are repeatable units: they occur in essentially the same way, regardless of project size, building type, or site peculiarities. Because they are constant, they provide a common standard for comparison across projects, and even companies (Figure 4). Standardising at the process-step level does not impose uniformity on the finished building; rather, it establishes a universal production vocabulary. Each step is given a clear definition, an expected sequence, and a reference time—derived from empirical observations, time-and-motion studies, or parametric estimates.
Using Value Stream Mapping (VSM) at this level of detail, each shop-floor process is laid out as a continuous flow of interconnected production steps (see Figure 4). In a construction context, VSM is applied to visualise the production of an individual Building Component—the smallest repeatable unit we track for productivity. A Building Component is a subset of a broader Construction Module: for example, one bored pile in a bored pile wall or a single room of complete floor. Although modules and their constituent components vary from project to project, each individual component can still be represented as a standardised sequence of value-adding process steps [91].
From a production-flow perspective, therefore, the manufacture of any building component can be decomposed into its own value stream—a step-wise, left-to-right representation that shows how materials, information and resources move through drilling, reinforcing, concreting, and so on.
Shingo ’s distinction between process and operation is a pillar of Lean manufacturing [92,93,94]. In his original model the process runs horizontally (X-axis) as the value stream, while the operations—the discrete work steps at each station—run vertically (Y-axis). When this concept is transposed to construction, a station can be associated with a Production Step as sketched in Figure 4. However, in construction not the product is flowing from station to station, the production is flowing through the product:
On a construction site, the vertically oriented operation axes, representing the sequence of sub-steps that together constitute a complete Production Step (e.g. drilling process of a bored pile, or drywall construction in a single room); whereas the process axis represents the flow of Production Steps creating a Building Component.
By treating these standardised activities as modular process steps, teams gain a powerful toolkit for systematizing performance analysis and continuous improvement. Each process step is defined in a consistent, repeatable manner—enabling direct comparability across projects, teams, and contexts. This modularity unlocks several core capabilities:
- Benchmarking performance: Actual task durations and resource usage can be compared against standard benchmarks derived from the Value Stream Map (VSM) of a given Building Component. These benchmarks represent the sum of expected durations for standardized process steps plus idealised logistics times (assumed to be zero in a just-in-time setup). This enables calculation of performance deviations at the level of individual construction elements.
- Benchmarking productivity: Similarly, productivity can be evaluated as the ratio of resource input (e.g. labour hours) to the actual output (e.g. installed area or component volume), allowing for quantifiable comparisons of work efficiency across different crews, shifts, or sites.
- Waste identification: Discrepancies between standard and actual sequences (e.g. idle time, rework, excessive motion) become visible within the process step model, highlighting bottlenecks and non-value-adding activities for elimination.
- Transfer of best practices: Because a process step such as “pour concrete” is identically defined across projects, successful strategies and learned optimizations from one site can be directly transferred to another, reinforcing organizational learning.
Thus, the process-step level serves as the industry’s ground truth for standardisation and continuous improvement, converting diverse construction workflows into a set of comparable, measurable, and optimisable units. Integrated metrics such as Input Efficiency, Output Effectiveness, and First Time Quality percentages are applied at the process step level, enabling granular tracking of performance. These metrics feed into a composite Productivity Index (PI), which quantifies how efficiently resources are being transformed into value-added outputs, which are the Building Components.
Moreover, this flow-based structure, broken down in standardised Process steps, supports real-time performance and productivity monitoring, especially in process domains where sensor-equipped machinery is used (e.g., special civil engineering tasks like Kelly drilling). In such cases, data collection can be automated and linked directly to process steps through AI-based pattern recognition as outlined in [91].
Even in conventional building construction, where the degree of automation is significantly lower than in specialized civil engineering, there remains substantial potential for implementing effective productivity tracking mechanisms. The advancements in artificial intelligence (AI) are creating new opportunities for enhancing data accuracy and reducing the burden of manual observation. AI technologies, particularly those involving computer vision, machine learning, and pattern recognition, can be trained to identify and classify recurring construction activities from images, video footage, or sensor data. These systems can map observed actions to specific, predefined process steps within the modular construction toolkit, enabling automated process recognition even in environments not originally designed for full automation.
Ultimately, the operational level—enriched through modular standardization, systematic measurement, and data-driven analysis—becomes a critical enabler of continuous productivity optimization. It transforms construction sites from reactive environments into proactive, intelligently managed systems, capable of learning and evolving through each project cycle.
It bears repeating that effective performance and productivity measurement hinges on a hierarchical structural model—an ontology—of the built asset. Any building is decomposed into construction modules, each of which is further subdivided into construction elements, and for every element a value stream composed of standardised process steps can be defined. This production-oriented ontology is a generic concept and can be applied to any type of built asset.
4.2. Tactical Level (or Trade Level)
Where the operational level focuses on the repeatable process steps that turn materials into a single Building Component, the tactical level governs how those steps are sequenced, balanced, and handed off among multiple trades working on the same Construction Module (floor, zone zone, bored pile wall). At the trade level, the focus shifts to variability control, schedule adherence, and coordination of multiple trades and subcontractors. To quantify performance at this stage, we propose the additional use of the Coefficient of Variation (CV) to capture workload balance, complemented by takt time compliance and schedule adherence metrics. These indicators reflect the ability of planning teams to stabilize production rhythms and control process variability, essential for preventing disruptions that propagate into higher-level risks.
In Figure 5 a sequencing model is sketched. Adapting Shingo’s two-axis model, we treat each trade crew (e.g. Production Step concrete, drywall, etc.) as a “station” that executes a column of Sub-Steps. The horizontal axis as above represents the flow of production steps from one Production-Step to the next or from one trade to the next, while the vertical axis lists the repetitive Production-Step, flowing vertical from one Building Component to the next Building Component. Optimising only the vertical column—say, reducing the cycle time of drywall installation—may yield local gains yet leave downstream crews waiting for materials or inspection. Conversely, redesigning the horizontal flow without stabilising the underlying tasks merely pushes variability to the next station. True productivity, therefore, emerges when efficient operations (task-level cycle time and quality) are nested inside a well-balanced, waste-free process flow (trade sequence and takt rhythm) [92,93,94].
We now return to our core definitions of performance and productivity and align them with the two axes of the trade-level model.
- Horizontal productivity is calculated along the process axis. It aggregates the cycle times and First-Time-Quality scores of the standardised process steps that form a single building component (e.g., one bored pile, one drywall partition).
- Vertical productivity is measured up the operation axis. It sums the performance of all construction elements produced by one trade within a defined zone or takt window, yielding the overall productivity of a Construction Module (e.g., an entire bored-pile wall or a completed apartment floor).
This dual-axis view makes it clear that every productivity indicator is tied to a specific level of abstraction. Because the metric hierarchy is anchored in the building ontology introduced earlier— Process Step → Building Component → Construction Module —KPIs roll up structurally from the shop floor to the project dashboard without losing fidelity. In other words, the KPI system is inseparable from the ontology of the built asset: horizontal metrics benchmark value creation within one Building Component, while vertical metrics benchmark the cumulative output of those Component, ensuring a coherent, bottom-up line of sight from task efficiency to Construction Modul-level performance.
Simply running several production steps in parallel does not by itself increase productivity. Because productivity is defined as output divided by input, adding more crews or equipment boosts both sides of the ratio proportionally; the headline index therefore remains flat.
Genuine improvement appears only when parallelisation is combined with repetitive work sequences and a takt rhythm. As a production crew performs the same standardised task—pile after pile, room after room—learning-curve effects shorten cycle times, hand-off delays shrink, and material flows stabilise. Under this disciplined cadence, the additional resources devoted to parallel crews yield disproportionately higher output, tipping the input/output ratio in favour of true productivity gain. In short, it is not parallel work per se that drives improvement, but the repetitive, takt-paced execution that unlocks the efficiencies inherent in standardised process steps.
4.3. Stratetic Level (or Building Section or Building)
Just as individual process steps aggregate into Building Components and such Components into Construction Modules, multiple Construction Modules can be combined to represent an entire Building Section—for example, civil works, shell construction, façade works, interior fit. By summing the standardised input and output data for all Construction Modules within that section, we can calculate Section-level Productivity and Section-level performance (Figure 6).
Because planned productivity and planned performance for each building section can be assembled from the same bottom-up ontology—step by step from process to component, from component to module, and from module to section—project teams begin their work with a rigorously defined baseline. Summing the standard task durations, resource hours and takt counts produces a section-level target that is directly comparable to live field data. The resulting percentage deviation, calculated as (actual minus planned) divided by planned, and expressed in real time, immediately reveals whether productivity is slipping or improving. Crucially, this variance is traceable all the way down to the individual process step, so managers can pinpoint the root cause of an over-run—or of an out-performance—within minutes rather than weeks.
Turning these insights into action requires that management reward genuine productivity gains, not merely cost cutting or schedule compliance in isolation. Performance-based contract clauses can link a share of fees or profits to closing the productivity gap, while rolling bonus pools for crews can grow as takt targets are beaten without compromising first-time quality. When two adjacent trades jointly reduce hand-off delays, both parties can receive an additional reward, ensuring that local optimisation never comes at the expense of overall flow. Real-time dashboards and leader boards displayed in site offices reinforce this culture by providing instantaneous, transparent feedback. Moreover, crews that document improvements and transfer them to sister projects can receive formal credits that count toward future bids or internal promotion, embedding continuous learning in the corporate DNA.
In this way, the hierarchical KPI structure ceases to be a passive reporting tool and becomes an active management lever. By tying financial and reputational incentives directly to productivity variance, executives ensure that every participant—from boardroom to shop floor—shares a tangible stake in narrowing the industry’s stubborn productivity gap.
Normative Level (or Project Management or Level):
At the normative level, executive leadership sets the guiding principles that define how a construction enterprise creates long-term value, controls risk, and fulfils its social licence to operate. While classic profitability metrics—Return on Investment (ROI), Operating Cash Flow, or Value-Chain Margin—remain indispensable, they are no longer sufficient on their own. To steer a modern, data-driven organisation, management needs composite indicators that link financial outcomes to operational performance, stakeholder expectations, and sustainability goals. Specifically, we propose the use of an Overall Productivity Index (OPI), calculated as the product of Flow Efficiency, resource efficiency factors (labour, material, equipment), and First Time Quality (FTQ) metrics.
ESG compliance and sustainability KPIs further complement the measurement framework at this level, reflecting the broader societal and environmental responsibilities of construction firms. These KPIs ensure that strategic decisions optimise not only economic return but also environmental stewardship and social impact—critical factors for winning public tenders, securing ESG oriented financing, and maintaining a resilient brand.
Figure 7.
Hierarchical Productivity Measurement Framework for the Construction Sector developed by the authors, integrating normative, strategic, tactical, and operational levels. The model aligns key productivity KPIs with Lean principles at each level, prioritizing systemic flow efficiency over isolated resource optimization. It highlights how task-level performance aggregates into project, firm, and macro-level productivity, offering a structured approach to bridging micro and macro perspectives. This conceptual framework has not been adapted from existing literature and was created by the authors for this study.
A defining feature of the proposed hierarchical production model is its explicit emphasis on flow efficiency as the primary strategic lever for improving productivity—setting it apart from conventional models that focus predominantly on resource optimization. Rather than merely seeking to maximize the use of labour, equipment, or materials, this model prioritizes the stability of process flow and the reduction of variability (known as Mura in Lean terminology), recognizing these as critical prerequisites for achieving sustainable and meaningful performance gains.
At the heart of this approach lies a structured framework built on decomposed, standardized, and repeatable process steps. These steps form the building blocks of what the authors refer to as a "production model", constructed using Value Stream Mapping (VSM) techniques. This model enables a modular representation of construction workflows that is not only analytically rigorous but also adaptable across diverse projects and site conditions. Through the lens of VSM, inefficiencies in the flow of work, materials, and information are made visible and measurable, allowing for targeted interventions at multiple organizational levels.
What truly distinguishes this hierarchical model is its systematic integration of Lean Construction principles across all tiers of decision-making. At the normative level, foundational values and long-term objectives are supported by practices such as Hansei (critical self-reflection) and Kaikaku (radical change), which enable paradigm shifts in organizational direction [95,96]. At the strategic level, tools like Value Stream Mapping and Heijunka (production leveling) ensure alignment between high-level planning and flow-efficiency goals [86,97,98]. On the tactical level, the focus shifts to implementing Pull systems and reducing variability (Mura), ensuring that processes are responsive to actual demand rather than speculative scheduling [10,25]. Finally, the operational level is shaped by Kaizen (continuous improvement), Jidoka (autonomation or built-in quality), and the 5S methodology, which collectively foster clean, standardized, and quality-driven work environments [99,100].
By embedding these Lean principles into a vertically integrated control architecture, the proposed framework extends beyond traditional siloed applications and enables dynamic productivity governance across the construction value chain.
By mapping these Lean methods directly onto the hierarchical model, the framework not only enhances operational execution but also embeds a culture of reflection, responsiveness, and continuous improvement. It transforms productivity optimization from a set of disconnected practices into a cohesive, systemic strategy, deeply rooted in the principles of flow, value, and learning.
In essence, the framework offers a comprehensive productivity measurement system that reflects the multi-stakeholder, multi-scale nature of construction projects. It is designed to facilitate aggregation of granular operational data into higher-level strategic insights, while providing actionable feedback loops at each level of the hierarchy. By explicitly linking Lean principles, flow optimization, and multi-factor efficiency metrics, this framework represents a novel contribution to the literature and addresses a critical gap in current productivity research.
To operationalize the hierarchical productivity model introduced in this paper, we developed an original, multi-level control architecture (Figure 8). This framework formalizes vertical and horizontal feedback loops between the normative, strategic, tactical, and operational levels, enabling continuous learning, cross-level alignment, and adaptive performance optimization. Developed by the authors, the model synthesizes core principles from Lean production, systems theory, and domain-specific construction governance, and represents a novel conceptual contribution rather than an adaptation of existing frameworks. Figure 8 illustrates how real-time operational feedback, process standardization, and strategic recalibration can be integrated into a dynamic control structure. Through digitalization, sensor-based monitoring, and standardized KPIs, this architecture supports responsive and data-driven productivity management across the entire construction value chain.
5. Discussion and Future Outlook
The hierarchical productivity framework proposed in this paper introduces a structured and ontologically coherent foundation for transitioning the construction industry from fragmented, manually managed processes to an integrated, digital, and performance-driven system. By vertically aligning productivity metrics across operational, tactical, strategic, and normative levels—and horizontally across stakeholders and process domains—the framework directly addresses one of the sector’s most persistent barriers: the lack of systemic coherence in data, decision-making, and performance interpretation.
What distinguishes this model from prior approaches is its built-in readiness for AI integration and automation. Traditional productivity models often treat digital technologies as external additions; here, they are embedded within the architecture. This is achieved through a modular structure and a common KPI ontology that normalizes flow, efficiency, and quality metrics. These are designed to be machine-interpretable, physically consistent, and scalable across diverse organizational environments.
The framework is particularly applicable in prefabrication, modular, and industrialized construction contexts—settings where repeatability, production control, and digital observability are already advanced. However, its relevance extends to complex, site-based projects through dynamic, multi-scalar feedback loops. In this paradigm, productivity shifts from a static, retrospective indicator to a real-time control variable for adaptive optimization.
5.1. Future Research Directions
To fully realize the potential of the proposed framework, future research should pursue the following directions:
- Empirical validation of the hierarchical framework across diverse project typologies (e.g., high-rise, infrastructure, modular housing), procurement models, and geographic contexts.
- Integration with digital twins and IoT-based observability, enabling bi-directional feedback between physical construction processes and virtual planning/control environments.
- Deployment of agentic AI systems that leverage the hierarchical KPI structure to detect deviations, trigger learning loops, and optimize workflows autonomously—while maintaining traceability and human oversight.
- Potential exploration of exponential technologies in construction such as smart contracts and blockchain integration for linking real-time productivity data to contractual milestones, payment systems, and performance-based incentives.
- Development of interoperability standards to bridge heterogeneous platforms (e.g., BIM, ERP, site sensors) through API harmonization and common data ontologies. This also aligns with recent initiatives in platform-based industrialization and open data models such as IFC 4.3 and ISO 19650, which seek to harmonize productivity data across construction ecosystems.
- Cultural and organizational change frameworks to overcome resistance to automation, standardization, and the shift from intuition-based to data-driven project management.
- The proposed framework can serve as a blueprint for digital construction standards, productivity-linked contracts, and AI integration strategies at both firm and industry levels. We recommend its inclusion in sectoral modernization roadmaps, such as those currently pursued under national productivity missions, construction industrialization plans, or EU digital twin programs.
5.2. Towards the Future of Intelligent Construction
We envision a near-future construction landscape characterized by cyber-physical production systems: richly instrumented, context-aware sites in which AI-driven control architectures continuously monitor crew performance, site conditions, and resource flows in real time. These systems compare actual operations against optimal plans and adjust dynamically based on multilevel KPIs.
Decision-makers will interact with immersive dashboards supported by predictive analytics, enabling proactive rather than reactive management. Progress reporting, quality tracking, and documentation may be fully automated. Human managers will shift focus toward exception handling, strategic oversight, and system-level optimization.
This transformation is not speculative. Technologies such as computer vision, LiDAR, digital twins, and reinforcement learning are already operational on pilot projects. What is missing is the integration logic—a unifying performance architecture that ties these components into a cohesive, feedback-driven productivity system. The hierarchical framework introduced here is intended to fill that gap.
5.3. Conclusion: A New Paradigm for Construction Productivity
After decades of stagnation, the construction sector stands at the threshold of a new industrial logic. Moving beyond isolated metrics and siloed tools, the future lies in a unified, dynamic, and data-centric productivity model—one that bridges the micro–macro divide, integrates human and machine intelligence, and transforms productivity into a system-level design variable.
This paper contributes a foundational step toward that paradigm, providing the structural logic, control layers, and ontological basis required to scale productivity measurement from reactive diagnostics to real-time performance engineering. By transforming productivity from a fragmented measurement exercise into a real-time, feedback-driven design variable, this framework lays the foundation for intelligent, adaptive, and scalable construction systems. Taken together, these elements establish a foundation not only for understanding productivity, but for engineering its continuous improvement across the construction sector.
5.4. Limitations and Future Work
While the proposed framework is grounded in systems theory, Lean construction principles, and extensive literature synthesis, it remains conceptual and has not yet undergone systematic empirical validation. Ongoing and planned research initiatives—including field applications through industry-academic collaborations such as BauPuls360—aim to test its applicability in real-world settings.
Several limitations must be acknowledged:
- Inter-project comparability of standardized process steps remains a methodological and organizational challenge across heterogeneous firms and delivery models. The potential tension between standardization and the bespoke nature of architectural design intent, which may require careful reconciliation between performance optimization and aesthetic/functional diversity.
- Integration with legacy IT ecosystems and fragmented data silos may require transitional interfaces, change management processes, and phased implementation strategies.
- Cultural resistance to automation, standardization, and performance transparency may constrain adoption, particularly in traditionally managed organizations.
Despite these constraints, the proposed architecture offers a scalable, modular, and implementation-ready foundation for a new class of digitalized, AI-augmented productivity systems in construction and other project-based industries.
Author Contributions
Conceptualization, M.M.B. and K.N.; methodology, M.M.B., K.N. and T.J.; validation, M.M.B., K.N., and T.J.; formal analysis, M.M.B.; investigation, L.K.; resources, M.M.B. and L.K.; data curation, M.M.B. and P.H.; writing—original draft preparation, M.M.B.; writing—review and editing, M.M.B., K.N. P.H., and L.K.; visualization, M.M.B. and P.H.; supervision, M.M.B.; project administration, M.M.B. and P.H.; funding acquisition, L.K., M.M.B., K.N. All authors have read and agreed to the published version of the manuscript.
Funding
This research received no external funding
Acknowledgments
This work was made possible through a sabbatical granted to the lead author by the University of Applied Sciences Konstanz and supported by the State of Baden-Württemberg, covering the period from July 2024 to March 2025. The authors gratefully acknowledge this institutional and governmental support, which provided the necessary time and resources to develop the conceptual and analytical foundations of the study.
Conflicts of Interest
The authors declare no conflicts of interest.
Abbreviations
The following abbreviations are used in this manuscript:
| AI | Artificial Intelligence |
| BEA | Bureau of Economic Analysis |
| BIM | Building Information Modelling |
| CICE | Construction Industry Cost Effectiveness |
| CPI | cost performance index |
| CPM | Critical Path Method |
| CV | Coefficient of Variation |
| ESG | Environmental, Social, and Governance |
| EVM | Earned Value Management |
| FTE | Full Time Equivalent |
| FTQ | First Time Quality |
| HIC | Human-in-Command |
| IoT | Internet of Things |
| LiDAR | Light Detection and Ranging |
| MPDM | Method Productivity Delay Model |
| OPI | Overall Productivity Index |
| PERT | Program Evaluation and Review Technique |
| R&D | Research and Development |
| ROI | Return on Investment |
| SPI | Schedule performance index |
| TFP | Total factor productivity |
| VSM | Value Stream Mapping |
Appendix A
Appendix A.1 Definition of Key Concepts and Terms
Agentic AI: Agentic artificial intelligence refers to AI systems capable of making autonomous, context-aware decisions. Unlike traditional AI, which relies on pre-programmed rules or static models, agentic AI can adapt dynamically to changing conditions and objectives. In construction, this can include AI systems that optimize project schedules, adjust workflows in real-time based on-site conditions, or predict risks to minimize delays and costs. Agentic AI also plays a critical role in enabling human-machine collaboration, allowing systems to act independently while complementing human expertise.
Automation: Automation in construction involves the use of machines, robotics, and digital systems to perform tasks traditionally carried out by humans. This ranges from automated prefabrication of building components in off-site factories to on-site robotic systems for tasks like bricklaying, welding, or concrete pouring. Automation increases efficiency, reduces human error, and minimizes the risks associated with dangerous tasks, making construction faster, safer, and more cost-effective.
Coefficient of Variation (CV): A normalized measure of the dispersion of a dataset, defined as the ratio of the standard deviation to the mean. In construction productivity analysis, it is used to evaluate workflow stability and takt-time adherence.
Construction Lifecycle: The construction lifecycle encompasses all phases of a construction project, including planning, design, management, execution, and operation. Technologies like agentic AI and automation have applications across each phase, from optimizing initial designs to ensuring long-term asset performance through predictive maintenance and sustainability measures.
Digital Twin: A dynamic, digital replica of a physical asset or process that continuously receives real-time data. In construction, digital twins support predictive analytics, scenario planning, and performance monitoring across the lifecycle of buildings.
Digitalization refers to the process of using digital technologies to transform business models, processes, and activities. In construction, digitalization involves the integration of tools such as Building Information Modeling (BIM), IoT sensors, AI, and data platforms to enable real-time decision-making, improve productivity, and support automation across the project lifecycle.
First-Time Quality (FTQ): The percentage of work completed correctly without the need for rework. FTQ is a critical quality and productivity measure in construction projects, reflecting process stability and skill coordination across trades.
Flow Efficiency: A measure of how much time in a process is spent on actual value-adding activities, calculated as the ratio of value-adding time to total lead time. It is a key performance driver in lean and AI-driven construction workflows.
Human-Machine Collaboration: Human-machine collaboration refers to the synergistic partnership between human expertise and automated systems. Rather than replacing humans, collaborative technologies, such as cobots (collaborative robots), enhance human capabilities by handling repetitive, physically demanding, or hazardous tasks while leaving complex decision-making and creativity to human workers. This partnership is crucial for scaling AI and automation adoption in construction while maintaining flexibility and trust.
Input Efficiency (η): The ratio of value-adding output achieved relative to the resources consumed. It quantifies how efficiently labour, time, materials, or equipment are used in performing a process. In construction, input efficiency may be measured in terms such as installed area per worker-hour or cubic meters per crane shift.
Kaizen is a Japanese management philosophy meaning “continuous improvement.” It emphasizes small, incremental changes in processes involving all employees, from the executive suite to the construction site. In the context of construction productivity, Kaizen fosters a culture of data-driven learning, waste reduction, and frontline empowerment to achieve better quality, flow, and resource use over time.
Modularization: The process of breaking down a building or process into standardized, prefabricated components that can be manufactured off-site and assembled on-site. Modularization supports automation, flow-based production, and improved productivity through repeatability.
Output Effectiveness (ε): A measure of how well the produced output meets predefined quality, specification, or customer value criteria. It focuses on doing the right things, such as delivering conforming work with minimal rework. In construction, output effectiveness often aligns with metrics like First-Time Quality (FTQ) or adherence to technical acceptance standards.
Overall Productivity Index (OPI): A normative-level productivity metric defined as the product of flow efficiency, multi-resource efficiency (labour, material, equipment), and First-Time Quality (FTQ). The OPI enables high-level benchmarking and integrates financial, operational, and ESG performance indicators.
Prefabrication: Prefabrication involves producing building components off-site in controlled factory environments and assembling them on-site. This approach leverages robotics and automation to improve precision, reduce waste, and accelerate project timelines. Prefabrication is central to modern construction innovations, enabling faster and more sustainable building processes.
Primary Value Creation: Core activities that directly transform inputs into the final built product and are essential to fulfilling the main purpose of the construction project. Examples include structural assembly, enclosure, mechanical installation, or foundation work. These are typically scheduled on the critical path and drive the main project milestones.
Productivity: In the context of construction, productivity refers to the efficiency with which resources—such as labour, materials, and time—are utilized to deliver a project or produce an output. It is typically measured as the ratio of output (e.g., completed tasks, built infrastructure) to input (e.g., hours worked, materials used). High productivity in construction implies achieving project goals with minimal waste, optimal resource allocation, and within the planned time and budget, while maintaining quality and safety standards. Factors influencing productivity include workforce skills, technology adoption, workflow efficiency, and external conditions like weather or supply chain disruptions.
Productivity Index (PI): A composite metric that integrates input efficiency (η) and output effectiveness (ε), defined as PI = η × ε. It quantifies how well a process uses resources and meets its output objectives, serving as a key tactical-level measure.
Secondary Value Creation: Supporting processes that contribute to overall project performance but do not directly add value to the final product in a client-visible way. This includes logistics, coordination, layout, inspection, documentation, quality assurance, and prefabrication workflows. Optimizing these activities enhances productivity, reduces waste, and enables smoother flow in primary tasks.
Takt Time: The maximum allowable time to produce a product or complete a task in order to meet customer demand. In construction, takt planning aligns trade workflows to a synchronized rhythm across work zones to reduce wait times, variability, and inefficiencies.
Value Stream Mapping (VSM): A Lean management method used to analyze, visualize, and optimize the flow of materials and information required to deliver a product or service. In construction, VSM helps identify bottlenecks, process variability, and non-value-adding activities by mapping the sequence of production and administrative steps across trades and phases.
References
- Farmer, M. The Farmer Review of the UK construction labour model "Modernize or die - Time to decide the industry's future"; http://www.constructionleadershipcouncil.co.uk/wp-content/uploads/2016/10/Farmer-Review.pdf, 2016.
- Barbosa, F.; Woetzel, J.; Mischke, J. Reinventing construction: A route of higher productivity; dln.jaipuria.ac.in: 2017.
- Barbosa, F.; Mischke, J.; Parsons, M. Improving construction productivity; dln.jaipuria.ac.in: 2017.
- Goolsbee, A.; Syverson, C. The strange and awful path of productivity in the us construction sector; nber.org: 2023.
- Mischke, J.; Stokvis, K.; Vermeltfoort, K.; Biemans, B. Delivering on construction productivity is no longer optional; 2024.
- Hossain, M.; Ng, S.; Antwi-Afari, P.; Amor, B. Circular economy and the construction industry: Existing trends, challenges and prospective framework for sustainable construction. Renewable and Sustainable … 2020.
- Yang, M.; Chen, L.; Wang, J.; Msigwa, G.; Osman, A.; ... Circular economy strategies for combating climate change and other environmental issues; Springer: 2023.
- World Economic Forum (WEF). Shaping the Future of Construction: A Breakthrough in Mindset and Technology; World Economic Forum: Cologny, Switzerland, 2016.
- Ballard, G.; Howell, G. Shielding production: Essential step in production control. Journal of Construction Engineering and … 1998. [CrossRef]
- Koskela, L. An exploration towards a production theory and its application to construction; aaltodoc.aalto.fi: 2000.
- World Economic Forum (WEF). Shaping the Future of Construction – An Action Plan to solve the Industry’s Talent Gap; World Economic Forum: Cologny, Switzerland, 2018.
- Bühler, M.M.; Jelinek, T.; Nübel, K. Training and Preparing Tomorrow’s Workforce for the Fourth Industrial Revolution. Education Sciences 2022, 12, 782.
- Alejo, A.; Aigbavboa, C.; Aghimien, D. Emerging Trends of Safe Working Conditions in the Construction Industry: A Bibliometric Approach; mdpi.com: 2024.
- Elbashbishy, T.; El-adaway, I. Assessing the Impact of Skilled Labor Shortages on Project Cost Performance. Construction Research Congress … 2024. [CrossRef]
- Syverson, C. Challenges to mismeasurement explanations for the US productivity slowdown. Journal of Economic Perspectives 2017. [CrossRef]
- Oglesby, C.; Parker, H.; Howell, G. Productivity improvement in construction; cir.nii.ac.jp: 1989.
- Thomas, H.; Kramer, D. The manual of construction productivity measurement and performance evaluation; firedoc.nist.gov: 1988.
- Clark, W. The Gantt chart: A working tool of management; Ronald Press Company: 1922.
- Hinze, J. Construction planning and scheduling; academia.edu: 2012.
- Fleming, Q.; Koppelman, J. Earned value project management; books.google.com: 2016.
- …; Tortorella, G.L.; Antony, J.; Romero, D. Lean Industry 4.0: Past, present, and future. Quality Management … 2023. [CrossRef]
- Ballard, G. The Lean Project Delivery System: An Update. Lean Construction Journal 2008.
- Ballard, G.; Howell, G. Lean project management. Building Research & Information 2003. [CrossRef]
- Howell, G. What is lean construction-1999; academia.edu: 1999.
- Koskela, L.; Howell, G.; Ballard, G.; ... The foundations of lean construction. Design and … 2007.
- Ballard, G.; Howell, G. Implementing lean construction: stabilizing work flow. Lean construction 1994.
- Frandson, A.; Berghede, K.; Tommelein, I. Takt time planning for construction of exterior cladding; Citeseer: 2013.
- Hamledari, H.; Fischer, M. Construction payment automation using blockchain-enabled smart contracts and robotic reality capture technologies. Automation in Construction 2021.
- Alzubi, K.; Alaloul, W.; Malkawi, A.; ... Automated monitoring technologies and construction productivity enhancement: Building projects case; Elsevier: 2023.
- Teizer, J.; Wolf, M.; Golovina, O.; ... Internet of Things (IoT) for integrating environmental and localization data in Building Information Modeling (BIM); researchgate.net: 2017.
- Banitaan, S.; Al-refai, G.; Almatarneh, S.; ... A review on artificial intelligence in the context of industry 4.0; researchgate.net: 2023.
- Kwak, E. Automatic 3D building model generation by integrating LiDAR and aerial images using a hybrid approach. 2013.
- Gubbi, J.; Buyya, R.; Marusic, S.; Palaniswami, M. Internet of Things (IoT): A vision, architectural elements, and future directions. Future Generation Computer Systems 2013, 29, 1645-1660. [CrossRef]
- Jeon, Y.; Kulinan, A.; Kim, T.; Park, M.; Park, S. Vision-based motion prediction for construction workers safety in real-time multi-camera system. Advanced Engineering … 2024.
- Morales, J.N. AI-driven project controls: integrated computer vision production tracking &AI-driven forecasting in building construction; ideals.illinois.edu: 2024.
- Xu, S.; Wang, J.; Shou, W.; Ngo, T.; Sadick, A.; ... Computer vision techniques in construction: a critical review. … Methods in Engineering 2021. [CrossRef]
- Yang, J.; Wilde, A.; Menzel, K.; Sheikh, M.; ... Computer vision for construction progress monitoring: A real-time object detection approach. Working Conference on … 2023. [CrossRef]
- …; Paulson, J.A.; Carron, A.; Zeilinger, M.N. Physics-Informed Machine Learning for Modeling and Control of Dynamical Systems. arXiv preprint arXiv … 2023.
- Boiko, A. Big data and machine learning. Practical step-by-step course for beginners. Available online: https://bigdataconstruction.com/ (accessed on 15 November 2022).
- Casini, M. Construction 4.0: Advanced technology, tools and materials for the digital transformation of the construction industry; books.google.com: 2021.
- Kumar, S. System and method for computational simulation and augmented/virtual reality in a construction environment. US Patent 11,907,885 2024.
- Liang, R.; Huang, C.; Zhang, C.; Li, B.; Saydam, S.; ... Exploring the fusion potentials of data visualization and data analytics in the process of mining digitalization. IEEE … 2023.
- Chen, Y.; Huang, D.; Liu, Z.; Osmani, M.; Demian, P. Construction 4.0, Industry 4.0, and Building Information Modeling (BIM) for sustainable building development within the smart city; mdpi.com: 2022.
- Bock, T.; Linner, T. Robot oriented design; books.google.com: 2015.
- Pan, Y.; Zhang, L. Integrating BIM and AI for smart construction management: Current status and future directions. Archives of Computational Methods in Engineering 2023. [CrossRef]
- Pan, Y.; Zhang, L. Roles of artificial intelligence in construction engineering and management: A critical review and future trends. Automation in Construction 2021.
- Farmer, E. Time and motion study; HM Stationery Office: 1921.
- Gilbreth, F. Bricklaying system; MC Clark Publishing Company: 1909.
- Gantt, H. Work, wages, and profits; Engineering magazine: 1913.
- Gantt, H. Organizing for work; Harcourt, Brace and Howe: 1919.
- Adrian, J.; Boyer, L. Modeling method-productivity. Journal of the Construction Division 1976. [CrossRef]
- Syverson, C. What determines productivity? Journal of Economic literature 2011.
- Modig, N.; Åhlström, P. This is lean: Resolving the efficiency paradox; nhpqi.ca: 2012.
- …; Farshidian, F.; Hutter, M.; Zeilinger, M.N. Bayesian multi-task learning MPC for robotic mobile manipulation. IEEE Robotics and … 2023.
- Ghanbari, J.; Zare, M. Review of Automation and Robotic in Advanced Construction Methods: A Case Study of Karaksa Hotel. New Approaches in Civil Engineering 2021.
- Bock, T. The future of construction automation: Technological disruption and the upcoming ubiquity of robotics. Automation in construction 2015.
- Ayele, S.; Fayek, A. A framework for total productivity measurement of industrial construction projects. Canadian Journal of Civil Engineering 2019. [CrossRef]
- Sacks, R.; Eastman, C.; Lee, G.; Teicholz, P. BIM handbook: A guide to building information modeling for owners, designers, engineers, contractors, and facility managers; books.google.com: 2018.
- Dave, B.; Kubler, S.; Främling, K.; Koskela, L. Opportunities for enhanced lean construction management using Internet of Things standards. Automation in construction 2016.
- Borrmann, A.; König, M.; Koch, C.; Beetz, J. Building information modeling: Why? what? how?; Springer: 2018.
- Dixit, S.; Sharma, K. An empirical study of major factors affecting productivity of construction projects. Emerging Trends in Civil Engineering: Select … 2020. [CrossRef]
- Sawhney, A.; Rubinsohn, S.; Luo, D. RICS Construction productivity report 2024. Available online: https://www.rics.org/news-insights/rics-construction-productivity-report-2024 (accessed on 11 May).
- Rathnayake, A.; Middleton, C. Systematic review of the literature on construction productivity. Journal of Construction Engineering … 2023. [CrossRef]
- Shan, M.; Li, Y.; Hwang, B.; Chua, J. Productivity metrics and its implementations in construction projects: A case study of Singapore; mdpi.com: 2021.
- Teicholz, P. Labor productivity declines in the construction industry: causes and remedies; 2004.
- Sacks, R.; Brilakis, I.; Pikas, E.; Xie, H.; ... Construction with digital twin information systems. Data-centric … 2020.
- Sacks, R.; Girolami, M.; Brilakis, I. Building information modelling, artificial intelligence and construction tech; Elsevier: 2020.
- Dubois, A.; Gadde, L. The construction industry as a loosely coupled system: implications for productivity and innovation. Construction management &economics 2002. [CrossRef]
- Winch, G. Managing construction projects; books.google.com: 2012.
- Love, P.; Gunasekaran, A. Concurrent engineering in the construction industry. Concurrent Engineering 1997. [CrossRef]
- Antunes, R.; Poshdar, M. Envision of an integrated information system for project-driven production in construction. arXiv preprint arXiv:1807.04966 2018.
- Antunes, R.; Gonzalez, V. A production model for construction: A theoretical framework; mdpi.com: 2015.
- Soliman, M.; Saurin, T.A. Lean-as-imagined differs from lean-as-done: the influence of complexity. Production Planning &Control 2022. [CrossRef]
- Howell, G.; Ballard, G.; Demirkesen, S. Why lean projects are safer. In Proceedings of the Proceedings of the 25th Annual Conference of the International Group for Lean Construction, Heraklion, Greece, 2017; pp. 4-12.
- Salem, O.; Solomon, J.; Genaidy, A.; ... Lean construction: From theory to implementation. Journal of management … 2006. [CrossRef]
- Elghaish, F.; Abrishami, S.; Hosseini, M.R. Integrated project delivery with blockchain: An automated financial system. Automation in Construction 2020, 114, 103182. [CrossRef]
- Zhang, L.; He, J.; Zhou, S. Sharing tacit knowledge for integrated project team flexibility: Case study of integrated project delivery. Journal of Construction Engineering and Management 2013, 139, 795-804.
- Kent, D.C.; Becerik-Gerber, B. Understanding construction industry experience and attitudes toward integrated project delivery. Journal of construction engineering and management 2010, 136, 815-825.
- Hijazi, A.A.; Perera, S.; Calheiros, R.N. A data model for integrating BIM and blockchain to enable a single source of truth for the construction supply chain data delivery. … , Construction and … 2023. [CrossRef]
- World Economic Forum (WEF). Shaping the Future of Construction – An Action Plan to Accelerate Building Information Modeling (BIM) Adoption; World Economic Forum: Cologny, Switzerland, 2018.
- Schuldt, S.; Nicholson, M.; Adams, Y.; Delorit, J. Weather-related construction delays in a changing climate: a systematic state-of-the-art review; mdpi.com: 2021.
- Dong, R.; Muhammad, A.; Nauman, U. The Influence of Weather Conditions on Time, Cost, and Quality in Successful Construction Project Delivery; mdpi.com: 2025.
- Pryke, S. Successful Construction supply chain management: Concepts and case studies; John Wiley & Sons: 2020.
- Zhang, G.; Yang, Y.; Yang, G. Smart supply chain management in Industry 4.0: the review, research agenda and strategies in North America. Annals of operations research 2023. [CrossRef]
- D'Amico, L.; Glaeser, E.; Gyourko, J.; Kerr, W.; ... Why Has Construction Productivity Stagnated? The Role of Land-Use Regulation; nber.org: 2024.
- Womack, J.; Jones, D.; Roos, D. The machine that changed the world: The story of lean production--Toyota's secret weapon in the global car wars that is now revolutionizing world industry; books.google.com: 2007.
- Smith, P. BIM Implementation – Global Strategies. Procedia Engineering 2014, 85, 482-492. [CrossRef]
- Ouda, E.; Haggag, M. Automation in Modular Construction Manufacturing: A Comparative Analysis of Assembly Processes; mdpi.com: 2024.
- Conte, M.; Echeveste, M.; Formoso, C.; Bazzan, J. Synergies between Mass Customisation and Construction 4.0 Technologies; mdpi.com: 2022.
- Ng, M.; Graser, K.; Hall, D. Digital fabrication, BIM and early contractor involvement in design in construction projects: A comparative case study. Architectural Engineering and Design … 2023. [CrossRef]
- Geiger, M.; Schlicke, M.; Yang, B.; Nübel, K. Framework of an Implementation Strategy for a Modular Construction Toolkit Design in Construction Companies. Journal of Information Systems Engineering and Management 2025, Vol. 10 No. 34s (2025). [CrossRef]
- Shingo, S. Non-stock production: the Shingo system of continuous improvement; books.google.com: 1988.
- Shingo, S. Zero quality control: Source inspection and the poka-yoke system; taylorfrancis.com: 2021.
- Shingo, S.; Dillon, A. A study of the Toyota production system: From an Industrial Engineering Viewpoint; books.google.com: 2019.
- Liker, J. The Toyota way: 14 management principles from the world's greatest manufacturer; katalog.ub.uni-heidelberg.de: 2020.
- Imai, M. Kaizen: The key to Japan's competitive success; 1986.
- Rother, M.; Shook, J. Value-stream mapping to create value and eliminate muda; 1999.
- Womack, J.; Jones, D. Lean thinking—banish waste and create wealth in your corporation. Journal of the operational research … 1997. [CrossRef]
- Ohno, T. Toyota production system: beyond large-scale production; taylorfrancis.com: 1988.
- Ballard, H. The last planner system of production control; etheses.bham.ac.uk: 2000.
Figure 1.
Indexes of U.S. construction sector labor productivity (value added per full-time-equivalent, FTE) and total factor productivity (TFP), 1950–2020. For comparison, the same indexes for the overall U.S. economy are plotted. During the 1950s and 1960s, construction productivity outpaced that of the overall economy. However, by 1970, both labor productivity and TFP in construction began to decline—and this downturn has continued for over five decades [4]. (Data: U.S. Bureau of Economic Analysis, BEA).
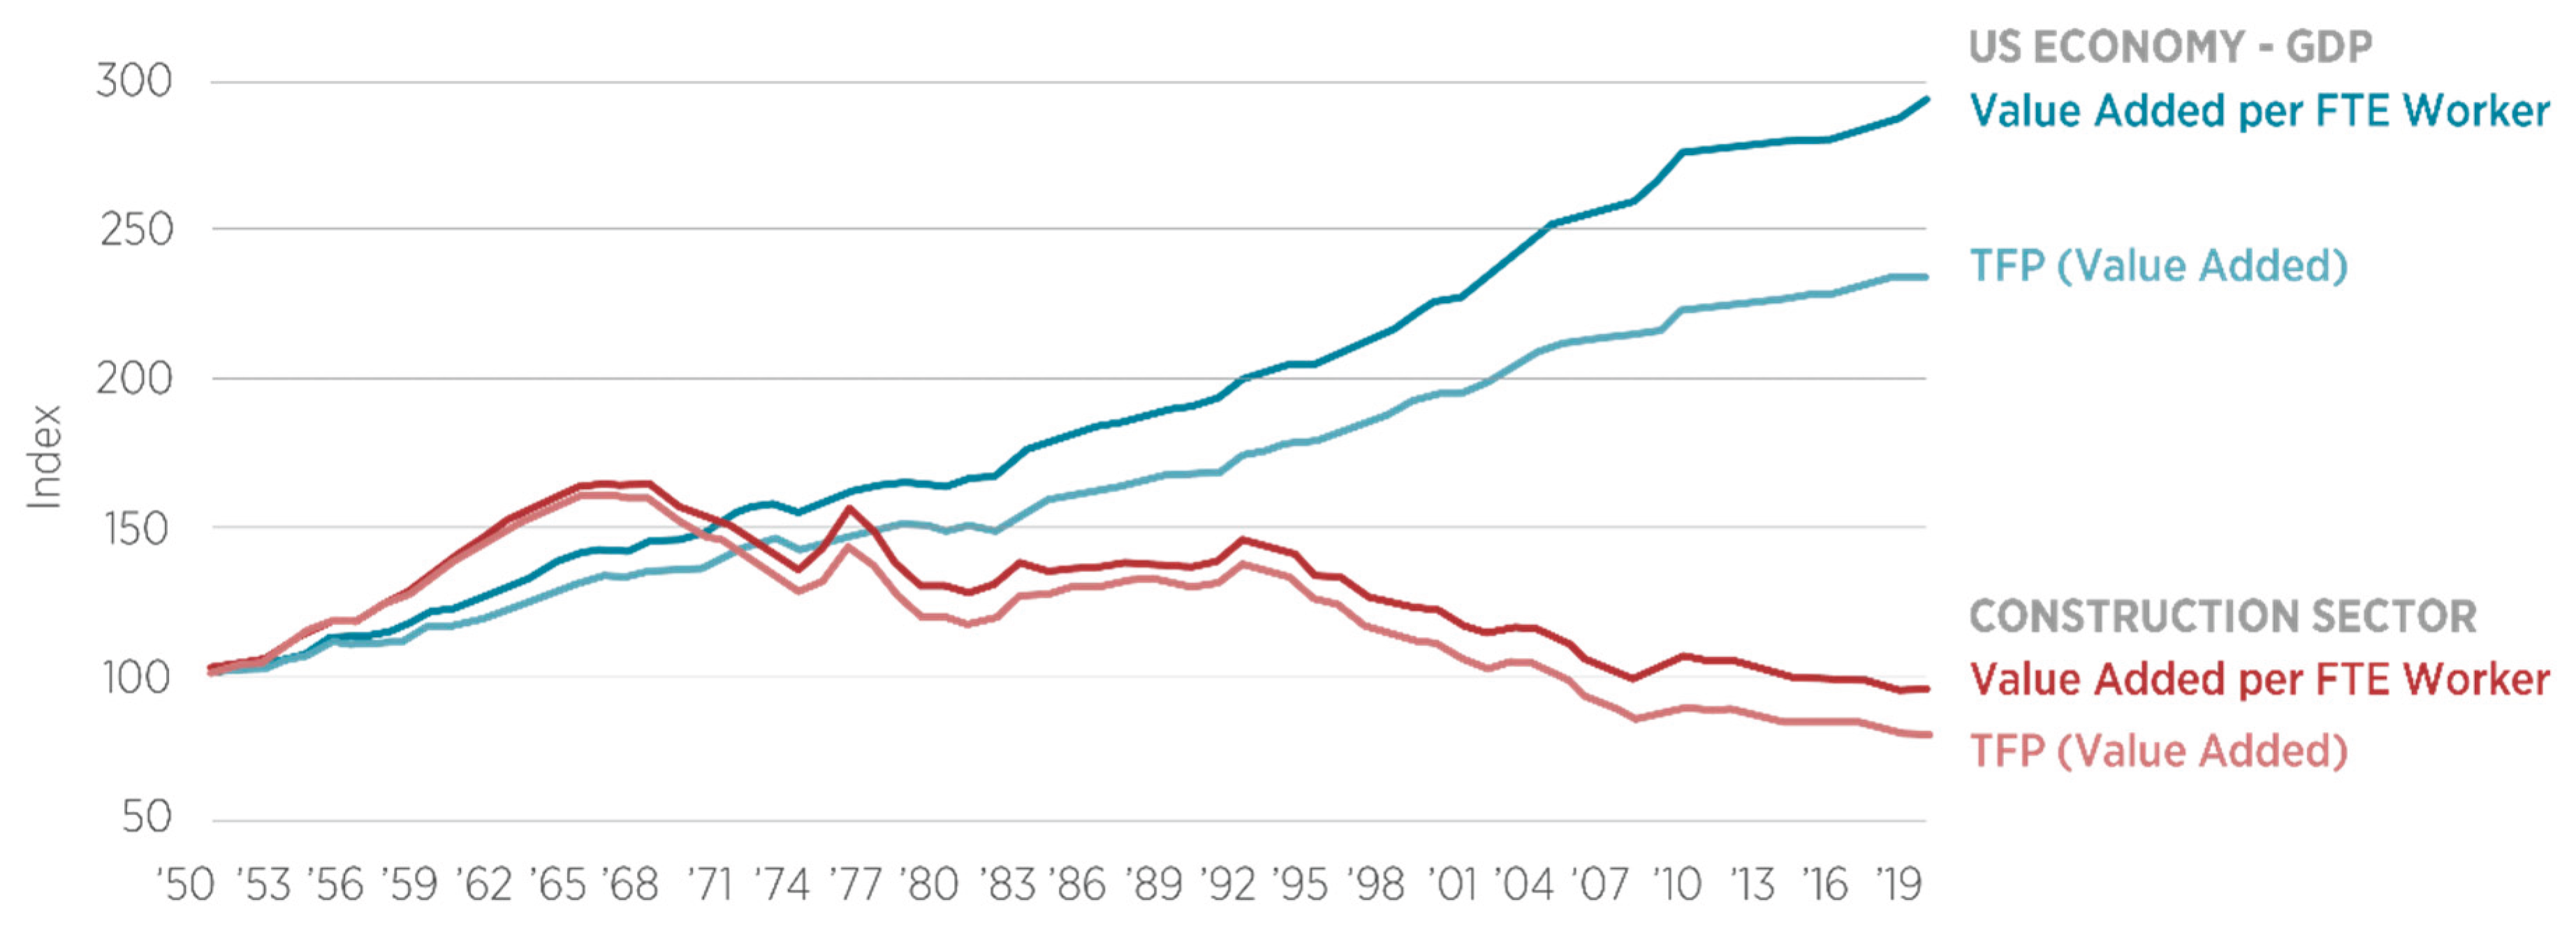
Figure 2.
Impact of productivity interventions as perceived by construction practitioners (adapted from RICS Construction Productivity Report 2024 [62]). The figure highlights that practitioners overwhelmingly rank skilled labour availability as the key driver of productivity, while automation, robotics, and technological innovations—such as construction equipment, tools, and prefabrication—are often perceived to have limited impact. This perception may underestimate the long-term productivity potential of technological interventions, particularly when integrated strategically. Given the opinion-based nature of these findings, further empirical research is needed to validate whether current practitioner judgments align with measurable productivity outcomes, especially in light of advancements in automation and AI-driven construction workflows.
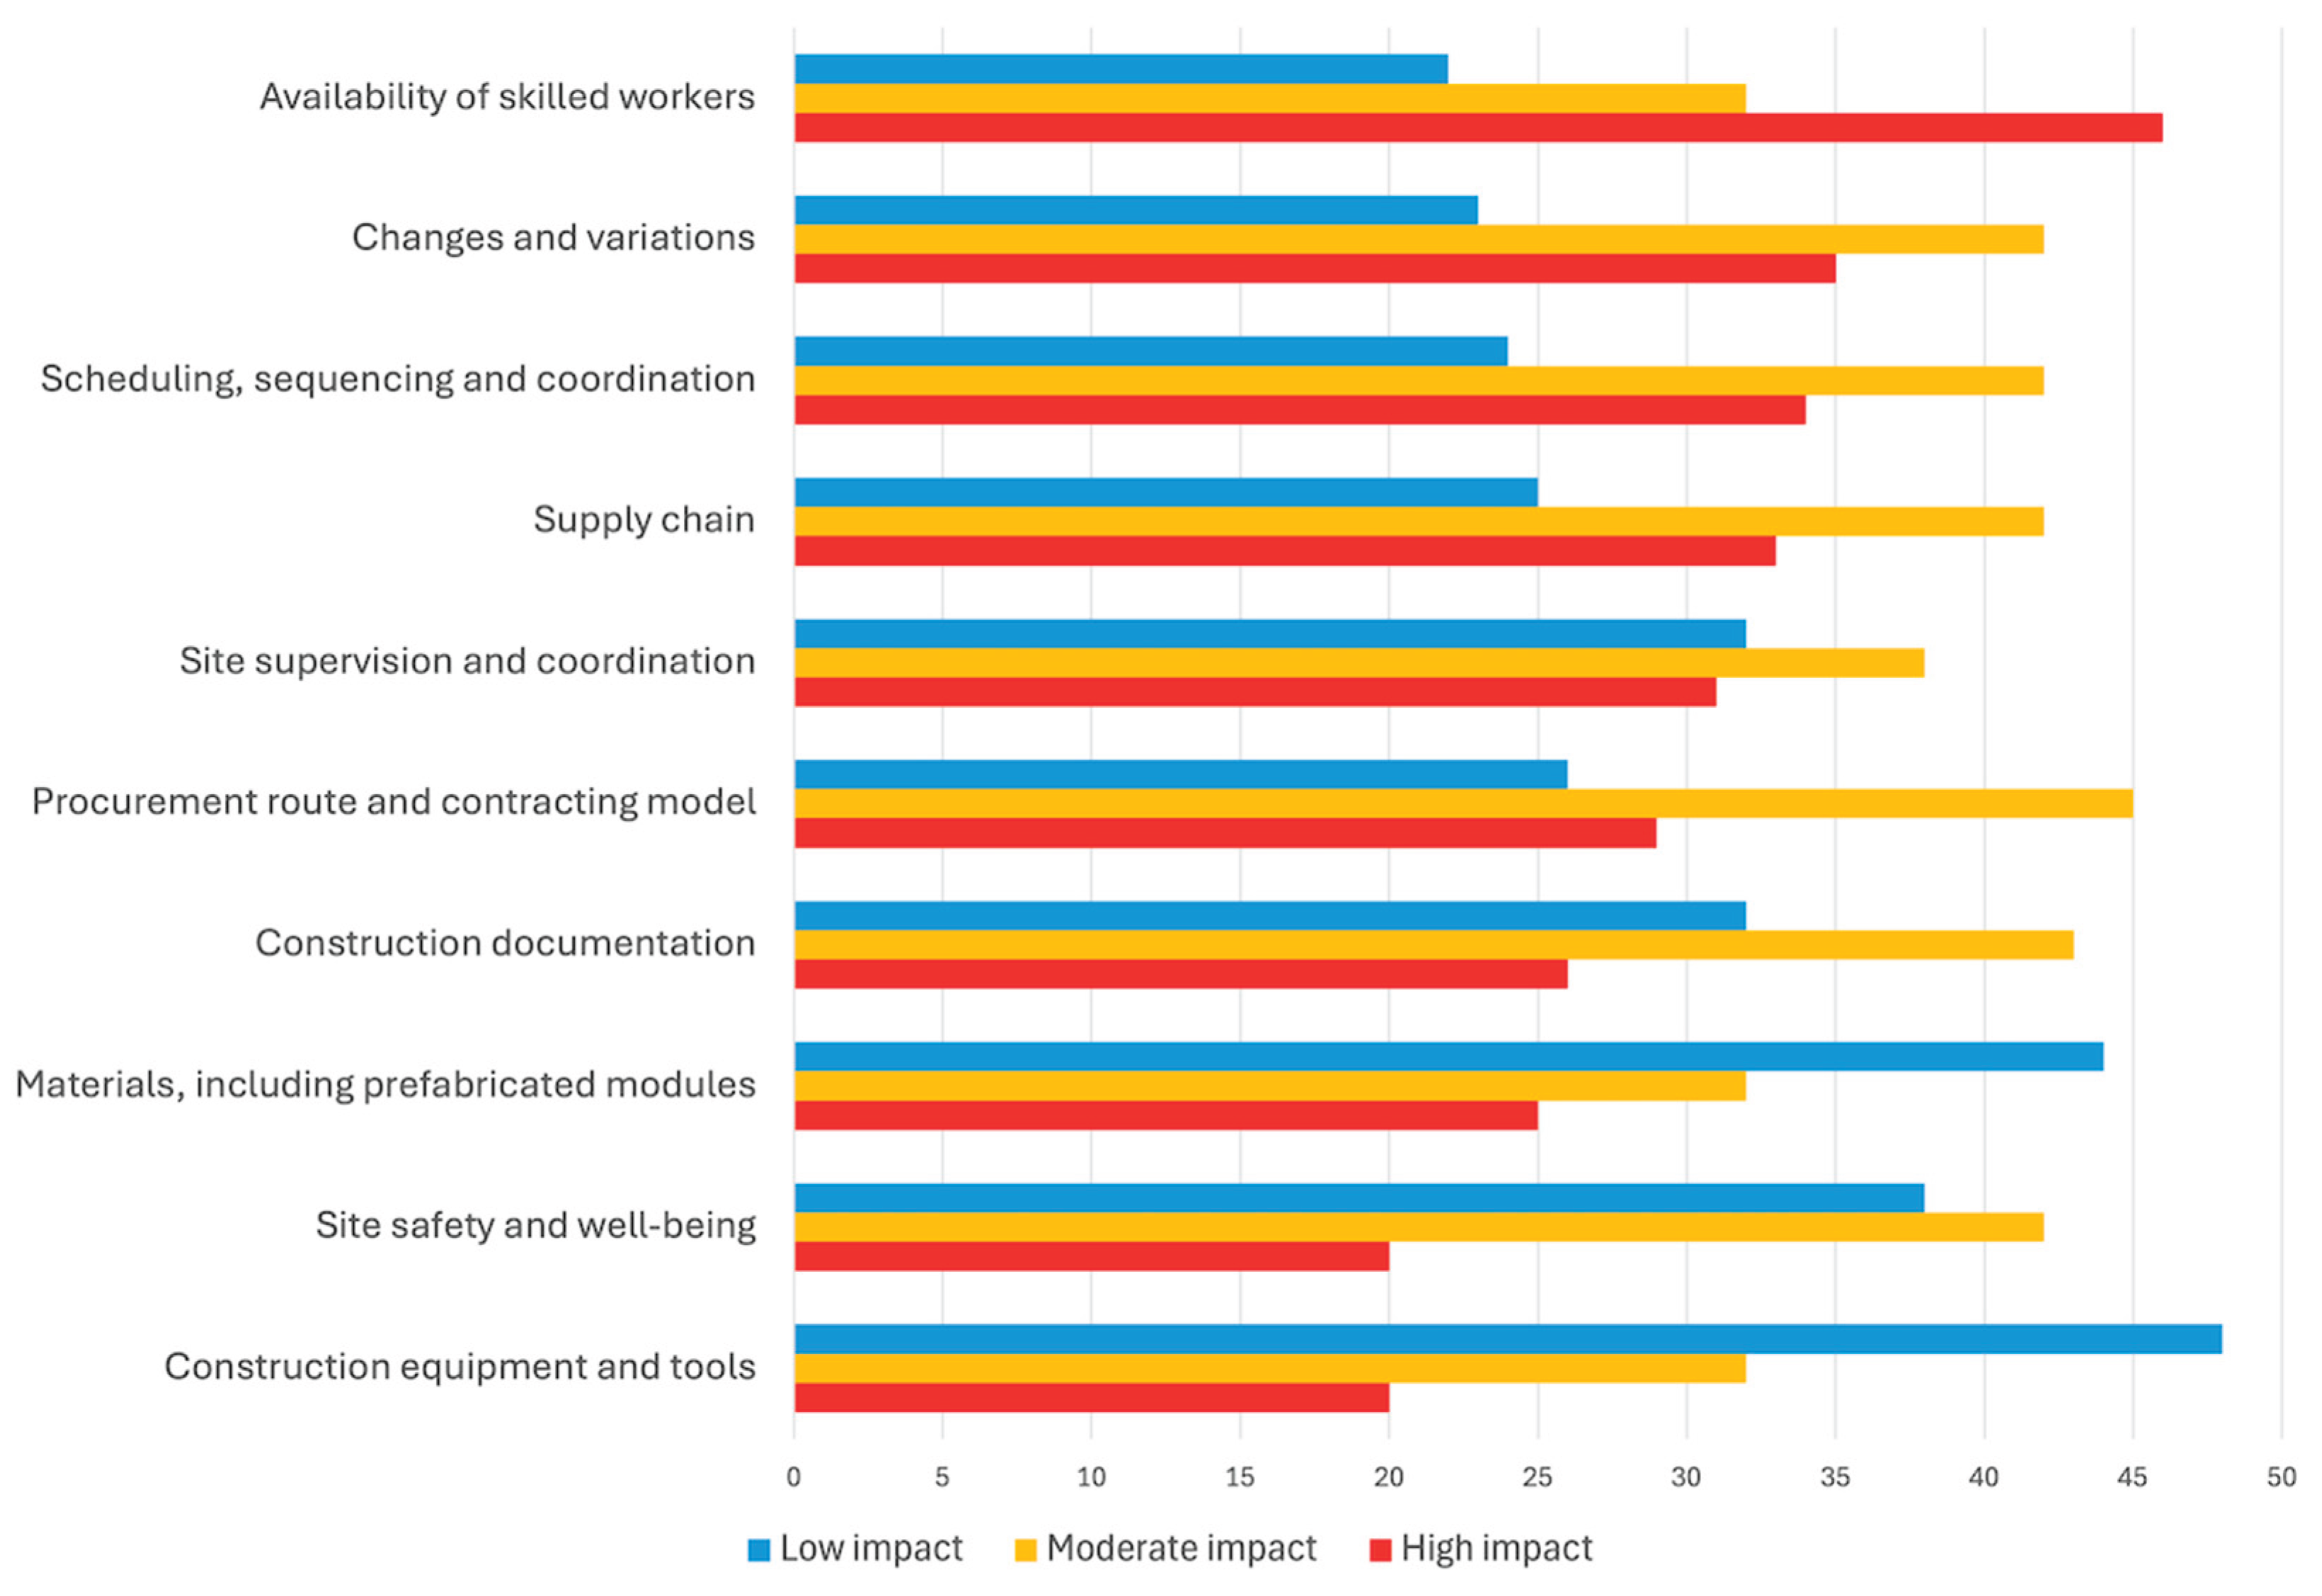
Figure 3.
Overview of key productivity performance metrics in construction. The diagram illustrates the relationships between planned and actual input and output, defining actual productivity, planned productivity, efficiency (η), effectiveness (ε), and the productivity index (PI). Efficiency measures resource utilization by comparing planned to actual input, while effectiveness assesses output goal achievement by comparing actual to planned output. The productivity index integrates both dimensions, indicating overall productivity performance relative to the plan. Guiding questions alongside each metric provide practical orientation for performance evaluation. This conceptual framework has not been adapted from existing literature and was created by the authors for this study.
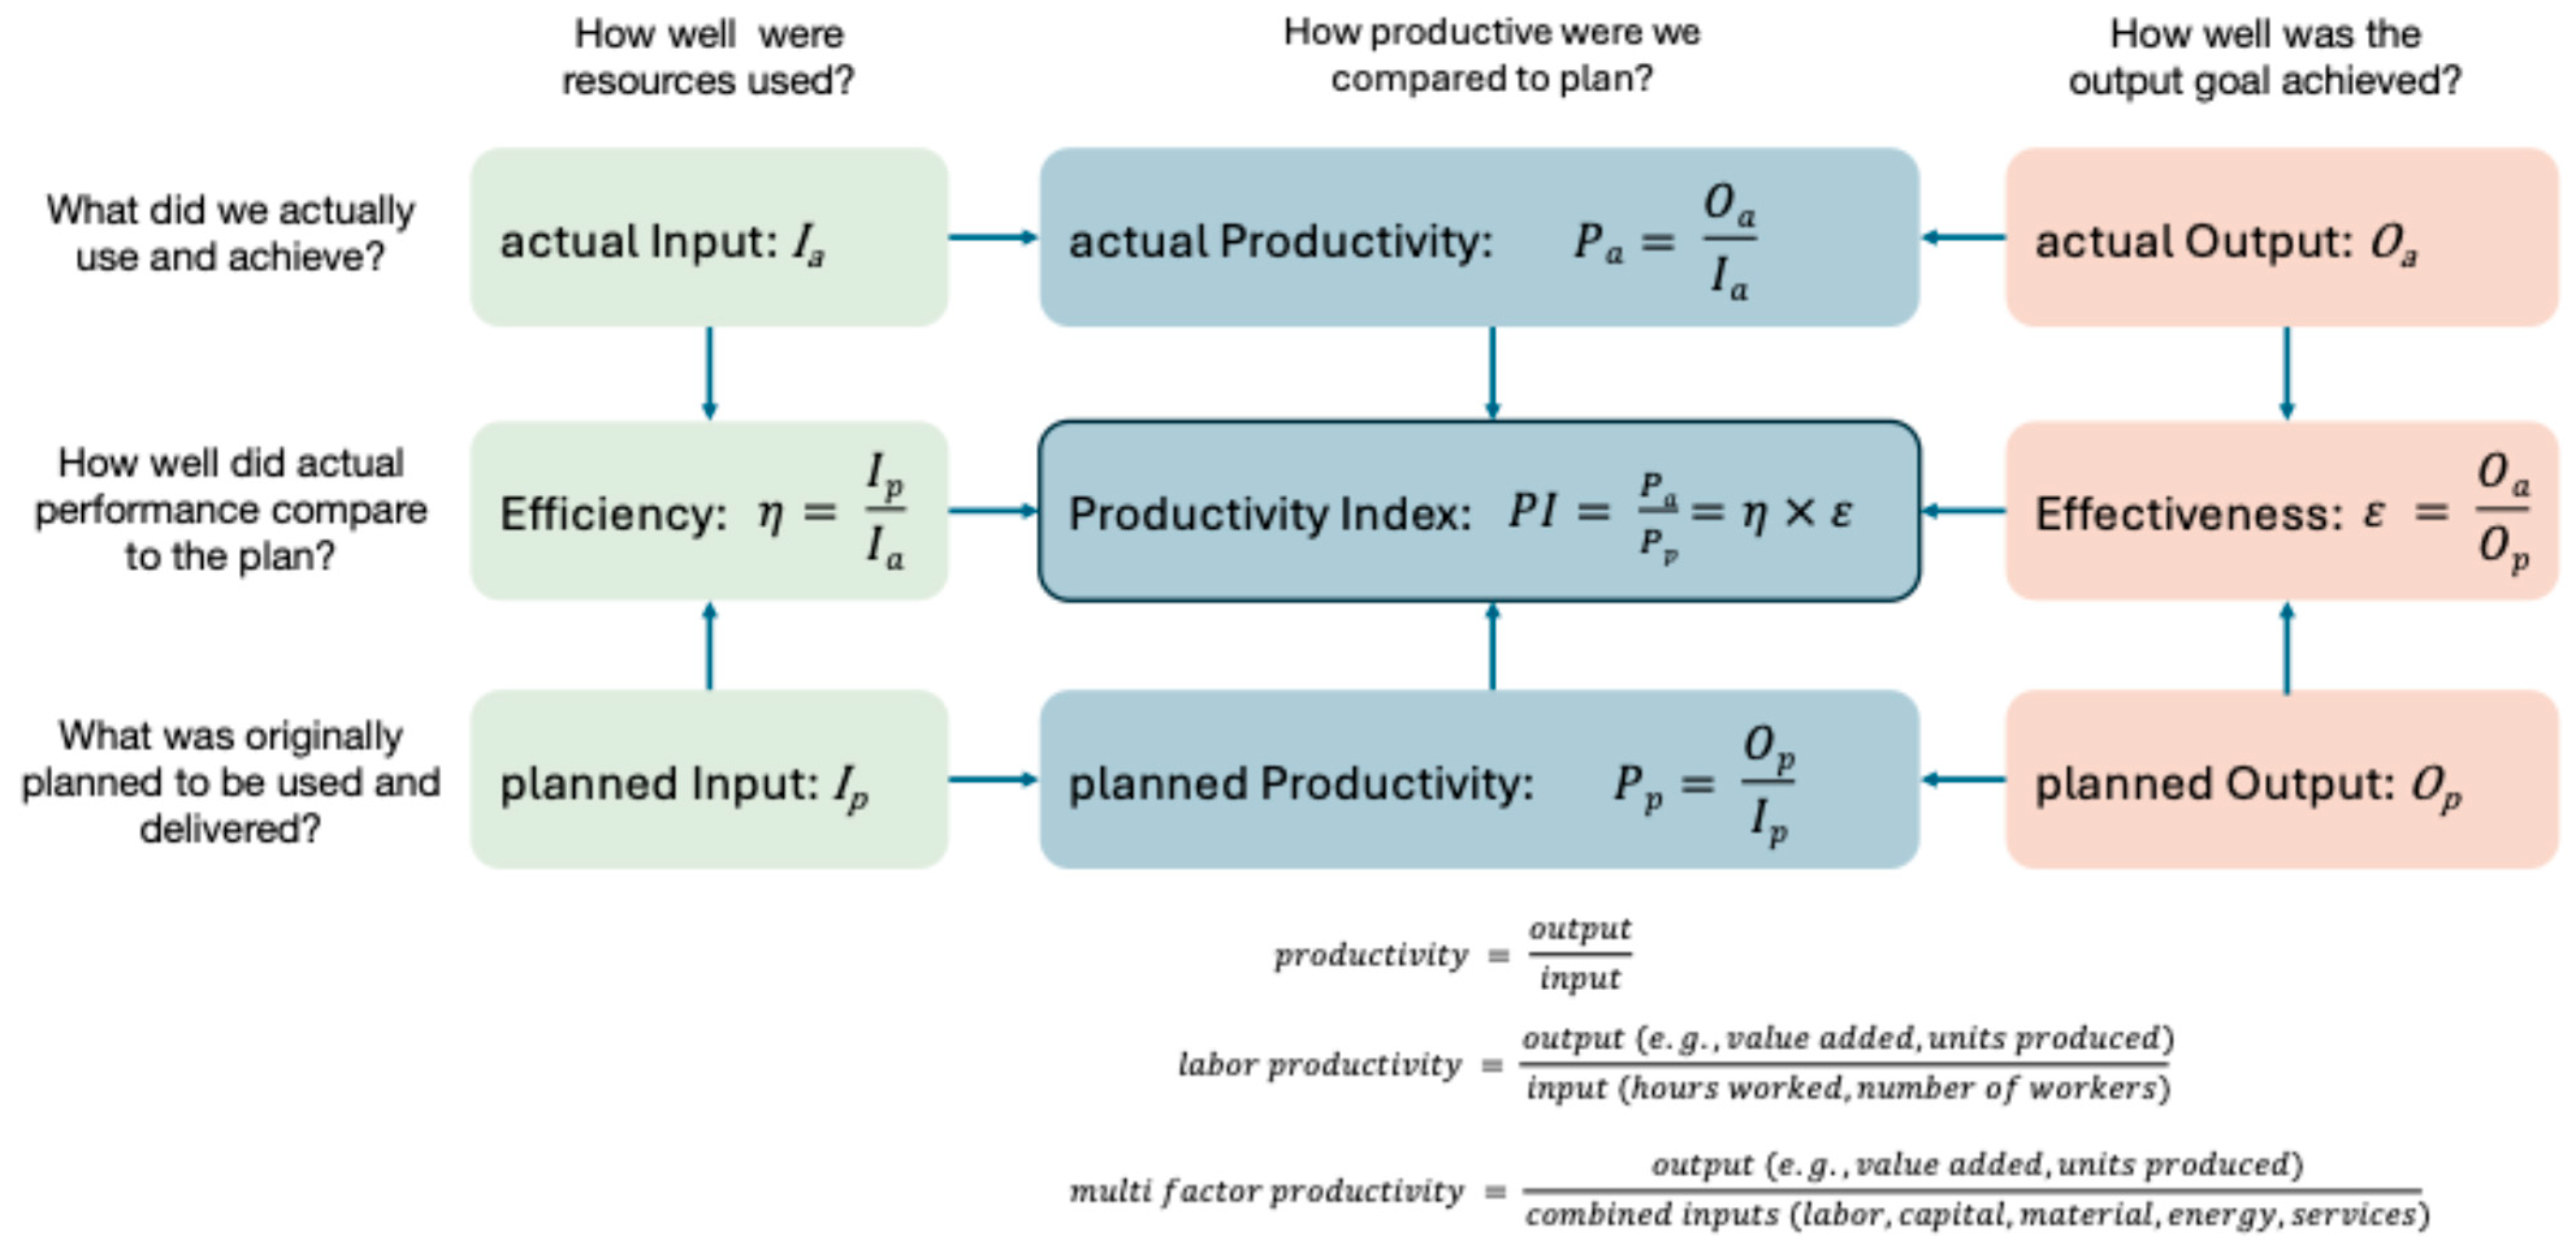
Figure 4.
Modular decomposition of a building component into standardized, repeatable production steps, forming the basis of a construction-specific value stream developed by the authors. Each process step is defined by its measurable output sₒᵢ, performance vᵢ = sₒᵢ / t, and productivity pᵢ = rᵢ / sᵢ, with logistics transitions linking steps. The aggregated performance and productivity of the entire building component (VBC, PIBC) derive from the sum of standardized outputs and resource inputs. This representation offers a physically consistent, granular model for value stream analysis at the operational level, enabling benchmarking, automation, and real-time performance monitoring based on process step logic. It serves as the foundational layer of a hierarchical productivity ontology for modular construction systems.
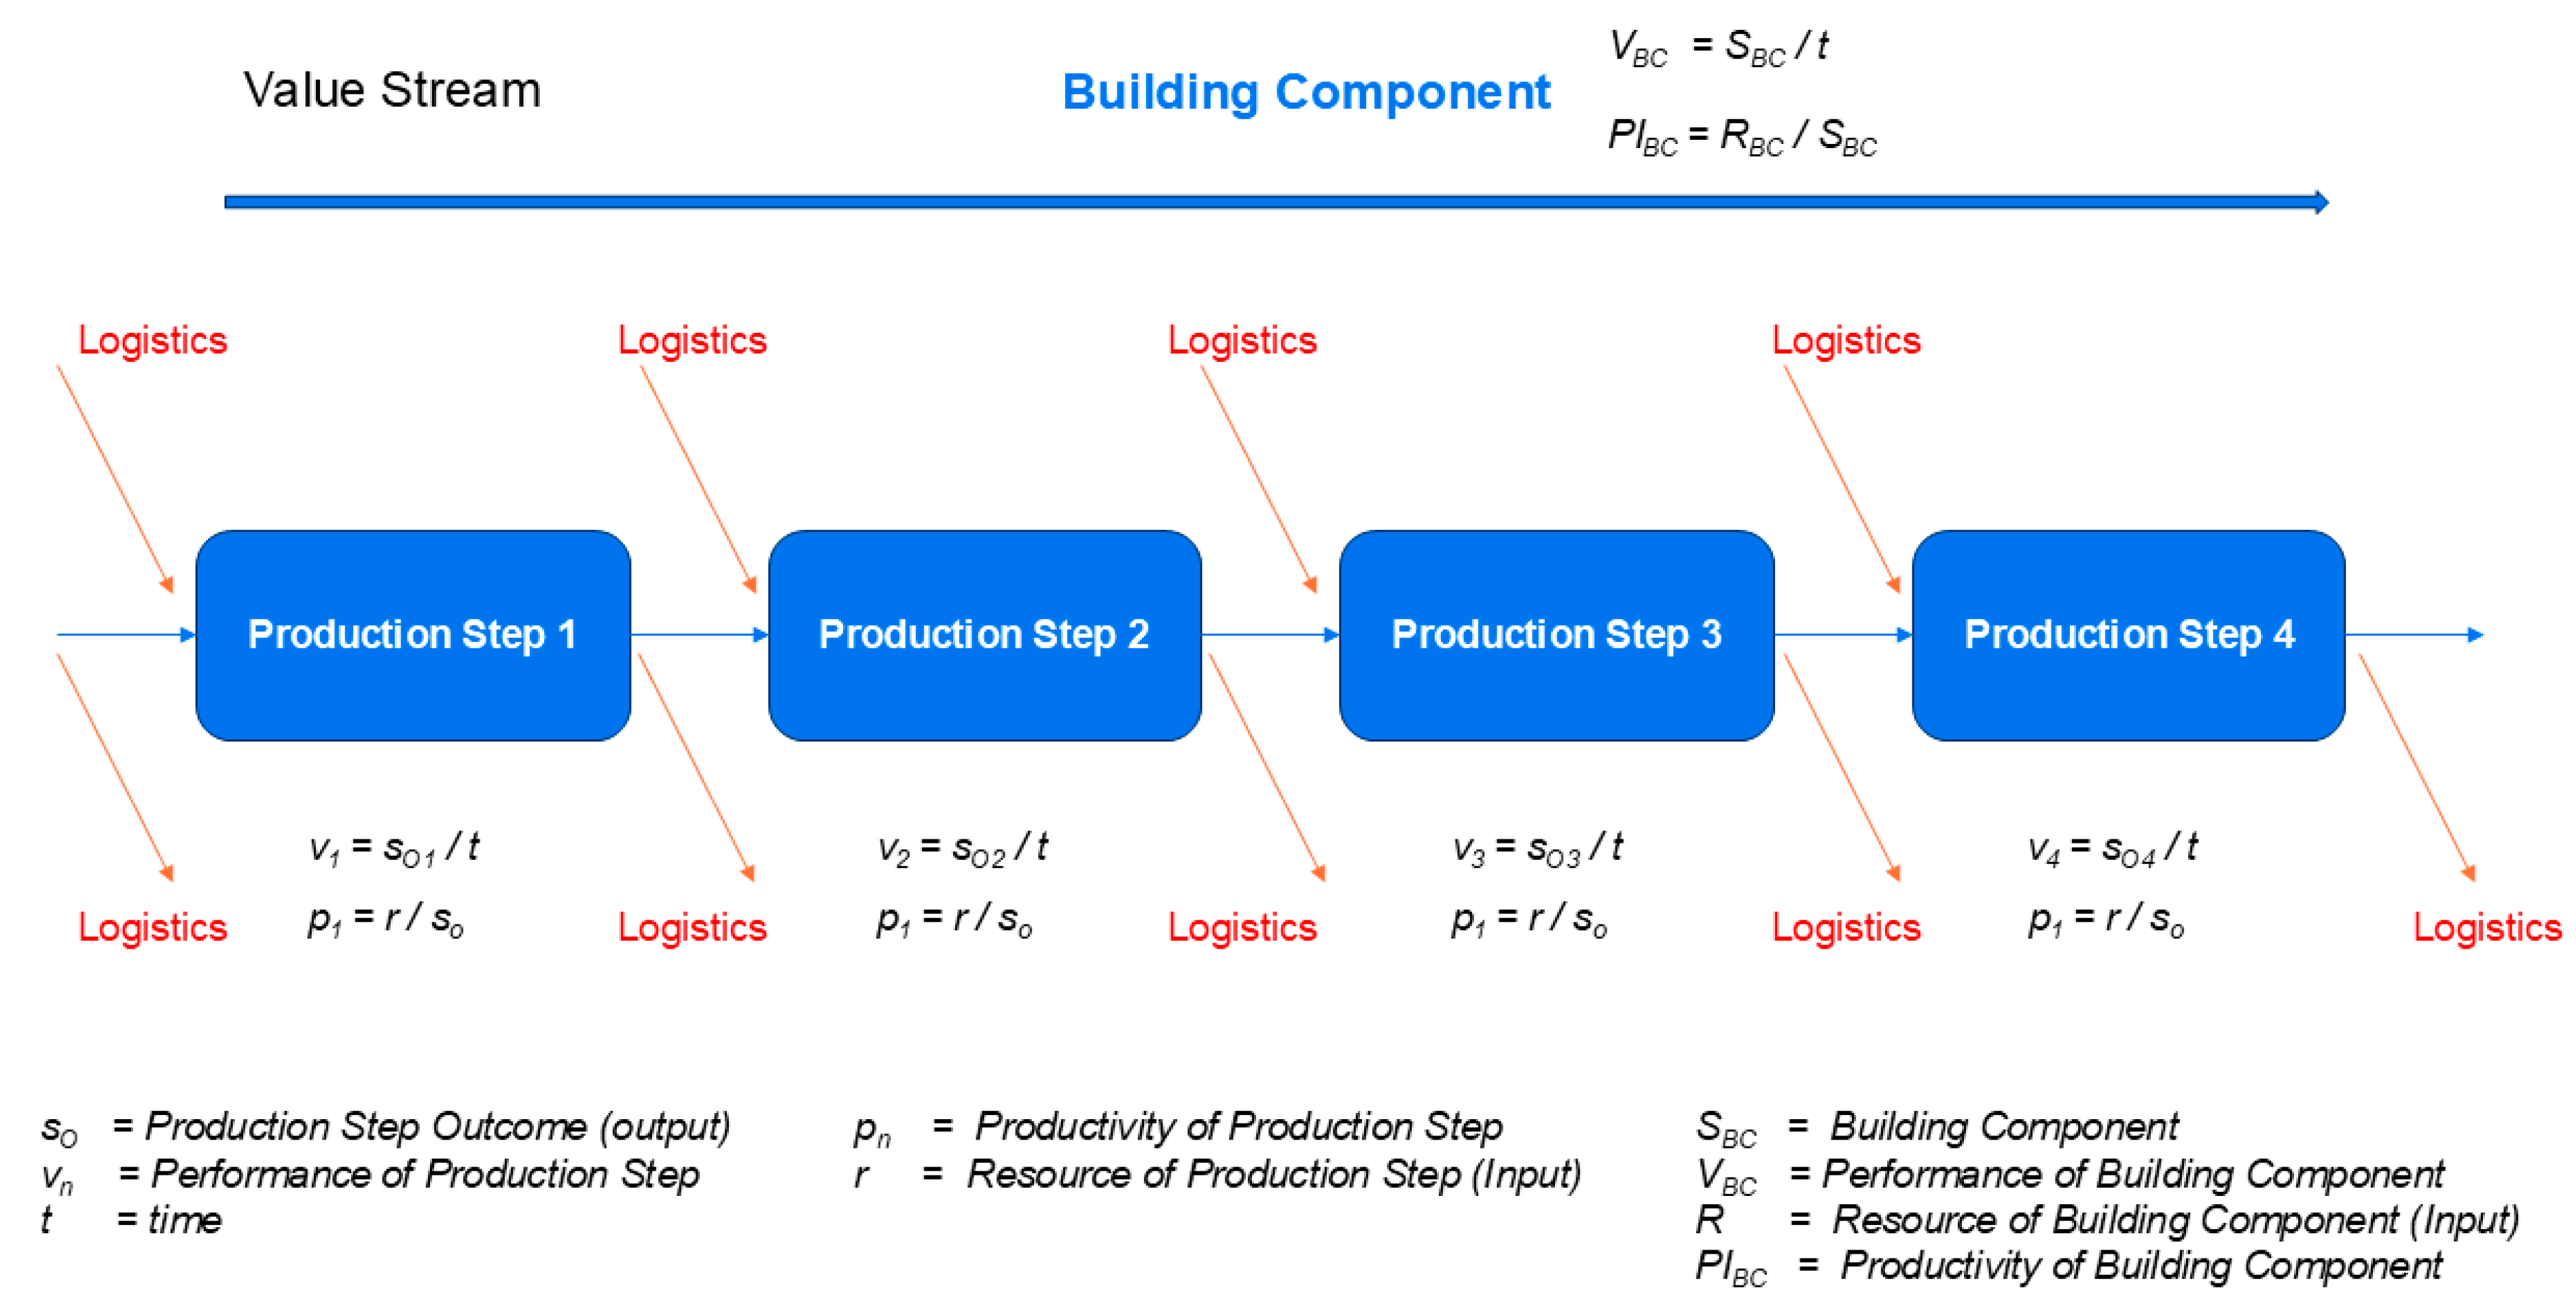
Figure 5.
Dual-axis sequencing model for trade-level productivity optimization developed by the authors, adapted from Shigeo Shingo’s process-operation framework [92]. The vertical axis represents standardized production steps performed repeatedly across multiple building components, while the horizontal axis captures the hand-off sequence between trades or production steps within a construction module. This structure enables concurrent tracking of vertical (task-level) efficiency and horizontal (flow-level) coordination, highlighting the interplay between takt-time stability, workload balance, and First-Time Quality in multi-trade construction environments.
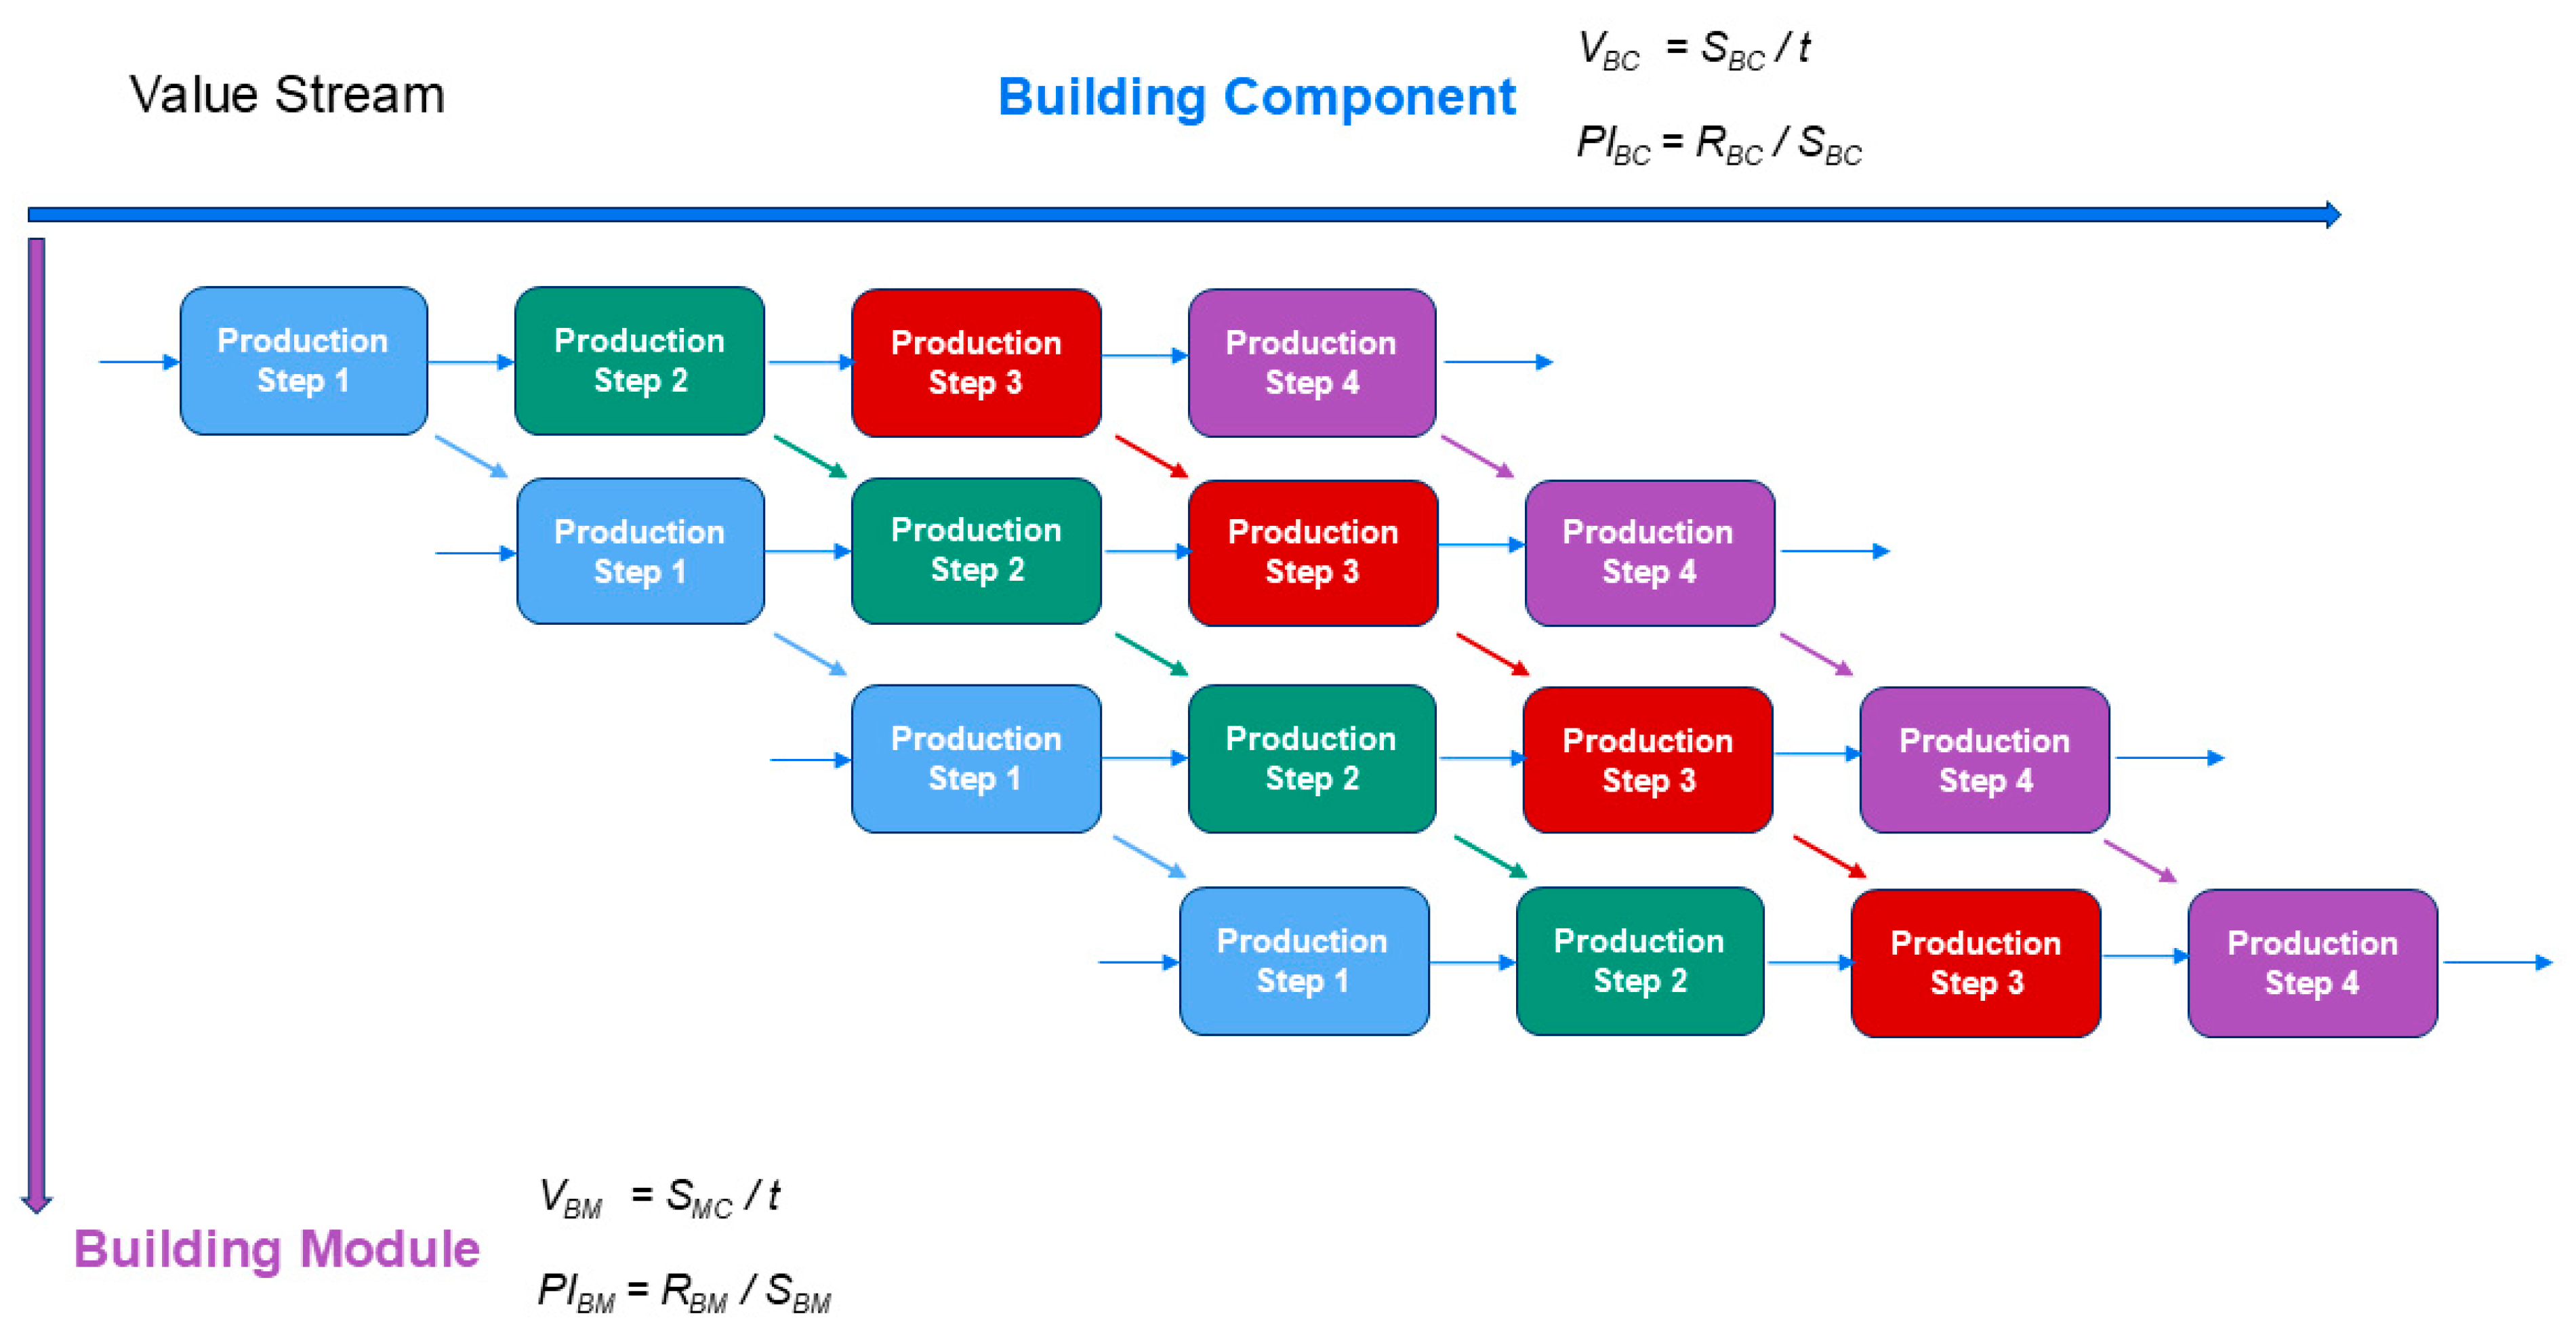
Figure 6.
Aggregation of standardized productivity metrics from construction modules to building sections developed by the authors. The model illustrates how planned versus actual productivity and performance can be tracked in real time at the strategic level by summing process data from the operational and tactical layers. This structure enables transparent performance benchmarking and supports incentive mechanisms—such as performance-based contracts and real-time bonus pools—that reward collaborative gains in takt-time reliability, flow stability, and First-Time Quality across multiple trades and building zones. This conceptual framework has not been adapted from existing literature and was created by the authors for this study.
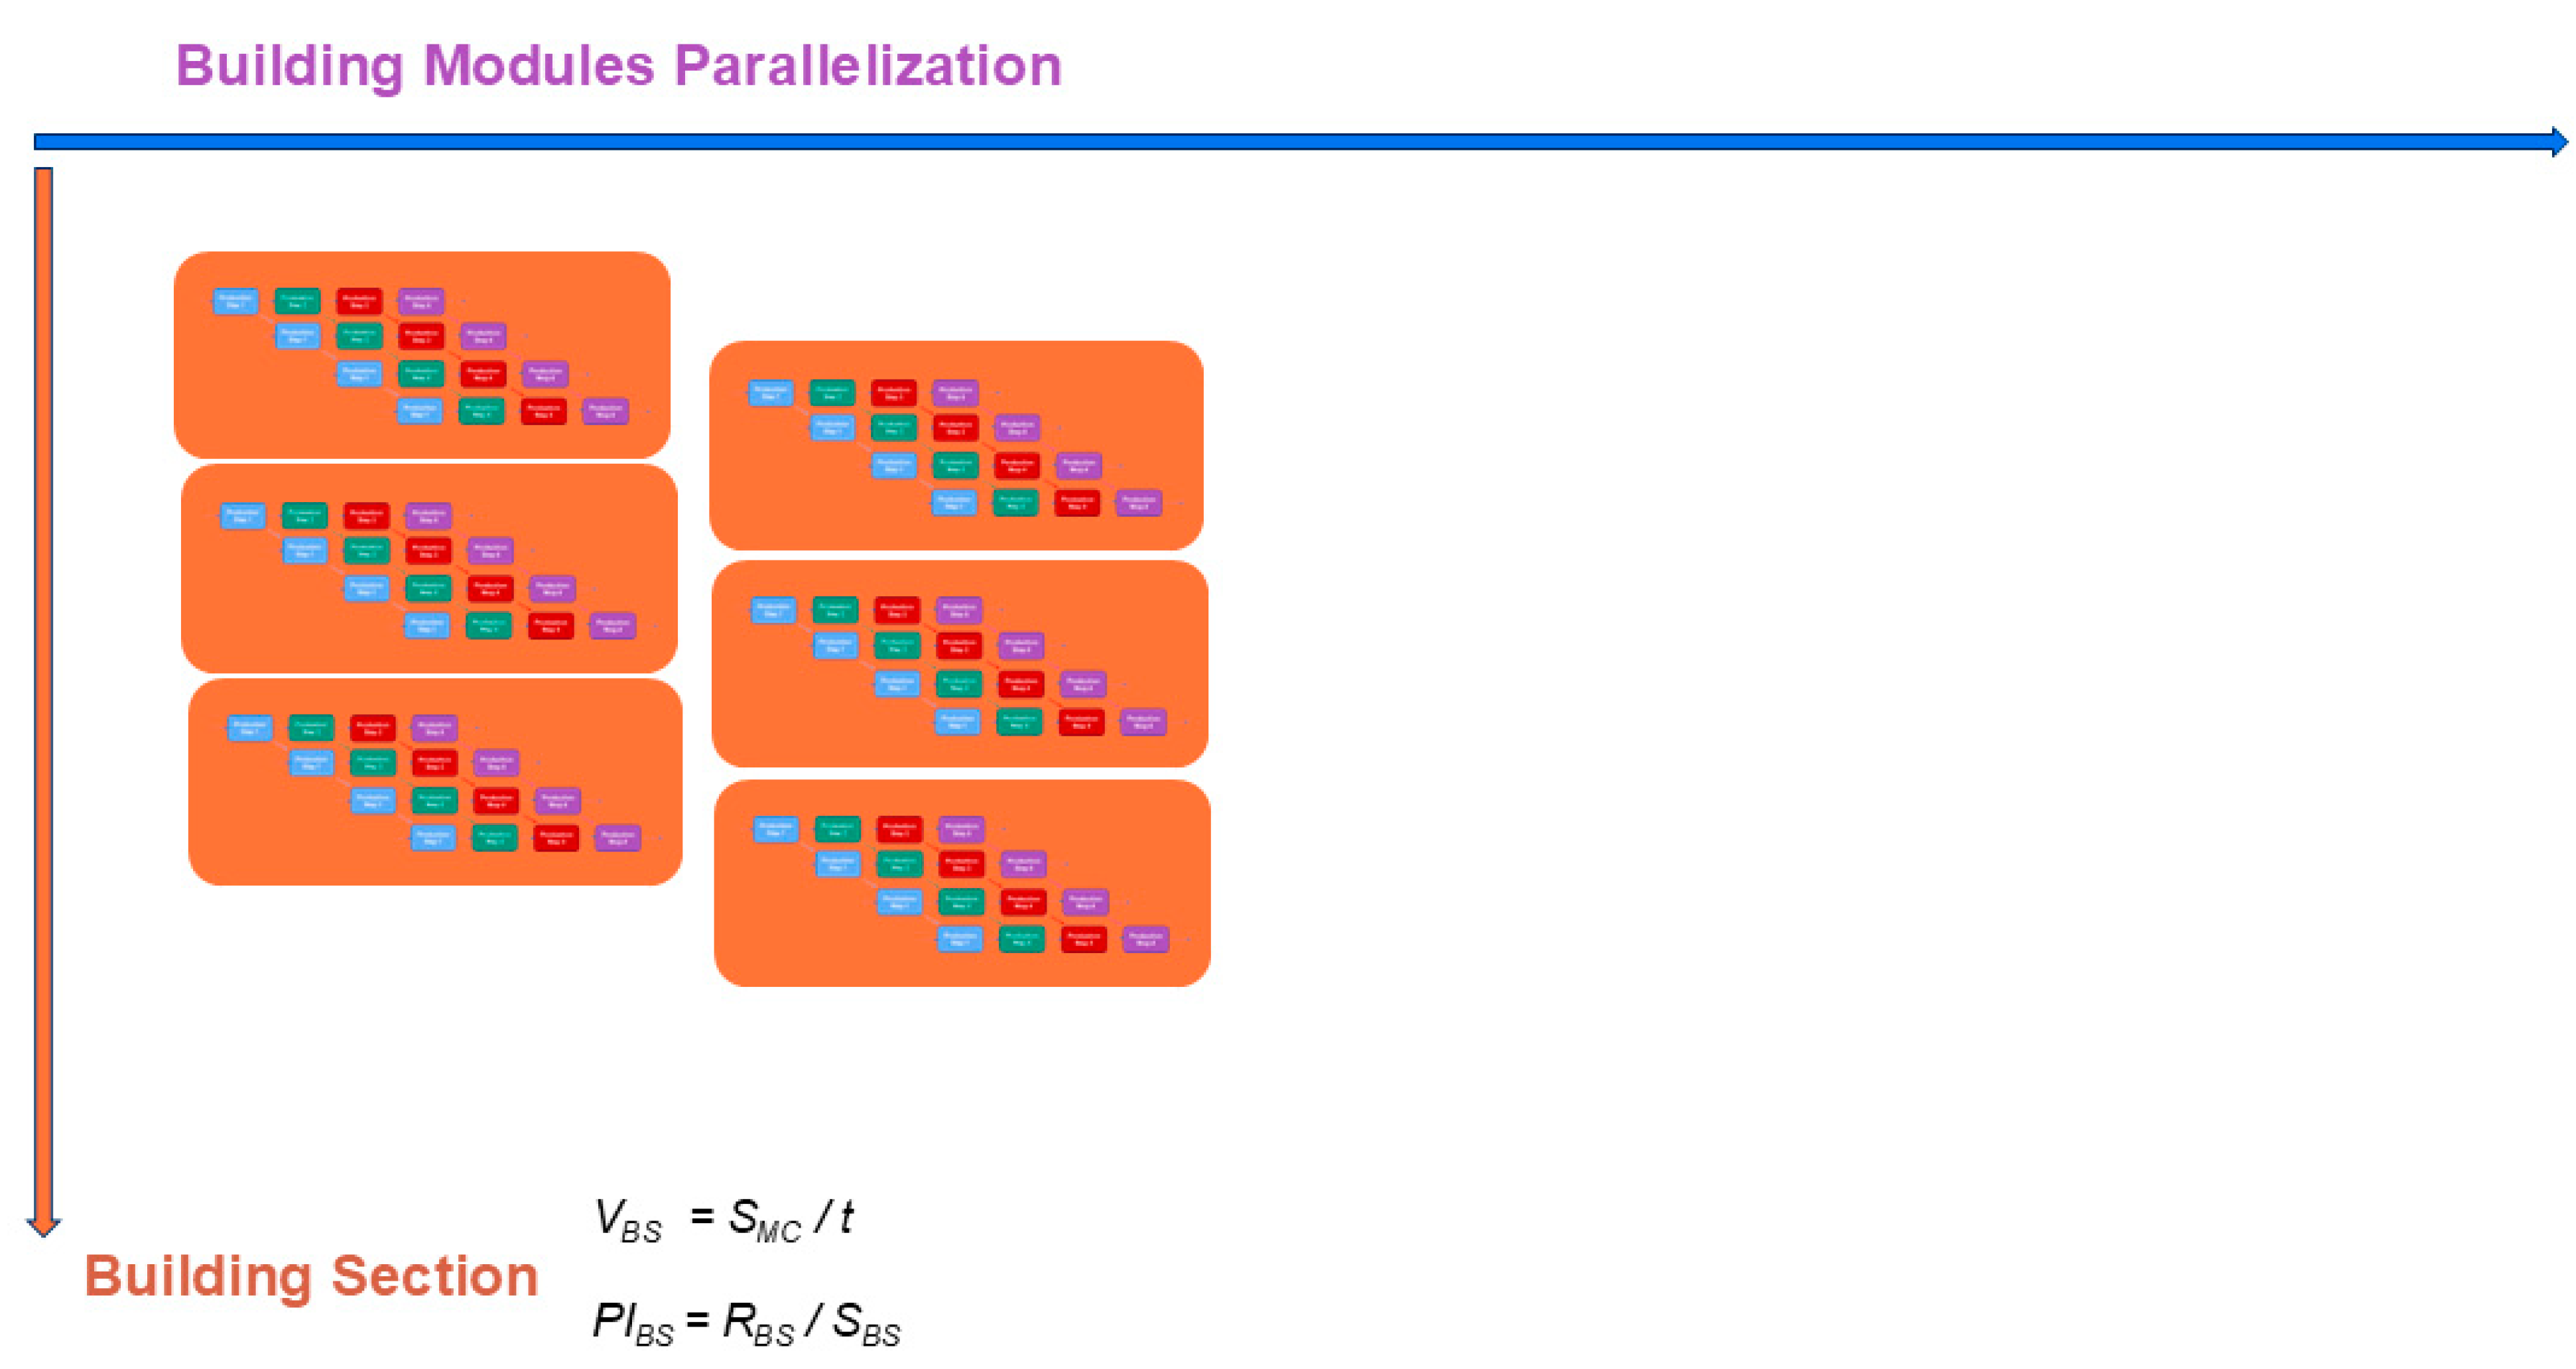
Figure 8.
Feedback-Driven Control Architecture developed by the authors integrating feedback loops between normative, strategic, tactical, and operative levels. The model illustrates how digitalization, sensor-based monitoring, and standardized KPIs enable a continuous refinement of mission alignment, resource planning, and operational practices. Feedback arrows highlight how real-time insights from the field inform standardization, how tactical feasibility calibrates strategic investments, and how strategic goals are recalibrated based on digital maturity and evolving productivity priorities. This conceptual framework has not been adapted from existing literature and was created by the authors for this study.
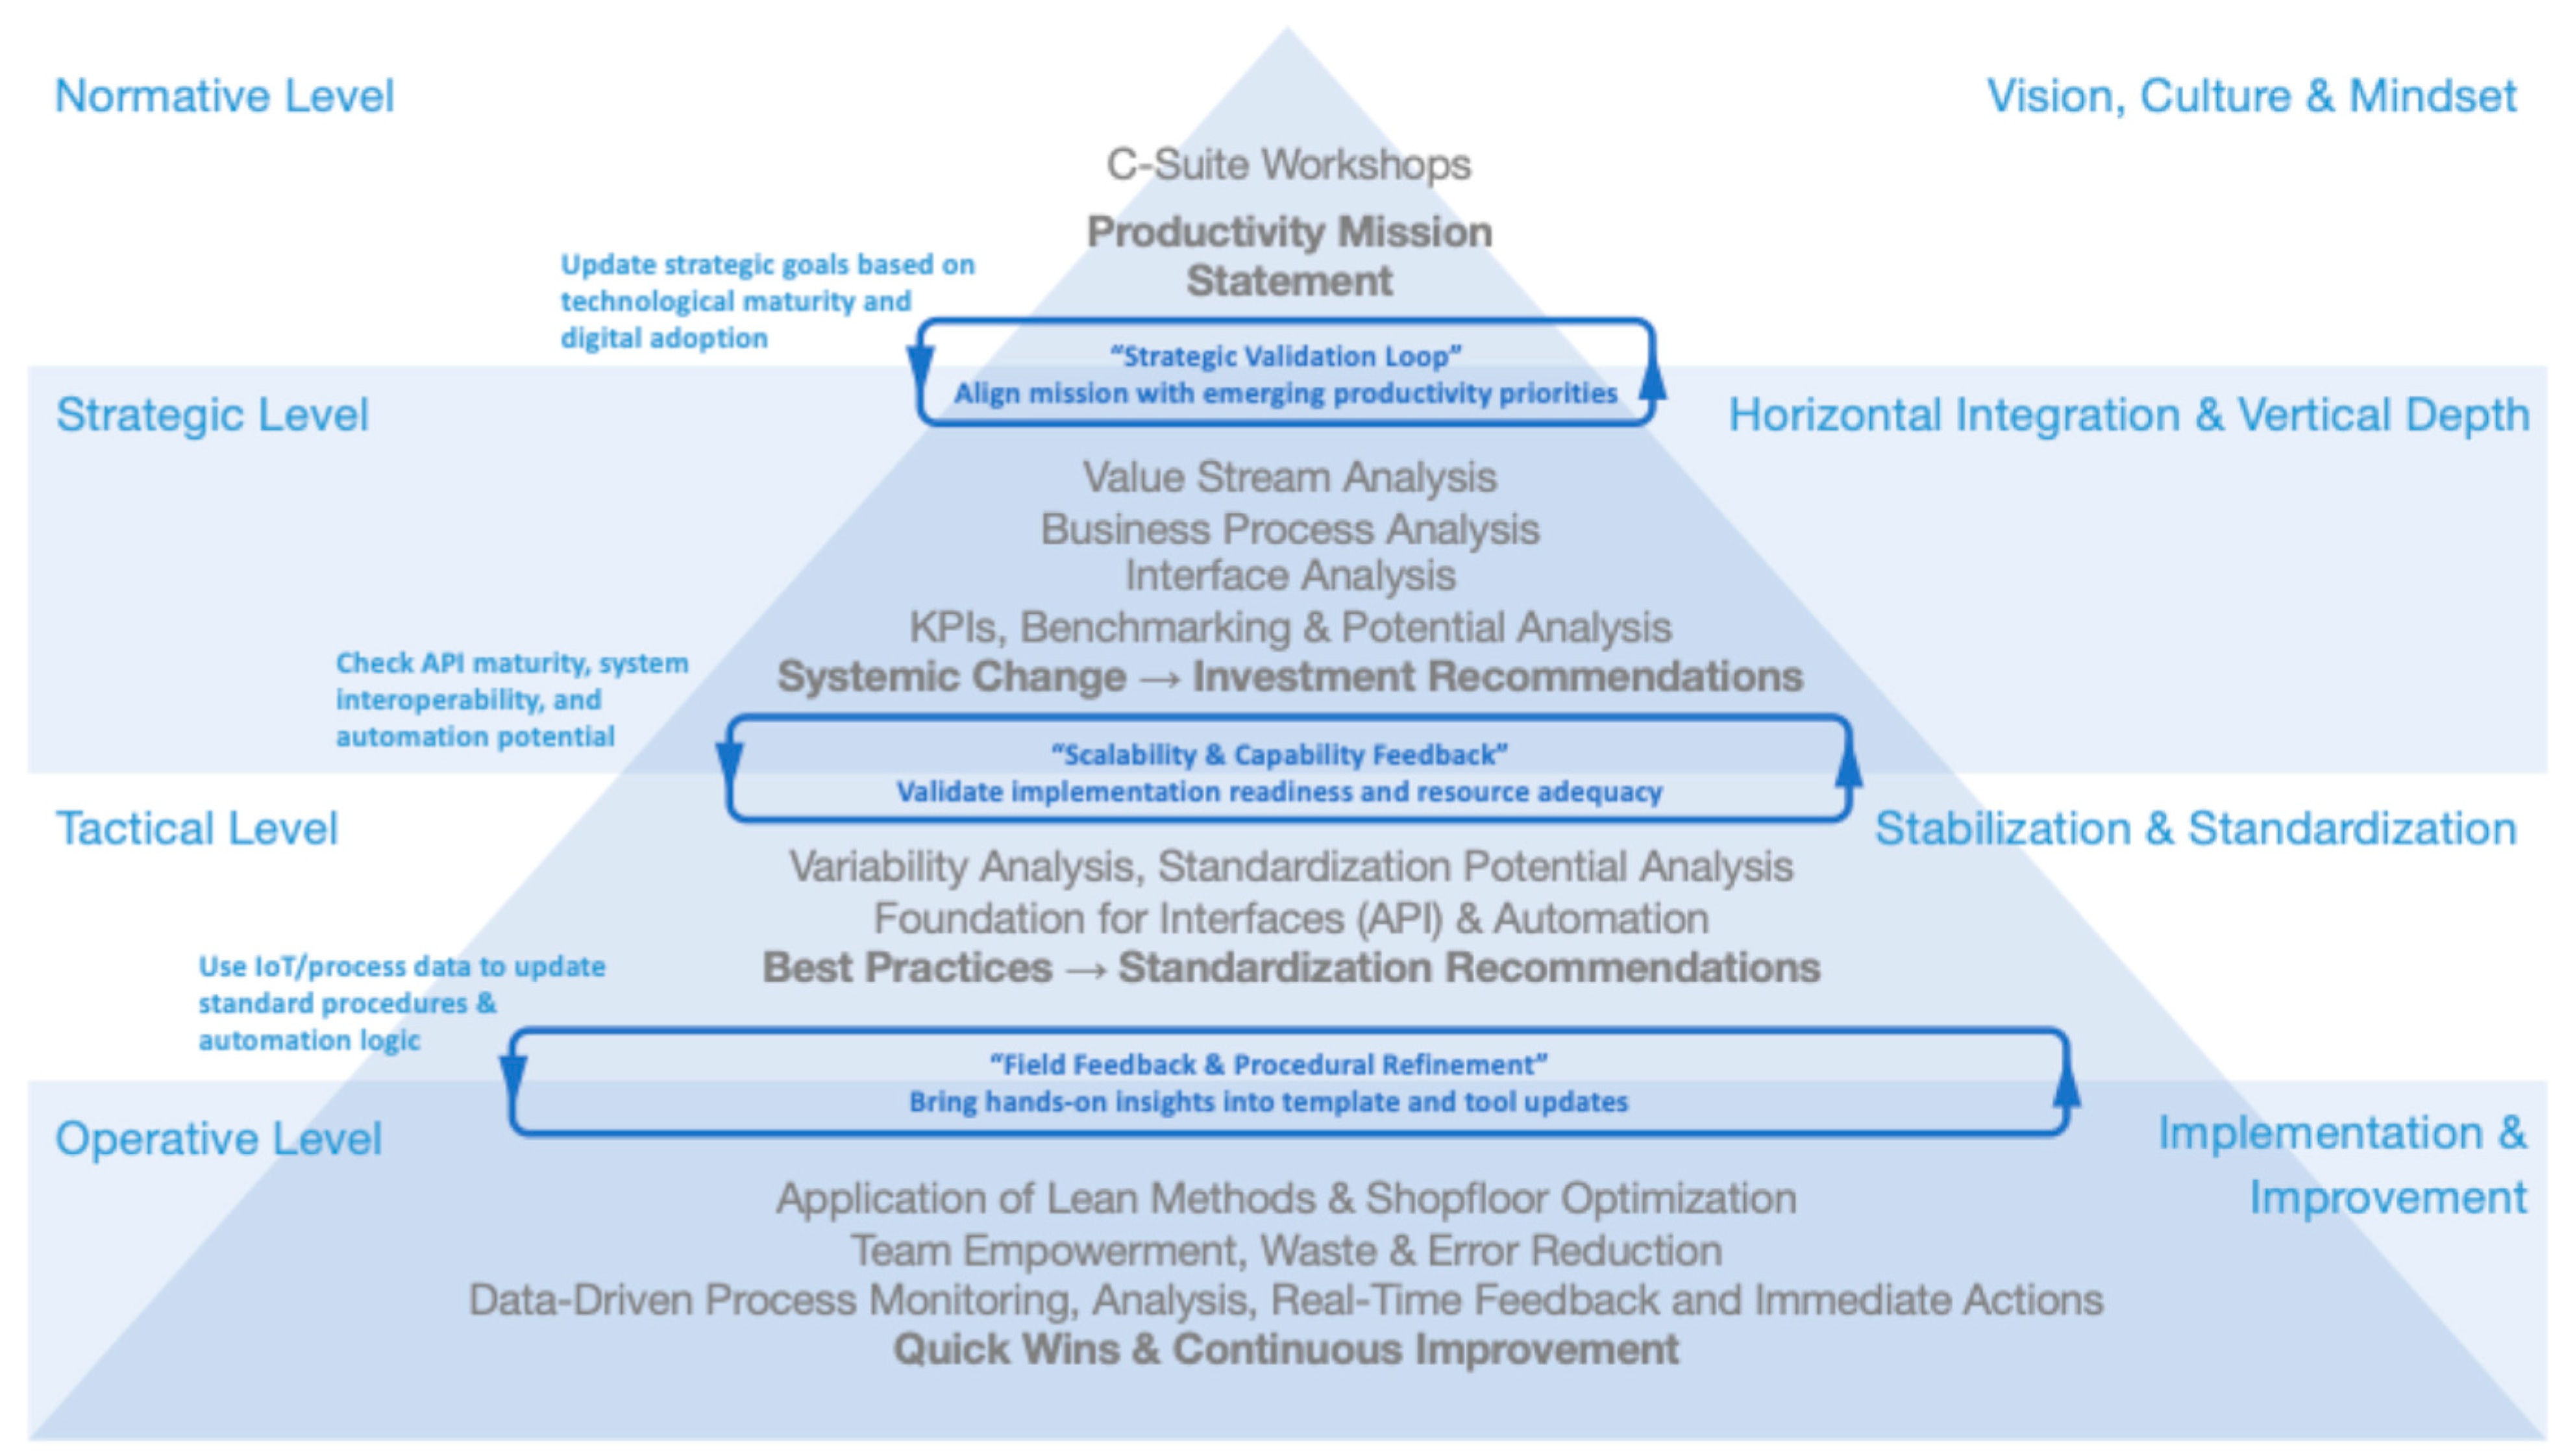
Disclaimer/Publisher’s Note: The statements, opinions and data contained in all publications are solely those of the individual author(s) and contributor(s) and not of MDPI and/or the editor(s). MDPI and/or the editor(s) disclaim responsibility for any injury to people or property resulting from any ideas, methods, instructions or products referred to in the content. |
© 2025 by the authors. Licensee MDPI, Basel, Switzerland. This article is an open access article distributed under the terms and conditions of the Creative Commons Attribution (CC BY) license (http://creativecommons.org/licenses/by/4.0/).
Copyright: This open access article is published under a Creative Commons CC BY 4.0 license, which permit the free download, distribution, and reuse, provided that the author and preprint are cited in any reuse.


