
Submitted:
16 May 2025
Posted:
19 May 2025
You are already at the latest version
Abstract
Ovarian cancer is the deadliest of all gynecologic malignancies due to limited therapeutic options. Our data show that tumor-specific metabolism of ovarian cancer could be effectively targetable, which highlights a path for new anti-cancer therapies. Our work showed that the upregulation of mitochondrial enzyme SDHA is particularly prevalent in ovarian carcinoma. The SDHA overexpression significantly induced orthotopic ovarian tumor growth substantially reducing mouse survival. We showed that the SDHA overexpressing tumors depend on glutaminolysis, and increased activity of TCA cycle coupled with mitochondrial oxidative phosphorylation (OXPHOS), which are essential for high-energy metabolism and cell survival. We also identified a distinctive vulnerability of SDHA overexpressing tumors to agents targeting regulators of OXPHOS pathway, particularly LRPPRC protein. LRPPRC is a key regulator of mitochondria homeostasis and energy metabolism promoting OXPHOS and ATP generation, however when overexpressed, the LRPPRC acts as tumor oncogene. Our analysis of SDHA and LRPPRC gene and protein expression patterns in precursor lesions and established ovarian cancer demonstrated that the upregulation of SDHA is accompanied by LRPPRC overexpression, particularly in advanced tumors. Our novel findings highlight for the first time a potential functional interaction between SDHA and LRPPRC in development and progression of ovarian malignancy. Importantly, our in vivo data showed that pharmacological blocking LRPPRC function results in a long-term therapeutic benefit and can be an effective therapy in SDHA and LRPPRC overexpressing ovarian tumors. Overall, our study underlines an understudied role of concomitant overexpression of SDHA and LRPPRC in ovarian cancer pathogenesis highlighting new opportunities for therapeutic intervention.
Keywords:
ovarian cancer
; succinate dehydrogenase
; SDHA
; LRPPRC
; OXPHOS
; HGSOC
; shikonin
; metabolism
; patient-derived xenograft
1. Introduction
High-grade serous ovarian cancer (HGSOC) is an aggressive gynecological cancer with extremely poor prognosis due to limited therapeutic options [1,2]. Despite initial responses to cytoreductive surgery and conventional chemotherapy, HGSOC is incurable, as recurrence and chemotherapy resistance occur in the majority of patients resulting in a 5-year survival rate less than 40% [3,4]. New therapies are urgently needed, and biomarker-guided personalized treatment strategies hold great promise to improve ovarian cancer disease outcomes.
Metabolic reprogramming is a hallmark of cancer, allowing tumor cells to grow and proliferate at a faster rate, and to survive cellular stress or anti-cancer treatment [5,6,7,8]. The past decade has brought numerous advances in our understanding of distinct metabolic phenotypes of malignant tumors. Many tumor types are not solely dependent on glycolysis (Warburg effect) for their energy requirements, which has been historically considered a fundamental feature of tumor metabolism. Instead, these tumors are more inclined to derive energy from mitochondrial OXPHOS [9,10,11,12]. Cancers can broadly be categorized into two distinct metabolic subgroups high-OXPHOS and low-OXPHOS tumors. The high-OXPHOS tumors show robust mitochondrial respiration relying on the tricarboxylic acid (TCA) cycle flux for their energy demands and biosynthetic needs, while low-OXPHOS tumors exhibit an enhanced glycolytic metabolism [13,14]. Studies show that in ovarian cancer, mitochondrial energy metabolism is one of the major contributors to aggressiveness and chemoresistance [13,15]. Moreover, metastatic ovarian tumors or cancers with stem cell-like features are highly metabolically active with increased mitochondrial respiration [6,15,16]. Thus, targeting key regulators of high-OXPHOS metabolism could be a promising therapeutic approach for ovarian cancer.
We discovered that a common feature of high-OXPHOS tumors is significantly overexpressed mitochondrial enzyme succinate dehydrogenase subunit A (SDHA), which is particularly prevalent in ovarian carcinoma (~20% of cases) [17]. Succinate dehydrogenase has a critical role in cellular energy metabolism through its dual role in the TCA cycle and as a part of the electron transport chain (ETC). Specifically, the SDHA acts within mitochondrial complex II, coupling oxidation of succinate to fumarate with reduction of ubiquinone to ubiquinol, directly connecting TCA cycle with ETC [18]. In our previous work, mechanistic studies revealed that the SDHA upregulation in ovarian cancer is associated with robust mitochondrial OXPHOS and ATP production, which are essential for viability of tumor cells. Lastly, we identified shikonin, a potent and selective compound in targeting tumors overexpressing SDHA [17]. However, the underlying mechanism of critical sensitivity of SDHA-overexpressing tumors to shikonin is unknown due to shikonin’s numerous biological activities and not fully understood molecular targets [19,20]. The goal of this study is to address this gap in knowledge by investigating the metabolic vulnerabilities and mechanisms of high sensitivity of SDHA overexpressing tumors to shikonin, which holds untapped opportunities for therapeutic intervention.
In this work, we showed that the aberrantly upregulated SDHA is therapeutically relevant target in ovarian cancer. Our in vivo studies using mouse models of ovarian cancer showed the SDHA overexpression contributed to robust orthotopic tumor growth and metastasis substantially reducing mouse survival. Further, using proteomics and metabolomics methods, we highlighted a central role of glutaminolysis, and increased activity of TCA cycle coupled with mitochondrial OXPHOS in maintaining high energy demands and biosynthetic needs of SDHA overexpressing tumors. Next, we performed a drug target screening study to gain insight into the mechanism of high sensitivity of SDHA overexpressing tumors to shikonin. With this approach, we discovered that shikonin strongly binds to and inhibits LRPPRC (leucine-rich pentatricopeptide repeat-containing) protein. LRPPRC is a multifunctional protein that plays an important role in cellular energy metabolism by inducing the synthesis of ETC complexes and promoting OXPHOS and ATP generation [21,22]. Further, we performed analysis of SDHA and LRPPRC gene and protein expression patterns in precursor lesions and advanced HGSOC samples and demonstrated that the tumor-specific upregulation of SDHA is consistently accompanied by increased expression of LRPPRC, particularly in advanced ovarian cancer. These novel findings highlight for the first time a potential functional interaction between SDHA and LRPPRC in development and progression of ovarian cancer disease. Lastly, we demonstrated that shikonin treatment in vitro leads to a loss of OXPHOS activity, bioenergetic disfunction, and death of SDHA and LRPPRC overexpressing ovarian cancer cell lines. In vivo, shikonin showed the most potent antitumor efficacy in SDHA-high, LRPPRC-high PDX models, and limited efficacy in PDX models with low SDHA and LRPPRC expression.
Altogether, our study demonstrated that tumors overexpressing SDHA and LRPPRC are uniquely vulnerable to agents targeting key regulators of OXPHOS pathway, particularly LRPPRC protein. Importantly, our findings revealed that the concomitant overexpression of SDHA and LRPPRC could be considered as novel biomarkers indicating tumors dependent on high-OXPHOS metabolism to guide personalized cancer therapy.
2. Materials and Methods
2.1. Source of Ovarian Cancer Cell Lines and PDX Tumor Models
All human ovarian cancer cell lines used in this work are commercial, including OVCAR3 (#HTB-161, ATCC), OVCAR4 (#OVCAR-4, NCI-DTP), OVCAR8 (#OVCAR-8, NCI-DTP), and OVSAHO (#JCRB1046, JCRB). Normal human fallopian tube cell lines (FT190 and FT194) were developed by Dr. Drapkin from human fallopian epithelial cells and gifted to us [23]. Mouse ovarian cancer cell lines such as BPPNM, PPNM, SPCA, BPCA, and KPCA were derived from murine fallopian tube epithelium (mFTE) by Dr. Weinberg group and gifted to us [24]. Human normal fallopian tube tissues and established PDX tumor models were obtained from the PDX-PCT core facility at OMRF [25]. Human ovarian cancer cell lines were maintained in RPMI 1640 GibcoTM medium (#11875-093), Thermo Fisher Scientific, Waltham, MA, USA) supplemented with 10% fetal bovine serum (FBS) (#F0926, Sigma-Aldrich, St. Louis, MO, USA). FT190 and FT194 cell lines were maintained in DMEM/Hams F-12 50/50, medium (#10-090-CV, Corning, Glendale, AR, USA) supplemented with 2% USG (Ultroser G Serum Substitute) serum (#67042, Crescent Chemicals, Islandia, NY, USA). The mFTE cell lines were maintained in DMEM, high glucose, HEPES GibcoTM medium (#12430054, Thermo Fisher Scientific) supplemented with 10 mg/ml EGF, GibcoTM (#AF-100-15-1MG, Thermo Fisher Scientific), Insulin-Transferrin-Selenium (ITS-G), GibcoTM (#41400045, Thermo Fisher Scientific), and 5% FBS. All cell lines were maintained in a standard humidified incubator at 37 °C in 5% CO2 and 95% O2 atmosphere. To ensure quality of data and to avoid issues associated with cell line misidentification, contamination or genetic drift, the cell lines were purchased from validated reliable source and cryopreserved in the laboratory cell line bank at low passage (passage 1–3). In addition, cell lines were tested for Mycoplasma by Idexx BioAnalytics and were found negative for any contamination. OVCAR3, 4, and 8 cell lines were authenticated by short tandem repeat (STR) profiling by ATCC.
2.2. Soft Agar Colony Formation Assay
Soft agar colony formation assay was performed as previously published[17]. Briefly, cells were cultured in 6-well plates (4 × 10⁴ cells per well) in a mixture of 0.6% DifcoTM Noble Agar (#214220, BD Biosciences, Franklin Lakes, NJ, USA) and their respective media, which was added on top of a layer of 1% noble agar in culture medium. Cells were cultured for 10 days and then stained overnight with 200 µL of nitroblue tetrazolium chloride (#VWR0329, VWR Chemicals, Radnor, PA, USA). The visible colonies were photographed using a Leica 205 FCA microscope. Colony number and was estimated using Image J, version 1.52a.
2.3. Generation of Lentiviruses and Cell Transduction
To generate ovarian cancer cell lines conditionally overexpressing SDHA, we used cell lines with low SDHA expression and conditionally overexpress the SDHA coding sequence by transducing the cells with pLentiTRE/rtTA-SDHA lentivirus as described previously [17]. The SDHA expression was induced by the addition of 100 ng/mL of doxycycline (dox) for 24 h. To knock down the SDHA gene, we used validated shRNA clones from Sigma-Aldrich including TRCN0000028085 clone for human cell lines and TRCN0000346208 clone for mouse cell lines. To knock down the LRPPRC gene, we used TRCN0000295840 clone for human cell lines and TRCN0000216868 clone for mouse cell lines. The respective shRNAs were cloned into pLKO.1-puro lentiviral vector (Sigma-Aldrich, St. Louis, MO, USA). Recombinant lentiviruses were produced in HEK293T cells according to standard protocols [26]. Ovarian cancer cell lines were then infected with lentiviruses containing the shRNA against SDHA or LRPPRC, or control shRNA with a scrambled sequence, followed by selection with puromycin, as described previously [26].
2.4.3. T5 Cell Proliferation Assay
The 3T5 cell proliferation assay was performed by plating 5 × 10⁵ cells per 10 cm tissue culture plate (each cell line was set up in triplicate), followed by counting and re-plating at the same density every 3 days for 13 days. Population doubling time was calculated using the formula ln(post-3-day cell count/5 × 105)/ln(2). The given population doubling time was added to the cumulative doubling time of the previous count.
2.5. WES (ProteinSimple)
Cells or tumors were homogenized and lysed in Buffer B (25 mM Tris-HCl, pH 7.5, 0.42 M NaCl, 1.5 mM MgCl2, 0.5 mM EDTA, 1 mM DTT, 25% sucrose, 1 mM Na3VO4, and 1× protease inhibitor cocktail, #786-331, G-Biosciences, St. Louis, MO) on ice for 15 min, followed by centrifugal clearing at 4 °C for 10 min at 10,000 rpm to recover whole cell lysates. For analysis of proteins using a capillary electrophoresis-based protein analysis system (WES; ProteinSimple, San Jose, CA, USA), cellular proteins (0.5 mg/mL) were separated and visualized using the standard instrument protocol. Primary antibodies used were: GAPDH (1:300, #sc-25778) from Santa Cruz Biotechnology (Santa Cruz, CA, USA); α-Tubulin (1:25, #2144), SDHA (1:50, #11998); cleaved PARP (1:50, #9541), COX1/MT-CO1 (1:50, #55159) from Cell Signaling Technology (Danvers, MA, USA); LRPPRC (1:50, # ab259927) from Abcam Inc. (Waltham, MA, USA). Anti-rabbit secondary antibodies were included in the Wes-Rabbit (12-230 kDa) Master Kit (#PS-MK14, ProteinSimple, San Jose, CA, USA).
2.6. Quantification of Protein Abundance Using High Resolution Accurate Mass Spectrometry (HRA-MS)
We used quantitative HRA-MS method to measure and compare protein abundance in several key metabolic pathways between normal human fallopian tube samples and ovarian PDX with and without SDHA overexpression. Tissues were minced and lysed in Buffer B as described for WES (ProteinSimple) and 100 μg of protein was used for analysis. Bovine serum albumin (BSA) was added as a non-endogenous internal standard. The samples were mixed, heated at 70°C, and precipitated with 80% acetone at −20°C overnight. The protein precipitate was reconstituted in Laemmli sample buffer at 1 ug/uL and separated using SDS-PAGE. The gel was fixed and stained with GelCode Blue, and the 1.5-cm lane was cut out of the gel. Gel pieces were washed, reduced with DTT, alkylated with iodoacetamide, and digested with trypsin at RT overnight. Digested peptides were extracted with 50% methanol and 10% formic acid. The extracts were evaporated and dissolved in 1% acetic acid for analysis. Protein abundance was determined using the HRA-MS method, scanning m/z 300–1100 with a resolution of 280,000, with an orbitrap mass spectrometer (Thermo Scientific, QEx Plus) configured with a High-Performance Liquid Chromatography (HPLC) system (Thermo Scientific Ultimate 3000). The HPLC conditions were a linear gradient elution from 2% B to 45% B in 60 min. Absolute protein concentrations were determined using multiple validated peptide markers to determine abundance of each protein. Protein abundance was determined by normalization to BSA used as a non-endogenous internal standard. Housekeeping proteins were also used for normalization. Further, the data were processed using Skyline version 3.7.0.10940 [27]. The program finds and integrates the proper chromatographic peaks. Proper retention times are predicted based on retention time calibration using BSA and trypsin peptides. This process is edited by manually inspecting the data as needed. Assays are set to find and integrate 2 peptides per protein. All peptides used have been validated in prior experiments. Calculations determine the total protein response from the geomean of the two monitored peptides. Results are normalized to the BSA internal standard and expressed as pmol/100µg total protein.
2.7. Metabolic Flux of Stable Isotope Labelled [U13C]-Glucose and [U13C]-Glutamine
Stable-isotope tracing studies were performed in the Metabolic Phenotypic Core facility at OMRF. Metabolic flux analysis of [U13C]-glucose and [U13C]-glutamine in SDHA overexpressing ovarian cancer cells (OVCAR4-SDHA) vs. controls (OVCAR4) was performed to evaluate the abundance and flux of glycolytic and TCA cycle intermediates. Quantification of isotopic enrichment was performed using Liquid Chromatography-Quadropole/Time-of-Flight (LC-Q/TOF) mass spectrometry from Agilent Technologies 6546, Santa Clara, CA, USA. Time course labelling was first conducted in OVCAR4 control cells to estimate dynamic and steady-state labelling timepoints. The abundance and flux of [U13C]-glucose-derived and [U13C]-glutamine-derived metabolic intermediates were assessed by tracking and quantification of isotopomers metabolized within respective metabolic pathways. Metabolite abundance and isotopic enrichments were calculated using Agilent Profinder software.
2.8. Extraction of Shikonin-Bound Cellular Proteins
Shikonin was conjugated with epoxy-activated Sepharose 6B (ES6B), #95016-858, from Cytvia, Marlborough, MA, USA), which is a pre-activated medium for immobilization of various ligands. ES6B incubated with vehicle only was used as negative control. Briefly, ES6B was washed in distilled water followed by washing in coupling buffer (1M NaCl, adjusted to pH 12 with 1M NaOH). ES6B medium was generated by resuspension of ES6B (1g per 3.5 ml of coupling buffer). Shikonin (200 µmol per ml) or vehicle control was dissolved in coupling buffer, added to ES6B medium (1:1 ratio), and gentle mixed (16 h at 30°C) in a stopper vessel. Next day, an excess of ligand (shikonin) or vehicle was washed away using coupling buffer and any remaining active groups within ES6B were blocked with 1M ethanolamine pH 8 by overnight incubation at room temperature (RT). Next, ES6B-shikonin and ES6B-vehicle conjugates were washed with 3 cycles of alternating pH using sintered glass filter system. Each cycle consisted of a wash with acidic wash buffer (0.1M acetate buffer containing 0.5M NaCl, pH 4) followed by a wash with alkaline wash buffer (0.1M Tris-HCl buffer containing 0.5M NaCl, pH 8). Finally, ES6B-shikonin and ES6B-vehicle were resuspended in binding buffer (0.05 M Tris-HCl, and 0.15 M NaCl, pH 7.5), and stored for the next step to be incubated with cell lysates. Respective cell line lysates were prepared in RIPA buffer (0.05M Tris-HCl, 1% NP-40, 0.25% sodium deoxycholate, 0.15M NaCl, 1 mM EDTA, 1mM Na3VO4, and 1x protease inhibitor cocktail, pH 7.4). Lysates containing 1 mg of protein were mixed with 100µl ES6B-shikonin or 100 µl ES6B-vehicle to a total volume of 400 µl. The mixture was incubated with gentle stirring for 16 h at 4°C and spun down for 2 min, 5,000 rpm at 4°C. The supernatant was discarded, and the precipitate was washed 3 times with 500 µl of chilled RIPA Buffer. Next, shikonin-bound or vehicle-bound proteins were eluted using denaturizing 2x SDS Buffer by adding 100 µL of 2x SDS Buffer to the pelleted precipitate, boiled for 10 min, and spun down (10 min at 10,000 rpm at 4°C). Supernatants containing shikonin-bound proteins or proteins present in vehicle control samples were provided to the Multiplexing Protein Analysis Core Facility of the Oklahoma Nathan Shock Center to perform mass-spectrometry-based drug discovery study.
2.9. Mass-Spectrometry-Based Drug Discovery Study to Identify Shikonin’s Molecular Targets
Identification of shikonin’s molecular targets was performed in the Protein Analysis Laboratory at OMRF. Precipitates containing shikonin-bound proteins or proteins present in vehicle control samples were mixed with SDS–PAGE sample buffer and boiled for 10 min. The samples were loaded and separated 1.5cm on a 10% SDS–polyacrylamide gel. The gel was stained with GelCode blue. The whole lane was digested in gel and analyzed by data dependent analysis using the QEx Plus tandem mass spectrometry system described above. Proteins were identified by searching the human RefSeq database using Mascot.
2.10. Modified Pull Down Assay Coupled with WES(ProteinSimple) to Validate Shikonin Binding to LRPPRC
To determine if shikonin can directly bind to LRPPRC protein shikonin-conjugated epoxy-activated Sepharose-6B (ES6B) or control ES6B-DMSO were incubated with human recombinant c-Myc/DDK-tagged LRPPRC protein (#TP316747, ORiGene, Rockville, MD, USA). Specifically, 1 ng of recombinant LRPPRC was mixed with 50 µl of ES6B-shikonin or ES6B-DMSO (prepared as described above) and filled up to 400 µl with Binding Buffer. The mixtures were incubated for 16h at 4oC with constant and gentle stirring. After incubation, precipitates were spun for 2 min, 14,000 rpm at 4°C and supernatants were gently removed and discarded. Precipitate pellets were washed 4 times with 800 µl of chilled RIPA Buffer by spinning the tubes for 2 min, 14,000 rpm and discarding supernatant. Next, 80 µL of 2x SDS Buffer was added to precipitate pellets and samples were boiled for 10 min. Samples were centrifugated (10 min at 10,000 rpm at 4°C) and supernatants collected. Lastly, supernatants were processed by WES(ProteinSimple) to visualize eluted shikonin bound proteins (recombinant LRPPRC) according to a standard instrument protocol. Primary antibodies used were: LRPPRC (1:50, #ab259927) from Abcam Inc., and DDK rabbit monoclonal antibody (1:50, #TA592569S) from ORiGene. Secondary antibodies were included in a Wes Master Kit (PS-MK14, ProteinSimple).
2.11. Animal Experiments
All animal procedures were approved by the OMRF’s Institutional Animal Care and Use Committee. To determine the effect of SDHA upregulation on orthotopic tumor growth in immunocompetent mice, 6-week-old female C57BL/6J mice (#000664, Jackson Laboratory, Bar Harbor, ME, USA) were implanted with BPPNM, BPPNM-SDHA-KD, or SPCA tumor cells. Specifically, 5 × 10⁵ of respective tumor cells were suspended in 50% matrigel/50% Hanks’ Balanced Salt Solution (HBBS) and injected into ovarian bursa. Matrigel CorningTM (#CLS354234) was obtained from MilliporeSigma, Burlington, MA; HBBS (#14175095) was purchased from, Thermo Fisher Scientific, Waltham, MA, USA). Mice were monitored for tumor growth, metastases and ascites development by palpation and body weight measurement. When mice reach advanced tumor burden and become moribund, animals were euthanized and tumor volume, metastatic potential, and overall survival was evaluated. Mouse survival curves were estimated with the Kaplan-Meier method and compared between groups with the two-sided log-rank test. In different experiment, to evaluate therapeutic response to shikonin in vivo, C57BL/6J female mice were implanted with SDHA overexpressing BPPNM model as described above. When tumors become palpable (~100 mm3 volume), animals were randomized and treated with vehicle control, shikonin (10 mg/kg, 3x/week), or carboplatin (50 mg/kg, 1x/week) + paclitaxel (10 mg/kg 1x/week). Mice were monitored for tumor growth, response to treatment, and overall survival, which was evaluated and compared between the groups using Kaplan-Meier method. To determine shikonin’s efficacy in vivo using human ovarian PDX models, 6-week-old female NRG mice (#007799, Jackson Laboratory) were used. PDXs were implanted subcutaneously (SQ) into the dorsal flank using our routine procedures [25]. Mice with established tumors of 100 mm3 volume were randomized and started 4-week treatment regimen with vehicle control, shikonin (10 mg/kg, 3x/week), or cisplatin (5 mg/kg, 1x/week) + paclitaxel (10 mg/kg 1x/week). The treatment continued for 4 weeks followed by an 8-week follow up period to assess tumor growth and response to treatment or eventual disease relapse. Tumor dimensions were measured with vernier calipers and tumor volumes were calculated using the formula ½ (Length × Width2). At the endpoint, animals were humanely euthanized by CO2 inhalation as described in our IACUC-approved animal use protocol.
2.12. Dose Response Assays
Exponentially growing cells were treated in vitro with indicated drugs followed by an MTT assay to measure cell viability using the Quick Cell Proliferation Assay kit II (#K302-500, BioVision, Milpitas, CA). Briefly, cells were seeded in a 96-well plate at a density of 5,000 cells per well. After 24 h culture, the cells were exposed to desired concentration of drug(s) or vehicle control for 4 days. Next, cells were incubated with the WST reagent for 2 h, and absorbance was determined at 450 nm. Absorbance measurements were normalized to the drug vehicle control wells.
2.13. Drugs and Reagents
Shikonin (#S8279) was purchased from Selleck Chemicals, Houston, TX, USA. For in vivo studies, desired concentration of shikonin was prepared by adding solvents to the shikonin powder individually as follow: 2% DMSO, 40% PEG300, 5% Tween80, and ddH2O. Shikonin solution was mixed until clear, protected from light, and administered within 30 min after preparation. Cisplatin (#NDC67457-0424, Alvogen, Morristown, NJ, USA), carboplatin (#NDC16729-0295, Intas Pharmaceuticals Limited, Ahmedabad, India), and paclitaxel (Actavis Generics, Parsippany-Troy Hills, NJ, USA) were purchased from University of Oklahoma Pharmacy and diluted to desired concentrations in saline solution or PBS, respectively.
2.14. In Silico Analysis of SDHA and LRPPRC Gene Expression in Human HGSOC Samples
An analysis of SDHA and LRPPRC gene expression patterns in human tissue samples representing consecutive stages of HGSOC development was performed with the use of GeoMx spatial transcriptomics data. The GeoMx dataset is publicly available via cBioPortal (www.cbioportal.org; last accessed on April 3rd, 2025) in the “Ovarian Cancer (Gray Foundation, Cancer Discov 2024)” category. All sample processing and sequencing were performed by the Dana Farber Sequencing facility. The quality control and the Quartile-3 normalization of the initial data set were performed as suggested by NanoString using GeoMx DSP software, NanoString (version 3.1.0.221). Detailed information about patients’ cohorts, sample collections, tissue processing, and spatial transcriptomic profiling using the Nanostring GeoMx platform are found elsewhere [28].
2.15. Measurement of OCR and ATP Production Rate by Seahorse
The Seahorse XFe24 Extracellular Flux Analyzer (Agilent Technologies, Santa Clara, CA, USA) was used to assess bioenergetic profiles of ovarian cancer cell lines. The Seahorse XF Cell Mito Stress assay (#103015-100) was used to quantify mitochondrial respiration (oxygen consumption rate, OCR) and ATP production rate. To run the assay, cells were evenly seeded (60,000 cells/well; following optimization of cell seeding number) into the XF24 cell culture plate (#102340-100, Seahorse XFe24 FluxPaks, Agilent Technologies) and incubated for 24 h at 37 °C and 5% CO2. After 24 h of incubation, cell culture medium was replaced with Seahorse XF Base Medium (#103335-100, Agilent Technologies) supplemented with 2 mM L-Glutamine (#G7513-100ML, Sigma-Aldrich, St. Louis, MO, USA), 1 mM Sodium Pyruvate (#13-115E, Lonza Bioscience, Basel, Switzerland), 10 mM Glucose (#G8270-100G, Sigma-Aldrich) with pH adjusted to 7.4. Then, the cells were placed in a non-CO2 incubator for 1 h at 37 °C required for cells to reach an optimal pH and temperature conditions prior to the start of the experiment. Following 1 h incubation, the XF24 cell culture plate was loaded into the Seahorse instrument, which measured OCR/ECAR at intervals of approximately 5–8 min. Depending on the seahorse assay, various pharmacological compounds interrupting mitochondrial respiration were injected via ports to determine their effects on mitochondria function. The plate included also control blank wells containing only media to which various reagents were added similar to experimental wells. The blanks were automatically subtracted from experimental wells by instrument software. Three measurements of OCR/ECAR were obtained following injection of each compound modulating cellular respiration. Compounds used in Seahorse assays included 1 mM Oligomycin A (ATP synthase inhibitor, #495455-10MG), 1 mM of FCCP (protonophoric uncoupler, #C2920-10MG), 0.5 mM of Antimycin A (complex III inhibitor, #A8674-25MG), and 0.5 mM of Rotenone (complex I inhibitor, #R8875-25G) from MilliporeSigma, Burlington, MA, USA. To determine the effect of shikonin on OCR, and ATP production, the cells were treated with indicated concentrations of shikonin for 1 h prior starting Cell Mito Stress assay. Compound concentrations were optimized prior to experiments. The measurements were normalized with cell number and total protein levels (Bradford protein assay).
2.16. Statistical Analysis
In vitro experiments were performed three times and in triplicate when applicable. Values are presented as mean ± SD, or as mean ± SEM. Statistical analysis of in vitro assays or in vivo data was done using unpaired t-test, multiple t-test, or analysis of variance (ANOVA) followed by Tukey’s multiple comparisons test whenever applicable. P < 0.05 was considered significant. For mouse survival, Kaplan-Meier survival curves were made with P value generated from log-rank test. Statistical analysis was performed using GraphPad Prism 10.4.0 (621) Software (San Diego, CA, USA).
3. Results
3.1. SDHA Overexpression Promotes Proliferation and Survival of Ovarian Tumor Cells in Suspension Cultures
Thus far, we have studied the effects of SDHA overexpression solely with the use of human ovarian cancer models [17]. Such tumor models require immunocompromised mice strains to be grown in vivo lacking the functional immune system, which is an essential component of the tumor microenvironment (TME). Here, to expand our studies exploring the impact of SDHA overexpression on tumor biology, we obtained innovative ovarian cancer cell lines derived from murine fallopian tube epithelium (mFTE) from Dr. Weinberg [24]. These mFTE cell lines harbor patient-relevant mutant genotypes and form tumors in immunocompetent C57BL/6J mice to fully represent the immunocompetent TME in vivo (Supplementary Figure S1A–C). First, we quantified SDHA levels in mFTE cell lines and normal mouse fallopian tube (mFT) cells as controls using WES (capillary electrophoresis-based protein analysis system from ProteinSimple). We identified BPPNM cell line with a significant upregulation (5.7 fold increase) of SDHA expression when compared with mFT cells. Other mFTE cell lines showed low SDHA expression similar to that observed in normal fallopian tubes or BPPNM cell with SDHA knockdown (BPPNM-SDHA-KD), Figure 1A,B and Supplementary Figure S1D.
We also expanded our panel of genetically engineered human ovarian cancer cell lines with conditional (dox inducible) SDHA overexpression (SDHA-OE) or stable SDHA knockdown (KD) as well as established human fallopian tube cell lines (FT190 and FT194) as controls (Figure 1C,D and Supplementary Figure S1E). The SDHA expression was very low in normal human fallopian tubes (FT190 and FT194), but became significantly increased (2.8-8.0 fold increase) in ovarian cancer cell lines that naturally overexpress SDHA (OVCAR4, OVCAR8 and OVSAHO), Figure 1C,D. The conditional SDHA overexpression increased SDHA levels 6.2 fold in OVCAR3-SDHA-OE and 12.8 fold in OVCAR4-SDHA-OE when compared with human fallopian tubes, while SDHA-KD reduced SDHA expression 2.0 or 5.8 fold in OVCAR8 and OVCAR4 cells, respectively (Figure 1C,D). The SDHA expression in OVSAHO-SDHA-KD is similar to that observed in fallopian tubes.
Next, using models of ovarian cancer (mFTE cell lines), we determined the effect of SDHA overexpression on anchorage-independent growth and cell survival. We observed that the BPPNM cells endogenously overexpressing SDHA showed significantly higher number of tumor cell colonies than SPCA cell line with naturally very low SDHA expression or isogenic BPPNM cell line with SDHA knockdown (Figure 1E,F). However, when we measured the cumulative population doubling of cells in adherent cell cultures in vitro, we did not observe any changes in cell proliferation, the cells proliferated at similar rate regardless of SDHA overexpression status (Figure 1G). We made similar observations in various human ovarian cancer cell lines with and without SDHA overexpression or knockdown, where the SDHA upregulation promotes cell proliferation and survival in suspension cultures but not in the adherent cell cultures (Supplementary Figure S2).
Collectively, our findings show that the SDHA overexpression promotes cell survival and proliferation in suspension conditions in both human and mouse ovarian cancer models, which is a key feature of patients’ ovarian tumors that are able to survive, proliferate, and metastasize in suspension in peritoneal fluid.
3.2. SDHA Upregulation Promotes Orthotopic Tumor Growth in Immunocompetent Mouse Models of Ovarian Cancer
We evaluated the effect of SDHA overexpression on ovarian tumor growth, metastasis, and mouse survival in vivo using immunocompetent mouse models of ovarian cancer. We selected SDHA overexpressing BPPNM model and SDHA-low models (SPCA and BPPNM-SDHA-KD, Figure 1A). First, we carried out a pilot in vivo experiment using immunocompetent C57BL/6J female mice, where tumor cells were implanted into mouse ovary to recapitulate early stages of ovarian cancer development or into peritoneum to model advanced tumor progression. Intraovarian route of cancer cell implantation resulted in the development of large tumors that disseminated throughout the abdominal cavity invading omentum, intestines, and diaphragm. Intraperitoneal cancer cell inoculation led to a generation of large number of smaller tumors invading omentum, diaphragm, intestines, liver, and stomach, as well as robust ascites. Both routes of tumor implantation recapitulated typical HGSOC histopathology (Supplementary Figure S3A–E). We observed similar results regardless of route of tumor implantation (intraovarian or intraperitoneal) where BPPNM tumors developed significantly faster, generating larger tumor masses and robust ascites when compared with SPCA tumors, which substantially reduced mouse survival (Supplementary Figure S3A–E).
Next, we performed a larger in vivo study using pair of isogenic cell lines with and without SDHA knockdown (BPPNM and BPPNM-SDHA-KD) and unrelated SPCA cell line with naturally low SDHA levels. We implanted respective cancers cells into C57BL/6J female mouse ovary and monitored the animals for tumor development. Similarly, as in pilot study, the SDHA overexpressing tumors (BPPNM) showed increased tumorigenic potential reflected as rapid tumor development and spreading when compared with SDHA-low tumors (SPCA) or BPPNM-SDHA-KD, which significantly reduced mouse survival (Figure 1H). Macroscopic evaluation of tumor burden at the time of necropsy showed that tumor masses, metastatic lesions and/or ascites were similar in BPPNM and BPPNM-SDHA-KD tumor bearing mice. In contrast, mice inoculated with SPCA cancer cells developed smaller tumors and less ascites and metastatic lesions (Supplementary Figure S3F–H).
3.3. The Majority of Differentially Expressed Proteins Between Normal Human Fallopian Tubes and Ovarian PDXs, Particularly PDXs with SDHA Overexpression Are Components of the TCA Cycle
We interrogated metabolic changes that occur as ovarian cancer develops from fallopian tube to invasive HGSOC and defined differences in metabolic protein content between SDHA overexpressing tumors and those with normal SDHA levels. We used our established HGSOC PDX models [25] and normal human fallopian tubes (hFTs) and performed absolute quantification of metabolic proteins by High Resolution Accurate Mass Spectrometry (HRA-MS) [29]. We used validated assays to measure protein content of major metabolic pathways including β-oxidation of fatty acids, gluconeogenesis, glutamine metabolism, glycolysis, mitochondria function and ETC, oxidative stress response, and the TCA cycle. We measured a total of 85 proteins (represented by unique gene symbols), Supplementary Figure S4A. First, we defined changes in protein content between ovarian PDXs and hFTs and identified 16 differentially expressed proteins, the majority of which were involved in oxidative stress response pathway and the TCA cycle (Figure 2A,B and Supplementary Figure S4B,C).
Among metabolic pathways, the TCA cycle protein content was the most significantly altered between hFTs and ovarian PDXs. Specifically, we identified significantly increased protein expression of citrate synthase (CS), succinate dehydrogenase (SDHA), and isocitrate dehydrogenases (IDH3A and IDH3B) in ovarian PDXs vs. hFTs. These are key enzymes in the TCA cycle, which governs cellular energy production and generates metabolic intermediates for biosynthetic pathways [30]. Furthermore, in PDX tumors, we also observed the upregulation of several proteins within oxidative response pathway (UBB, PHB2 and HSPA9) and mitochondria function pathway (NNT, VSAC2) that play an essential role in cellular antioxidant defense or function as chaperone proteins to stabilize mitochondrial respiratory enzymes and maintain mitochondrial integrity [31]. Lastly, we detected a significant overexpression of mitochondrial enzymes such as acetyl-CoA acyltransferase 2 (ACAA2) and glutamate dehydrogenase 1 (GLUD1) in PDXs vs. hFTs. ACAA2 catalyzes the final step of mitochondrial β-oxidation of fatty acids, which is a catabolic pathway where fatty acids are metabolized to produce energy [32]. GLUD1 is a key enzyme in glutaminolysis pathway converting glutamate to αketoglutarate (αKG), which is an important intermediate in the TCA cycle [33]. Among proteins showing increased abundance in normal hFTs than ovarian PDXs, we detected catalase (CAT), peroxiredoxin 2 (PRDX2), hexokinase 2 (HK2), solute carrier family 25 member 20 (SLC25A20), and succinate-CoA ligase GDP/ADP-forming subunit alpha (SUCLG1). CAT and PRDX2 are antioxidant enzymes commonly found in normal fallopian tubes, which are essential for normal reproductive physiology [34]. HK2 is known to be upregulated in various cancers promoting tumor progression, however high activity of hexokinases has been also detected in endosalpinx (mucous membrane lining the fallopian tubes), where glucose is a major metabolic fuel [35]. SCL25A20 is a carrier protein transporting acylcarnitines into mitochondrial matrix for β-oxidation of fatty acids. SLC25A20 is frequently downregulated in cancer, which leads to a suppression of β-oxidation of fatty acids promoting tumor growth and metastasis [36,37]. We also observed downregulation of SUCLG1 in ovarian PDXs catalyzing the conversion of succinyl-CoA to succinate in the TCA cycle. It has been shown in certain cancers that SUCLG1 becomes downregulated in tumor tissue, even though the remaining TCA cycle components are upregulated, which indicates additional unexplored functions of SUCLG1 [38,39].
In the next step, we identified SDHA overexpressing PDX models, which showed SDHA protein expression greater than the 75th percentile value of SDHA levels in remaining PDXs. Our HRA-MS results demonstrated that the SDHA overexpressing PDXs are characterized by significantly increased expression of proteins primarily in the TCA cycle and mitochondrial ETC (Figure 2C–E and Supplementary Figure S4D,E). The SDHA-high PDXs showed significantly elevated levels of SDHA as expected, ketoglutarate dehydrogenase (KGDH) components (DLST and OGDH) and mitochondrial ATP synthase subunits (ATP5F1A and ATP5F1B) (Figure 2C–E). The KGDH complex is the primary site of control of metabolic flux through the TCA cycle [40,41]. The KGDH collaborates with glutaminolysis at the intersectional point to govern KG levels for energy production, and resources for macromolecule synthesis in cancer cells [42]. Additionally, the SDHA-high PDXs showed significantly upregulated NNT and HSPA9 proteins when compared with SDHA-low PDXs (Figure 2C–E), which are also among differentially expressed proteins between a whole panel of PDXs and normal hFTs (Figure 2A,B). Lastly, SDHA-high PDXs show significantly increased levels of Acyl-CoA Dehydrogenase Long Chain (ACADL), an enzyme that catalyzes the initial step of b-oxidation of fatty acids, which plays an essential role in mitochondrial energy production (Figure 2C–E).
Altogether, our proteomics data highlight the significance of the TCA cycle metabolic pathway coupled with ETC in supporting metabolic requirements of SDHA overexpressing ovarian tumors.
3.4. SDHA Overexpressing Ovarian Cancer Cells Rely on Glutaminolysis to Maintain an Increased TCA Cycle Flux and OXPHOS Activity
Our HRA-MS data revealed that SDHA overexpressing ovarian tumors are characterized by significantly increased protein content in the TCA cycle and the ETC including components of the αKGDH complex that couples glutaminolysis with the TCA cycle. Glutaminolysis contributes to the production of αKG from glutamine, which can be utilized by TCA cycle to support mitochondrial OXPHOS and ATP generation [42]. Here, to gain a better insight into the metabolic flux of key nutrients glucose (Glu) and glutamine (Gln) in SDHA overexpressing ovarian cancer cells, and to determine if Gln is a key metabolite in replenishing the TCA cycle intermediates, we performed stable-isotope tracing. We used stable isotopes such as [U13C]glucose and [U13C]glutamine to determine Glu or Gln carbon contribution to metabolic intermediates within glycolysis and the TCA cycle pathway by quantification of isotopic enrichment using Liquid Chromatography-Quadropole/Time-of-Flight (LC-Q/TOF) mass spectrometry. The analysis of glycolysis flux in OVCAR4-SDHA vs. OVCAR4 control cells, revealed that glycolytic intermediates were rapidly labelled with [U13C]glucose. At 30 min of labeling m+3 enrichment of glycolytic intermediates reached saturation and the m+3 isotopomer enrichment was very similar in both cell lines (Supplementary Figure S5A,B). These data indicate that the SDHA overexpression does not affect glycolytic flux, which leads to a similar carbon contribution of Glu to glycolytic metabolite pool in ovarian cancer cells with or without SDHA upregulation. Next, we quantified relative metabolite abundance within glycolytic pathway and observed an increased abundance of glycolytic intermediates downstream from glucose-6 phosphate (G6P) such as F6P, F1,6BP, DHAP, PEP, and 3-PGA in OVCAR4-SDHA cells when compared with controls (Supplementary Figure S5C–E). Since both cell lines showed similar glycolytic flux, the increased pool of glycolytic intermediates in OVCAR4-SDHA cells could be associated with decreased flux of G6P into other pathways such as the pentose phosphate pathway (PPP).
As a next step, we analyzed the flux of TCA cycle intermediates with a single tracer [U13C]glucose or two tracers [U13C]glucose and [U13C]glutamine (parallel labeling experiment, Figure 3 and Supplementary Figure S5F,G). Analysis of the TCA cycle metabolite pool revealed similar enrichment of m+2 labelled TCA cycle intermediates with a single tracer [U13C]glucose in OVCAR4-SDHA and OVCAR4 cells. The m+2 labelling of citrate, isocitrate, and aconitate was higher than the m+2 labelling of succinate, fumarate, malate, and aspartate (Figure 3B). These data indicate that glucose carbon contribution to the TCA cycle is largely associated with generation of citrate, isocitrate, and aconitate, which are key metabolites linking glycolysis and lipid metabolism and promoting de novo lipid biosynthesis. Further, we observed a minimal labelling (0-2%) of m+4 TCA cycle intermediates with a single tracer [U13C]glucose (Figure 3C) when compared with the m+4 labelling (12-36%) with both tracers [U13C]glucose and [U13C]glutamine (Figure 3E). In addition, we noted a significantly increased enrichment of m+4-labelled fumarate, malate, aspartate, citrate, and isocitrate as well as m+5-labelled ⍺KG and glutamate in OVCAR4-SDHA cells vs. parental OVCAR4 cells (Figure 3E,F). Together, these data indicate that the majority of m+4 and m+5 labelled TCA cycle intermediates with both tracers ([U13C]glucose and [U13C]glutamine) were produced by [U13C]glutamine, and that the glutamine showed a significantly increased flux into the TCA cycle in tumor cells with SDHA overexpression. We also noted a higher abundance of citrate, isocitrate, and aconitate in SDHA overexpressing cells vs. controls in experiments with both tracers (Supplementary Figure S5F,G). Since SDHA overexpressing cells show increased glutamine-derived m+4 and m+5 carbon flux (Figure 3E,F) and similar glucose-derived m+2 carbon flux into the TCA cycle when compared with control cells (Figure 3B), this indicate that the increased pool of citrate, isocitrate, and aconitate metabolites in SDHA-high cells could be associated with decreased flux of those intermediates into the de novo lipid biosynthesis pathway. Instead, our data suggest that the SDHA overexpressing tumor cells preferentially rely on glutamine-derived αKG oxidative metabolism producing metabolic intermediates supporting mitochondrial OXPHOS (Supplementary Figure S5H). These data are in agreement with Seahorse results, where SDHA overexpression significantly increases mitochondrial respiration and ATP production in OVCAR4-SDHA cells when compared with control OVCAR4 cells (Supplementary Figure S5I,J).
3.5. Identification of LRPPRC Protein as a Top Molecular Target of Shikonin
Our previous in vitro drug screening study [17] revealed that the most potent and selective in targeting SDHA overexpressing cancer cells is a natural compound shikonin. However, shikonin has broad anti-cancer mechanisms of action and its molecular targets are not fully understood [19,20,43]. Here, we performed a mass spectrometry-based drug target discovery study to identify shikonin’s unexplored targets to determine the specific mechanism by which shikonin effectively eradicates SDHA overexpressing tumor cells. We used shikonin-conjugated Sepharose-6B that was incubated with ovarian cancer cell lysates. As a result, we obtained cell extracts containing shikonin bound to various cellular proteins that underwent analysis by mass spectrometry (Supplementary Figure S6). We discovered that in SDHA overexpressing cell lines, the shikonin most strongly binds to the protein LRPPRC (leucine-rich pentatricopeptide repeat-containing), which is a top-ranking peptide hit in MASCOT score analysis (Figure 4A and Supplementary Figure S6). Further, we performed a pull-down assay coupled with WES (ProteinSimple) using shikonin-conjugated Sepharose-6B and cell extracts with and without addition of cMyc/DDK-tagged recombinant LRPPRC protein. Shikonin bound proteins were precipitated and analyzed by WES validating our novel findings that shikonin binds with high affinity to LRPPRC protein (Figure 4B and Supplementary Figure S7A). LRPPRC protein emerged as a tumor oncogene with a central role in mitochondria homeostasis and energy metabolism [21, 22]. Since shikonin effectively eliminates SDHA overexpressing tumor cells [17], while targeting LRPPRC, this suggests a potential unexplored interaction or dependence between SDHA and L[21,22RPPRC proteins.
3.6. SDHA and LPPPRC Transcript Levels Progressively Increase from Precancerous Lesions to Invasive HGSOC, and Exhibit Concomitant Gene and Protein Expression Patterns, Particularly in Advanced Invasive Tumors
We analyzed GeoMx spatial transcriptomics data (available via cBioPortal) of human tissues collected at different stages of HGSOC development including normal fallopian tube (FT), precursor lesions such as p53 signature and serous tubal intraepithelial carcinomas (STIC), and invasive ovarian carcinoma. We aimed to determine changes in SDHA and LRPPRC gene expression from precursor lesions to advanced HGSOC to provide insight into the potential role of those molecules in development and progression of ovarian cancer disease. Our findings revealed a shift towards significantly higher gene expression of both SDHA and LRPPRC when precursor lesions advanced ovarian cancer. Specifically, the SDHA and LRPPRC expression was significantly lower in normal FT when compared with ovarian cancer (Supplementary Figure S8A). Furthermore, while there was no correlation between SDHA and LRPPRC expression in early precursor lesions (FT and p53 signature), in STIC lesions and invasive cancer, however, we observed increasing positive correlation between expression of those genes, which was particularly strong in invasive cancer (STIC, r = 0.2675, P = 0.0064; invasive cancer, r = 0.5671, P < 0.0001, Supplementary Figure S8B).
Next, we measured the SDHA and LRPPRC protein expression in mouse and human ovarian cancer cell lines, HGSOC PDXs and normal hFTs using WES(ProteinSimple) and observed a concomitant SDHA and LRPPRC protein expression in all examined tissues. The expression of both LRPPRC and SDHA was very low in normal fallopian tubes when compared with cancer samples (Figure 4C–E). Next, to determine the statistical significance of a correlation between SDHA and LRPPRC protein expression in HGSOC PDXs and hFTs, we calculated Pearson correlation coefficient (r) values. The results showed a strong positive correlation (r = 0.7654, P < 0.001) between SDHA and LRPPRC protein expression (Figure 4F). Next, to determine if SDHA or LRPPRC depletion affects each other’s protein expression, we knocked down (KD) either SDHA or LRPPRC in several mouse and human ovarian cancer cell lines. The results showed that the SDHA-KD is associated with loss of protein expression of both SDHA and LRPPRC (Figure 4G,H), while LRPPRC-KD leads to loss of LRPPRC expression (as expected) but has no effect on SDHA protein expression (Figure 4H). We also analyzed changes in the expression of COX1 (a subunit of Complex 4 of ETC) following SDHA-KD and LRPPRC-KD as a control, since COX1 expression is positively regulated by LRPPRC [21,44]. As expected, COX1 expression was suppressed in LRPPRC-KD cell lines or those with naturally low LRPPRC levels (Figure 4G,H).
Collectively, these findings showed progressively increasing expression of key mitochondrial metabolism regulators SDHA and LPRPRC from precancerous lesions to invasive cancer, which could serve as biomarkers and therapeutic targets for advanced HGSOC disease.
3.7. Shikonin Inhibits LRPPRC Suppressing Mitochondrial Respiration, Which Leads to Bioenergetic Disfunction and Death of Cancer Cells Overexpressing of SDHA and LRPPRC
We investigated the effect of shikonin treatment in vitro on cellular metabolism and survival of SDHA overexpressing tumors in the presence and absence of LRPPRC expression (genetic knockdown). Our data revealed that the inhibition of LRPPRC either by shikonin or by genetic knockdown resulted in a loss of LRPPRC expression as expected (Figure 4I,J). Our data also showed that 5 μM dose of shikonin triggered apoptosis (high expression of cleaved PARP, Figure 4I,J) only in SDHA and LRPPRC overexpressing cell lines, but not those with SDHA-KD or LRPPRC-KD. This suggests that SDHA overexpressing cancer cells are particularly vulnerable to the LRPPRC inhibition, which leads to tumor cell death. Next, we examined the effect of shikonin on OXPHOS by measuring basal and maximal mitochondrial respiration (reflected as oxygen consumption rate, OCR) in isogenic and non-related cell lines with and without LRPPRC-KD. We observed that in SDHA and LRPPRC overexpressing cell line (BPPNM), both 1μM and 5μM shikonin’s concentrations most potently reduced basal and maximal mitochondrial respiration when compared to isogenic LRPPRC-KD cell line or non-related SPCA cells (Supplementary Figure S9H,I). Interestingly, in BPPNM-LRPPRC-KD or SPCA cells, the shikonin actually increased basal OCR at certain doses (Supplementary Figure S9I), which is likely due to mitochondrial hyperfusion, a compensatory mechanism maintaining mitochondrial respiration and energy production during cellular stress [44].
3.8. Shikonin Shows Potent Anti-Tumor Efficacy In Vivo in Ovarian Tumors with Concomitant Overexpression of SDHA and LRPPRC
A potent shikonin’s efficacy in vitro has been previously reported in ovarian cancer with upregulated SDHA [17], however there is a lack of respective in vivo data validating shikonin as effecting treatment in these tumors. In addition, the impact of LRPPRC overexpression on shikonin’s treatment efficacy has never been investigated. Here, we tested the efficacy of shikonin in vivo, using clinically relevant patient-derived models of ovarian cancer. We selected two SDHA overexpressing PDXs, one with low LRPPRC levels (PDX-0030), and the second with high LRPPRC levels (PDX-0113). We also included PDX with naturally low SDHA and LRPPRC levels (PDX-0038), Figure 5A–D and Supplementary Figure S9A–D [25]. Viable PDX fragments were implanted subcutaneously into the left flank of NRG female mice. When the tumor volume reached ~100 mm3, the mice started treatment. Animals were treated with vehicle control, shikonin (10 mg/kg, 3x/week), or cisplatin (5 mg/kg, 1x/week) + paclitaxel (10 mg/kg 1x/week). The treatment continued for 4 weeks followed by a 8-week follow up period to assess tumor growth and response to treatment or eventual disease relapse. During a 4-week treatment period, all treatment regimens significantly inhibited tumor growth when compared to control group, and there was no difference in anti-tumor efficacy between shikonin and conventional chemotherapy (Supplementary Figure S9B–D). To assess the long-term efficacy of each treatment modality, we monitored the residual tumors for 8 weeks following discontinuation of all treatments. At the end of follow up period, we observed that shikonin showed a superior efficacy to chemotherapy in SDHA and LRPPRC overexpressing PDX-0113 (Figure 5C), and a similar efficacy to chemotherapy in SDHA-high and LRPPRC-low PDX-0030 (Figure 5A). In contrast, in the SDHA-low, LRPPRC-low PDX-0038, shikonin showed no therapeutic effect, while chemotherapy exhibited a good efficacy (Figure 5B).
Furthermore, to determine shikonin’s antitumor efficacy in vivo in immunocompetent mouse model of ovarian cancer, we used SDHA-high, LRPPRC-high BPPNM tumor model implanted into ovaries of C57BL/6J female mice. When tumors became palpable (tumor size ~100 mm3) the mice started a 4-week treatment with vehicle control, shikonin (10 mg/kg, 3x/week), or carboplatin (50 mg/kg, 1x/week) + paclitaxel (10 mg/kg 1x/week). The animals were monitored for tumor, metastases and ascites development by palpation and caliper measurement. When mice reached advanced tumor burden, the animals were euthanized and metastatic potential and overall survival was evaluated and compared between the groups. At necropsy, all mice developed metastatic tumor and ascites. The analysis of overall survival showed that both shikonin and chemotherapy significantly increased mouse survival when compared with vehicle control (Figure 5E, Supplementary Figure 96E-G). Collectively, our in vivo data demonstrated that the shikonin treatment results in a long-term therapeutic benefit and can be an effective treatment in preselected SDHA and LRPPRC overexpressing ovarian tumors, which brings hope for the improvement of current therapies for ovarian cancer patients.
4. Discussion
Metabolic reprogramming is a distinguishing feature of cancer cells that undergo significant metabolic rewiring to adapt to increased energy demands to maintain rapid cell proliferation, promote metastasis, and survive microenvironmental stressors. However, cancer-specific metabolic adaptations also introduce distinct metabolic vulnerabilities that offer a unique opportunity for therapeutic targeting. In this study, we interrogated unique metabolism of ovarian cancer overexpressing succinate dehydrogenase subunit A (SDHA) and identified key vulnerabilities of tumors with the SDHA-gain-of-function phenotype that can be exploited for therapeutic benefit. While the role of succinate dehydrogenase (SDH) has been studied primarily in the context of its deficiency due to genetic mutations that can lead to neurodevelopmental disorders or rare tumors [45,46,47,48,49], the impact of aberrantly upregulated SDH in carcinogenesis is an emerging area of research [17,50,51].
Using human and mouse cell-line based ovarian cancer models, we demonstrated that the SDHA overexpression is associated with improved colony formation and cell survival in 3D suspension cultures, but has no effect on cell proliferation in adherent 2D cultures (grown on plastic dishes), which is in agreement with our previous data [17]. Our findings reflect previous observations that the behavior of tumor cells in adherent 2D cultures does not fully predict the behavior of the corresponding tumor cells in 3D suspension cultures or in vivo systems in regards to tumor promoting functions or response to treatment [52,53,54]. Consistently, our in vivo study showed that the SDHA overexpressing mFTE tumors exhibited significantly increased tumor growth and reduced mouse survival due to metastatic burden, when compared with isogenic tumors with SDHA knockdown or unrelated tumors with low SDHA expression. Yong et al., reported similar results in breast cancer, showing improved proliferation, colony-forming, and migration capabilities of SDHA overexpressing tumor cells vs. controls in suspension cultures in vitro [51]. Others reported that the high expression of SDHA was associated with poor prognosis in breast cancer patients, increased risk of metastasis and poor clinical outcome in uveal melanoma patients, and shorter overall (OS) survival in head and neck cancer, while the SDHA deficiency in PDX models was linked with reduced tumor growth [51,55,56]. Studies exploring the role of other SDH subunits in cancer showed that patients with higher expression of SDHB displayed a worse OS than patients with reduced SDHB expression in renal carcinoma [57]. By contrast, patients with low SDHB expression presented a significantly shorter OS than those with high SDHB expression in nasopharyngeal carcinoma [58]. In study by Li et al., the downregulation of all four SDH subunits (SDHA/B/C/D) correlated with poor prognosis of hepatocellular carcinoma patients, which was associated with accumulation of succinate acting as oncometabolite in this tumor type [59]. Altogether, these findings indicate that tumor-specific nature of SDH-subunit expression and prognostic capacity may depend on tumor type. Nevertheless, in ovarian and breast cancer, the SDHA subunit overexpression promotes aggressive tumor phenotype characterized by improved ability to survive, proliferate, and metastasize in anchorage-independent conditions. These cancer features are particularly relevant in ovarian cancer disease, where tumor cells are able to thrive and robustly disseminate in peritoneal fluid (ascites).
In this study, the primary finding from the proteomic and metabolomic analyses revealed that the TCA cycle pathway plays an important role in ovarian tumors with SDHA-gain-of-function phenotype. We demonstrated that the TCA cycle protein content progressively increased from hFTs to PDXs reaching the highest abundance in SDHA overexpressing PDXs as compared to PDXs with low/normal SDHA expression. Consistent with our observations, it has been shown that an increased mitochondrial activity, specifically the overactive TCA cycle, plays a significant role in providing metabolic advantages to ovarian cancer cells promoting tumor progression, maintaining cancer stem cell-like behavior and chemotherapy resistance [7,15,60]. Furthermore, by employing HRA-MS and stable-isotope tracing, we discovered that tumor cells with SDHA overexpression show elevated levels of αKGDH complex and increased glutamine-derived carbon flux into TCA cycle when compared to controls. It has been shown that the αKGDH complex collaborates with glutaminolysis governing aketoglutarate (αKG) flux through the TCA cycle [40,41,42]. Within the TCA cycle, the αKG can undergo either reductive carboxylation to support fatty acid biosynthesis or oxidative decarboxylation to generate reduced electron carriers such as NADH and FADH2 to support energy production via OXPHOS [33]. Similarly to our findings, Udumula et al., demonstrated that highly metabolically active ovarian cancer cell lines have significantly increased mRNA and protein expression of DLST (a subunit of αKGDH), a key enzyme facilitating glutamine entry into the TCA cycle [60]. Furthermore, Yang et al., using isotope tracing showed that the high-invasive ovarian cancer cells are heavily reliant on glutamine to maintain their TCA cycle metabolite pool and to support cell proliferation and invasiveness, whereas low-invasive tumors showed glutamine-independent growth [61]. In addition, the authors also found that genes involved in glutaminolysis and the TCA cycle pathways were highly expressed in ovarian cancer patients with poor survival, whereas glycolytic genes were associated with better patient survival [61]. Others showed that aggressive chemoresistant ovarian cancer cell lines exhibits increased metabolic activity, reflected as increased OXPHOS coupled with TCA cycle, when compared to chemosensitive cell lines [7]. Interestingly, in many tumor types, the reductive carboxylation of glutamine-derived αKG promotes tumor growth by supplying citrate for de novo fatty acid synthesis [62,63]. However, here we showed that the SDHA overexpressing ovarian tumors rely on increased oxidative metabolism of αKG promoting OXPHOS rather than de novo lipid biosynthesis. Our observations reflect ovarian cancer behavior in vivo, where advanced tumors preferentially depend on the uptake of exogenous lipids and cholesterol than de novo lipogenesis, especially in the presence of adipocytes [64]. Adipocytes act as major mediators of ovarian cancer metastasis to the fat-rich omentum tissue. Subsequently, adipocytes provide fatty acids to the cancer cells, fueling rapid tumor growth [64,65]. In light of these data, it is likely that the SDHA overexpressing aggressive tumors use adipocyte-derived lipids for tumor growth, while relying on glutaminolysis to replenish TCA cycle with carbon intermediates essential for mitochondrial OXPHOS metabolism and biosynthesis pathways to support cancer progression and survival.
Our previous in vitro drug screening study [17] revealed that the most potent and selective in targeting SDHA overexpressing cancer cells is a natural compound shikonin, however the underlying mechanism is unclear [19,20,43]. Here, by performed a mass spectrometry-based drug target discovery study, we discovered that in SDHA overexpressing ovarian cancer cell lines, the shikonin most strongly binds to the protein LRPPRC. LRPPRC is a multifunctional protein with an essential role in regulating mitochondria homeostasis and energy metabolism [21,22]. LRPPRC functions as mitochondrial mRNA chaperone regulating the expression of mitochondrial genes, particularly respiratory chain complexes [21,66]. In recent years, the overexpressed LRPPRC emerged as a potent tumor oncogene linked with poor patients’ prognosis in various human cancers [67,68,69,70,71]. LRPPRC affects cancer progression by upstream regulators, interaction partners, and downstream targets [72]. Our novel findings shed light on an unexplored link between SDHA and LRPPRC in ovarian cancer, and to the best of our knowledge, there are no studies directly investigating a functional relationship between those key metabolic regulators. Therefore, we analyzed GeoMx spatial transcriptomics data to determine the SDHA and LRPPRC expression patterns in human HGSOC samples to provide insight into the potential role of those molecules in development and progression of ovarian cancer disease. We observed a progressive increase of SDHA and LRPPRC transcript expression in early steps of ovarian carcinogenesis, which subsequently led to a concomitant high expression of SDHA and LRPPRC gene and protein in advanced tumors. Genomic studies show that the mechanism of SDHA overexpression is mainly due to the SDHA gene amplification, which is particularly common in HGSOC [17]. The SDHA gene resides within 5p15 chromosome locus, which is one of the most significantly amplified regions in the HGSOC genome [73]. HGOSC tumors exhibit high level of somatic copy number aberrations (SCNAs), primarily due to a high prevalence of mutations and promoter methylation in DNA repair genes, which leads to profound chromosomal instability [73]. In other tumor types, the upregulation of SDHA gene was driven by different mechanisms including the SDHA promoter hypomethylation in breast cancer [51] or increased histone acetylation within the SDHA promoter in multiple myeloma [74]. The LRPPRC gene amplification is relatively rare in HGSOC, since the LRPPRC gene (chromosome 2p21 locus) is not located in genome regions affected by recurrent focal amplification or deletion events [73]. There is scarcity of data regarding the mechanisms contributing to LRPPRC overexpression in tumors. Xue et al. showed that a reduced methylation of LRPPRC promoter correlates with increased DNA copy number of LRPPRC gene and subsequently increased LRPPRC expression in breast cancer [75]. It is possible that a similar mechanism occurs in other tumor types including HGSOC.
Further, we showed that the inhibition of LRPPRC either by shikonin or by genetic knockdown (KD) resulted in a loss of LRPPRC expression, while SDHA levels remain unchanged. These observations agree with previous studies investigating the effects of LRPPRC deficiency on activity and assembly of ETC complexes. Cuillerier et al., showed that the hepatocyte-specific inactivation of LRPPRC in mice leads to a severe decrease in activity and assembly of Complex IV (CIV) and CV, while the amounts of assembled CI, CII, and CIII and the TCA cycle enzymes activity were similar to controls, including normal levels of SDHA [76]. In patients with French-Canadian Leigh Syndrome (LSFC), which is an autosomal recessive OXPHOS disorder caused by a mutation of LRPPRC gene, the assembly of all ETC complexes is disrupted with the exception of the nuclear-encoded subunits of CII and CV, which results in normal SDHA levels in patients. These data are consistent with our findings showing that loss of LRPPRC does not affect SDHA levels but is associated with OXPHOS deficiency [77]. In contrast to LRPPRC KD, which downregulated only LRPPRC expression, the SDHA KD significantly reduced the expression of both SDHA and LRPPRC. These findings highlight the possibility of the upregulated SDHA acting as a positive regulator of LRPPRC in ovarian cancer, which is yet an unexplored area of research. Since LRPPRC gene expression could be regulated by altered promoter methylation, it would be interesting to investigate if the TCA cycle metabolites, particularly those associated with SDHA overexpression phenotype (increased fumarate levels [17], Figure 3E) are able indirectly affect the LRPPRC expression via epigenetic mechanisms [78].
Our Seahorse-based assays showed that the LRPPRC plays an essential role in promoting OXPHOS in SDHA overexpressing ovarian cancer cell lines. The inhibition of LRPPRC by shikonin in those cell lines significantly suppressed mitochondrial respiration leading to bioenergetic disfunction and cancer cell death. Interestingly, while cell lines with high expression of SDHA and LRPPRC showed severe inhibition of mitochondrial respiration resulting in apoptosis upon treatment with shikonin, the cell lines with LRPPRC KD or naturally low LRPPRC levels were completely insensitive to low doses of shikonin, which is likely due to mitochondria hyperfusion. Mitochondria hyperfusion is a conserved pro-survival response to various forms of stress to preserve ETC function and mitochondrial integrity during OXPHOS deficiency [44,79]. It is likely that normal cells or cancer cells with normal SDHA levels, are able to preserve mitochondrial integrity and the ETC function by employing mitochondria hyperfusion. In contrast, it seems that in tumors with high-energy metabolism such as those with SDHA overexpression, mitochondria hyperfusion could be defective or insufficient to maintain energy production via OXPHOS resulting in cell death [44]. This also emphasizes the idea that LRPPRC inhibitors could be less toxic to normal cells while eliminating SDHA/LRPPRC overexpressing cancer cells. Future mechanistic studies investigating the impact of mitochondria hyperfusion on cell viability in SDHA overexpressing tumors treated with LRPPRC inhibitors are warranted.
5. Conclusions
In summary, we investigated unique metabolic features of ovarian cancer and discovered that tumors with high-OXPHOS phenotype are characterized by concomitant overexpression of SDHA and LRPPRC. We demonstrated for the first time that the SDHA and LPPPRC expression progressively increases from precancerous lesions to invasive HGSOC and become significantly upregulated in advanced tumors. Importantly, our in vivo data demonstrated that blocking LRPPRC function by shikonin results in a long-term therapeutic benefit and can be an effective therapy in preselected SDHA and LRPPRC overexpressing ovarian tumors. We propose that high levels of SDHA and LRPPRC could serve as novel biomarkers of high-OXPHOS tumors to guide personalized cancer therapy.
Supplementary Materials
The following supporting information can be downloaded at: Preprints.org, Figure S1: Validation of mFTE cell lines harboring patient-relevant mutant genotypes. Figure S2: The effect of SDHA overexpression on cell proliferation and anchorage-independent growth. Figure S3: In vivo study evaluating the effect of SDHA overexpression on tumor growth and mouse survival. Figure S4: Analysis of protein abundance in metabolic pathways assessed by HRA-MS. Figure S5: Effects of SDHA overexpression on glucose and glutamine flux in ovarian cancer. Figure S6: Identification of LRPPRC protein as a top molecular target of shikonin. Figure S7: Analysis of a direct binding of shikonin to LRPPRC protein. Figure S8: SDHA and LRPPRC gene expression during HGSOC development and progression. Figure S9: The effect of shikonin on OXPHOS metabolism and tumor growth in ovarian cancer models with and without SDHA and/or LRPPRC overexpression.
Author Contributions
Conceptualization, M.B.; methodology, A.S., L.W., A.H., M.K., A.P., K.H., T.G., B.L., M.B.; validation, A.S., L.W., M.K., A.P.; formal analysis, M.B., A.S., A.P.; investigation, A.S., L.W., M.K., A.P.; resources, A.S., L.W., A.H., M.K., A.P., K.H., B.L., T.G., M.B.; writing original draft preparation, M.B.; visualization, M.B.; supervision, M.B.; project administration, M.B.; funding acquisition, M.B. All authors have read and agreed to the published version of the manuscript.
Funding
This research was funded by the National Cancer Institute (NIH) Centers of Biomedical Research Excellence (COBRE) Grant (1P20GM139763-01) awarded to Dr. Bieniasz (project leader). The Protein Analysis Laboratory at OMRF is supported by NIH grants P20GM103447 (Oklahoma INBRE), R24GM137786 (IDeA National Resource for Quantitative Proteomics), P30AG050911 (Oklahoma Nathan Shock Center).
Institutional Review Board Statement
The animal study protocol was approved by the Oklahoma Medical Research Foundation Institutional Animal Care and Use Committee (#24-53, 12/20/2024). All animal studies were performed in compliance with NIH regulations and institutional guidelines. All human-derived tissues were acquired and use for research in compliance with NIH regulations and institutional guidelines, approved by the Institutional Review Board at the University of Oklahoma (IRB#: 5286; 03/18/2015; IRB#: 7292, 10/05/2016). The study was conducted in accordance with the tenets of the Declaration of Helsinki.
Informed Consent Statement
Informed consent was obtained from all subjects involved in the study.
Data Availability Statement
The data presented in this study are contained within the article or Supplementary Materials. Additional data supporting the findings of this study are available from the corresponding author upon reasonable request.
Acknowledgments
The authors would like to thank the PDX-PCT Core Facility at OMRF, and the Biospecimen and Tissue Pathology Shared Resource at University of Oklahoma for providing fallopian tube tissues and established HGSOC PDX models. We thank the Metabolic Phenotyping Core for providing expertise in using Seahorse instruments and metabolic flux analysis. The authors would like to thank Dr. Robert Weinberg for sharing mFTE cell lines harboring patient-relevant mutant genotypes and Dr. Ronny Drapkin for providing us with normal human fallopian tube epithelial cell lines (FT190 and FT194). In addition, we thank Patryk Mucha and Magdalena Bulicz for comments and suggestions during this work.
Conflicts of Interest
The authors declare no conflict of interest.
Abbreviations
The following abbreviations are used in this manuscript:
| 2D | two-dimensional |
| 3D | three-dimensional |
| 3-PGA | 3-phosphoglyceric acid |
| aKG | aketoglutarate |
| aKGDH | aketoglutarate dehydrogenase |
| ACAA2 | acetyl-CoA acyltransferase 2 |
| ACADL | acyl-CoA Dehydrogenase Long Chain |
| ANOVA | analysis of variance |
| ATCC | American type culture collection |
| ATP | adenosine triphosphate |
| BSA | bovine serum albumin |
| CAT | catalase |
| CI | complex I |
| CII | complex II |
| CIII | complex II |
| CIV | complex IV |
| CV | complex V |
| CS | citrate synthase |
| DHAP | dihydroxyacetone phosphate |
| DLST | dihydrolipoamide S-succinyltransferase |
| DOX | doxycycline |
| ECAR | extracellular acidification rate |
| ES6B | epoxy-activated Sepharose 6B |
| ETC | electron transport chain |
| F1,6BP | fructose-1,6-bisphosphate |
| F6P | fructose 6-phosphate |
| FADH2 | flavin adenine dinucleotide |
| FCCP | carbonyl cyanide-4-(trifluoromethoxy)phenylhydrazone |
| FT | fallopian tube |
| G6P | glucose-6 phosphate |
| GAPDH | glyceraldehyde 3-phosphate dehydrogenase |
| GLU | glucose |
| GLUD1 | glutamate dehydrogenase 1 |
| GLN | glutamine |
| hFT | human fallopian tube |
| HGSOC | high-grade serous ovarian cancer |
| HK2 | hexokinase 2 |
| H | hour |
| HPLC | high-performance liquid chromatography |
| HRA-MS | high resolution accurate mass spectrometry |
| IACUC | institutional animal care and use committee |
| IDH3A | isocitrate dehydrogenase (NAD(+)) 3 catalytic subunit alpha |
| IDH3B | isocitrate dehydrogenase (NAD(+)) 3 catalytic subunit beta |
| IRB | institutional review board |
| KD | knockdown |
| LC-MS-MS | liquid chromatography-tandem mass spectrometry |
| LC-Q/TOF | liquid chromatography-quadropole/time-of-flight |
| LRPPRC | leucine-rich pentatricopeptide repeat-containing |
| LSFC | French-Canadian Leigh Syndrome |
| mFT | mouse fallopian tube |
| mFTE | murine fallopian tube epithelium |
| MS | mass spectrometry |
| MTT | 3-(4,5-Dimethylthiazol-2-yl)-2,5-Diphenyltetrazolium Bromide |
| NADH | nicotinamide adenine dinucleotide hydrogen |
| OCR | oxygen consumption rate |
| OGDH | oxoglutarate dehydrogenase |
| OE | overexpression |
| OMRF | Oklahoma Medical Research Foundation |
| OS | overall survival |
| OXPHOS | oxidative phosphorylation |
| PDX | patient-derived xenograft |
| PEP | phosphoenolpyruvate |
| PRDX2 | peroxiredoxin 2 |
| PPP | pentose phosphate pathway |
| RT | room temperature |
| SCNA | somatic copy number aberration |
| SD | standard deviation |
| SDH | succinate dehydrogenase |
| SDHA | succinate dehydrogenase subunit A |
| SDS-PAGE | sodium dodecyl-sulfate polyacrylamide gel electrophoresis |
| SEM | standard error of the mean |
| shRNA | short hairpin ribonucleic acid |
| SLC25A20 | solute carrier family 25 member 20 |
| SUCLG1 | succinate-CoA ligase GDP/ADP-forming subunit alpha |
| STIC | serous tubal intraepithelial carcinomas |
| STR | short tandem repeat |
| TCA | tricarboxylic acid |
| TME | tumor microenvironment |
| USG | ultroser G serum substitute |
References
- Foley, O.W. , Rauh-Hain, J.A.; del Carmen, M.G. Recurrent epithelial ovarian cancer: an update on treatment. Oncology (Williston Park) 2013, 27, 288–294. [Google Scholar] [PubMed]
- Raja, F.A.; Chopra, N.; Ledermann, J.A. Optimal first-line treatment in ovarian cancer. Ann Oncol 2012, 23 (Suppl 10), x118–x127. [Google Scholar] [CrossRef] [PubMed]
- Mazidimoradi, A.; Momenimovahed, Z.; Khani, Y.; Shahrabi, A.R.; Allahqoli, L.; Salehiniya, H. Global patterns and temporal trends in ovarian cancer morbidity, mortality, and burden from 1990 to 2019. Oncologie 2023, 25, 641–659. [Google Scholar] [CrossRef]
- Society, A.C. Cancer Facts and Figures, 2024. 2024.
- Anderson, A.S.; Roberts, P.C.; Frisard, M.I.; Hulver, M.W.; Schmelz, E.M. Ovarian tumor-initiating cells display a flexible metabolism. Exp Cell Res 2014, 328, 44–57. [Google Scholar] [CrossRef]
- Caneba, C.A.; Bellance, N.; Yang, L.; Pabst, L.; Nagrath, D. Pyruvate uptake is increased in highly invasive ovarian cancer cells under anoikis conditions for anaplerosis, mitochondrial function, and migration. Am J Physiol Endocrinol Metab 2012, 303, E1036–E1052. [Google Scholar] [CrossRef]
- Dar, S.; Chhina, J.; Mert, I.; Chitale, D.; Buekers, T.; Kaur, H.; Giri, S.; Munkarah, A.; Rattan, R. Bioenergetic Adaptations in Chemoresistant Ovarian Cancer Cells. Sci Rep 2017, 7, 8760. [Google Scholar] [CrossRef]
- Zaal, E.A.; Berkers, C.R. The Influence of Metabolism on Drug Response in Cancer. Front Oncol 2018, 8, 500. [Google Scholar] [CrossRef]
- Griguer, C.E.; Oliva, C.R.; Gillespie, G.Y. Glucose metabolism heterogeneity in human and mouse malignant glioma cell lines. J Neurooncol 2005, 74, 123–133. [Google Scholar] [CrossRef]
- Rodriguez-Enriquez, S.; Carreno-Fuentes, L.; Gallardo-Perez, J.C.; Saavedra, E.; Quezada, H.; Vega, A.; Marin-Hernandez, A.; Olin-Sandoval, V.; Torres-Marquez, M.E.; Moreno-Sanchez, R. Oxidative phosphorylation is impaired by prolonged hypoxia in breast and possibly in cervix carcinoma. Int J Biochem Cell Biol 2010, 42, 1744–1751. [Google Scholar] [CrossRef]
- Bellance, N.; Benard, G.; Furt, F.; Begueret, H.; Smolkova, K.; Passerieux, E.; Delage, J.P.; Baste, J.M.; Moreau, P.; Rossignol, R. Bioenergetics of lung tumors: alteration of mitochondrial biogenesis and respiratory capacity. Int J Biochem Cell Biol 2009, 41, 2566–2577. [Google Scholar] [CrossRef]
- Pascale, R.M.; Calvisi, D.F.; Simile, M.M.; Feo, C.F.; Feo, F. The Warburg Effect 97 Years after Its Discovery. Cancers (Basel) 2020, 12. [Google Scholar] [CrossRef] [PubMed]
- Gentric, G.; Kieffer, Y.; Mieulet, V.; Goundiam, O.; Bonneau, C.; Nemati, F.; Hurbain, I.; Raposo, G.; Popova, T. , Stern, M.H.; et al. PML-Regulated Mitochondrial Metabolism Enhances Chemosensitivity in Human Ovarian Cancers. Cell Metab 2019, 29, 156–173 e110. [Google Scholar] [CrossRef]
- Koc, Z.C.; Sollars, V.E.; Bou Zgheib, N.; Rankin, G.O.; Koc, E.C. Evaluation of mitochondrial biogenesis and ROS generation in high-grade serous ovarian cancer. Front Oncol 2023, 13, 1129352. [Google Scholar] [CrossRef]
- Pasto, A.; Bellio, C.; Pilotto, G.; Ciminale, V.; Silic-Benussi, M.; Guzzo, G.; Rasola, A.; Frasson, C.; Nardo, G.; Zulato, E.; et al. Cancer stem cells from epithelial ovarian cancer patients privilege oxidative phosphorylation, and resist glucose deprivation. Oncotarget 2014, 5, 4305–4319. [Google Scholar] [CrossRef]
- Yang, L.; Moss, T.; Mangala, L.S.; Marini, J.; Zhao, H.; Wahlig, S.; Armaiz-Pena, G.; Jiang, D.; Achreja, A.; Win, J.; et al. Metabolic shifts toward glutamine regulate tumor growth, invasion and bioenergetics in ovarian cancer. Mol Syst Biol 2014, 10, 728. [Google Scholar] [CrossRef] [PubMed]
- Wang, L.; Cybula, M.; Rostworowska, M.; Wang, L.; Mucha, P.; Bulicz, M.; Bieniasz, M. Upregulation of Succinate Dehydrogenase (SDHA) Contributes to Enhanced Bioenergetics of Ovarian Cancer Cells and Higher Sensitivity to Anti-Metabolic Agent Shikonin. Cancers (Basel) 2022, 14. [Google Scholar] [CrossRef]
- Sun, F.; Huo, X.; Zhai, Y.; Wang, A.; Xu, J.; Su, D.; Bartlam, M.; Rao, Z. Crystal structure of mitochondrial respiratory membrane protein complex II. Cell 2005, 121, 1043–1057. [Google Scholar] [CrossRef]
- Chen, Y.; Ni, J.; Gao, Y.; Zhang, J.; Liu, X.; Chen, Y.; Chen, Z.; Wu, Y. Integrated proteomics and metabolomics reveals the comprehensive characterization of antitumor mechanism underlying Shikonin on colon cancer patient-derived xenograft model. Sci Rep 2020, 10, 14092. [Google Scholar] [CrossRef] [PubMed]
- Ke, L.N.; Kong, L.Q.; Xu, H.H.; Chen, Q.H.; Dong, Y.; Li, B.; Zeng, X.H.; Wang, H.M. Research Progress on Structure and Anti-Gynecological Malignant Tumor of Shikonin. Front Chem 2022, 10, 935894. [Google Scholar] [CrossRef]
- Cui, J.; Wang, L.; Ren, X.; Zhang, Y.; Zhang, H. LRPPRC: A Multifunctional Protein Involved in Energy Metabolism and Human Disease. Front Physiol 2019, 10, 595. [Google Scholar] [CrossRef]
- Sterky, F.H.; Ruzzenente, B.; Gustafsson, C.M.; Samuelsson, T.; Larsson, N.G. LRPPRC is a mitochondrial matrix protein that is conserved in metazoans. Biochem Biophys Res Commun 2010, 398, 759–764. [Google Scholar] [CrossRef] [PubMed]
- Perets, R.; Wyant, G.A.; Muto, K.W.; Bijron, J.G.; Poole, B.B.; Chin, K.T.; Chen, J.Y.; Ohman, A.W.; Stepule, C.D.; Kwak, S.; et al. Transformation of the fallopian tube secretory epithelium leads to high-grade serous ovarian cancer in Brca;Tp53;Pten models. Cancer Cell 2013, 24, 751–765. [Google Scholar] [CrossRef] [PubMed]
- Iyer, S.; Zhang, S.; Yucel, S.; Horn, H.; Smith, S.G.; Reinhardt, F.; Hoefsmit, E.; Assatova, B.; Casado, J.; Meinsohn, M.C.; et al. Genetically Defined Syngeneic Mouse Models of Ovarian Cancer as Tools for the Discovery of Combination Immunotherapy. Cancer Discov 2021, 11, 384–407. [Google Scholar] [CrossRef]
- Cybula, M.; Wang, L.; Wang, L.; Drumond-Bock, A.L.; Moxley, K.M.; Benbrook, D.M.; Gunderson-Jackson, C.; Ruiz-Echevarria, M.J.; Bhattacharya, R.; Mukherjee, P.; et al. Patient-Derived Xenografts of High-Grade Serous Ovarian Cancer Subtype as a Powerful Tool in Pre-Clinical Research. Cancers (Basel) 2021, 13. [Google Scholar] [CrossRef]
- Bieniasz, M.; Radhakrishnan, P.; Faham, N.; De La, O.J.; Welm, A.L. Preclinical Efficacy of Ron Kinase Inhibitors Alone and in Combination with PI3K Inhibitors for Treatment of sfRon-Expressing Breast Cancer Patient-Derived Xenografts. Clin Cancer Res 2015, 21, 5588–5600. [Google Scholar] [CrossRef]
- MacLean, B.; Tomazela, D.M.; Shulman, N.; Chambers, M.; Finney, G.L.; Frewen, B.; Kern, R.; Tabb, D.L.; Liebler, D.C.; MacCoss, M.J. Skyline: an open source document editor for creating and analyzing targeted proteomics experiments. Bioinformatics 2010, 26, 966–968. [Google Scholar] [CrossRef]
- Kader, T.; Lin, J.R.; Hug, C.; Coy, S.; Chen, Y.A.; de Bruijn, I.; Shih, N.; Jung, E.; Pelletier, R.J.; Leon, M.L.; et al. Multimodal Spatial Profiling Reveals Immune Suppression and Microenvironment Remodeling in Fallopian Tube Precursors to High-Grade Serous Ovarian Carcinoma. bioRxiv 2024. [Google Scholar] [CrossRef] [PubMed]
- Chen, Y.; Wang, F.; Xu, F.; Yang, T. Mass Spectrometry-Based Protein Quantification. Adv Exp Med Biol 2016, 919, 255–279. [Google Scholar]
- Eniafe, J.; Jiang, S. The functional roles of TCA cycle metabolites in cancer. Oncogene 2021, 40, 3351–3363. [Google Scholar] [CrossRef]
- Shukla, P.; Singh, K.K. The mitochondrial landscape of ovarian cancer: emerging insights. Carcinogenesis 2021, 42, 663–671. [Google Scholar] [CrossRef]
- Koundouros, N.; Poulogiannis, G. Reprogramming of fatty acid metabolism in cancer. Br J Cancer 2020, 122, 4–22. [Google Scholar] [CrossRef] [PubMed]
- Wu, N.; Yang, M.; Gaur, U.; Xu, H.; Yao, Y.; Li, D. Alpha-Ketoglutarate: Physiological Functions and Applications. Biomol Ther (Seoul) 2016, 24, 1–8. [Google Scholar] [CrossRef] [PubMed]
- Yohannes, E.; Kazanjian, A.A.; Lindsay, M.E.; Fujii, D.T.; Ieronimakis, N.; Chow, G.E.; Beesley, R.D.; Heitmann, R.J.; Burney, R.O. The human tubal lavage proteome reveals biological processes that may govern the pathology of hydrosalpinx. Sci Rep 2019, 9, 8980. [Google Scholar] [CrossRef]
- Brewis, I.A.; Winston, R.M.; Leese, H.J. Energy metabolism of the human fallopian tube. J Reprod Fertil 1992, 95, 257–262. [Google Scholar] [CrossRef] [PubMed]
- Console, L.; Scalise, M.; Mazza, T.; Pochini, L.; Galluccio, M.; Giangregorio, N.; Tonazzi, A.; Indiveri, C. Carnitine Traffic in Cells. Link With Cancer. Front Cell Dev Biol 2020, 8, 583850. [Google Scholar]
- Yuan, P.; Mu, J.; Wang, Z.; Ma, S.; Da, X.; Song, J.; Zhang, H.; Yang, L.; Li, J.; Yang, J. Down-regulation of SLC25A20 promotes hepatocellular carcinoma growth and metastasis through suppression of fatty-acid oxidation. Cell Death Dis 2021, 12, 361. [Google Scholar] [CrossRef]
- Sanders, E.; Diehl, S. Analysis and interpretation of transcriptomic data obtained from extended Warburg effect genes in patients with clear cell renal cell carcinoma. Oncoscience 2015, 2, 151–186. [Google Scholar] [CrossRef]
- Jaberi, E.; Chitsazian, F.; Ali Shahidi, G.; Rohani, M.; Sina, F.; Safari, I.; Malakouti Nejad, M.; Houshmand, M.; Klotzle, B.; Elahi, E. The novel mutation p.Asp251Asn in the beta-subunit of succinate-CoA ligase causes encephalomyopathy and elevated succinylcarnitine. J Hum Genet 2013, 58, 526–530. [Google Scholar] [CrossRef]
- Tretter, L.; Adam-Vizi, V. Alpha-ketoglutarate dehydrogenase: a target and generator of oxidative stress. Philos Trans R Soc Lond B Biol Sci 2005, 360, 2335–2345. [Google Scholar] [CrossRef]
- Vatrinet, R.; Leone, G.; De Luise, M.; Girolimetti, G.; Vidone, M.; Gasparre, G.; Porcelli, A.M. The alpha-ketoglutarate dehydrogenase complex in cancer metabolic plasticity. Cancer Metab 2017, 5, 3. [Google Scholar] [CrossRef]
- Mates, J.M.; Di Paola, F.J.; Campos-Sandoval, J.A.; Mazurek, S.; Marquez, J. Therapeutic targeting of glutaminolysis as an essential strategy to combat cancer. Semin Cell Dev Biol 2020, 98, 34–43. [Google Scholar] [CrossRef] [PubMed]
- Chen, J.; Xie, J.; Jiang, Z.; Wang, B.; Wang, Y.; Hu, X. Shikonin and its analogs inhibit cancer cell glycolysis by targeting tumor pyruvate kinase-M2. Oncogene 2011, 30, 4297–4306. [Google Scholar] [CrossRef]
- Rolland, S.G.; Motori, E.; Memar, N.; Hench, J.; Frank, S.; Winklhofer, K.F.; Conradt, B. Impaired complex IV activity in response to loss of LRPPRC function can be compensated by mitochondrial hyperfusion. Proc Natl Acad Sci U S A 2013, 110, E2967–E2976. [Google Scholar] [CrossRef] [PubMed]
- Aldera, A.P.; Govender, D. Gene of the month: SDH. J Clin Pathol 2018, 71, 95–97. [Google Scholar] [CrossRef]
- Nazar, E.; Khatami, F.; Saffar, H.; Tavangar, S.M. The Emerging Role of Succinate Dehyrogenase Genes (SDHx) in Tumorigenesis. Int J Hematol Oncol Stem Cell Res 2019, 13, 72–82. [Google Scholar] [CrossRef]
- Burnichon, N.; Briere, J.J.; Libe, R.; Vescovo, L.; Riviere, J.; Tissier, F.; Jouanno, E.; Jeunemaitre, X.; Benit, P.; Tzagoloff, A.; et al. SDHA is a tumor suppressor gene causing paraganglioma. Hum Mol Genet 2010, 19, 3011–3020. [Google Scholar] [CrossRef] [PubMed]
- Hoekstra, A.S.; de Graaff, M.A.; Briaire-de Bruijn, I.H.; Ras, C.; Seifar, R.M.; van Minderhout, I.; Cornelisse, C.J.; Hogendoorn, P.C.; Breuning, M.H.; Suijker, J.; et al. Inactivation of SDH and FH cause loss of 5hmC and increased H3K9me3 in paraganglioma/pheochromocytoma and smooth muscle tumors. Oncotarget 2015, 6, 38777–38788. [Google Scholar] [CrossRef]
- Courage, C.; Jackson, C.B.; Hahn, D.; Euro, L.; Nuoffer, J.M.; Gallati, S.; Schaller, A. SDHA mutation with dominant transmission results in complex II deficiency with ocular, cardiac, and neurologic involvement. Am J Med Genet A 2017, 173, 225–230. [Google Scholar] [CrossRef]
- Chattopadhyay, C.; Oba, J.; Roszik, J.; Marszalek, J.R.; Chen, K.; Qi, Y.; Eterovic, K.; Robertson, A.G.; Burks, J.K.; McCannel, T.A.; et al. Elevated Endogenous SDHA Drives Pathological Metabolism in Highly Metastatic Uveal Melanoma. Invest Ophthalmol Vis Sci 2019, 60, 4187–4195. [Google Scholar] [CrossRef]
- Yong, L.; Fang, Y.; Jin, L.; Zhang, X.; Luis, M.A.; Lin, X.; Tang, S.; Cai, F. Unveiling the hidden role of SDHA in breast cancer proliferation: a novel therapeutic avenue. Cancer Cell Int 2025, 25, 108. [Google Scholar] [CrossRef]
- Kapalczynska, M.; Kolenda, T.; Przybyla, W.; Zajaczkowska, M.; Teresiak, A.; Filas, V.; Ibbs, M.; Blizniak, R.; Luczewski, L.; Lamperska, K. 2D and 3D cell cultures - a comparison of different types of cancer cell cultures. Arch Med Sci 2018, 14, 910–919. [Google Scholar] [PubMed]
- Zhou,Y. Understanding the cancer/tumor biology from 2D to 3D. J Thorac Dis 2016, 8, E1484–E1486.
- Cortesi, M.; Warton, K.; Ford, C.E. Beyond 2D cell cultures: how 3D models are changing the in vitro study of ovarian cancer and how to make the most of them. PeerJ 2024, 12, e17603. [Google Scholar] [CrossRef]
- Olszewski, K.; Barsotti, A.; Feng, X.J.; Momcilovic, M.; Liu, K.G.; Kim, J.I.; Morris, K.; Lamarque, C.; Gaffney, J.; Yu, X.; et al. Inhibition of glucose transport synergizes with chemical or genetic disruption of mitochondrial metabolism and suppresses TCA cycle-deficient tumors. Cell Chem Biol 2022, 29, 423–435 e410. [Google Scholar] [CrossRef]
- Camacho, M.; Bague, S.; Valero, C.; Holgado, A.; Lopez-Vilaro, L.; Terra, X.; Aviles-Jurado, F.X.; Leon, X. Transcriptional Expression of SLC2A3 and SDHA Predicts the Risk of Local Tumor Recurrence in Patients with Head and Neck Squamous Cell Carcinomas Treated Primarily with Radiotherapy or Chemoradiotherapy. Int J Mol Sci 2025, 26. [Google Scholar] [CrossRef]
- Cornejo, K.M.; Lu, M.; Yang, P.; Wu, S.; Cai, C.; Zhong, W.D.; Olumi, A.; Young, R.H.; Wu, C.L. Succinate dehydrogenase B: a new prognostic biomarker in clear cell renal cell carcinoma. Hum Pathol 2015, 46, 820–826. [Google Scholar] [CrossRef]
- Dai, Z.; Pan, S.; Chen, C.; Cao, L.; Li, X.; Chen, X.; Su, X.; Lin, S. Down-regulation of succinate dehydrogenase subunit B and up-regulation of pyruvate dehydrogenase kinase 1 predicts poor prognosis in recurrent nasopharyngeal carcinoma. Tumour Biol 2016, 37, 5145–5152. [Google Scholar] [CrossRef] [PubMed]
- Li, J.; Liang, N.; Long, X.; Zhao, J.; Yang, J.; Du, X.; Yang, T.; Yuan, P.; Huang, X.; Zhang, J.; et al. SDHC-related deficiency of SDH complex activity promotes growth and metastasis of hepatocellular carcinoma via ROS/NFkappaB signaling. Cancer Lett 2019, 461, 44–55. [Google Scholar] [CrossRef]
- Udumula, M.P.; Rashid, F.; Singh, H.; Pardee, T.; Luther, S.; Bhardwaj, T.; Anjaly, K.; Piloni, S.; Hijaz, M.; Gogoi, R.; et al. Targeting mitochondrial metabolism with CPI-613 in chemoresistant ovarian tumors. J Ovarian Res 2024, 17, 226. [Google Scholar] [CrossRef]
- Yang, L.; Moss, T.; Mangala, L.S.; Marini, J.; Zhao, H.; Wahlig, S.; Armaiz-Pena, G.; Jiang, D.; Achreja, A.; Win, J.; et al. Metabolic shifts toward glutamine regulate tumor growth, invasion and bioenergetics in ovarian cancer. Mol Syst Biol 2014, 10, 728. [Google Scholar] [CrossRef]
- Mullen, A.R.; Wheaton, W.W.; Jin, E.S.; Chen, P.H.; Sullivan, L.B.; Cheng, T.; Yang, Y.; Linehan, W.M.; Chandel, N.S.; DeBerardinis, R.J. Reductive carboxylation supports growth in tumour cells with defective mitochondria. Nature 2011, 481, 385–388. [Google Scholar] [CrossRef] [PubMed]
- Metallo, C.M.; Gameiro, P.A.; Bell, E.L.; Mattaini, K.R.; Yang, J.; Hiller, K.; Jewell, C.M.; Johnson, Z.R.; Irvine, D.J.; Guarente, L.; et al. Reductive glutamine metabolism by IDH1 mediates lipogenesis under hypoxia. Nature 2011, 481, 380–384. [Google Scholar] [CrossRef] [PubMed]
- Zhao, G.; Cardenas, H.; Matei, D. Ovarian Cancer-Why Lipids Matter. Cancers (Basel) 2019, 11. [Google Scholar] [CrossRef]
- Nieman, K.M.; Kenny, H.A.; Penicka, C.V.; Ladanyi, A.; Buell-Gutbrod, R.; Zillhardt, M.R.; Romero, I.L.; Carey, M.S.; Mills, G.B.; Hotamisligil, G.S.; et al. Adipocytes promote ovarian cancer metastasis and provide energy for rapid tumor growth. Nat Med 2011, 17, 1498–1503. [Google Scholar] [CrossRef] [PubMed]
- Chujo, T.; Ohira, T.; Sakaguchi, Y.; Goshima, N.; Nomura, N.; Nagao, A.; Suzuki, T. LRPPRC/SLIRP suppresses PNPase-mediated mRNA decay and promotes polyadenylation in human mitochondria. Nucleic Acids Res 2012, 40, 8033–8047. [Google Scholar] [CrossRef]
- Li, X.; Lv, L.; Zheng, J.; Zhou, J.; Liu, B.; Chen, H.; Liang, C.; Wang, R.; Su, L.; Li, X.; et al. The significance of LRPPRC overexpression in gastric cancer. Med Oncol 2014, 31, 818. [Google Scholar] [CrossRef]
- Jiang, X.; Li, X.; Huang, H.; Jiang, F.; Lin, Z.; He, H.; Chen, Y.; Yue, F.; Zou, J.; He, Y.; et al. Elevated levels of mitochondrion-associated autophagy inhibitor LRPPRC are associated with poor prognosis in patients with prostate cancer. Cancer 2014, 120, 1228–1236. [Google Scholar] [CrossRef]
- Nishio, T.; Kurabe, N.; Goto-Inoue, N.; Nakamura, T.; Sugimura, H.; Setou, M.; Maekawa, M. Immunohistochemical expression analysis of leucine-rich PPR-motif-containing protein (LRPPRC), a candidate colorectal cancer biomarker identified by shotgun proteomics using iTRAQ. Clin Chim Acta 2017, 471, 276–282. [Google Scholar] [CrossRef]
- Zhang, Y.; Feng, B.; Liang, Y.; Tang, Q.; Zhang, S.; Zhang, Z.; Xu, L.; Yin, J. Prognostic significance of LRPPRC and its association with immune infiltration in liver hepatocellular carcinoma. Am J Clin Exp Immunol 2024, 13, 105–116. [Google Scholar] [CrossRef]
- Wu, Z.; Liu, X.; Xie, F.; Ma, C.; Lam, E.W.; Kang, N.; Jin, D.; Yan, J.; Jin, B. Comprehensive pan-cancer analysis identifies the RNA-binding protein LRPPRC as a novel prognostic and immune biomarker. Life Sci 2024, 343, 122527. [Google Scholar] [CrossRef]
- Ge, Y.; Janson, V.; Liu, H. Comprehensive review on leucine-rich pentatricopeptide repeat-containing protein (LRPPRC, PPR protein): A burgeoning target for cancer therapy. Int J Biol Macromol 2024, 282 Pt 3, 136820. [Google Scholar] [CrossRef] [PubMed]
- Cancer Genome Atlas Research N: Integrated genomic analyses of ovarian carcinoma. Nature 2011, 474, 609–615. [CrossRef]
- Sun, Y.; Xu, Z.; Jiang, J.; Xu, T.; Xu, J.; Liu, P. High Expression of Succinate Dehydrogenase Subunit A Which Is Regulated by Histone Acetylation, Acts as a Good Prognostic Factor of Multiple Myeloma Patients. Front Oncol 2020, 10, 563666. [Google Scholar] [CrossRef] [PubMed]
- Xue, Q.; Wang, W.; Liu, J.; Wang, D.; Zhang, T.; Shen, T.; Liu, X.; Wang, X.; Shao, X.; Zhou, W.; et al. LRPPRC confers enhanced oxidative phosphorylation metabolism in triple-negative breast cancer and represents a therapeutic target. J Transl Med 2025, 23, 372. [Google Scholar] [CrossRef]
- Cuillerier, A.; Honarmand, S.; Cadete, V.J.J.; Ruiz, M.; Forest, A.; Deschenes, S.; Beauchamp, C.; Consortium, L.; Charron, G.; Rioux, J.D.; et al. Loss of hepatic LRPPRC alters mitochondrial bioenergetics, regulation of permeability transition and trans-membrane ROS diffusion. Hum Mol Genet 2017, 26, 3186–3201. [Google Scholar] [CrossRef]
- Olahova, M.; Hardy, S.A.; Hall, J.; Yarham, J.W.; Haack, T.B.; Wilson, W.C.; Alston, C.L.; He, L.; Aznauryan, E.; Brown, R.M.; et al. LRPPRC mutations cause early-onset multisystem mitochondrial disease outside of the French-Canadian population. Brain 2015, 138 Pt 12, 3503–3519. [Google Scholar] [CrossRef]
- Wang, P.; Chen, L.L.; Xiong, Y.; Ye, D. Metabolite regulation of epigenetics in cancer. Cell Rep 2024, 43, 114815. [Google Scholar] [CrossRef]
- Cuillerier, A.; Ruiz, M.; Daneault, C.; Forest, A.; Rossi, J.; Vasam, G.; Cairns, G.; Cadete, V.; Consortium, L.; Des Rosiers, C.; et al. Adaptive optimization of the OXPHOS assembly line partially compensates lrpprc-dependent mitochondrial translation defects in mice. Commun Biol 2021, 4, 989. [Google Scholar] [CrossRef]
Figure 1.
The effect of SDHA overexpression on ovarian cancer cell proliferation and survival evaluated in human and mouse tumor models. (A) WES analysis of mouse normal fallopian tubes “mFT” and ovarian cancer cell lines assayed for SDHA and loading control GAPDH. (B) Graph represents normalized quantification of SDHA protein expression in cell lines shown in ‘A’ using Compass for SimpleWestern Software. Table shows fold change of SDHA expression in mouse ovarian cancer cell lines as relative to the expression of SDHA in normal mFTs. (C) WES analysis of human fallopian tube cell lines (FT190, FT194) and human ovarian cancer cell lines with and without overexpression (OE) or knockdown (KD) of SDHA assayed for SDHA and GAPDH. (D) Graph represents normalized quantification of SDHA protein expression in cell lines shown in ‘C’. Table shows fold change of SDHA expression in human ovarian cancer cell lines as relative to the expression of SDHA in normal human FTs. (E) Images represent anchorage-independent growth and colony formation of mouse ovarian cancer cell lines overexpressing SDHA (BPPNM), depleted of SDHA by shRNA-mediated knockdown (BPPNM-SDHA-KD), and those with naturally low SDHA levels (SPCA). (F) Number of cell colonies shown in ‘E’ was quantified (one-way ANOVA; ****=P<0.0001). (G) Cell proliferation in vitro was assessed by 3T5 cell doubling assay in cell lines with and without SDHA overexpression (one-way ANOVA; NS, not significant) (H) Kaplan-Meier curves showing % probability of survival of mice injected into ovary with BPPNM, BPPNM-SDHA-KD or SPCA cells. (A, C) Uncropped blots are shown in Supplementary Figure S1).
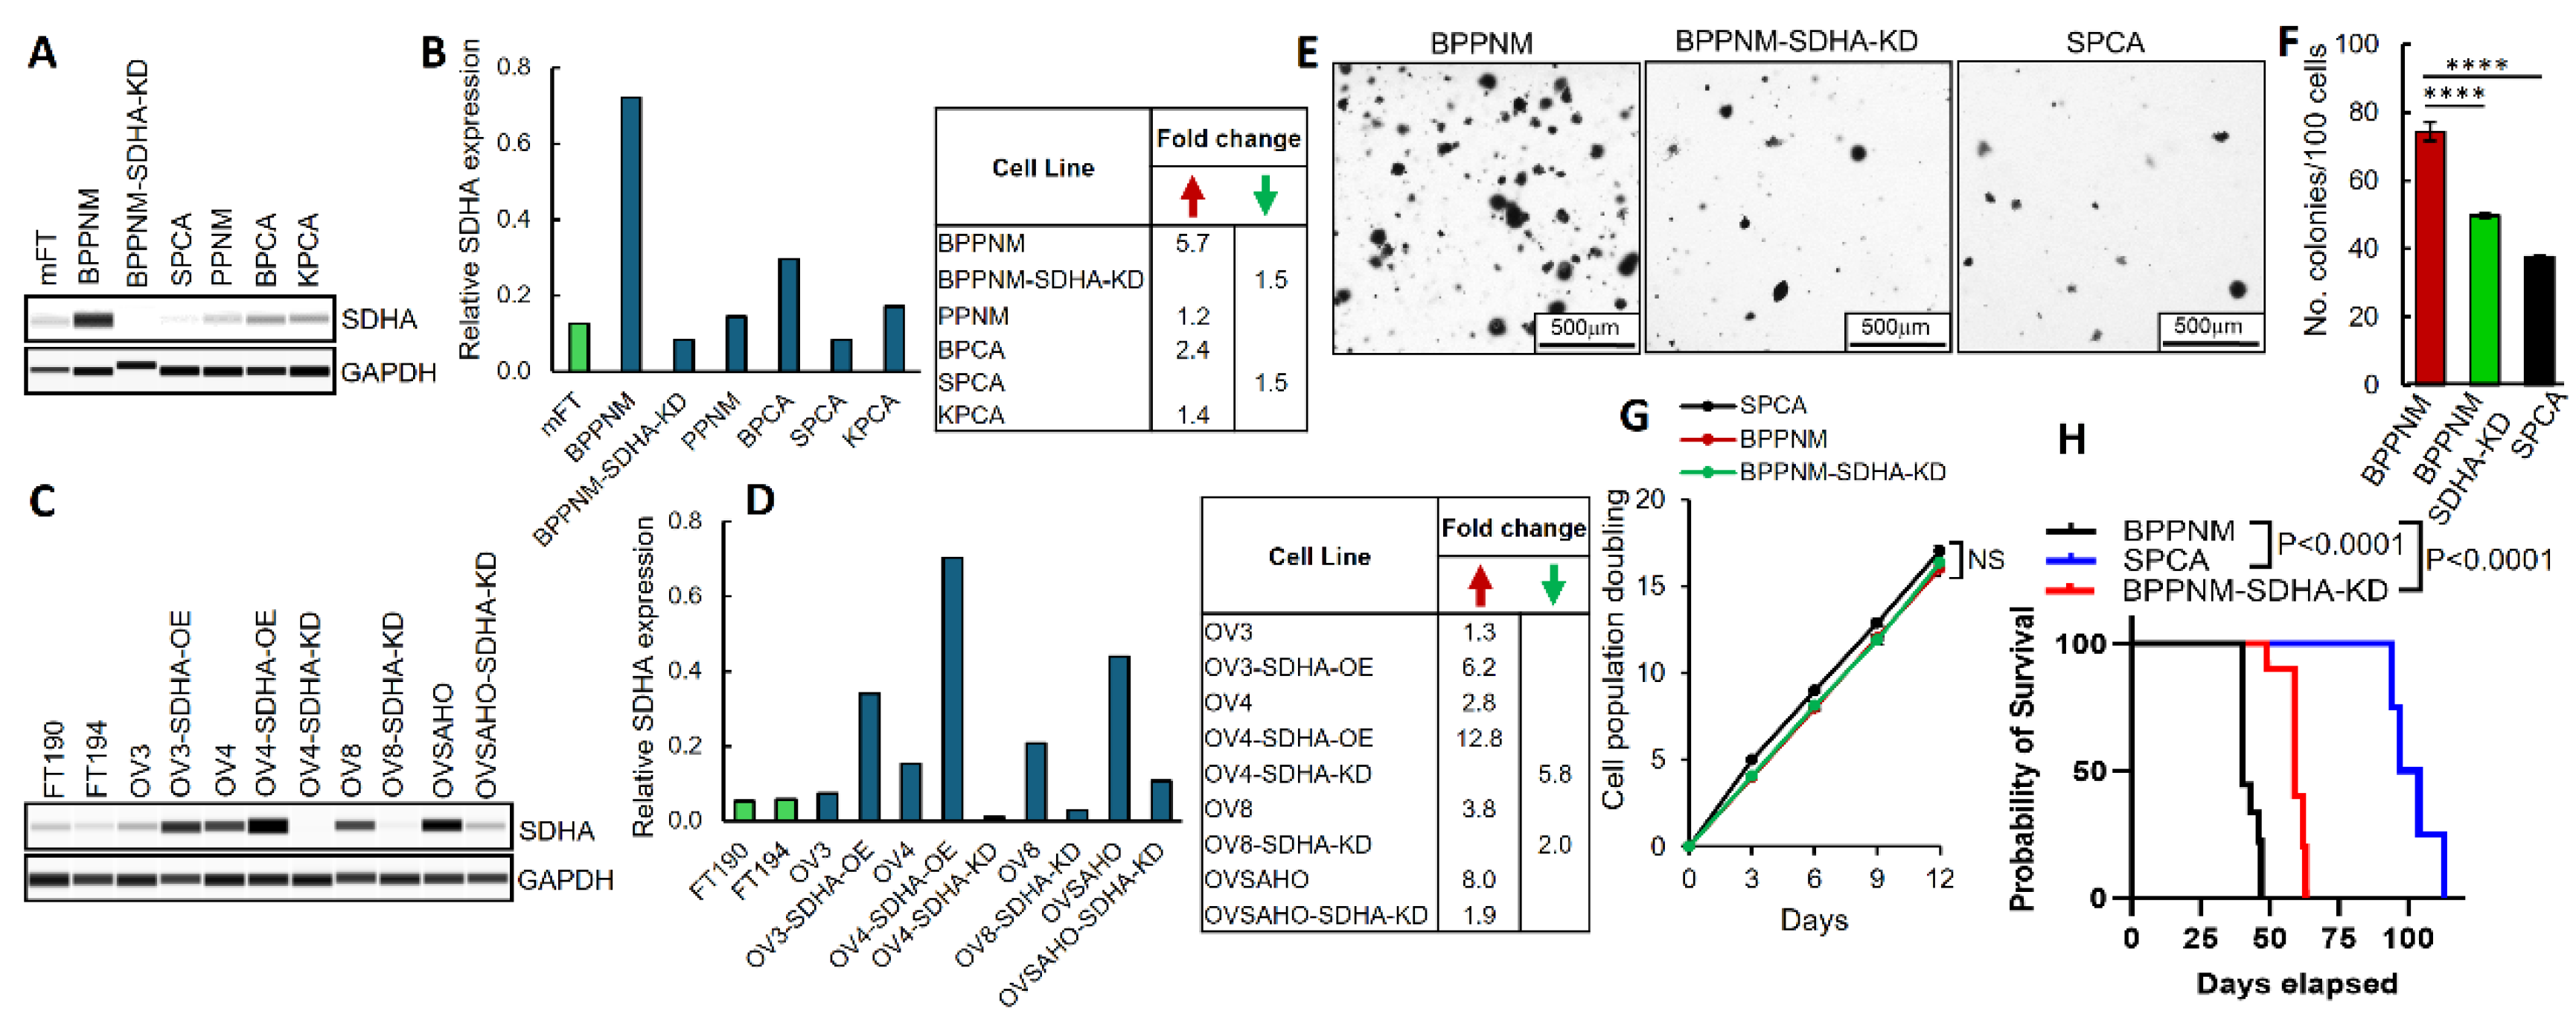
Figure 2.
Analysis of protein content of metabolic pathways in ovarian PDXs and normal hFTs. (A) A heatmap representing differentially expressed metabolic proteins between ovarian PDXs and hFTs identified by high-throughput MS analysis (unpaired t test). (B) Graph shows levels of differentially expressed proteins between PDXs and hFTs identified by MS (unpaired t test). (C) A heatmap illustrating differentially expressed metabolic proteins between SDHA overexpressing PDXs vs. PDX with normal SDHA levels (unpaired t test). (D) Graph shows levels of differentially expressed proteins between SDHA overexpressing PDXs vs. PDX with normal SDHA levels (unpaired t test). (E) Table shows full name and function of differentially expressed proteins listed in ‘D’. (B, D) Asterisks indicate level of statistical significance: * P ≤ 0.05, ** P ≤ 0.01, ***P ≤ 0.001, ****P ≤ 0.001. Detailed information about MS data are provided in Supplementary Figure S4.
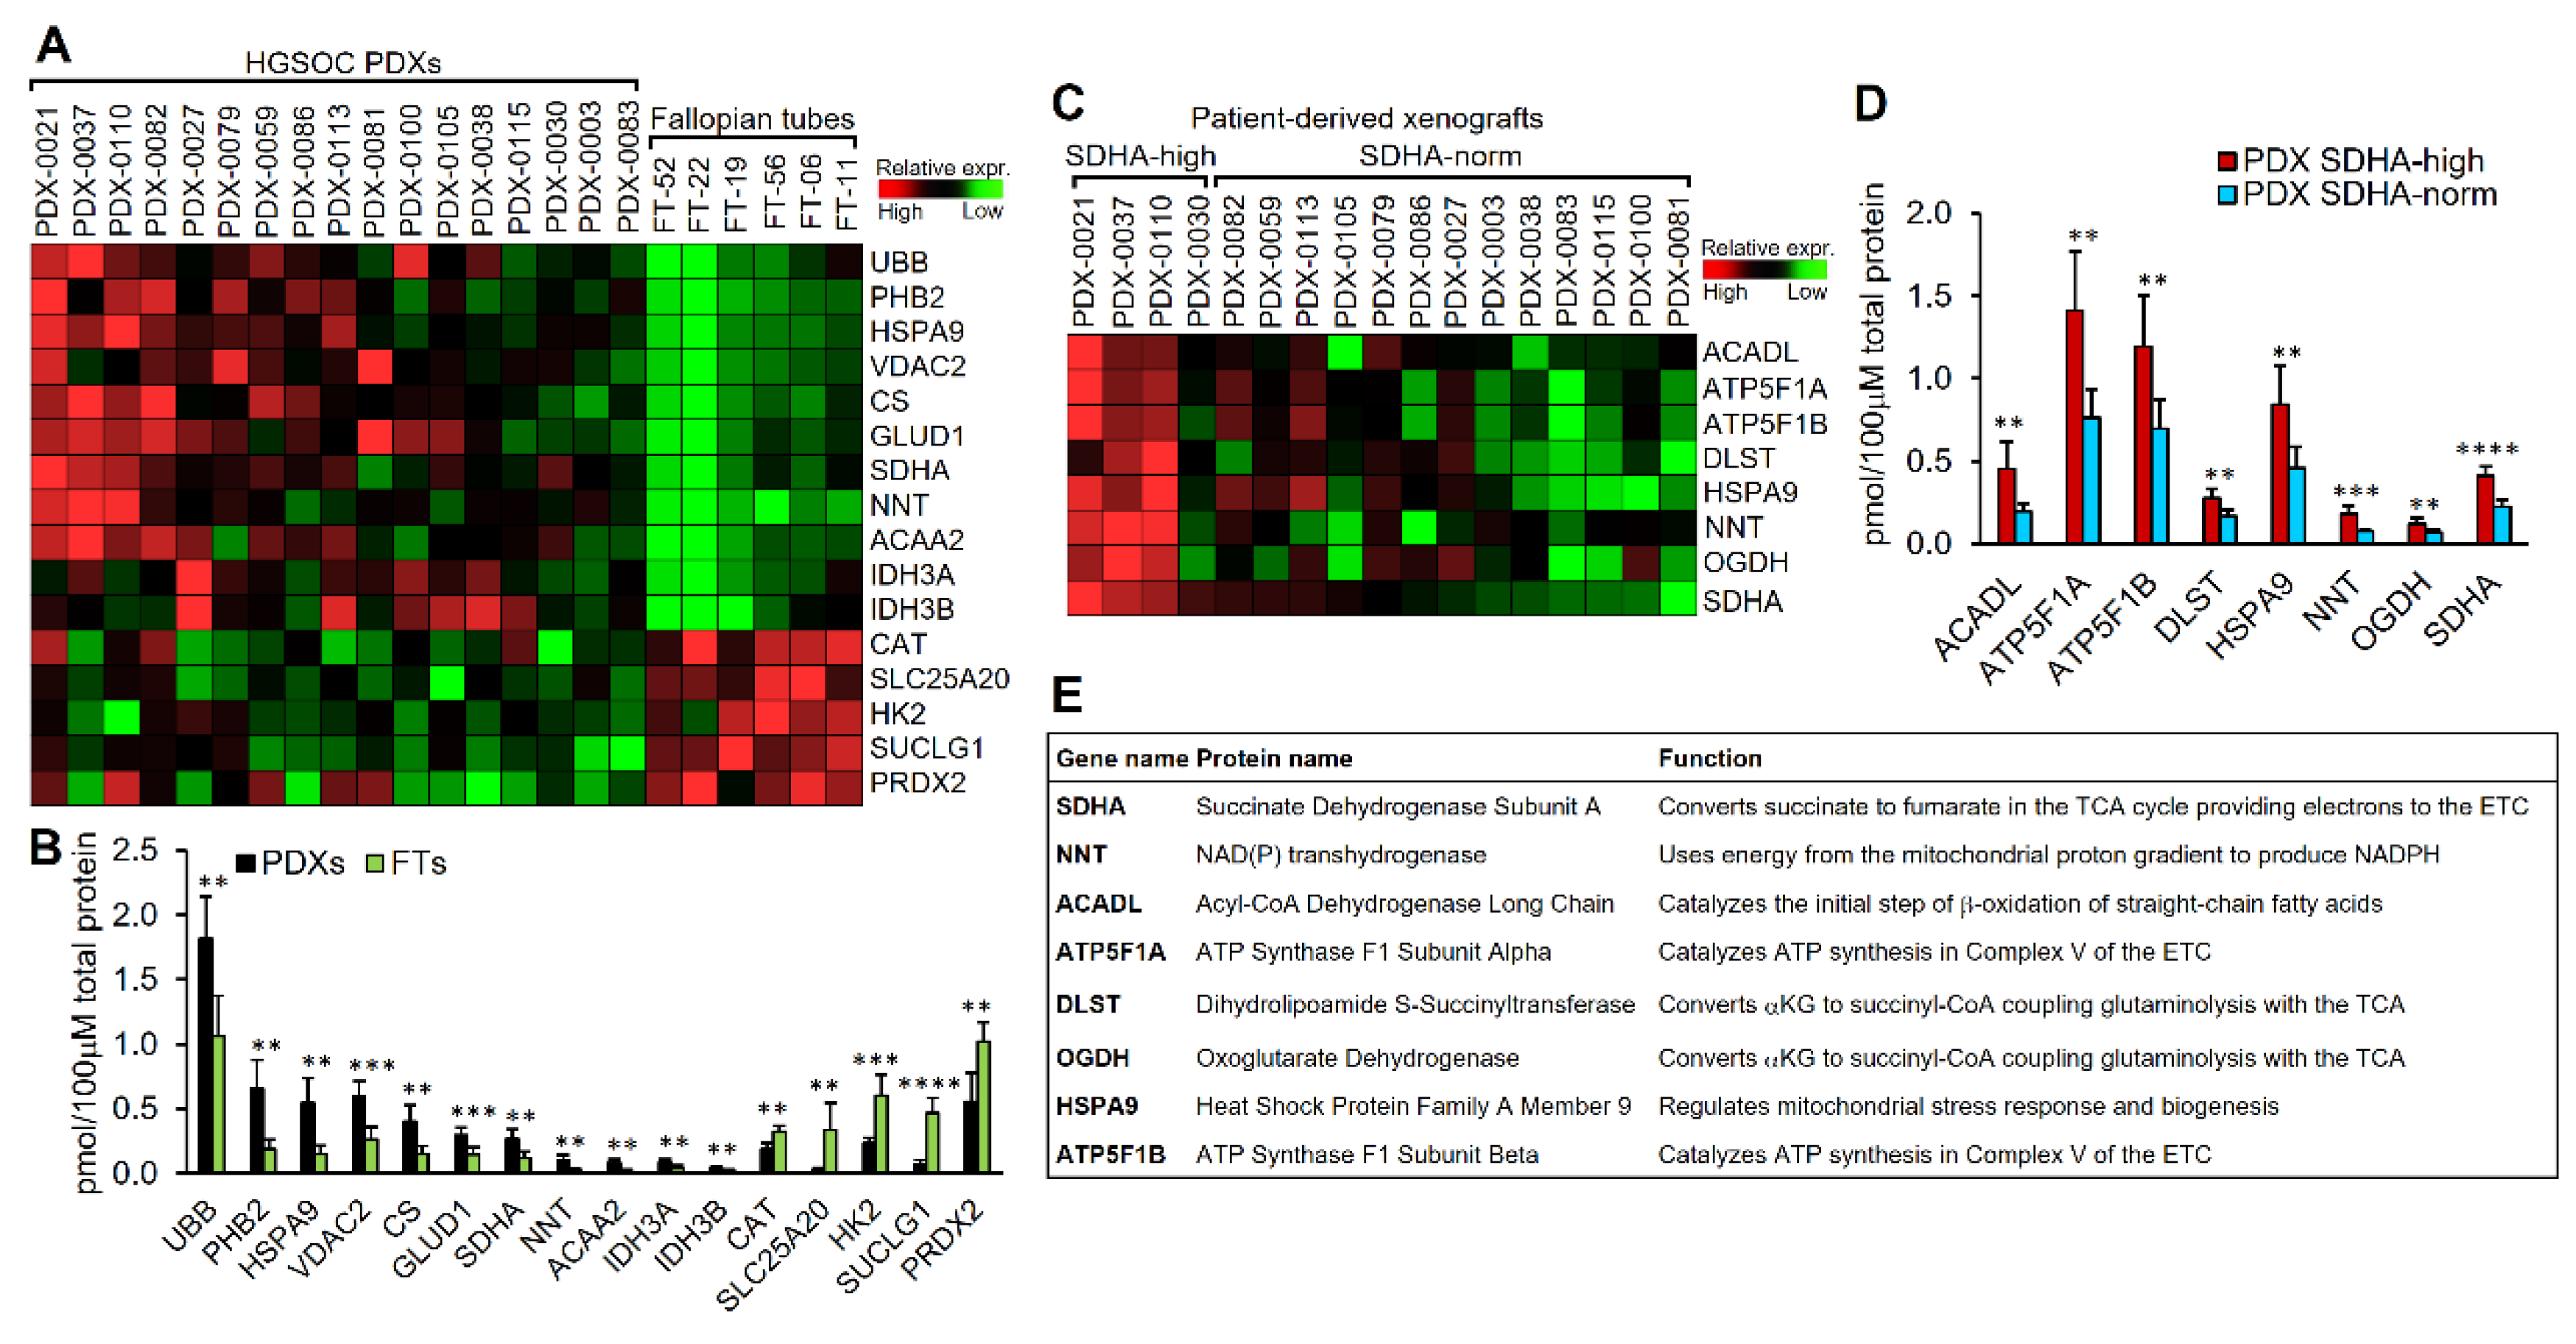
Figure 3.
Analysis of TCA cycle fluxes of [U13C]glucose and [U13C]glutamine. (A) The diagram represents the flux of metabolic intermediates derived from a single tracer [U13C]glucose via the TCA cycle in OVCAR4 cell lines. Red circles indicate 13C, while gray circles indicate 13C. (B) Graph represents the percentage abundance of the m+2 isotopomers within the TCA cycle metabolite pool in OVCAR4-SDHA vs. OVCAR4 control cells following tracing of [U13C]glucose (unpaired t test). (C) The percentage abundance of the m+4 isotopomers within the TCA cycle metabolite pool in OVCAR4-SDHA vs. OVCAR4 control cells following tracing of [U13C]glucose (unpaired t test). (D) The flux of metabolic intermediates derived from both tracers [U13C]glucose and [U13C]glutamine via TCA cycle in OVCAR4 cells. Red circles indicate 13C derived from glucose, while blue circles indicate 13C derived from glutamine. (E) The percentage abundance of the m+4 isotopomers within the TCA cycle metabolite pool in OVCAR4-SDHA vs. OVCAR4 control cells following parallel tracing of [U13C]glucose and [U13C]glutamine (unpaired t test). (F) The percentage abundance of the m+5 isotopomers within the TCA cycle metabolite pool in OVCAR4-SDHA vs. OVCAR4 control cells following parallel tracing of [U13C]glucose and [U13C]glutamine (unpaired t test). (B-C, E-F) Asterisks indicate level of statistical significance: ** P ≤ 0.01, ***P ≤ 0.001, NS not significant. Additional information regarding tracer studies is provided in Supplementary Figure S5.
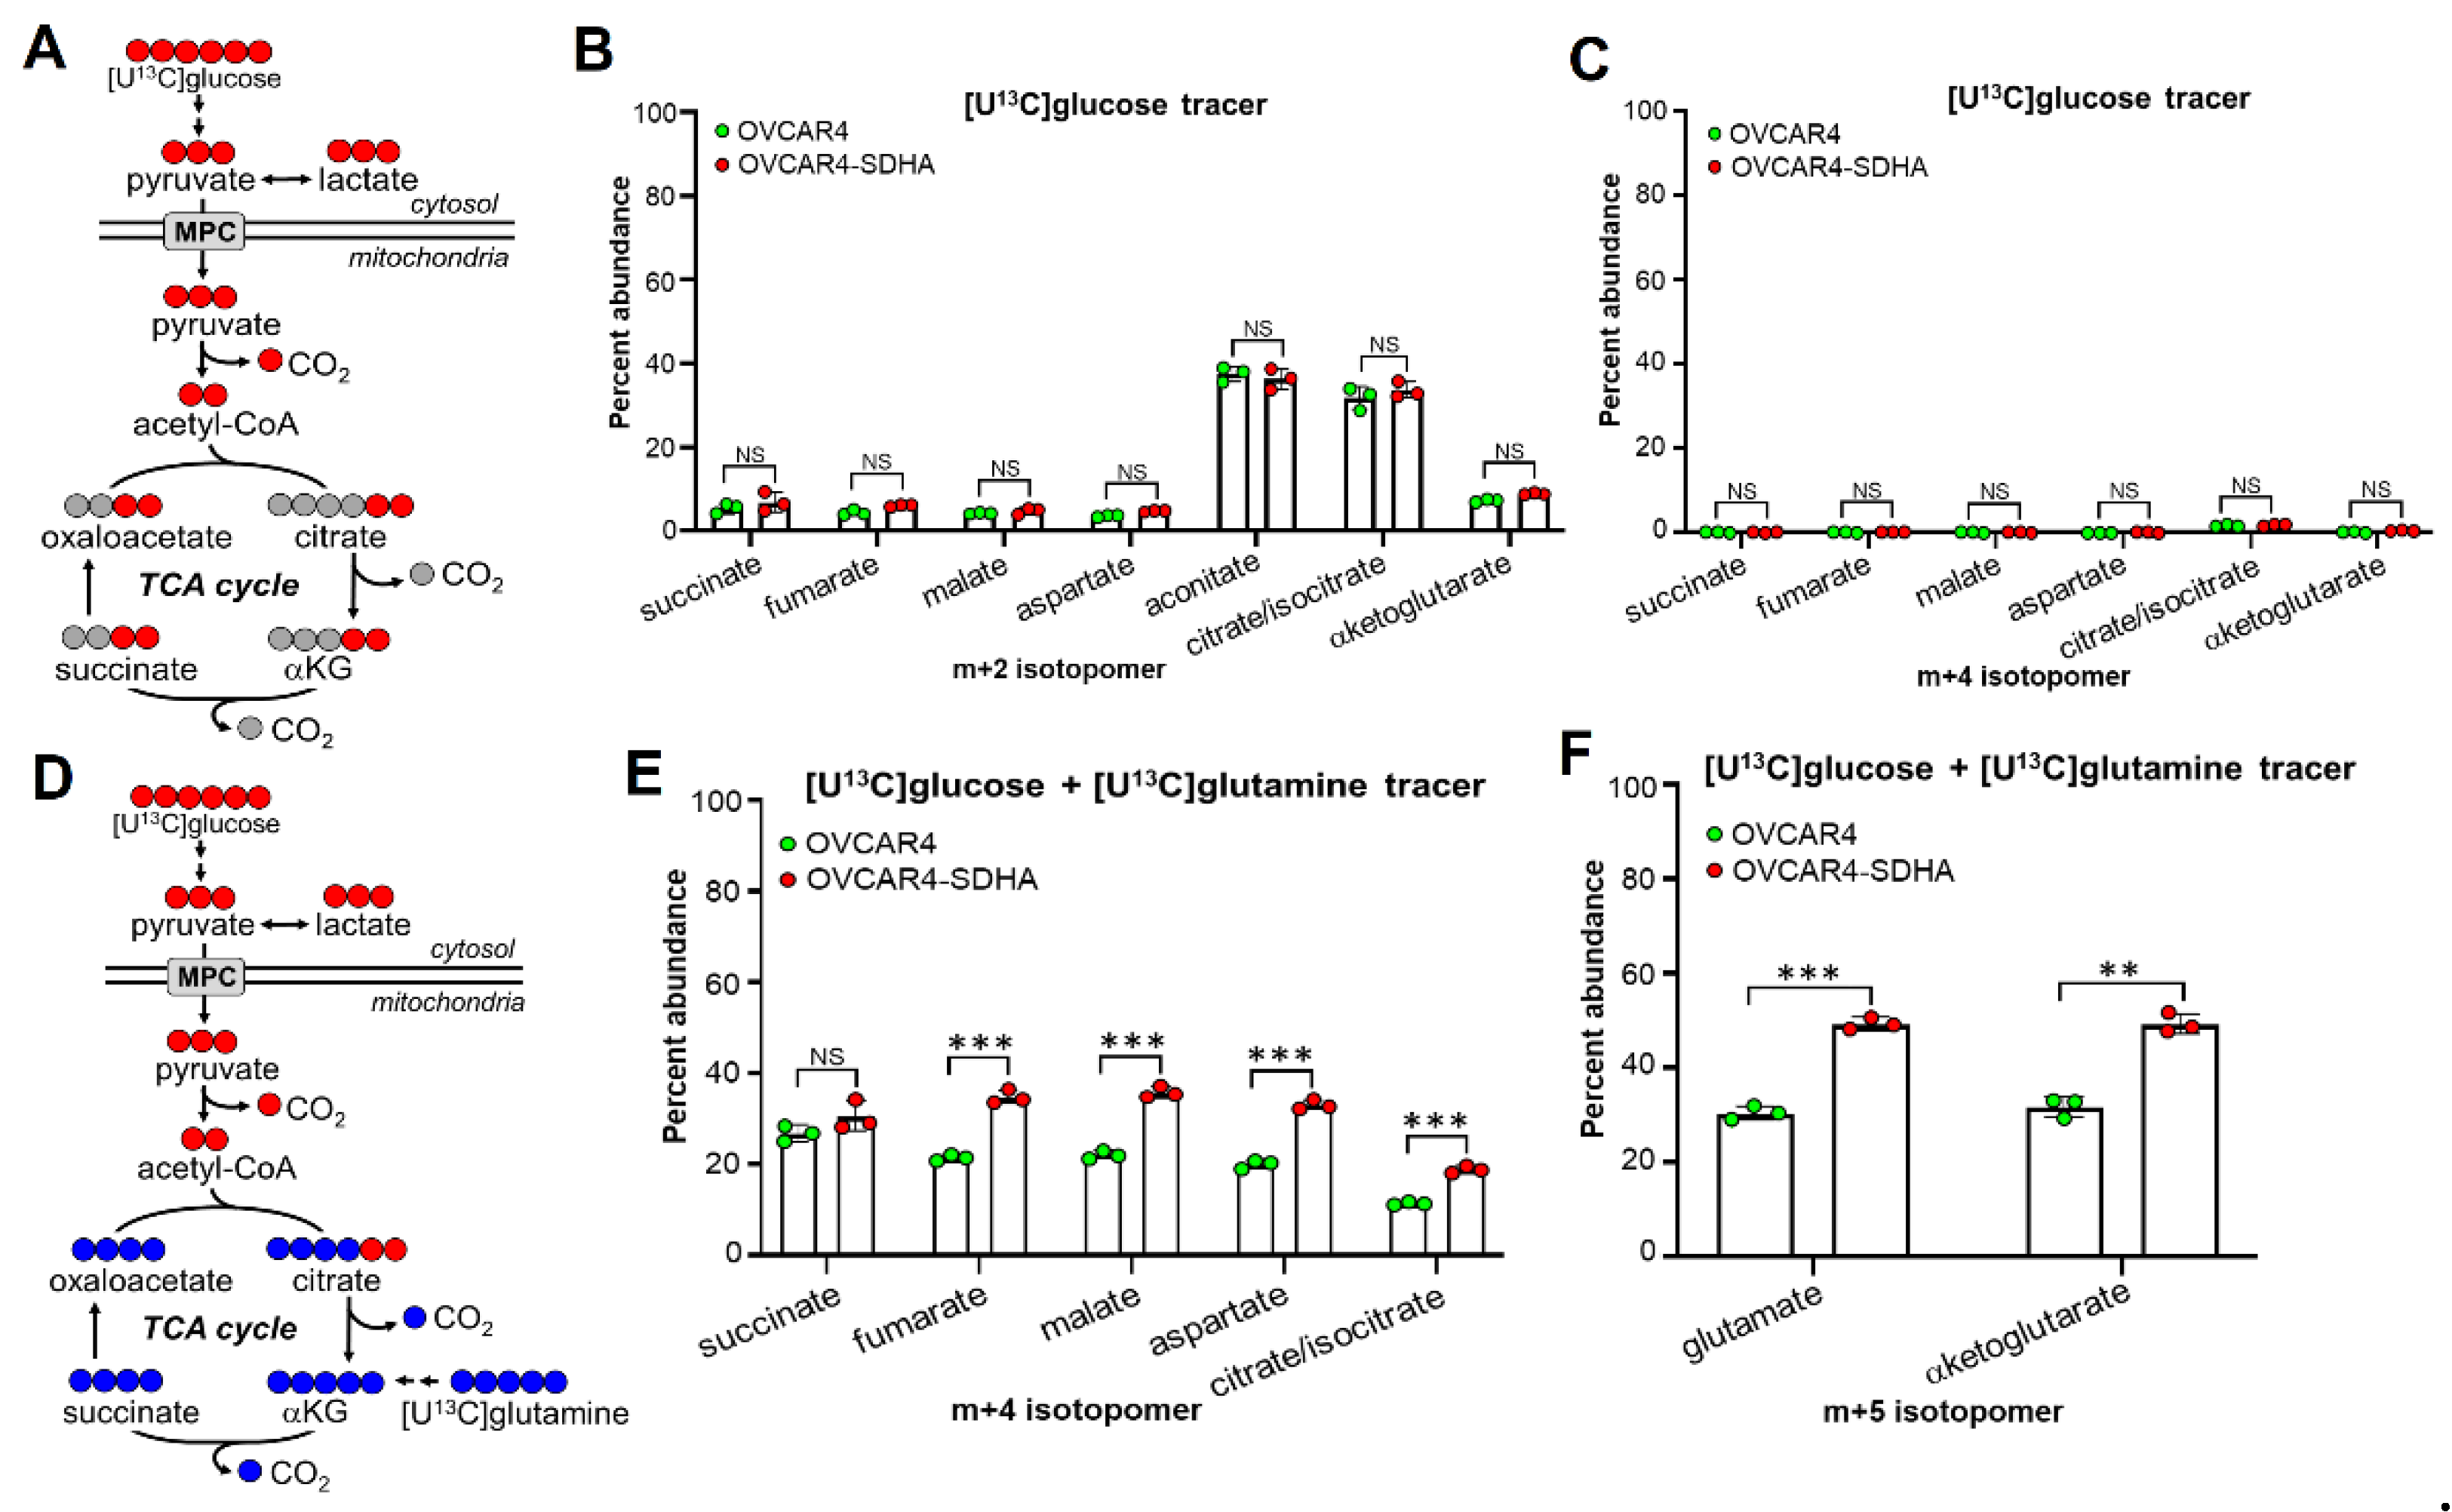
Figure 4.
Shikonin most strongly binds to LRPPRC protein. (A) MS-based shikonin’s target discovery study. Representative results with the use of SDHA overexpressing OVSAHO ovarian cancer cell line showing MASCOT score analysis of top-ranking shikonin-bound peptides (additional information is provided in the Supplementary Figure S6. (B) Validation of a direct binding of shikonin to LRPPRC protein assessed by pull-down assay using shikonin-conjugated ES6B and OVCAR4 cell extracts with and without addition of recombinant LRPPRC protein tagged with c-terminal Myc-DDK tags. The assay validated that the shikonin binds with high affinity to LRPPRC. (C) WES analysis of SDHA and LRPPRC levels in mFTE cell lines vs. normal mouse fallopian tubes (mFT) shows concomitate expression of SDHA and LRPPRC (GAPDH, loading control). (D) WES showed marginal levels of SDHA and LRPPRC in human fallopian tubes (FT-190, FT-194) and a high concomitant expression of SDHA and LRPPRC in human ovarian cancer cell lines. (E) WES detected marginal levels of SDHA and LRPPRC in hFTs and a high concomitant expression of SDHA and LRPPRC in a subgroup of HGSOC PDXs. (F) Assessment of Pearson correlation coefficient (r) revealed a strong positive correlation (r = 0.7654, P < 0.001) between SDHA and LRPPRC protein expression in HGSOC PDXs and hFTs. (G) The effects of LRPPRC-KD on SDHA and COX1 protein levels in mFTE cell lines assessed by WES. The LRPPRC-KD leads to a loss of LRPPRC and COX1 expression but has no effect on SDHA protein levels. (H) The effects of LRPPRC-KD or SDHA-KD in human ovarian cancer cell lines. The SDHA-KD is associated with loss of protein expression of both SDHA and LRPPRC, while LRPPRC-KD leads to a loss of LRPPRC and COX1 expression but has no effect on SDHA protein levels. (I) WES showing the expression of cleaved PARP (apoptosis marker), LRPPRC and GAPDH (loading control) in mFTE cell lines treated with 5 μM dose of shikonin for 24 h in vitro. Shikonin treatment leads to a loss of LRPPRC expression and triggers apoptosis. (J) WES showing the expression of cleaved PARP, LRPPRC and GAPDH in human ovarian cancer cell lines treated with 5 μM dose of shikonin for 24 h in vitro. Shikonin treatment leads to a loss of LRPPRC expression and triggers apoptosis. Uncropped blots are shown in Supplementary Figure S7).
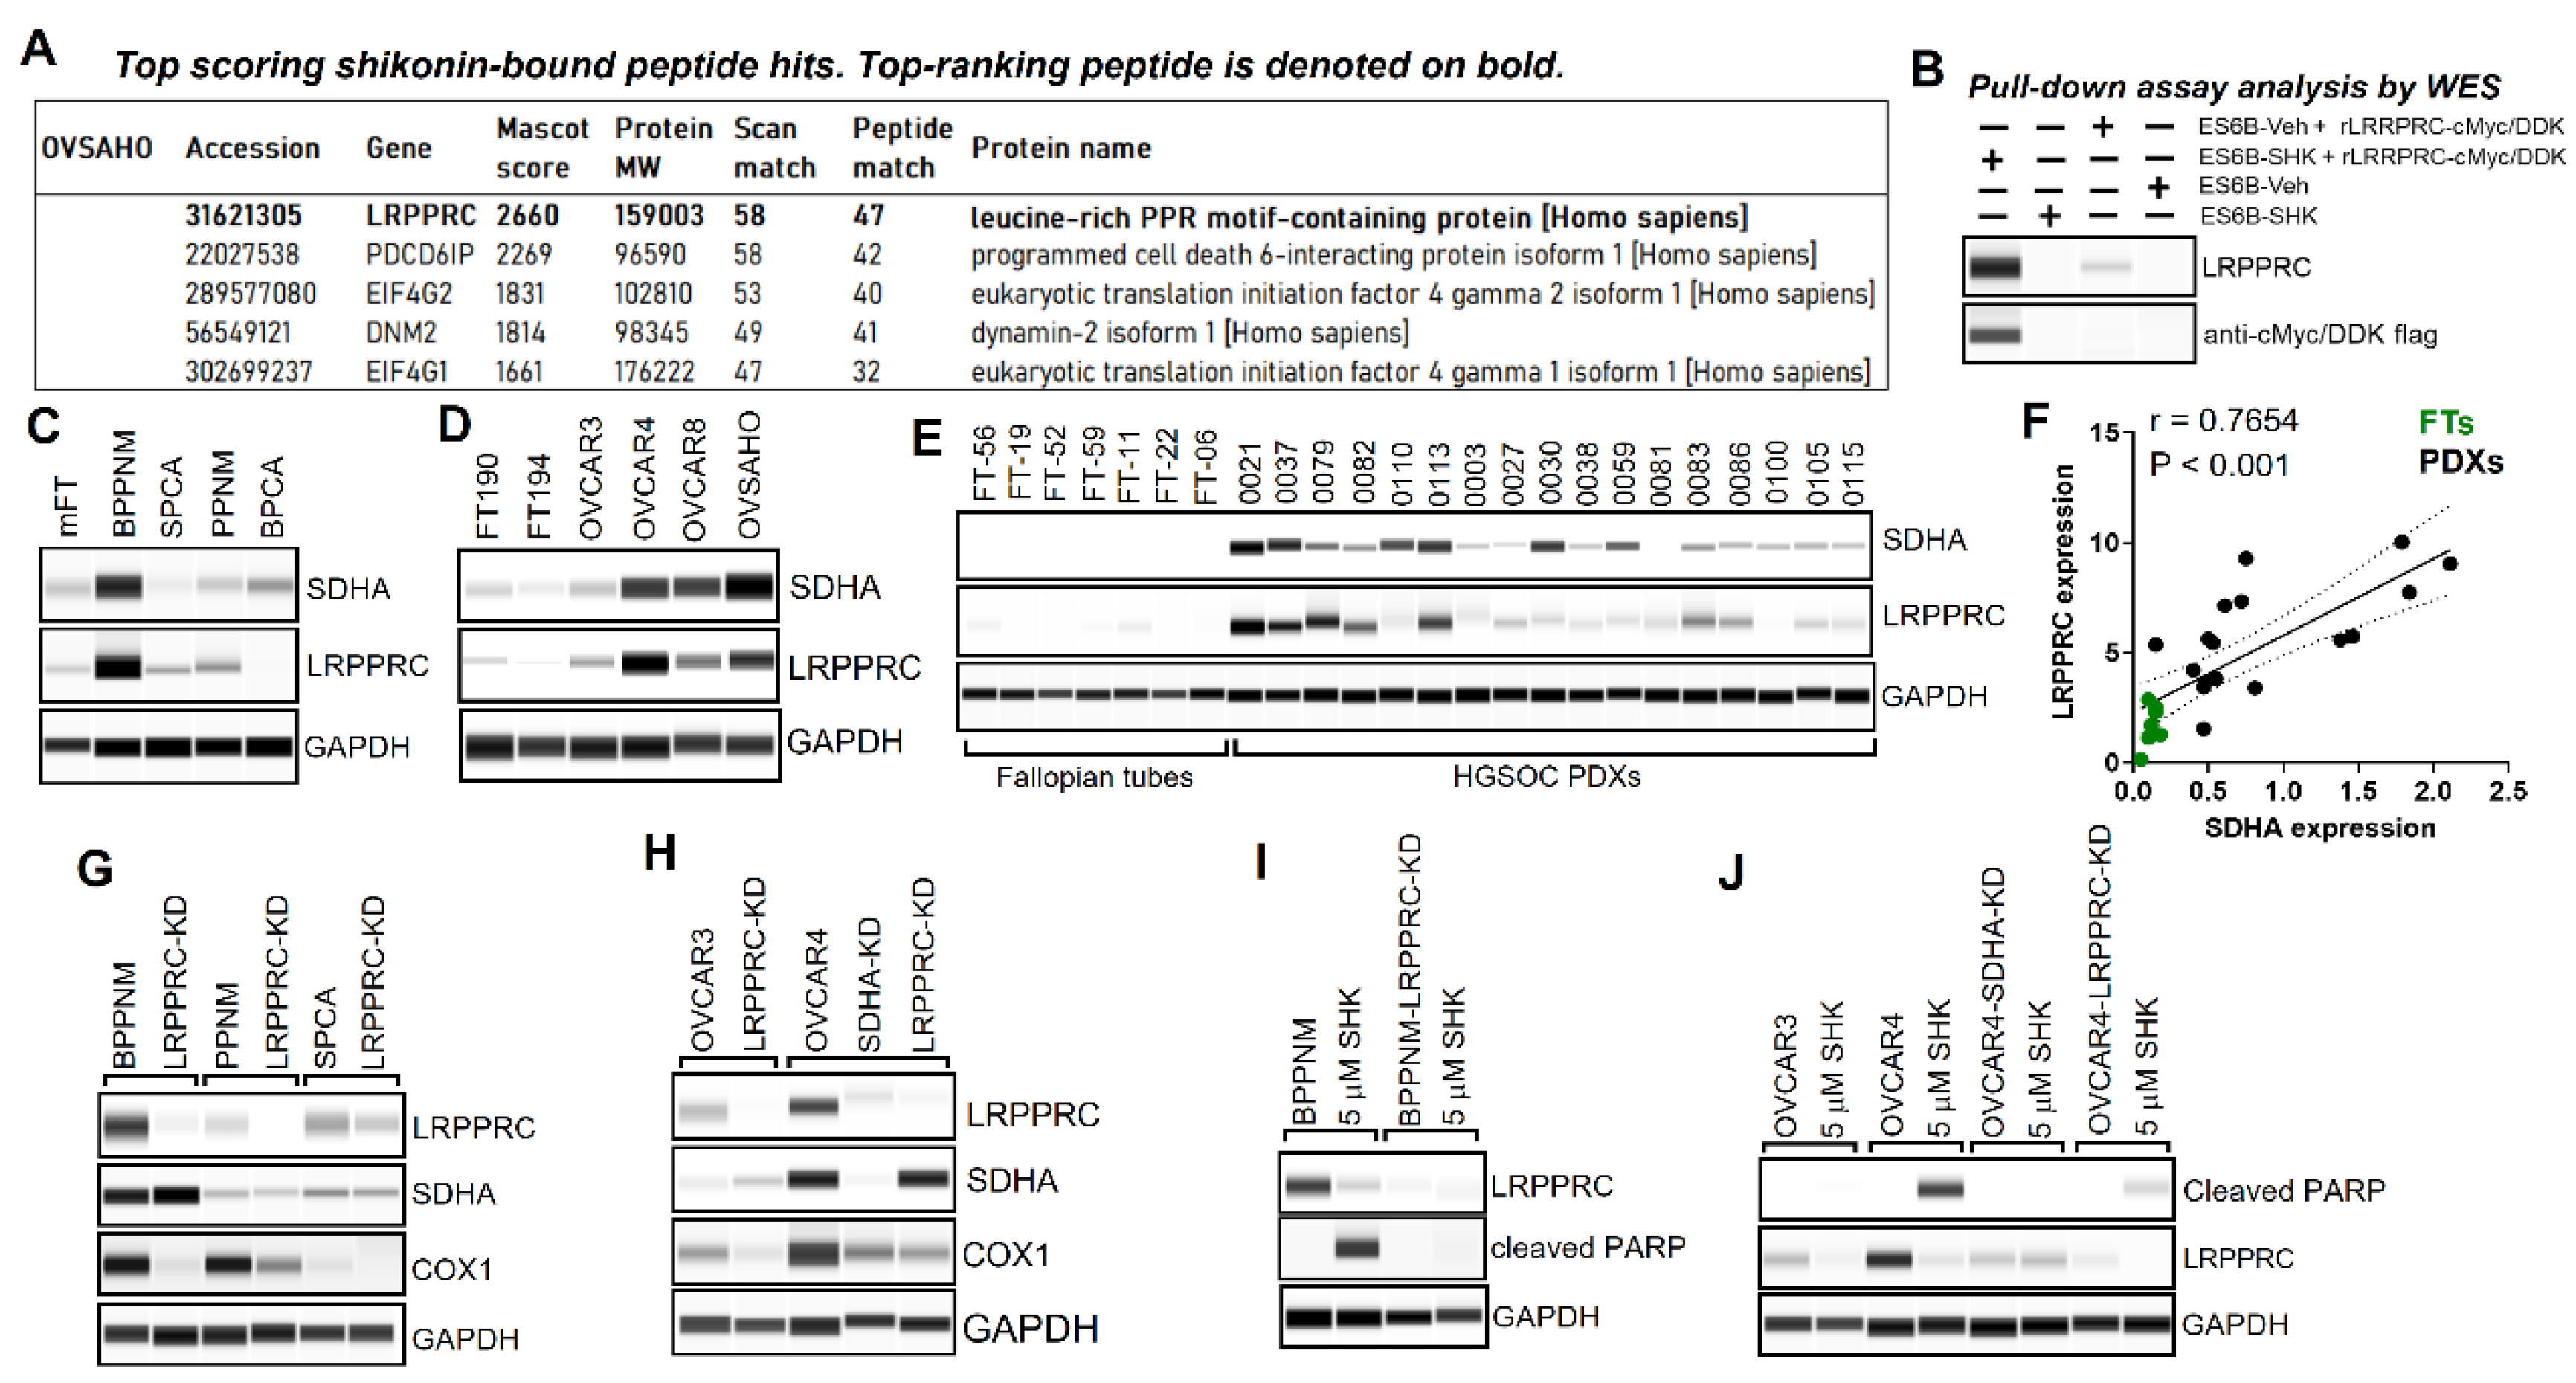
Figure 5.
Evaluation of the efficacy of shikonin vs. chemotherapy in ovarian tumor models expressing SDHA or SDHA and LRPPRC. (A) Graph (left) represents SDHA-high, LRPPRC-low PDX-0030 tumor growth rate in NRG mice. Animals were treated for 4 weeks with vehicle, shikonin, or cisplatin/paclitaxel chemotherapy, and followed for an additional 8 weeks for recurrence to investigate the long-term effect of the treatment. Graph (right) shows differences in average tumor volume between treatment groups at 12 weeks since treatment started. (B) Graph (left) represents SDHA-low, LRPPRC-low PDX-0038 tumor growth rate in NRG mice treated as in ‘A’. Graph (right) shows differences in average tumor volume between treatment groups at 12 weeks since treatment started. (C) Graph (left) represents SDHA-high, LRPPRC-high PDX-0113 tumor growth rate in NRG mice treated as in ‘A’. Graph (right) shows differences in average tumor volume between treatment groups at 12 weeks since treatment started. (A-C) Statistical analysis was performed using one-way Anova test. Asterisks indicate level of statistical significance: ** P ≤ 0.01, ***P ≤ 0.001, ****P ≤ 0.001, NS not significant. (D) WES analysis of ovarian PDXs assayed for SDHA, LRPPRC, and loading control aTubulin. (E) Kaplan-Meier curves showing % probability of survival of C57BL/6J female mice injected into ovary with 5x10⁵ SDHA and LRPPRC overexpressing BPPNM tumor cells. When tumors became palpable (~100 mm3) the animals started 4-week treatment with vehicle, shikonin, or carboplatin/paclitaxel chemotherapy. After therapy, mice were monitored for tumor growth, metastasis, and survival. The overall survival was assessed by Kaplan Meier method and Log-Rank Mantel-Cox test. Additional information is provided in Supplementary Figure S9.
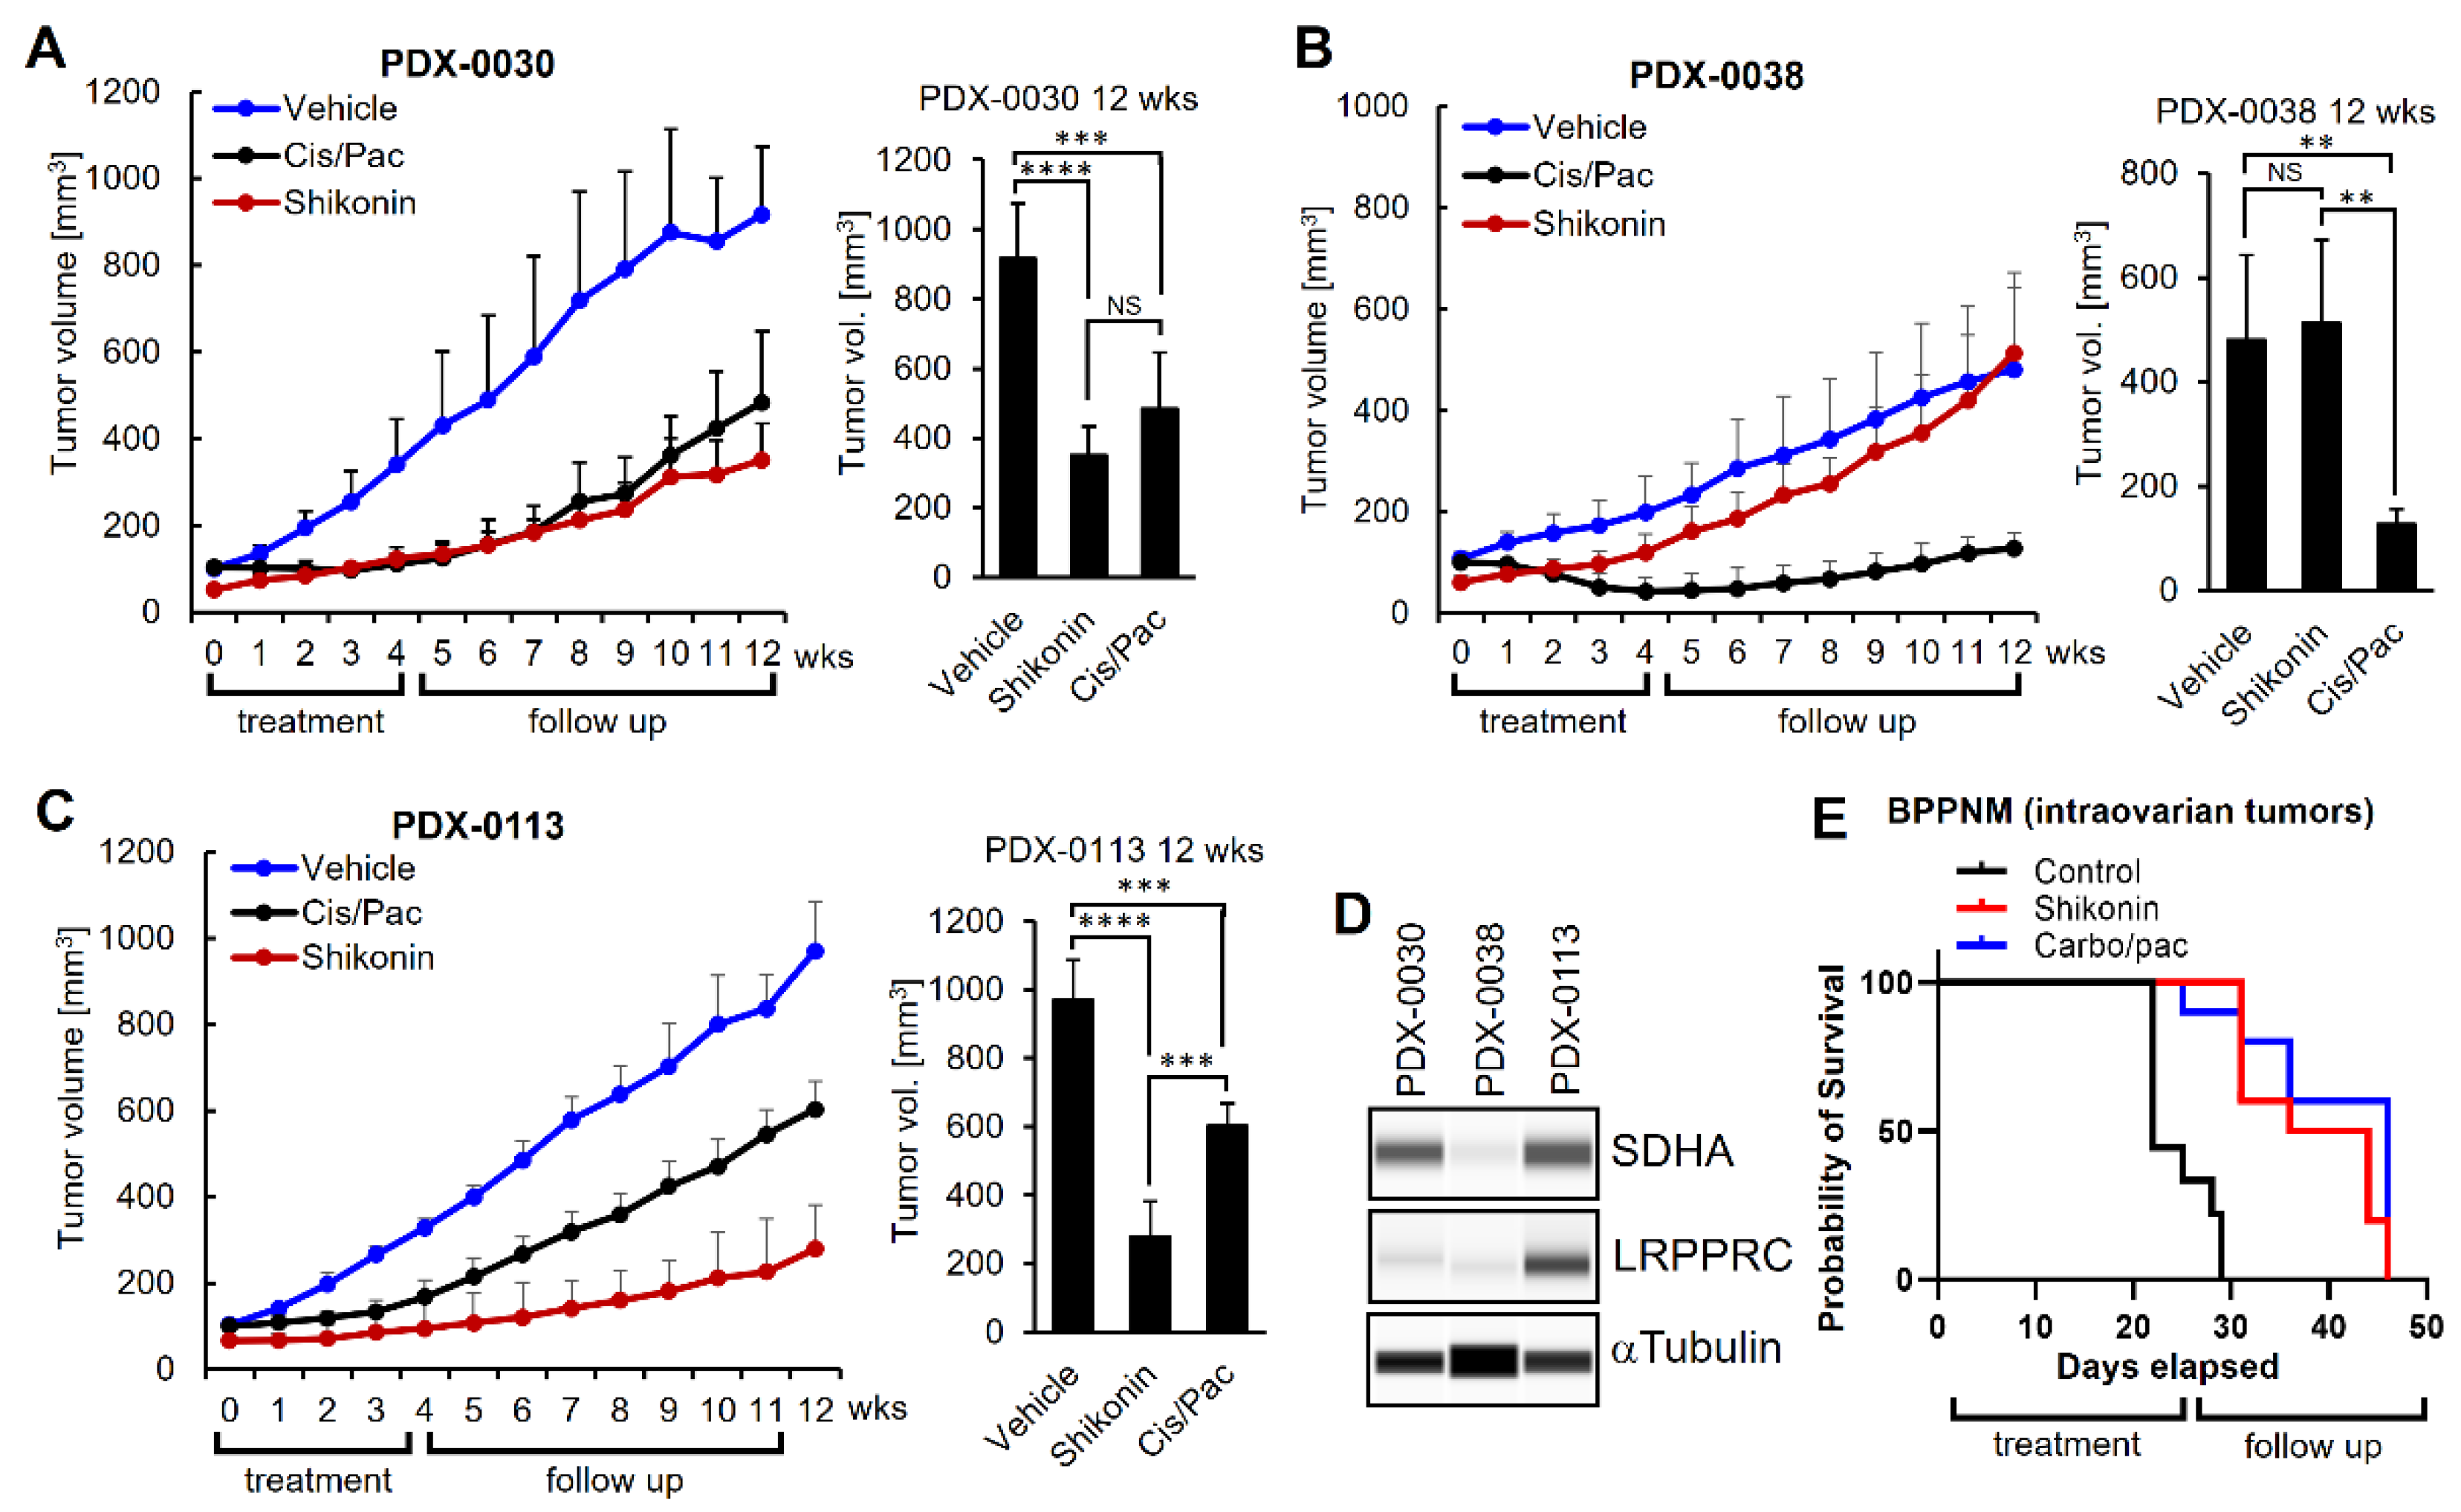
Disclaimer/Publisher’s Note: The statements, opinions and data contained in all publications are solely those of the individual author(s) and contributor(s) and not of MDPI and/or the editor(s). MDPI and/or the editor(s) disclaim responsibility for any injury to people or property resulting from any ideas, methods, instructions or products referred to in the content. |
© 2025 by the authors. Licensee MDPI, Basel, Switzerland. This article is an open access article distributed under the terms and conditions of the Creative Commons Attribution (CC BY) license (http://creativecommons.org/licenses/by/4.0/).
Copyright: This open access article is published under a Creative Commons CC BY 4.0 license, which permit the free download, distribution, and reuse, provided that the author and preprint are cited in any reuse.


