Submitted:
16 May 2025
Posted:
17 May 2025
You are already at the latest version
Abstract
In recent years, there has been a growing interest in the use of forest raw materials to develop new products for the textile industry, focusing mainly on their use as a source of fibres. In addition to fibres, the forest industry produces many by-products, such as bark, branches and leaves, which have interesting applications in the textile sector, mainly as a source of natural dyes or as finishing products for textiles. The textile industry also requires new products with very different charac-teristics, to be used in conditions as diverse as the production of shoes, bags, jackets, thermal clothing and articles for the automotive industry, among others. These products have traditionally been made from leather, which is obtained from animal hides. However, leather production has come under enormous pressure due to sustainability concerns in various areas and the growing number of people who actively choose to avoid all animal products. The main solutions developed by the textile industry have been to apply synthetic coatings based on polyvinyl chloride (PVC) or polyurethane (PUR) to textile substrates. One of the ways to reduce the environmental impact and non-renewable content of artificial leather is to replace parts of the synthetic component with lig-nocellulosic by-products. In addition, lignocellulosic by-products could be used to add functionali-ties to textile products. The feasibility of using small branches and leaves of Eucalyptus globulus (BLE) as a component of an aqueous PUR formulation for coating textile products was evaluated. Recent works demonstrated that BLE particles had interesting antioxidant properties. The effect of the BLE particle size distribution in the PUR formulation and on the properties of the coated textile products was evaluated. The BLE particles and their size influenced the colour, appearance, hydrophobicity and mechanical properties of the coated textiles, demonstrating the industrial applicability of the process. Furthermore, the textiles coated with the BLE particles showed interesting antioxidant properties.

Keywords:
biomass
; functional textiles
; Vegan textiles
; coated fabrics
; natural fibres
; antioxidant
; FTIR-ATR
1. Introduction
In recent years, the use of forest raw materials to develop new products for the textile industry has gained interest due to environmental concerns. The main advances have been in the use of eucalyptus wood to produce a semi-synthetic fibre called Lyocell. However, the forestry industry produces a large quantity of by-products, mainly bark, branches and leaves. The valorisation of eucalyptus bark has been studied previously with interesting applications in substrates for the germination of plants[1,2], in wood-based panels [3,4], or for insulation solutions [5]. However, small branches and leaves (BLE) do not have the same interest and are left in the forest without further valorisation.
Recent research published by our research team has shown that it is possible to use BLE particles as a raw material to obtain extracts that allow dyeing and functionalizing cotton fabrics[6].
The textile industry is always demanding new products with very differential characteristics to be used in conditions as diverse as in the production of shoes, bags, jackets, thermal clothing, items for the automobile industry, among others.
Historically, these kinds of products were made from leather obtained from the skins of animals. However, the production of leather has been under enormous strain due to worries about sustainability in various fields (due to greenhouse gas emissions from livestock farming), and the rising number of people, who choose to actively eat meatless or abstain from all animal products[7]. As a result, alternative vegan alternatives have become necessary.
The main solutions developed by the textile industry were the application of synthetic coatings based on polyvinyl chloride (PVC) or polyurethane (PUR) on textile substrates. One of the possibilities to reduce the environmental impact and non-renewable content of artificial leather is to replace parts of the synthetic component with products derived from agricultural lignocellulosic by-products.
In this way, interesting commercial solutions were developed using materials such as grape (Vegea SRL), apple, lemon or barley skin (Vegatex Biotech (HK) LTD.), or grape pomace (Tintex textiles)[7]
However, few published studies have focused on evaluating the impact of industrial waste or by-products on textile coating formulation and the produced coated textile products [8,9,10].
In terms of research focusing the incorporation of forestry by-products into textile coatings, recent work has demonstrated the potential of radiata pine sawdust as a component of textile coatings[11]. However, to the best of our knowledge, no study has been published evaluating the impact of BLE particles as a component of coating textile formulations.
The incorporation of a lignocellulosic material into a polymeric formulation, such as the PUR textile coating formulation, will mainly affect the rheological properties of the formulation and its reactivity. In addition, the variability of lignocellulosic by-products in chemical composition and morphology, due to their natural origin, necessitates a deeper understanding of the effect of the particles on the properties of the coating formulation, on the production process and on the properties of the final coated textile products, in order to ensure the reproducibility required for industrial application.
Aqueous dispersions of waterborne polyurethanes (WPUs) are widely used in textile applications and were the solution adopted in the study. Waterborne polyurethanes are less toxic and more environmentally friendly than their solvent-based counterparts as they contain no hazardous volatile organic compounds [12]. For this reason, companies with strong environmental commitments choose to use these WPUs as the main components for textile coating formulations.
Lignocellulosic by-products are mainly composed of cellulose, lignin and an extractable fraction, the nature and composition of which will depend on the nature of the by-product and the extraction conditions used[4].
Incorporation of the lignocellulosic by-product into the water-based textile coating formulation is achieved by mixing it with the WPU solution under continuous stirring. The extractable compounds present in the lignocellulosic material are “extracted” and migrate into the water-based WPU solution, changing the colour, the rheology, reacting with the polymeric components or imparting special properties to the coated textile product, such as antioxidant or antifungal properties.
Recent work carried out by the research group has shown that BLE particles contain approximately 19-25% water-extractable components, mainly hydrolysable tannins, sugars and, to a lesser extent, condensed tannins[6]. The antioxidant properties of hydrolysable and condensed tannins are well known [13,14,15] and the possibility of transferring them to the textile product has been demonstrated by using BLE extracts to dye cotton fabrics[6]. In this case, it was expected that functional antioxidant textile products could be obtained by incorporating BLE particles into the coating textile formulation. Functional textile products with antioxidant properties have applications in the production of medical, food packaging and sports textiles [16,17].
In this study, the BLE particles were air-dried, milled and sieved to obtain five fractions with different particle size distributions. The morphology of the BLE particles and their thermal behaviour were characterised by SEM-EDS and TGA techniques. FTIR spectroscopy was used to analyse the effect of particle size on the chemical nature of the BLE samples. In addition, the stability of the BLE particles was tested by analysing the phenolic, sugar and protein content of the BLE particles and their evolution with storage time. The cotton fabrics were coated with a polymer formulation based on the BLE particles and an aqueous polyurethane solution.
Therefore, this study has focused on the production of coatings for the textile industry incorporating BLE particles. The aim is to valorise the BLE particles, reduce the synthetic polymers used and obtain coated textile products with different properties in terms of appearance, colour and feel. In addition, the BLE was expected to impart interesting antioxidant properties to the final product [18].
2. Materials and Methods
2.1. Raw Material
The branches and leaves of E. globulus (BLE) were collected from a forestry plantation in Ponteareas (Galicia, NW Spain) (42°11’22.5”N 8°31’55.6”W) just after the felling. The BLE was air-dried until attaining the moisture content (10.3 ± 0.9 % (105°C)) and then was grounded in a cutting mill (Retsch, Haan, Germany) with a 1 mm sieve. Afterwards, the BLE particles were sieved in a vibratory sieve shaker (Retsch, Haan, Germany) and was obtained 6 samples with different particle size distribution: BLE32 (<32 µm), BLE32 (<32 µm), BLE63 (32-63 µm), BLE125 (63-125 µm), BLE200 (125-200 µm), BLE500 (200-500 µm).
Samples of different particle size distributions were prepared to evaluate their influence on the physical and mechanical properties of the coated fabric.
2.2. Fourier Transform Infrared Spectroscopy (FTIR) Assay
FTIR spectra were recorded on a VERTEX 70 FTIR spectrometer (BRUKER, Billerica, MA, USA) equipped with a high sensitivity DLaTGS detector at room temperature.
Samples were measured in ATR mode using an A225/Q PLATINUM ATR diamond crystal with a single reflection accessory. Spectra were recorded from 4000 to 400 cm-1 with a resolution of 4 cm-1. All spectra were recorded and processed using OPUS 7.0 software.
2.3. Scanning Electron Microscopy
The surface morphology of the BLE particles and of the cotton fabrics coated with them was evaluated by SEM analysis. The cross-section and the surface of the coated cotton knits were scanned at different places on the sample using a Phenom XL Scanning Electron Microscope (SEM, Thermo Fisher Scientific, Waltham, MA, USA), at 250 and 2000 × magnifications. Before analysis, the samples were sputtered with a gold–palladium (Au-Pd) layer to ensure conductivity. Energy Dispersive Spectroscopy (EDS) was used to analyse the chemical composition of the BLE particles and of the cotton fabrics coated with them.
2.4. Chemical Characterization of BLE Particles
2.4.1. Phenol Content (Folin Ciocalteu)
The Folin–Ciocalteu method is based on the formation of a blue-colored complex resulting from the reaction between phenolic compounds and the Folin–Ciocalteu reagent in an alkaline medium. In this assay, 0.25 mL of sample were mixed with 15 mL of distilled water and 1.25 mL of diluted Folin–Ciocalteu reagent (1:10 v/v). After 8 minutes of reaction in the dark, 3.75 mL of sodium carbonate solution (75 g/L) were added, and the volume was brought to 25 mL with distilled water. The mixture was homogenized and incubated at room temperature, protected from light, for 2 hours. Absorbance was then measured at 760 nm using a P9 UV/VIS double-beam spectrophotometer. A calibration curve was constructed using gallic acid standards in the range of 0 to 600 mg/L, and the total phenolic content was determined from this curve. Results were expressed as grams of gallic acid equivalents per 100 grams of dry extract (g GAE/100 g dry extract)[19].
2.4.2. Sugar Content (Anthrone Method)
The quantification of reducing sugars was carried out using the anthrone method, which is based on the formation of a green-blue chromogenic complex resulting from the reaction between anthrone and carbohydrates under strongly acidic and high-temperature conditions. In this method, 2 mL of sample were added to 4 mL of cold sulfuric acid solution (75%). Then, 8 mL of freshly prepared anthrone solution were added. The tubes were sealed, vortexed, and heated in a boiling water bath (100 °C) for 15 minutes. After cooling to room temperature, absorbance was measured at 620 nm using a P9 UV/VIS double-beam spectrophotometer. A calibration curve was constructed using glucose standard solutions ranging from 10 to 100 mg/L, and the concentration of reducing sugars in the samples was determined from the curve. Results were expressed as grams of glucose equivalents per 100 grams of dry extract (g GE/100 g dry extract).
2.4.3. Protein Content (Lowry Method)
The Lowry method is based on the reaction between peptide bonds and copper ions under alkaline conditions, followed by the reduction of the Folin–Ciocalteu reagent by aromatic amino acids such as tyrosine and tryptophan, forming a blue-colored complex. To perform the assay, 1 mL of NaOH solution (2 N) was added to 1 mL of the sample, and the mixture was hydrolysed at 100 °C for 10 minutes. After cooling to room temperature, 10 mL of freshly prepared Lowry reagent were added, and the solution was left to stand for 10 minutes in the dark. Then, 1 mL of Folin–Ciocalteu reagent (1 N) was added, followed by vortexing. The reaction mixture was incubated at room temperature for 30–60 minutes, protected from light. Absorbance was measured at 750 nm using a P9 UV/VIS double-beam spectrophotometer. The calibration curve was established using bovine serum albumin (BSA) standards in the concentration range of 0 to 1000 ppm. Results were expressed as grams of BSA equivalents per 100 grams of dry extract (g BSA/100 g dry extract).
2.4.4. Extraction Yield
The extraction experiments were performed in an ultrasonic bath (Sonorex Super RK 512 H, Bandelin, Berlin, Germany) with temperature control. BLE particles were mixed with water (solid/liquid ratio was fixed at 1/10 (w/w)) in a closed bottle (500 mL) and placed in the ultrasonic bath (frequency 35 kHz) that previously was set at the temperature of 80 °C. After 30 min contact, the suspension was vacuum filtered, and the solid residue was washed with water until a nearly colourless filtrate was obtained. The liquid fraction was used to evaluate the phenolic, sugar and protein content, and the solid fraction was used to evaluate the extraction yield.
The extractions were performed in triplicate, and the analysis results (phenolic content, sugar content, protein content and extraction yield) were averaged.
The extraction yield was evaluated by drying the solid fraction obtained after the extraction in a laboratory oven for 24 hours at (60.0 ± 1.0) °C. The test was performed in quintuplicate, and the results were averaged.
The extraction yield was determined as the difference between the dry material weight at the start of the process and the dry material weight at the end of the process (Eq. 1).
2.5. Coating of Cotton Fabrics with BLE Particles
For the coating formulation, an industrial textile coating formulation was used as a standard (PB) and the effect of the addition of the BLE samples (of different particle size distribution) was evaluated by replacing a percentage of the formulation components with the BLE particles (Table 1).
The coating formulations were prepared in an open beaker of 1000 ml, stirred by a mechanical stirrer (IKA Eurostar 20) equipped with a propeller stirrer, 4-bladed. The different components of the formulation, i.e. aqueous solution of polyurethane (WPU), blocked isocyanate and rheological additives, and BSG particles (when necessary) were added one by one, waiting to obtain a homogeneous mixture in each step.
Subsequently, the coating formulation was foamed for 1.5 min to obtain a stable foam.
The coating formulation with and without the BLE particles was applied on the textile substrate using a scraper to give uniformity to the coatinginute. Subsequently, the coated textile was dried at 100°C for 4 m s in a LABDRYER type «LTE» (WERNER MATHIS AG, Oberhasli, Switzerland). The dried coated textile was pressed in a single application compact calender H02 (MONTI ANTONIO S.P.A. Thiene, Italy), and the polymerisation process was performed in the same lab-dryer equipment at 150 °C.
2.6. Coated Fabrics Characterisation
2.6.1. Colour and Color Fastness Evaluation
The evaluation of colour coordinates was performed with a Ci7600 Sphere benchtop spectrophotometer (X-rite Grand Rapids, Michigan) using the CIELab colour coordinate system. Colour coordinates: L* (black/white axis; a direct measure of lightness), a* (red/green axis) and b* (yellow/blue axis) were measured five times for each sample, and the mean values of the measured coordinates were used. The values of the total colour difference (ΔE), and the variation of the colour coordinates ΔL*, Δa* and Δb*, were calculated to assess the impact of the BLE samples used in the textile coating formulation(ΔE). The total colour differences were calculated according to the following equation (Eq.2):
Where L0*, a0* and b0* are the colour coordinates values of the PB textile coating produced only with the WPU formulation, and L1*, a1* and b1* are the colour coordinates of the coated textile products produced incorporating the BLE particles.
The light fastness of the coated fabrics was also assessed. For this purpose, the samples were placed in laboratory equipment to study the effect of visible light (2000 lumen, 6500 K lamp) on the coated fabrics. The samples were exposed to light for one week and the values of the chromatic coordinates were measured after the light treatment.
To evaluate the colour lightfastness of the samples the total colour difference (ΔE), and variation of colour coordinates values ΔL*, Δa* and Δb*, regarding the original samples were calculated using the following equation (Eq.3):
Where LBLEx*, aBLEx* and bBLEx* are the colour coordinates values of the original coated cotton knit untreated, and LBLExT*, aBLExT* and bBLExT* are the colour coordinates of the same coated cotton knit after the light treatment.
2.6.2. Surface Wettability
Contact angles of water and hexane on the materials’ surfaces were measured. Contact angles were measured using a Dataphysics OCA 20 Plus (Filderstadt, Germany) equipment, equipped with a single direct dosing system SDDM, and the data were analysed with the Dataphysics software SCA 20. A 4 μl drop was added over the coated textile surface and the contact angle after 120 s was measured. For each solution, five measurements were performed, and the results were averaged.
2.6.3. Differential Scanning Calorimetry (DSC)
DSC analysis was performed on a NETZSCH DSC instrument (214 Polyma, Selb, Germany). Samples (7 ± 3 mg) were sealed in non-hermetic aluminium pans, crimped with an inverted cover. The temperature range was scanned from 25 °C to 500 °C with a 10 °C min− 1 heating rate. Temperature and enthalpy calibrations were performed using indium calibration standards (purity > 99.999 %).
2.6.4. Simultaneous Thermal Analysis (STA)
TGA and DSC analyses were performed using a simultaneous NETZSCH STA 449 F3 Jupiter® thermal analyser which allows measurement of mass changes (Thermogravimetric Analysis (TGA)) and thermal effects (Differential Scanning Calorimetry (DSC)). The technique was used to evaluate the thermal degradation of BLE particles using an atmosphere of N2 at a heat rate of 10 K /min from 50 to 800 °C, and was also used to characterise the thermal behaviour of coated and uncoated textile samples by heating the samples at a rate of 10 K/min under air flow between 25 °C and 500 °C.
2.6.5. Evaluation of Antioxidant Capacity of the Fabrics
DPPH (2,2-diphenyl-1-picrylhydrazyl) Assay
A 10 mL solution containing 0.1 mM DPPH was added to 50 mg of each textile sample (Uncoated and coated with the WPU formulation alone (PB) and with the BLE particles (BLE32-200)), which was then incubated at room temperature in the dark for 1, 2, 4 and 6 h to evaluate the textile product antioxidant activity. The absorbance of the solutions at predefined time intervals at a wavelength of 515 nm was measured using a VWR® P9 UV/VIS Double-Beam Spectrophotometer. The following equation (Eq. 4) was used to determine the antioxidant efficiency.
where the control was the DPPH solution incubate without sample.
FRAP essay
To evaluate the antioxidant activity of the uncoated fabrics and those coated with the WPU formulation alone (PB) and with the BLE particles (BLE32-200) using the FRAP method, samples of (1.0 ± 0.1) g of the fabric were cut and mixed with 25.0 ml of NaOH (1M) solution in a sealed bottle (50 ml). The bottles were then placed in an ultrasonic bath (Sonorex Super RK 512 H, Bandelin, Berlin, Germany) (frequency 35 kHz), which had previously been pre-set at 80 °C. After 60 minutes of contact, the suspension was vacuum filtered, the fabric was washed with water and dried in an oven (60 ± 5 °C) for 24 h. The liquid fraction was used to evaluate the antioxidant activity using the FRAP method.
The ferric reducing antioxidant power (FRAP) assay evaluates the ability of antioxidants present in a sample to reduce yellow ferric ions (Fe³⁺) to blue ferrous ions (Fe²⁺) under acidic conditions. To perform the assay, 12.0 mL of freshly prepared FRAP reagent (composed of acetate buffer, TPTZ solution, and FeCl₃ solution) were mixed with 0.40 mL of the sample solution. After 5 minutes of incubation at room temperature in the dark, absorbance was measured at 593 nm using a VWR® P9 UV/VIS Double-Beam Spectrophotometer. A calibration curve was constructed using ascorbic acid standards in the concentration range of 0.1 to 1.0 mmol/L, and the antioxidant capacity of the samples was calculated based on this curve. Results were expressed as milligrams of ascorbic acid equivalents per 100 grams of dry extract (mg AAE/100 g dry extract).
2.7. Statistical Analysis
All determinations were performed in triplicate, and the data presented as the means ± standard deviations. The effect of BLE particle size on the antioxidant activity of BLE extracts and textile products dyed with these extracts was statically evaluated (p < 0.05) by one-way analysis of variance (ANOVA) using Real Statistics Resource Pack and Tukey test for differences of means.
3. Results and Discussion
3.1. Characterization of E. globulus Branches and Leaves
Milling is one of the first steps in the processing of lignocellulosic by-products and will influence their applicability in terms of particle size distribution and morphology. In this case, a knife mill with a 1 mm sieve was selected for the study.
The particle size distribution of the BLE dry and milled particles was evaluated by gravimetrically fractioning the particles in six samples by mechanical sieving.
The percentage in weight of each sample is shown in Figure 1.
Despite the use of a 1 mm sieve, the majority fraction was between 200 and 500 μm, followed by fractions between 63 and 200 µm, with particles smaller than 63 µm and larger than 500 µm having the lowest percentage of particles. The particle size fraction of <32 µm (BLE32), of 32-63 µm (BLE63), 63-125 µm (BLE125), 125-200 µm (BLE200) and 200-500 µm (BLE500) were used for the study of the impact of BLE particles on the textile coating formulation.
Thermal characterisation of BLE particles by TG
The thermal degradation of BLE not sieved particles was evaluated employing TGA analysis in N2 atmosphere with a heat rate of 10 K /min from 50 to 800 °C (Figure 2).
The BLE particles were observed to undergo five main stages of degradation.
The first peak of weight loss was observed at 85.4 °C, related to the evaporation of moisture and low temperature volatile compounds. The second and third peaks of degradation were observed at 241.6 °C, related to the decomposition of hemicellulose, and at 338.4 °C, due to the degradation of cellulose [20]. Another peak of weight loss was observed at 408.5 °C, associated with the degradation of low molecular weight polyphenols present in the BLE particles. Finally, a slow and continuous degradation was observed between 500 °C and 800 °C, attributed to the degradation of lignin. Residue mass was 24.2% at 800 °C and approximately 27.0% at 600 °C, a similar value as previously observed by other authors (26.0%) when evaluating commercial bleached eucalyptus kraft pulp fibres [20].
Chemical characterisation of BLE particles and storage time impact
One of the main barriers to the viability of industrial application of a process based on lignocellulosic products is ensuring material stability and reproducibility of the newly developed industrial process. To this end, the effect of storage time on the properties of unsieved BLE particles was investigated.
The milled BLE particles were stored in black plastic bags (to avoid light exposure) in a climate-controlled room at (20 ± 5) °C for 12 months.
To assess the effect of time on the chemical composition of the BLE particles, four chemical characterisations were performed, the first immediately after milling (M0), the second after 4 months of storage (M4), the third after 8 months of storage (M8) and the last before 12 months of storage (M12).
To evaluate the chemical composition of the BLE particles, an ultrasonic water extraction was performed at 80 °C for 30 min, according to a previously published method [19].
The extraction yield, phenolic, sugar content and protein content were evaluated, and the results are shown in Figure 3.
The extracts obtained from the BLE particles contained 278.4-246.1 mg GAE/g extract of phenols, 184.6-276.0 mg of sugars and 391.1-228.0 mg of proteins, being the phenolic content similar to that obtained for ethanolic extracts of E. globulus leaves (273.2 ± 17.5 mg GAE/g extract) by other authors [21] and the protein content higher than the reported previously by other authors in E. globulus leaves (218 mg ABSE/g extract) and seeds (151 mg ABSE/g extract) [22].
Regarding the effect of storage time, phenolic and sugar contents were relatively stable, with a significant decrease in sugar content only after twelve months of storage (Figure 3). However, the protein content was the component more sensitive to storage, once that registered a significative decrease over time (Figure 3).
The extraction yield of BLE particles after 4 months of storage was significantly improved, when compared to the initial value (M0, Figure 3) due to degradation of high molecular weight water insoluble compounds and remained stable up to 8 months of storage (Figure 3). After 12 months, a decrease was observed (Figure 3), possibly due to the loss of small phenols/organics.
3.1.1. Characterization of the BLE Particles by SEM Microscopy
The particle morphology influences their interaction with the polyurethane (WPU) matrix and their stacking properties during the mixing, application, drying and pressing stages of the textile coating formulation. SEM images of BLE samples with different particle sizes are shown in Figure 4.
Regarding the analysis of particle morphology, it was possible to identify two main types of particles, one more fibrous and the other with an amorphous nature (Figure 4). In addition, the particle size of the SEM images obtained at 250x magnification, and the results of average particle size are shown in Table 2.
The amorphous particles have a particle size between the sieves used, but the fibre particles were found to be longer (Table 2). This fact may be associated to the mechanical degradation caused by the fibres passing through the sieves.
The BLE particles are a mixture of fibrous and amorphous particles with the estimated number of fibres being 25.0% for BLE500, 27.3% for BLE200, 10.5% for BLE125, 8.3% for BLE63 and less than 1% for BLE32.
In addition, the chemical composition of the BLE sample particles was determined by EDS and the results are shown in Table 3.
The leaves and branches of E. globulus have different carbon, nitrogen and oxygen contents. Leaves have a higher carbon content than branches, with an average of 52.9%. Branches and wood have a lower content, around 46.8% [23]. Nitrogen content varies from leaves to branches and will also depend on age and month of harvesting, with the N content of Eucalyptus Globulus leaves being around 7-33 (mg seedling-1) and for stems around 3-13 (mg seedling-1) [24]
The physical and chemical interaction between the particles and the WPU coating formulation depends on the morphology of the particles and their chemical nature. As mentioned previously, BLE particles contain soluble proteins, polyphenols, sugars and waxes that can react with the reactive isocyanate and hydroxyl groups present in the WPU formulation.
The proportion of N and O groups present in the BLE particles will affect their chemical interactions with the isocyanate and hydroxyl-free groups present in the polyurethane coating formulation. In the low particle size samples (BLE32-BLE125), the amorphous particles had higher nitrogen (N) and oxygen (O) content compared to the fibrous particles (Table3). However, in the larger particle size samples (BLE200-BLE500), this difference was not observed (Table 3).
In relation to the chemical composition of the fibrous component, it was observed that the samples exhibiting high particle size and high fibrous content (BLE200-BLE500) demonstrated higher concentrations of N and O groups (Table 3).
3.1.2. Characterisation of the BLE Particles by FTIR-ATR Spectroscopy
The analysis of the original BLE particles, as well as the investigation of the impact of the particle size distribution on the material’s functional groups, was conducted through the utilisation of FTIR-ATR spectroscopy. In Figure 5, the spectra of BLE32, BLE63, BLE125, BLE200 and BLE500 are presented for comparison.
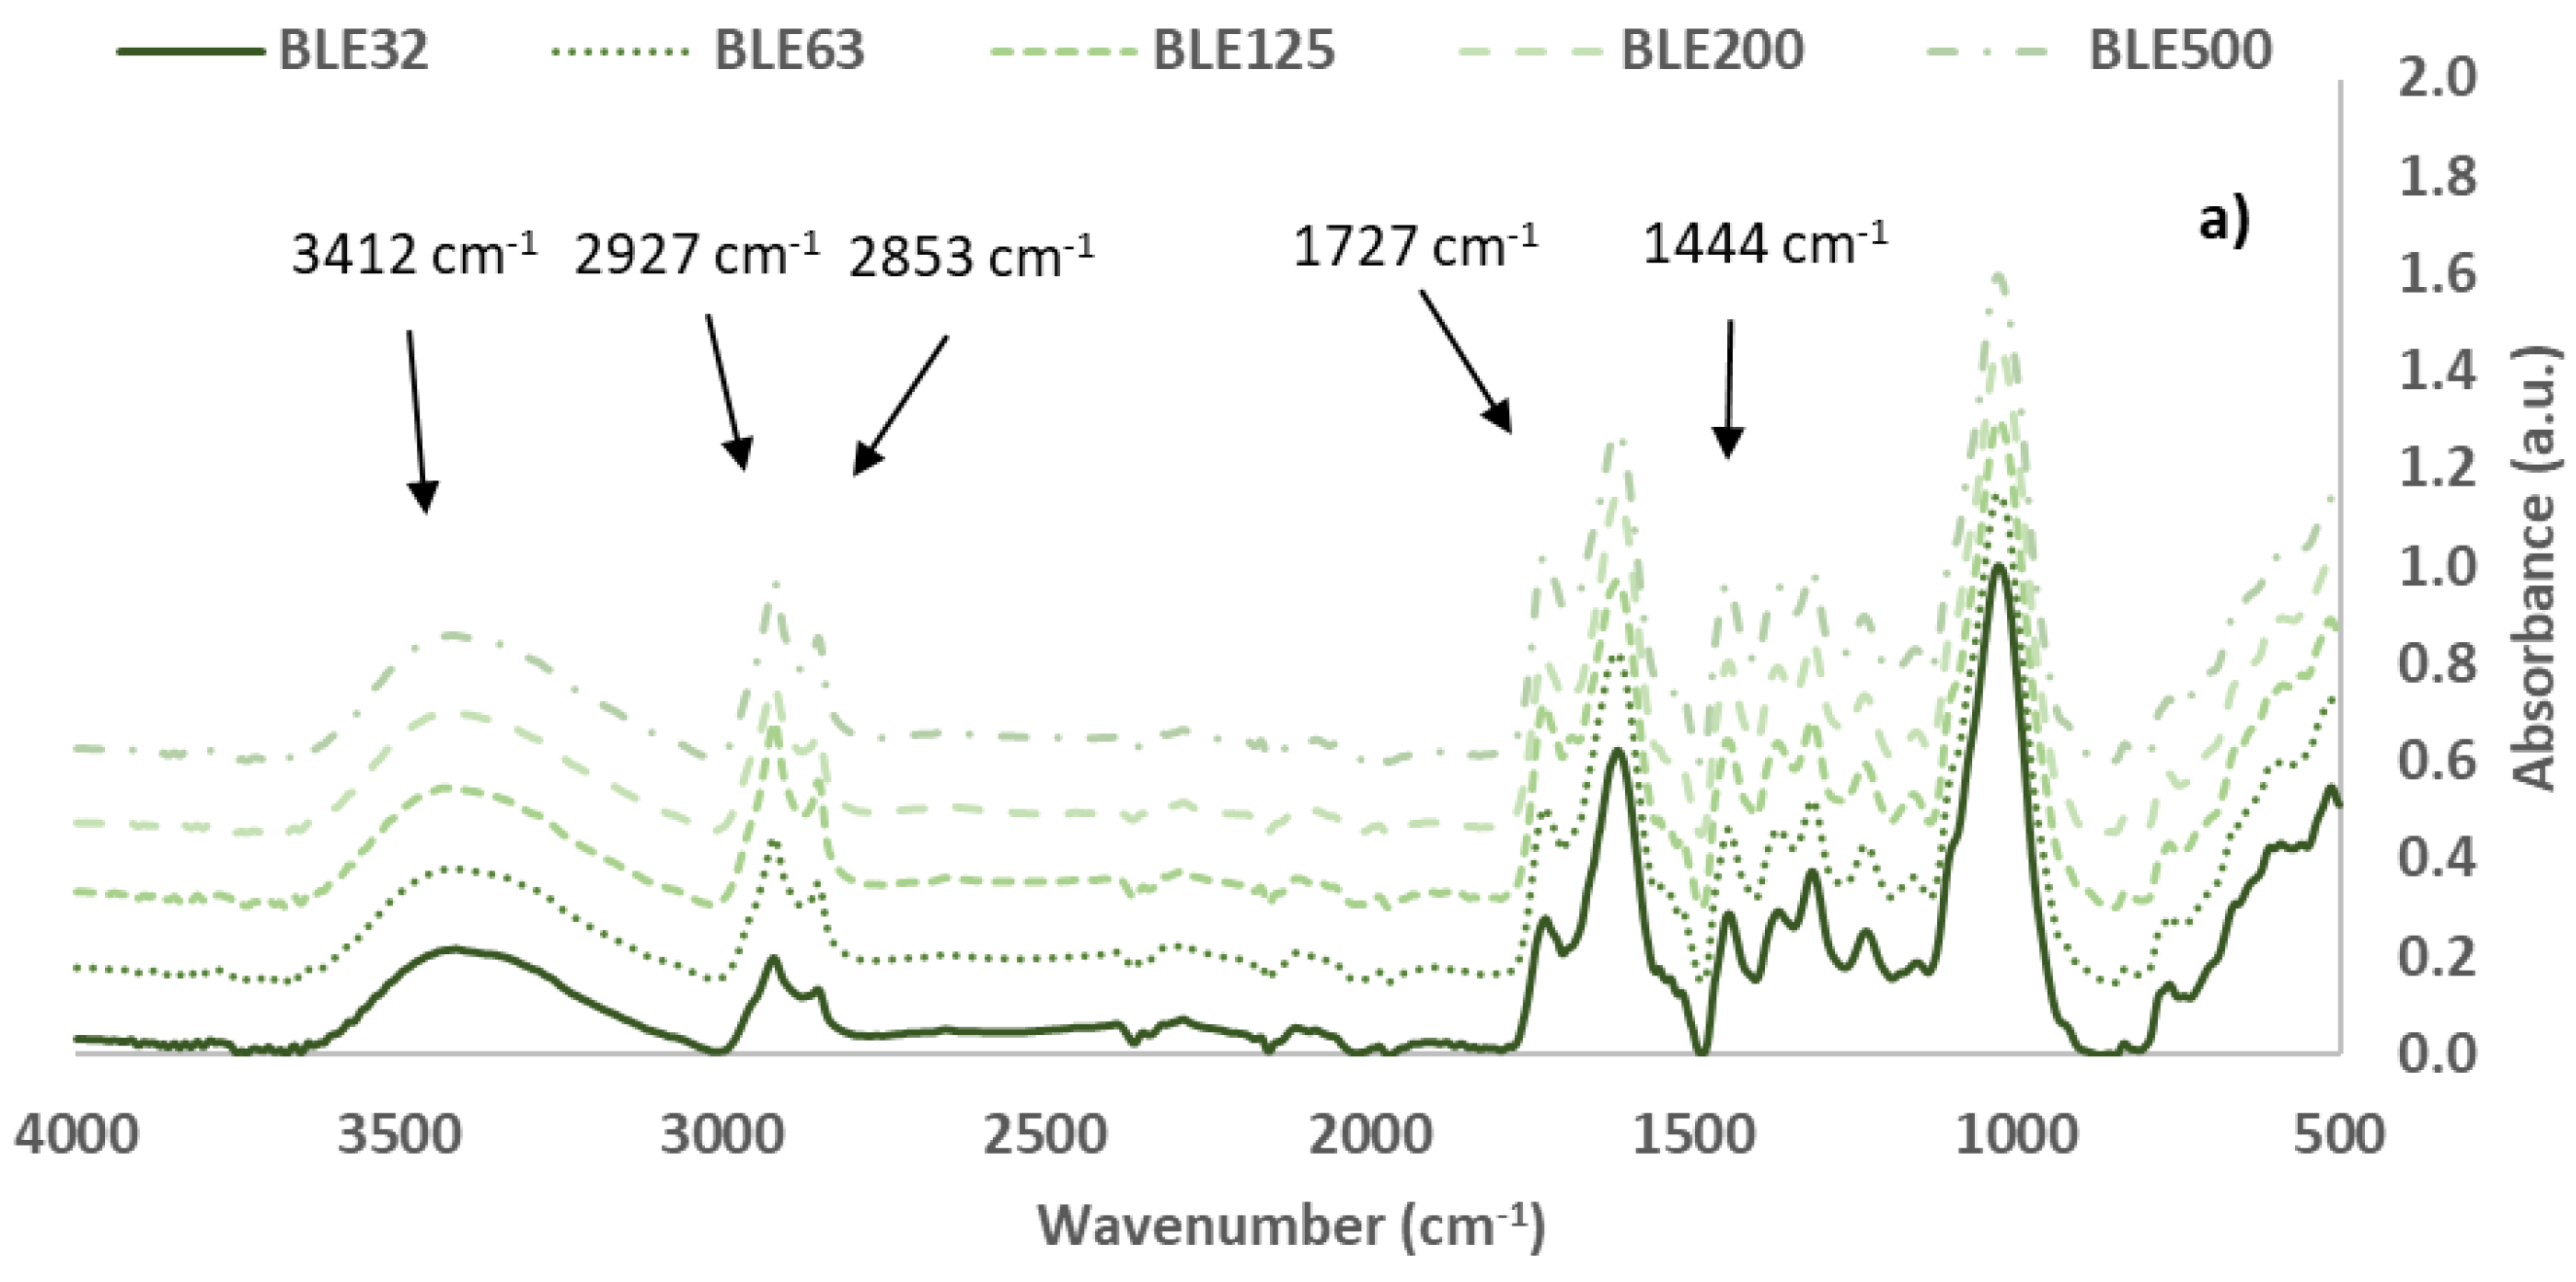
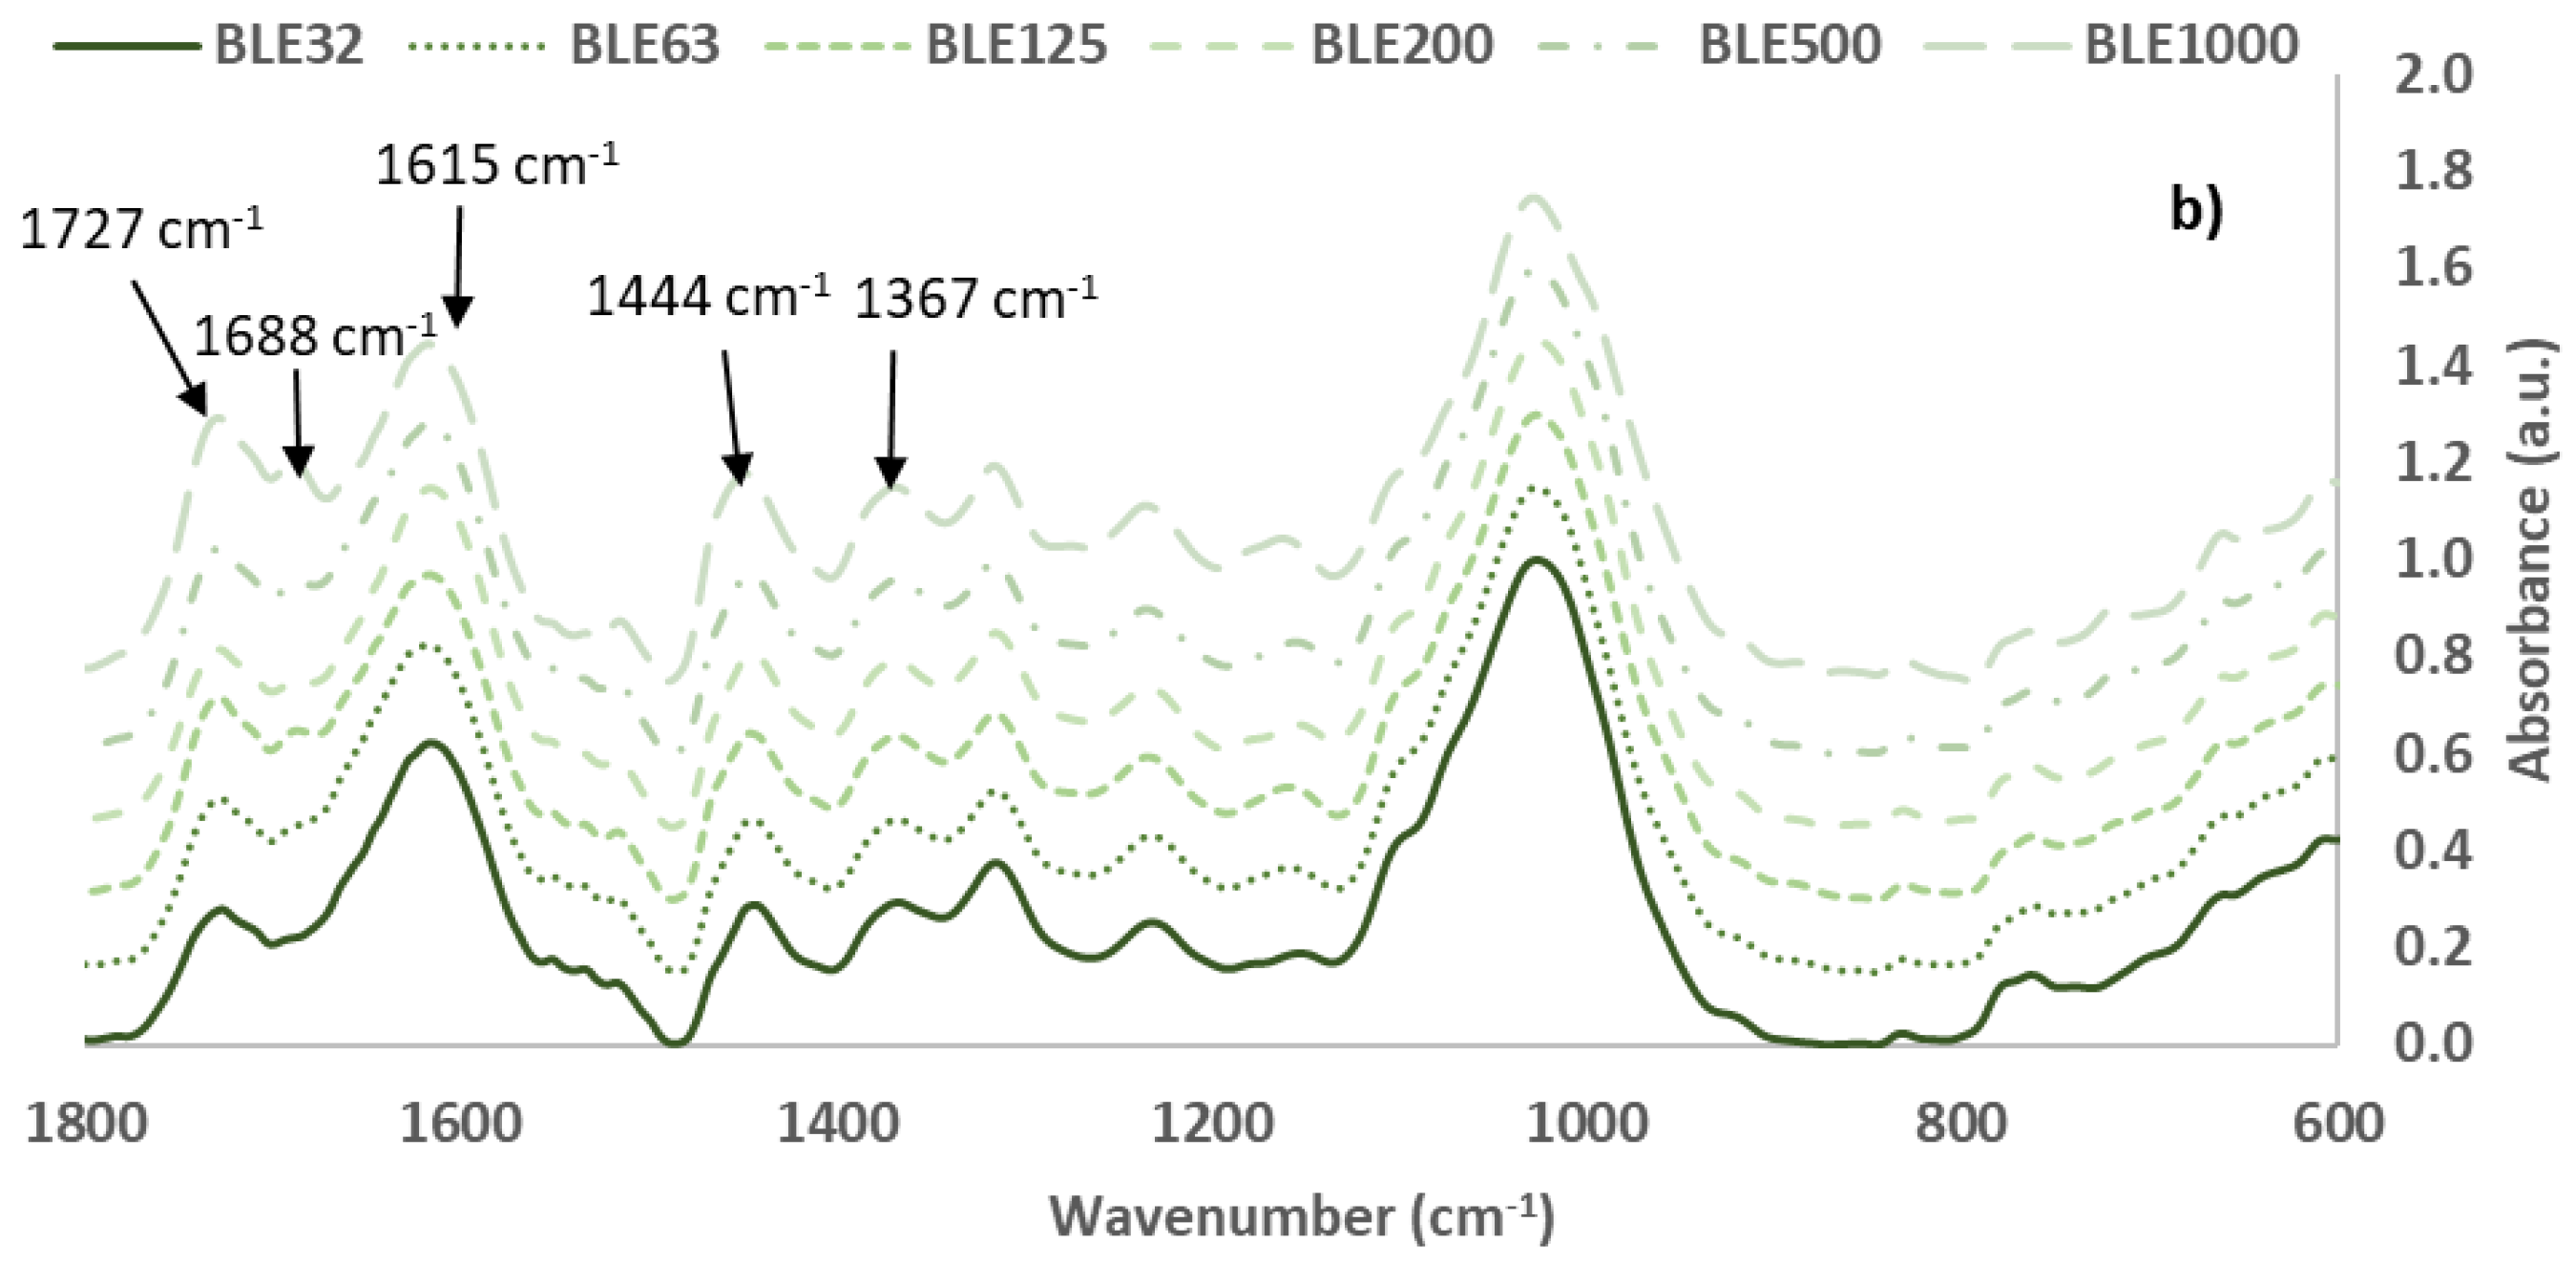
Figure 5.
FTIR spectra: Eucalyptus Globulus Branches and leaves particles (BLE) with different particle size distribution a) (4000–500 cm-1) and b) (1800-600 cm-1).
Figure 5.
FTIR spectra: Eucalyptus Globulus Branches and leaves particles (BLE) with different particle size distribution a) (4000–500 cm-1) and b) (1800-600 cm-1).
Based on the intensity of the vibration bands in the BLE spectra, the most abundant compounds in both materials were cellulose, hemicelluloses, and lignin. However, bands from other low molecular weight sugars and polyphenolic compounds are also detected. FTIR bands of these materials were assigned and summarized in Table 4 [25,26,27,28,29,30,31,32].To help the analysis, the FTIR spectra were normalized based on the most intense bands of the C-O, C-C, and C-C-O stretching vibrations of cellulose, hemicelluloses, and lignin, which appear at 1025-1035 cm-1 [33].
The cellulose content is characterised by the presence of a specific pattern of bands in the FTIR spectra. The most relevant of these are the CH2 deformation at 1444 and 1315 cm-1, the CH deformation at 1367 cm-1, the C-O stretch of C-OH/C-O-C at 1153 cm-1, and the CO stretch at 1027 cm-1 [32,34,35]. The area of these characteristic bands was measured, and the potential cellulose content was evaluated (Table 5).
The samples of high particle size distribution (BLE200 and BLE500) had shown high area percentage bands at 1444 and 1367 cm-1 of the CH2 and CH cellulosic groups respectively, and the BLE125 was the sample with low percentage area band at 1027 cm-1 related to the C-O, C-C, and C-C-O stretching vibrations of cellulose. Considering all the characteristics cellulose bands area, samples BLE 63 and BLE 125 were those with low cellulose content.
The FTIR band around 1727 cm−1 is due to the C=O stretching vibration of carboxyl and acetyl groups, characteristic of hemicellulose presence[35,36]. Regarding the intensity of this band on the spectra, the hemicellulose content is generally higher for the high particle size samples.
Lignin is the second major component present in BLE by-products. Table 6 shows the assignment of the main important functional groups contained in lignin, such as hydroxyl, carbonyl, methoxyl, carboxyl, and aromatic and aliphatic C-H, detected in BLE32-500 FTIR spectra, based on previous studies [28,40].
The results showed significant differences between the amount of lignin in the BLE125 and BLE500 samples.
To complete the evaluation of the BLE samples, the presence of oils and waxes was analysed. The presence of aliphatic components is indicated by the two vibration bands around 2920 and 2850 cm-1, as well as the bands at 1468, 1313 and 725 cm-1. These bands are due to vibrations of CH2 groups.

Table 7.
Aliphatic (Waxes) FTIR bands quantification for BLE particles.
| BLE32 | BLE63 | BLE125 | BLE200 | BLE500 | Group | Integration Range | |
| cm-1 | % Area | % Area | % Area | % Area | % Area | ||
| 2920 | 4.15 ± 0.16 a | 5.98 ± 0.19 b | 6.35 ± 0.26 b | 6.74 ± 0.05 b,b | 5.70 ± 0.36 b,c | -CH2- asymmetric stretch | 3000-2800 |
| 2852 | -CH2- symmetric stretch | ||||||
| 1467 | 0.41 ± 0.01 a | 0.52 ± 0.02 b | 0.53 ± 0.03 b | 0.53 ± 0.03 b | 0.54 ± 0.03 b | CH- deformation; asymmetric in -CH2 | 1480-1460 |
| 1315 | 3.40 ± 0.04 | 3.11 ± 0.07 | 3.10 ± 0.02 | 3.22 ± 0.22 | 3.24 ± 0.02 | CH2 deformation medium-weak |
1340-1285 |
| 721 | 0.55 ± 0.01 | 0.58 ± 0.06 | 0.52 ± 0.04 | 0.53 ± 0.01 | 0.55 ± 0.01 | C-C Alkanes skeletal vibrations |
730-710 |
| ∑ Area | 8.50 ± 0.22 a | 10.35 ± 0.39 b | 11.02 ± 0.66 b | 11.22 ± 0.39 b | 10.03 ± 0.40 b |
BLE32-1000: Milled and sieved Branches and leaves of E. globulus.; % Area was the peak area/Area Total; Area total was measured between 400 and 4000 cm-1. Samples subscripted by different letters are significantly different in terms of impact of raw material particle size distribution at p < 0.05.
The aliphatic character of the BLE particles is related to their hydrophobicity and the impact on the polymerisation reaction and rheology of the WPU formulation.
With regard to the results obtained, it was observed that the sample with the smallest particle size (BLE32) had a significantly lower wax content.
3.2. Production and Characterization of Coated Fabrics with BLE Particles
3.2.1. BLE Particles Impact on WPU Coating Formulation
The first step in the production of the coated textile samples was the preparation of the polymeric solution with the BLE particles and to evaluation of the impact of the different BLE particle size distribution in the rheological behaviour of the polymeric solutions.
The coating solutions were prepared by mixing the water-soluble polyurethane formulation with 10.0 ± 0.5% (dry basis) of the different BLE particles. The coating formulations were characterised in terms of viscosity, foam density and solid content (Table 8).
In all cases, BLE particles increased the viscosity of the polymer formulation. However, no trend was observed with the particle size distribution of the samples.
Due to operational conditions, the coating formulations were foamed and used as stable foam, which made it necessary to evaluate the impact of BLE particles on foam density. In general, no foam density increase due to the BLE particles was observed, except when BLE32 and BL63 particles were used. This increase could be attributed to the lower proportion of aliphatic compounds present in the particles.
3.2.2. Analysis of Fabrics Coated with BLE Particles
Analysis of the effect of BLE particles on the colour of coated fabrics.
The first evaluation was focused on the impact of the BLE particles on the esthetical properties of the coated textile products. Figure 5 shows the textile samples coated with WPU formulation and WPU+BLE particles.
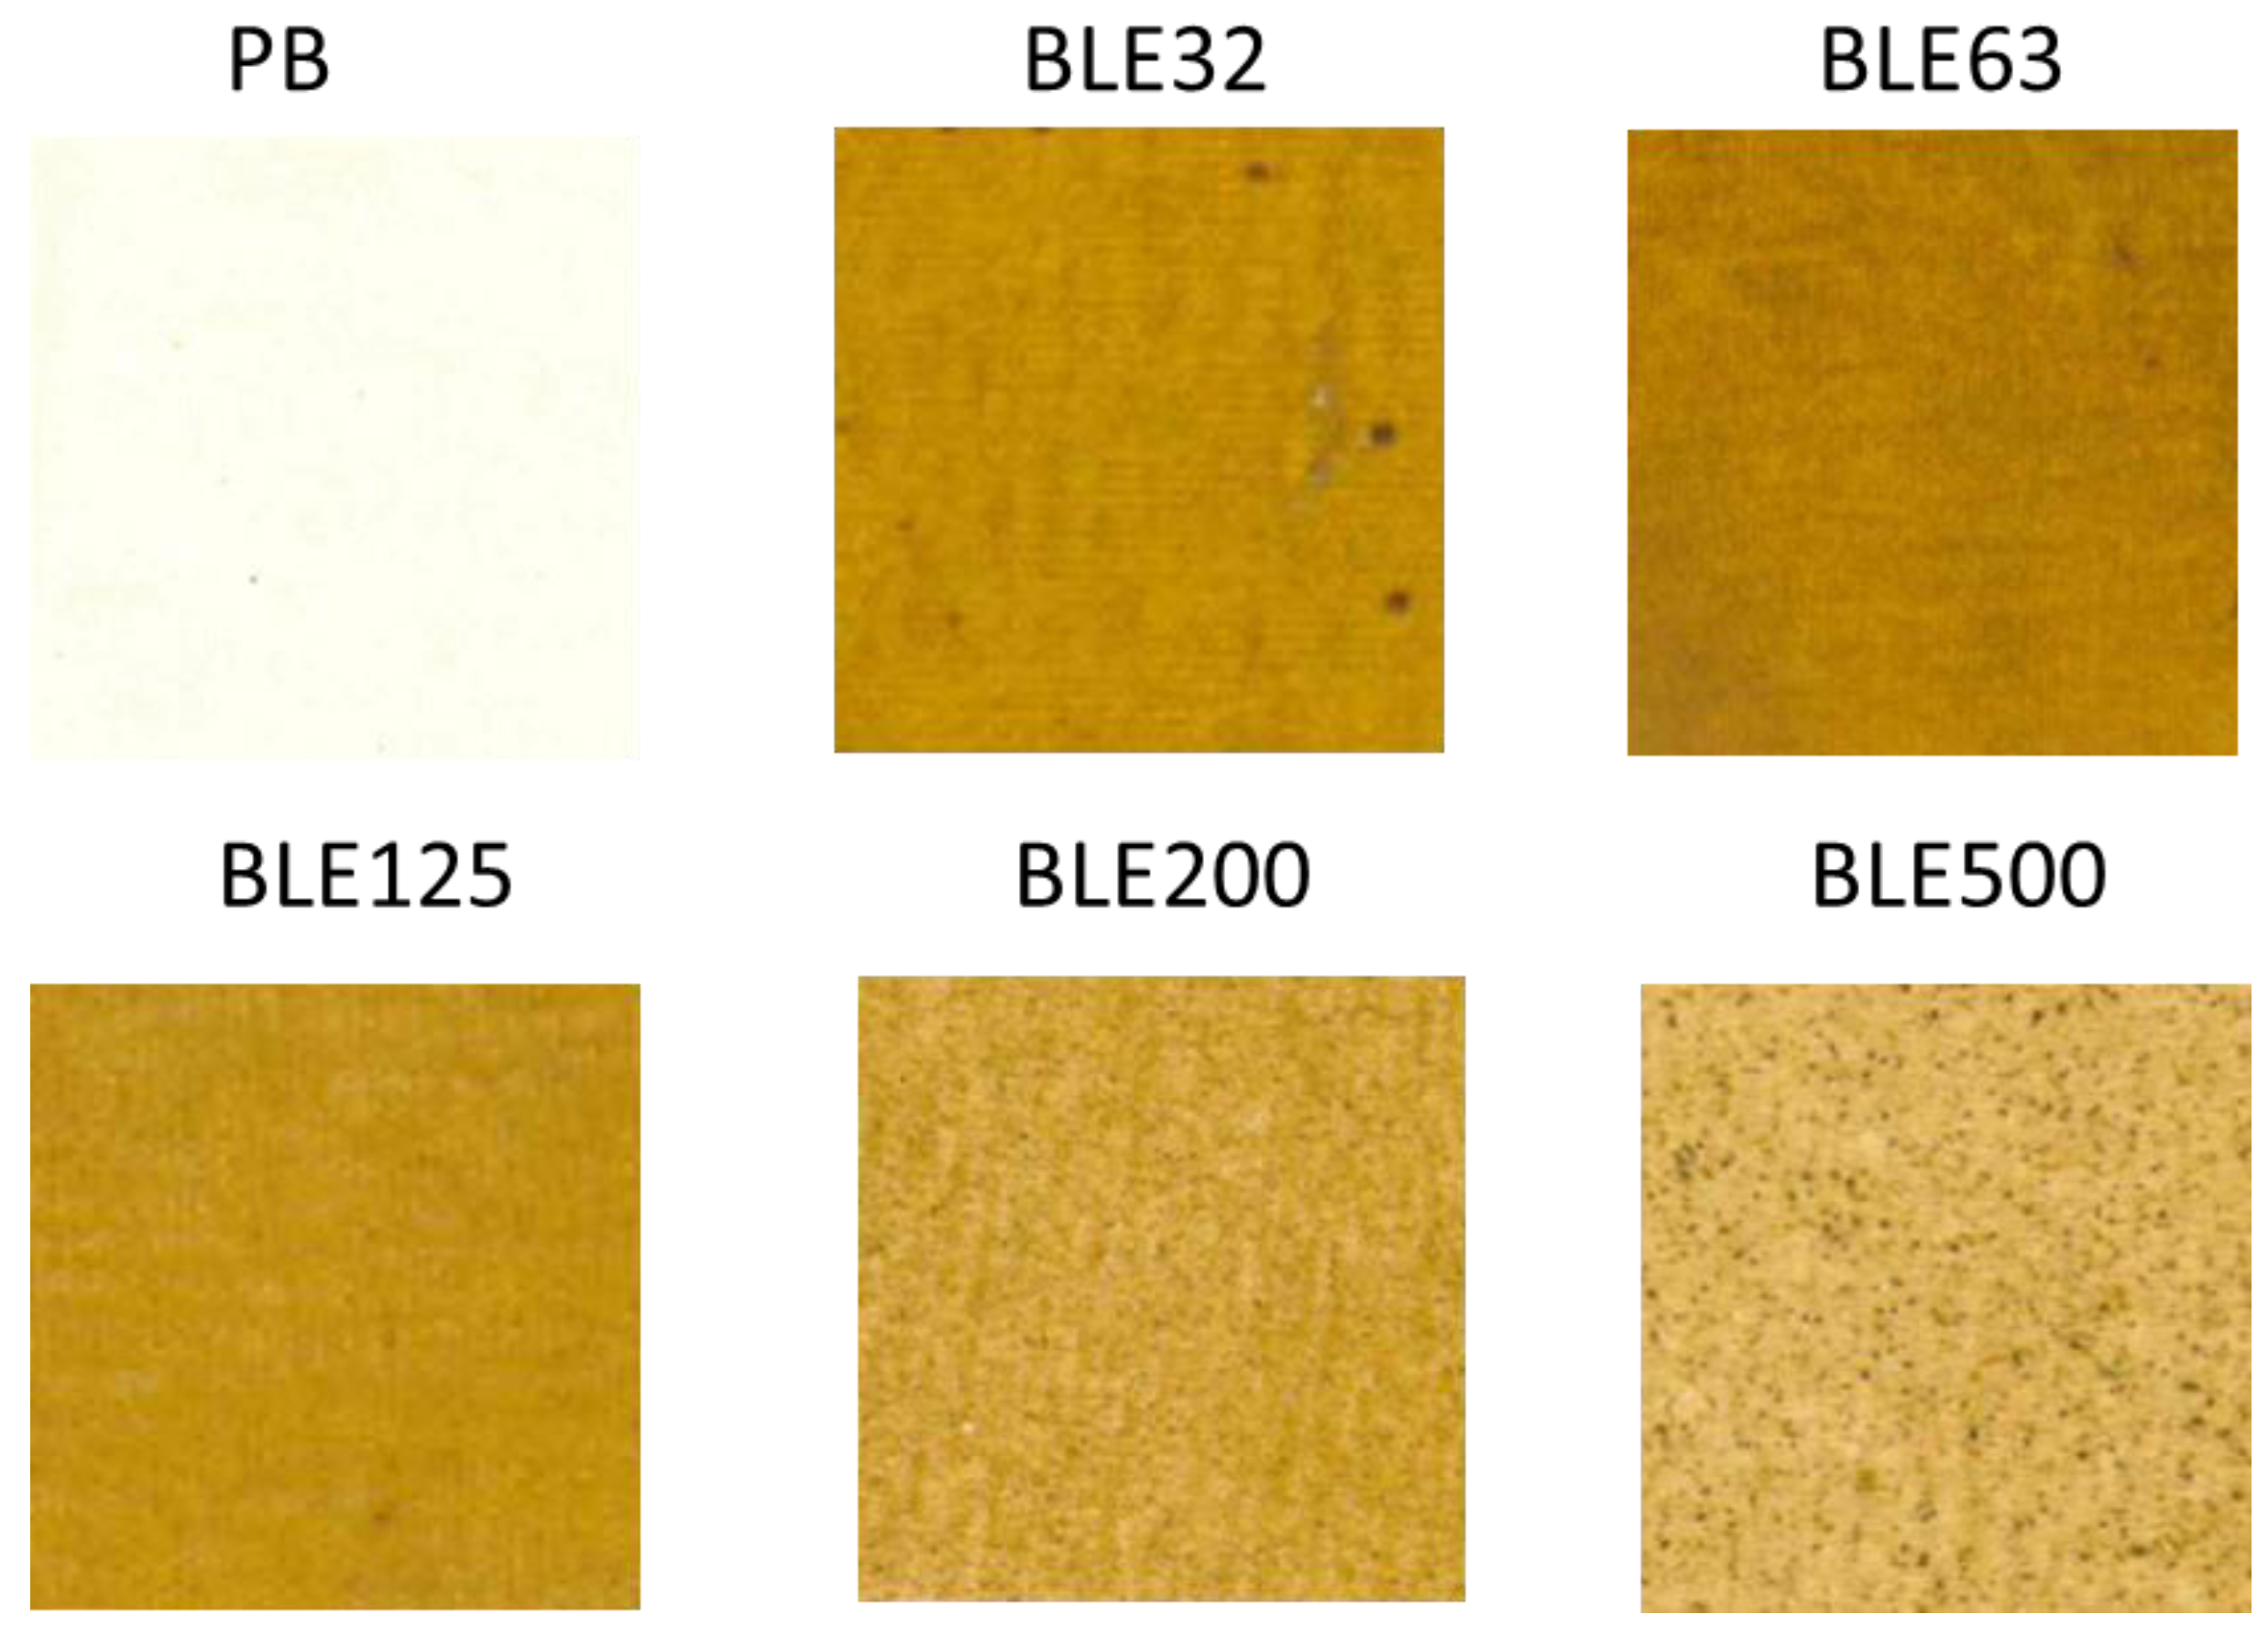
Figure 5.
Coated fabrics with aqueous WPU formulation (PB), and with WPU+ BLE32-BLE500 particles (BLE32-BLE500).
Figure 5.
Coated fabrics with aqueous WPU formulation (PB), and with WPU+ BLE32-BLE500 particles (BLE32-BLE500).
The colour coordinate evaluation was performed using the CIELab colour measurement system, and the results obtained are shown in Table 9
The BLE particles changed the colour of the coated fabrics produced. The effect of the size distribution of the BLE particle samples used in the coating formulation on the colour properties of the final product was also confirmed. It was possible to obtain coated fabrics with different colour properties depending on the BLE sample
The coating textile samples with a higher luminescence value L*, indicating a lighter final colour, were those in which large-size particles were used (BLE500, BLE 200 and BLE 125), which is related to the lower water-extractable components present in the BLE samples.
However, textiles coated with the larger particle size samples (BLE 200 and BLE 500) showed the highest overall colour variation (ΔE*), which is related to a higher proportion of dark spots due to the larger particles present in the BLE samples.
Particle size had a greater effect on the colour parameter a* than on b*, with fabrics coated with the smallest BLE particle size (BLE32-BLE125) having higher a* values (redder).
Colour lightfastness evaluation
The lightfastness of the coated cotton samples was then evaluated, which is a relevant parameter that could affect their industrial viability, especially if these products are to be manufactured for demanding applications, such as automotive developments.
The samples were exposed to artificial white light for one week and the colour changes were measured (Figure 6).
The most relevant difference in the colour of the coated fabrics due to the light treatment was observed in the parameters L* (lightness) and b* (yellow-blue). The light treatment increased the L* value of all coated fabrics (brighter colour), being this increase higher in the fabrics coated with BLE particles. However, due to the size distribution of the BLE particles used in the coating formulation, no significant trend in the increase of the L* value was observed. As for the b* parameter, in all samples, exposure to light changed the colours of the coated fabrics to lower b* values, resulting in bluer colours. The fabrics coated with the largest BLE particle size (BLE125-BLE500) had significantly higher Δb* values due to light treatment.
Colour lightfastness can be measured by ΔE* (total colour difference) values, which are obtained by comparing the parameters of the colour values of the coated fabric after and before exposure to light [6] . The BLE particles influenced the colour lightfastness of the coated fabrics, and the influence of the size distribution of the BLE particles used was also significant. The coated fabrics produced with the smallest BLE particle size had the lowest ΔE* values and the highest colour lightfastness. This is related to the higher antioxidant capacity of the water extracts obtained from the samples with the smaller particle size distribution (BLE32, BLE63), values analysed in a previous work of this research group [6].
Characterisation of the samples by SEM microscopy
Scanning electron microscopy (SEM) was used to evaluate the morphology of coated fabrics produced without (PB) and with BLE particles (Figure 7).
The most significant differences detected due to the presence of BLE particles are related to the percentage of foam voids present in the polymer matrix. The water-based WPU formulation was applied as a foam and then hot pressed in a calender press to achieve the required end thickness.
The BLE particles altered the coating layer, producing a textile product with a higher proportion of retained gas and surface voids.
The voids in the surface and in the polymer, matrix will affect several parameters that will influence the final applicability of the products, namely wettability, breathability and thermal transfer properties. The coatings prepared with BLE63 were the ones that achieved a higher proportion of voids on the surface and bubbles retained in the polymer matrix.
FTIR-ATR coating samples characterization
The fabrics coated with the WPU formulation alone (PB) and with the different particle size BLE particles (BLE32-500) were analysed by FTIR-ATR spectroscopy and the absorbance spectra are shown in Figure 8.
The FTIR bands of the coated fabrics were assigned and summarised in Table 10. The FTIR spectra were normalised on the basis of the characteristic -C-O-C- stretching peak band of the polyol component, which appears at 1157 ± 5 cm-1, [37,38] and the area of each characteristic peak was calculated as a percentage (relative to the total area of the spectra). The experiments were performed in triplicate at different points and the results were averaged.
No isocyanate absorption band at 2266 cm-1 was observed in any of the samples analysed, indicating that the polyurethane curing reaction was complete in all cases and that no free isocyanate groups were present in the coated fabrics[42].
Concerning to the characteristic polyurethane bands, the presence of an N-H vibration band at 3383 cm-1 [38] , the carbonyl stretching non-hydrogen bonded urethane band at 1724 cm-1 and the associated urethane (hydrogen bonded) band at 1687 cm-1 were observed, the amide II band at 1518 cm-1 due to the stretching vibration of the C-N bonds and the deformation vibration of the C-N-H bonds of the urethane linkages, and the amide III band at 1245 cm-1 due to the deformation vibration of the N-H bond and the deformation vibration of the O-C-N bonds.
The fabrics coated with the formulation containing the BLE particles showed a significant reduction in the area of the bands at 1518 cm-1 (of amide II), regardless of the particle size used, the BLE 125 being the sample with the lowest value.
Regarding the band at 1245 cm-1 (of amide III), only the samples produced with BLE 63 and BLE 125 particles showed a significant reduction in the area of the band concerning the reference coated fabric (PB).
The bands of hydrogen-bonded and non-hydrogen-bonded carbonyl groups appear at 1685 and 1724 cm-1 respectively. The fabrics coated with BLE 63, BLE 125 and BLE 200 particles showed a smaller band area due to the non-hydrogen bonded urethane carbonyl groups (PB), but only BLE 125 showed a significant reduction in the band due to hydrogen-bonded urethane bonds.
In general, the area of the CH₂ and CH₃ bands was smaller in fabrics coated with BLE particles than in fabrics coated only with WPU (PB).
Finally, it was observed changes on the OH band that appeared at 3520 cm-1, which area increase in the fabrics coated with the BLE particles being the higher values obtained when BLE32 and BLE500 particles were used. The hydroxyl groups present on the coating surface will affect the reactivity and hydrophobicity of the material.
Hydrophobicity and Oleophobicity of Coating textile with BLE
The hydrophobicity and oleophobicity of the coated fabrics produced with the different BLE particle samples (BLE32-500) and only with the WPU formulation (PB) were characterised by measuring the contact angle of a drop of water and hexadecane on the surface of the coating (Figure 9). These properties will influence the applicability of the products in product manufacturing, their cleanability, disinfectability, breathability, or impermeability[43].
In all textile products coated with BLE particles, the hydrophobicity of the coated surface was lower than the reference (PB), which correlates with the higher hydroxyl surface groups observed by FTIR-ATR (Table 10).
In terms of oleophobicity, all the samples coated with the BLE particles showed a significant reduction in oleophobicity, being those that showed low contact angle values, the fabrics coated with the BLE63 and BLE 125 particles. Both coatings were the ones that showed low FTIR area percentage values of the bands at 1724 and 1245 cm-1 due to the non-hydrogen bonded urethane and amide III vibration of the urethane bonds, respectively (Table 10).
Coating textile with BLE particles performance
The effect of the BLE particles on the physico-mechanical behaviour of the coated fabric was evaluated and the results are shown in Figure 10 and Figure 11. The original cotton fabric used as a textile substrate was also tested as a reference (MAM).
In all cases, the coating increased the elasticity and tensile strength of the textile product. To analyse the effect of the particles on the coating, the behaviour of the material when subjected to low forces (< 50 N) was analysed measuring the elongation value, which is a parameter of great interest for the applicability of the coating on textile products, as it is related to the reversible deformation that the material can withstand. In addition, the Force and elongation maximum were also tested.
Fabrics coated with BLE32 and BLE125 particles showed the lowest elongation at 50 N, being the most elastic the textile coated with the largest particle size (BLE500) and without the addition of BLE particles (PB). This higher elasticity of the product coated with the largest BLE particles is related to the higher percentage of fibrous particles and the lower content of extractable phenolic compounds.
Regarding the tensile strength and maximum elongation of the coated textile products (Figure 11), it was observed that regardless of the BLE particle size used, the BLE particles have a reinforcing effect on the material, increasing the tensile strength value without significantly reducing its elongation capacity. The material coated with the largest BLE particles had the highest tensile strength and elongation.
Coating textile products thermal behaviour characterization
DSC Essay
To evaluate the effect of BLE particles on the thermal behaviour of textile products coated with them, a DSC test was carried out in an N2 atmosphere. The thermogram and characteristic temperatures and enthalpies of the thermal process are shown in Figure 12 and Table 11.
Two endothermic peaks associated with thermal events in the cotton knit were observed, the first at around 70 °C, associated with the moisture, and the second at around 370 °C with the formation of volatile compounds during the decomposition of cellulose[44].
Concerning to the effect of the coating on the thermal behaviour of the fabric, it was observed that the first endothermic peak shifted to higher temperature values (79-94 °C), because at this temperature the melting of the hard segments of the polyurethane matrix also occurs [45], and also a new peak appears around 220-227 °C, related to the melting of the soft segments of the polyurethanes [46].
As for the degradation peaks, a peak at 355-362 °C was detected, which overlaps with the degradation peak of the textile substrate, and a second endothermic degradation peak at 451-457 °C, which is not present in the textile substrate.
The BLE particles had shifted the first peak (79-94 °C) to lower temperature values, indicating an effect on the melting of the hard segments of the polyurethane matrix.
Regarding the second peak (220-227 °C) related to the melting of the soft segments, the peak temperature was generally similar for the fabrics coated with BLE particles and no differences in peak enthalpy were detected.
The temperature of the peak observed at 356-362 °C, associated with polyurethane degradation, was higher for all fabrics coated with the BLE particles compared to the reference (PB). In addition, higher degradation enthalpy values were obtained for the fabrics coated with BLE particles, indicating that high energy was required to break the urethane bonds. Finally, a peak was observed at 451-457 °C, which is associated with the onset of degradation of the phenolic structures present in the polyurethane polymer. It was observed that the peak enthalpy was higher for the samples coated with the low BLE particle size (BLE32-125), which is related to their higher phenol content [6].
Simultaneous thermal analysis (STA)
A STA analysis in O2 atmosphere involving TGA and DSC analysis was performed to assess the BLE particles’ impact on the thermal stability of the coated textile products. The TGA, DTG and DSC curves are shown in Figure 13. As a reference were evaluated also the cotton knit used as textile substrate, and the textile sample was coated only with the WPU formulation (PB).
Thus, it was possible to identify one degradation step on the textile substrate and three degradation steps in the coated textile products. The maximum decomposition temperature of the different degradation steps and the weight residue at 500 °C are shown in Table 12.
For the coated samples, the first weight loss between (330.5-340.5) was attributed to the degradation of urethane bonds to form primary amine and olefin or secondary amine and carbon dioxide [47]. The second weight loss around 449.4-471.0 corresponds to the structural decomposition of organic chains (mainly urea groups) [20]. In general, the BLE particles shift the peak to lower values due to the thermal degradation of the BLE particles.
The Td 5%, which is related to the melting of the soft segments and the onset of WPU degradation, was influenced by the type of BLE particle sample used in the coating formulation, with this temperature being higher for fabrics coated with BLE 63, BLE200 and BLE 500 particles.
Td 20% was selected as a reference of the start of the most relevant degradation step, being Td 50% and Td 75% correlated with the middle and the end of the degradation peak. No difference was observed in the Td 20% of the coated fabrics due to the BLE particles, being higher the impact of the BLE particles on the Td 50% that was low for the fabrics coated with the high particle size distribution (BLE 125-500) and mainly in the Td 75% that was higher for the fabrics coated with the BLE 63 and BLE 200 particles. In general, the fabric samples coated with the BLE particle shown a residual mass at 600 °C higher than the reference coated only with the WPU formulation (PB), being the fabrics coated with the low BLE particle size samples BLE32, and BLE63 those with have a high residual mass value (7.4 and 10.9). This is related to the high phenolic content of the low particle size samples demonstrated in previous works [6].
The results obtained by simultaneous DSC analysis under O2 atmosphere were summarised and shown in Table 13.
In the thermograms obtained by DSC, three peaks were observed for the fabric coated only with the WPU formulation and only two peaks for the coated fabrics in which BLE particles were added to the coating formulation, confirming the influence of the BLE particles on the properties of the coated fabrics. All the peaks observed in the DSC analysis in O2 atmosphere were exothermic peaks, in contrast to the previous essay developed in N2 atmosphere.
The first peak related to the urethane bond degradation appears at lower temperature (338.2-355.6 °C) than that obtained in the previous essays in N2 atmosphere (355.9-361.6 °C), demonstrating the O2 impact on the urethane degradation, however the second degradation peak had shift to higher temperature values respect the essays done in O2 atmosphere.
Antioxidant activity of Coating textiles with BLE
The ABTS and FRAP methods were used to evaluate the antioxidant activity of the textile samples. The FRAP method measures the reduction of ferric ion (Fe3+) to ferrous ion (Fe2+) in the presence of antioxidants [48], while the 2,2-diphenylpicrylhydrazyl (DPPH) radical scavenging capacity method measures the ability of antioxidant compounds to scavenge the DPPH radical [49].
Recent work by the research group has demonstrated the feasibility of producing textile products dyed with BLE extracts with antioxidant properties. Following the same strategy, the antioxidant properties of the cotton knitted fabric used as substrate and the textile products coated with the WPU base formulation and with the WPU and BLE32-500 particles were evaluated by DPPH and FRAP methodology, and the results obtained are shown in Figure 14 and Figure 15.
It has been shown that it is possible to obtain functionalised coated textile products with antioxidant properties only by incorporating BLE particles in the textile coating formulation. Regarding the influence of the particle size distribution, it was observed that after 6 hours, the coated textile products with the smaller particle size (BLE32 and BLE 63) were the ones that presented a higher antioxidant activity, which correlated with the higher antioxidant capacity of the extractable compounds present in the samples [6].
As expected, the incubation time increased the antioxidant efficacy for all coated fabrics tested [50].
Finally, the antioxidant capacity of the textile samples was evaluated by FRAP methodology. The coated fabrics were subjected to an ultrasound-assisted alkaline extraction process and the extracts obtained were evaluated by FRAP methodology.
The results obtained are shown in Figure 15.
The results obtained with the FRAP method confirm the DPPH analyses, which show that textiles coated with BLE particles have antioxidant properties. It has also been shown that the textiles coated with the smallest particle size (BLE32-BLE63) have the highest antioxidant activity, which is related to the characterisation of extractable compounds present in the samples carried out in a previous work by the research group[6].
4. Conclusions
The possibility of valorising unseparated small branches and leaves as components of textile coatings has been demonstrated.
The BLE particles affect the rheological behaviour of the WPU coating formulations, which in turn affects the foamability and density of the final formulation foam applied to the textile substrate. They also affect the cross-linking reaction of the WPU and the thermal behaviour, colour, appearance, hydrophobicity and oleophobicity of the coated textile products.
By replacing 10% of the polyurethane formulation with the forestry by-product, a new product was obtained in terms of colour, feel and mechanical performance, making it more attractive to the market.
The particles have improved the tensile strength of textile coating products without loss of elongation, improving their properties for specific applications such as high-performance footwear.
The effect of the BLE particles on the thermal properties of the coated fabrics was evaluated, and it was found that the addition of BLE particles as part of the coating formulation increased the residual mass at 600 °C of the coated fabrics by more than four times.
It was also possible to confirm the transfer of the antioxidant properties of the eucalyptus particles to the coated textile products, allowing us to obtain a functional textile product that could have interesting applications in the medical, pharmaceutical and sports fields.
Further research could investigate the potential applications of BLE particles in the manufacture of textiles and other products. This could include exploring the potential economic and environmental benefits of using forest by-products in this way. Overall, the results of this study highlight the potential of using forest by-products in the development of new functional textile products.
Funding
This work was supported by: national funds through FCT/MCTES (PIDDAC): LEPABE, UIDB/00511/2020 (DOI: 10.54499/UIDB/00511/2020) and UIDP/00511/2020 (DOI: 10.54499/UIDP/00511/2020) and ALiCE, LA/P/0045/2020 (DOI: 10.54499/LA/P/0045/2020); This work was supported by the Integrated Project Be@t – Textile Bioeconomy, to strengthen the National Bioeconomy, financed by the Environmental Fund through Component 12 – Promotion of Sustainable Bioeconomy (Investment TC-C12-i01 – Sustainable Bioeconomy No. 02/ C12-i01.01/2022), of European funds allocated to Portugal by the Recovery and Resilience Plan (RRP), within the scope of the European Union (EU) Recovery and Resilience Mechanism, framed in the Next Generation EU, for the period 2021 – 2026).
Data Availability Statement
Data is contained within the article.
Acknowledgments
The authors wish to thank Tintex Textiles for the support with data and materials. Danilo Escobar-Avello, would like to thank ANID BASAL FB210015 CENAMAD and ANID FONDECYT de Postdoctorado 2023 (3230782).
Conflicts of Interest
The authors declare no conflict of interest.
References
- Escobar-Avello, D.; Ferrer, V.; Bravo-Arrepol, G.; Reyes-Contreras, P.; Elissetche, J.P.; Santos, J.; Fuentealba, C.; Cabrera-Barjas, G. Pretreated Eucalyptus Globulus and Pinus Radiata Barks: Potential Substrates to Improve Seed Germination for a Sustainable Horticulture. Forests 2023, 14. [CrossRef]
- Ferrer-Villasmil, V.; Fuentealba, C.; Reyes-Contreras, P.; Rubilar, R.; Cabrera-Barjas, G.; Bravo-Arrepol, G.; Escobar-Avello, D. Extracted Eucalyptus Globulus Bark Fiber as a Potential Substrate for Pinus Radiata and Quillaja Saponaria Germination. Plants 2024, 13. [CrossRef]
- Santos, J.; Antorrena, G.; Freire, M.S.; Pizzi, A.; González-Álvarez, J. Environmentally Friendly Wood Adhesives Based on Chestnut (Castanea Sativa) Shell Tannins. European Journal of Wood and Wood Products 2017, 75. [CrossRef]
- Santos, J.; Escobar-Avello, D.; Fuentealba, C.; Cabrera-Barjas, G.; González-Álvarez, J.; Martins, J.M.; Carvalho, L.H. Forest By-Product Valorization: Pilot-Scale Pinus Radiata and Eucalyptus Globulus Bark Mixture Extraction. Forests 2023, 14. [CrossRef]
- Casas-Ledón, Y.; Daza Salgado, K.; Cea, J.; Arteaga-Pérez, L.E.; Fuentealba, C. Life Cycle Assessment of Innovative Insulation Panels Based on Eucalyptus Bark Fibers. J Clean Prod 2020, 249. [CrossRef]
- Santos, J.; Freitas, B.; Fernandes, R.A.; Escobar-Avello, D.; Gomes, T.; Magalhães, P.; Magalhães, F.D.; Martins, J.M.; Carvalho, L.H. Ultrasonic-Assisted Water Extraction from Eucalyptus Globulus Leaves and Branches, to Obtain Natural Textile Dyes with Antioxidant Properties. Ind Crops Prod 2025, 228, 120885. [CrossRef]
- Meyer, M.; Dietrich, S.; Schulz, H.; Mondschein, A. Comparison of the Technical Performance of Leather, Artificial Leather, and Trendy Alternatives. Coatings 2021, 11. [CrossRef]
- Silva, A.; Vilaça, H.; Antunes, J.; Rocha, A.; Silva, C. Textile Bio-Based and Bioactive Coatings Using Vegetal Waste and by-Products. Base Diseño e Innovación 2022, 7. [CrossRef]
- Coelho, L.; Isabel Magalhães, A.; Fernandes, S.; Batista, P.; Pintado, M.; Faria, P.; Costa, C.; Moura, B.; Marinho, A.; Maria, R.; et al. Innovation of Textiles through Natural By-Products and Wastes. In Waste in Textile and Leather Sectors; 2020.
- Nolasco, A.; Esposito, F.; Cirillo, T.; Silva, A.; Silva, C. Coffee Silverskin: Unveiling a Versatile Agri-Food By-Product for Ethical Textile Coatings. In Proceedings of the Communications in Computer and Information Science; 2024; Vol. 1937 CCIS.
- Castro, J.A.; Balbo, R.; Silva, C.J.; Fernández, C.F.; Carrasco, F.A. Material Textile Design as a Trigger for Transdisciplinary Collaboration: Coating Bio-Based Textiles Using Waste from the Wood Industry. 2025. [CrossRef]
- Ghazal, H.; Saad, F.; Hegazy, B.M.; Sedik, A.; Hassabo, A.G. Polyurethane and Its Application in Textile Industry. Letters in Applied NanoBioScience 2024, 13.
- Neiva, D.M.; Araújo, S.; Gominho, J.; Carneiro, A. de C.; Pereira, H. Potential of Eucalyptus Globulus Industrial Bark as a Biorefinery Feedstock: Chemical and Fuel Characterization. Ind Crops Prod 2018, 123, 262–270. [CrossRef]
- Vázquez, G.; Fernández-Agulló, A.; Freire, M.S.; Antorrena, G.; González-Álvarez, J. Chestnut Bur Extracts as Antioxidants: Optimization of the Extraction Stage. WIT Transactions on Ecology and the Environment 2010, 140. [CrossRef]
- Vázquez, G.; Santos, J.; Freire, M.S.; Antorrena, G.; González-Álvarez, J. Extraction of Antioxidants from Eucalyptus (Eucalyptus Globulus) Bark. Wood Sci Technol 2012, 46. [CrossRef]
- Ghaheh, F.S.; Khoddami, A.; Alihosseini, F.; Jing, S.; Ribeiro, A.; Cavaco-Paulo, A.; Silva, C. Antioxidant Cosmetotextiles: Cotton Coating with Nanoparticles Containing Vitamin E. Process Biochemistry 2017, 59, 46–51. [CrossRef]
- Das, P.; Sherazee, M.; Marvi, P.K.; Ahmed, S.R.; Gedanken, A.; Srinivasan, S.; Rajabzadeh, A.R. Waste-Derived Sustainable Fluorescent Nanocarbon-Coated Breathable Functional Fabric for Antioxidant and Antimicrobial Applications. ACS Appl Mater Interfaces 2023, 15, 29425–29439. [CrossRef]
- Yılmaz, F. Investigating the Usage of Eucalyptus Leaves in Antibacterial Finishing of Textiles against Gram-Positive and Gram-Negative Bacteria. Journal of the Textile Institute 2021, 112, 341–345. [CrossRef]
- Escobar-Avello, D.; Olmo-Cunillera, A.; Lozano-Castellón, J.; Marhuenda-Muñoz, M.; Vallverdú-Queralt, A. A Targeted Approach by High Resolution Mass Spectrometry to Reveal New Compounds in Raisins. Molecules 2020, 25. [CrossRef]
- Członka, S.; Strakowska, A.; Pospiech, P.; Strzelec, K. Effects of Chemically Treated Eucalyptus Fibers on Mechanical, Thermal and Insulating Properties of Polyurethane Composite Foams. Materials 2020, 13. [CrossRef]
- Park, J.Y.; Kim, J.Y.; Son, Y.G.; Kang, S.D.; Lee, S.W.; Kim, K.D.; Kim, J.Y. Characterization of Chemical Composition and Antioxidant Activity of Eucalyptus Globulus Leaves under Different Extraction Conditions. Applied Sciences (Switzerland) 2023, 13. [CrossRef]
- SINGH, S.; RAGHAV, S.; KALYANARAMAN, K.; SAIFI, A. Partial Purification and De- Staining Property of Protease from Leaves and Seeds of Eucalyptus Globulus and Fruit of Azadirachta Indica. Int J Pharma Bio Sci 2019, 10. [CrossRef]
- Ribeiro, S.C.; Soares, C.P.B.; Fehrmann, L.; Jacovine, L.A.G.; von Gadow, K. Biomassa Acima e Abaixo Do Solo e Estimativas de Carbono Para Um Plantio Clonal de Eucalipto No Sudeste Do Brasil. Revista Arvore 2015, 39, 353–363. [CrossRef]
- Wendler, R.; Carvalho, P.O.; Pereira, J.S.; Millard, P. Role of Nitrogen Remobilization from Old Leaves for New Leaf Growth of Eucalyptus Globulus Seedlings. Tree Physiol 1995, 15. [CrossRef]
- Grasel, F.D.S.; Ferrão, M.F.; Wolf, C.R. Development of Methodology for Identification the Nature of the Polyphenolic Extracts by FTIR Associated with Multivariate Analysis. Spectrochim Acta A Mol Biomol Spectrosc 2016, 153, 94–101. [CrossRef]
- Poletto, M.; Ornaghi Júnior, H.L.; Zattera, A.J. Native Cellulose: Structure, Characterization and Thermal Properties. Materials 2014. [CrossRef]
- Yemele, M.C.N.; Koubaa, A.; Cloutier, A.; Soulounganga, P.; Wolcott, M. Effect of Bark Fiber Content and Size on the Mechanical Properties of Bark/HDPE Composites. Compos Part A Appl Sci Manuf 2010, 41, 131–137. [CrossRef]
- Kačík, F.; Ďurkovič, J.; Kačíková, D. Chemical Profiles of Wood Components of Poplar Clones for Their Energy Utilization. Energies (Basel) 2012, 5, 5243–5256. [CrossRef]
- Li, X.; Wei, Y.; Xu, J.; Xu, N.; He, Y. Quantitative Visualization of Lignocellulose Components in Transverse Sections of Moso Bamboo Based on FTIR Macro- and Micro-Spectroscopy Coupled with Chemometrics. Biotechnol Biofuels 2018. [CrossRef]
- Santos, J.; Delgado, N.; Fuentes, J.; Fuentealba, C.; Vega-Lara, J.; García, D.E. Exterior Grade Plywood Adhesives Based on Pine Bark Polyphenols and Hexamine. Ind Crops Prod 2018, 122, 340–348. [CrossRef]
- Santos, J.; Pereira, J.; Escobar-Avello, D.; Ferreira, I.; Vieira, C.; Magalhães, F.D.; Martins, J.M.; Carvalho, L.H. Grape Canes (Vitis Vinifera L.) Applications on Packaging and Particleboard Industry: New Bioadhesive Based on Grape Extracts and Citric Acid. Polymers (Basel) 2022, 14. [CrossRef]
- Santos, J.; Escobar-Avello, D.; Magalhães, P.; Magalhães, F.D.; Martins, J.M.; González-Álvarez, J.; de Carvalho, L.H. High-Value Compounds Obtained from Grape Canes (Vitis Vinifera L.) by Steam Pressure Alkali Extraction. Food and Bioproducts Processing 2022, 133. [CrossRef]
- Xu, F.; Yu, J.; Tesso, T.; Dowell, F.; Wang, D. Qualitative and Quantitative Analysis of Lignocellulosic Biomass Using Infrared Techniques : A Mini-Review. Appl Energy 2013, 104, 801–809. [CrossRef]
- Poletto, M.; Ornaghi Júnior, H.L.; Zattera, A.J. Native Cellulose: Structure, Characterization and Thermal Properties. Materials 2014, 7. [CrossRef]
- Xu, F.; Yu, J.; Tesso, T.; Dowell, F.; Wang, D. Qualitative and Quantitative Analysis of Lignocellulosic Biomass Using Infrared Techniques: A Mini-Review. Appl Energy 2013, 104.
- Poletto, M.; Ornaghi Júnior, H.L.; Zattera, A.J. Native Cellulose: Structure, Characterization and Thermal Properties. Materials 2014, 7. [CrossRef]
- Morales-Cerrada, R.; Tavernier, R.; Caillol, S. Fully Bio-Based Thermosetting Polyurethanes from Bio-Based Polyols and Isocyanates. Polymers (Basel) 2021, 13. [CrossRef]
- Zuliani, A.; Rapisarda, M.; Chelazzi, D.; Baglioni, P.; Rizzarelli, P. Synthesis, Characterization, and Soil Burial Degradation of Biobased Polyurethanes. Polymers (Basel) 2022, 14. [CrossRef]
- Socrates, G. Infrared and Raman Characteristic Group Frequencies. Tables and Charts; 2001;
- Asefnejad, A.; Khorasani, M.T.; Behnamghader, A.; Farsadzadeh, B.; Bonakdar, S. Manufacturing of Biodegradable Polyurethane Scaffolds Based on Polycaprolactone Using a Phase Separation Method: Physical Properties and in Vitro Assay. Int J Nanomedicine 2011, 6. [CrossRef]
- Dong, H.; Xiao, K.; Tang, X.; Zhang, Z.; Dai, J.; Long, R.; Liao, W. Preparation and Characterization of Polyurethane (PU)/Polyvinylidene Fluoride (PVDF) Blending Membrane. Desalination Water Treat 2016, 57. [CrossRef]
- Hosseinpourpia, R.; Adamopoulos, S.; Echart, A.S.; Eceiza, A. Polyurethane Films Prepared with Isophorone Diisocyanate Functionalized Wheat Starch. Eur Polym J 2021, 161. [CrossRef]
- Meng, Q.B.; Lee, S. Il; Nah, C.; Lee, Y.S. Preparation of Waterborne Polyurethanes Using an Amphiphilic Diol for Breathable Waterproof Textile Coatings. Prog Org Coat 2009, 66. [CrossRef]
- Katović, D.; Grgac, S.F.; Bischof-Vukušić, S.; Katović, A. Formaldehyde Free Binding System for Flame Retardant Finishing of Cotton Fabrics. Fibres and Textiles in Eastern Europe 2012, 90.
- Son, T.W.; Lee, D.W.; Lim, S.K. Thermal and Phase Behavior of Polyurethane Based on Chain Extender, 2,2-Bis-[4-(2-Hydroxyethoxy)Phenyl]Propane. Polym J 1999, 31. [CrossRef]
- Noureddine, B.; Zitouni, S.; Achraf, B.; Houssém, C.; Jannick, D.R.; Jean-François, G. Development and Characterization of Tailored Polyurethane Foams for Shock Absorption. Applied Sciences (Switzerland) 2022, 12. [CrossRef]
- Bakhshi, H.; Yeganeh, H.; Yari, A.; Nezhad, S.K. Castor Oil-Based Polyurethane Coatings Containing Benzyl Triethanol Ammonium Chloride: Synthesis, Characterization, and Biological Properties. J Mater Sci 2014, 49. [CrossRef]
- Benzie, I.; Strain, J. The Ferric Reducing Ability of Plasma(FRAP)as a Measure of “Antioxidan Power”:The FRAP Assay Analytical Biochemistry. Anal Biochem 1996, 239.
- Brand-Williams, W.; Cuvelier, M.E.; Berset, C. Use of a Free Radical Method to Evaluate Antioxidant Activity. LWT - Food Science and Technology 1995, 28.
- Allehyani, E.S. Surface Functionalization of Polyester Textiles for Antibacterial and Antioxidant Properties. Polymers (Basel) 2022, 14. [CrossRef]
Figure 1.
Particle size distribution in weight of the original milled BLE particles.
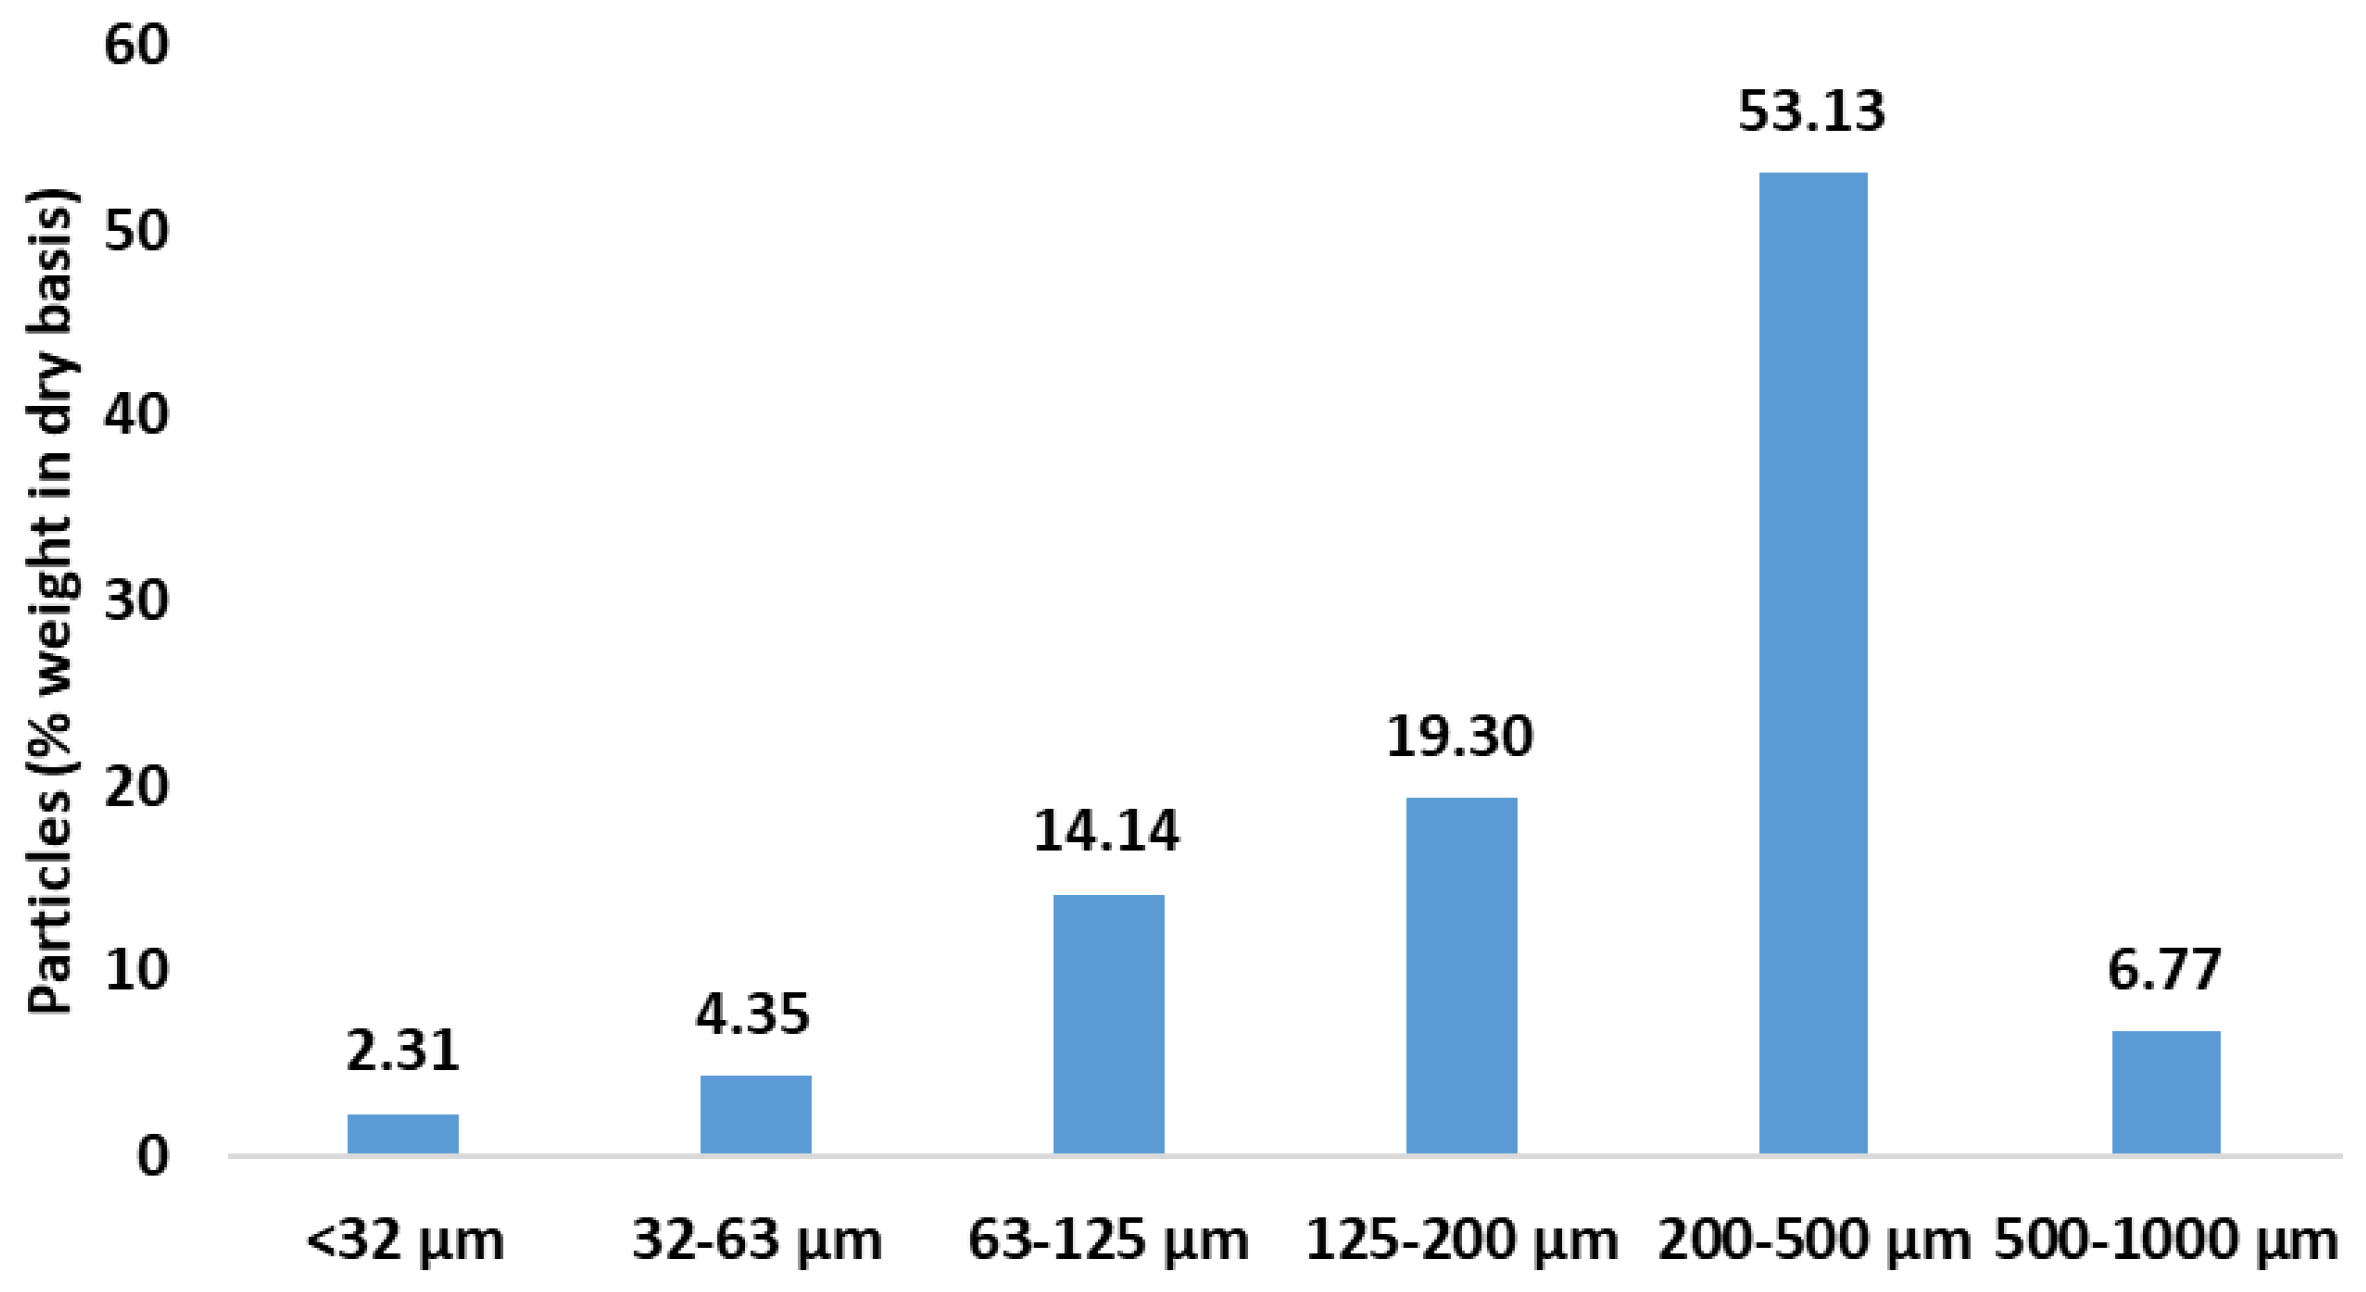
Figure 2.
Thermogravimetric analysis curve (TGA) and first derivative (DTG) obtained for Eucalyptus BLE particles.
Figure 2.
Thermogravimetric analysis curve (TGA) and first derivative (DTG) obtained for Eucalyptus BLE particles.
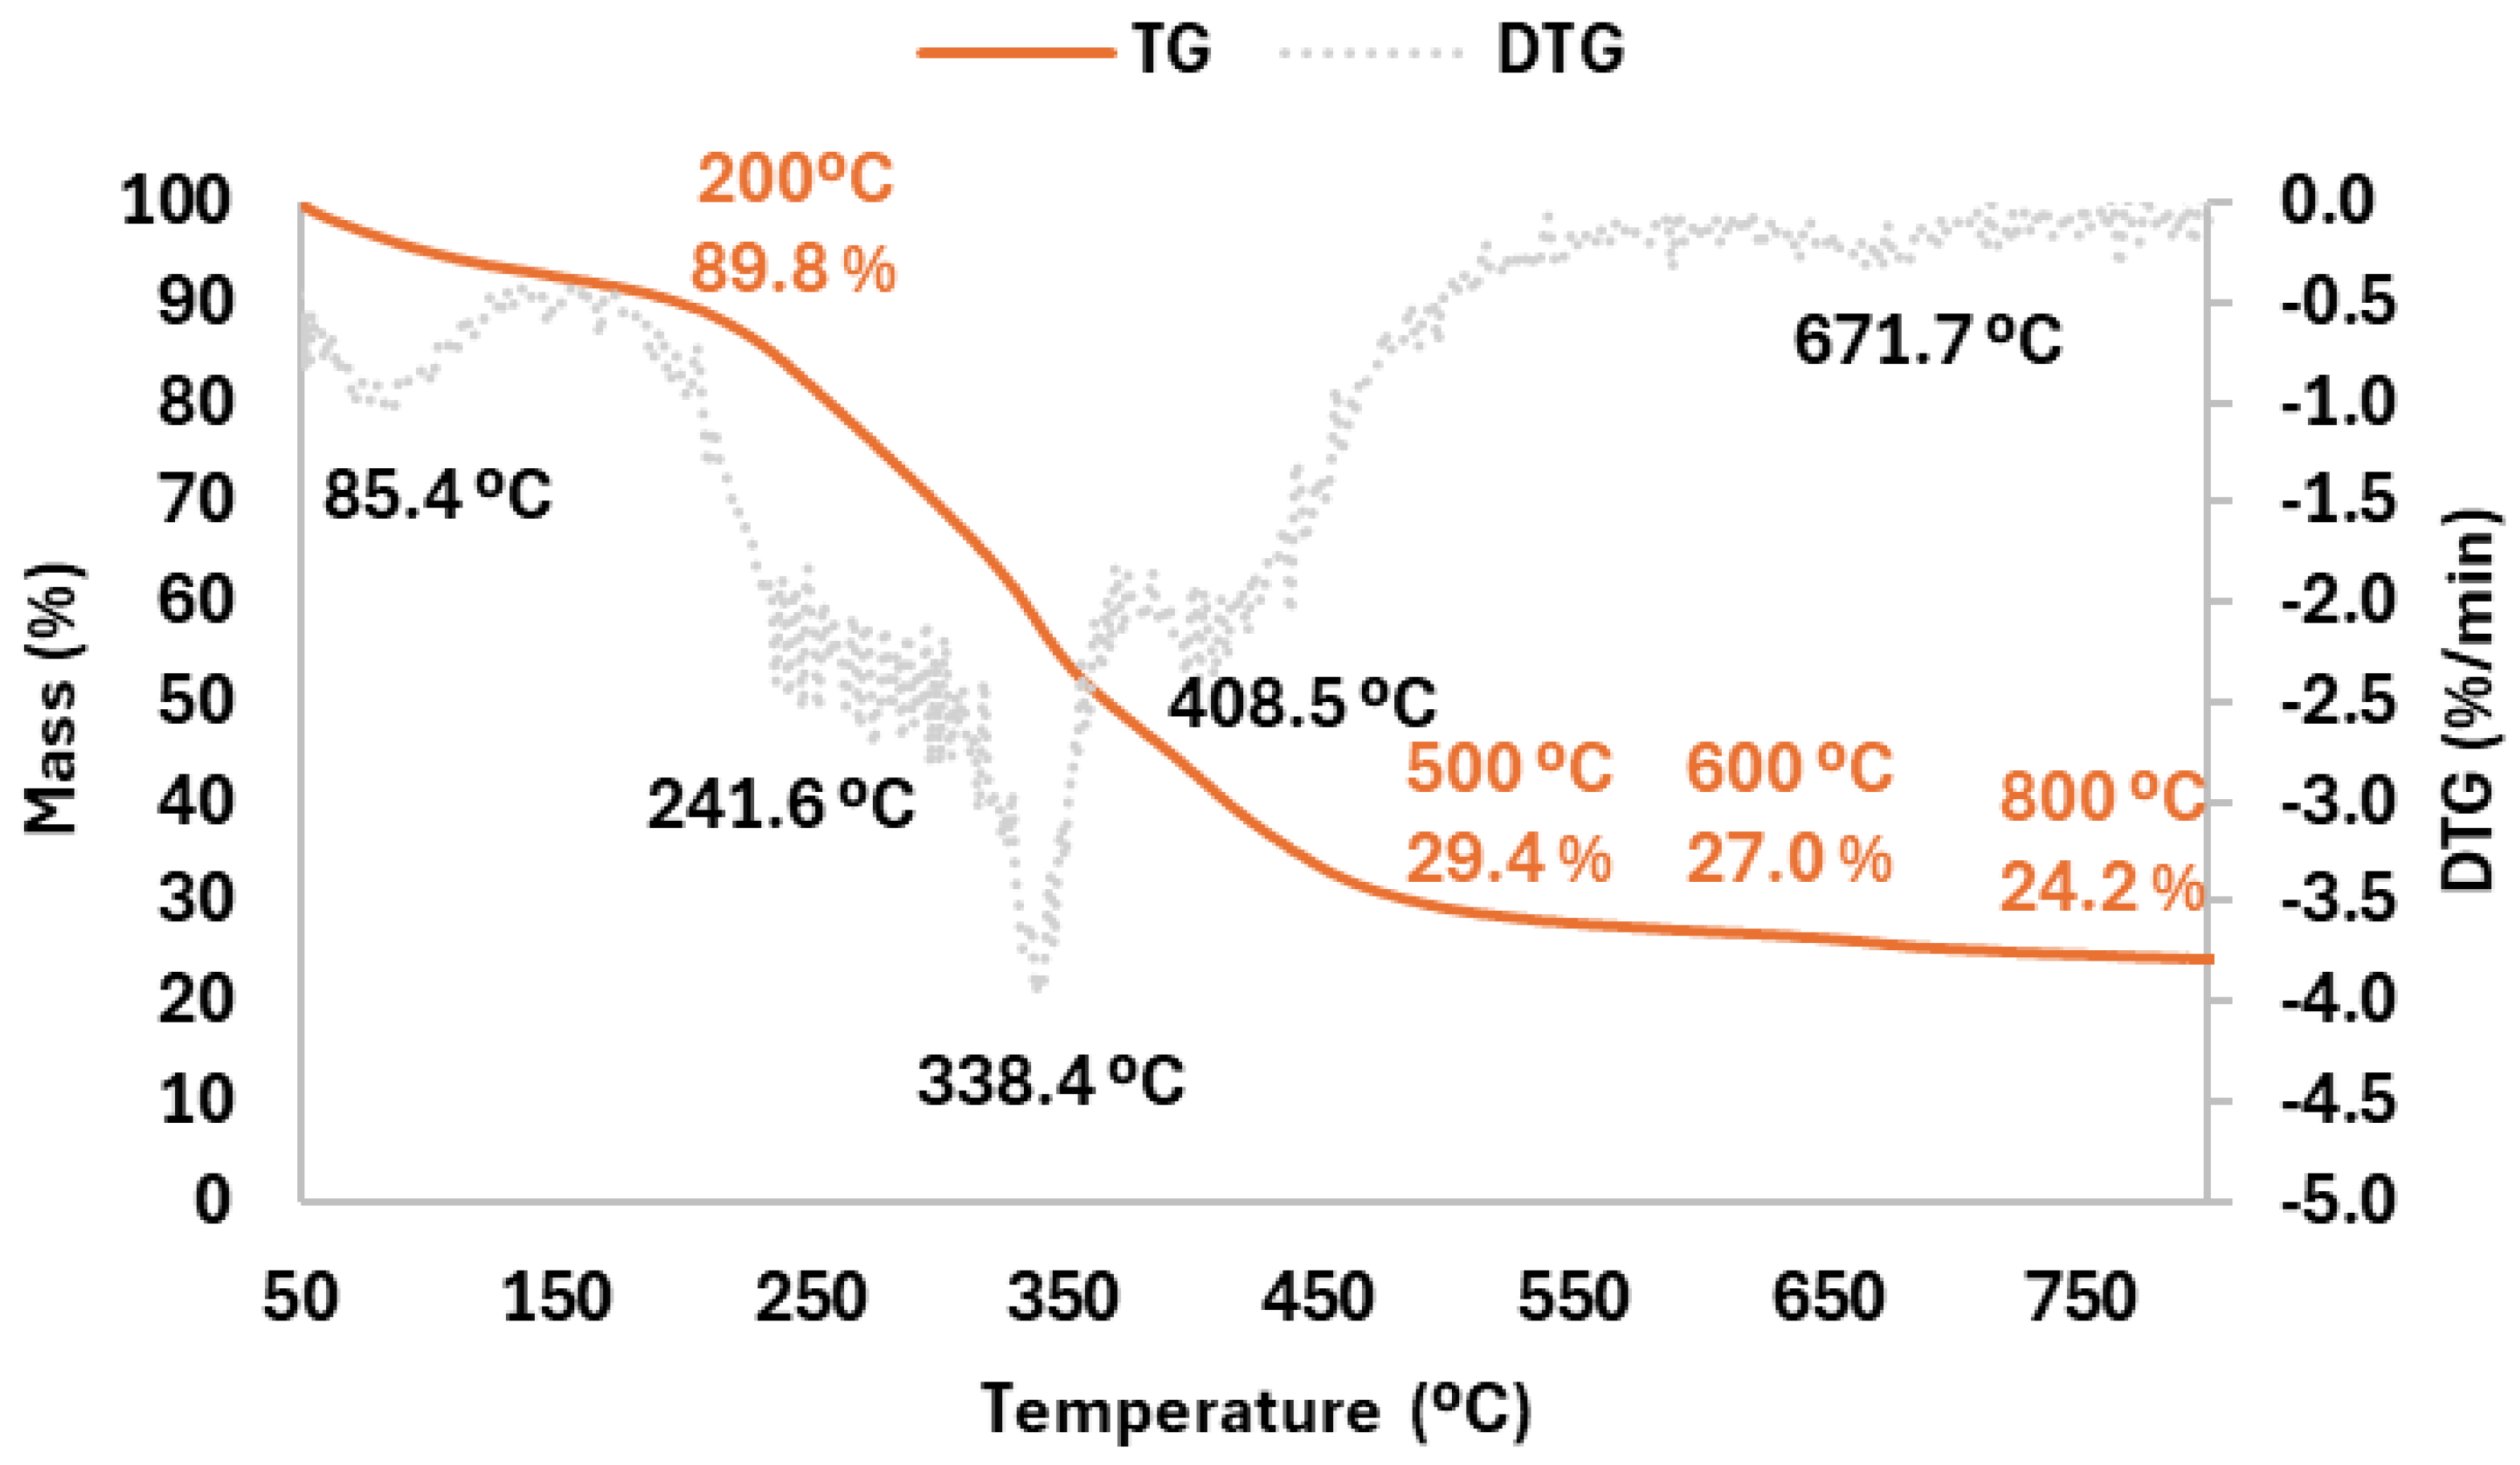
Figure 3.
Evaluation of the storage time impact on the BLE particles chemical composition (Extraction yield, protein, sugar and phenol content). Samples subscripted by different letters are significantly different in terms of impact of storage time p < 0.05.
Figure 3.
Evaluation of the storage time impact on the BLE particles chemical composition (Extraction yield, protein, sugar and phenol content). Samples subscripted by different letters are significantly different in terms of impact of storage time p < 0.05.
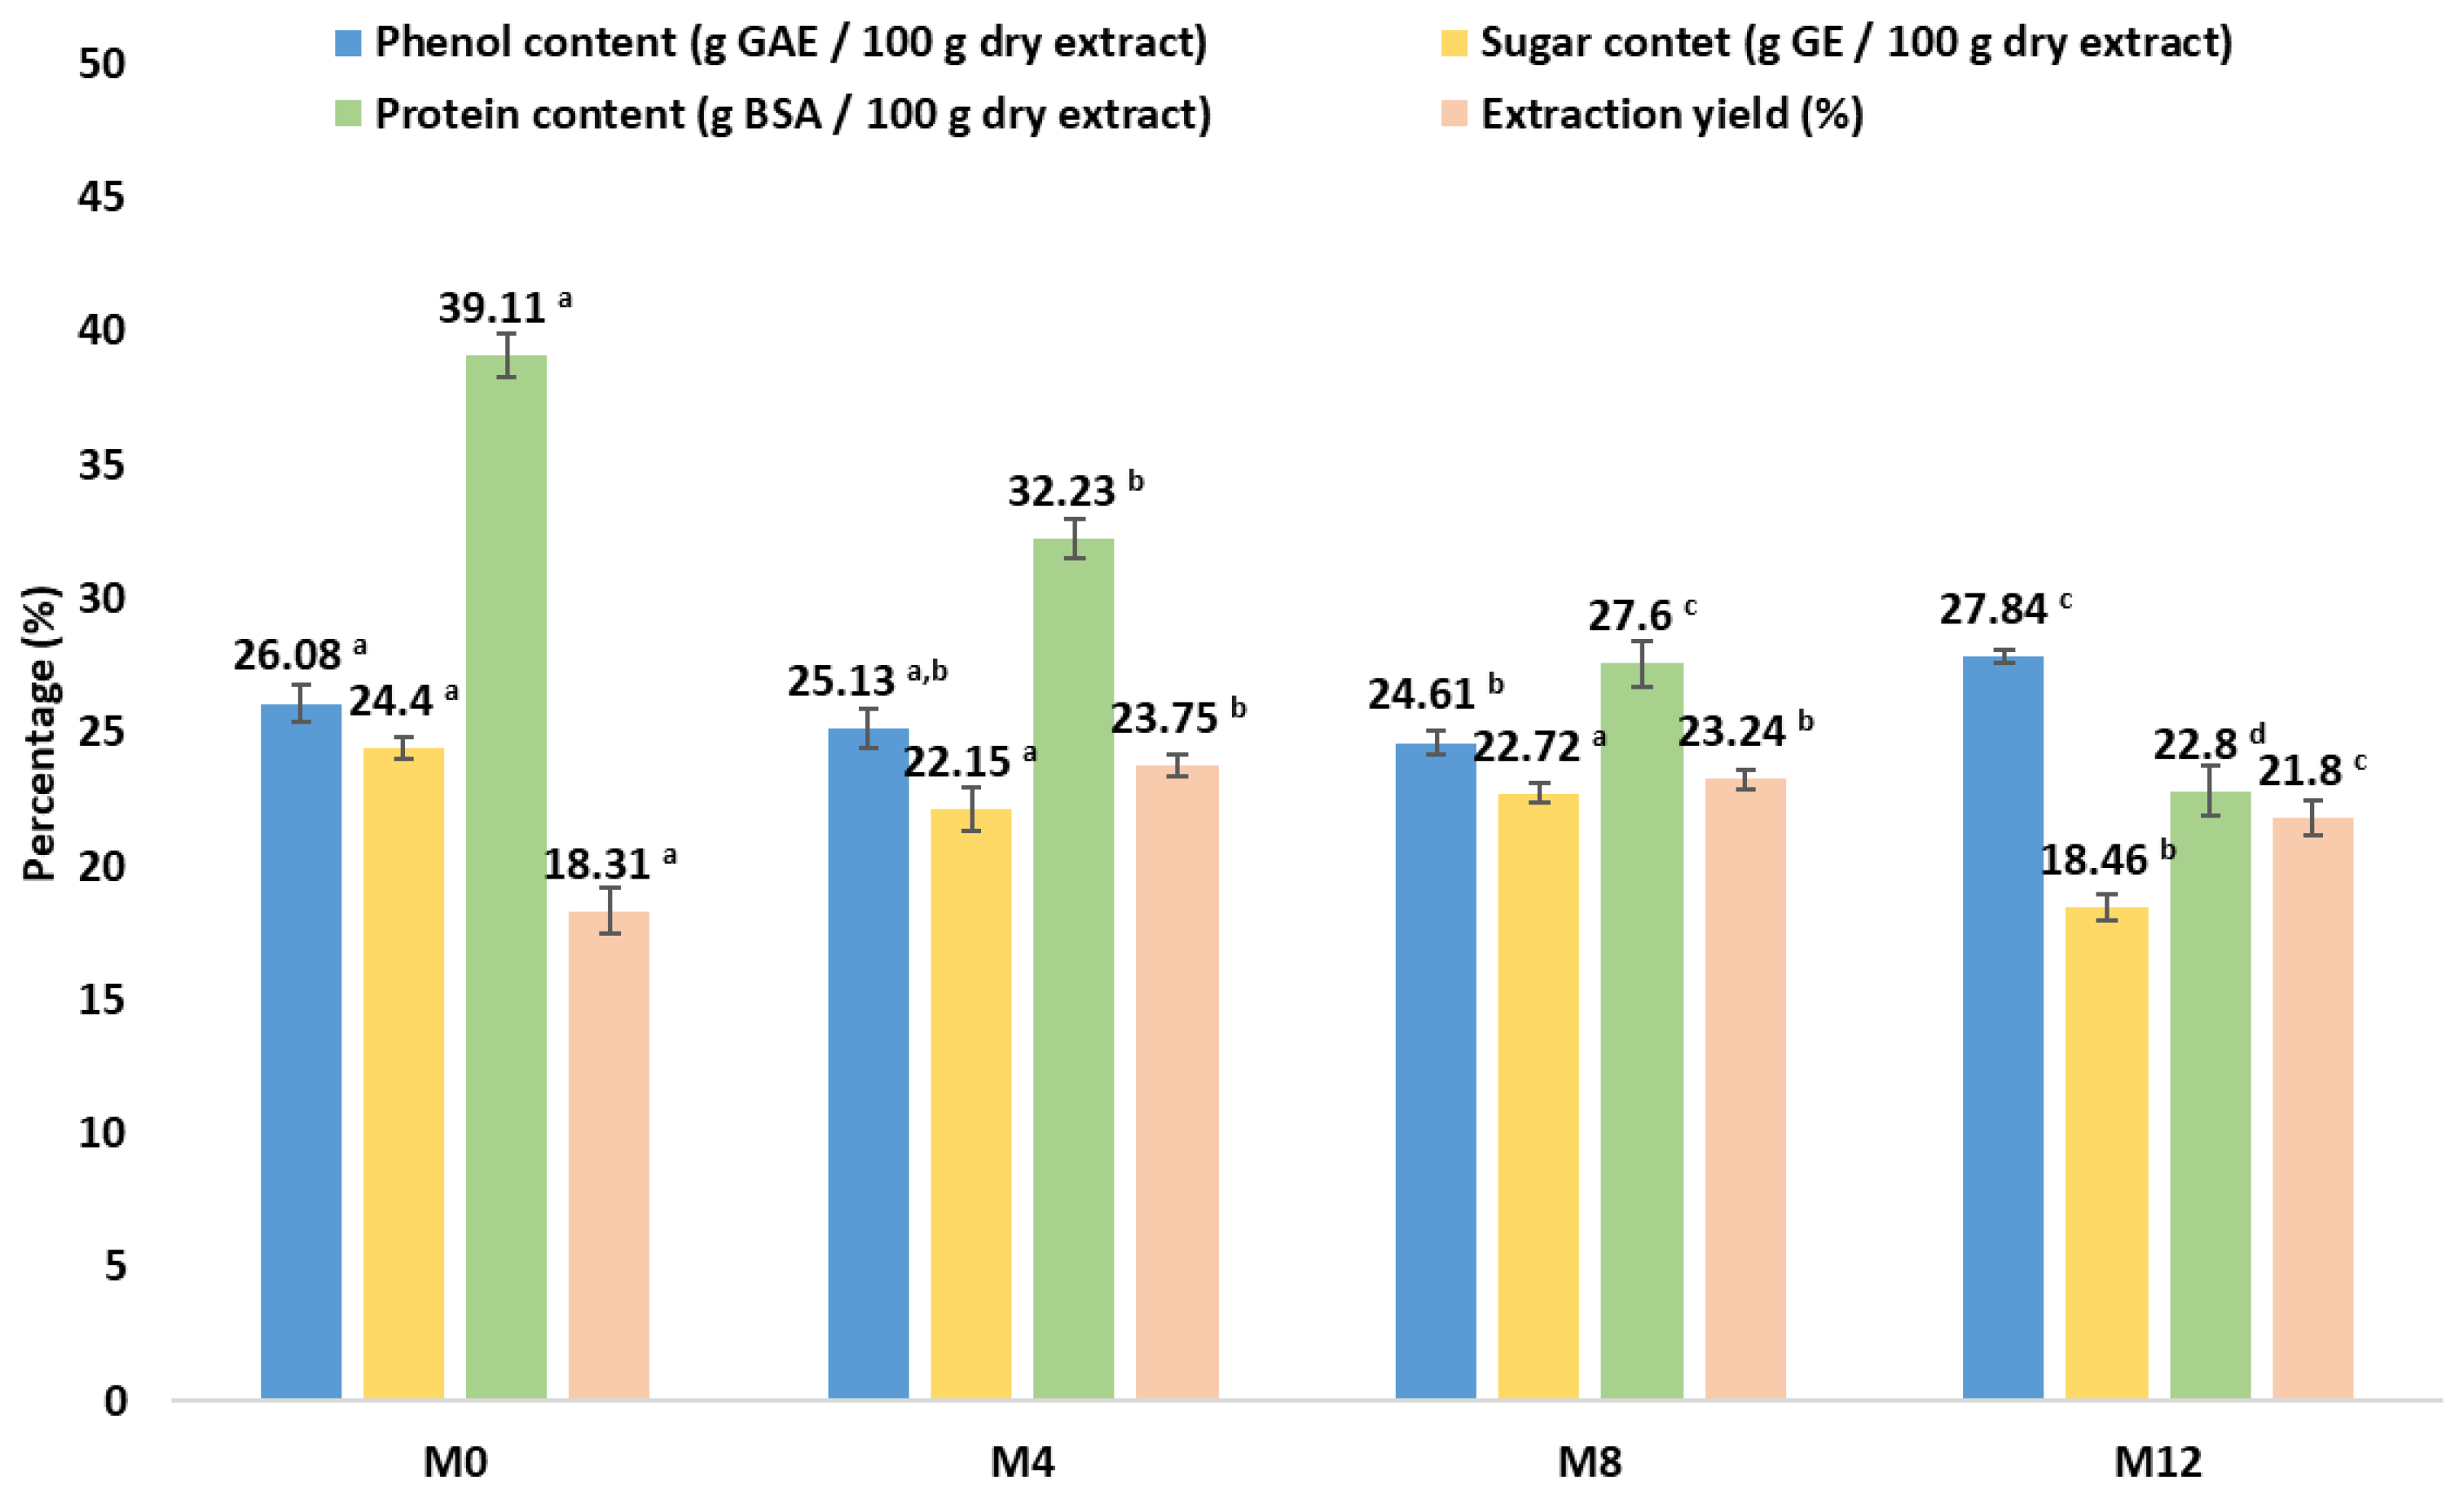
Figure 4.
SEM micrographs of the BLE samples (BLE32, BLE125 BLE200, and BLE500) at 250, 1000 and 2000 magnifications.
Figure 4.
SEM micrographs of the BLE samples (BLE32, BLE125 BLE200, and BLE500) at 250, 1000 and 2000 magnifications.
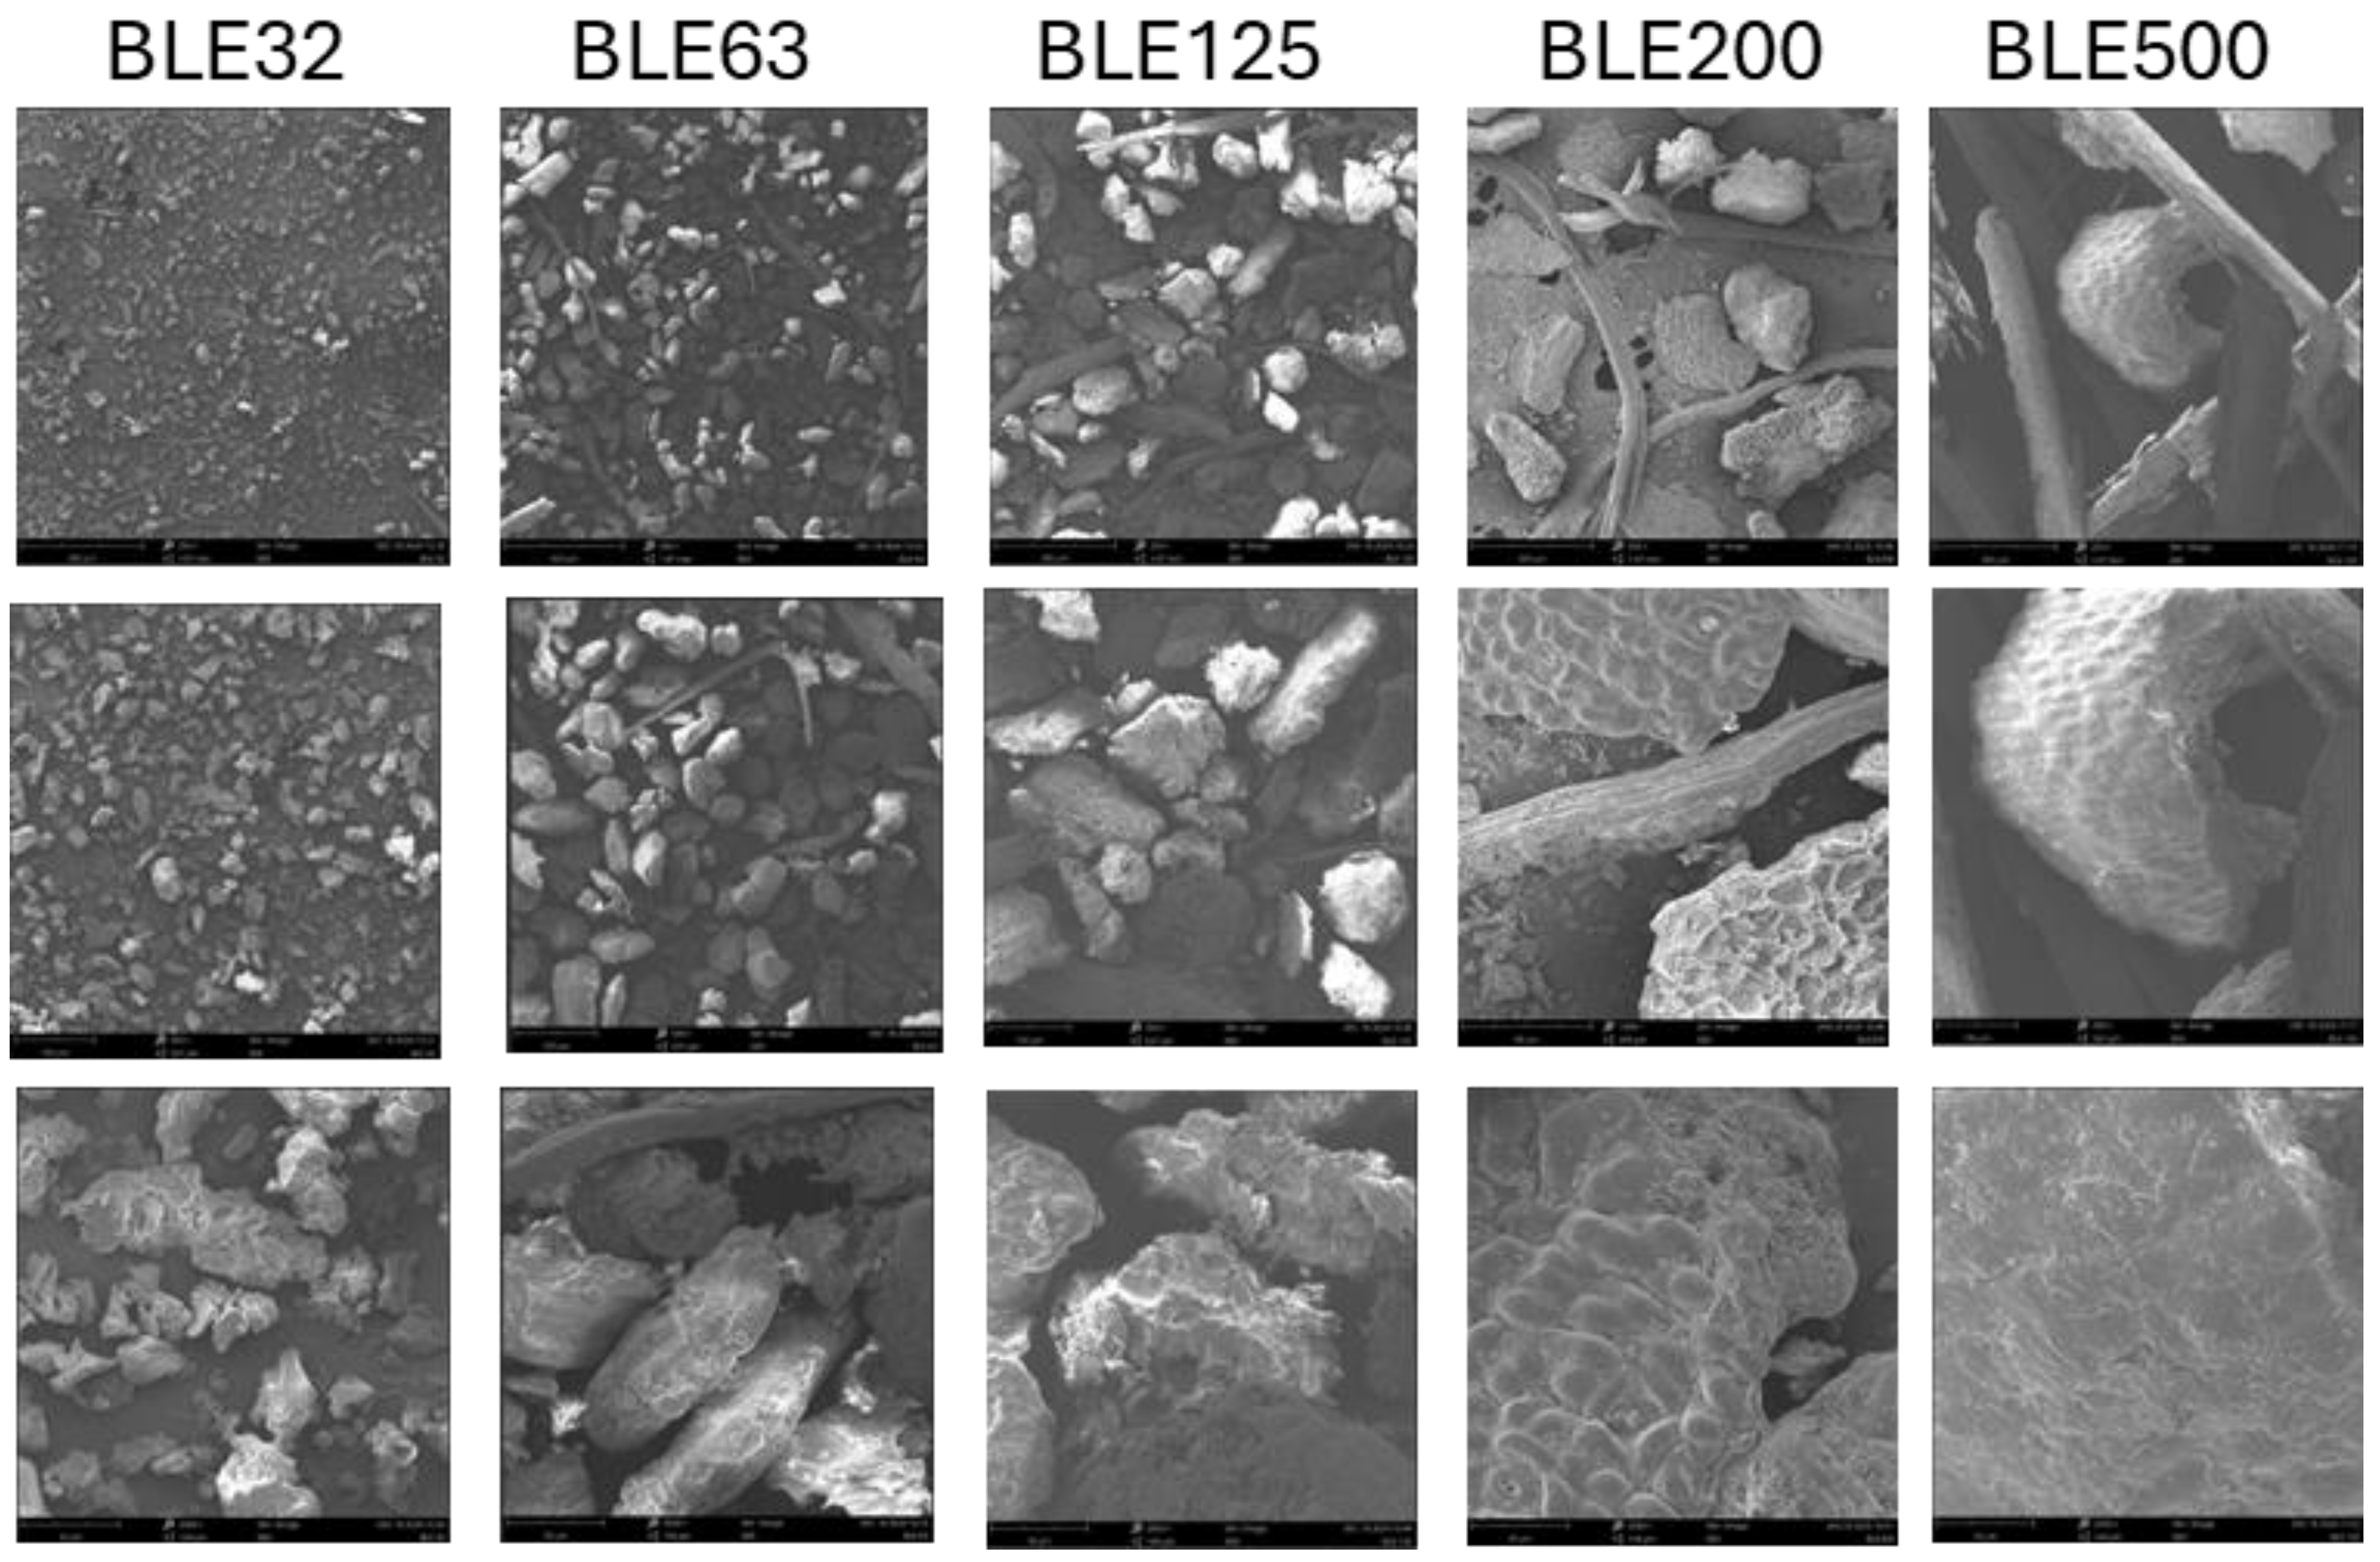
Figure 6.
shows the colour changes of the coated fabrics, in the CIELAB colour space due to the light exposure. (ΔL*, Δa*, Δb* and ΔE* are the variation of the CIELAB colour space parameters).
Figure 6.
shows the colour changes of the coated fabrics, in the CIELAB colour space due to the light exposure. (ΔL*, Δa*, Δb* and ΔE* are the variation of the CIELAB colour space parameters).
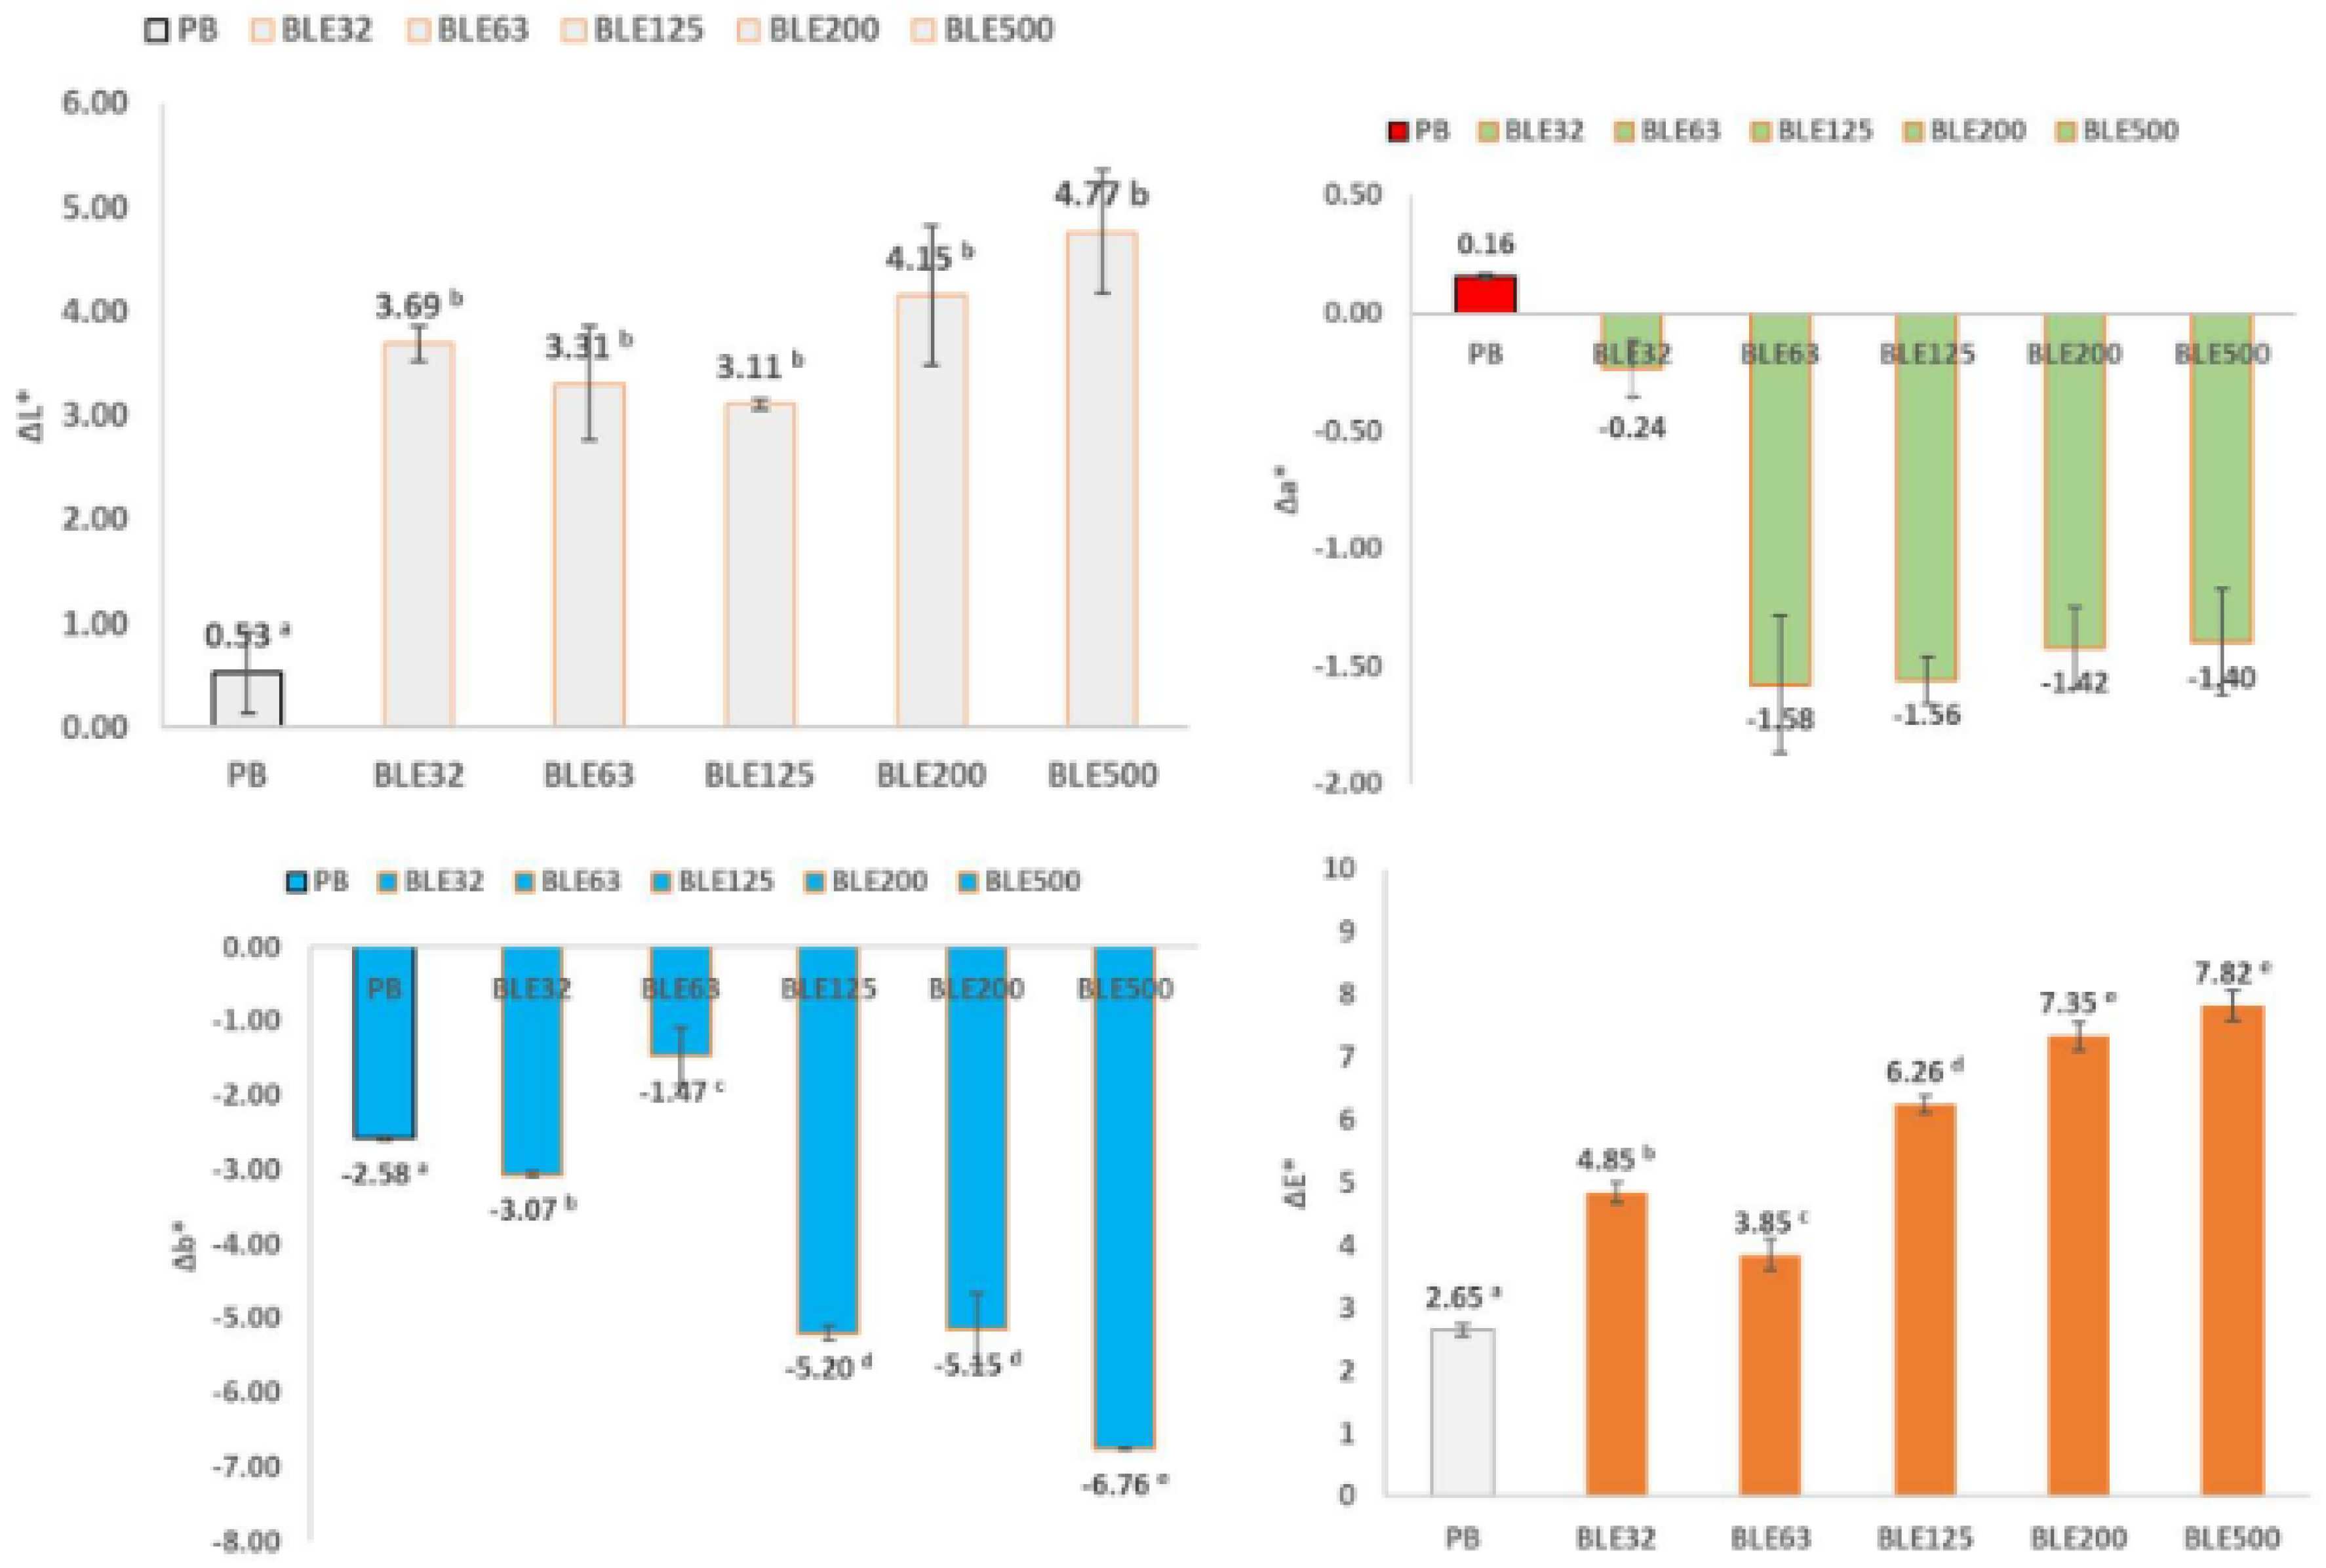
Figure 7.
Scanning electron microscopy micrographs of the coated textile samples produced with the WPU solution alone and mixed with the BLE particles surface (a) and cross section(b) at 500 and 2000 magnifications.
Figure 7.
Scanning electron microscopy micrographs of the coated textile samples produced with the WPU solution alone and mixed with the BLE particles surface (a) and cross section(b) at 500 and 2000 magnifications.
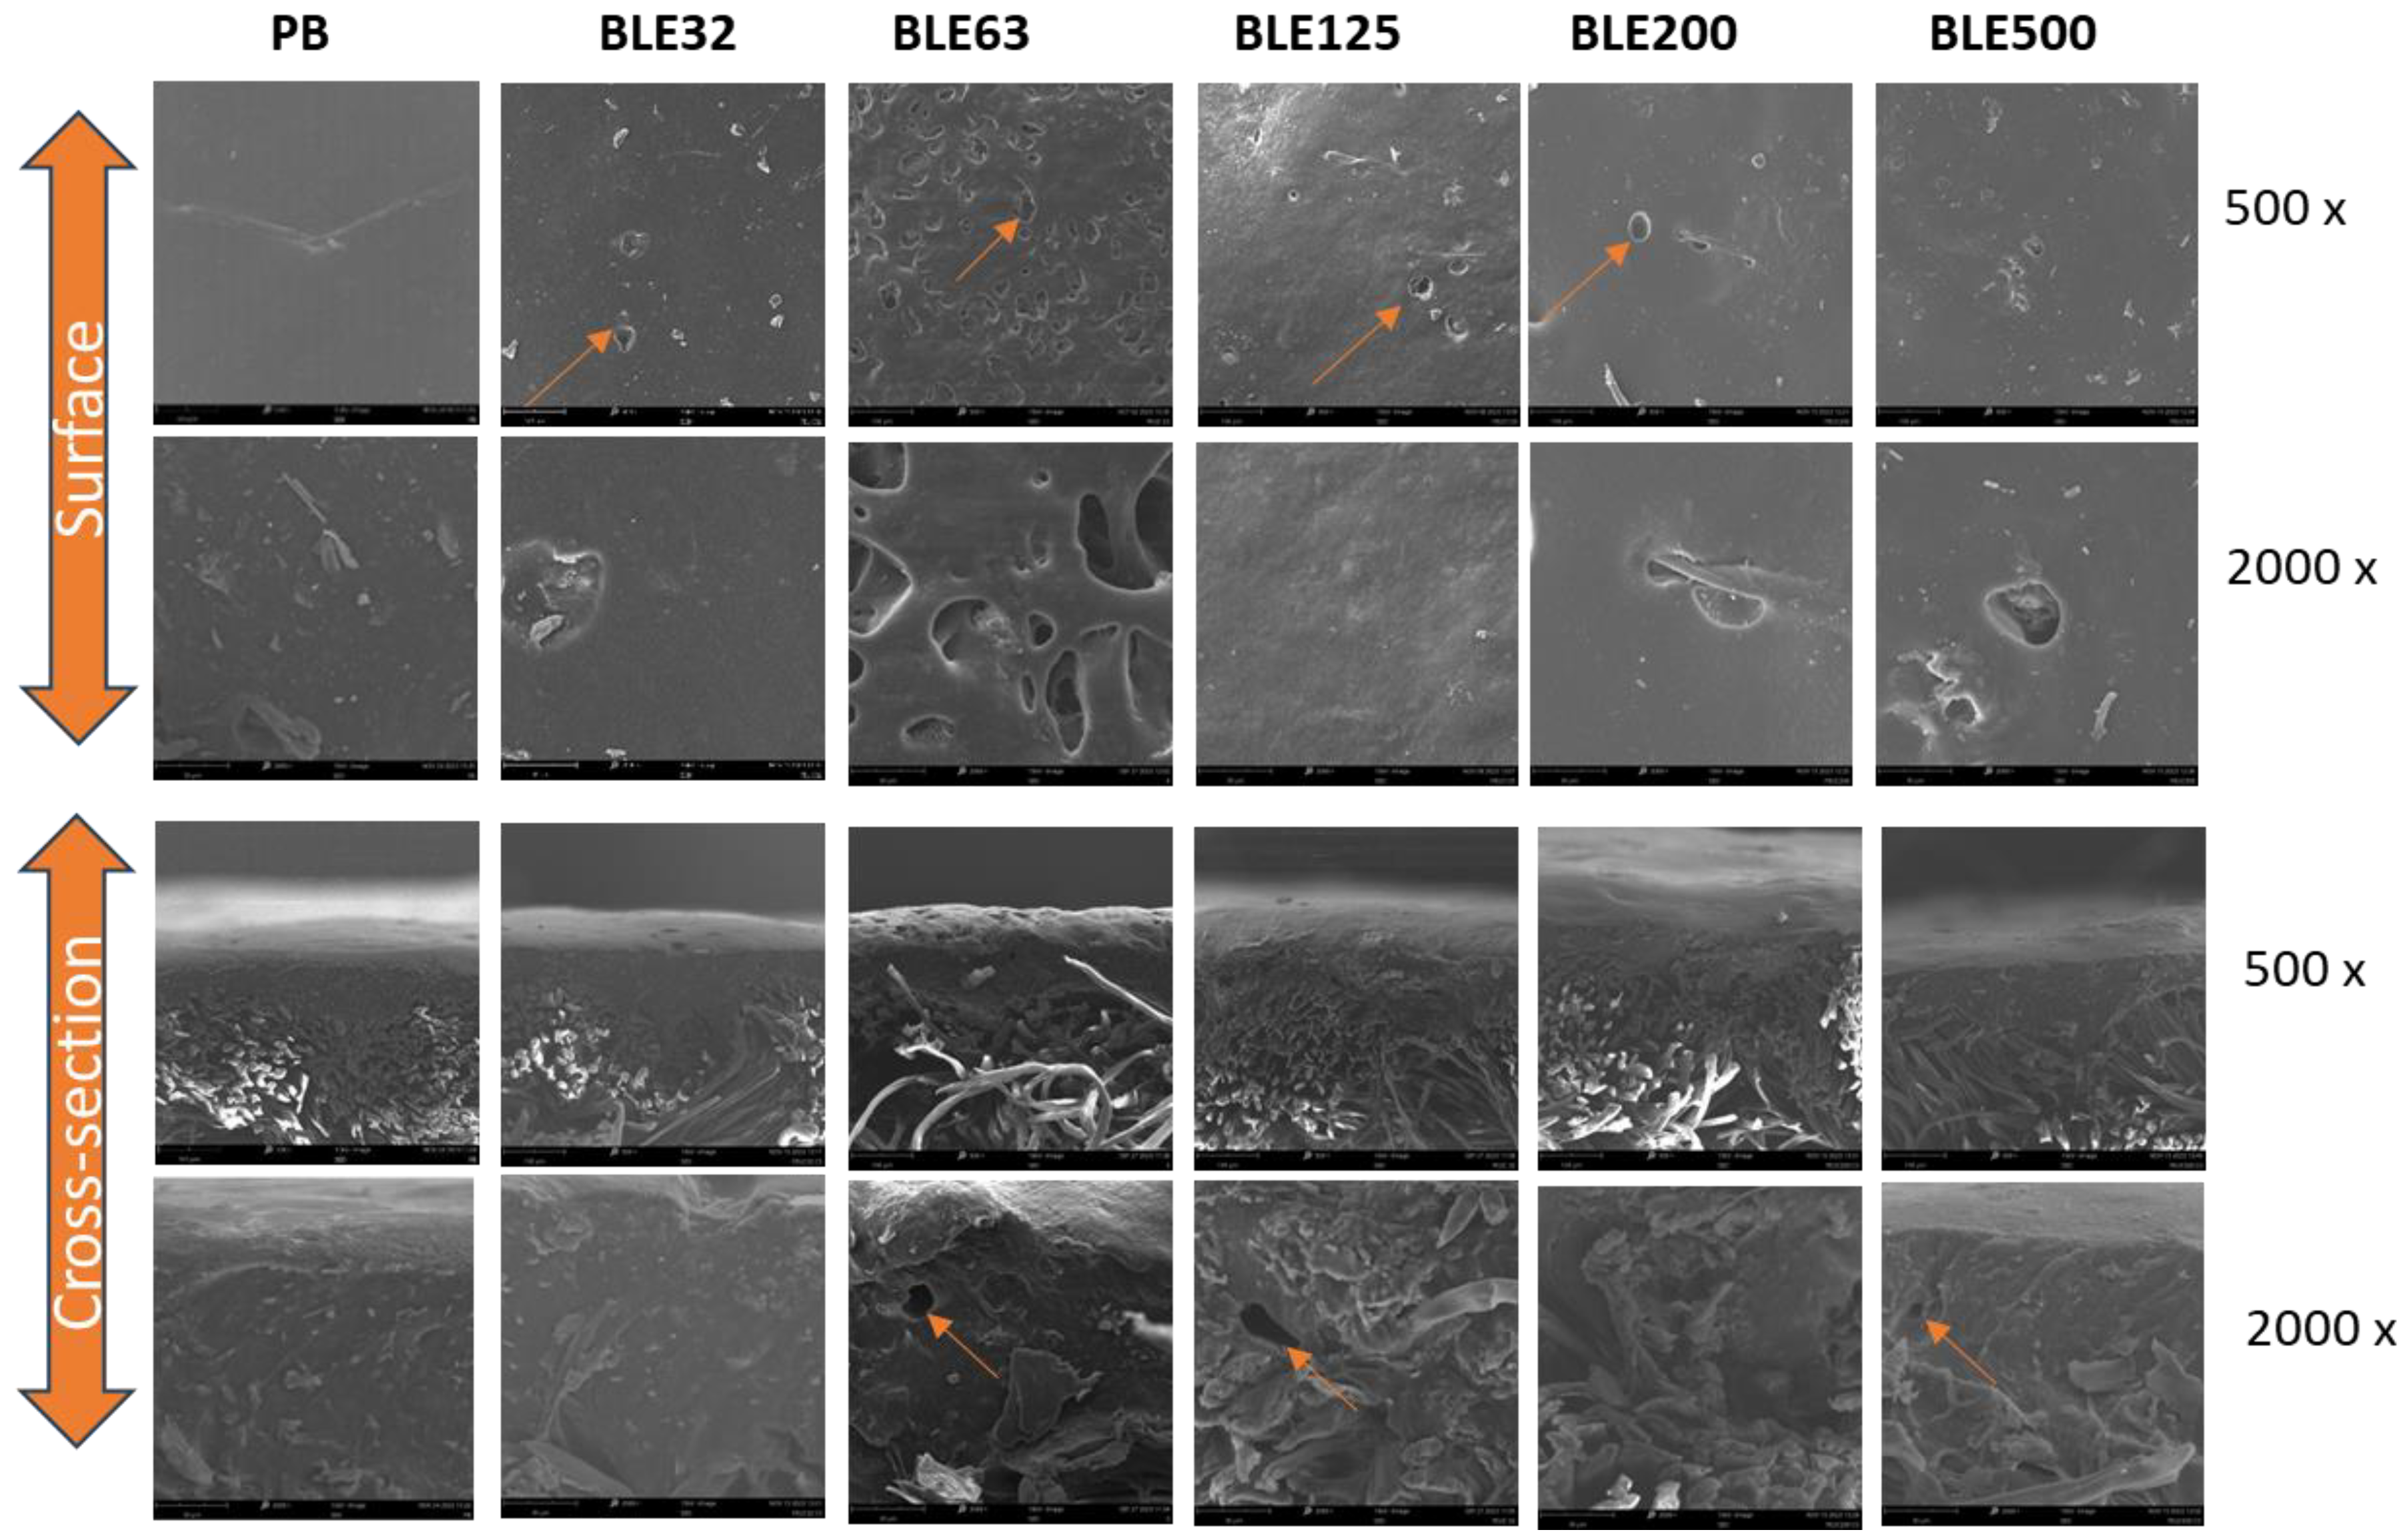
Figure 8.
FTIR spectra: Coatings without (PB) and with Branches and leaves of Eucalyptus Globulus (BLE) with different particle size distribution a) (4000–500 cm-1) and b) (1800-600 cm-1).
Figure 8.
FTIR spectra: Coatings without (PB) and with Branches and leaves of Eucalyptus Globulus (BLE) with different particle size distribution a) (4000–500 cm-1) and b) (1800-600 cm-1).
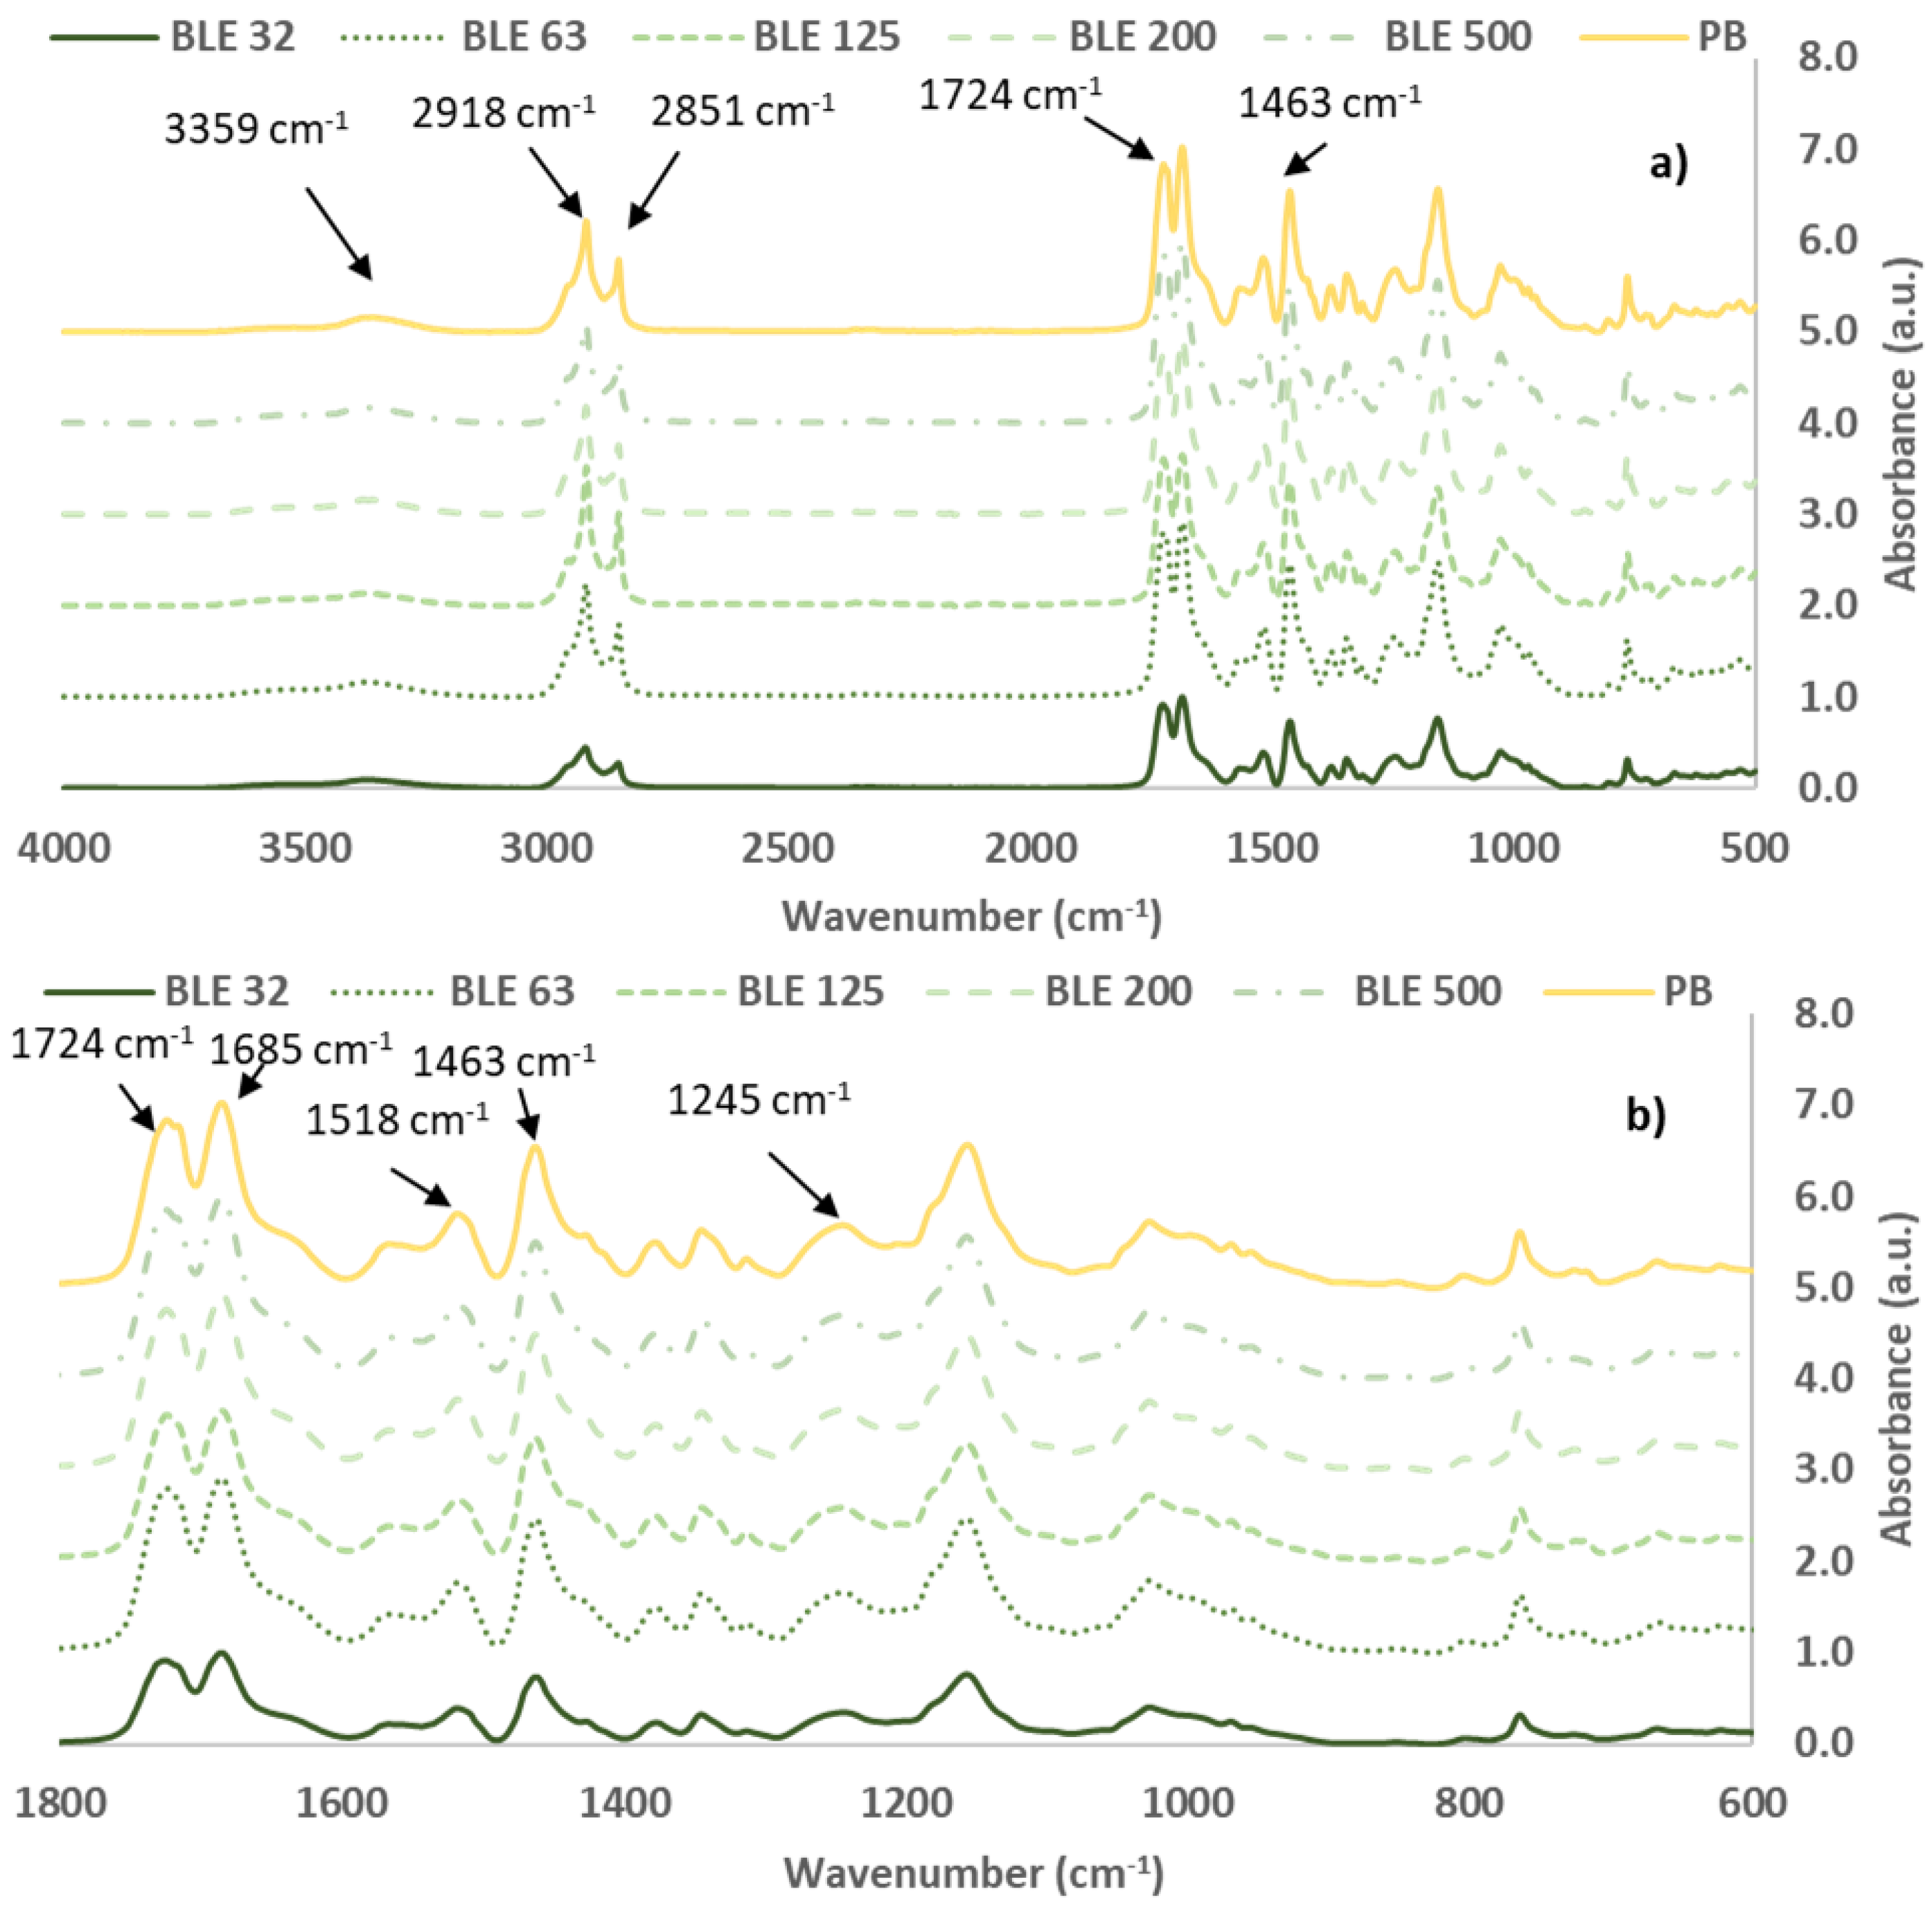
Figure 9.
Wettability of Coated textile products without (PB) and with Branches and leaves of Eucalyptus (BLE) with different particle size distribution a) water contact angle and b) Hexadecane contact angle Values are presented as mean (n=6). Samples subscripted by different capital letters are significantly different at p < 0.05.
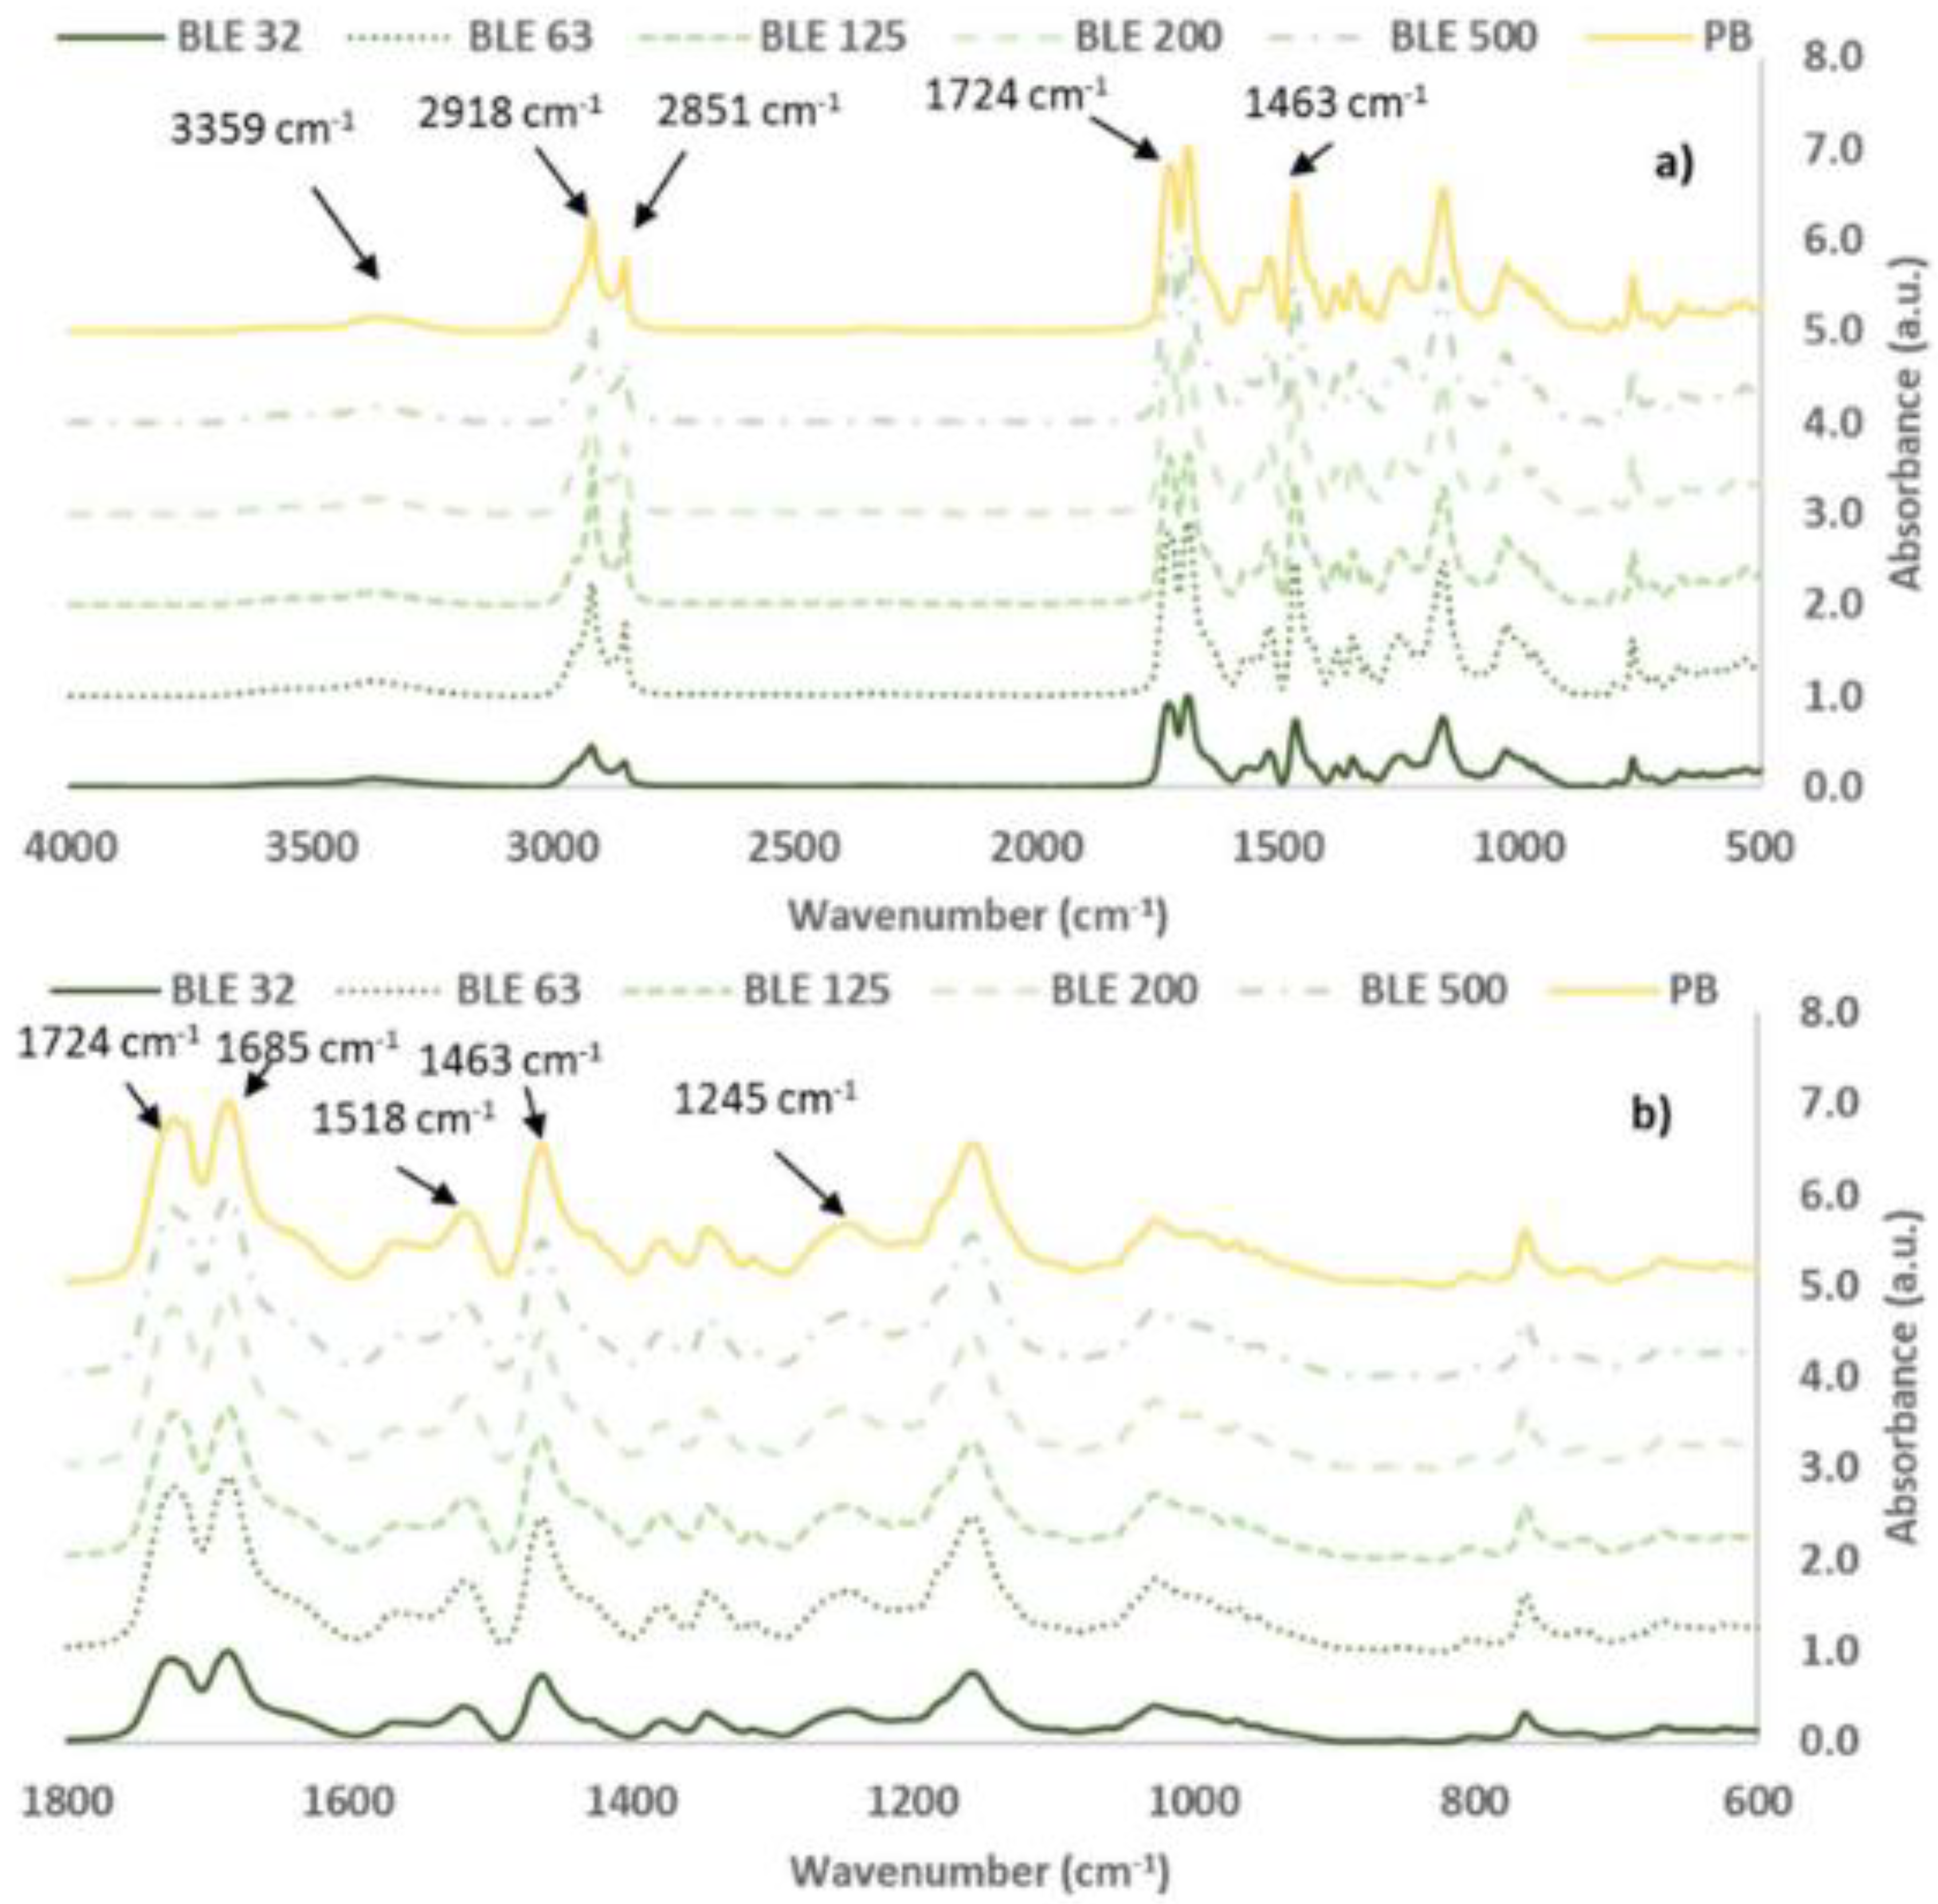
Figure 10.
Force versus elongation in the wale direction of the original cotton fabric (MAM) and the coated without (PB) and with BLE particles (BLE32-500) (Samples dimensions: 4x10 cm; Speed 20 mm/min).
Figure 10.
Force versus elongation in the wale direction of the original cotton fabric (MAM) and the coated without (PB) and with BLE particles (BLE32-500) (Samples dimensions: 4x10 cm; Speed 20 mm/min).
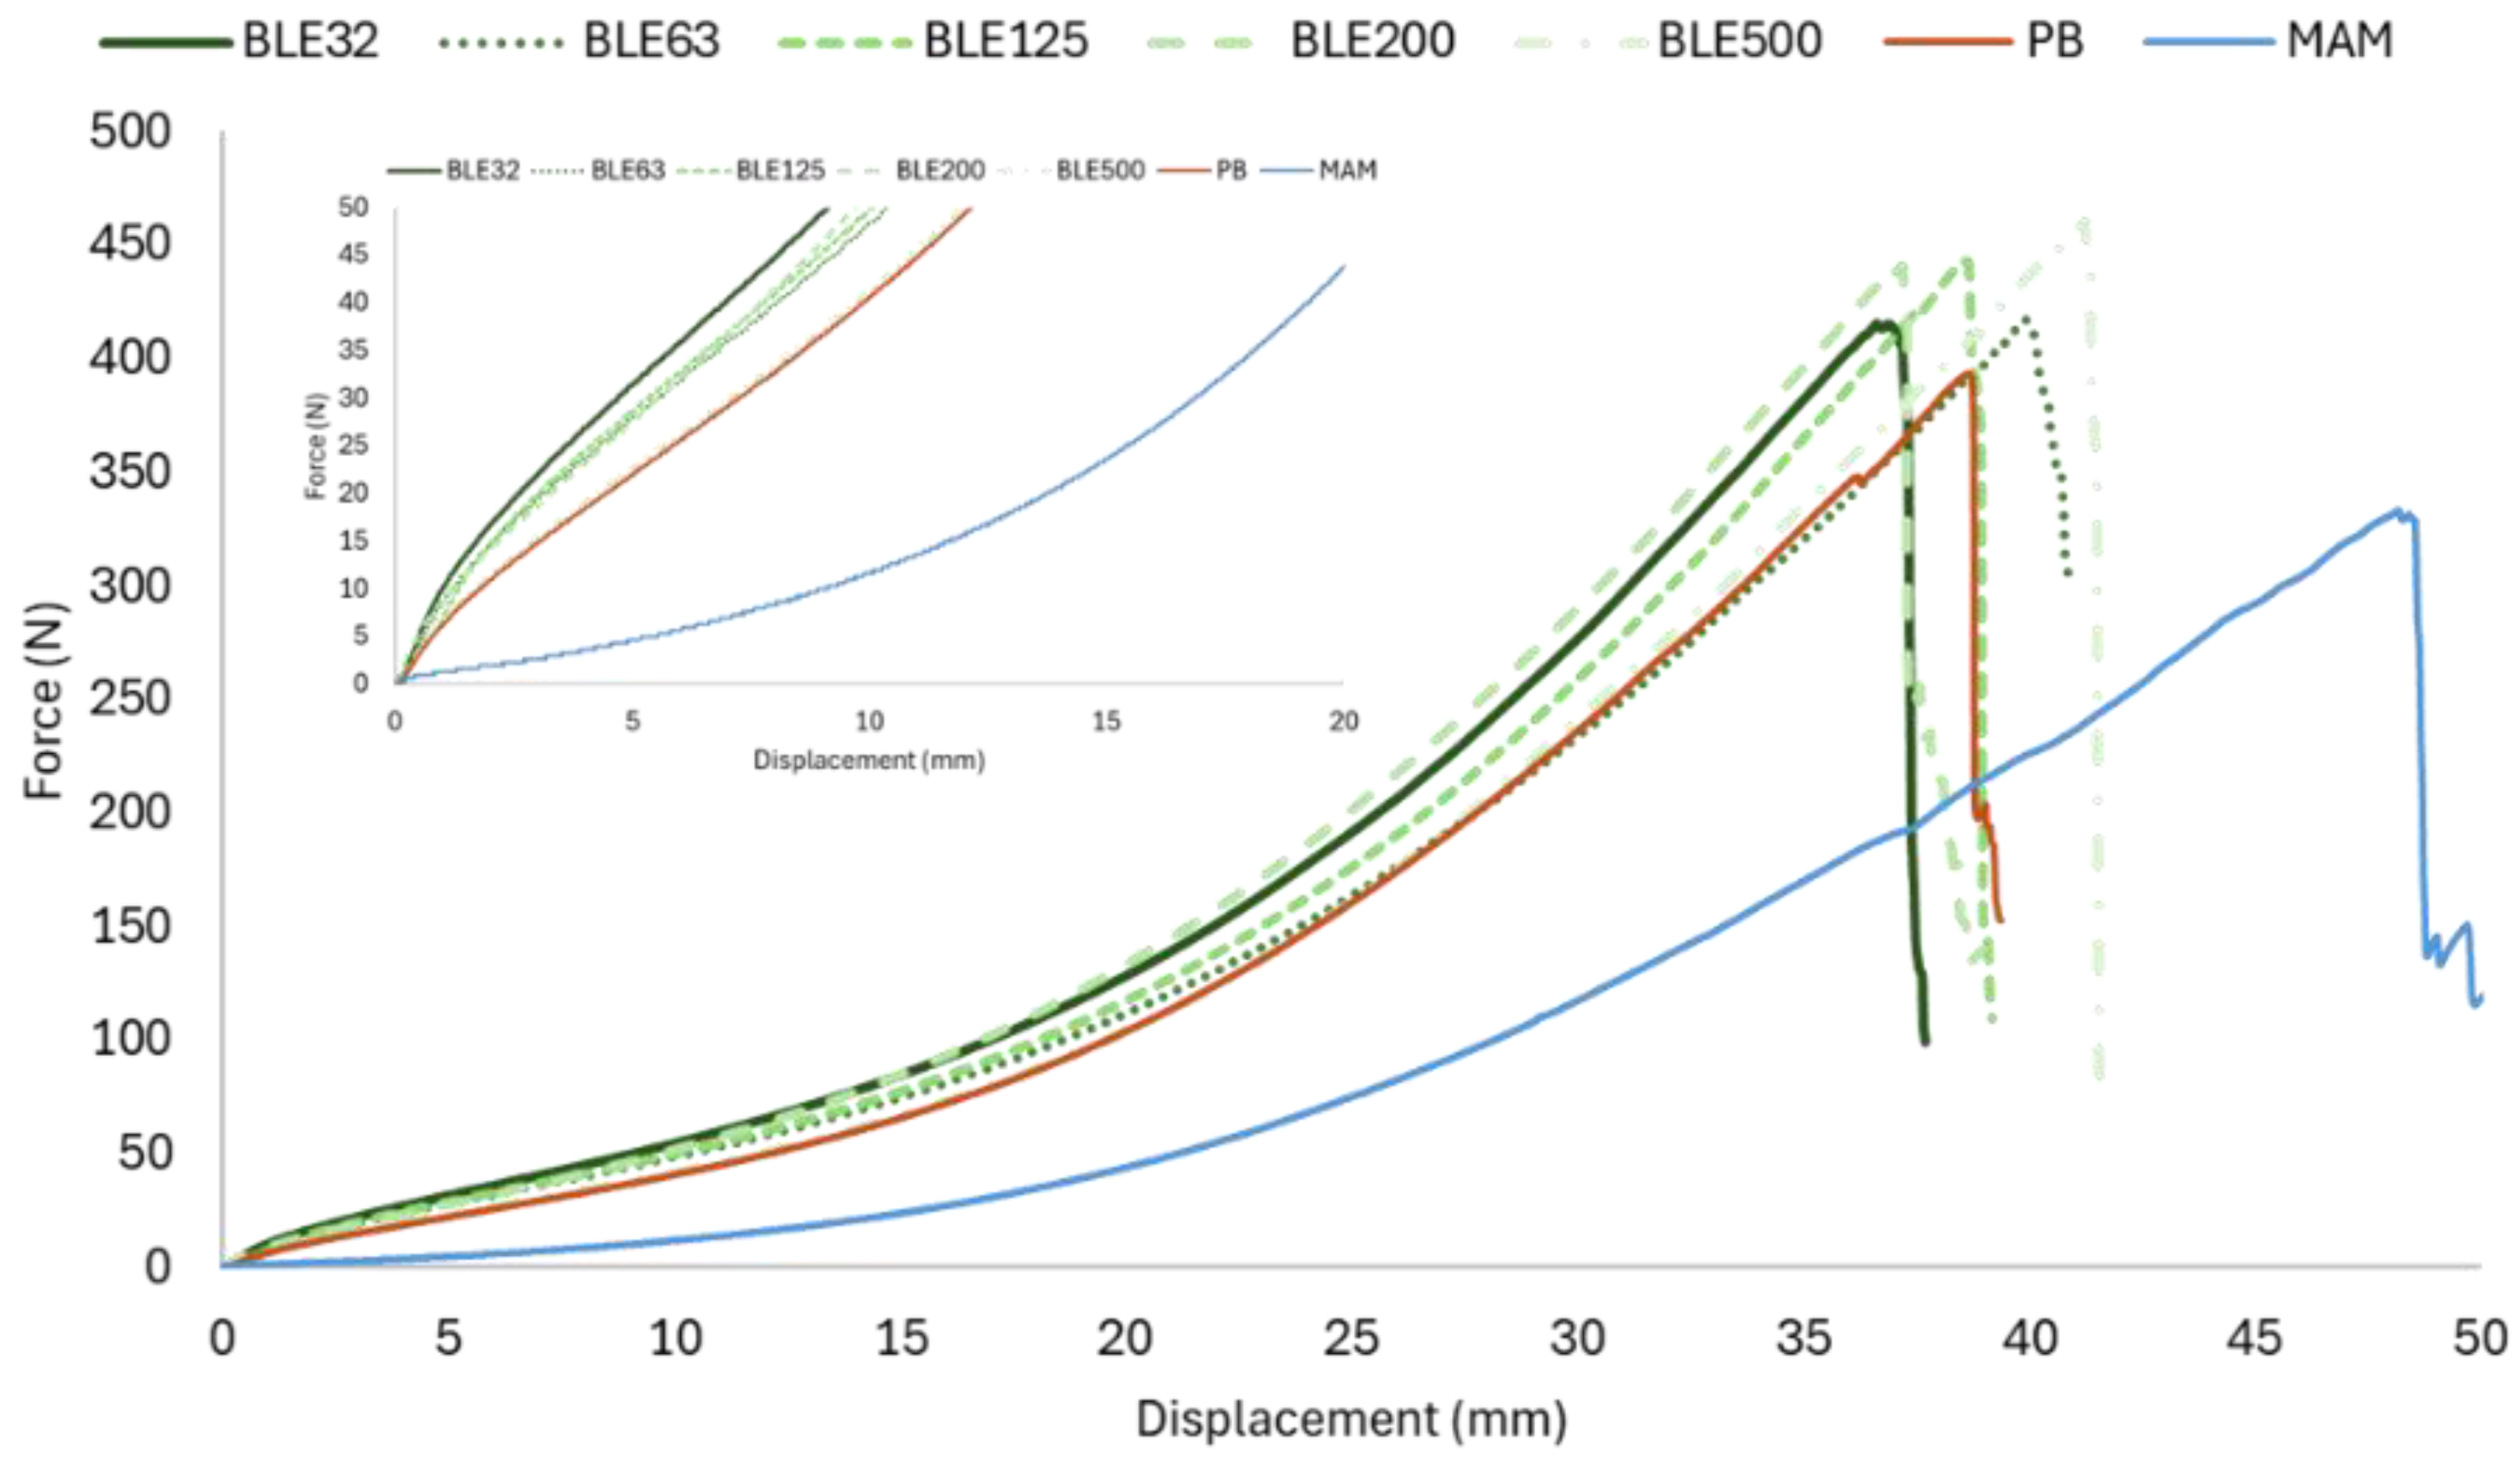
Figure 11.
Breaking forces (N) a) Maximum Elongation (%) b), and elongation at 50 N c) measured in the test samples in the wale direction of the coated cotton knits (Samples dimensions: 4x10 cm; Speed 20 mm/min) Samples subscripted by different capital letters are significantly different at p < 0.05.
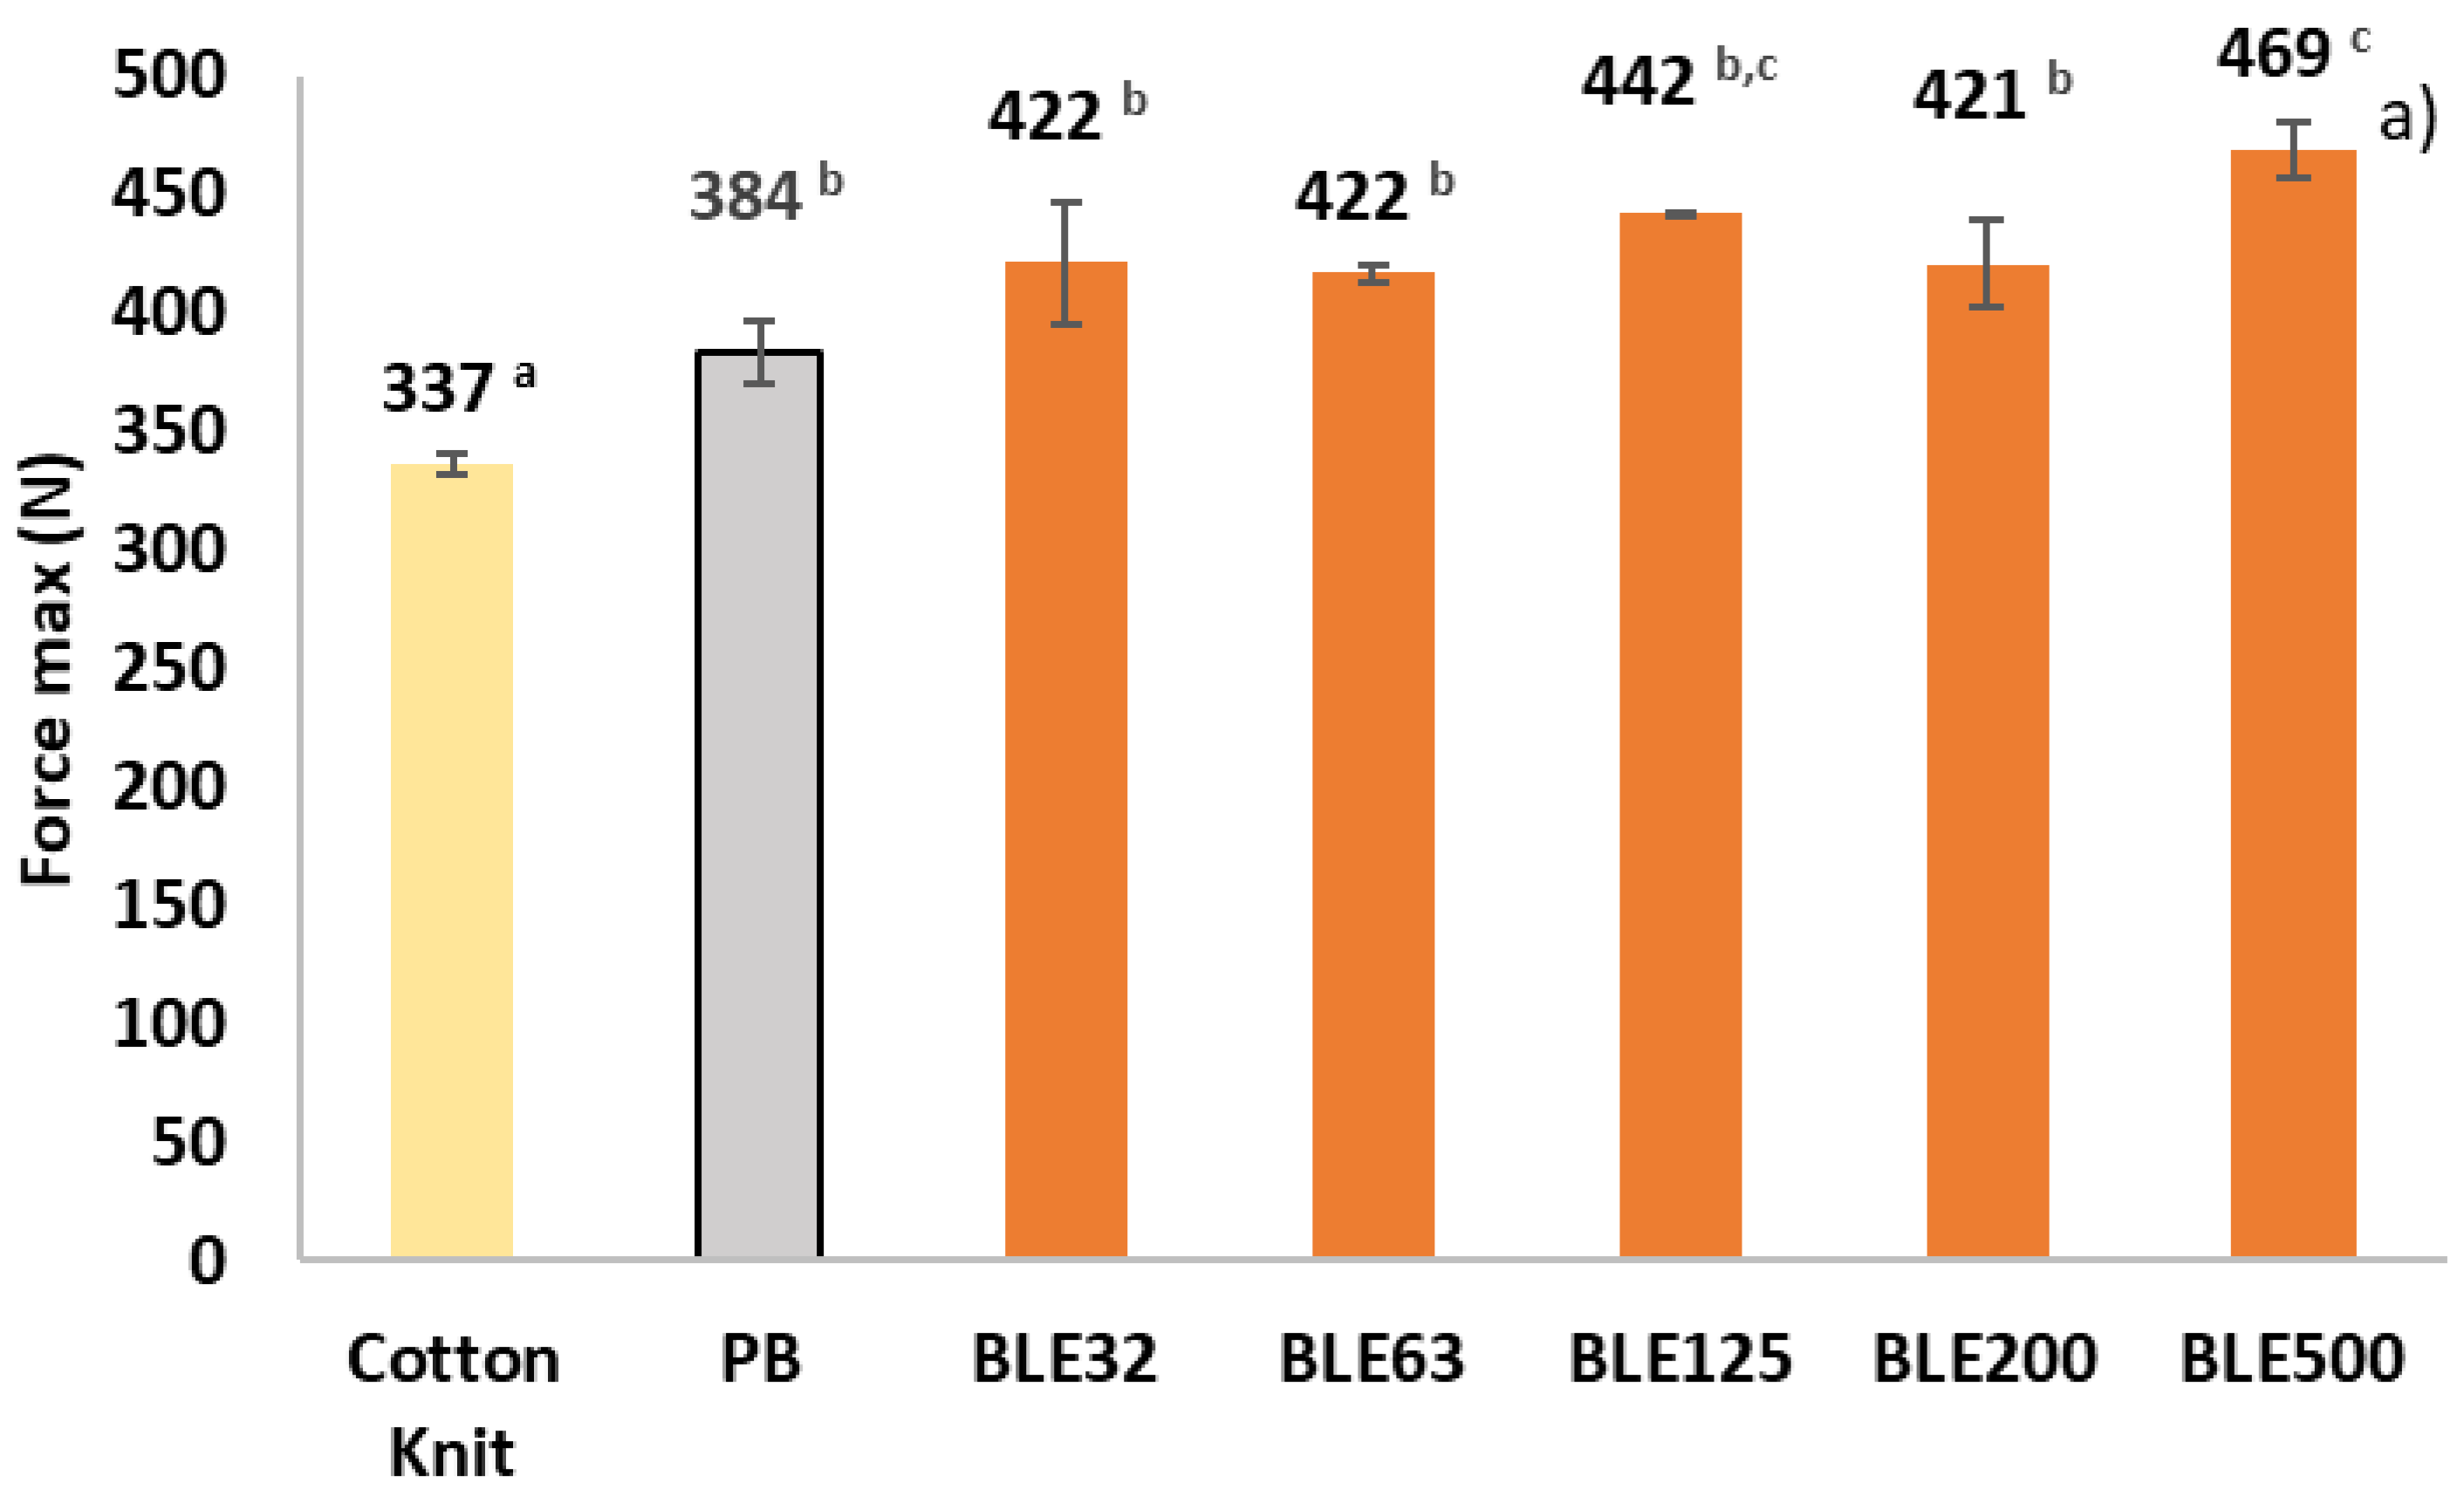
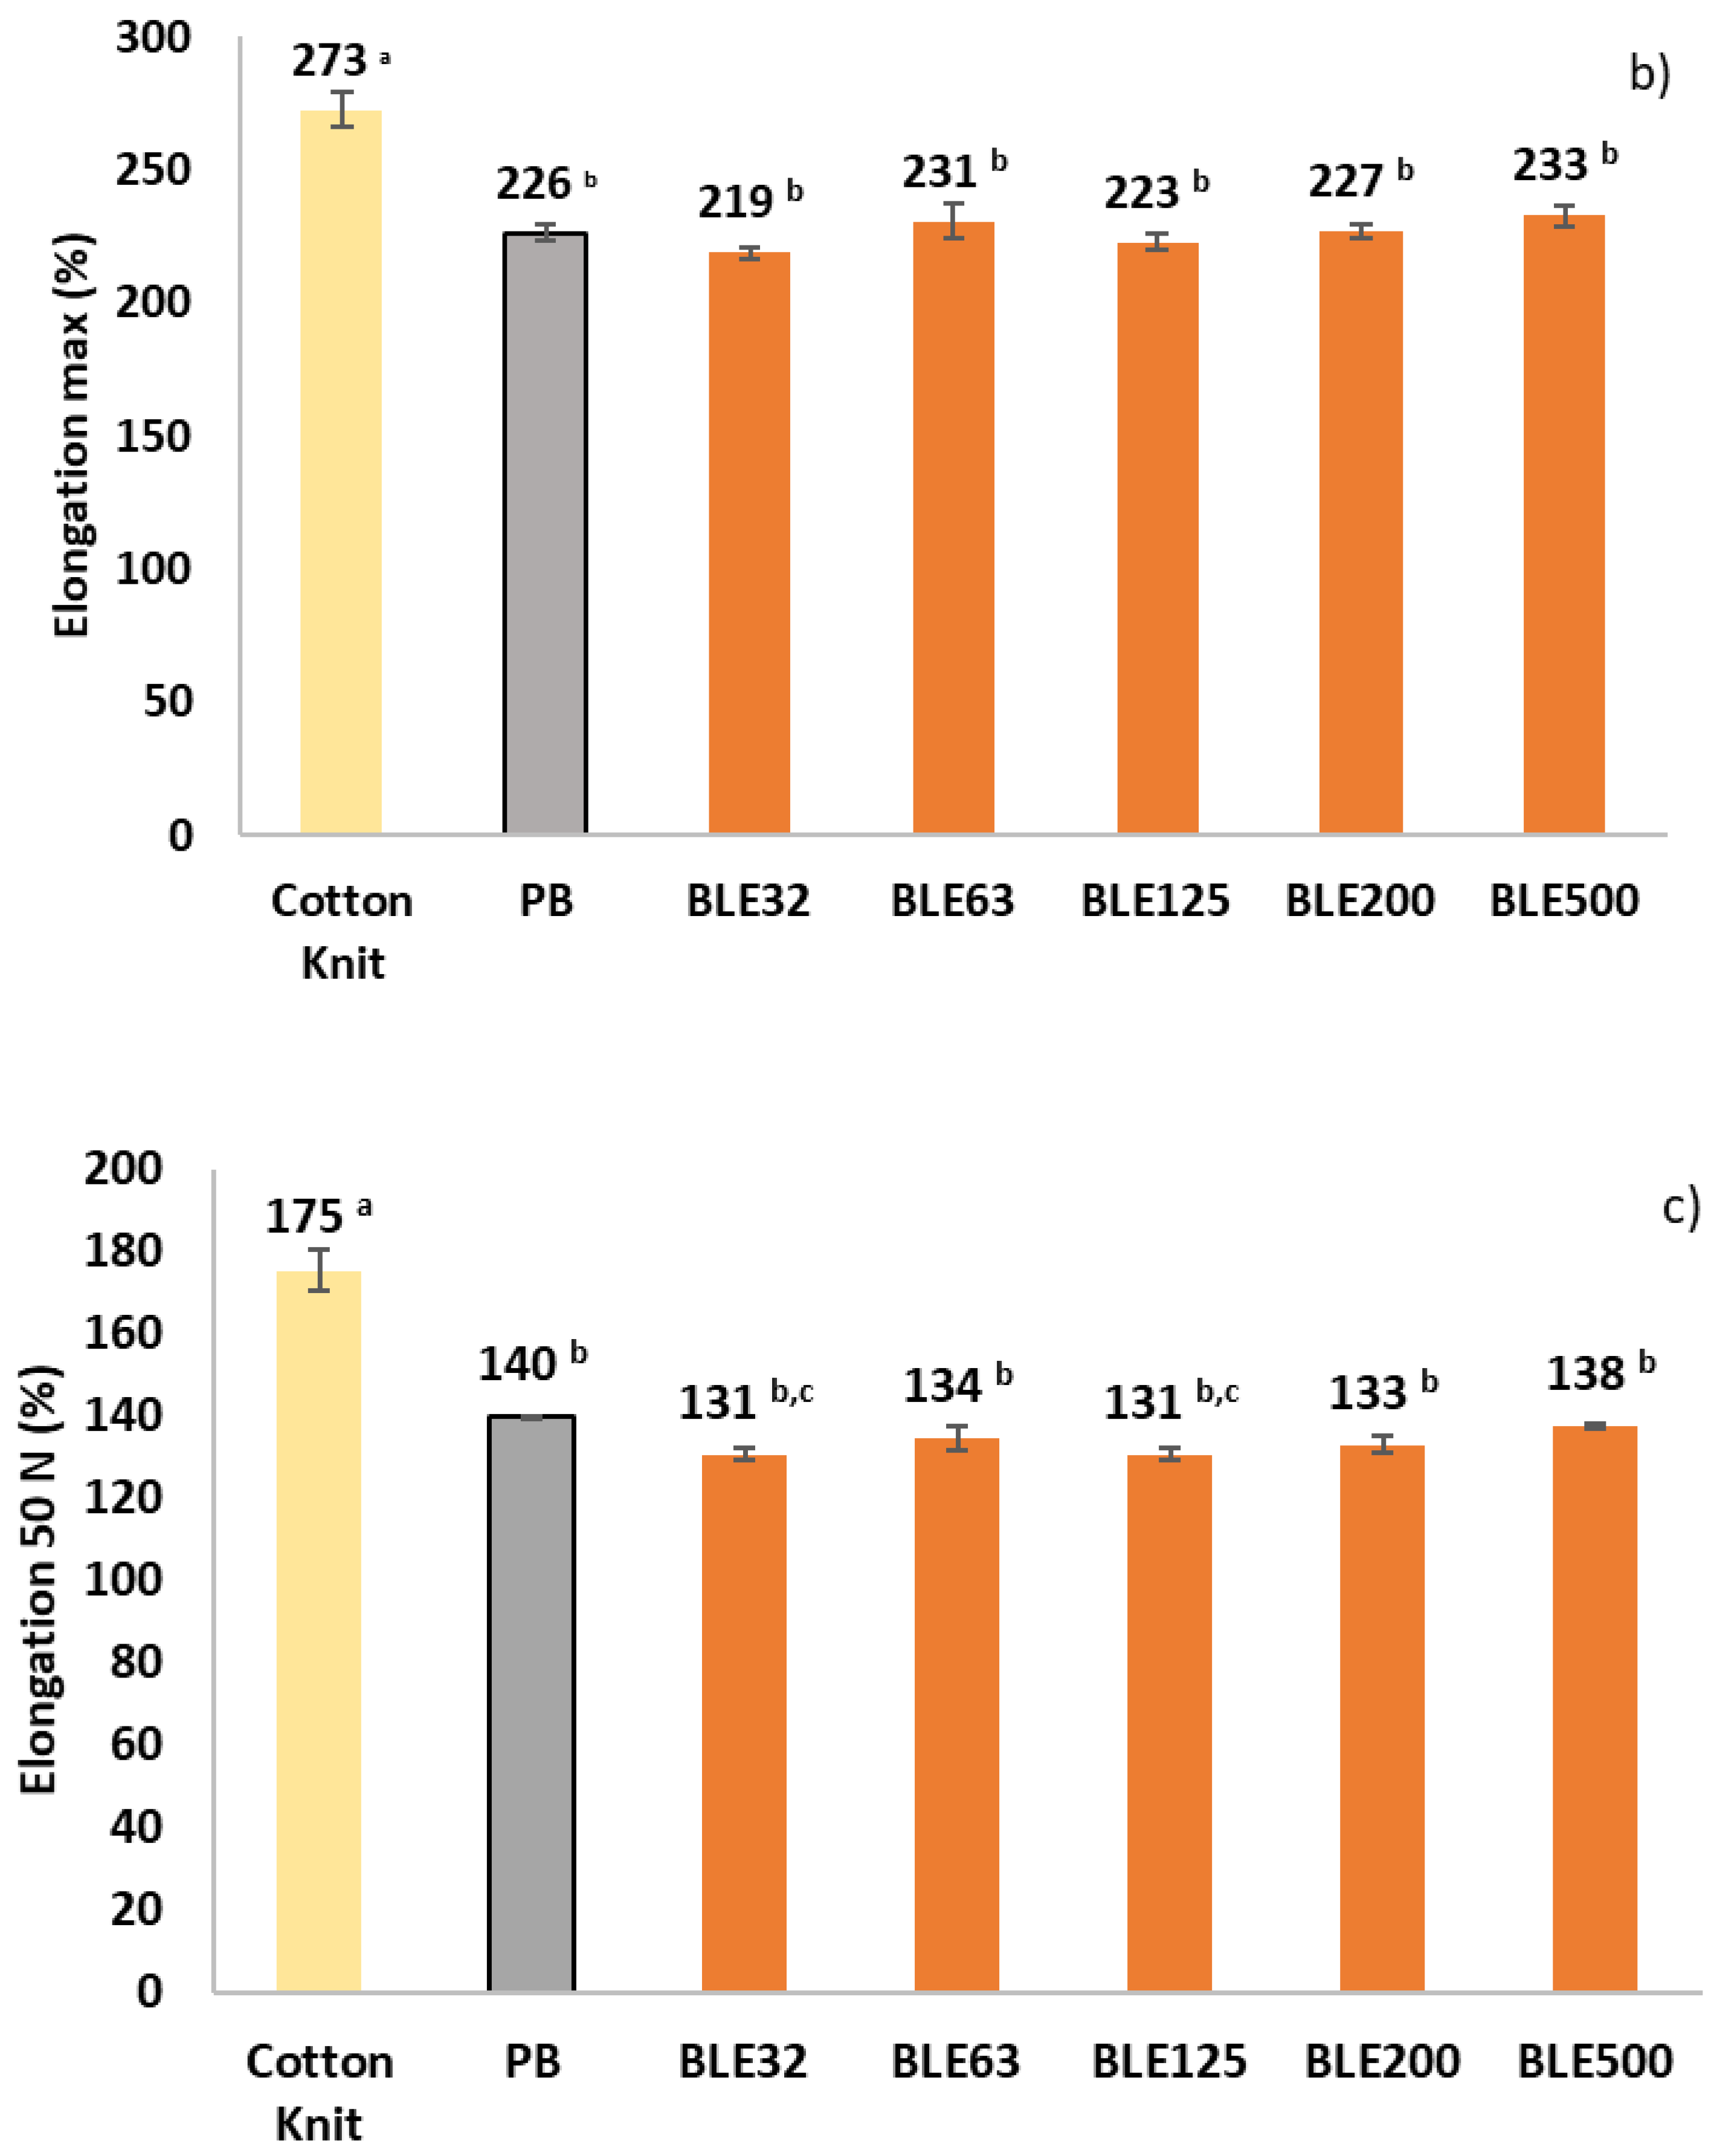
Figure 12.
DSC curves of Cotton Knitt and coated with WPU alone (PB) and with the BLE particles (BLE32-500) and at a heating rate of 10 C min-1 in N2 atmosphere.
Figure 12.
DSC curves of Cotton Knitt and coated with WPU alone (PB) and with the BLE particles (BLE32-500) and at a heating rate of 10 C min-1 in N2 atmosphere.
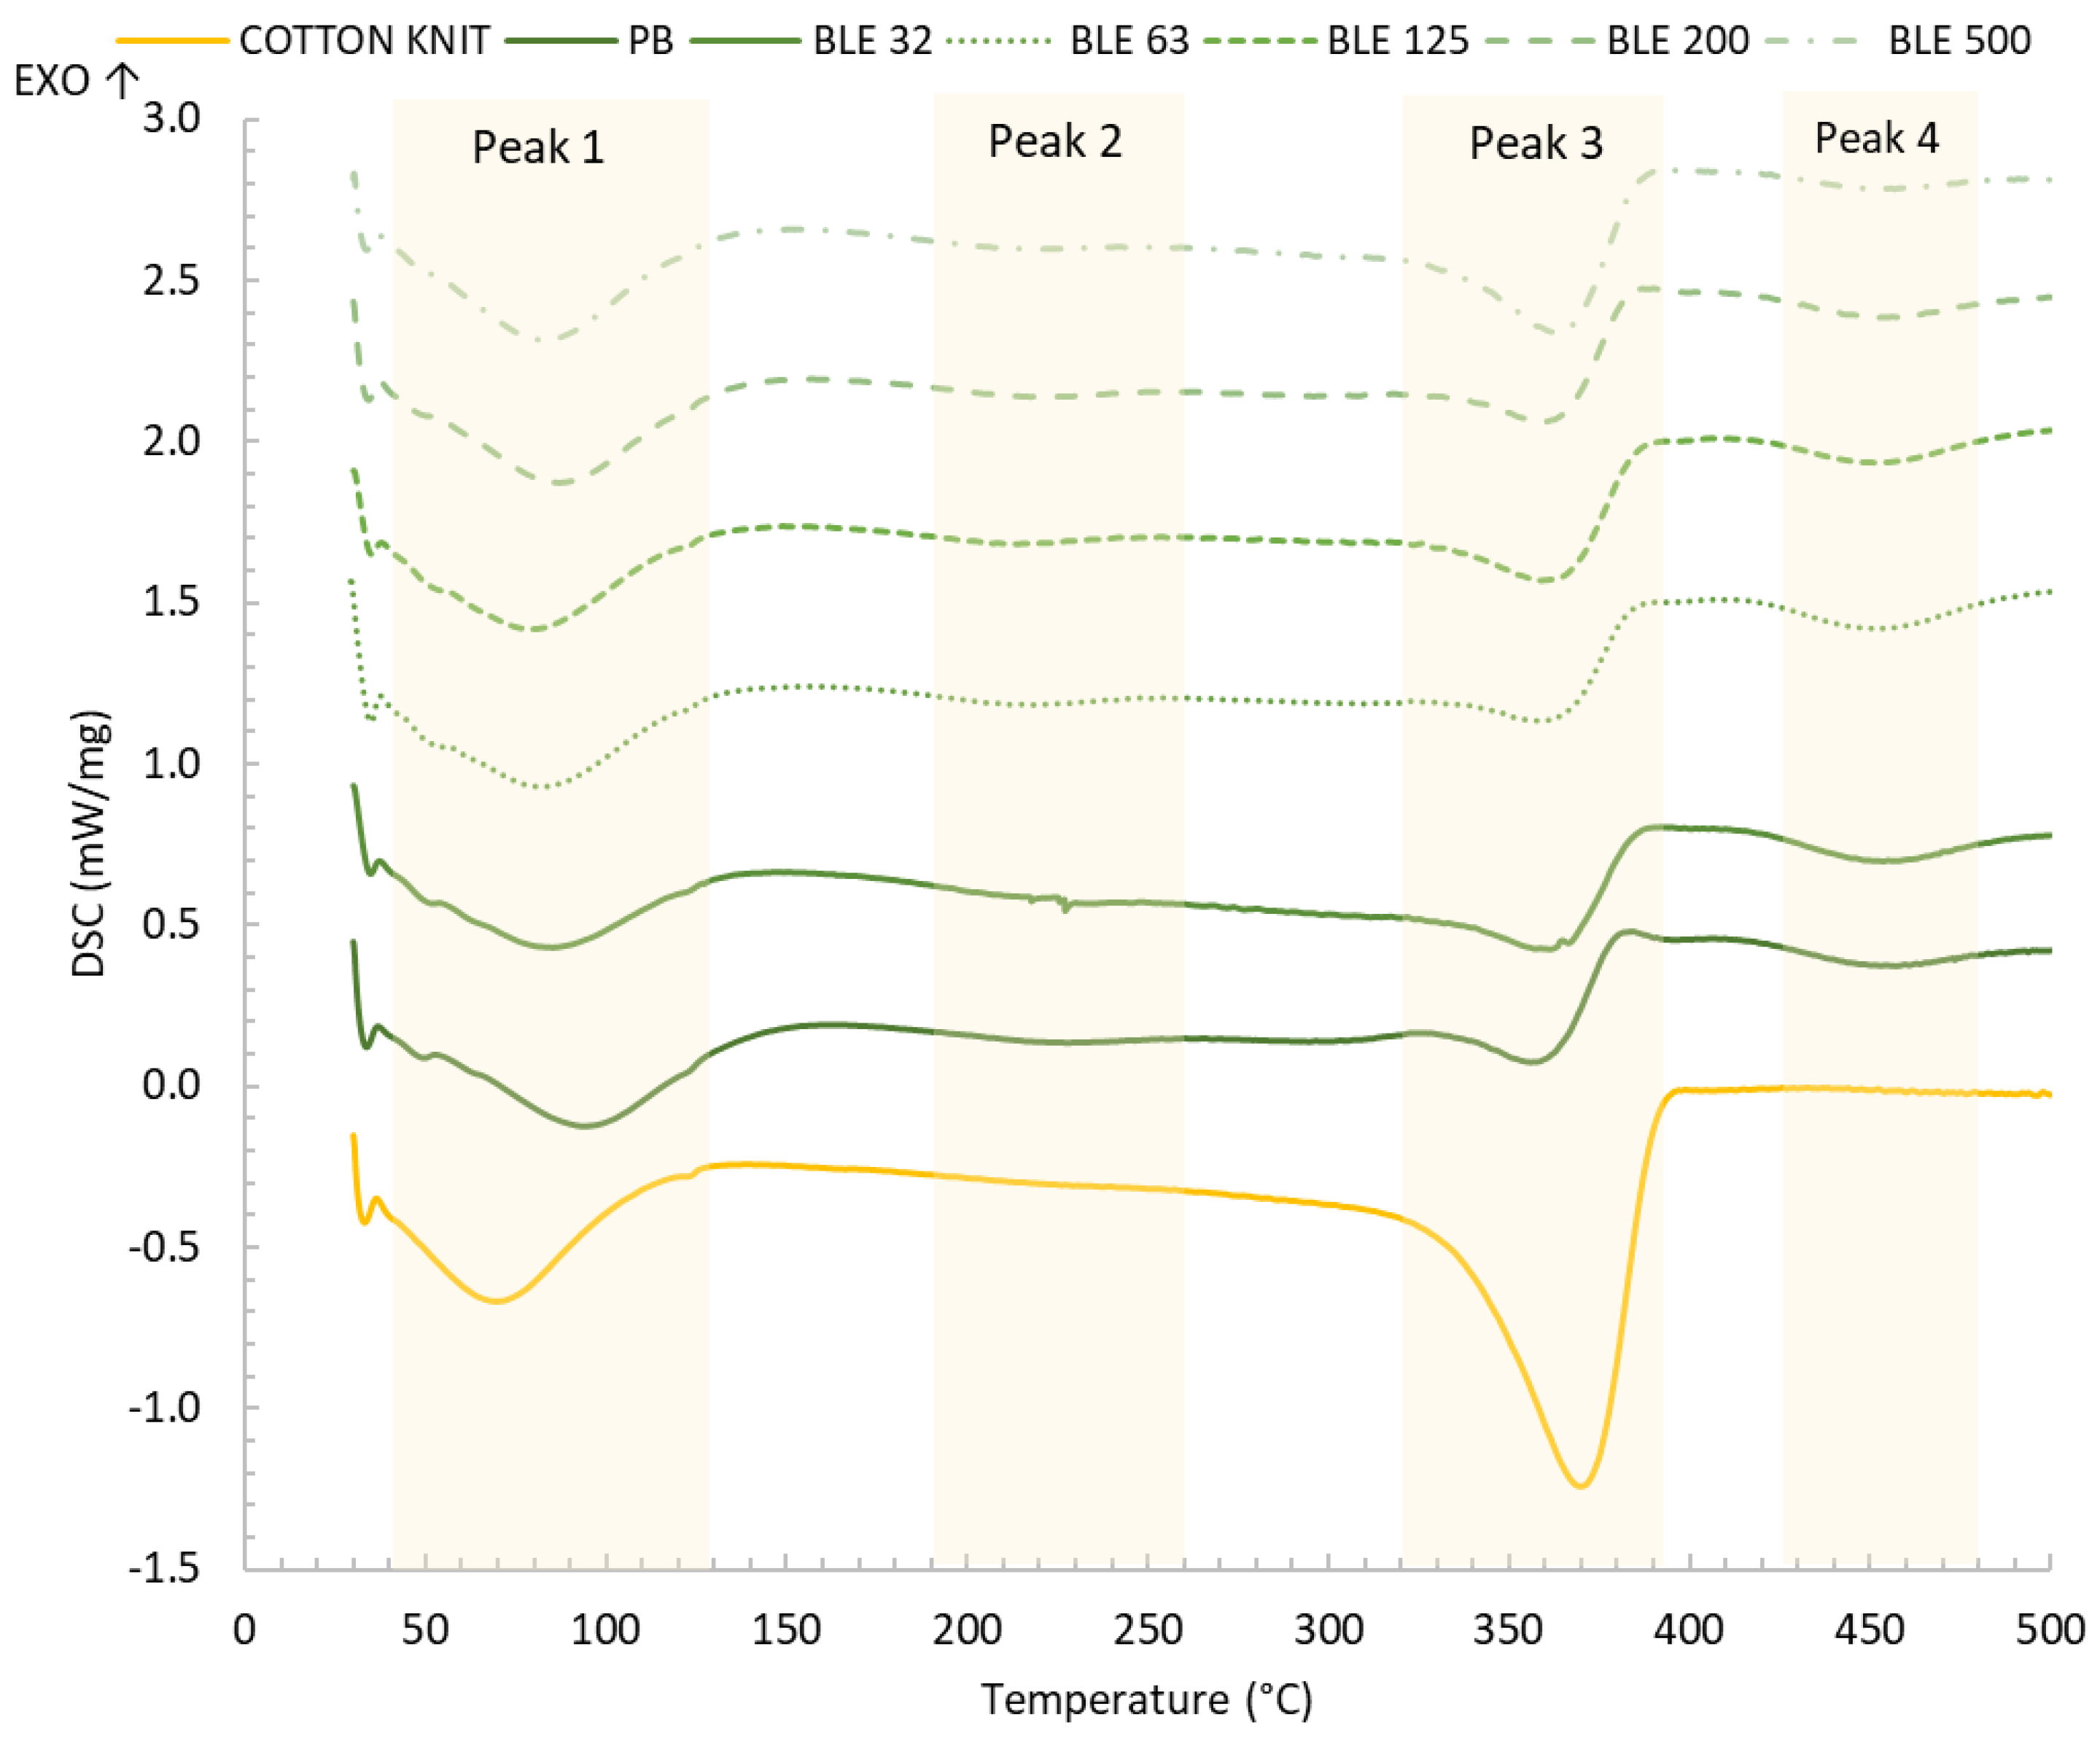
Figure 13.
TG (a) and DTG (b) curves of PB and BL E32-500 coated textile products. Note: b) graph shown the first derivatives (DTG) illustrating the decomposition temperatures (Td) of the textile products.
Figure 13.
TG (a) and DTG (b) curves of PB and BL E32-500 coated textile products. Note: b) graph shown the first derivatives (DTG) illustrating the decomposition temperatures (Td) of the textile products.
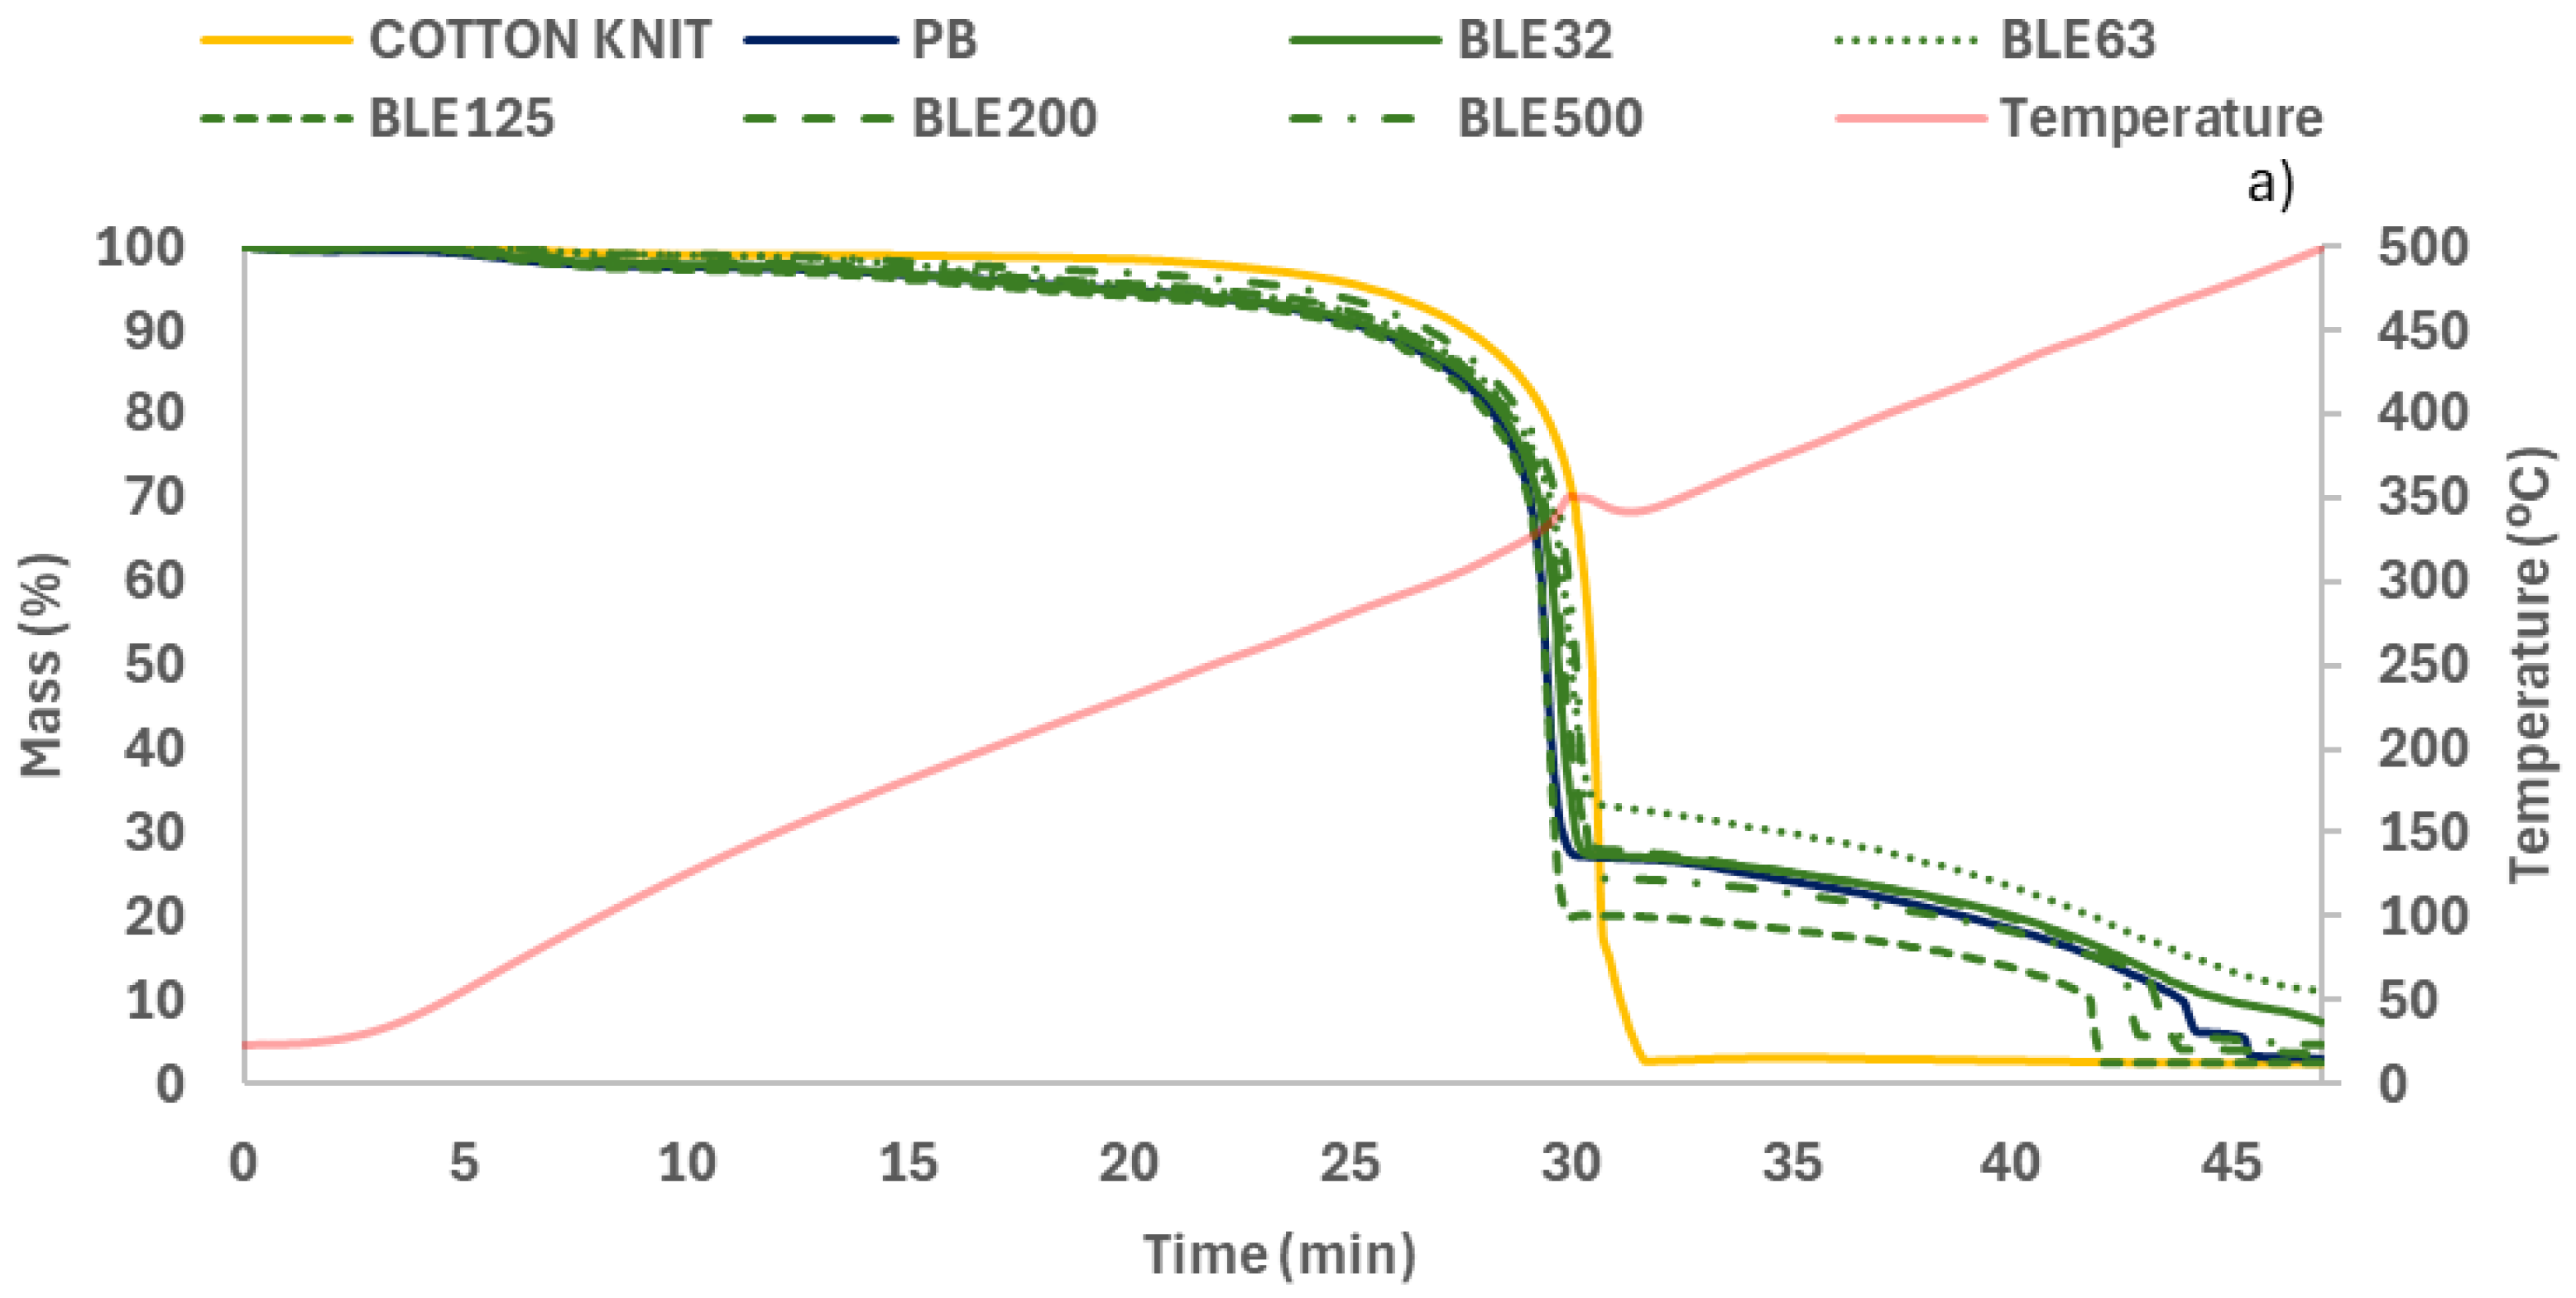
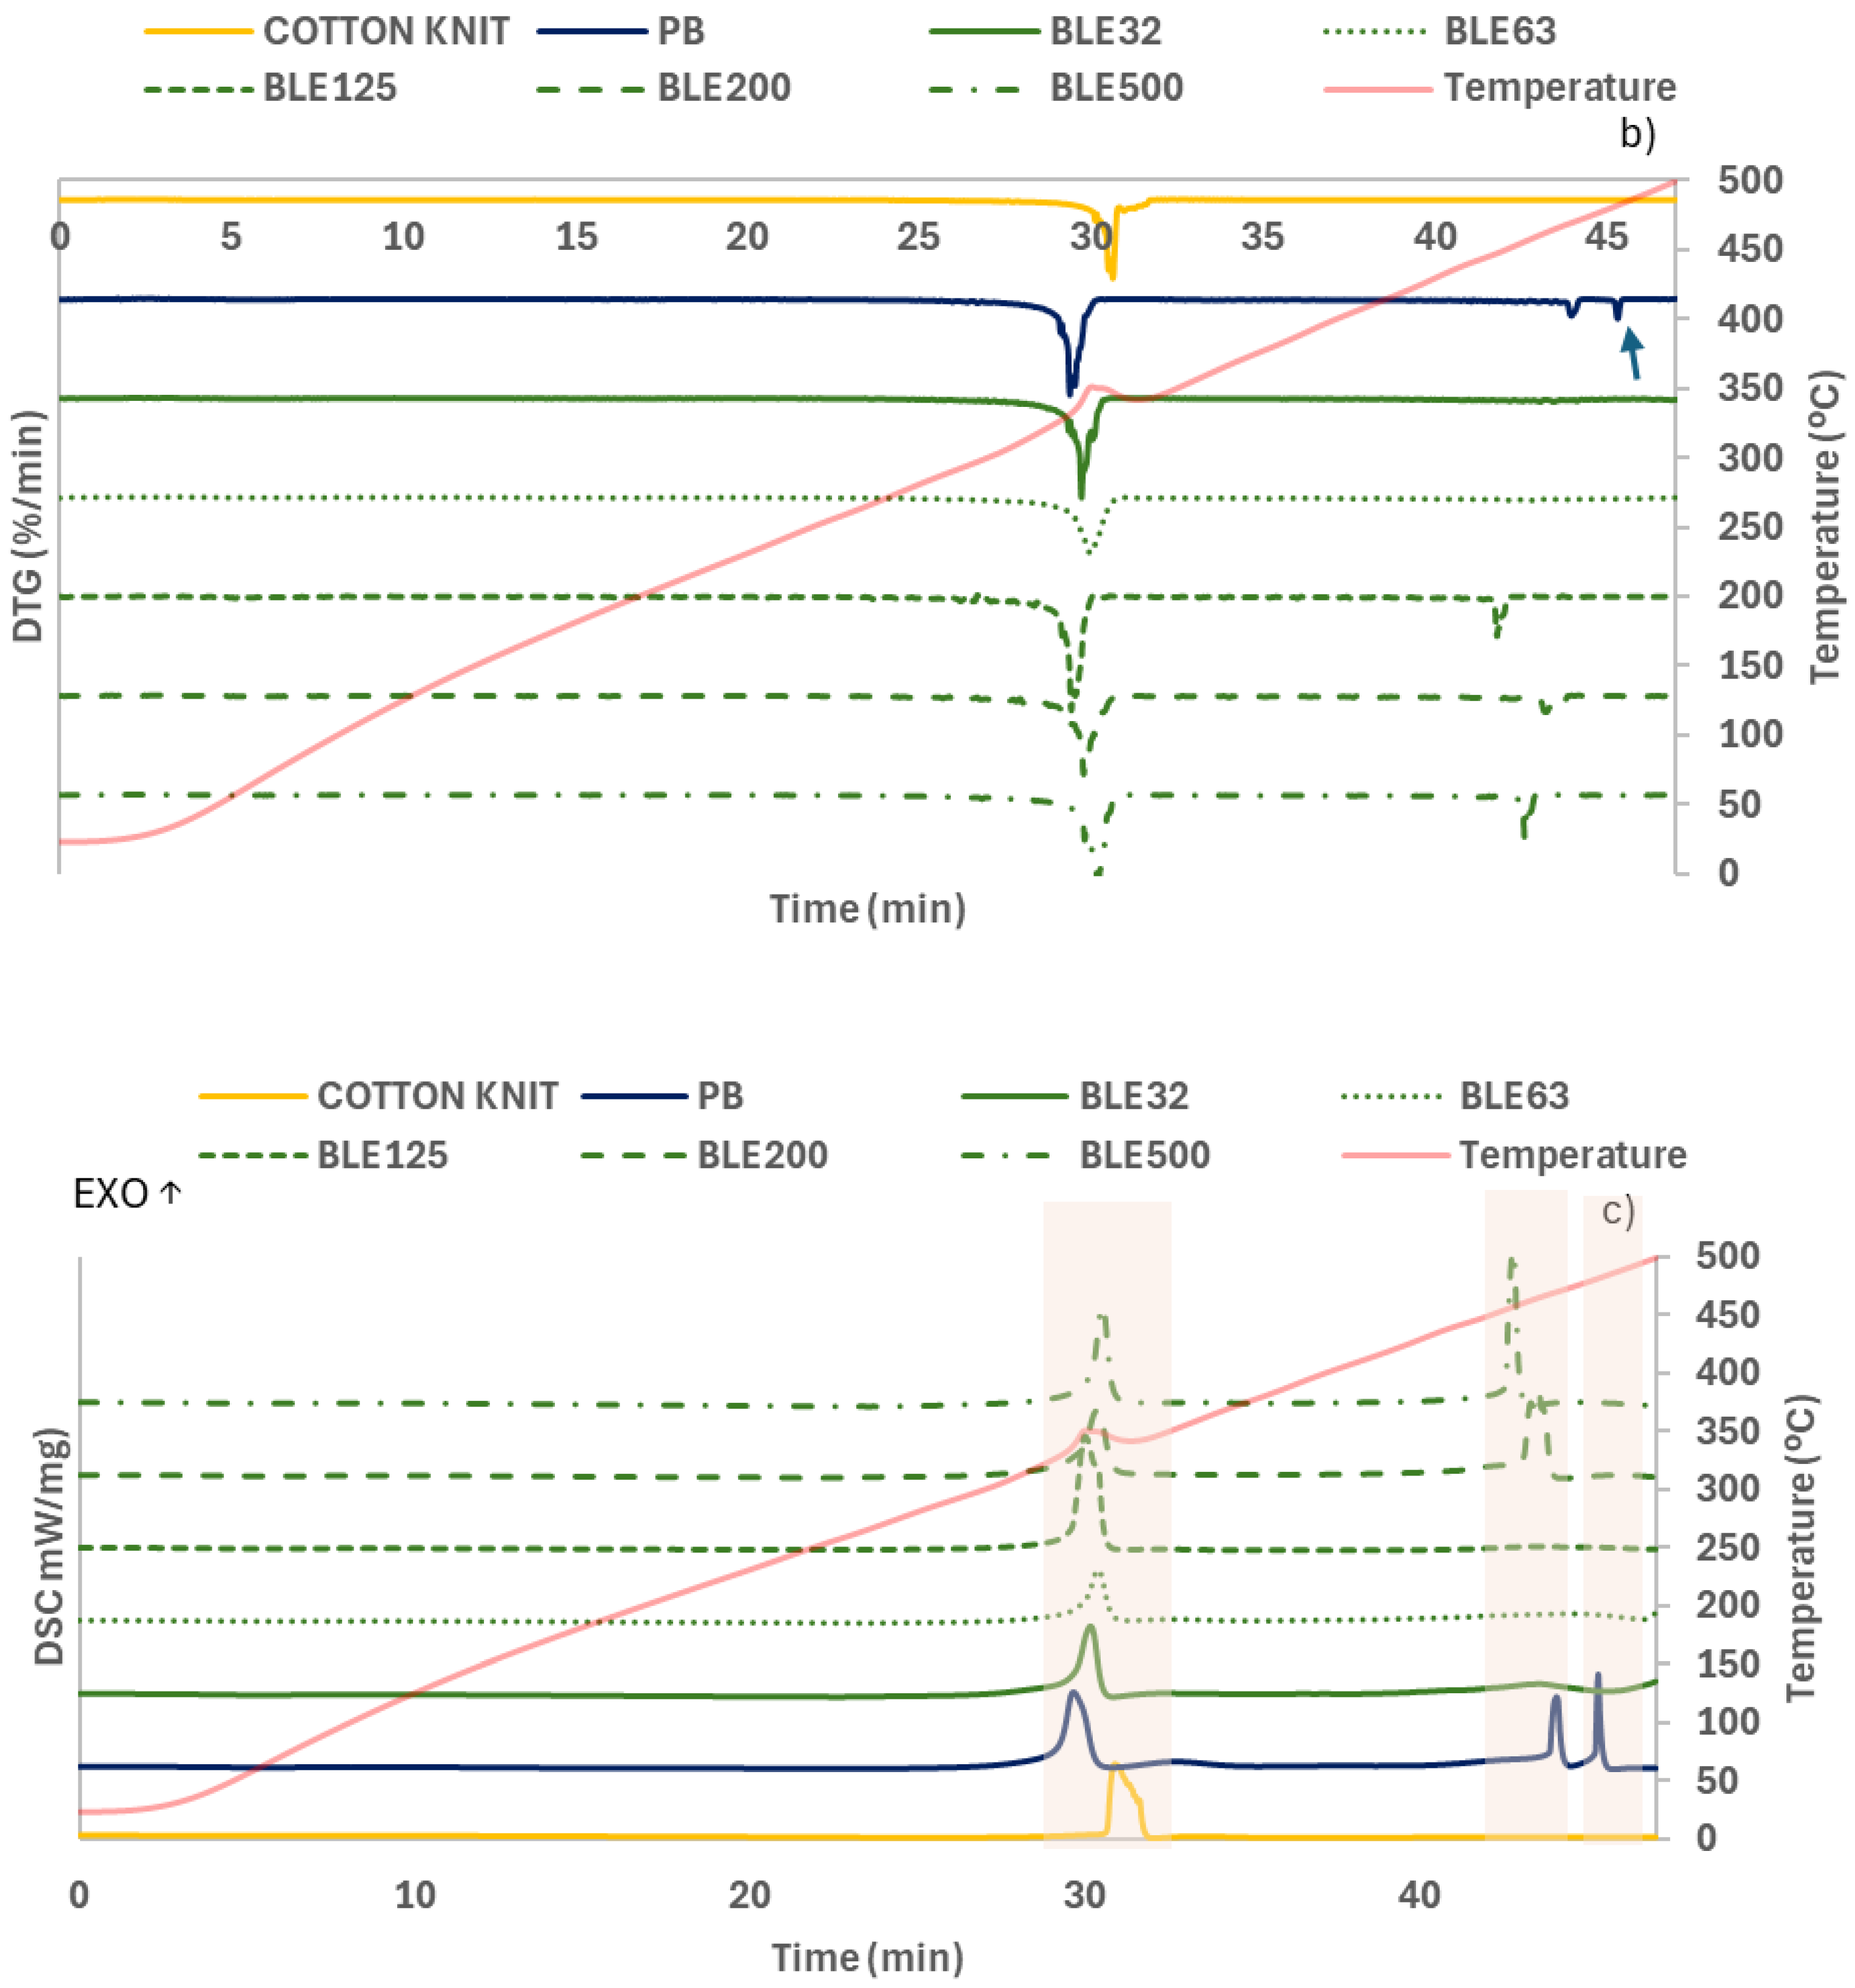
Figure 14.
The DPPH antioxidant efficiency at different time of Cotton fabrics uncoated and coated with the WPU formulation alone (PB) and with the BLE particles (BLE32-500).
Figure 14.
The DPPH antioxidant efficiency at different time of Cotton fabrics uncoated and coated with the WPU formulation alone (PB) and with the BLE particles (BLE32-500).
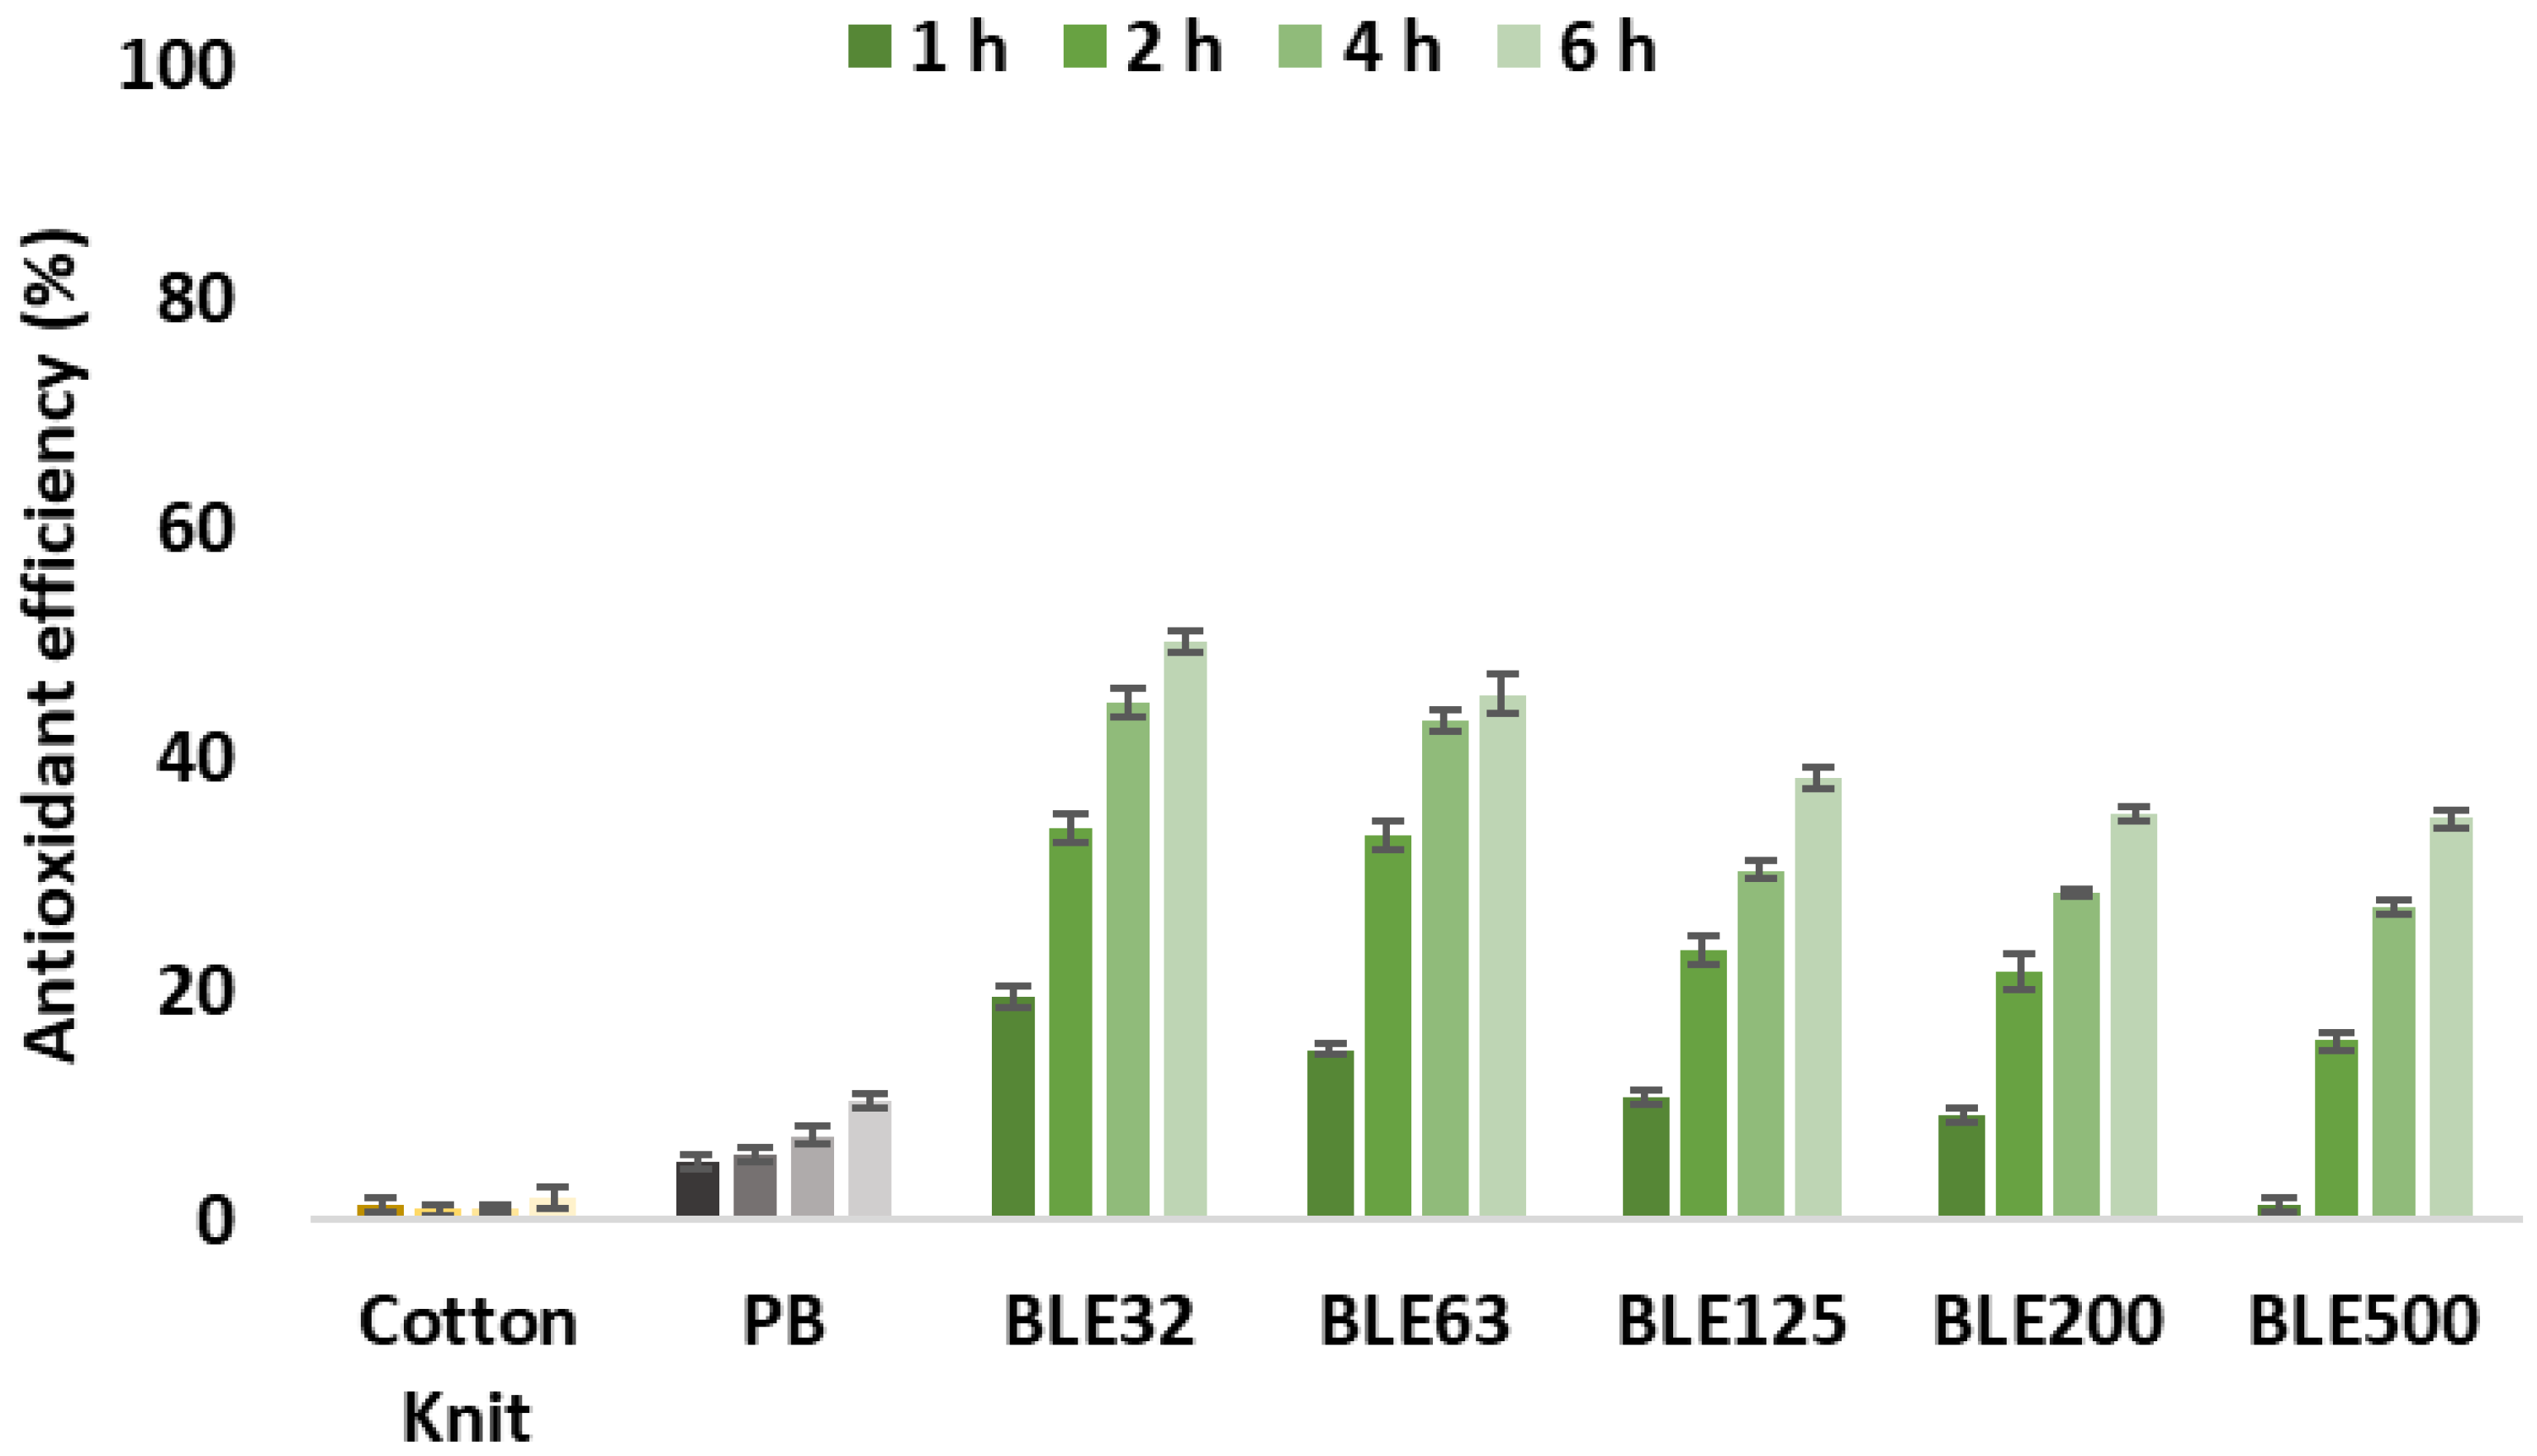
Figure 15.
The FRAP antioxidant capacity of Cotton fabrics uncoated and coated with the WPU formulation alone (PB) and with the BLE particles (BLE32-500). Samples subscripted by different capital letters are significantly different at p < 0.05.
Figure 15.
The FRAP antioxidant capacity of Cotton fabrics uncoated and coated with the WPU formulation alone (PB) and with the BLE particles (BLE32-500). Samples subscripted by different capital letters are significantly different at p < 0.05.
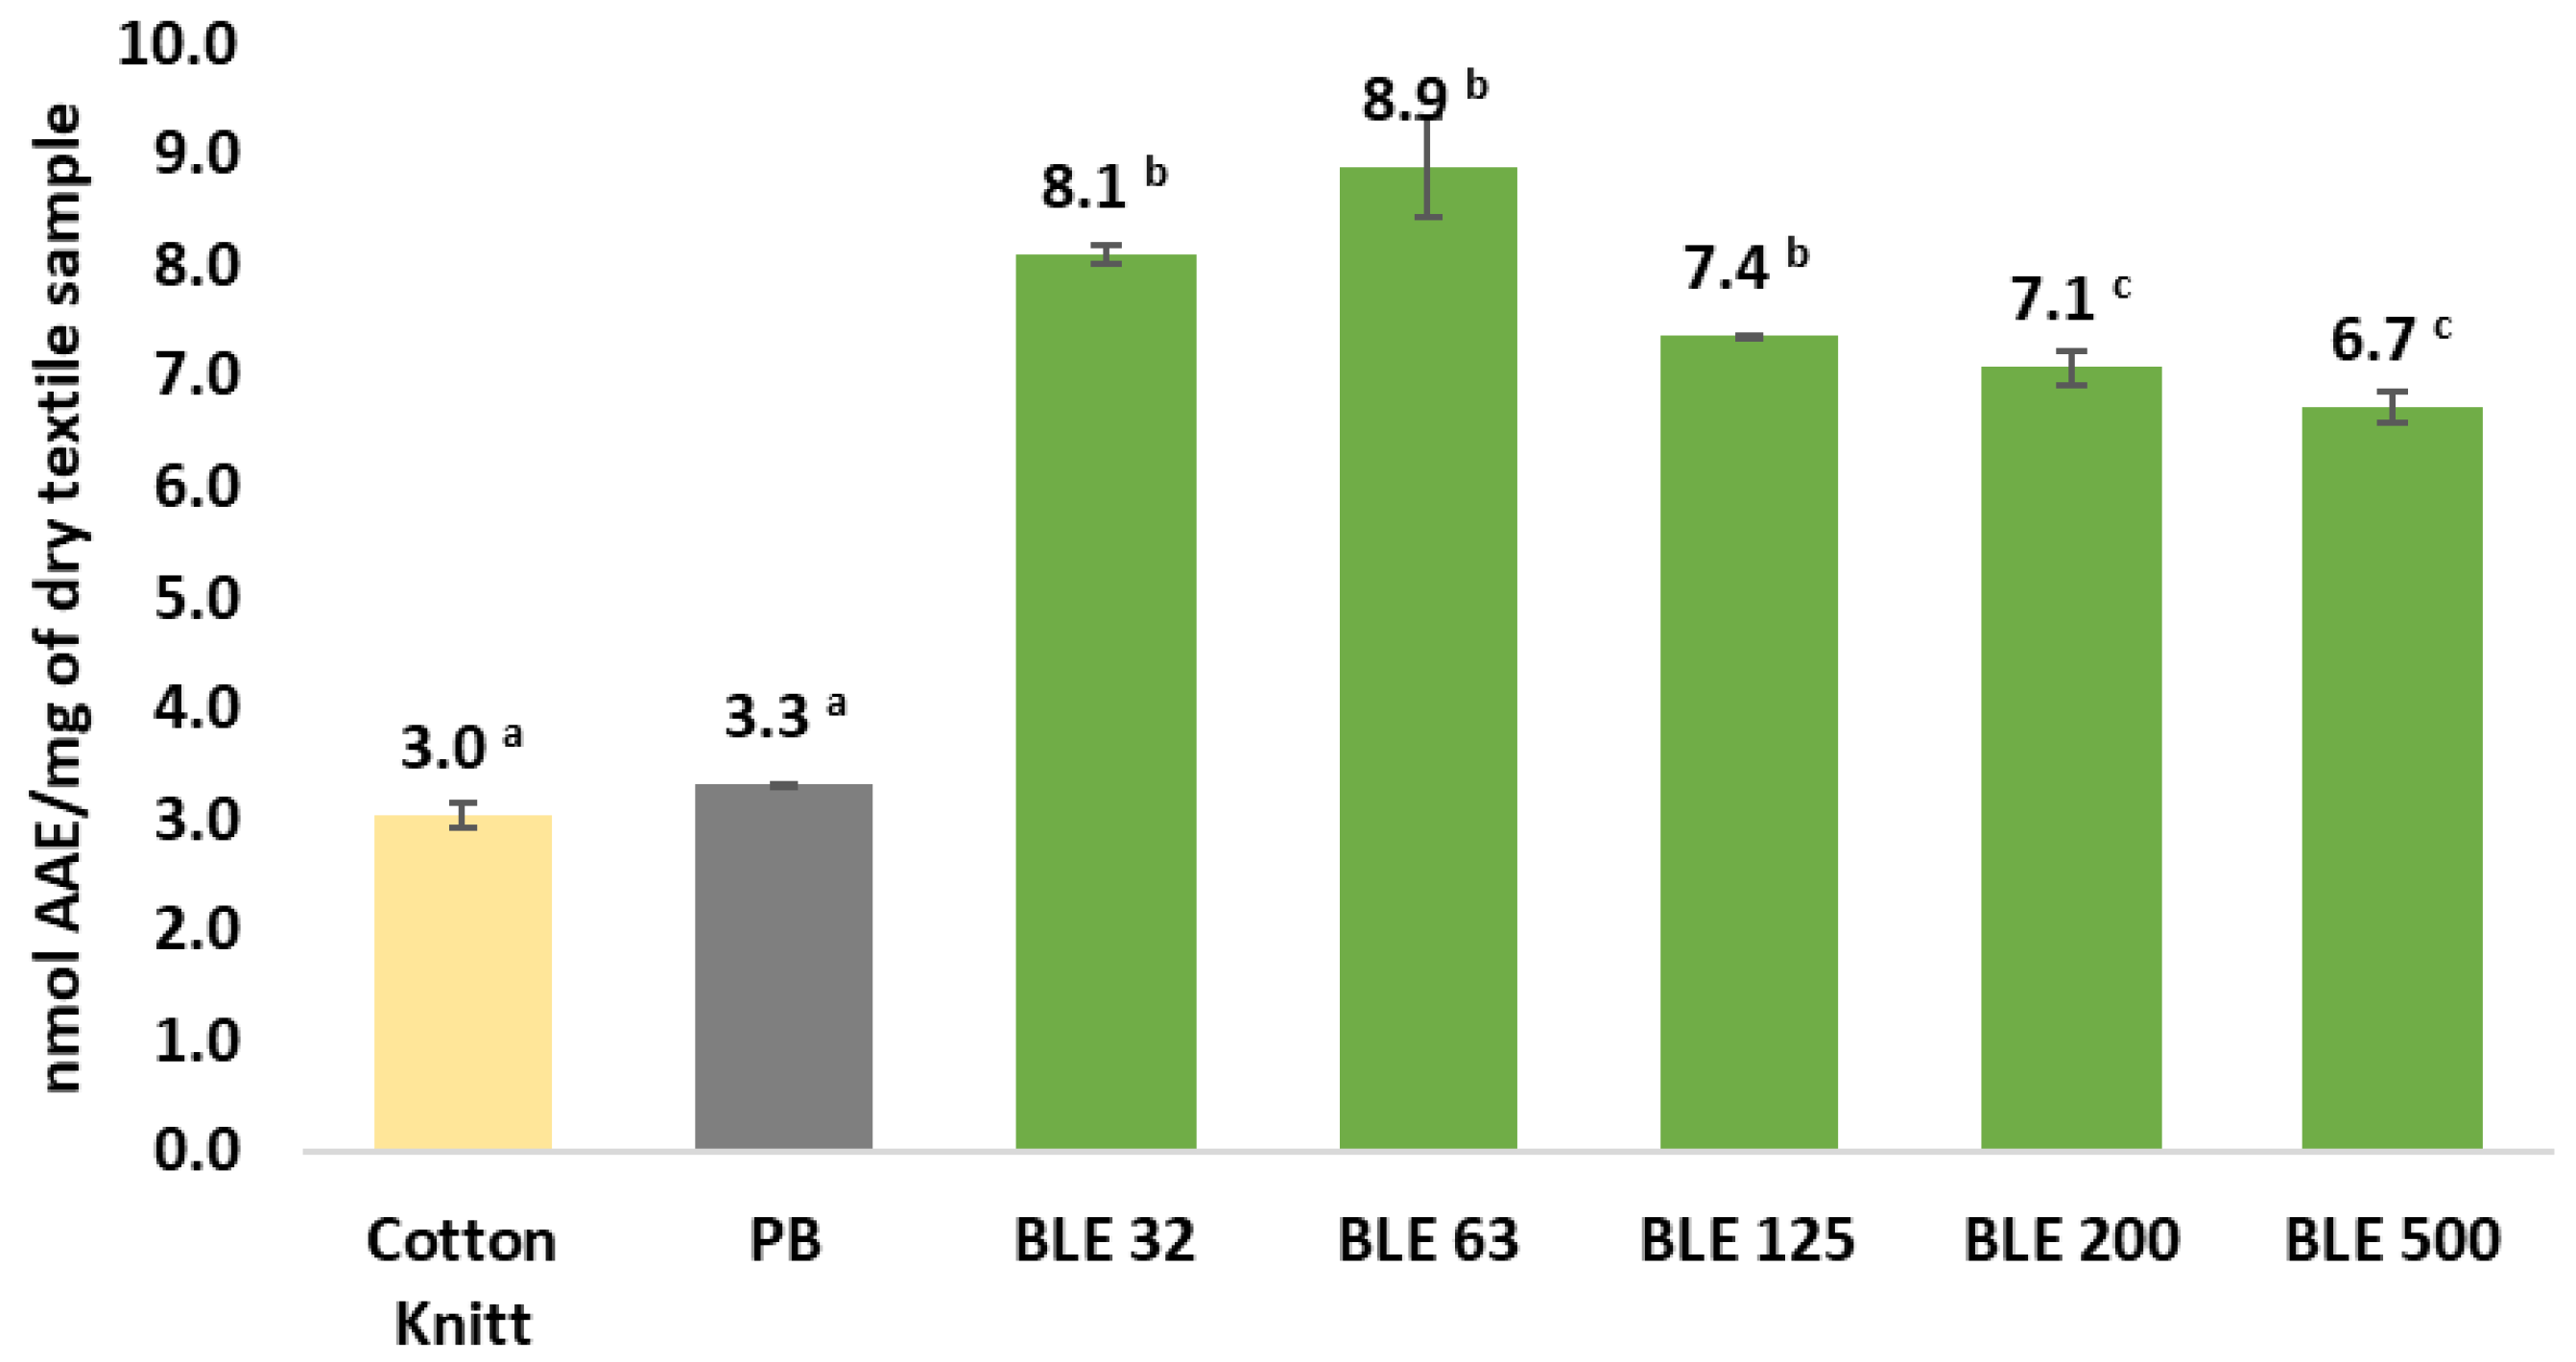
Table 1.
Composition of coating formulates without (PB) and with BSG particles.
| Sample |
Polyurethane % (dry basis) |
Isocyanate % (dry basis) |
BLE % (dry basis) |
Additives % (dry basis) |
| PB | 62.0 | 29.5 | 0.0 | 8.6 |
| BLE 32 | 55.8 | 26.5 | 10.0 | 7.7 |
| BLE 63 | 55.8 | 26.5 | 10.0 | 7.7 |
| BLE 125 | 55.8 | 26.5 | 10.0 | 7.7 |
| BLE 200 | 55.8 | 26.5 | 10.0 | 7.7 |
| BLE 500 | 55.8 | 26.5 | 10.0 | 7.7 |
Table 2.
Dimension analysis of the BLE particles.
| Samples |
Particle size (µm) |
Fiber | Amorphous particle | |
| Length (µm) | Width (µm) | Length (µm) | ||
| BLE32 | >32 | 247.0 ± 41.0 | 15.0 ± 2.1 | 28.6 ± 11.9 |
| BLE63 | 32-63 | 225.9 ± 83.2 | 18.7 ± 5.3 | 51.2 ± 14.4 |
| BLE125 | 63-125 | 535.8 ± 180.2 | 45.0 ± 4.2 | 112.5 ± 39.9 |
| BLE200 | 125-200 | 176.6 ± 43.2 | 49.3 ± 7.3 | 176.6 ± 43.2 |
| BLE500 | 200-500 | 912.5 ± 20.1 | 136.5 ± 7.8 | 398.0 ± 70.7 |
Table 3.
Chemical characterization of the BLE particles surface by EDS.
| Samples | Fiber | Amorphous particle | ||||
| C (%) | O (%) | N (%) | C (%) | O (%) | N (%) | |
| BLE32 | 74.7 ± 2.9 a | 21.8 ± 2.5 a | 3.6 ± 1.4 a | 66.0 ± 6.9 a | 26.5 ± 6.4 a | 7.5 ± 2.6 a |
| BLE63 | 66.0 ± 5.5 b | 27.9 ± 4.8 b | 6.1 ± 0.8 b | 52.2 ± 5.9 a | 32.9 ± 8.5 a | 14.9 ± 3.6 b |
| BLE125 | 65.7± 6.2 b | 28.9 ± 4.9 b | 6.2 ± 0.6 b | 60.6 ± 7.8 a | 31.5 ± 7.6 a | 7.8 ± 1.6 a |
| BLE200 | 48.3 ± 0.9 c | 42.3 ± 2.8 c | 10.8 ± 2.0 b | 62.1 ± 3.1 a | 30.8 ± 3.5 a | 7.0 ± 2.2 a |
| BLE500 | 50.7 ± 5.6 c | 40.5 ± 4.1 c | 10.0 ± 3.6 b | 47.2 ± 5.8 b | 44.5 ± 6.4 b | 8.2 ± 4.0 a |
Values are presented as mean ± standard deviation (n=12). (%) were calculated as weight concentration; Samples subscripted by different letters are significantly different in terms of impact of raw material particle size distribution at p < 0.05.
Table 4.
FTIR peak assignment of BLE samples.
| BLE32 | BLE63 | BLE125 | BLE200 | BLE500 | |||
| cm-1 | Intensity | Intensity | Intensity | Intensity | Intensity | Group | Range |
| 3412* | 21.7 ± 0.1 | 23.3 ± 0.2 | 24.6 ± 0.2 | 25.2 ± 0.7 | 26.0 ± 0.7 | -OH stretch | 3300-3400 |
| 2920* | 19.9 ± 0.3 | 29.9 ± 2.9 | 39.0 ± 3.3 | 30.8 ± 3.3 | 37.7 ± 7.0 | -CH2- asymmetric stretch | 2916-2936 |
| 2853* | 13.5 ± 0.2 | 20.4 ± 2.0 | 26.5 ± 2.3 | 20.7 ± 2.3 | 25.7 ± 4.9 | -CH2- symmetric stretch | 2843-2863 |
| 1727* | 27.9 ± 0.7 | 35.8 ± 1.9 | 42.9 ± 3.4 | 36.6 ± 2.1 | 42.5 ± 3.6 | C=O stretch in unconjugated ketones, carbonyls and in ester groups (hemicellulose) | 1738 |
| 1615* | 62.3 ± 1.6 | 67.6 ± 0.5 | 67.2 ± 1.8 | 69.8 ± 0.6 | 68.5 ± 4.8 | Aromatic skeletal vibration and C=O stretch (lignin) | 1595 |
| 1551* | 17.7 ± 0.4 | 19.8 ± 0.0 | 17.9 ± 1.0 | 17.5 ± 0.9 | 17.6 ± 0.8 | CAR=CAR (Pp cd.) | 1500-1600 |
| 1454* | 23.7 ± 0.8 | 27.0 ± 1.2 | 30.5 ± 1.4 | 31.1 ± 1.5 | 33.6 ± 3.2 | C=C and C-H bond O-H in plane deformation (lignin and hemicellulose) | 1450-1453 |
| 1444* | 28.8 ± 0.2 | 31.3 ± 0.4 | 34.7 ± 0.6 | 35.4 ± 1.0 | 37.0 ± 3.8 | CH- deformation; asymmetric in -CH3 and -CH2- (cellulose) | 1430-1485 |
| 1367 | 29.4 ± 0.2 | 31.5 ± 0.2 | 34.1 ± 0.7 | 34.4 ± 0.7 | 36.1 ± 2.6 | CH deformation (cellulose and hemicellulose) | 1372 |
| 1315 | 37.5 ± 0.6 | 37.4 ± 0.3 | 38.3 ± 0.4 | 40.0 ± 0.6 | 39.7 ± 2.9 | Ph-CHR-OH deformation | 1260-1350 |
| 1232 | 25.3 ± 0.1 | 28.2 ± 0.2 | 29.9 ± 1.4 | 28.6 ± 1.5 | 29.9 ± 2.1 | Syringyl ring and C=C stretch in lignin and xylan | 1235 |
| 1153 | 18.9 ± 0.0 | 21.5 ± 0.9 | 24.0 ± 2.2 | 21.1 ± 0.8 | 23.2 ± 1.8 | Involves C-O stretching of C-OH/C-O-C (cellulose) | 1160 |
| 1027 | 100.0 ± 0.0 | 100.0 ± 0.0 | 100.0 ± 0.0 | 100.1 ± 0.1 | 100.0 ± 0.1 | C-O, C-C, and C-C-O stretch (cellulose, hemicellulose, and lignin) | 1025-1035 |
| 832 | 2.3 ± 0.1 | 2.6 ± 0.1 | 3.0 ± 0.1 | 3.4 ± 0.3 | 3.6 ± 0.4 | C-O-C aromatic ethers, symmetric stretch | 810-850 |
| 763 | 14.4 ± 0.3 | 13.6 ± 0.0 | 12.7 ± 0.6 | 12.4 ± 1.3 | 12.9 ± 0.7 | C-C Alkanes skeletal vibrations | 720–750 |
Ph: Phenyl group; BLEE: Milled and sieved Branches and leaves of E. globulus.
Table 5.
Cellulose FTIR bands quantification for BLE particles.
| BLE32 | BLE63 | BLE125 | BLE200 | BLE500 | Group | Integration Range | |
| cm-1 | % Area | % Area | % Area | % Area | % Area | ||
| 1444 | 3.12 ± 0.05a | 3.09 ± 0.01a | 3.40 ± 0.00 a | 3.47 ± 0.00 b | 3.53 ± 0.00 b | CH2 deformation medium-weak |
1400-1485 |
| 1367 | 2.18 ± 0.02 a | 2.16 ± 0.02 a | 2.24 ± 0.00 a | 2.32 ± 0.02 b | 2.35 ± 0.05 b | CH deformation | 1390-1350 |
| 1315 | 3.62 ± 0.05 | 3.36 ± 0.01 | 3.29 ± 0.01 | 3.54 ± 0.09 | 3.35 ± 0.12 | CH2 deformation medium-weak |
1340-1280 |
| 1153 | 2.15 ± 0.04 | 2.20 ± 0.13 | 2.26 ± 0.23 | 2.09 ± 0.06 | 2.20 ± 0.01 | C-O stretch of C-OH / C-O-C medium |
1195-1130 |
| 1100 | 2.72 ± 0.16 | 2.51 ± 0.17 | 2.44 ± 0.17 | 2.52 ± 0.14 | 2.49 ± 0.15 | C-O-C stretch medium |
1130-1090 |
| 1027 | 13.55 ± 0.09 a | 12.52 ± 0.03 a | 12.05 ± 0.20 b | 12.60 ± 0.06 a | 12.40 ± 0.62 a | CO stretch medium-strong |
1068-990 |
| ∑ Area | 27.16 ± 0.21 a | 25.75 ± 0.31 b | 25.59 ± 0.14 b | 26.45 ± 0.16 a | 26.29 ± 0.61 a |
BLE32-500: Milled and sieved Branches and leaves of E. globulus.; % Area was the peak area/Area Total; Area total was measured between 400 and 4000 cm-1. Values are presented as mean ± standard deviation (n=3). Samples subscripted by different letters are significantly different in terms of impact of raw material particle size distribution at p < 0.05.
Table 6.
Lignin FTIR bands quantification for BLE particles.
| BLE32 | BLE63 | BLE125 | BLE200 | BLE500 | Group | Integration Range | |
| cm-1 | % Area | % Area | % Area | % Area | % Area | ||
| 1688 | 1.72 ± 0.32 | 1.74 ± 0.09 | 1.86 ± 0.23 | 1.68 ± 0.14 | 1.60 ± 0.23 | C=O stretch | 1670-1700 |
| 1616 | 7.61 ± 0.51 | 7.87 ± 0.30 | 7.60 ± 0.36 | 7.70 ± 0.52 | 7.33 ± 0.71 | Aryl ring stretch, asymmetric | 1560-1640 |
| 1516 | 0.62 ± 0.03 a | 0.69 ± 0.01 b | 0.58 ± 0.04 a | 0.57 ± 0.01 a | 0.57 ± 0.01 a | Aryl ring stretch, asymmetric | 1488-1525 |
| 1446 | 3.39 ± 0.13 | 3.50 ± 0.06 | 3.60 ± 0.02 | 3.24 ± 0.14 | 3.43 ± 0.71 | OH deformation, asymmetric, OCH3 CH deformation, asymmetric, S-mode | 1400-1485 |
| 1315 | 3.21 ± 0.26 | 3.08 ± 0.10 | 2.99 ± 0.26 | 3.08 ± 0.28 | 2.74 ± 0.58 | Aryl ring breathing mode; CO stretch; S-mode. | 1290-1340 |
| 1234 | 3.13 ± 0.14 | 3.09 ± 0.19 | 3.18 ± 0.31 | 3.07 ± 0.35 | 3.20 ± 0.36 | Syringyl ring and C=C stretch in lignin and Xylan | 1195-1265 |
| 1160 | 2.08 ± 0.11 | 2.16 ± 0.09 | 2.23 ± 0.03 | 2.11 ± 0.07 | 2.14 ± 0.29 | C-H stretch in G-ring | 1135-1190 |
| ∑ Area | 20.89 ± 0.14 a | 21.32 ± 0.28 a | 22.50 ± 0.47 a,b | 20.82 ± 0.88 a | 19.86 ± 0.57 a,a |
BLE32-1000: Milled and sieved branches and leaves of E. globulus; % area was the peak area/ total area; total area was measured between 400 and 4000 cm-1. Values are presented as mean ± standard deviation (n=3). Samples subscripted by different letters are significantly different (p < 0.05).
Table 8.
Characterization of WPU solutions with BLE particles.
| Sample | µ(mPa⋅s) | Foam density (g/l) | Solid content (%) |
| PB | 8.6 | 218.1 | 39.6 |
| BLE 32 | 54.05 | 263.6 | 42.5 |
| BLE 63 | 63.41 | 275.6 | 42.8 |
| BLE 125 | 70.41 | 217.1 | 42.4 |
| BLE 200 | 65.01 | 222.6 | 42.2 |
| BLE 500 | 41.25 | 200.6 | 43.0 |
Milled using a sieve of 1000 µm.
Table 9.
shows the colour of the coated textile samples, in the CIELAB colour space.
| Samples/Coatings | L * | a * | b * | ΔL * | Δa * | Δb * | ΔE* |
| PB | 87.7 ± 0.2 a | 0.12 ± 0.10 a | 9.2 ± 0.3 a | 0 | 0 | 0 | 0 |
| BLE32 | 51.3 ± 1.6 b | 8.10 ± 0.48 b | 33.6 ± 1.0 b | -22.3 | 5.1 | 23.1 | 32.5 |
| BLE63 | 46.8 ± 0.9 c | 10.73 ± 0.18 c | 30.5 ± 0.9 c | -26.2 | 6.4 | 25.3 | 37.0 |
| BLE125 | 57.1 ± 0.4 d | 7.65 ± 0.15 b | 34.9 ± 0.3 b | -30.6 | 7.5 | 25.7 | 40.7 |
| BLE200 | 61.5 ± 1.0 e | 6.54 ± 0.30 d | 34.6 ± 0.6 b | -40.9 | 10.6 | 21.3 | 47.3 |
| BLE500 | 65.4 ± 1.3 f | 5.22 ± 0.12 e | 32.3 ± 0.4 c | -36.4 | 8.0 | 24.3 | 44.5 |
Coating conditions: BLE 8% (dry basis). Values are presented as mean ± standard deviation (n = 6). In the CIELAB color space, * after L, a, and b are part of the full name to distinguish L*a*b* from Hunter’s Lab. Samples subscripted by different letters are significantly different in terms of impact of raw material particle size distribution at p < 0.05.
Table 10.
FTIR peak assignment of coatings without (PB) and with BLE particles (PB-BLE).
| PB-BLE32 | PB-BLE63 | PB-BLE125 | PB-BLE200 | PB-BLE500 | PB | Group |
Integration Range (cm-1) |
||
| cm-1 | Area (%) | Area (%) | Area (%) | Area (%) | Area (%) | Area (%) | |||
| 3520 | 2.16 ± 0.06 a | 2.05 ± 0.16 a | 1.87 ± 0.08 b | 2.02 ± 0.08 a | 2.13± 0.04 a | 1.22 ± 0.01 c | -OH stretch | 3450-3700 | |
| 3383 | 4.13 ± 0.09 a | 3.66 ± 0.18 b | 3.02 ± 0.36 c | 3.63 ± 0.09 b | 3.75 ± 0.07 b | 3.42 ± 0.06 b | -N-H stretch | 3200-3450 | |
| 2917 | 7.96 ± 0.26 a | 8.84 ± 0.17 a | 10.1 ± 0.9 b | 8.6 ± 0.1 a | 8.7 ± 0.5 a | 9.1 ± 0.1 b | -CH2- asymmetric stretch | 2875-3020 | |
| 2851 | 2.50 ± 0.10 a | 2.96 ± 0.06 a | 3.66 ± 0.47 b | 2.91 ± 0.04 a | 2.88 ± 0.23a | 3.05 ± 0.03 a | -CH2- symmetric stretch | 2800-2875 | |
| -- | -- | -- | -- | -- | -- | -- | NCO isocyanate groups stretch | 2260-2270 | |
| 1724 | 8.37 ± 0.01 a | 8.11 ± 0.00 b | 7.55 ± 0.05 c | 8.03 ± 0.00 b | 8.30 ± 0.00 a | 8.47 ± 0.00 a | Urethane carbonyl groups non-hydrogen bonded [39] | 1745-1705 | |
| 1685 | 9.07 ± 0.10 a | 8.74 ± 0.02 a | 8.08 ± 0.35 b | 8.90 ± 0.04 a | 9.01 ± 0.14 a | 9.19 ± 0.02 a | Urethane carbonyl groups hydrogen bonded [39] | 1660-1705 | |
| 1518 | 3.55 ± 0.02 a | 3.48 ± 0.01 a | 3.27 ± 0.04 b | 3.47 ± 0.01 a | 3.58 ± 0.01 a | 3.82 ± 0.00 c | –NH and –C–N vibrations of the urethane linkages[38] | 1490-1540 | |
| 1463 | 5.75 ± 0.00 a | 5.80 ± 0.00 a | 5.81 ± 0.01 a | 5.98 ± 0.00 b | 5.87 ± 0.01 a | 6.28 ± 0.00 c | -CH2, -CH3 bending vibrations[38,40] | 1440-1490 | |
| 1245 | 4.84 ± 0.00 a | 4.62 ± 0.00 b | 4.41 ± 0.01 b | 4.70 ± 0.00 a | 4.81 ± 0.02 a | 4.82 ± 0.00 a | Deformation vibrations of the N-H bond and of the O-C-N bonds | 1220-1285 | |
| 1180 | 3.67 ± 0.00 a | 3.61 ± 0.00 a | 3.37 ± 0.03 b | 3.64 ± 0.00 a | 3.74 ± 0.00 a | 3.80 ± 0.00 a | Coupled C-N and C-O stretching vibrations | 1165-1195 | |
| 1065 | 0.97 ± 0.00 a | 0.91 ± 0.00 b | 0.91 ± 0.00 b | 0.85 ± 0.00 c | 0.83 ± 0.00 c | 0.76 ± 0.00 d | C–H stretching vibration[41] | 1080-1055 | |
| 1027 | 3.42 ± 0.01 a | 3.34 ± 0.01 a | 3.26 ± 0.00 a | 3.21 ± 0.00 b | 3.14 ± 0.00 b | 3.11 ± 0.00 b | C-O, C-C, and C-C-O stretch | 1005-1040 | |
| 764 | 1.85 ± 0.00 a | 1.82 ± 0.00 a | 1.71 ± 0.01 b | 1.85 ± 0.00 a | 1.84 ± 0.01 a | 1.67 ± 0.00 b | N-H out of plane bending | 740-785 | |
| 717 | 0.69 ± 0.00 a | 0.74 ± 0.00 b | 0.80 ± 0.00 c | 0.75 ± 0.00b | 0.74 ± 0.0 b | 0.62 ± 0.00 d | C-C Alkanes skeletal vibrations | 705-735 | |
PB: textile samples coated with the standard WPU formulation; PB-BLE: textile samples coated with the WPU formulation and the Branches and leaves of E. globulus particles of different particle size. Values are presented as mean ± standard deviation (n=3). Samples subscripted by different letters are significantly different in terms of impact of raw material particle size distribution at p < 0.05.
Table 11.
DSC characteristic temperatures and enthalpy of the textile products uncoated and coated without (PB) and with the BLE particles (BLE32-500).
Table 11.
DSC characteristic temperatures and enthalpy of the textile products uncoated and coated without (PB) and with the BLE particles (BLE32-500).
| Samples/Coatings | Peak 1 | Peak 2 | Peak 3 | Peak 4 | ||||
| Temperature (°C) | J/g | Temperature (°C) | J/g | Temperature (°C) | J/g | Temperature (°C) | J/g | |
| Cotton Knitt | 36.9-125.6 (70.2) | -87.8 | -- | -- | 326.7-398.0 (369.7) | -220.3 | -- | -- |
| PB | 55.0 -125.1 (93.9) | -46.8 | 175.1-257.0 (227.3) | -7.8 | 330.7-376.2 (355.9) | -42.2 | 142.9-494.4 (457.1) | -16.8 |
| BLE32 | 54.3-138.8 (85.2) | -45.9 | 180.7-274.6 (227.1) | -7.3 | 321.5-387.3 (361.6) |
-53.0 | 406.8-499.5 (453.3) |
-24.2 |
| BLE63 | 57.4-124.6 (82.5) | -39.0 | 170.8-251.0 (218.4) | -8.2 | 325.1-387.8 (358.8) | -44.7 | 417.3-499.3 (451.4) | -26.4 |
| BLE125 | 57.0-120.9 (78.8) |
-35.2 | 162.1-246.9 (211.8) | -8.5 | 327.7-389.2 (359.2) | -56.1 | 415.7-497.9 (451.2) | -21.3 |
| BLE200 | 52.2-125.6 (87.0) | -53.4 | 162.1-249.7 (221.0) | -7.7 | 325.6-383.5 (359.7) | -52.5 | 413.9-498.8 (453.1) | -17.7 |
| BLE500 | 53.9-122.4 (82.6) | -53.4 | 162.6-254.8 (220.0) | -8.2 | 320.3-389.0 (362.5) | -80.8 | 419.5-494.7 (452.6) | -9.7 |
Coating conditions: BLE 10% (dry basis). Values are presented as mean ± standard deviation (n = 6). Peak temperatures are shown as onset - end of the peak with the value of the peak temperature in brackets.
Table 12.
DTG (O2 atmosphere) characteristic temperatures and TG mass lose values of the textile products uncoated and coated without (PB) and with the BLE particles (BLE32-500).
Table 12.
DTG (O2 atmosphere) characteristic temperatures and TG mass lose values of the textile products uncoated and coated without (PB) and with the BLE particles (BLE32-500).
| Cotton Knitt | PB | BLE 32 | BLE 63 | BLE 125 | BLE 200 | BLE 500 | ||
| Peak 1 (°C) | 355.7 | 335.9 | 340.5 | 336.1 | 330.5 | 330.5 | 335.0 | |
| Peak 2 (°C) | -- | 471.0 | 464.3 | -- | 468.2 | 464.3 | 456.6 | |
| Peak 3 (°C) | -- | 484.1 | -- | -- | -- | -- | -- | |
| Temperature (Td 5%) | 285.7 | 225.9 | 221.5 | 243.3 | 230.1 | 246.6 | 269.0 | |
| Temperature (Td 20%) | 325.3 | 315.5 | 317.8 | 318.3 | 313.2 | 316.8 | 318.8 | |
| Temperature (Td 50%) | 345.0 | 340.6 | 340.9 | 337.2 | 327.8 | 331.5 | 333.9 | |
| Temperature (Td 75%) | 357.5 | 370.5 | 379.9 | 420.6 | 330.8 | 381.3 | 342.4 | |
| Residual mass 500 °C (%) | 2.4 | 2.9 | 7.4 | 10.9 | 2.5 | 3.5 | 4.7 | |
Td 5%: Temperature of 5% weight loss; Td 20%: Temperature of 20% weight loss; Td 50%: Temperature of 50% weight loss; Td 75%: Temperature of 75% weight loss.
Table 13.
DSC (O2 atmosphere) characteristic temperatures and enthalpy of the textile products uncoated and coated without (PB) and with the BLE particles (BLE32-500).
Table 13.
DSC (O2 atmosphere) characteristic temperatures and enthalpy of the textile products uncoated and coated without (PB) and with the BLE particles (BLE32-500).
| Samples/Coatings | Peak 1 | Peak 2 | Peak 3 | |||
| Temperature (°C) | J/g | Temperature (°C) | J/g | Temperature (°C) | J/g | |
| PB | 283.2-357.6 (355.6) | 1157 | 429.2-474.6 (472.9) | 597.5 | 474.6-487.0 (483.4) | 267.3 |
| BLE32 | 279.9-352.4 (350.2) | 1028 | 403.7-483.5 (465.2) | 380.8 | -- | -- |
| BLE63 | 279.6-347.8 (346.0) | 687.9 | 404.2-495.2 (473.9) | 395.9 | -- | -- |
| BLE125 | 298.6-342.0 (338.2) | 2145 | 427.0-498.9 (465.0) | 288.7 | -- | -- |
| BLE200 | 281.3-349.6 (339.6) | 1004 | 427.6-470.5 (469.5) | 1147 | -- | -- |
| BLE500 | 305.1-345.9 (341.0) | 935.4 | 439.2-463.8 (461.6) | 821.2 | -- | -- |
Coating conditions: BLE 10% (dry basis). Values are presented as mean ± standard deviation (n = 6). Peak temperatures are shown as onset - end of the peak with the value of the peak temperature in brackets.
Disclaimer/Publisher’s Note: The statements, opinions and data contained in all publications are solely those of the individual author(s) and contributor(s) and not of MDPI and/or the editor(s). MDPI and/or the editor(s) disclaim responsibility for any injury to people or property resulting from any ideas, methods, instructions or products referred to in the content. |
© 2025 by the authors. Licensee MDPI, Basel, Switzerland. This article is an open access article distributed under the terms and conditions of the Creative Commons Attribution (CC BY) license (http://creativecommons.org/licenses/by/4.0/).
Copyright: This open access article is published under a Creative Commons CC BY 4.0 license, which permit the free download, distribution, and reuse, provided that the author and preprint are cited in any reuse.


