Submitted:
15 May 2025
Posted:
15 May 2025
You are already at the latest version
Abstract
A new nongenetic mechanism of cancer initiation that induces single preneoplastic hepatocytes positive for the glutathione S-transferase P-form (GST-P), precursors of foci and nodules, was identified in rat livers on the basis of the rapid excretion of GST-P into bile. Presently, the key process was examined quantitatively through application of the first-order consecutive reaction, A → B → C, where A and B represent the concentrations of the GST-P protein synthesized and accumulated in hepatocytes, respectively, and C represents the amount of the GST-P protein excreted into bile; additionally, k1 and k2 are kinetic constants for the first and second steps, respectively. In response to strong carcinogenic stress, GST-P was suggested to be excreted 10 to 20 times more rapidly than it accumulated in hepatocytes. The GST-P+ cells were suggested to have formed from severe injury because more than 90 % of the damage to the excretory system was caused by the carcinogens, the initial process of which is considered irreversible in practice. Preneoplastic cell induction, i.e., phenotypic conversion, was thus indicated kinetically to be nongenetic as well. Although tentative, the present data may help in gaining further insights into cancer initiation at the molecular and cellular levels.
Keywords:
cancer initiation
; lipid peroxidation
; preneoplastic marker enzyme
; chemical hepatocarcinogenesis
; kinetic simulation
1. Introduction
Thus far, researchers have been unable to gain insight into the mechanism of cancer initiation on the basis of the somatic mutation theory (SMT) of Boveri [1,2,3]. Since they are latent and slight, mutations are undetectable and unexaminable in vivo in practice [4]. Considering the intrinsic difficulties of genetic analysis, biomarker analysis has emerged as a promising alternative. In chemical hepatocarcinogenesis in rats, glutathione S-transferase P-form-positive (GST-P+) single hepatocytes and minifoci, precursors of foci and nodules, are detected as early as 2 to 3 days after the administration of diethyl-N-nitrosamine (DEN), as shown in Figure 1 [5,6].
The specific induction mechanism of GST-P+ single hepatocytes in rat livers, i.e., the phenotypic conversion of GST-P- hepatocytes into GST-P+ hepatocytes, has attracted increasing attention from many researchers [7,8,9] but remained unclear for more than 35 years. Unexpectedly, however, GST-P was found to be rapidly excreted into bile in response to the strong carcinogenic stress upon 2-acetylaminofluorene (AAF) administration followed by immunocytochemical staining using vibratome-prepared liver samples instead of microtome-prepared samples [10]. Although GST-P is a cytosolic enzyme, its expression was negative in hepatocytes but heavily positive in canaliculi, canalicular networks, bile ducts and ductules; i.e., in bile juice.
A new mechanism of cancer initiation was then identified unambiguously on the basis of the dynamic action of the marker enzyme unspecified thus far [10,11]. Notably, the induction of GST-P+ single hepatocytes was determinable to be nongenetic in nature since numerous positive cells are detectable in rat livers under appropriate conditions, whereas mutation is a rare event that is undetectable in vivo in practice.
This new nongenetic mechanism of cancer initiation via the induction of GST-P+ single hepatocytes is illustrated in Supplementary Figure S1. In this mechanism, carcinogens act to stimulate the lipid peroxidation (LPO) of microsomal components to generate various endogenous carcinogens, such as acrolein, 4-hydroxynonenal (4-HNE) and malondialdehyde (MDA), in hepatocytes [12,13,14]. GST-P and many other phase 2 detoxifying/antioxidant enzymes are induced to detoxify these compounds. Carcinogens also injure canaliculi to decrease the excretion of GST-P into bile, resulting in the accumulation of the marker enzyme in hepatocytes and giving rise to GST-P+ single hepatocytes. Promoter agents also act similarly but do not injure the excretory system of GST-P. To delineate the process by which hepatocytes transform into preneoplastic cells, in the present study the functional characteristics of the excretory system of GST-P were examined through kinetic simulations, albeit tentatively.
2. Materials and Methods
2.1. Kinetic Formulation for the Specific Induction of GST-P+ Single Hepatocytes in Rat Livers by Carcinogens
As described above, GST-P was found to be rapidly excreted into bile in response to strong carcinogenic stress. Upon feeding a basal diet containing 0.04 % AAF, numerous GST-P+ single hepatocytes, along with minifoci, foci and nodules, are inducible over 6 to 7 weeks. Therefore, assuming that the amount of the GST-P protein synthesized in hepatocytes per unit time, i.e., the time differential, is constant (A0), at certain time, the induction of GST-P+ single hepatocytes can be approximated by the following first-order consecutive/sequential reaction:
where A and B represent the concentrations of GST-P protein synthesized and accumulated in hepatocytes, respectively, C represents the protein concentration excreted into bile, and k1 and k2 represent the rate constants for the first and second steps, respectively.
k1 k2
A → B → C
According to the formulation by Laidler and others [15,16], the kinetic equations are expressed as follows:
where [A0] = [A] + [B] + [C].
[A] = [A0]e-k1t
[B] = [A0]{k1/(k2-k1)}(e-k1t-e-k2t)
[C] = [A0][1- e-k1t - {k1/(k2-k1)}(e-k1t-e-k2t)]
In Equation (2),
where [Bmax] is the maximum value of [B] at tmax= {1/(k1-k2)}ln(k1/k2)} in Equation (2). For ease of simulation, the equation [Bmax] = xx/(1-x) was used, with k2/k1=x and [A0] = 1.
[B max] = [A0](k2/k1)k2/(k1-k2)
2.2. Softwares Used for the Simulations
The simulations were performed using GeoGebra (https://www.geogebra.org) and Excel (version 2108) softwares.
3. Results
Figure 2 shows six typical patterns, a)-f), which were simulated as a function of time considering [A0] = 1 and k1=1, for simplicity. The [Bmax] values obtained were a) 0.657, b) 0.5, c) 0.368, d) 0.25, e) 0.078 and f) 0.042. Since k1 and k2 are rate constants for the accumulation and excretion of GST-P, respectively, k2/k1 represents the efficiency of excretion vs. accumulation. Specifically, the smaller the k2/k1 value is, the greater the accumulation of GST-P in hepatocytes is, and vice versa. Under strong carcinogenic stress, hepatocytes are negative for GST-P, but biliary tracts are heavily immunocytochemically positive for GST-P, which corresponds to pattern e) or f), i.e., the amount of GST-P accumulated in hepatocytes is 7.8 % or 4.2 % of the total (100 %). However, when the excretory system is injured to different degrees by carcinogens, the GST-P protein accumulates in hepatocytes. Accordingly, the intensities of GST-P+ single hepatocyte immunostaining are a), strong; b) intermediate; c) and d) weak; and e) and f) negative.
To clarify the process of GST-P protein accumulation in hepatocytes, i.e., the transformation process quantitatively, simulations were performed to generate plots of [Bmax] vs. t at k2/k1 values of 0.1, 0.2, 0.5, 1.0, 2.0, 5.0, 10.0, 20.0 and 50.0, as shown in Figure 3a. As described above, the k2/k1(=x) value is a measure of the efficiency of GST-P excretion vs. accumulation. As shown in the figure, the smaller the k2/k1 value is, the greater the accumulation of GST-P in hepatocytes is, giving rise to GST-P+ single hepatocytes, and vice versa.
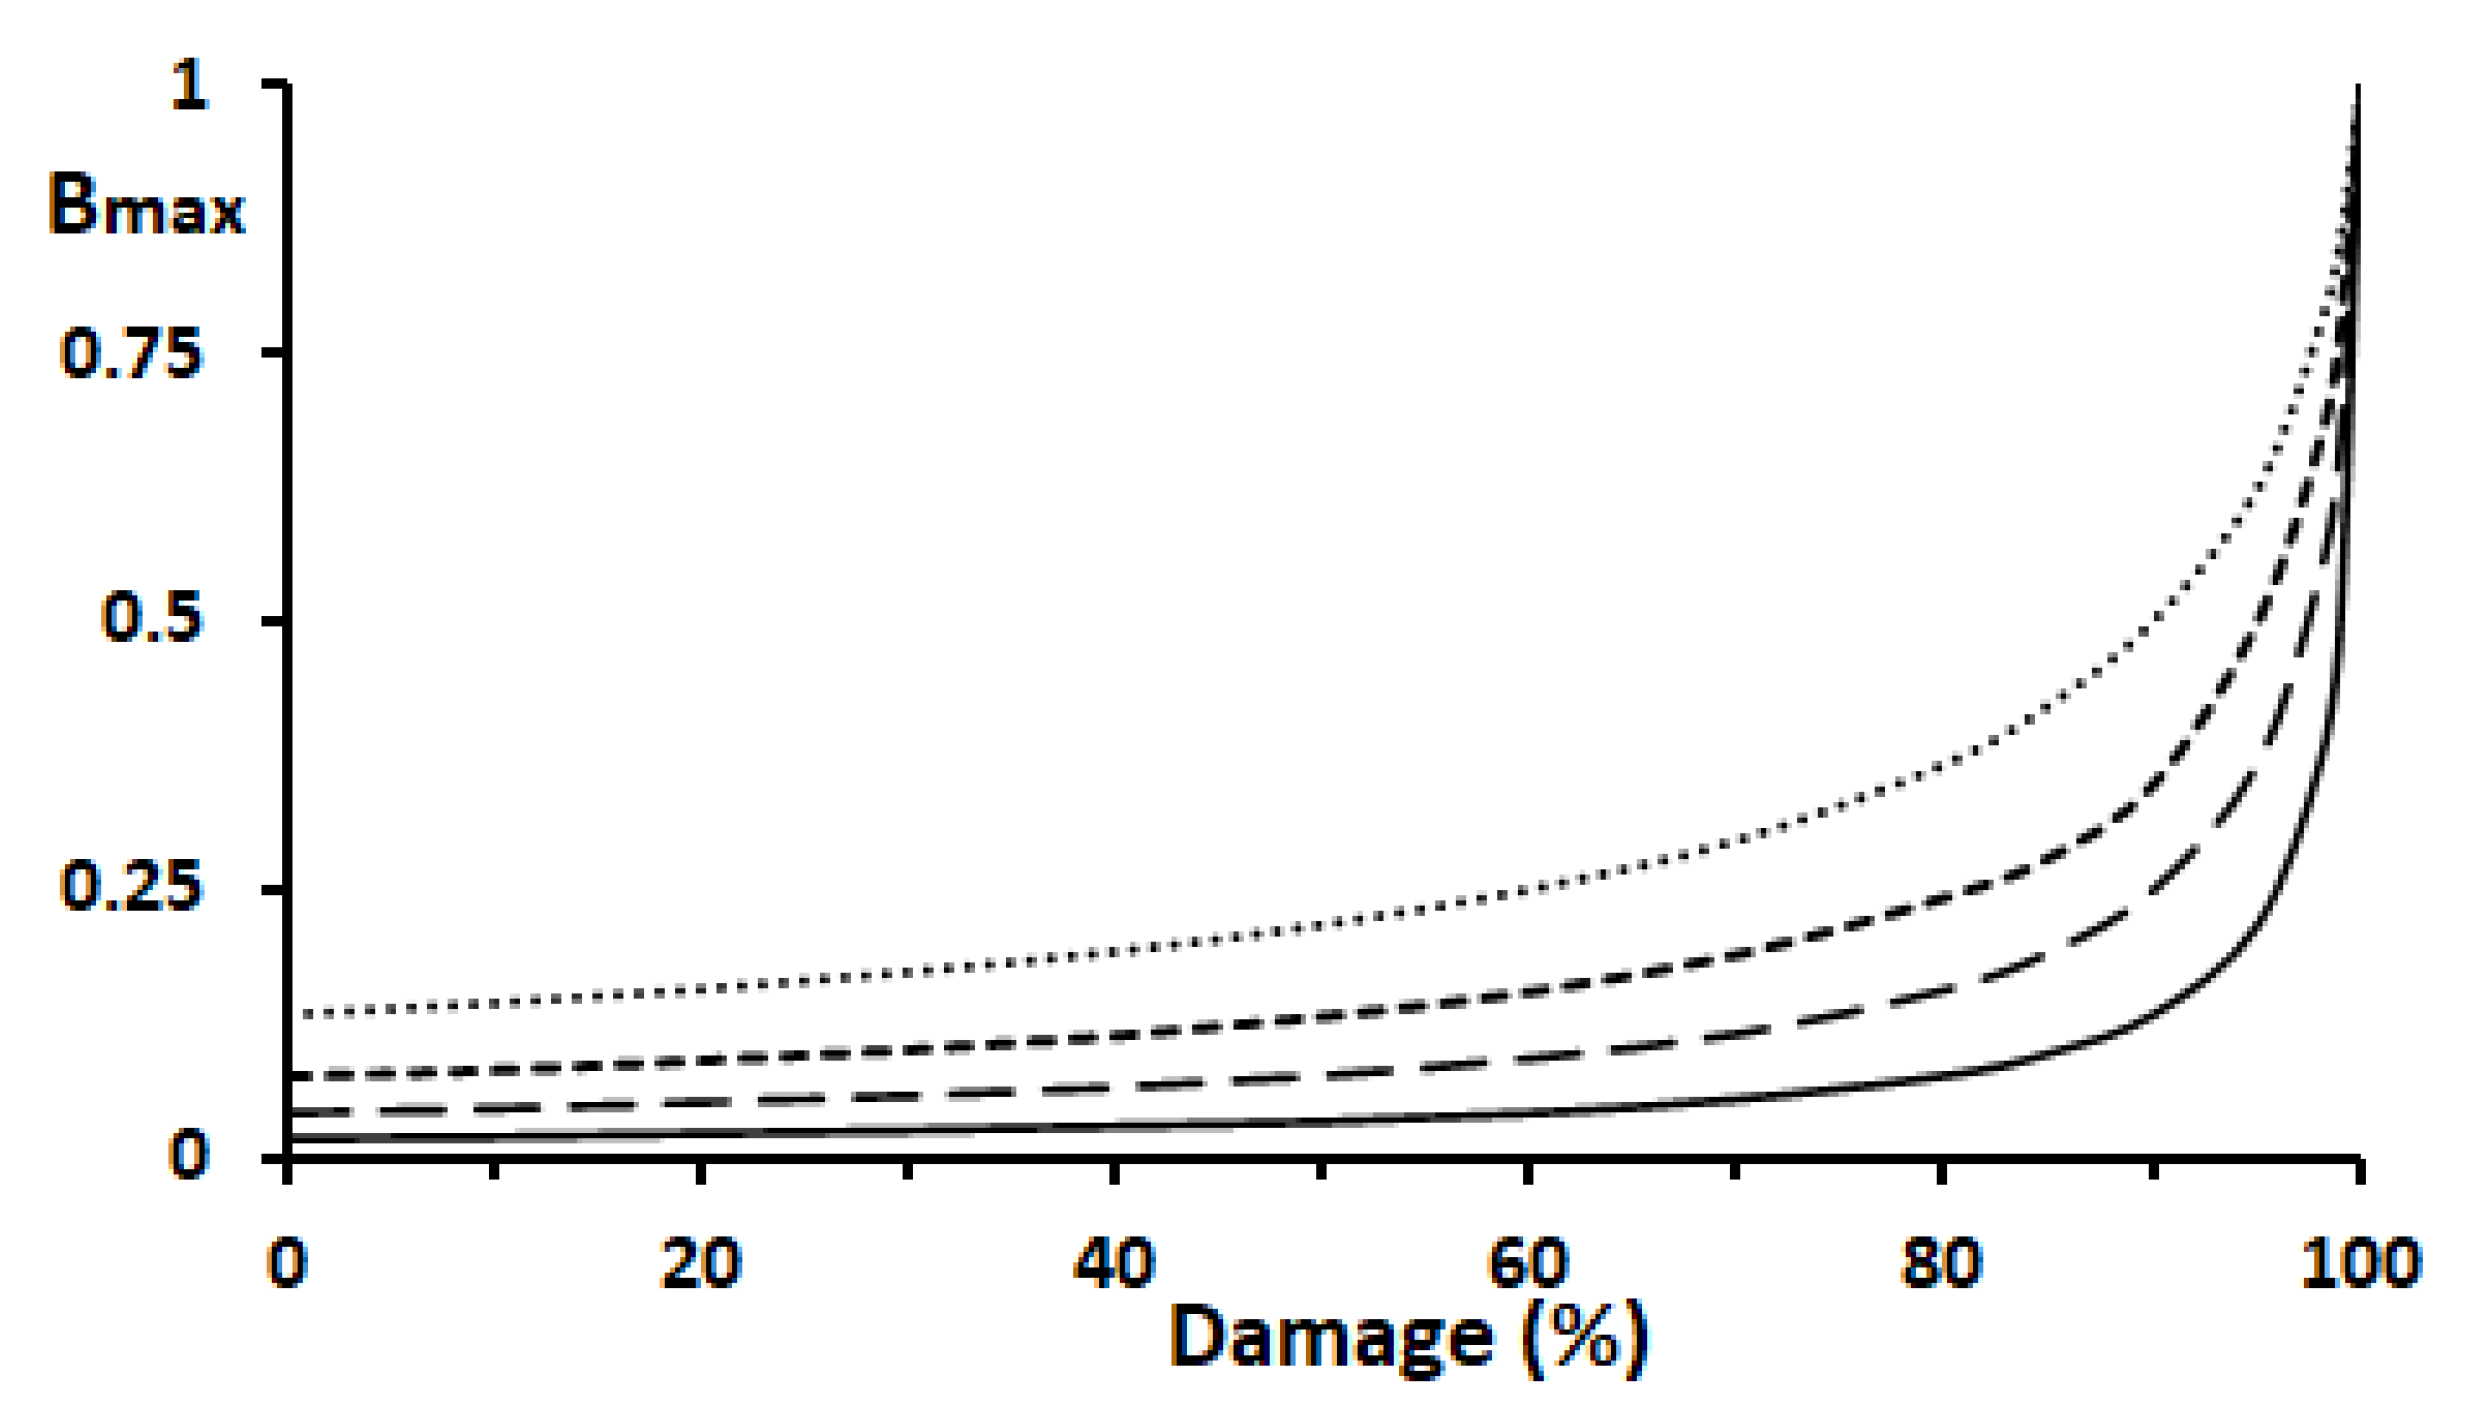
Figure 3b shows the plots of [Bmax] vs. k2/k1. [Bmax] is inversely correlated with k2/k1, by which the smaller the k2/k1 value is, the larger the [Bmax] value is. For simplicity, the [Bmax] value was assumed to be 1.0 when excretion is completely damaged, i.e., k2 = 0. The functional damage to the excretory system caused by the carcinogens and GST-P accumulation can be estimated as follows: damage (%) = {(xi – x)/xi}×100, where x = k2/k1; xi = 5, 10, 20 or 50; and xi > x in the ordinate (Figure 3b). Figure 4 shows the simulated patterns of the plots of [Bmax] vs. damage (%) to the excretory system at k2/k1=5, 10, 20 and 50.
In Figure 4, 100 % damage corresponds to [Bmax] = 1.0, and 0 % indicates no damage caused by carcinogens. The increment of [Bmax] is fairly small in the range of 0 to 90 % damage, but it increases sharply from 90 to 100 % damage. This tendency became more marked as the k2/k1 value increased. For example, even when the excretory system suffered 50 % damage, the increases in [Bmax] were relatively small, at 8.3 %, 5.5 %, 3.4 % and 1.7 % at k2/k1 = 5, 10, 20, and 50, respectively. However, the increases reached 85.4 %, 91.6 %, 95.3 %, and 98.0 % when 90 % damage occurred at k2/k1=5, 10, 20, and 50, respectively. Accordingly, severe injury to the excretory system is needed for more than 90 % functional damage to occur and give rise to GST-P+ single hepatocytes in the rat liver.
4. Discussion
The specific mechanism of GST-P+ single hepatocyte induction in the rat liver is highly important for elucidating the mechanism of cancer initiation, i.e., the cause or origin of cancer, at the molecular and cellular levels. The rapid excretion of GST-P from hepatocytes into bile is thus a key process during cancer initiation in a rat model of hepatocarcinogenesis. Considering immunocytochemical staining for GST-P, as the cytosol of hepatocytes is negative but bile juice is heavily positive, although GST-P is a cytosolic enzyme [17,18], the functional characteristics of the excretory system of GST-P were examined through application of the first-order consecutive/sequential reaction to the phenotypic conversion of GST-P- hepatocytes into positive ones.
The kinetic simulations revealed that a relative rate (k2/k1 value) of 10 to 20 agrees well for the immunocytochemical staining patterns. Namely, the excretion rate, k2, was 10 to 20 times faster than the accumulation rate, k1, in hepatocytes. In addition, induction was caused specifically by severe injury to the excretory system that resulted in more than 90 % functional damage. In other words, the excretory system is fairly resistant to carcinogenic injury, and specific induction has been suggested to be irreversible in the rat liver.
At present, the details of the GST-P excretory system are unclear. However, GST-P is expressed in all hepatocytes and excreted rapidly into bile in response to strong carcinogenic stress induced by either initiators or promoters [10,11]. Accordingly, GST-P is thought to be excreted through some transporter of phase 3 detoxifying enzymes that are not yet known. Thus, elucidation of the GST-P transporter, if it exists, is needed.
The biochemical function of GST-P is also of interest. GST-P expression is suppressed under normal conditions, but it is strongly induced in preneoplastic livers to levels as high as approximately 30-fold greater than those in normal livers [19,20]. Unlike Alpha and Mu class GSTs, Pi class GSTs have been shown to be selective for water-soluble compounds [21]. In addition, the sequences of both rat and human Pi class GSTs contain the highly reactive residue 47-Cys [22,23,24]. The specific function of GST-P was therefore speculated as follows. GST-P is inducible in response to the strong carcinogenic stress applied to the animals. Upon glutathione (GSH) depletion, GST-P binds to 4-HNE or acrolein selectively through its reactive 47-Cys residue and is instantaneously excreted into bile. Interestingly, GST-P is still enzymatically active in bile juice and resistant to bile acids. Additionally, soluble GST-P from bile bound almost quantitatively to an S-hexyl-GSH-Sepharose 4B affinity column [19,25].
5. Conclusions
The key process of cancer initiation that induces preneoplastic GST-P+ single hepatocytes in rat livers, i.e., the phenotypic conversion of GST-P- hepatocytes into GST-P+ hepatocytes, was examined quantitatively through application of the first-order constitutive reaction. The excretion rate of GST-P into bile, k2, was suggested to be 10 to 20 times faster than the accumulation rate, k1, in hepatocytes in response to strong carcinogenic stress. The GST-P+ cells were suggested to have formed after severe injury that damaged more than 90 % of the excretory system upon the administration of initiator carcinogens, and the initial carcinogenic process by which GST-P+ single hepatocytes are induced was suggested to be irreversible in practice. Preneoplastic cell induction, i.e., phenotypic conversion, was thus indicated kinetically to be nongenetic as well. The new nongenetic mechanism accounts for various problems with and aspects of preneoplastic cell induction in rat livers and is also applicable to many other carcinogenic processes, as previously noted [11]. The present data may be helpful in gaining further insight into the mechanism of cancer initiation at the molecular and cellular levels.
Supplementary Materials
The following supporting information can be downloaded at the website of this paper posted on Preprints.org. The Supplementary Figure is shown on a separate sheet.
Author Contributions
KS designed and wrote the manuscript. HN and TM performed the kinetic simulations. HN and KK performed immunochemical, cytologic and enzymatic analyses. English language editing was performed by American Journal Experts. The authors read and approved the final manuscript.
Funding
This research received no external funding.
Data Availability Statement
All the data needed to evaluate the conclusions in the paper are presented in the paper and in the references cited in this article.
Acknowledgments
The authors thank the late Dr. Hatayama I (Aomori Prefectural Institute) and the late professor Sato K (2nd Dept. Biochem., Hirosaki Univ., Sch. Med) for their helpful discussions and supervisions.
Conflicts of Interest
The authors have no conflicts of interest to disclose.
Abbreviations
| AAF | 2-Acetylaminofluorene |
| DEN | Diethyl-N-nitrosamine |
| GST-P | Glutathione S-transferase P-form [EC. 2.5.1.18] |
| HNE | 4-Hydrxy-2-nonenal |
References
- Boveri, T. The Origin of Malignant Tumors. Williams & Wilkins; Baltimore, MD: 1914: pp. 62–63.
- Farber, E. , Cameron R. The sequential analysis of cancer development. Adv. Cancer Res. 1980, 125–226. [Google Scholar] [CrossRef]
- Berenblum, I.; Shubik, P. An experimental study of the initiating stage of carcinogenesis, and a re-examination of the somatic cell mutation theory of cancer. Br. J. Cancer 1949, 3, 109–118. [Google Scholar] [CrossRef] [PubMed]
- Pitot, H.C. Principles of carcinogenesis. Chemical, In: DeVita VT Jr, Hellman SA & Rosenburg (eds), Cancer: Principles and Practice of Oncology, 2nd ed. Philadelphia: Lippincott JB, 1985, pp. 116–135.
- Moore, M.A.; Nakagawa, K.; Satoh, K.; Ishikawa, T.; Sato, K. Single GST-P positive liver cells--putative initiated hepatocytes. Carcinogenesis 1987, 8, 483–4836. [Google Scholar] [CrossRef] [PubMed]
- Weinhouse, S. A single GST-P positive hepatocyte induced by a hepatocarcinogen. Jpn J Cancer Res. 1991, 82(12): 1464-1465.
- Grasl-Kraupp, B.; Luebeck, G.; Wagner, A.; Löw-Baselli, A.; de Gunst, M.; Waldhör, T.; Moolgavkar, S.; Schulte-Hermann, R. Quantitative analysis of tumor initiation in rat liver: role of cell replication and cell death (apoptosis). Carcinogenesis 2000, 21, 1411–1421. [Google Scholar] [CrossRef] [PubMed]
- Ogawa, K. Molecular pathology of early stage chemically induced hepatocarcinogenesis. Pathology International 2009, 59, 605–622. [Google Scholar] [CrossRef] [PubMed]
- Muramatsu, M.; Sakai, M. Mechanisms of a tumor marker, glutathione transferase P, expression during hepatocarcinogenesis of the rat. Proc. Jpn Acad. Ser B Phys. Biol. Sci. 2006, 82(9), 339–352. [Google Scholar] [CrossRef] [PubMed]
- Satoh, K.; Yamakawa, D.; Kasai, K.; Hatayama, I. Vibratome technique revealed initial carcinogenic changes that induce GST-P+ single hepatocytes and minifoci in rat liver: Molecular and cellular mechanisms for cancer initiation. Anal. Biochem. 2023, 672, 115168. [Google Scholar] [CrossRef] [PubMed]
- Satoh, K. A new mechanism of cancer initiation that involves the transformation of hepatocytes into preneoplastic single hepatocytes and minifoci positive for glutathione S-transferase P-form (GST-P) in rat livers: 3D analysis using a vibratome. . Cancer Med. 2024, 13(18):e70165. DOI: 10.1002/cam4.70165. [CrossRef]
- Esterbauer, H.; Schaur, R.J.; Zollner, H. Chemistry and biochemistry of 4-hydroxynonenal, malonaldehyde, and related aldehydes. Free Radic. Biol. Med. 1991, 11, 81–128. [Google Scholar] [CrossRef] [PubMed]
- Dianzani, M.U. Lipid peroxidation and cancer. Crit. Rev. Oncol. Hematol. 1993, 15(2), 125–147. [Google Scholar] [CrossRef] [PubMed]
- Jelic, M.D.; Mandic, A.D.; Maricic, S.M.; Srdjenovic, B.U. Oxidative stress and its role in cancer. J. Cancer Res. Ther. 2021, 17(1), 22–28. [Google Scholar] [CrossRef] [PubMed]
- Laidler, K.J. Reaction Kinetics. Homogeneous Gas Reactions. Chapter 2. In Molecular Kinetics.; Elsevier Ltd, 1963; pp. 42–96. [Google Scholar]
- Dalal, M. Textbook of Physical Chemistry – Volume I. Chapter 3. Chemical Dynamics – I. Dalal Inst. 2018.pp.127-134.
- Mannervik, B.; Danielson, U.H. Glutathione transferases--structure and catalytic activity. CRC Crit. Rev. Biochem. 1988, 23(3), 283–337. [Google Scholar] [CrossRef] [PubMed]
- Hayes, J.D.; Pulford, D.J. The glutathione S-transferase supergene family: regulation of GST and the contribution of the isoenzymes to cancer chemoprotection and drug resistance. Crit. Rev. Biochem. Mol. Biol. 1995, 30(6), 445–600. [Google Scholar] [CrossRef] [PubMed]
- Satoh, K.; Kitahara, A.; Soma, Y.; Inaba, Y.; Hatayama, I.; Sato, K. Purification, induction, and distribution of placental glutathione transferase: A new marker enzyme for preneoplastic cells in the rat chemical hepatocarcinogenesis. Proc. Natl Acad. Sci. USA. 1985, 82, 3964–3968. [Google Scholar] [CrossRef] [PubMed]
- Sato, K. Glutathione transferases as markers of preneoplasia and neoplasia. Adv. Cancer Res. 1989, 52, 205–255. [Google Scholar] [CrossRef] [PubMed]
- Satoh, K.; Sato, R.; Takahata, T.; Suzuki, S.; Hayakari, M.; Tsuchida, S.; Hatayama, I. Quantitative differences in theactive site hydrophobicity of five huma glutathione S-transferaseisoenzymes: Water-soluble carcinogen selective properties of the neoplastic GSTP1-1 species. Arch. Biochem. Biophys. 1999, 361, 271–276. [Google Scholar] [CrossRef] [PubMed]
- Tamai, K.; Satoh, K.; Tsuchida, S.; Hatayama, I.; Maki, T.; Sato, K. Specific inactivation of glutathione S-transferases in class Pi by SH-modifiers. Biochem. Biophys. Res. Commun. 1990, 167(1), 331–338. [Google Scholar] [CrossRef] [PubMed]
- Lo Bello, M.; Parker, M.W.; Desideri, A.; Polticelli, F.; Falconi, M.; Del Boccio, G.; Pennelli, A.; Federici, G.; Ricci, G. Peculiar spectroscopic and kinetic properties of Cys-47 in human placental glutathione transferase. Evidence for an atypical thiolate ion pair near the active site. J. Biol. Chem. 1993, 268, 19033–19038. [Google Scholar] [CrossRef] [PubMed]
- Ricci, G.; Lo Bello, M.; Caccurri, A.M.; Pastore, A.; Nuccetelli, M.; Parker, M.W.; Federici, G. Site-directed mutagenesis of human glutathione transferase P1-1. Mutation of Cys-47 induces a positive cooperativity in glutathione transferase P1-1. J. Biol. Chem. 1995; 270, 1243–1248. [Google Scholar] [CrossRef]
- Satoh, K.; Hatayama, I.; Tsuchida, S.; Sato, K. Biochemical characteristics of a preneoplastic marker enzyme glutathione S-transferase P-form(7-7). Arch. Biochem. Biophys. 1991, 285(2), 312–316. [Google Scholar] [CrossRef] [PubMed]
Figure 1.
A single GST-P+ hepatocyte 48 hours after DEN induction in the liver of a male Sprague–Dawley rat. A microtome-prepared liver sample was immunostained for GST-P [6]. Magnification: 40×. Reprinted with permission from Wiley.
Figure 1.
A single GST-P+ hepatocyte 48 hours after DEN induction in the liver of a male Sprague–Dawley rat. A microtome-prepared liver sample was immunostained for GST-P [6]. Magnification: 40×. Reprinted with permission from Wiley.
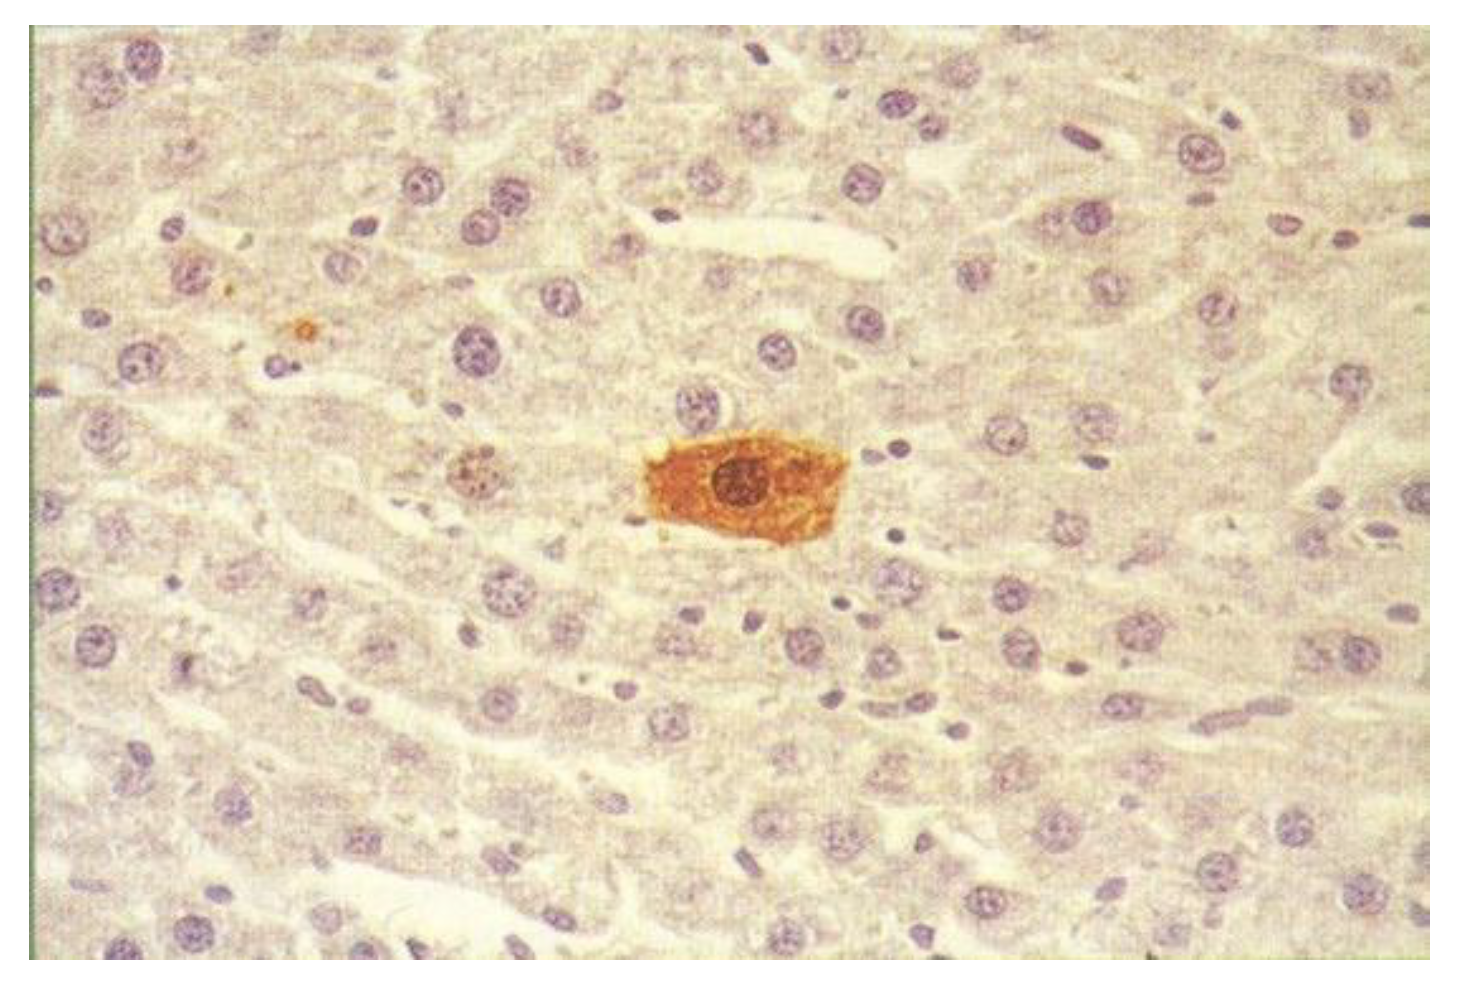
Figure 2.
Typical patterns of GST-P+ single hepatocyte induction in rat livers as a function of time. The k2/k1 values used were a) 0.25, b) 0.5, c) 0.99, d) 2, e) 10 and f) 20. The lines, (—), (---) and (– –) represent the concentrations of the GST-P protein synthesized (A) and accumulated (B) in hepatocytes and the concentration excreted into the bile (C), respectively, according to equations (1-3) shown in the Materials and Methods.
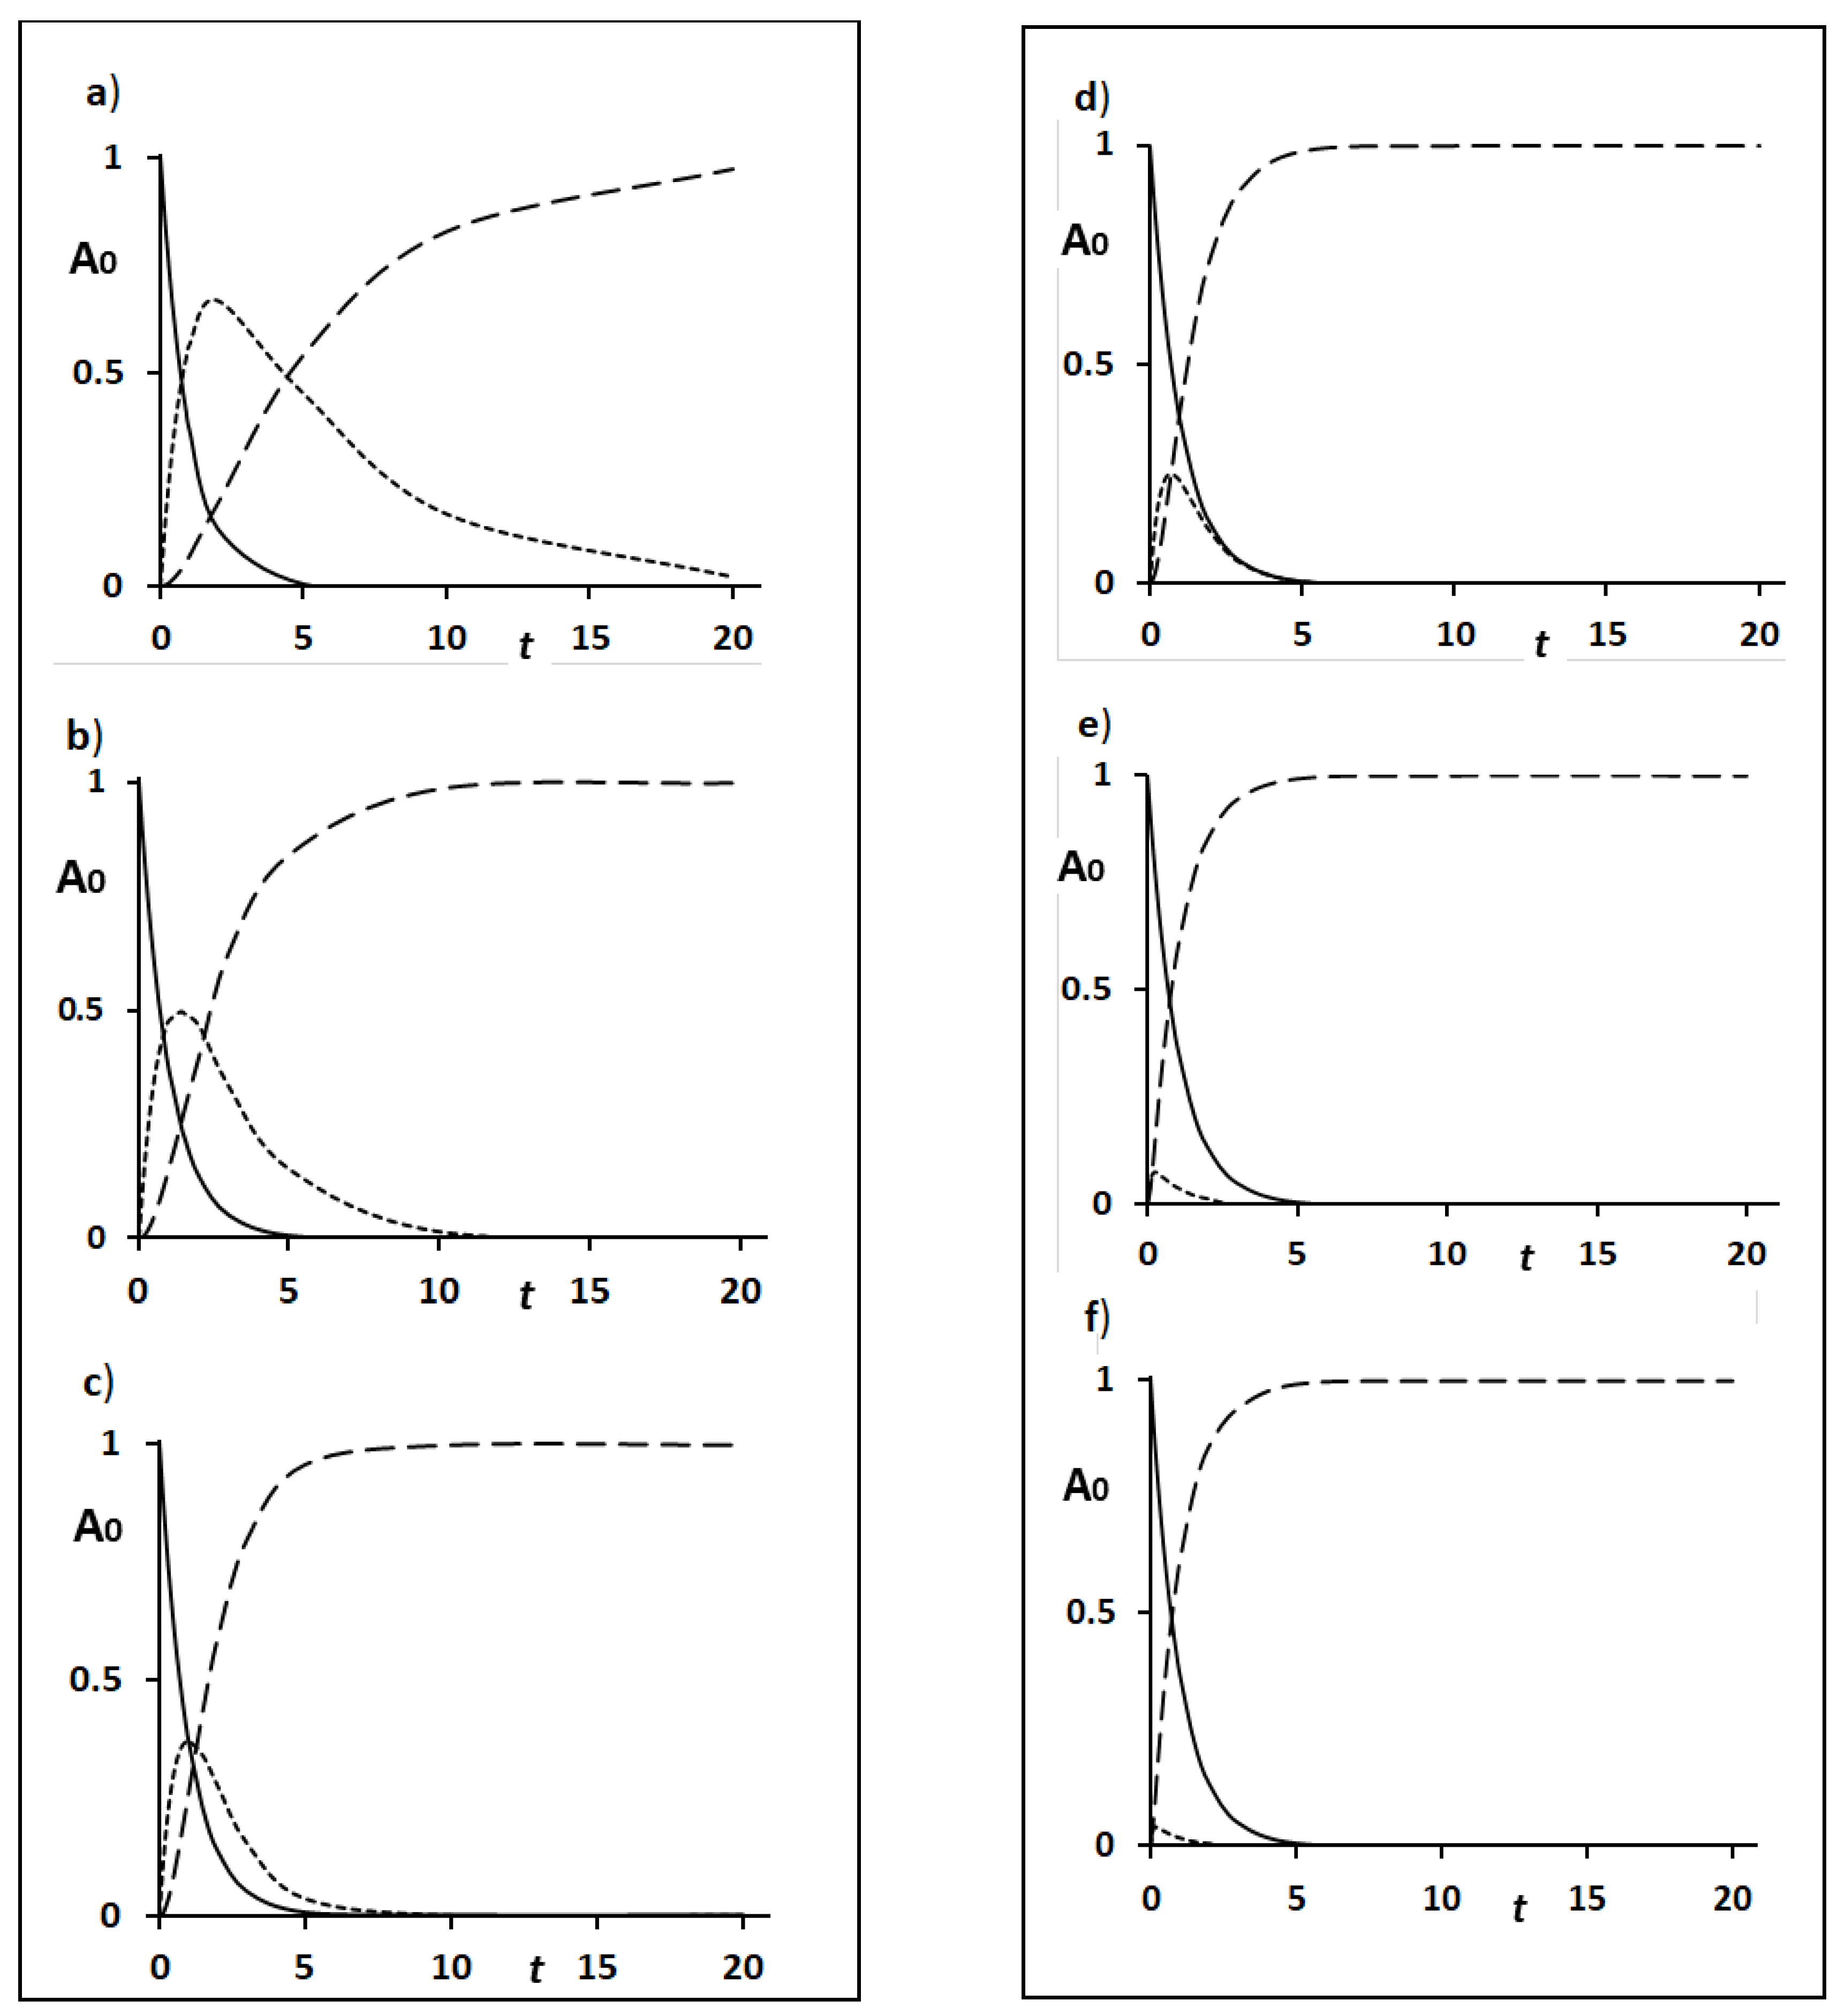
Figure 3.
Simulated patterns of the plots of [B] vs. t only at k2/k1 values of 0.1, 0.2, 0.5, 1.0, 2.0, 5.0, 10.0 and 20.0. b) Plot of [Bmax] vs. k2/k1.
Figure 3.
Simulated patterns of the plots of [B] vs. t only at k2/k1 values of 0.1, 0.2, 0.5, 1.0, 2.0, 5.0, 10.0 and 20.0. b) Plot of [Bmax] vs. k2/k1.
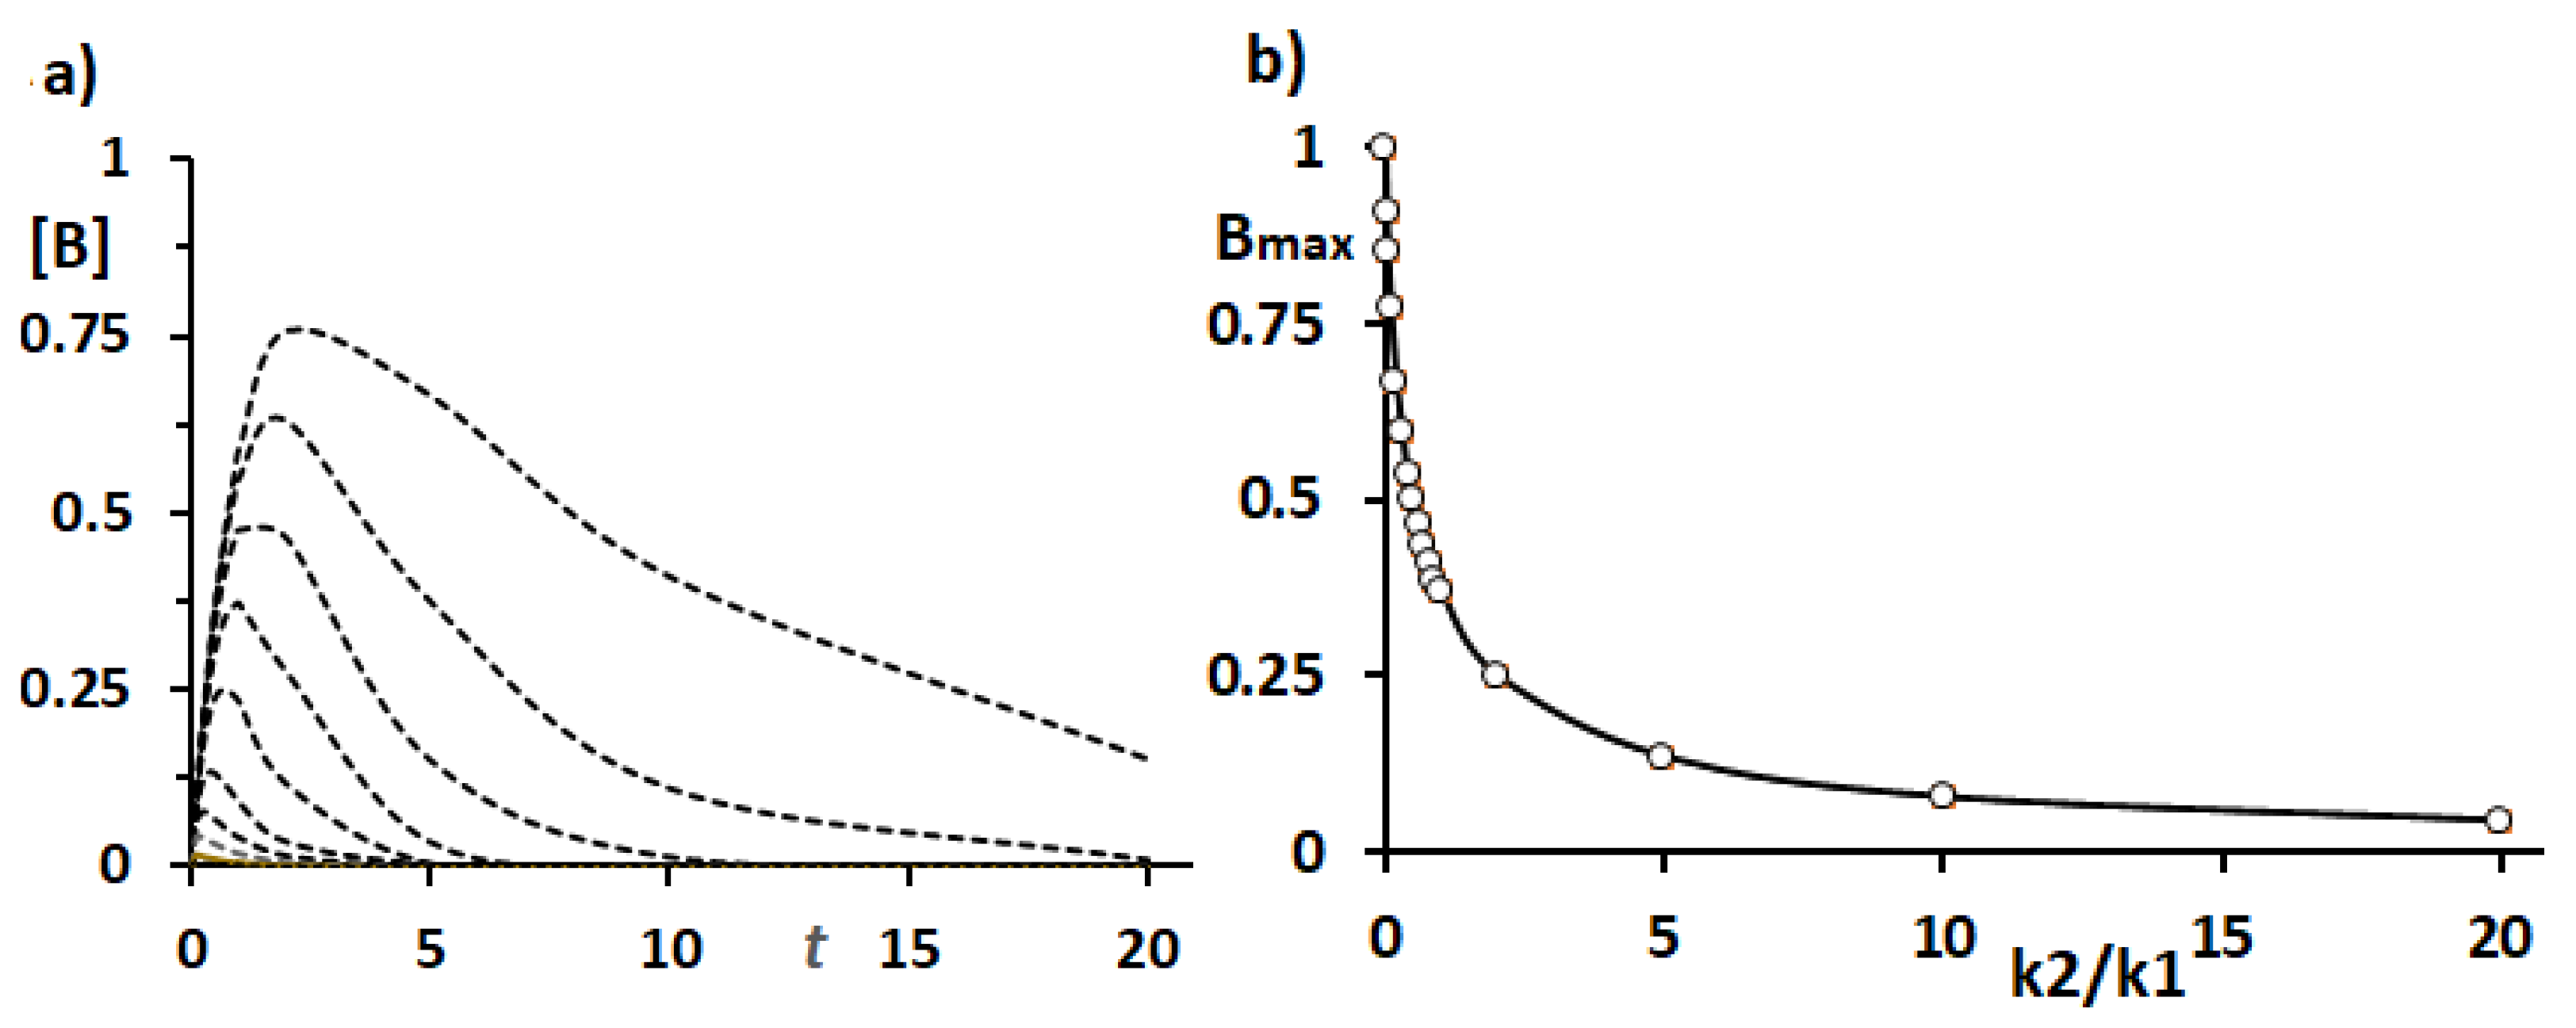
Figure 4.
Simulation of the plot of [Bmax] vs. Damage (%). The simulations were performed at k2/k1= 5 (·····), 10 (---), 20 (——) and 50 ( ).
).
).
Figure 4.
Simulation of the plot of [Bmax] vs. Damage (%). The simulations were performed at k2/k1= 5 (·····), 10 (---), 20 (——) and 50 ().
).
Disclaimer/Publisher’s Note: The statements, opinions and data contained in all publications are solely those of the individual author(s) and contributor(s) and not of MDPI and/or the editor(s). MDPI and/or the editor(s) disclaim responsibility for any injury to people or property resulting from any ideas, methods, instructions or products referred to in the content. |
© 2025 by the authors. Licensee MDPI, Basel, Switzerland. This article is an open access article distributed under the terms and conditions of the Creative Commons Attribution (CC BY) license (https://creativecommons.org/licenses/by/4.0/).
Copyright: This open access article is published under a Creative Commons CC BY 4.0 license, which permit the free download, distribution, and reuse, provided that the author and preprint are cited in any reuse.


