Submitted:
14 May 2025
Posted:
15 May 2025
You are already at the latest version
Abstract
Continuous monitoring of glucose dynamics during sleep is critical for early detection of asymptomatic hypoglycemia and other metabolic risks. In this study, we aimed to characterize the physiological responses associated with interstitial fluid glucose (ISFG) fluctuations during sleep by performing multimodal time-series analyses of heart rate (HR), peripheral oxygen saturation (SpO₂), and motion signals. 5 healthy participants (1 female) simultaneously wore a minimally invasive ISFG sensor and a ring-type sensor that recorded HR, SpO₂, and actigraphy. Throughout the sleep period (00:00–06:00), ISFG levels decreased in four out of five participants. Subsequently, in participants 1, 3, 4, and 5, ISFG increased between 12:00–15:00 and then gradually declined again towards the night. Paired t-tests comparing ISFG levels between 0–3 h and 3–6 h showed a significant decrease during the later half of the night (n=5, p=0.01). Regarding SpO₂, four participants exhibited a mild decrease between 3:00–4:00 after sleep onset, while one dataset was incomplete. Our findings suggest that ISFG reduction during sleep is associated with subtle changes in oxygen saturation patterns. These multimodal signal patterns could serve as potential new indicators for detecting unrecognized nocturnal hypoglycemia. Furthermore, the integration of low-invasive continuous monitoring technologies may enhance online consultations and remote medical services by providing real-time physiological risk assessments during sleep. Future studies with larger cohorts are warranted to validate these promising applications.
Keywords:
interstitial fluid glucose (ISFG)
; sleep physiology
; multimodal signal analysis
; heart rate variability
; nocturnal hypoglycemia detection
; telemedicine
1. Introduction
Glucose homeostasis is essential for maintaining overall physiological stability, especially during sleep when external inputs are minimized, and intrinsic regulatory mechanisms predominate. Dysregulation of glucose levels during sleep can lead to serious health consequences, including unrecognized nocturnal hypoglycemia, which poses risks particularly for individuals with diabetes or other metabolic disorders. Early detection and continuous monitoring of glucose fluctuations during sleep are therefore critical to preventing adverse outcomes and enabling timely medical interventions [1-8]. Recent advancements in wearable technology have enabled non-invasive or minimally invasive monitoring of various physiological parameters, such as heart rate (HR), peripheral oxygen saturation (SpO₂), physical activity, and interstitial fluid glucose (ISFG) [9-11]. Multimodal monitoring offers a unique opportunity to explore the complex interactions between metabolic and autonomic processes during sleep. Despite growing interest, limited research has focused on how ISFG fluctuations correlate with other physiological signals during sleep in healthy individuals. Understanding these patterns may provide new insights into early risk detection and contribute to the development of preventive strategies.
Heart rate variability (HRV) and SpO₂ have been extensively studied in sleep medicine [12-19]. Changes in autonomic tone, reflected in HRV, and respiratory stability, inferred from SpO₂ fluctuations, are known to be influenced by metabolic states [20-26]. For instance, hypoglycemia has been associated with sympathetic nervous system activation, which may manifest as alterations in HR and HRV [27-33]. Similarly, decreased glucose availability may impact respiratory patterns, potentially affecting SpO₂ levels. However, direct evidence linking ISFG variations with simultaneous multimodal physiological signals during sleep remains scarce. To address this gap, we conducted a pilot study involving five healthy participants, utilizing a minimally invasive ISFG sensor combined with a ring-type wearable device capable of continuously recording HR, SpO₂, and motion signals. Our aim was to characterize how ISFG changes during sleep and to investigate corresponding physiological patterns, focusing particularly on SpO₂ and HR dynamics. By analyzing time-series data across the sleep period, we sought to identify signatures that could serve as new markers for detecting nocturnal metabolic disturbances, even before clinical symptoms become apparent.
2. Materials and Methods
2.1. Participants
5 healthy volunteers (1 female, age 55 ± 10 years) were recruited for this study. All participants reported no history of metabolic, cardiovascular, or sleep disorders and were not taking any medications that could affect glucose metabolism or autonomic function. Exclusion criteria included any history of chronic illness, use of medications or supplements that could influence glucose metabolism, autonomic nervous system function, or sleep quality, as well as shift work, smoking, or excessive alcohol consumption. Written informed consent was obtained from all participants prior to enrollment. The study protocol was approved by the institutional ethics committee (Ethics Committee of Graduate School of Engineering, Mie University, Approval number 132, Approval date February 19, 2025, and Nagoya City University Hospital Ethics Review Committee Approval Number 60-18-0211, Approval Date March 22, 2019) and was conducted in accordance with the Declaration of Helsinki.
2.2. Sensors and Data Acquisition
Participants simultaneously wore two types of sensors during the monitoring period. Interstitial Fluid Glucose (ISFG) Monitoring; a minimally invasive ISFG sensor (Abbott, Libre, USA) was attached to the upper arm [34-37]. The sensor continuously recorded glucose concentrations at 15-minute intervals, measurement period was 2 weeks (14 days). ISFG levels closely reflect blood glucose concentrations, with a typical lag time of approximately 5 to 15 minutes due to the diffusion process between blood and interstitial compartments. Numerous studies have validated the strong correlation between ISFG and capillary blood glucose, supporting the clinical utility of continuous ISFG monitoring in both diabetic and non-diabetic populations. The ISFG sensor used in this study is minimally invasive, involving a small filament inserted just beneath the skin, which allows for continuous, real-time glucose monitoring without the need for frequent finger-prick blood sampling. Participants reported no discomfort or skin irritation during the 14-day monitoring period. The device was lightweight and securely adhered to the upper arm, enabling normal daily activities, including sleep, exercise, and bathing (when appropriately covered), without disruption. The unobtrusive design of the sensor made it suitable for long-term use, facilitating reliable glucose trend tracking across various physiological states, such as during sleep, rest, or activity. This non-intrusive nature supports its integration into multimodal physiological studies and offers a practical tool for investigating metabolic dynamics in naturalistic settings.
Physiological Signal Monitoring; a ring-type wearable device (Sanei Medisys, CheckMeRing, Kyoto, Japan, Medical device certification number: 304AABZX00029000) was used to record heart rate (HR), peripheral oxygen saturation (SpO₂), and motion (actigraphy) at a sampling rate of 0.25 Hz. In this study, a ring-shaped silicon sensor was used to HR and SpO₂ during sleep. The sensor was comfortably worn on either the thumb or index finger of the non-dominant hand, based on participant preference and optimal signal quality. The device, made from soft and flexible medical-grade silicone, was lightweight and caused no discomfort or interference with natural hand movement or sleep posture. In pre-measurement, participants reported no irritation or awareness of the device during use. This design allowed for continuous, unobtrusive monitoring of physiological parameters throughout the night, enhancing the ecological validity of the measurements. The device was connected to the Check Me app on a smartphone via Bluetooth 4.0 BLE, and CSV data was extracted. The measurement ranges were SpO2: 70%-99%, Pulse: 30bpm-250bpm, and the measurement accuracy was SpO2: 80-99%, ±2%, 70-79%, ±3%, Pulse: 30bpm-250bpm±2bpm or 30bpm-250bpm±2%, whichever was greater.
Data collection was performed over a sleep period (from bedtime to waking up), focusing particularly on the nighttime sleep interval from 00:00 to 06:00. Participants were instructed to maintain their usual sleep habits and avoid alcohol or intense physical activity on the day of measurement.
Figure 1.
Continuous monitoring of interstitial fluid glucose levels
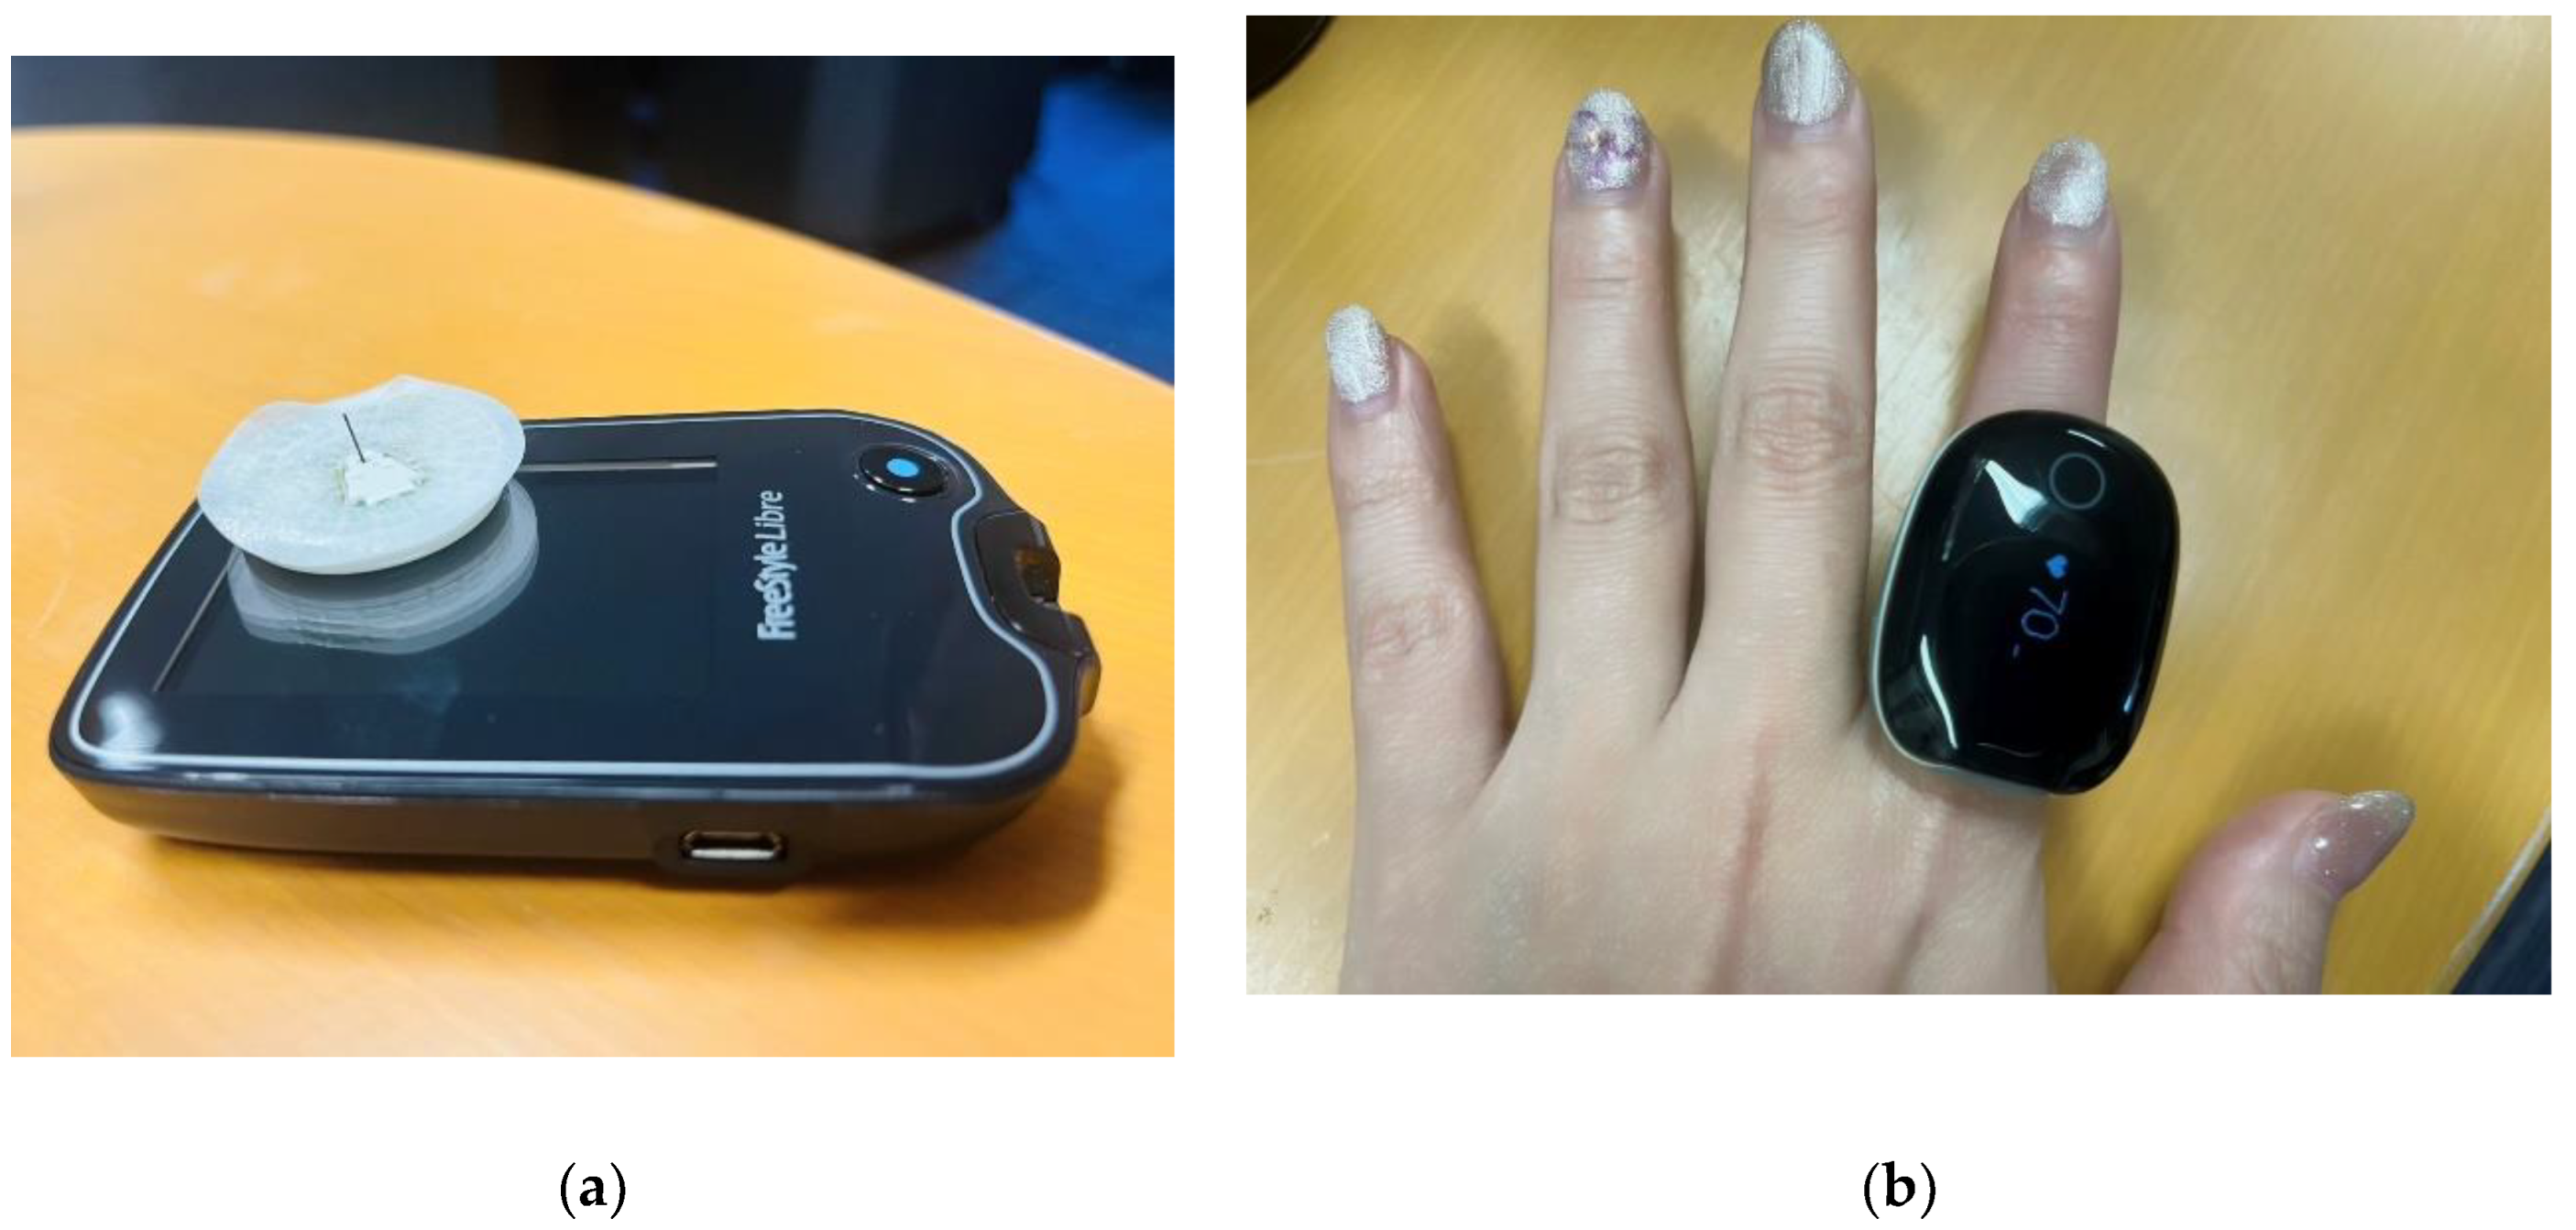
Figure (a) shows a sensor used to measure glucose levels in interstitial fluid. It comes with an ultra-fine filament (needle) that is inserted into the skin during application. This is not designed to puncture the skin or leave the needle in place; instead, it is inserted into the skin’s interstitial spaces to measure glucose concentration in the interstitial fluid. The filament reacts with glucose in the interstitial fluid using an enzyme inside the sensor, and the resulting weak electrical current is measured. The strength of this current is used to calculate blood glucose levels. Since there is no need to prick the fingertip with a needle, this method offers the advantage of reduced pain and discomfort compared to traditional blood glucose meters. Figure (b) shows the measurement using a ring-shaped sensor.
2.3. Data Processing and Analysis
All physiological data were synchronized based on timestamp information. ISFG data were linearly interpolated to generate a continuous time-series matching the 0.25 Hz sampling rate of the ring-type device. HR, SpO2 and motion signals were sampled at 0.25 Hz and were not filtered or smoothed for noise reduction; filtering and smoothing techniques are effective in reducing random noise, but they can obscure transient changes or introduce phase shifts, especially in low-frequency components that are important in the analysis of autonomic nervous system and metabolic dynamics.
The motion signal was used to confirm sleep onset and detect major body movements during sleep. Datasets containing excessive motion artifacts during the sleep period of interest were excluded from further analysis. In this study, a resultant acceleration was calculated from the 3-axis accelerometer built into the ring sensor using the following formula:
x, y, and z are the accelerations in each axis direction (units are g). amag is the magnitude of acceleration.
The above formula mainly distinguishes between changes in the magnitude of acceleration (dynamic or static). The classification of body position itself is usually determined from the direction of the acceleration vector (tilt angle) based on the direction of gravity (static acceleration). When estimating body position from three-axis body acceleration (x, y, z), it is generally classified into six types of body positions: standing, sitting, supine, prone, right lateral recumbent, and left lateral recumbent. In this study, we determined the lying position using the tilt angle (angle of inclination), a typical index that can be used to determine lying position. When the Z axis is vertical, it can be expressed by the following formula.
This angle θ (= how much the body is tilted from the vertical) can be used to roughly classify the positions.
θ ≈ 0°: Standing
θ ≈ 90°: Supine or prone or lateral (lying down)
The classification of the positions (supine/prone/lateral) can be done based on the deviation of the horizontal components (a_x, a_y).
This resultant acceleration value was used to confirm sleep (or lying down) status.
Mean ISFG levels were calculated for two consecutive time windows: 0–3 hours and 3–6 hours after sleep onset. A paired t-test was performed to compare ISFG between these intervals, with significance set at p < 0.05. Changes in SpO₂ were analyzed by averaging 1-hour segments, and group patterns were visually inspected to identify common trends. Data analyses were conducted using SPSS v28.
3. Results
3.1. Interstitial Fluid Glucose (ISFG) Dynamics During Sleep
3.2. Peripheral Oxygen Saturation (SpO₂) Changes and Heart Rate and Motion Analysis
SpO₂ levels remained relatively stable during the early stages of sleep but began to show a mild downward trend between 3:00 and 4:00 AM in four participants. Specifically, mean SpO₂ values dropped by approximately 1–2% during this window com-pared to earlier sleep phases. One participant’s SpO₂ dataset was incomplete due to device malfunction and was excluded from this part of the analysis(Figure 2 and 3). Heart rate (HR) showed expected nocturnal slowing across participants, with no arrhythmic events or abrupt fluctuations detected during the monitoring period. Minor HR increases were observed corresponding to occasional motion artifacts; however, major body movements were rare during the main sleep intervals (Table 2.).
3.3. Quantitative analysis
Revealed that mean ISFG levels during the 3–6 h window were significantly lower than those during the 0–3 h window. A paired t-test confirmed this decrease was statistically significant (p = 0.01, n = 5, Figure 5.).
Figure 2.
Diurnal variation calculated from 2 weeks of ISFG. Blue: participant 1, Green: participant 2, Orange: participant 3, Purple: participant 4, Red: participant 5. ISFG is measured as a 3-hour average. During nighttime sleep, ISFG decreased in 4 out of 5 participants from 0:00 to 6:00. After that, ISFG increased in 4 participants (participants 1, 3, 4, and 5) from 12:00 to 15:00 and then gradually decreased throughout the night.
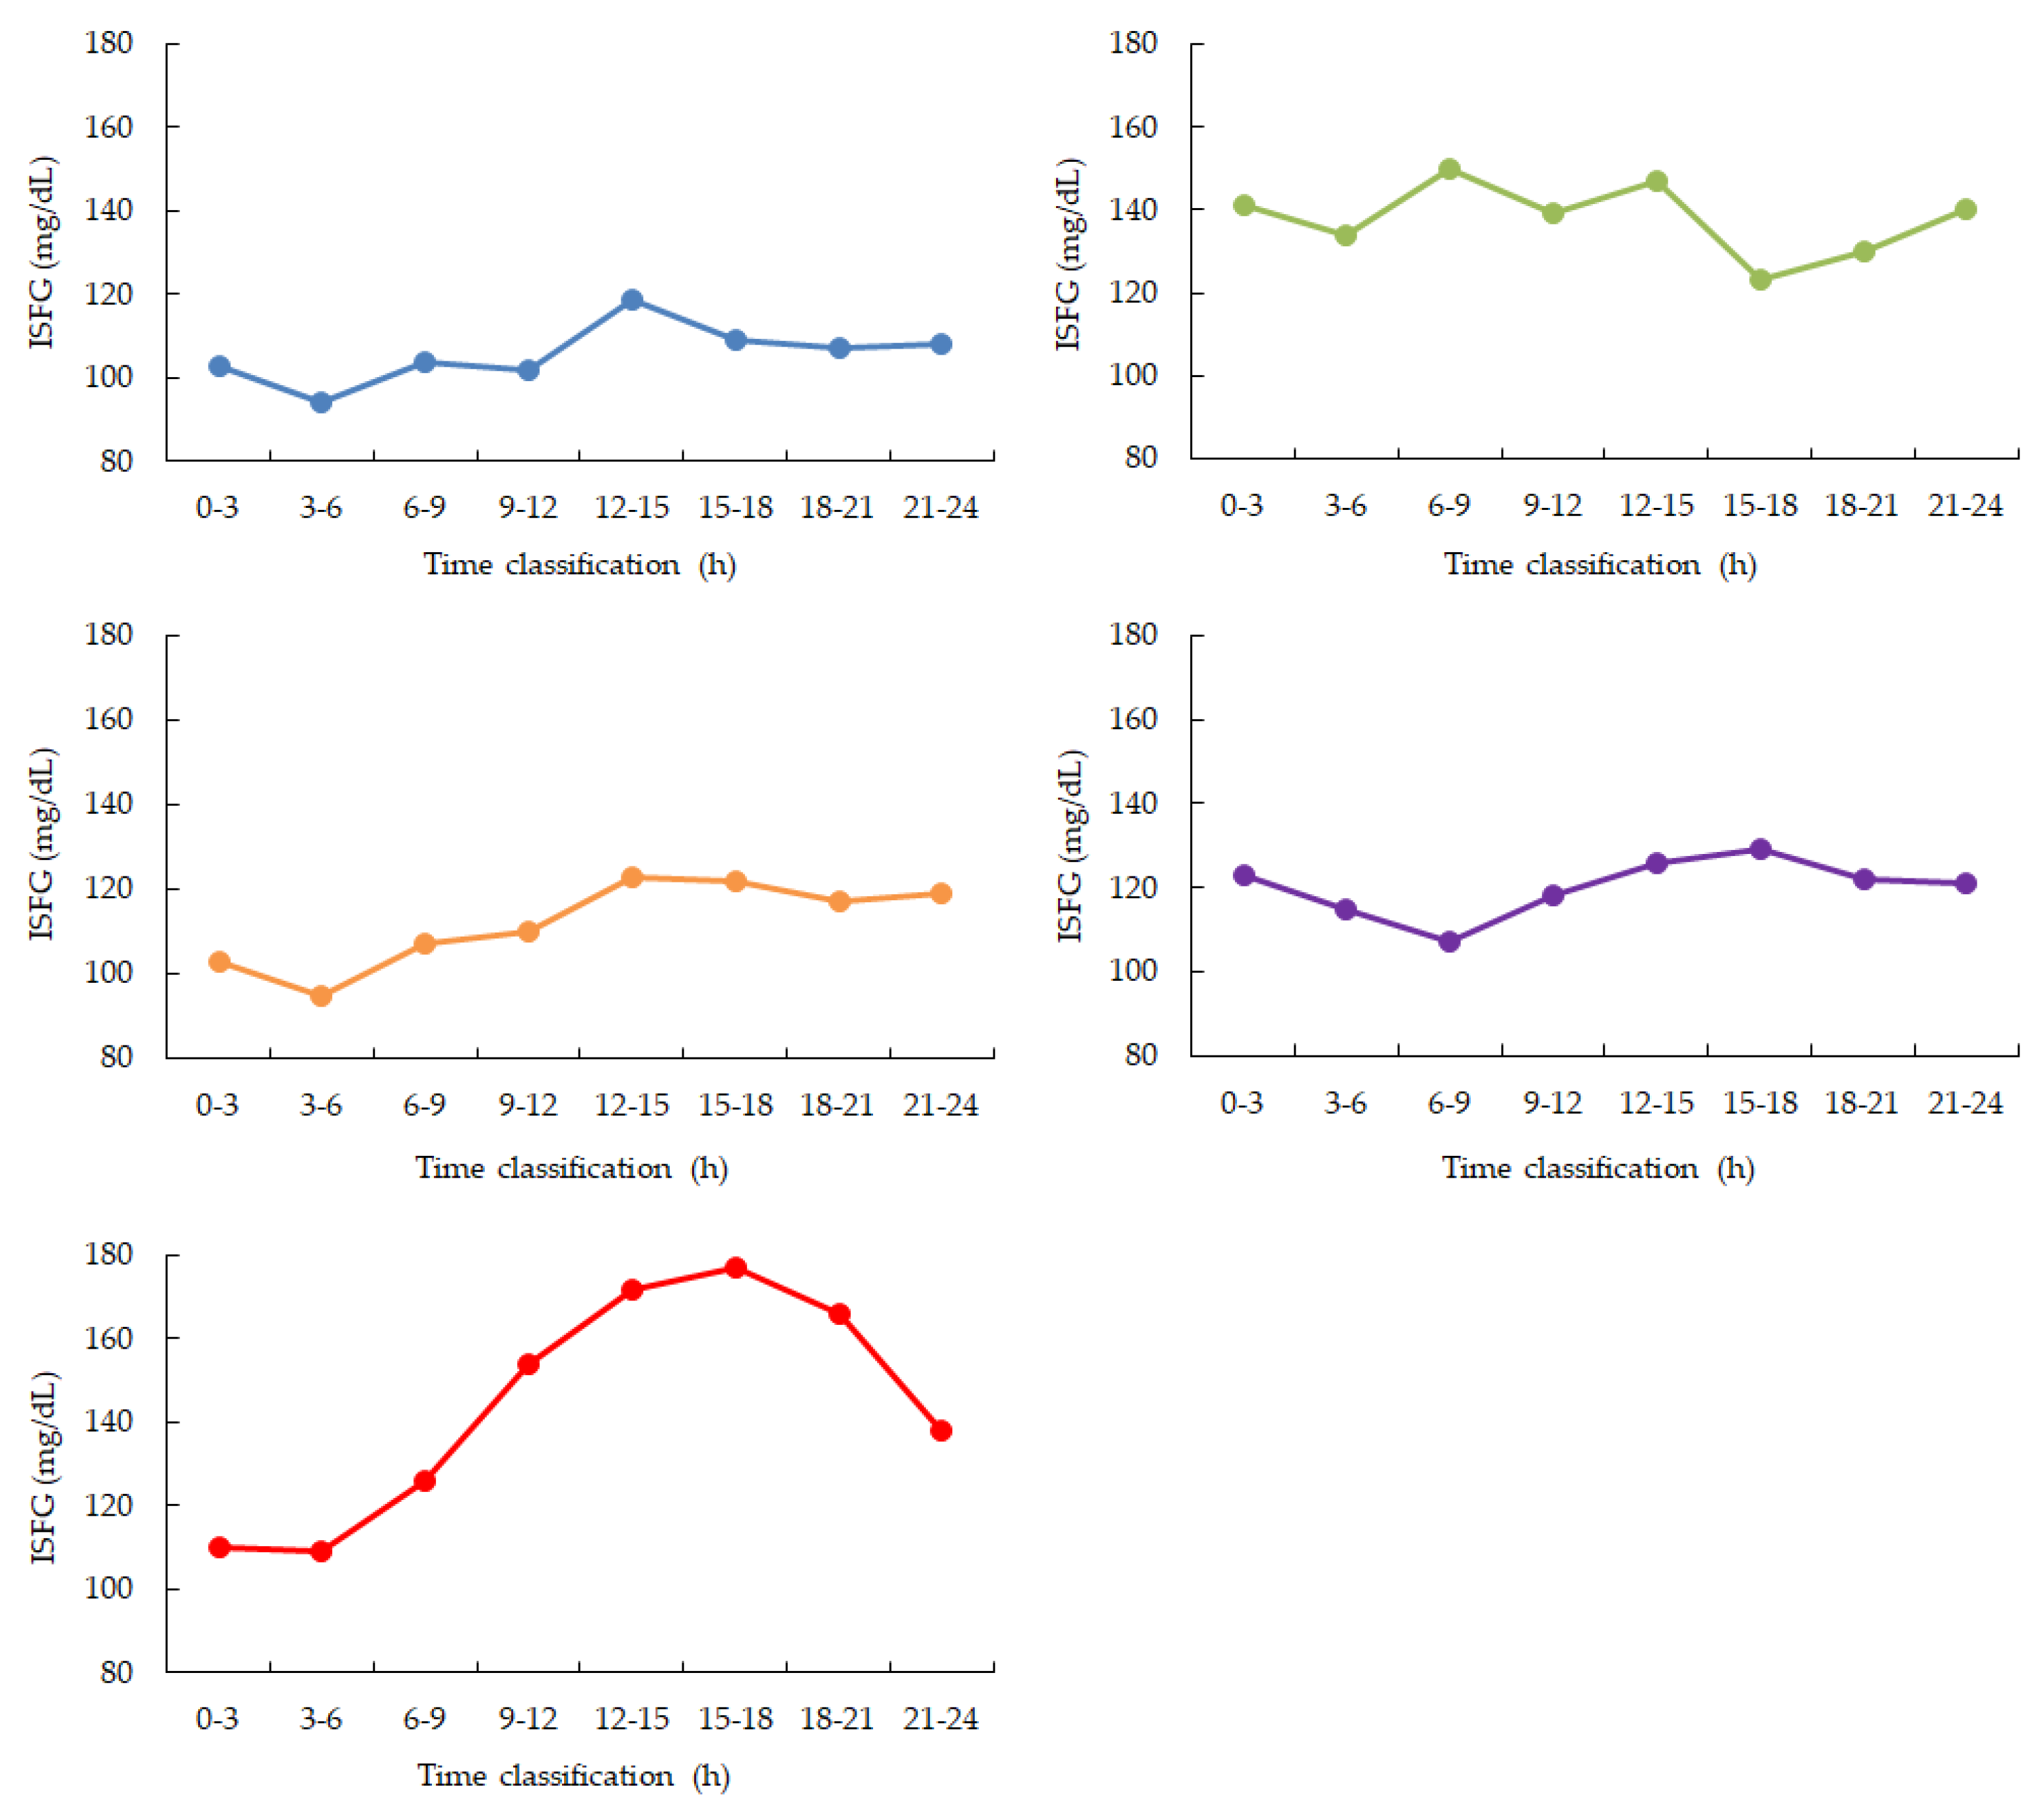
Figure 3.
Changes in average SpO2 over time during nighttime sleep. Blue: participant 1, Green: participant 2, Orange: participant 3, Purple: participant 4. Hourly averages and standard deviations from 0 to 6:00 am. Participants 1, 3, and 4 showed a gradual increase from 3 to 4:00 am. after falling asleep. Participant 2, who had the highest ISFG among participants, showed a rapid decrease from 2 to 3:00 am. after falling asleep, and then recovered. (Data for participant 5 is missing)
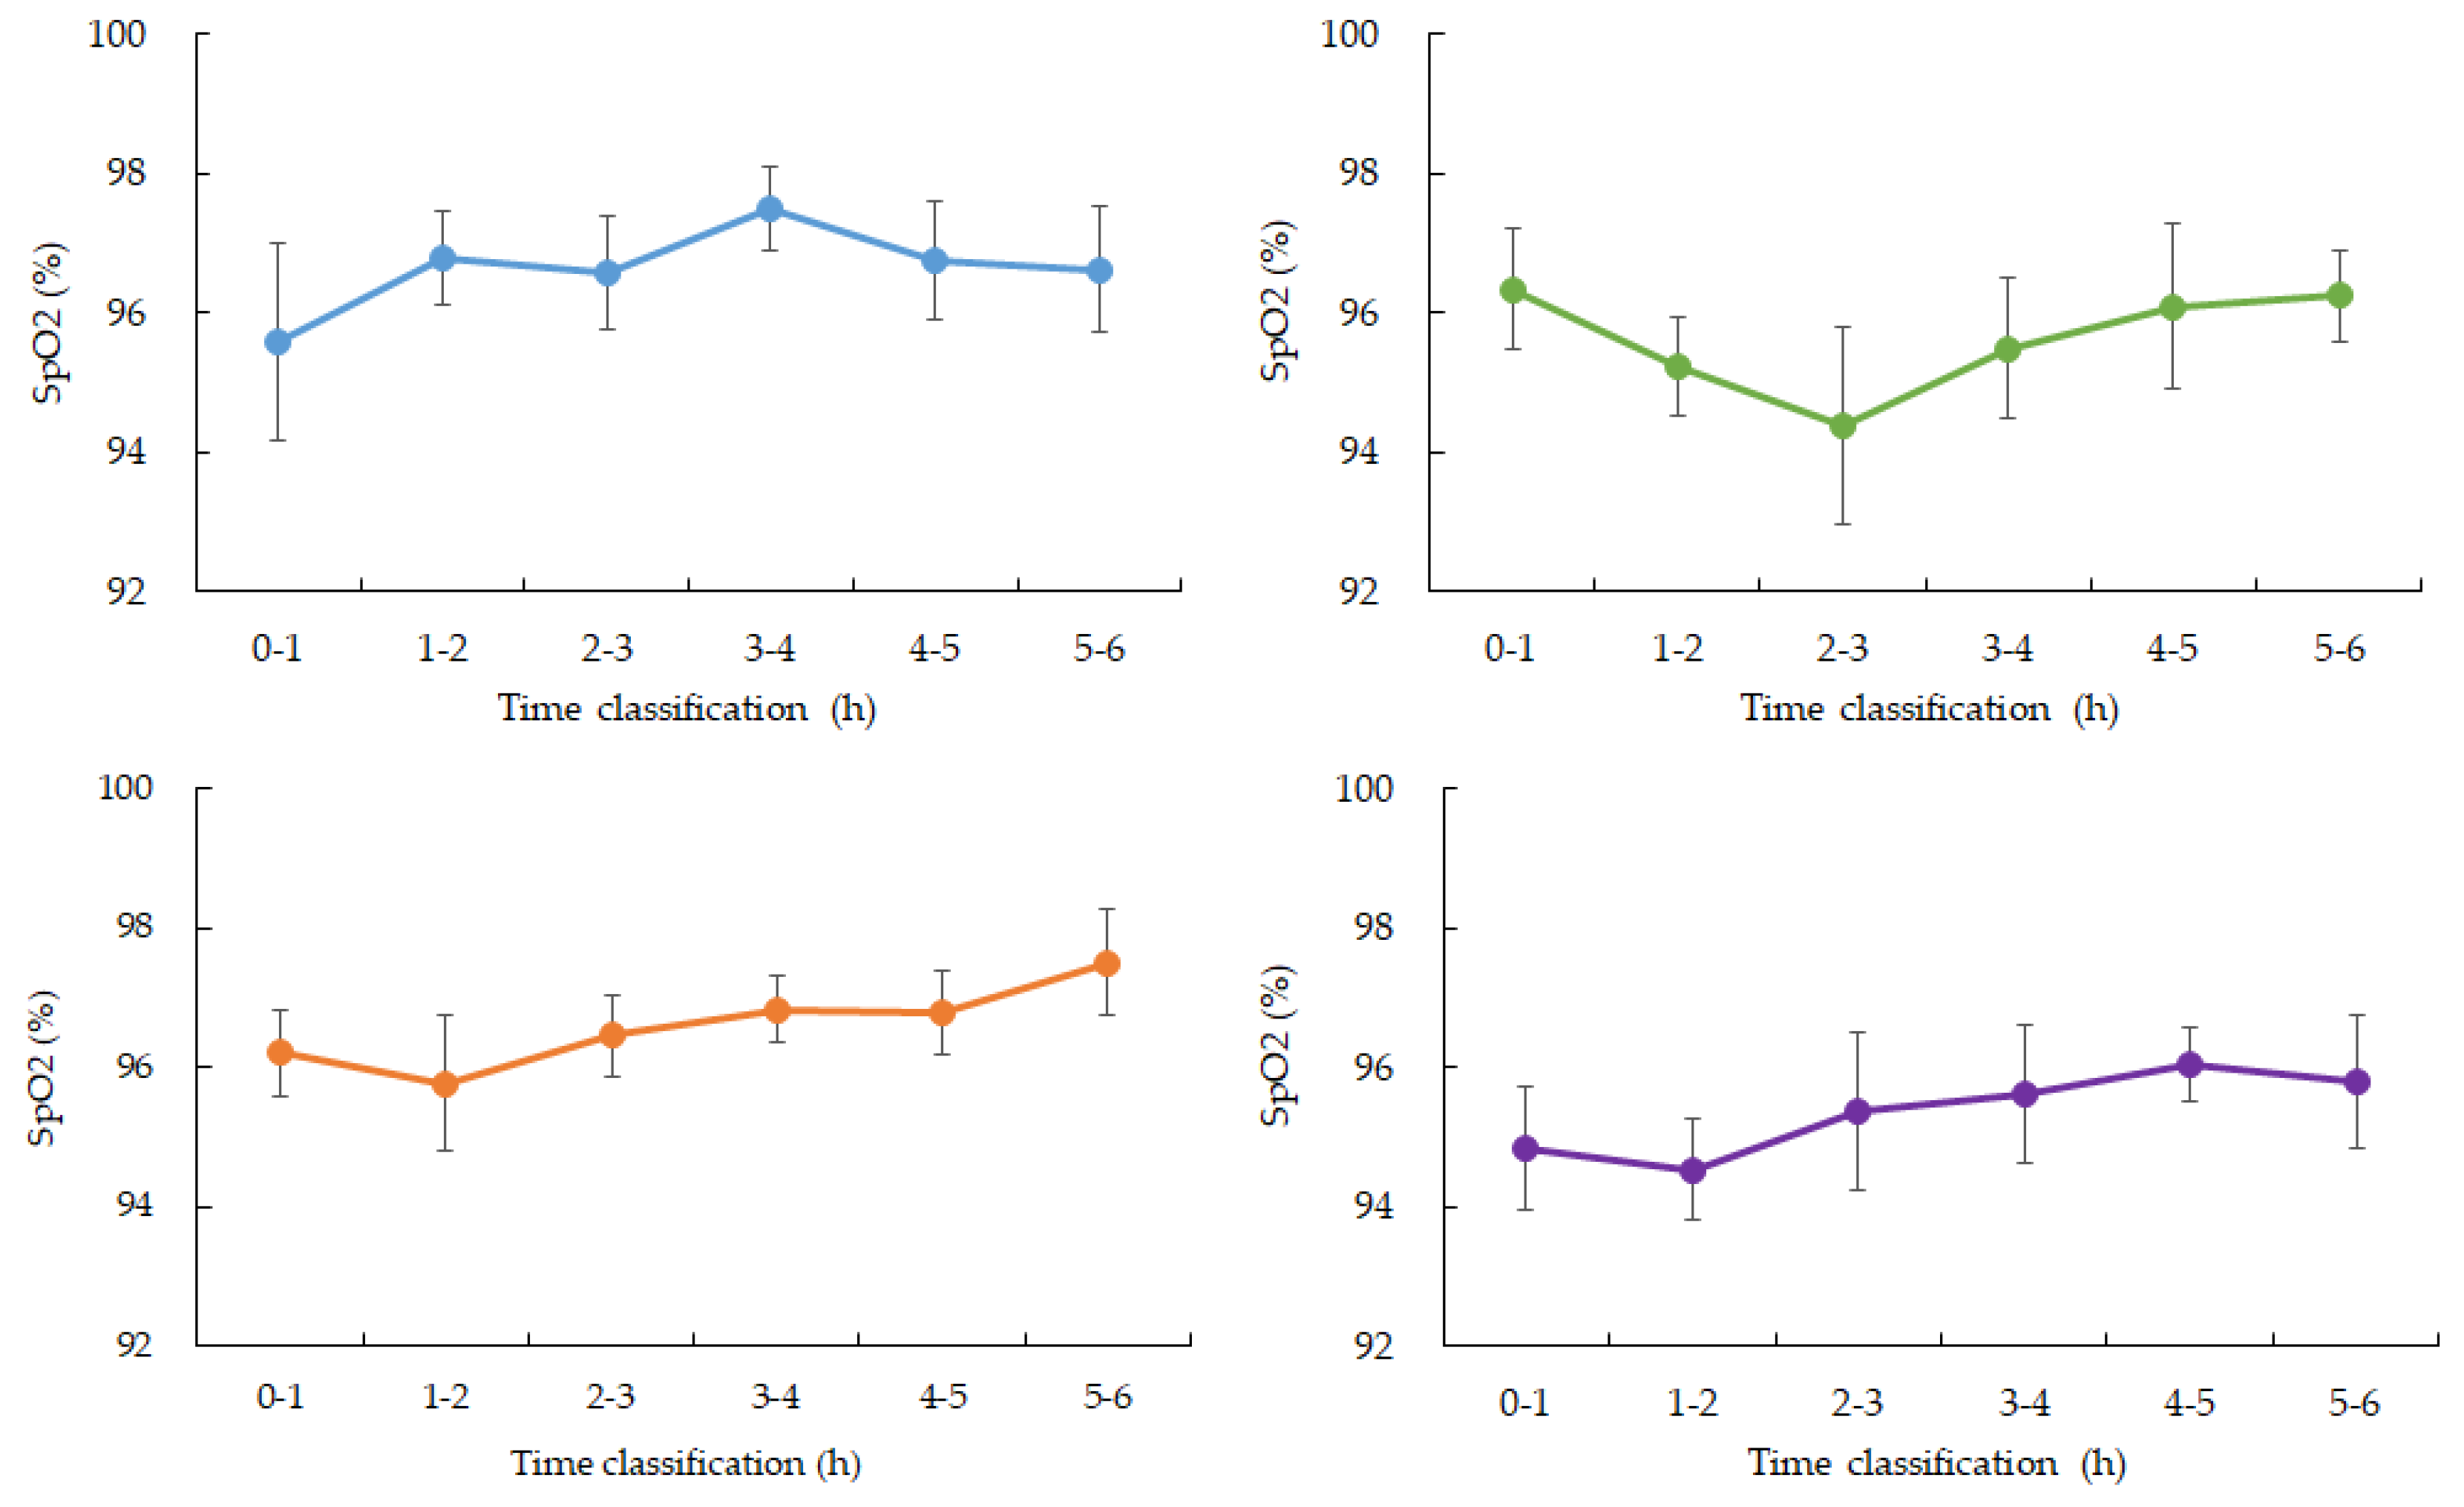
Figure 4.
Changes in average SpO2 over time during nighttime sleep. Blue: participant 1, Green: participant 2, Orange: participant 3, Purple: participant 4. Hourly averages and standard deviations from 0:00 to 6:00. All four participants experienced a gradual decrease from 3:00 to 4:00 after going to bed.
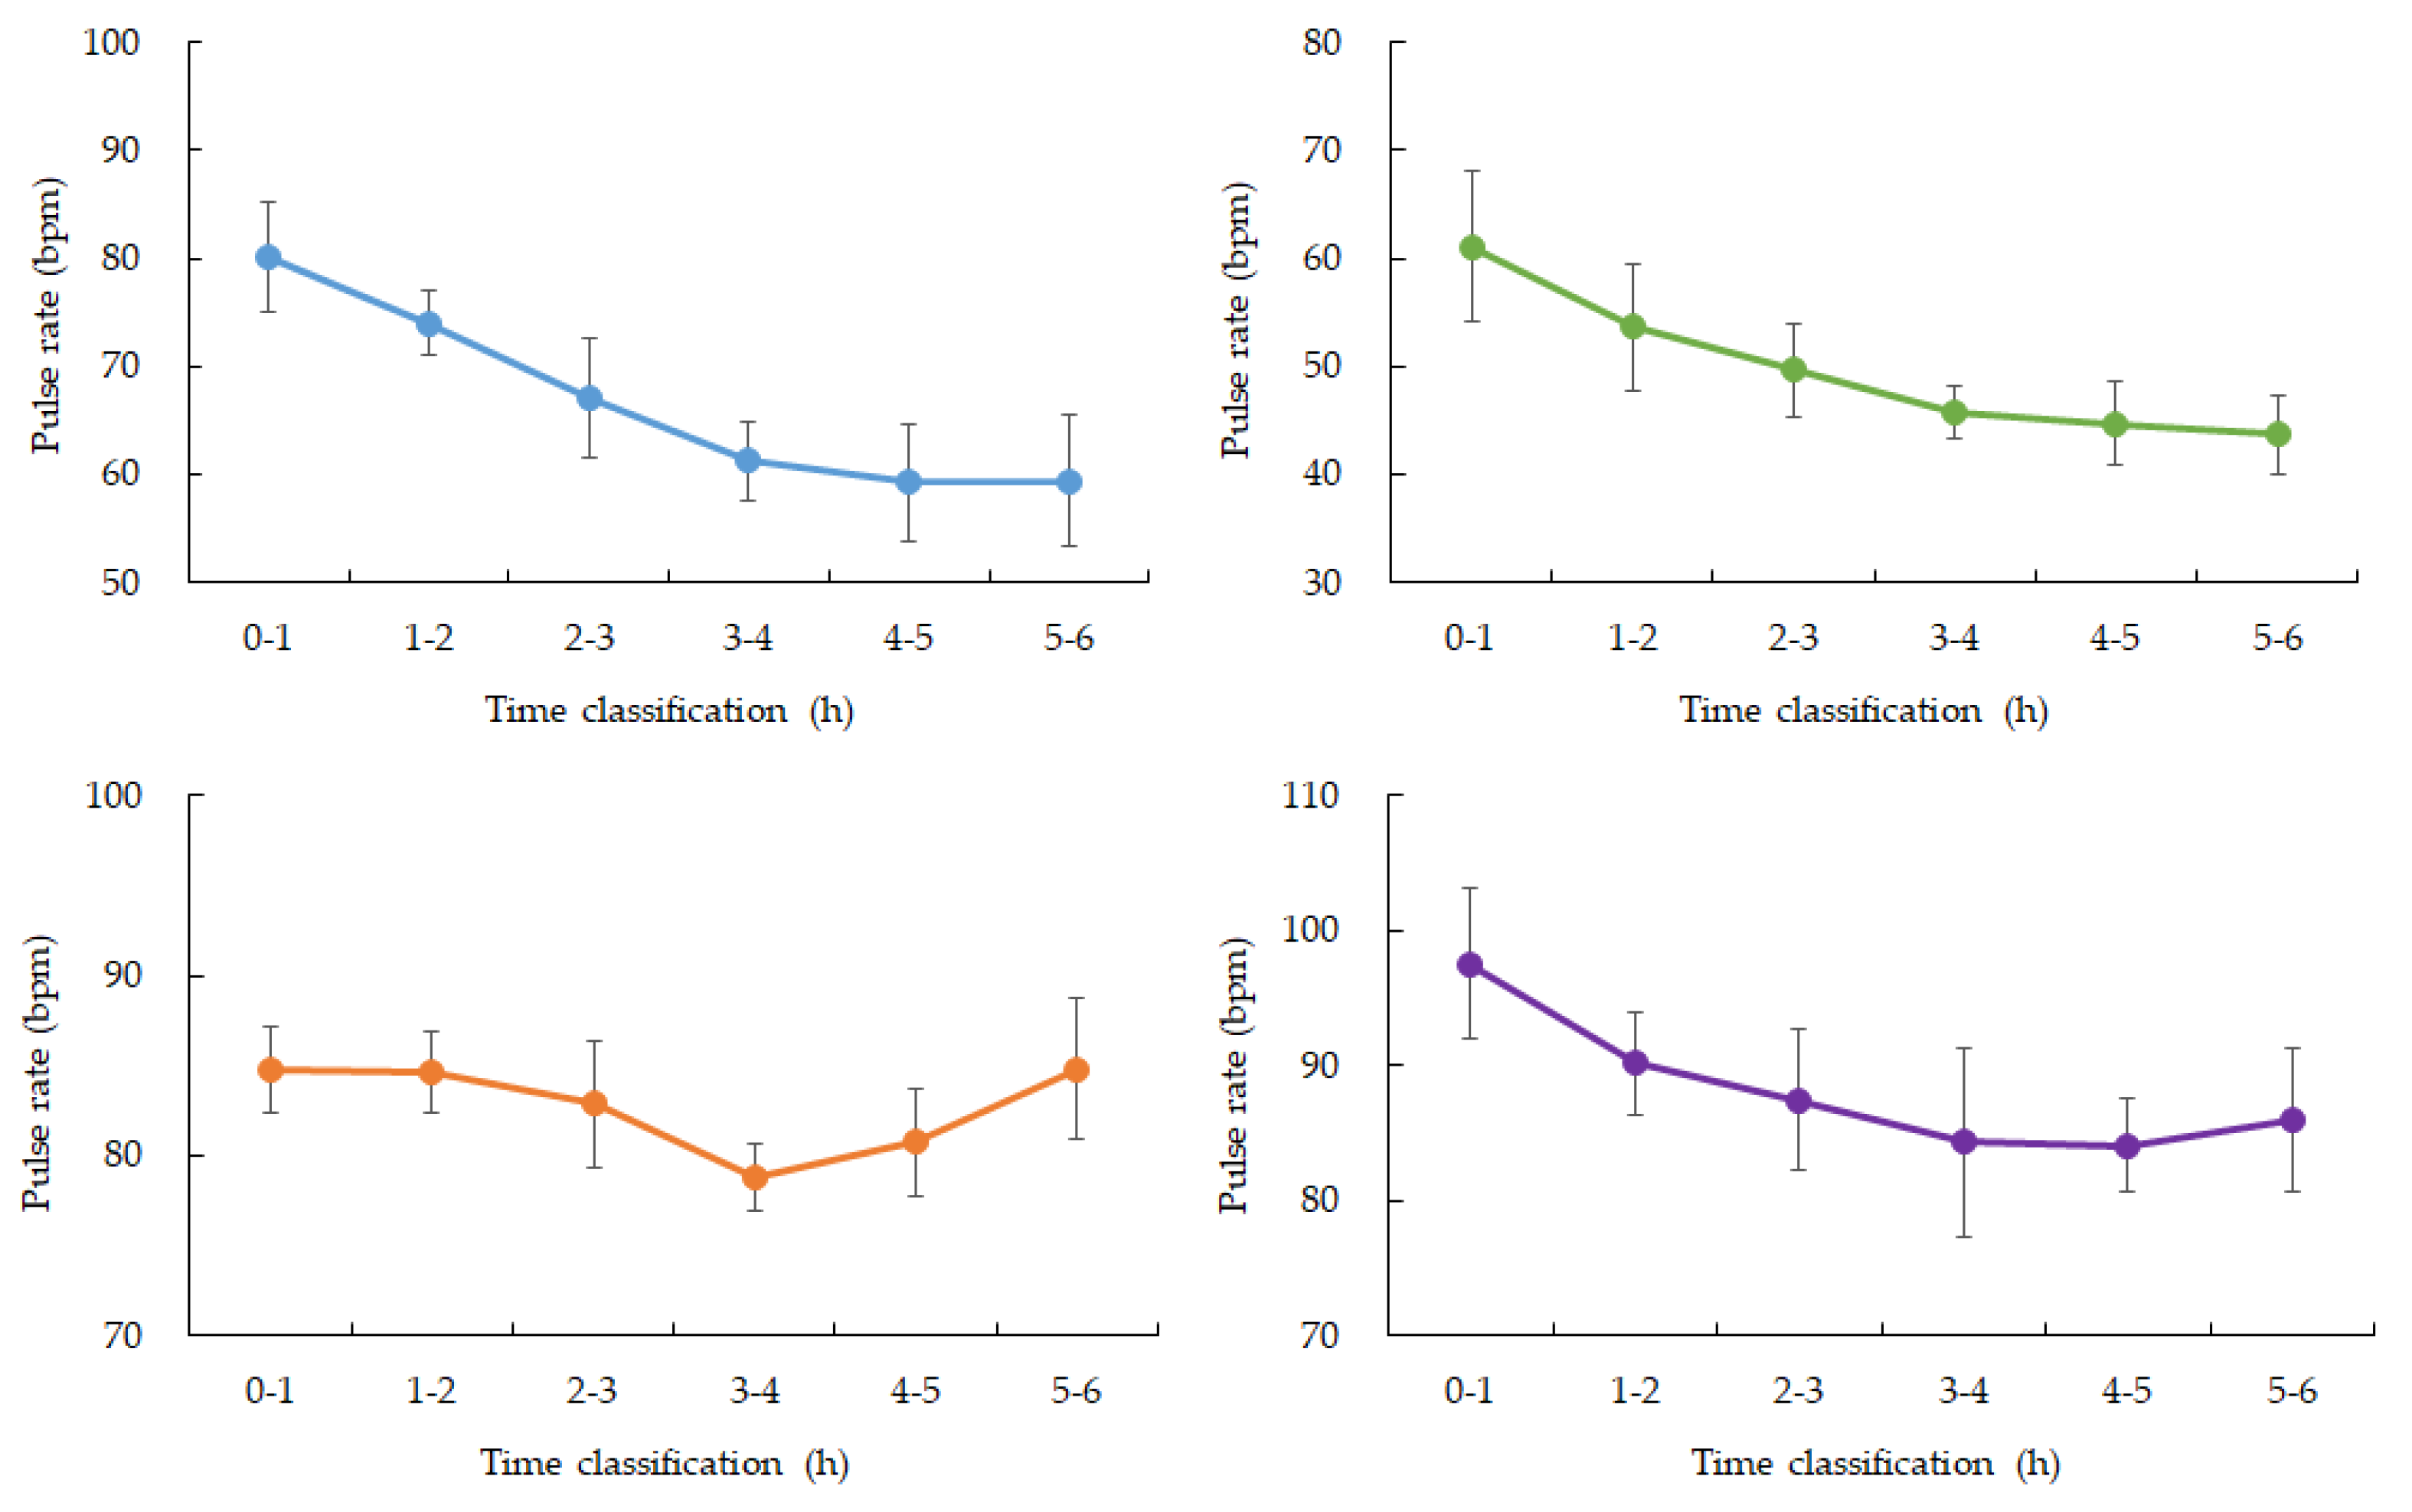
Figure 5.
Test for significant difference in ISFG during nighttime sleep.
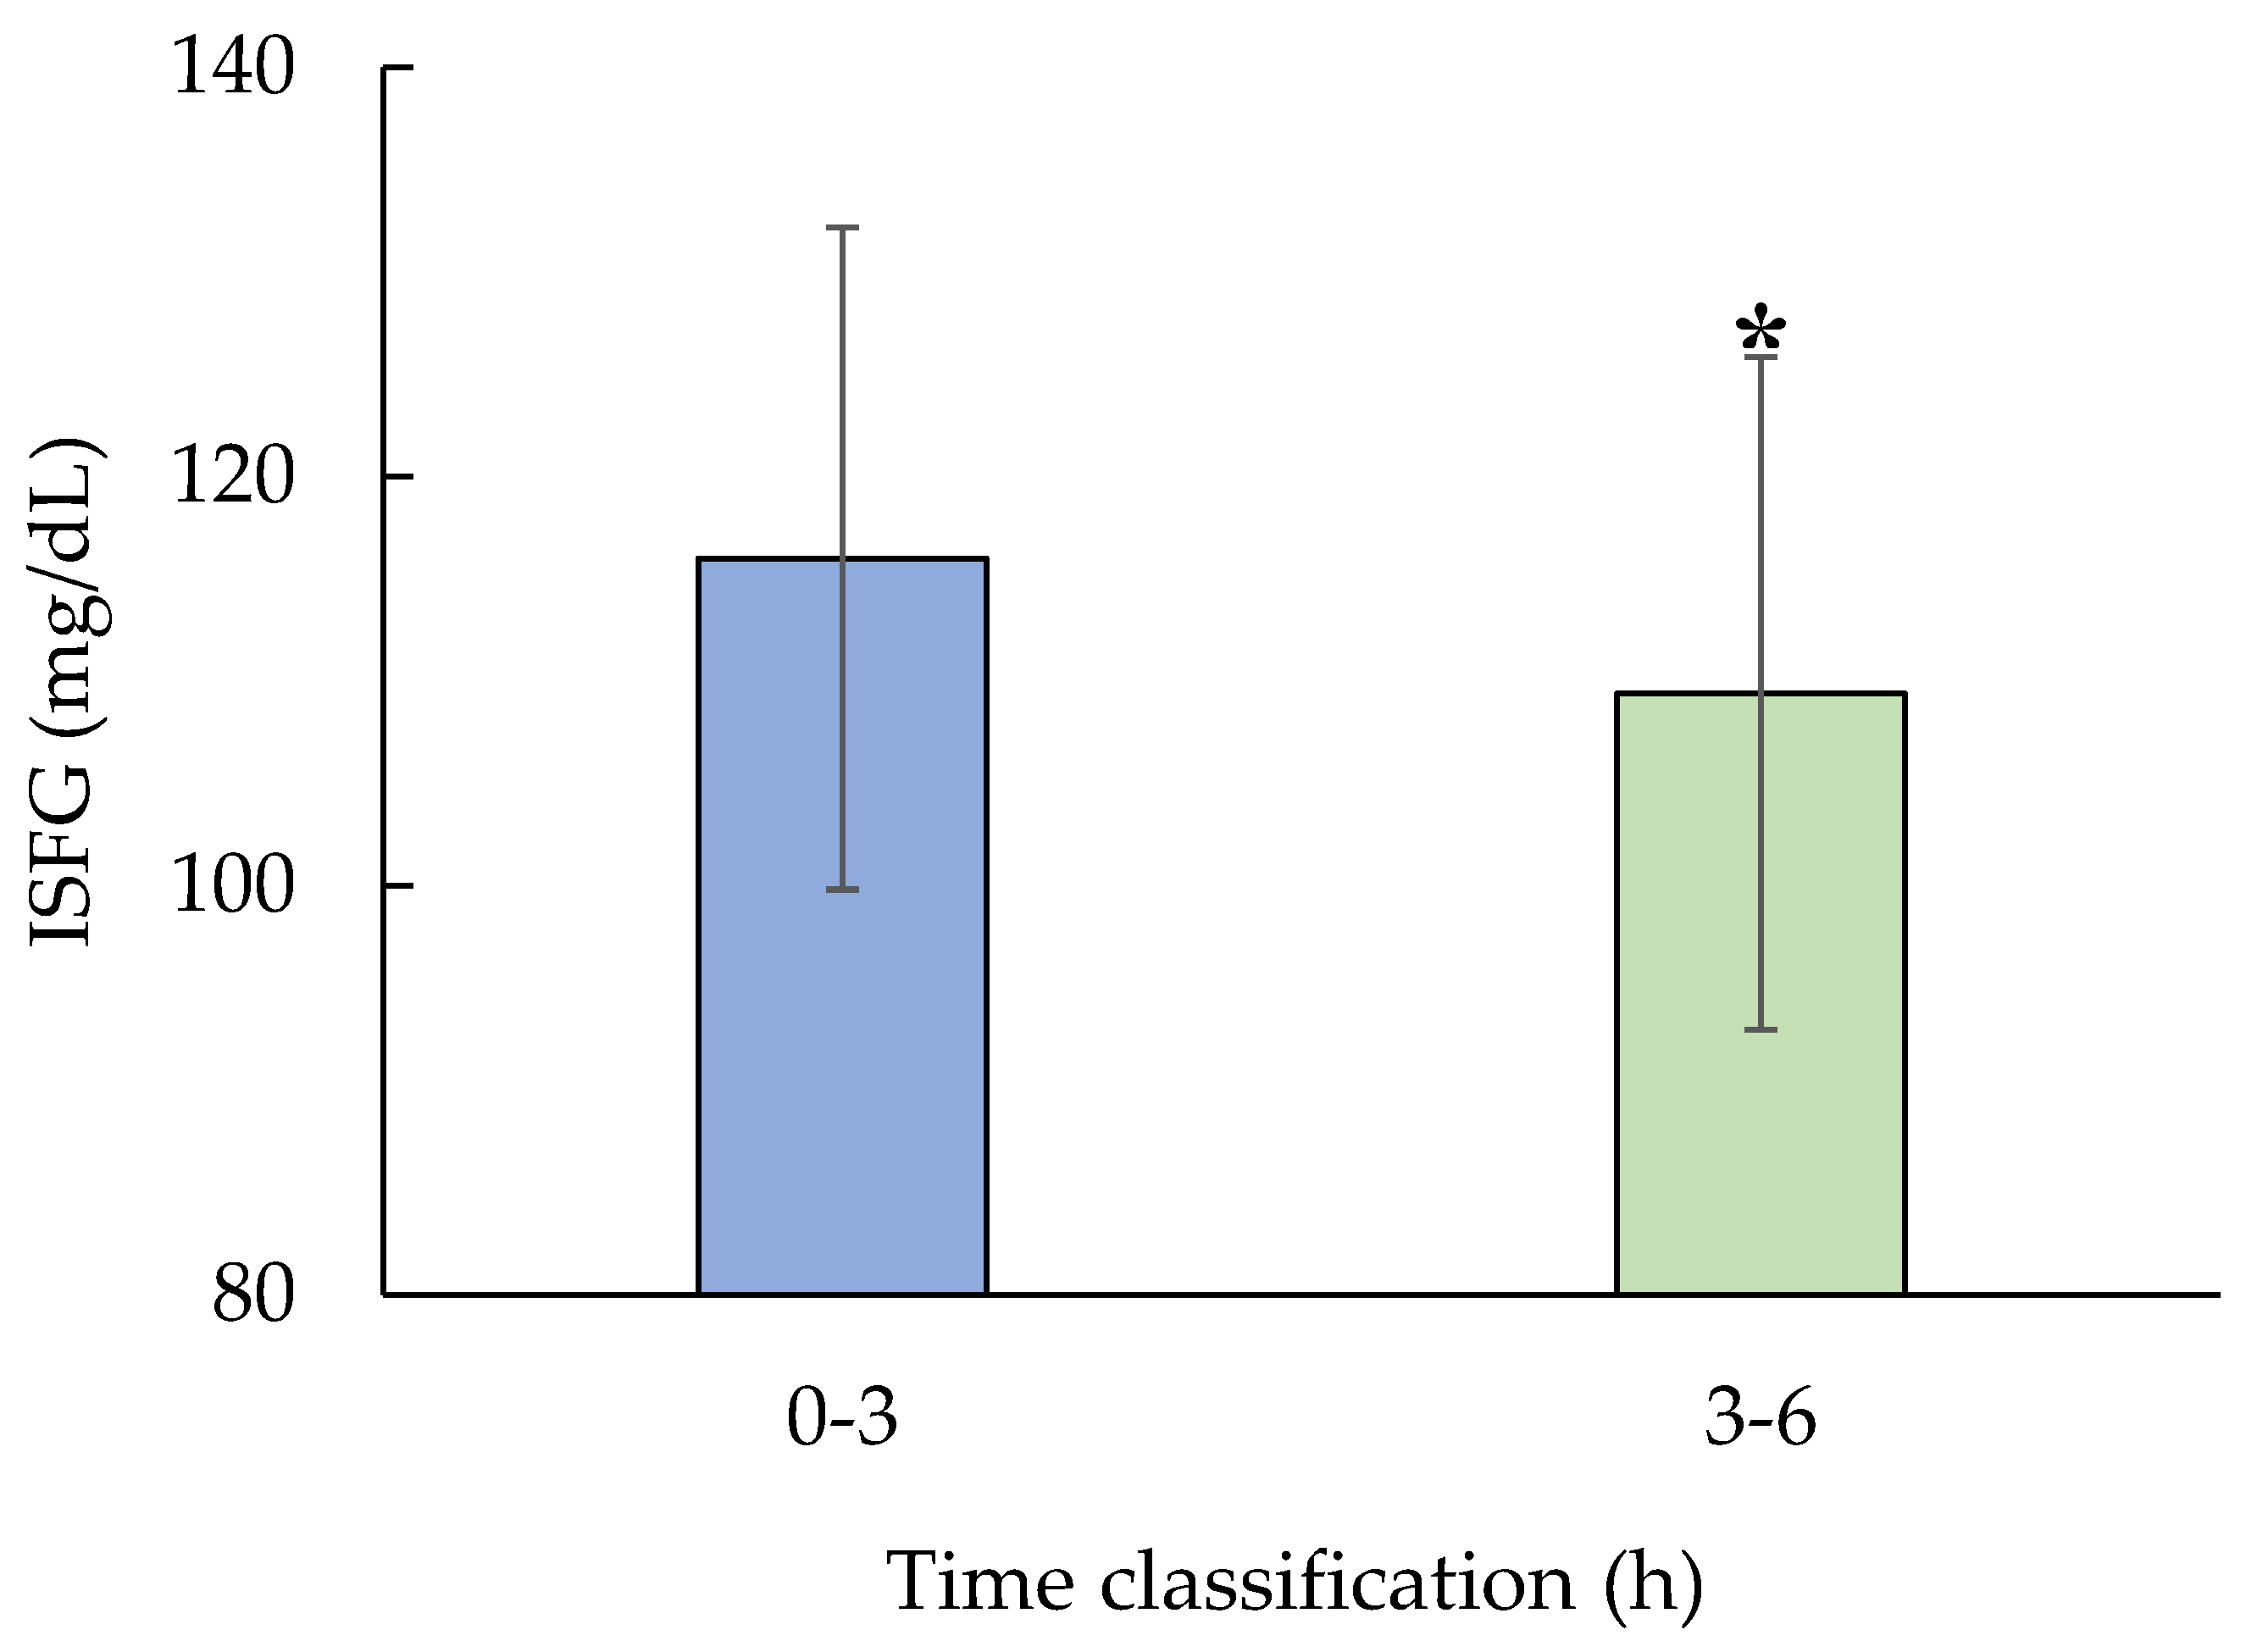
Test for significant difference in ISFG during nighttime sleep. Paired t-test for 0-3h and 3-6h (n=5, p=0.01). ISFG was significantly decreased during 3-6h compared to 0-3h.
4. Discussion
This study explored the dynamics of interstitial fluid glucose (ISFG) during sleep in healthy individuals using a multimodal monitoring approach combining minimally invasive glucose sensing with wearable biosensors for heart rate (HR), oxygen saturation (SpO₂), and motion detection. Our findings provide novel insights into physiological fluctuations occurring overnight and their potential implications for real-time metabolic health assessment, particularly in remote or home-care settings. A consistent trend observed in this study was the decrease in ISFG levels during the first half of the sleep window (00:00–03:00), followed by a further decline or stabilization in the second half (03:00–06:00). This reduction was statistically significant (p=0.01), suggesting that glucose consumption during sleep persists, possibly due to continued cerebral glucose uptake even in the absence of food intake. Such a pattern aligns with existing literature on nocturnal glucose metabolism and emphasizes the brain’s high energy demands during sleep, particularly in non-REM phases [31].
The mild but temporally correlated decline in SpO₂ between 3:00 and 4:00 a.m. in most participants may point to physiological adjustments that occur during sleep transitions. Although these changes remained within normal ranges and did not indicate clinical hypoxia, their temporal association with the lowest ISFG values raises interesting questions. One hypothesis is that subtle autonomic nervous system modulations or sleep-stage transitions—such as from non-REM to REM sleep—might temporarily impact both ventilatory control and peripheral glucose utilization. This interplay could represent an early physiological signal of metabolic stress or adjustment, even in otherwise healthy individuals. Actigraphy data confirmed minimal movement throughout the 00:00–06:00 window, supporting the notion that participants were mostly at rest and likely asleep, lending credibility to the assumption that observed physiological changes were indeed sleep-related rather than behaviorally driven [21,23]. Moreover, HR data showed expected nocturnal reductions consistent with circadian patterns and parasympathetic predominance during sleep. These relatively stable HR trends reinforce the validity of the glucose and oxygenation changes, further suggesting that the body’s metabolic and respiratory systems undergo synchronized adjustments overnight. Interestingly, the rebound of ISFG levels observed between 12:00 and 15:00 in four participants may reflect circadian or behavioral influences, including increased activity levels, dietary intake, or hormonal fluctuations such as cortisol peaks. The fact that this pattern emerged in a majority of participants implies a reproducible post-sleep physiological response. Such daytime recovery patterns underscore the importance of considering full diurnal glucose dynamics, not only nocturnal phases, when evaluating metabolic regulation.
The implications of these findings are particularly relevant in the context of telemedicine and remote health monitoring. As chronic diseases such as diabetes continue to rise globally, the need for early detection tools that can be used non-invasively and outside clinical settings is becoming urgent. Our study demonstrates the potential for continuous, home-based, multimodal monitoring systems to identify metabolic imbalances such as asymptomatic nocturnal hypoglycemia. This is especially valuable for patients who do not exhibit overt symptoms and thus might remain undiagnosed under standard care practices. Furthermore, the integration of glucose, HR, SpO₂, and motion data provides a richer dataset than single-modality monitoring systems. When processed with advanced analytics, such as gradient-based anomaly detection or machine learning algorithms, these multimodal signals may reveal subtle, yet clinically significant patterns. This technological synergy opens the door to predictive modeling that could support real-time clinical decision-making and patient self-management.
Despite these promising insights, this study has several limitations. The most notable is the small sample size (n=5), which constrains the generalizability of our findings. Additionally, the study lacked simultaneous polysomnography (PSG), which would allow for precise identification of sleep stages. Incorporating PSG in future research would enable more granular analyses of how specific sleep architecture changes correspond to metabolic fluctuations. Another limitation of this study lies in the relatively low sampling rate (0.25 Hz) used for physiological signal acquisition. In general, low-frequency sampling has the advantage of minimizing the impact of high-frequency noise, as such noise components are theoretically excluded due to the Nyquist theorem. This is particularly appropriate for parameters like SpO₂, which typically vary slowly and can be sufficiently captured at lower sampling rates. Additionally, a lower sampling rate reduces the need for complex filtering, preserving the raw signal characteristics. However, this approach comes at the cost of reduced temporal resolution. Rapid physiological changes or transient events—such as brief arousals, sudden movements, or sharp drops in oxygen saturation—may not be accurately detected. Moreover, low-frequency measurements remain susceptible to slow-drift noise or sensor-related artifacts. Future studies could benefit from higher-resolution data to allow for finer-grained analyses of dynamic physiological patterns, especially in relation to sleep-stage transitions and metabolic fluctuations. Moreover, while our participants were healthy and free of known metabolic disorders, extending this protocol to include individuals with prediabetes, type 2 diabetes, or sleep disorders such as obstructive sleep apnea would be essential to fully assess the clinical utility of these monitoring approaches. Longitudinal designs capturing intra-individual variability across multiple nights could also improve the robustness of derived biomarkers and account for temporal fluctuations related to lifestyle or environmental factors.
In conclusion, our findings reinforce the value of continuous multimodal monitoring for capturing the physiological complexity of sleep and its interaction with glucose metabolism. The use of minimally invasive and wearable technologies makes such assessments feasible in non-clinical settings, advancing the goals of preventive medicine and personalized healthcare. Through further refinement and validation, this approach holds promise for real-time health surveillance and risk management, particularly in populations vulnerable to metabolic dysregulation during sleep. By bridging engineering innovation, data science, and clinical medicine, we can envision a future in which subtle physiological cues are harnessed for proactive, data-driven healthcare delivery.
5. Conclusions
This study aimed to characterize interstitial fluid glucose (ISFG) dynamics during sleep and to examine associated physiological patterns, particularly focusing on peripheral oxygen saturation (SpO₂) and heart rate (HR) fluctuations. By employing a multimodal time-series analysis approach, we sought to uncover potential early markers of nocturnal metabolic disturbances using non-invasive monitoring techniques. Our results revealed that in four out of five participants, ISFG levels steadily declined throughout the sleep period (00:00–06:00), indicating a consistent metabolic trend among healthy individuals. Only one participant showed stable glucose levels without significant decrease, suggesting possible individual variability in nocturnal glucose regulation. Quantitative analysis confirmed a statistically significant reduction in ISFG levels between the early (0–3 h) and late (3–6 h) sleep phases (p = 0.01). SpO₂ remained generally stable during the initial sleep period but demonstrated a subtle decline between 3:00 and 4:00 AM in most participants, with an average reduction of approximately 1–2%. Together, these findings support the feasibility of using integrated wearable sensor systems for continuous, non-invasive monitoring of sleep-related metabolic changes.
Author Contributions
Conceptualization, E.Y.; methodology, E.Y.; software, Y.Y.; validation, E.Y. and Y.Y.; formal analysis, E.Y.; investigation, E.Y.; resources, H.E. and K.H.; data curation, E.Y.; writing—original draft preparation, E.Y.; writing—review and editing, E.Y.; visualization, Y.Y.; supervision, E.Y.; project administration, E.Y.; funding acquisition, E.Y. All authors have read and agreed to the published version of the manuscript.
Funding
This research received no external funding.
Data Availability Statement
The data presented in this study are available on request from the corresponding author. The data are not publicly available due to privacy and ethical restrictions.
Acknowledgments
The authors would like to express their sincere gratitude to all study participants for their time, cooperation, and valuable contributions to this research. Their commitment and patience made this study possible.
Conflicts of Interest
The authors declare no conflicts of interest.
Abbreviations
The following abbreviations are used in this manuscript:
| ISFG | Interstitial Fluid Glucose |
| HR | Heart Rate |
| SpO₂ | Peripheral Oxygen Saturation |
| CGM | Continuous Glucose Monitoring |
References
- Zhu, W.; Yu, H.; Pu, Z.; Guo, Z.; Zheng, H.; Li, C.; Zhang, X.; Li, J.; Li, D. Effect of interstitial fluid pH on transdermal glucose extraction by reverse iontophoresis. Biosens. Bioelectron. 2023, 235, 115406. [Google Scholar] [CrossRef] [PubMed]
- Sun, T.; Liu, J.; Chen, C.J. Calibration algorithms for continuous glucose monitoring systems based on interstitial fluid sensing. Biosens. Bioelectron. 2024, 260, 116450. [Google Scholar] [CrossRef] [PubMed]
- De la Paz, E.; Barfidokht, A.; Rios, S.; Brown, C.; Chao, E.; Wang, J. Extended noninvasive glucose monitoring in the interstitial fluid using an epidermal biosensing patch. Anal. Chem. 2021, 93, 12767–12775. [Google Scholar] [CrossRef]
- Tehrani, F.; Teymourian, H.; Wuerstle, B.; Kavner, J.; Patel, R.; Furmidge, A.; Aghavali, R.; Hosseini-Toudeshki, H.; Brown, C.; Zhang, F.; et al. An integrated wearable microneedle array for the continuous monitoring of multiple biomarkers in interstitial fluid. Nat. Biomed. Eng. 2022, 6, 1214–1224. [Google Scholar] [CrossRef]
- Tianyi, S.; Yulong, Z.; Yanzhen, J.; Chen, C.J.; Liu, J.T. Micro interstitial fluid extraction and detection device integrated with the optimal extraction conditions for noninvasive glucose monitoring. Biosens. Bioelectron. 2023, 237, 115515. [Google Scholar] [CrossRef] [PubMed]
- Pfohl, M.; Pfeiffer, A.; Schatz, H. Spot glucose measurement in epidermal interstitial fluid—An alternative to capillary blood glucose estimation? Exp. Clin. Endocrinol. Diabetes 2000, 108, 1–4. [Google Scholar] [CrossRef] [PubMed]
- Chan, T.I.L.; Yip, Y.W.Y.; Man, T.T.C.; Pang, C.P.; Brelén, M.E. Comparing the rise in glucose concentration in blood, aqueous and interstitial fluid during a glucose tolerance test. Transl. Vis. Sci. Technol. 2022, 11, 3. [Google Scholar] [CrossRef]
- Kemp, E.; Palomäki, T.; Ruuth, I.A.; Boeva, Z.A.; Nurminen, T.A.; Vänskä, R.T.; Zschaechner, L.K.; Pérez, A.G.; Hakala, T.A.; Wardale, M.; et al. Influence of enzyme immobilization and skin-sensor interface on non-invasive glucose determination from interstitial fluid obtained by magnetohydrodynamic extraction. Biosens. Bioelectron. 2022, 206, 114123. [Google Scholar] [CrossRef]
- Belle, A.; Thiagarajan, R.; Soroushmehr, S.M.; Navidi, F.; Beard, D.A.; Najarian, K. Big Data Analytics in Healthcare. Biomed. Res. Int. 2015, 2015, 370194. [Google Scholar] [CrossRef]
- Mehta, N.; Pandit, A. Concurrence of Big Data Analytics and Healthcare: A Systematic Review. Int. J. Med. Inform. 2018, 114, 57–65. [Google Scholar] [CrossRef]
- Wang, L.; Alexander, C.A. Big Data Analytics in Medical Engineering and Healthcare: Methods, Advances and Challenges. J. Med. Eng. Technol. 2020, 44(6), 267–283. [Google Scholar] [CrossRef] [PubMed]
- Lee, S.W.H.; Ng, K.Y.; Chin, W.K. The impact of sleep amount and sleep quality on glycemic control in type 2 diabetes: A systematic review and meta-analysis. Sleep Med. Rev. 2017, 31, 91–101. [Google Scholar] [CrossRef] [PubMed]
- Tsereteli, N.; Vallat, R.; Fernandez-Tajes, J.; Delahanty, L.M.; Ordovas, J.M.; Drew, D.A.; Valdes, A.M.; Segata, N.; Chan, A.T.; Wolf, J.; Berry, S.E.; Walker, M.P.; Spector, T.D.; Franks, P.W. Impact of insufficient sleep on dysregulated blood glucose control under standardised meal conditions. Diabetologia 2022, 65, 356–365. [Google Scholar] [CrossRef] [PubMed]
- Mason, I.C.; Qian, J.; Adler, G.K.; Scheer, F.A.J.L. Impact of circadian disruption on glucose metabolism: implications for type 2 diabetes. Diabetologia 2020, 63, 462–472. [Google Scholar] [CrossRef]
- Addo, P.N.O.; Mundagowa, P.T.; Zhao, L.; Kanyangarara, M.; Brown, M.J.; Liu, J. Associations between sleep duration, sleep disturbance and cardiovascular disease biomarkers among adults in the United States. BMC Public Health 2024, 24, 947. [Google Scholar] [CrossRef]
- Kim, Y.C.; Um, Y.J.; Yoon, S.H.; Kim, T.W.; Seo, H.J.; Jeong, J.H.; Hong, S.C.; Um, Y.H. Association between weekend catch-up sleep and the risk of prediabetes and diabetes: A cross-sectional study using KNHANES. J. Psychosom. Res. 2024, 179, 111618. [Google Scholar] [CrossRef]
- Liu, K.; Marques-Vidal, P. Sleep well, but be active. Effect of sleep and sedentariness on incidence of diabetes. Prim. Care Diabetes 2023, 17, 454–459. [Google Scholar] [CrossRef]
- Reutrakul, S.; Van Cauter, E. Interactions between sleep, circadian function, and glucose metabolism: implications for risk and severity of diabetes. Ann. N. Y. Acad. Sci. 2014, 1311, 151–173. [Google Scholar] [CrossRef]
- Wang, J.; Kwok, M.K.; Au Yeung, S.L.; Li, A.M.; Lam, H.S.; Leung, J.Y.Y.; Hui, L.L.; Leung, G.M.; Schooling, C.M. Sleep duration and risk of diabetes: Observational and Mendelian randomization studies. Prev. Med. 2019, 119, 24–30. [Google Scholar] [CrossRef]
- Prieto-Avalos, G.; Cruz-Ramos, N.A.; Alor-Hernández, G.; Sánchez-Cervantes, J.L.; Rodríguez-Mazahua, L.; Guarneros-Nolasco, L.R. Wearable Devices for Physical Monitoring of Heart: A Review. Biosensors 2022, 12, 292. [Google Scholar] [CrossRef]
- Chen, S.; Qi, J.; Fan, S.; Qiao, Z.; Yeo, J.C.; Lim, C.T. Flexible Wearable Sensors for Cardiovascular Health Monitoring. Adv. Healthc. Mater. 2021, 10, 2100116. [Google Scholar] [CrossRef] [PubMed]
- Vaghasiya, J.V.; Mayorga-Martinez, C.C.; Pumera, M. Wearable sensors for telehealth based on emerging materials and nanoarchitectonics. NPJ Flex. Electron. 2023, 7, 26. [Google Scholar] [CrossRef]
- Dias, D.; Silva Cunha, J.P. Wearable Health Devices—Vital Sign Monitoring, Systems and Technologies. Sensors 2018, 18, 2414. [Google Scholar] [CrossRef] [PubMed]
- Takahashi, S.; Nakazawa, E.; Ichinohe, S.; Akabayashi, A. Wearable Technology for Monitoring Respiratory Rate and SpO₂ of COVID-19 Patients: A Systematic Review. Diagnostics 2022, 12, 2563. [Google Scholar] [CrossRef]
- Beniczky, S.; Arbune, A.A.; Jeppesen, J.; Ryvlin, P. Biomarkers of seizure severity derived from wearable devices. Epilepsia 2020, 61 (Suppl. 1), S61–S66. [Google Scholar] [CrossRef] [PubMed]
- Guo, Y.; Liu, X.; Peng, S.; Jiang, X.; Xu, K.; Chen, C.; Wang, Z.; Dai, C.; Chen, W. A review of wearable and unobtrusive sensing technologies for chronic disease management. Comput. Biol. Med. 2021, 129, 104163. [Google Scholar] [CrossRef]
- Wang, J.; Kwok, M.K.; Au Yeung, S.L.; Li, A.M.; Lam, H.S.; Leung, J.Y.Y.; Hui, L.L.; Leung, G.M.; Schooling, C.M. Sleep duration and risk of diabetes: Observational and Mendelian randomization studies. Prev. Med. 2019, 119, 24–30. [Google Scholar] [CrossRef]
- Lutfi, M.F.; Elhakeem, R.F. Effect of Fasting Blood Glucose Level on Heart Rate Variability of Healthy Young Adults. PLoS One 2016, 11(7), e0159820. [Google Scholar] [CrossRef]
- Aoki, Y.; et al. The blood glucose level increased in parallel with the heart rate following cilostazol administration in three diabetic patients. Intern Med. 2014, 53, 2063–2065. [Google Scholar] [CrossRef]
- Aluko, E.O.; et al. Acute Effect of Honey-sweetened Coffee on Blood Pressure, Heart Rate and Blood Glucose Level in Healthy Female Subjects. Cardiovasc. Hematol. Disord. Drug Targets 2024, 24, 1–9. [Google Scholar] [CrossRef]
- Kajisa, T.; Kuroi, T.; Hara, H.; Sakai, T. Correlation analysis of heart rate variations and glucose fluctuations during sleep. Sleep Med. 2024, 113, 180–187. [Google Scholar] [CrossRef] [PubMed]
- Stojmenski, A.; Gusev, M.; Chorbev, I.; Tudjarski, S.; Poposka, L.; Vavlukis, M. Age and Gender Impact on Heart Rate Variability towards Noninvasive Glucose Measurement. Sensors (Basel) 2023, 23(21), 8697. [Google Scholar] [CrossRef] [PubMed]
- Panzer, C.; Lauer, M.S.; Brieke, A.; Blackstone, E.; Hoogwerf, B. Association of fasting plasma glucose with heart rate recovery in healthy adults: A population-based study. Diabetes 2002, 51(3), 803–807. [Google Scholar] [CrossRef] [PubMed]
- Bidonde, J.; Fagerlund, B.C.; Frønsdal, K.B.; Lund, U.H.; Robberstad, B. FreeStyle Libre Flash Glucose Self-Monitoring System: A Single-Technology Assessment; Report No. 2017-07; Knowledge Centre for the Health Services at The Norwegian Institute of Public Health (NIPH): Oslo, Norway, 2017. [Google Scholar] [PubMed]
- Blum, A. Freestyle Libre Glucose Monitoring System. Clin. Diabetes 2018, 36, 203–204. [Google Scholar] [CrossRef]
- Gu, J.; Zhao, Z.; Li, H.; Li, B.; Chen, S.; Cao, Y.; Li, N.; Lu, X. Accuracy of Freestyle Libre continuous glucose monitoring system in critically ill patients after cardiac surgery. J. Cardiothorac. Surg. 2025, 20, 75. [Google Scholar] [CrossRef]
- Blissett, R.; Blissett, D.; Levrat-Guillen, F.; Deshmukh, H.; Wilmot, E.G.; Ryder, R.E.J.; Walton, C.; Sathyapalan, T. FreeStyle Libre Flash Glucose Monitoring system for people with type 1 diabetes in the UK: A budget impact analysis. BMJ Open Diabetes Res. Care 2022, 10, e002580. [Google Scholar] [CrossRef]

Table 1.
Average ISFG per time segment.
| Participants | ISFG (mg/dL) | ISFG (0-3)* |
ISFG (3-6) |
ISFG (6-9) |
ISFG (9-12) |
ISFG (12-15) |
ISFG (15-18) |
ISFG (18-21) |
ISFG (21-24) |
|---|---|---|---|---|---|---|---|---|---|
| 1 | 106±7 | 103 | 94 | 104 | 102 | 119 | 109 | 107 | 108 |
| 2 | 138±8 | 141 | 134 | 150 | 139 | 147 | 123 | 130 | 140 |
| 3 | 112±9 | 103 | 95 | 107 | 110 | 123 | 122 | 117 | 119 |
| 4 | 120±6 | 123 | 115 | 107 | 118 | 126 | 129 | 122 | 121 |
| 5 | 144±25 | 110 | 109 | 126 | 154 | 172 | 177 | 166 | 138 |
*The brackets in ISFG indicate time.
Table 2.
Values obtained from biosensors during sleep (by time period).
| Participants | HR (bpm) | HR (0-3a) | HR (3-6a) |
|---|---|---|---|
| 1 | 67±9 | 74±7 | 60±5 |
| 2 | 49±7 | 54±7 | 45±4 |
| 3 | 83±4 | 84±3 | 81±4 |
| 4 | 87±6 | 90±6 | 85±6 |
| SpO2(%) | SpO2(0-3) | SpO2(3-6) | |
| 1 | 97±1 | 96±1 | 97±1 |
| 2 | 96±1 | 95±1 | 96±1 |
| 3 | 97±1 | 96±1 | 97±1 |
| 4 | 95±1 | 95±1 | 96±1 |
| Motion (G) | Motion (0-3) | Motion (3-6) | |
| 1 | 0 [0-0] | 0 [0-1] | 0 [0-0] |
| 2 | 0 [0-1] | 0 [0-1] | 0 [0-1] |
| 3 | 0 [0-1] | 1 [0-1] | 0 [0-1] |
| 4 | 0 [0-0] | 0 [0-0] | 0 [0-0] |
Due to missing data, we were unable to obtain biosignal data during sleep from participant 5.
Disclaimer/Publisher’s Note: The statements, opinions and data contained in all publications are solely those of the individual author(s) and contributor(s) and not of MDPI and/or the editor(s). MDPI and/or the editor(s) disclaim responsibility for any injury to people or property resulting from any ideas, methods, instructions or products referred to in the content. |
© 2025 by the authors. Licensee MDPI, Basel, Switzerland. This article is an open access article distributed under the terms and conditions of the Creative Commons Attribution (CC BY) license (http://creativecommons.org/licenses/by/4.0/).
Copyright: This open access article is published under a Creative Commons CC BY 4.0 license, which permit the free download, distribution, and reuse, provided that the author and preprint are cited in any reuse.


