
Submitted:
14 May 2025
Posted:
15 May 2025
You are already at the latest version
Abstract
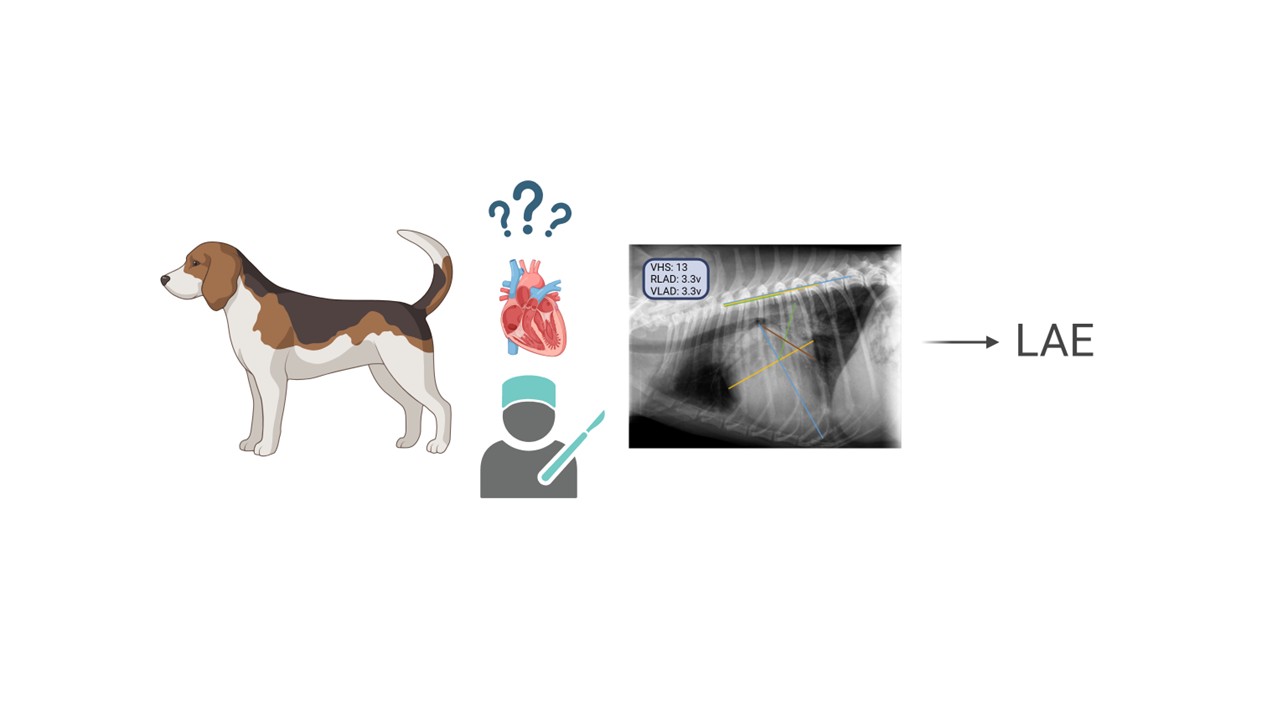
Degenerative mitral valve disease accounts for more than 75% of all cardiac diseases in dogs, with left atrial enlargement (LAE) being the primary radiographic sign [1].
In this retrospective study, the radiographic measurements Vertebral Heart Size (VHS), Radiographic Left Atrial Dimension (RLAD), and Vertebral Left Atrial Size (VLAS) were compared for the detection of LAE on lateral thoracic radiographs, correlating them with the echocardiographic left atrium to aortic root ratio (LA/Ao). Two groups were ana-lyzed: Group A with 35 radiographs (without LAE) and Group B with 24 radiographs (with LAE), in which VHS, RLAD, VLAS, and their corresponding LA/Ao ratio values were measured. The optimal cut-off value for each variable to detect LAE was determined using Receiver Operating Characteristic (ROC) curve analysis, and the sensitivity, speci-ficity, and area under the curve (AUC) were reported. The correlation of the radiographic measurements with LA/Ao ratio was also assessed.
Moderate to high correlations were observed between VHS, RLAD, and VLAS and LA/Ao ratio (r = 0.77, 0.65, and 0.68, respectively). The specificity of all three measures was the same (91%), while their sensitivities were also similar (75%, 71%, and 67%, respec-tively). The optimal cut-off values were determined to be 11.1v for VHS, 2v for RLAD, and 2.2v for VLAS.
It was concluded that all three radiographic measurements have comparable speci-ficity and sensitivity for detecting LAE in dogs.
Keywords:
RLAD
; VLAS
; VHS
; LA/Ao ratio
; left atrial enlargement
; degenerative mitral valve disease
1. Introduction
Degenerative mitral valve disease (DMVD) accounts for more than 75% of all cardiac pathologies in dogs [1]. The most common radiographic sign of this pathology is left atrial enlargement (LAE), alongside enlargement of the left ventricle, pulmonary veins in cases of venous hypertension, and pulmonary arteries in cases of pulmonary arterial hypertension [2]. For this reason, it is essential to recognize the most common radiographic signs in canine cardiology [3]. Radiography of the cardiovascular system is one of the methods used for staging cardiac disease in a patient, determining the appropriate cardiac therapy, and monitoring the response to treatment or the progression of cardiac pathology [3].
Despite normal variations between breeds, a baseline for radiographic evaluation is necessary. Until 7 years ago, no radiographic measurement existed to specifically evaluate left atrial size in dogs. The most used measurement to evaluate cardiomegaly, without specifying which cardiac chamber is affected, is the Vertebral Heart Scale (VHS) [3]. To calculate VHS, the long cardiac axis is drawn (Figure 1, blue line) from the ventral limit of the carina to the most distant point of the cardiac apex. Perpendicular to this, the short cardiac axis is drawn (Figure 1, yellow line) from the dorsal limit of the caudal vena cava [4] to the opposite side of the cardiac silhouette. Both axes are transposed to the cranial edge of the fourth thoracic vertebra, parallel to the spine. The number of vertebral units (v) occupied by each axis is summed to obtain the VHS value. The normal range for VHS is 9.7v ± 0.5 [5].
Recently, two new methods have been proposed to objectively detect LAE radiographically in dogs. The RLAD [6], or radiographic left atrial dimension, is a new radiographic measure for detecting increases in left atrial size. It is drawn as the bisector of the right angle formed by the long and short VHS axes [4] extending to the dorsal limit of the left atrium. The line is transposed parallel to the spine starting from the fourth thoracic vertebra to measure the vertebral units occupied (Figure 1, green line). The optimal value for this measure is 1.8v [6].
The VLAS [7-9] or vertebral left atrial size, is another quantitative method to radiographically estimate left atrial size. It involves drawing a line from the centre of the ventral limit of the carina to the most caudal limit of the left atrium, intersecting with the dorsal border of the caudal vena cava [7]. This line is transposed parallel to the spine starting from the cranial edge of the fourth thoracic vertebra, and the vertebral units it occupies are measured (Figure 2, orange line). A value exceeding 2.3v indicates LAE.
Moreover, assessing the degree of left atrial dilation is crucial for predicting survival prognosis and the progression of DMVD in dogs [10]. Echocardiography serves as a valuable non-invasively tool for evaluating left atrial size, employing linear methods obtained via M-mode or two-dimensional imaging [11]. Among this, the left atrium-to-aortic root ratio (LA/Ao ratio) obtained from a short-axis right parasternal projection is the most used method for detecting left atrial enlargement in clinical veterinary practice. This parameter is considered the most reliable for assessing left atrial size [12].
The main objective of this study is to compare the utility (sensitivity and specificity) of the radiographic measurements VHS, RLAD, and VLAS for detecting LAE in dogs. Additionally, it aims to identify the optimal cut-off value for these variables within the study. Finally, the study investigates the correlation between the three radiographic measurements and the LA/Ao ratio, as this is the reference test for diagnosing left atrial enlargement.
2. Materials and Methods
2.1. Clinical Cases
A total of 143 cases were retrospectively collected from ARS Veterinary Hospital in Barcelona, Canis i Felis Veterinary Hospital in Sant Adrià, and the Northern Barcelona Area Animal Shelter. The inclusion criteria required dogs with DMVD in stages B1, B2, C, and D, with available thoracic radiographs and LA/Ao ratio measurements at the time of diagnosis. An initial selection was made, excluding cases with radiographic and/or echocardiographic findings consistent with alveolar pulmonary oedema, pulmonary hypertension, or right-sided cardiac disease, as well as cardiac diseases other than DMVD, such as cardiomyopathy, myocarditis, congenital cardiac defects, and diagnosed arrhythmias. The most frequently represented breeds in this study were mixed breed, Pinscher, Dachshund, Poodle, Yorkshire Terrier, Chihuahua, and Cavalier King Charles Spaniel. The age range was between 5 and 15 years. The sex and weight of the patients were not considered in this study.
2.2. Radiographic Measurements
A total of 59 right lateral thoracic radiographic projections were ultimately included in this study, with all measurements performed by the same operator (Irene García Luque) using Microsoft Office PowerPoint 2016. They were assigned to two groups: without LAE (Group 1) and with LAE due to DMVD (Group 2), based on the LA/Ao ratio. Group 1 was defined by an LA/Ao < 1.6, and Group 2 was defined by an LA/Ao ≥ 1.6 [13]. Group 1 included 35 radiographs, and Group 2 included 24 radiographs.
The VHS was calculated using the methodology described by Buchanan [4]. The long axis was measured from the ventral edge of the left main stem bronchus (carina) to the most distant point of the cardiac apex (Figure 1, blue line). The short axis was drawn perpendicular to the long axis from the dorsal edge of the caudal vena cava (Figure 1, yellow line). Both axes were transposed parallel to the spine from the cranial edge of the fourth thoracic vertebra (T4), and the number of vertebral units (v) occupied by both axes was measured.
For RLAD, a line was drawn from the intersection of the VHS axes [4], forming a 45° angle, to the dorsal edge of the left atrium (Figure 1, green line). This line was transposed parallel to the spine from the cranial edge of the fourth thoracic vertebra [6].
For VLAS, a line was drawn from the centre of the ventral edge of the carina to the most caudal point of the left atrium, where it intersects with the dorsal edge of the caudal vena cava (Figure 2, orange line). This line was transposed parallel to the spine from the cranial edge of the fourth thoracic vertebra, and its length in vertebral units (v) was measured [7].
2.3. LA/Ao Ratio
The LA/Ao ratio for the 59 dogs included in the study was obtained simultaneously with their respective radiographic studies. This measurement was performed by three different operators: I.N., C.M. and X.S., using the same methodology [12]. The LA/Ao was calculated as the ratio between the left atrium diameter and the aortic diameter, obtained using 2D echocardiography from a short-axis right parasternal view. The diameter of the aorta was measured by placing the first caliper at the midpoint of the convex curvature of the right aortic sinus wall and the second caliper at the point where the left and non-coronary valve leaflets intersect. The diameter of the left atrium was measured from this point, extending the line to the blood-tissue interface of the left atrium wall.
2.4. Statistical Analysis
The statistical analysis of these data was processed using JMP® Pro 14.0.0 software (© 2018 SAS Institute Inc.).
First, a linear model was used for each radiographic measurement (VHS, RLAD, and VLAS) to assess its effectiveness in identifying LAE. Then, for a description of the variables to be studied, the basic statistics were generated: mean, standard deviation, maximum value and minimum value. In addition, ROC (Receiver Operating Characteristic) curve analysis was used to specify the optimal cut-off value of the variables to detect LAE, where the Youden Index is higher. The sensitivity, specificity and area under the curve (AUC) of said radiographic measurement for that cut-off value were also described. Next, the Pearson correlation (r) between each of the three radiographic measurements (VHS, RLAD and VLAS) with the LA/Ao ratio was analysed. A p-value under 0.05 was established as the level of statistical significance.
3. Results
3.1. VHS, RLAD and VLAS Usefulness in Detecting LAE
The Chi-square (χ²) significance values for VHS, RLAD, and VLAS was 0.0002, 0.0002, and 0.0004, respectively. It can be observed that all three radiographic measurements show a statistically significant level (p < 0.05) and, therefore, are decisive for detecting this radiographic sign.
3.2. Descriptive Analysis of the Variables
The optimal cut-off values for the three variables under study were 11.1v for VHS, 2v for RLAD, and 2.2v for VLAS (Figure 3). The AUC for VHS, RLAD, and VLAS was similar, with values of 0.86, 0.86, and 0.84, respectively.
The sensitivity of a radiographic measurement represents its ability to detect LAE in a radiograph. In this study, the sensitivity values for VHS, RLAD, and VLAS were 75%, 71%, and 67%, respectively. Conversely, specificity refers to the ability of the radiographic measurement to correctly identify individuals without LAE in a radiograph. In this case, the specificity of all three measurements (VHS, RLAD, and VLAS) was identical at 91%.
3.3. Correlation Between VHS, RLAD, VLAS and LA/Ao Ratio
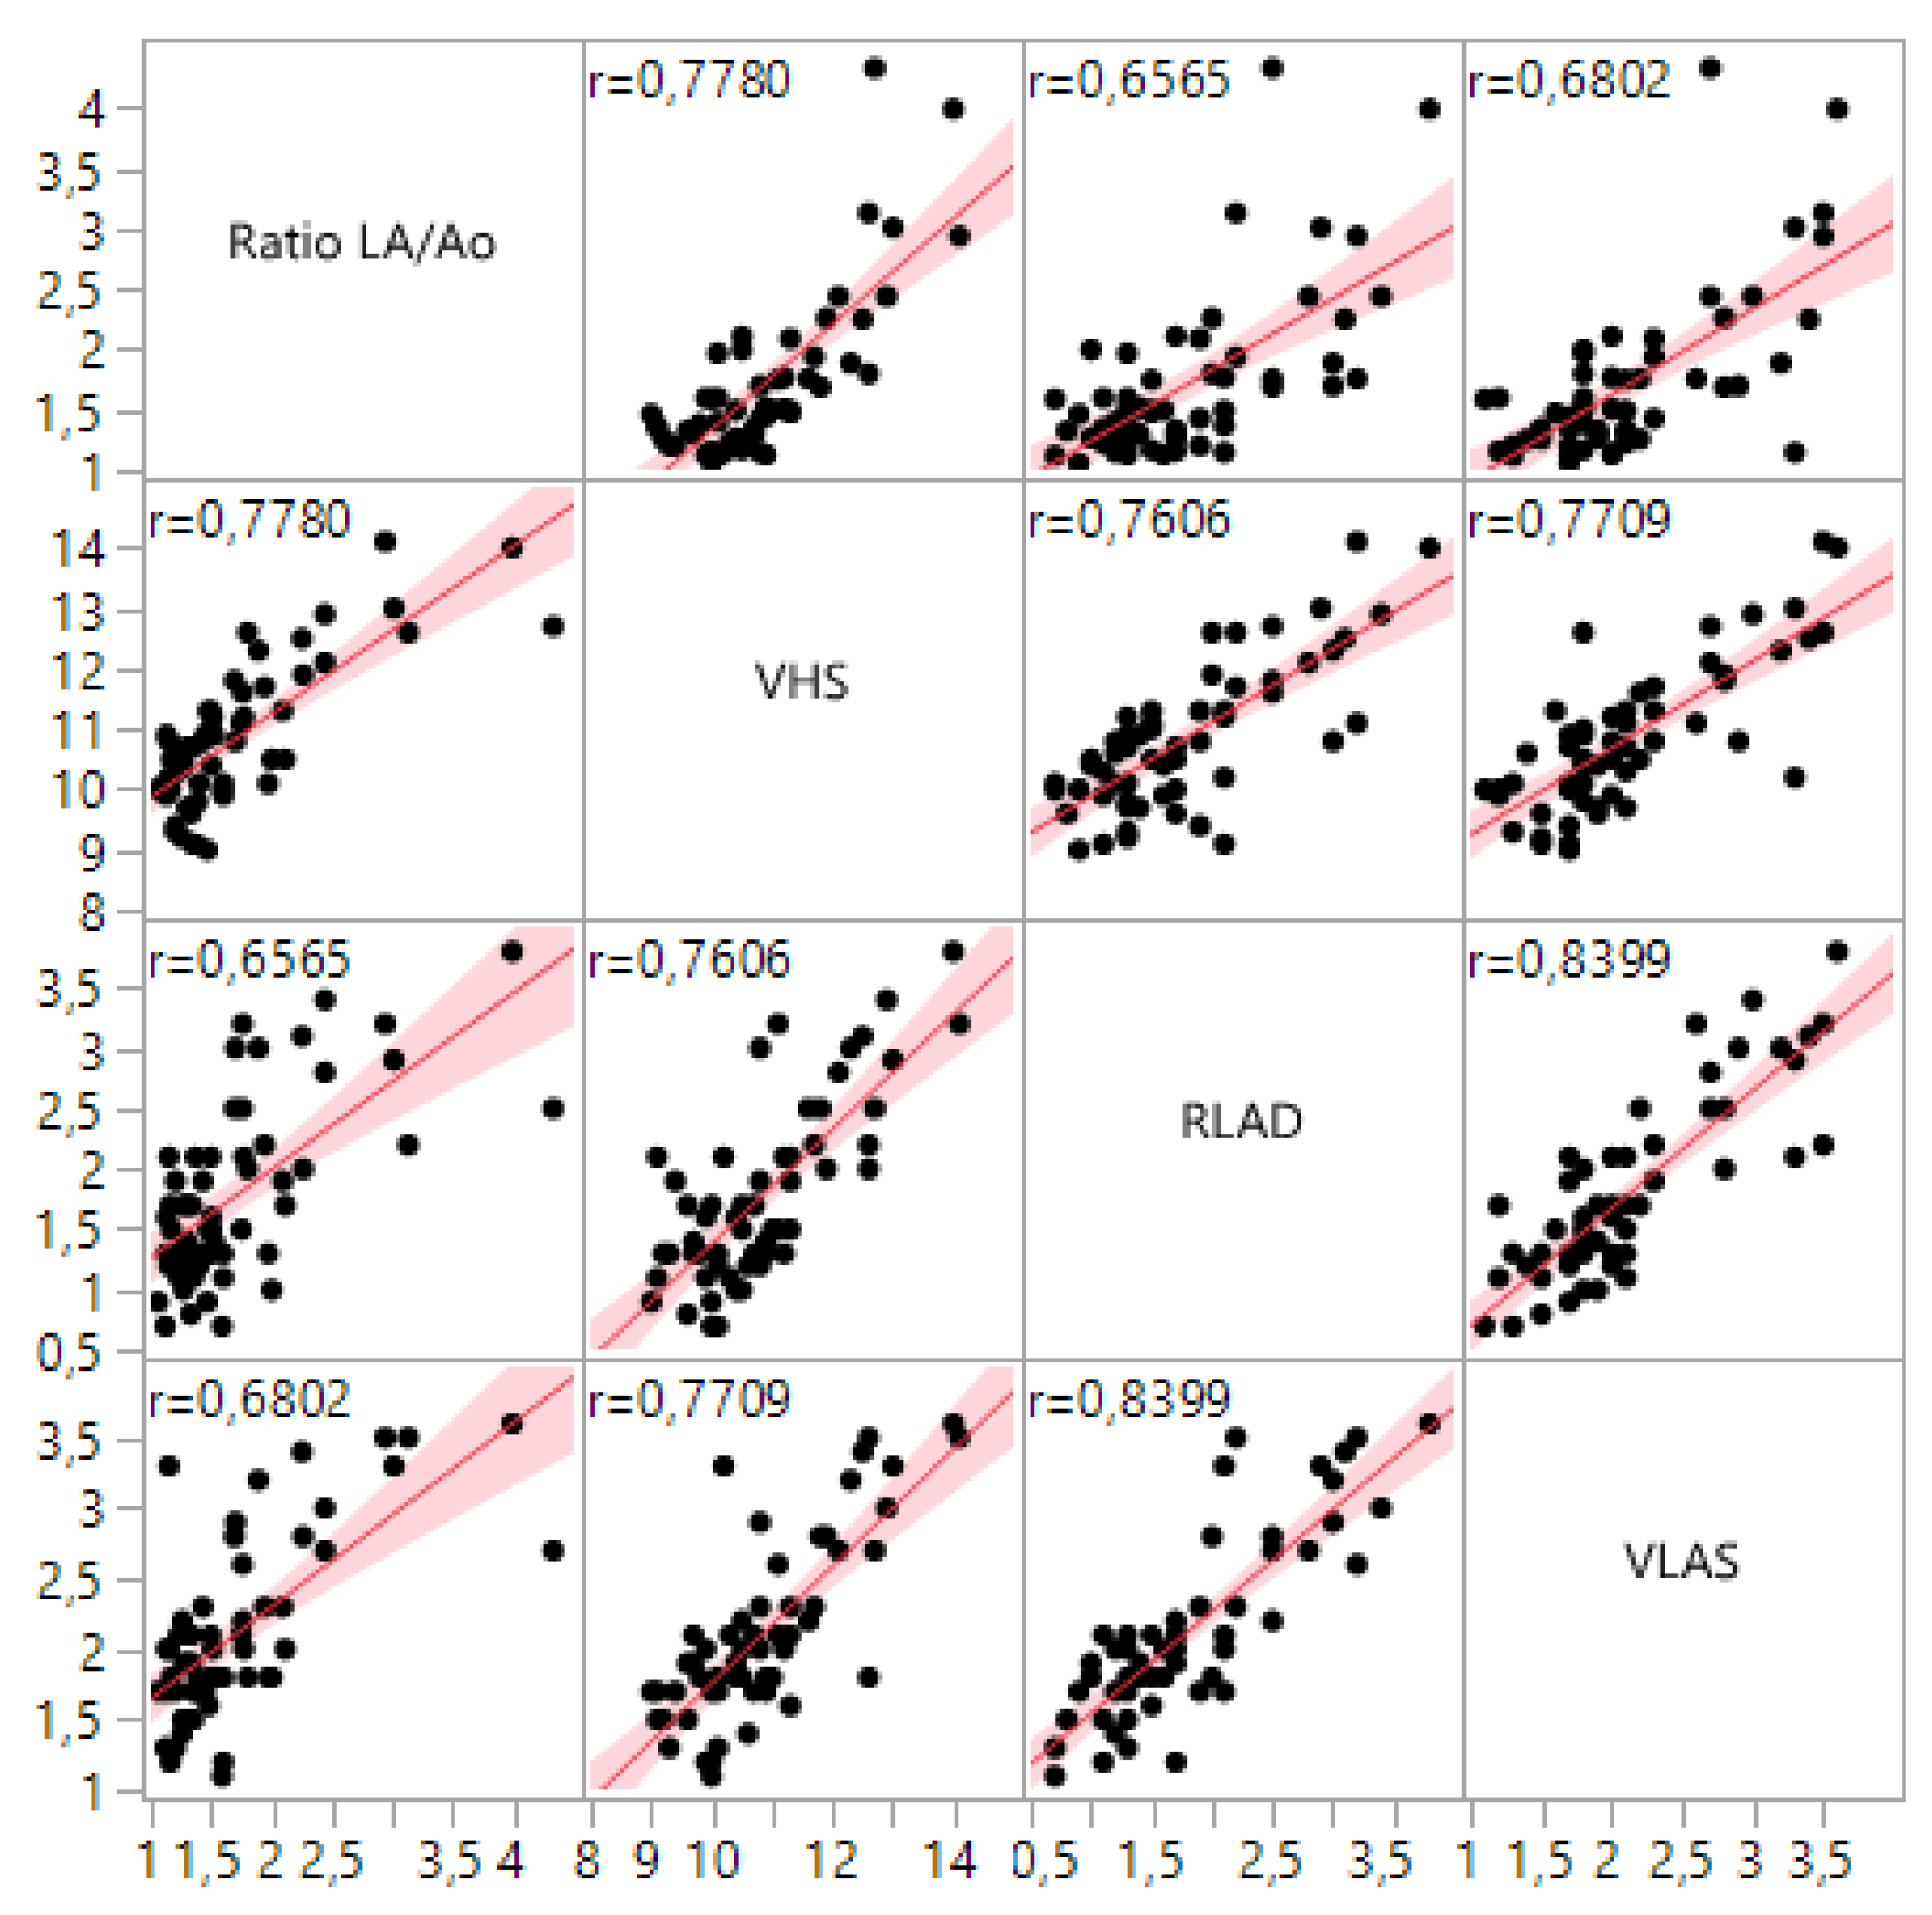
Additionally, the relationships between the three variables and the LA/Ao ratio were analysed, as the latter serves as the reference measurement for diagnosing DMVD. Moderate to strong correlations were observed between VHS, RLAD, and VLAS and the LA/Ao ratio, with correlation coefficients of r = 0.78, r = 0.66, and r = 0.68, respectively. Figure 4 provides a graphical representation of the correlation between the four variables. It can be observed that the LA/Ao ratio and VHS display a more linear trend with a narrower shaded area, indicating less data dispersion, compared to RLAD and VLAS.
4. Discussion
The objective of this study was to compare VHS, RLAD, and VLAS for the radiographic detection of left atrial enlargement (LAE) in dogs. To achieve this, the sensitivity, specificity, and AUC of the three radiographic measurements were assessed. Additionally, these three measurements were correlated with the LA/Ao ratio, as it is the most used echocardiographic measurement for detecting LAE and monitoring its progression.
The sensitivity, specificity, and AUC values obtained in the RLAD study [6] were 93.5%, 96.8%, and 0.97, respectively. Similarly, the values reported in the VLAS study [7] were 81%, 77%, and 0.88, respectively.
The values obtained in our study are similar to those reported in the original studies, although the sensitivity, specificity, AUC, and correlation with the LA/Ao ratio were lower. These differences may be due to several factors, which are described below.
Studies with larger sample sizes generally yield more precise estimates and a lower risk of error. Therefore, the smaller sample size in this study may explain some of the observed differences.
Intra- and inter-observer variability, as well as the experience of the observer, could also significantly affect the cut-off values identified. A study conducted in 2005 [14] evaluated inter-observer variability among operators with varying levels of experience in calculating VHS, using a sample of 50 dogs. The average difference between the 16 observers was 1.05v ± 0.32, and the average difference between individuals within each observer group (with varying levels of experience) was approximately 0.5v. Conducting a study to quantify this variability within the present study would be of interest.
Additionally, the lack of breed-specific information may contribute to inter-breed differences that were not accounted for. Identifying optimal cut-off values for different dog breeds, similar to the parameters currently available for VHS [3], would be an interesting objective for future studies.
It is also important to note that differences may stem from the various stages of DMVD within the studied population, as the dogs were included arbitrarily. To this end, the population of dogs with DMVD in this study was compared with those from the original RLAD [6] and VLAS [7] studies. Our study shows a higher percentage of patients in stage B2, specifically 40%, compared to the original studies (25–29%). The control group in our study accounts for a similar percentage compared to the RLAD and VLAS studies, while the group in stages C-D has lower representation. A higher proportion of dogs in stage B2 results in a greater proportion of mild LAE cases, which are more difficult to visualize radiographically and could explain the slightly lower sensitivity of the radiographic measurements and their correlation with the LA/Ao ratio in this study.
5. Conclusions
In conclusion, the findings from this study demonstrate that the radiographic measurements VHS, RLAD, and VLAS are all valuable tools for identifying LAE. More specifically, the VHS, RLAD and VLAS radiographic measurements are similar in terms of sensitivity and specificity to detect an increased size of the left atrium. The determined optimal cut-off values from this study were 11.1v for VHS, 2v for RLAD, and 2.2v for VLAS. Additionally, the correlations between these radiographic measurements and the LA/Ao ratio were 0.78 for VHS, 0.66 for RLAD, and 0.68 for VLAS, indicating a strong relationship between these indices and echocardiographic findings. These results highlight the reliability of VHS, RLAD, and VLAS in diagnosing LAE and support their continued use in veterinary radiology.
Author Contributions
Conceptualization, X.S. and I.G.; methodology, X.S.; software, I.G.; validation, X.S., I.G. and D.G.; formal analysis, I.G.; investigation, X.S.; resources, X.S. D.P., I.N and C.M.; data curation, I.G.; writing—original draft preparation, I.G.; writing—review and editing, X.S. and D.G.; visualization, X.S.; supervision, X.S. All authors interpreted the data, critically revised the manuscript for important intellectual contents and approved the final version of the manuscript.”.
Funding
This research received no external funding.
Institutional Review Board Statement
Not applicable.
Informed Consent Statement
Not applicable.
Data Availability Statement
Data Availability Statements are available in section “MDPI Research Data Policies” at https://www.mdpi.com/ethics.
Acknowledgments
The authors wish to thank the Northern Barcelona Area Animal Shelter for providing a large part of the clinical cases.
Conflicts of Interest
The authors declare no conflicts of interest.
Abbreviations
The following abbreviations are used in this manuscript:
| AUC | Area Under Curve |
| DMVD | Degenerative mitral valve disease |
| LA/Ao | Left Atrial to Aortic root |
| LAE | Left Atrial Enlargement |
| RLAD | Radiographic Left Atrial Dimension |
| ROC | Receiver Operating Characteristic |
| VHS | Vertebral Heart Size |
| VLAS | Vertebral Left Atrial Size |
References
- Borgarelli, M.; Häggström, J. Canine Degenerative Myxomatous Mitral Valve Disease: Natural History, Clinical Presentation and Therapy. Vet. Clin. N. Am. Small Anim. Pract. 2010, 40, 651–663. [Google Scholar] [CrossRef] [PubMed]
- Fox, P.R.; Sisson, D.; Moïse, N.S. Textbook of Canine and Feline Cardiology: Principles and Clinical Practice; Saunders: Philadelphia, PA, USA, 1998. [Google Scholar]
- Thrall, D.E. Veterinary Diagnostic Radiology, 8th ed.; Elsevier: St. Louis, MO, USA, 2024. [Google Scholar]
- Buchanan, J.W. Vertebral Scale System to Measure Heart Size in Radiographs. Vet. Clin. N. Am. Small Anim. Pract. 2000, 30, 379–93. [Google Scholar] [CrossRef]
- Buchanan, J.W.; Bücheler, J. Vertebral Scale System to Measure Canine Heart Size in Radiographs. J. Am. Vet. Med. Assoc. 1995, 206, 194–199. [Google Scholar] [CrossRef] [PubMed]
- Sánchez Salguero, X.; Prandi, D.; Llabrés-Díaz, F.; Manzanilla, E.G.; Bussadori, C. A Radiographic Measurement of Left Atrial Size in Dogs. Ir. Vet. J. 2018, 71, 1–7. [Google Scholar] [CrossRef] [PubMed]
- Malcolm, E.L.; Visser, L.C.; Phillips, K.L.; Johnson, L.R. Diagnostic Value of Vertebral Left Atrial Size as Determined from Thoracic Radiographs for Assessment of Left Atrial Size in Dogs with Myxomatous Mitral Valve Disease. J. Am. Vet. Med. Assoc. 2018, 253, 1038–1045. [Google Scholar] [CrossRef] [PubMed]
- Bagardi, M.; Manfredi, M.; Zani, D.D.; Brambilla, P.G.; Locatelli, C. Interobserver Variability of Radiographic Methods for the Evaluation of Left Atrial Size in Dogs. Vet. Radiol. Ultrasound 2021, 62, 161–174. [Google Scholar] [CrossRef] [PubMed]
- Puccinelli, C.; Citi, S.; Vezzosi, T.; Garibaldi, S.; Tognetti, R. A Radiographic Study of Breed-Specific Vertebral Heart Score and Vertebral Left Atrial Size in Chihuahuas. Vet. Radiol. Ultrasound 2021, 62, 20–26. [Google Scholar] [CrossRef] [PubMed]
- Höllmer, M.; Willesen, J.L.; Tolver, A.; Koch, J. Comparison of Four Echocardiographic Methods to Determine Left Atrial Size in Dogs. J. Vet. Cardiol. 2016, 18, 137–145. [Google Scholar] [CrossRef] [PubMed]
- Nakamura, R.K.; Tompkins, E.; Russell, N.J.; et al. Left Atrial Rupture Secondary to Myxomatous Mitral Valve Disease in 11 Dogs. J. Am. Anim. Hosp. Assoc. 2014, 50, 405–408. [Google Scholar] [CrossRef] [PubMed]
- Hansson, K.; Häggström, J.; Kvart, C.; Lord, P. Left Atrial to Aortic Root Indices Using Two-Dimensional and M-Mode Echocardiography in Cavalier King Charles Spaniels with and without Left Atrial Enlargement. Vet. Radiol. Ultrasound 2002, 43, 568–575. [Google Scholar] [CrossRef] [PubMed]
- Rishniw, M.; Erb, H.N. Evaluation of Four 2-Dimensional Echocardiographic Methods of Assessing Left Atrial Size in Dogs. J. Vet. Intern. Med. 2000, 14, 429–435. [Google Scholar] [PubMed]
- Hansson, K.; Häggström, J.; Kvart, C.; Lord, P. Interobserver Variability of Vertebral Heart Size Measurements in Dogs with Normal and Enlarged Hearts. Vet. Radiol. Ultrasound 2005, 46, 122–130. [Google Scholar] [CrossRef] [PubMed]
Figure 1.
VHS and RLAD measurements on a right lateral thoracic radiographic view. The blue and yellow lines correspond to the long and short axes of the VHS [4], respectively. The green line corresponds to RLAD [6].
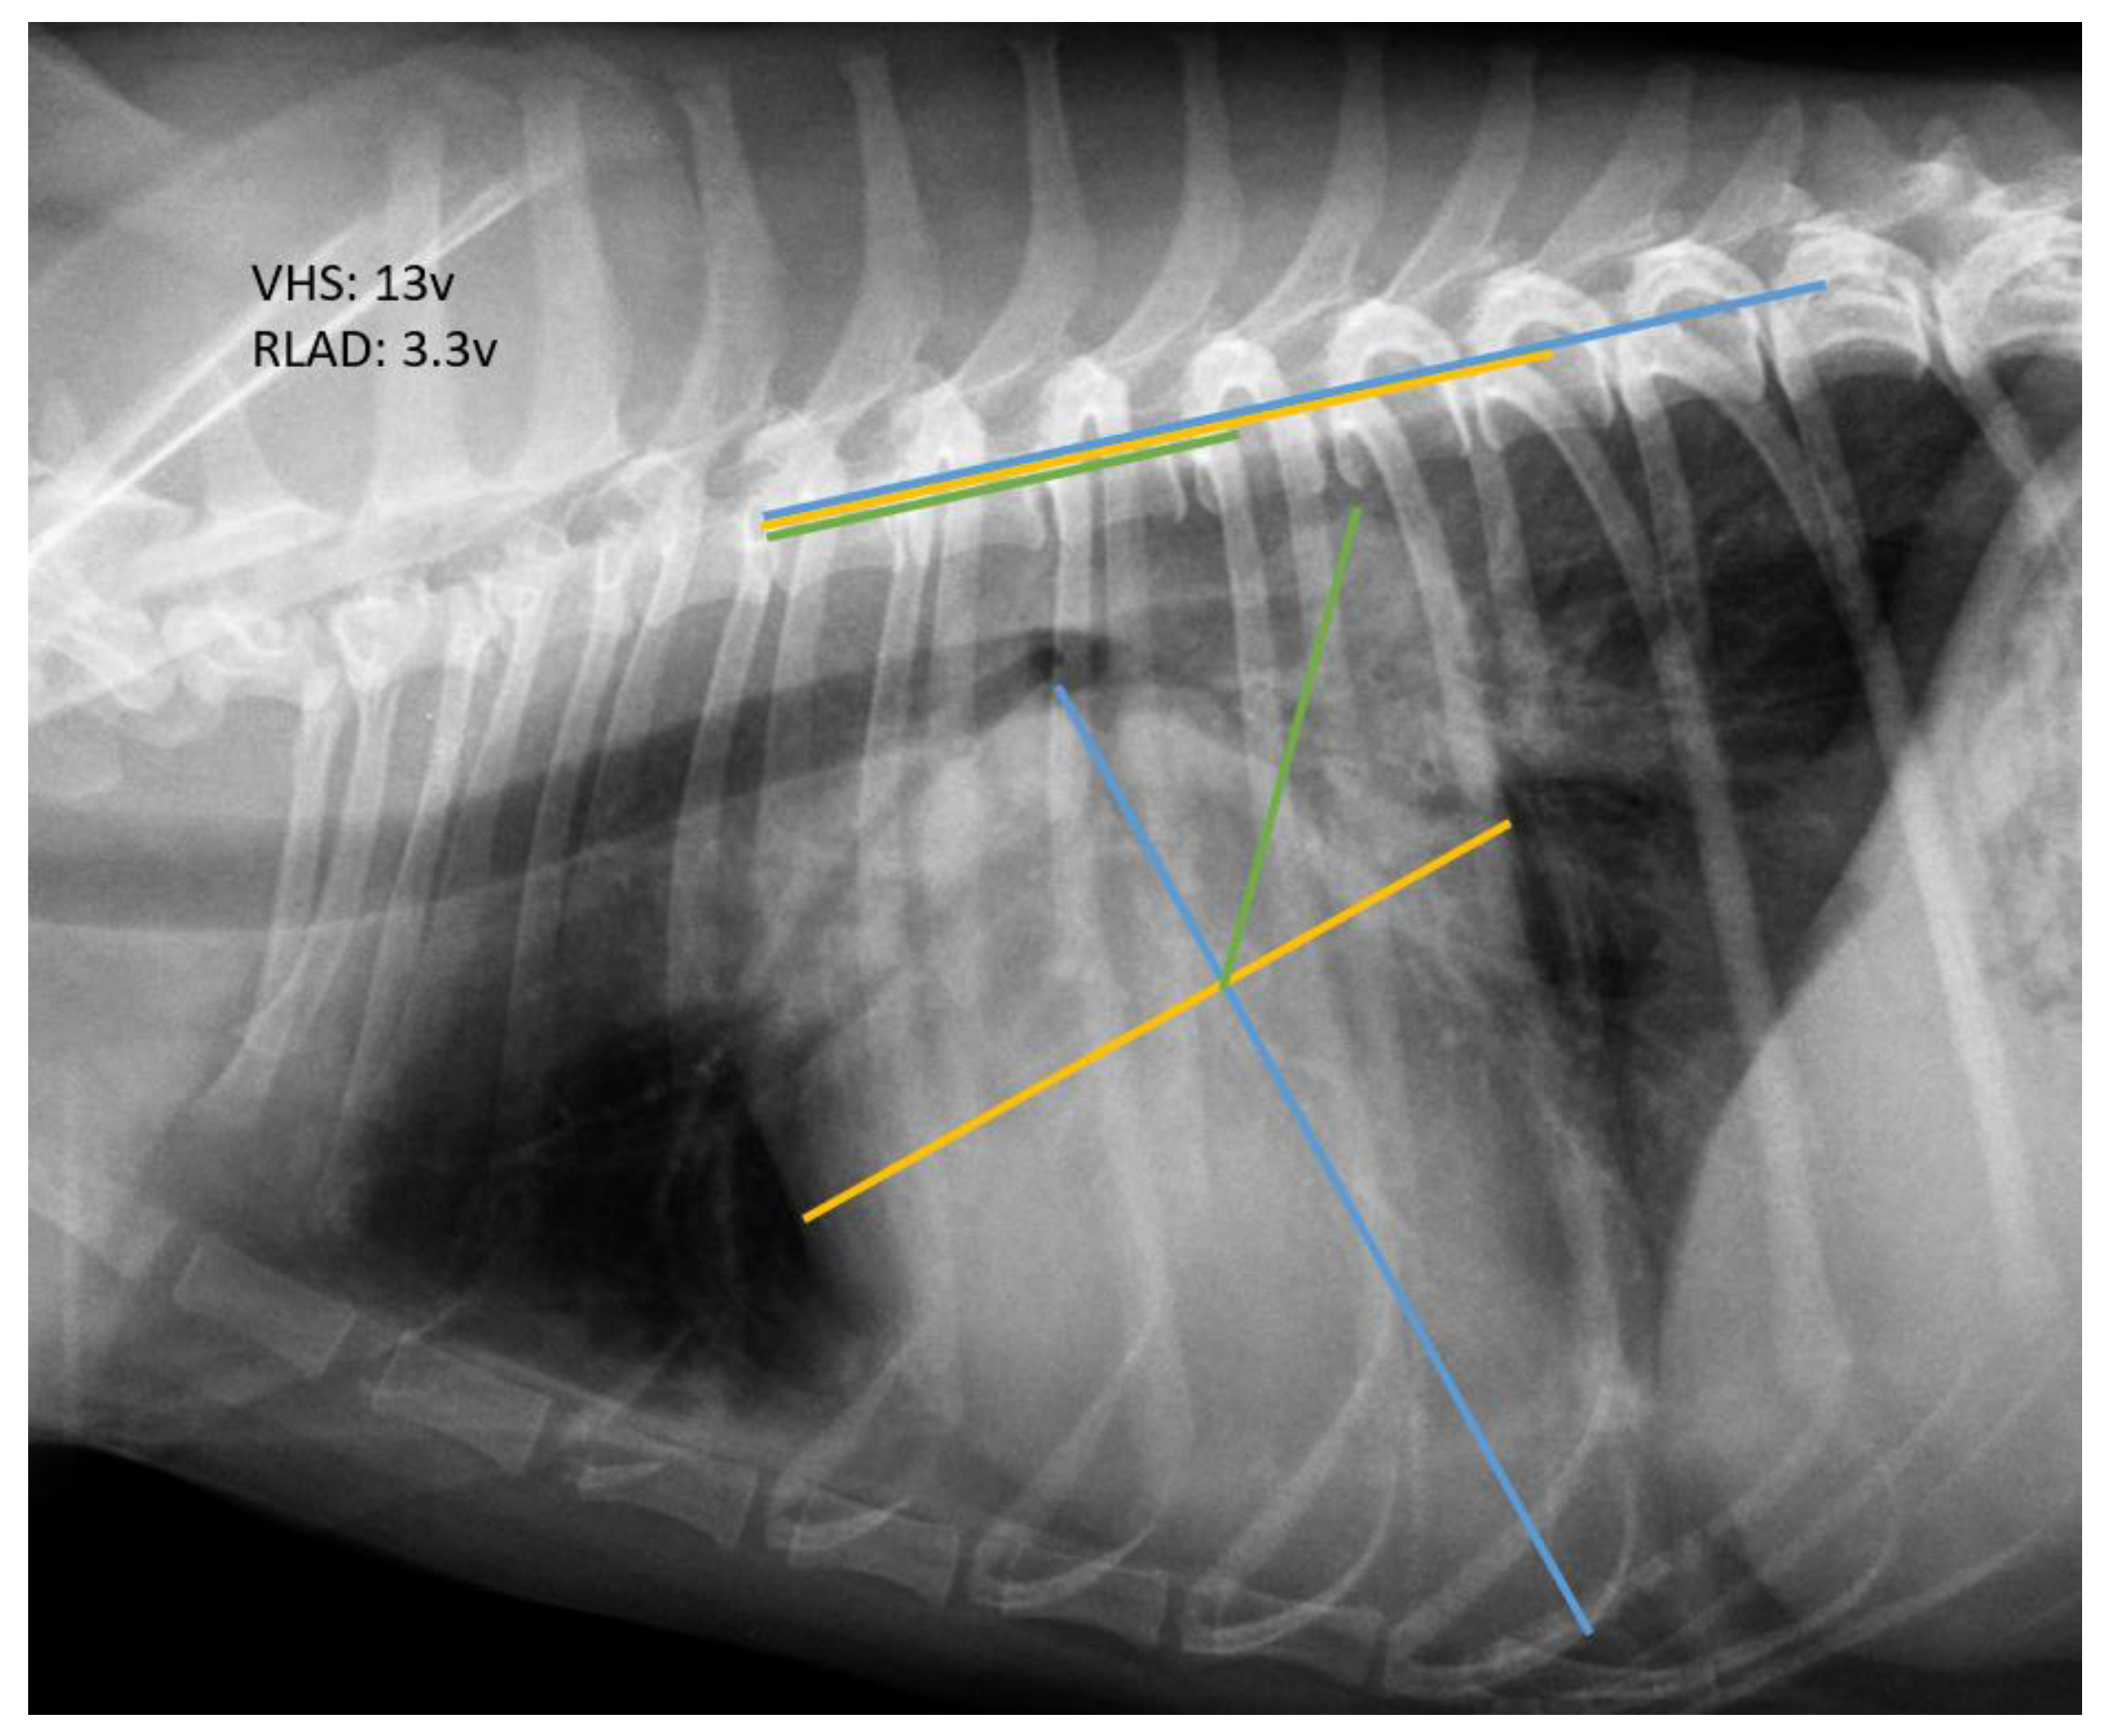
Figure 2.
VLAS measurement on a right lateral thoracic radiographic view [7].
Figure 2.
VLAS measurement on a right lateral thoracic radiographic view [7].
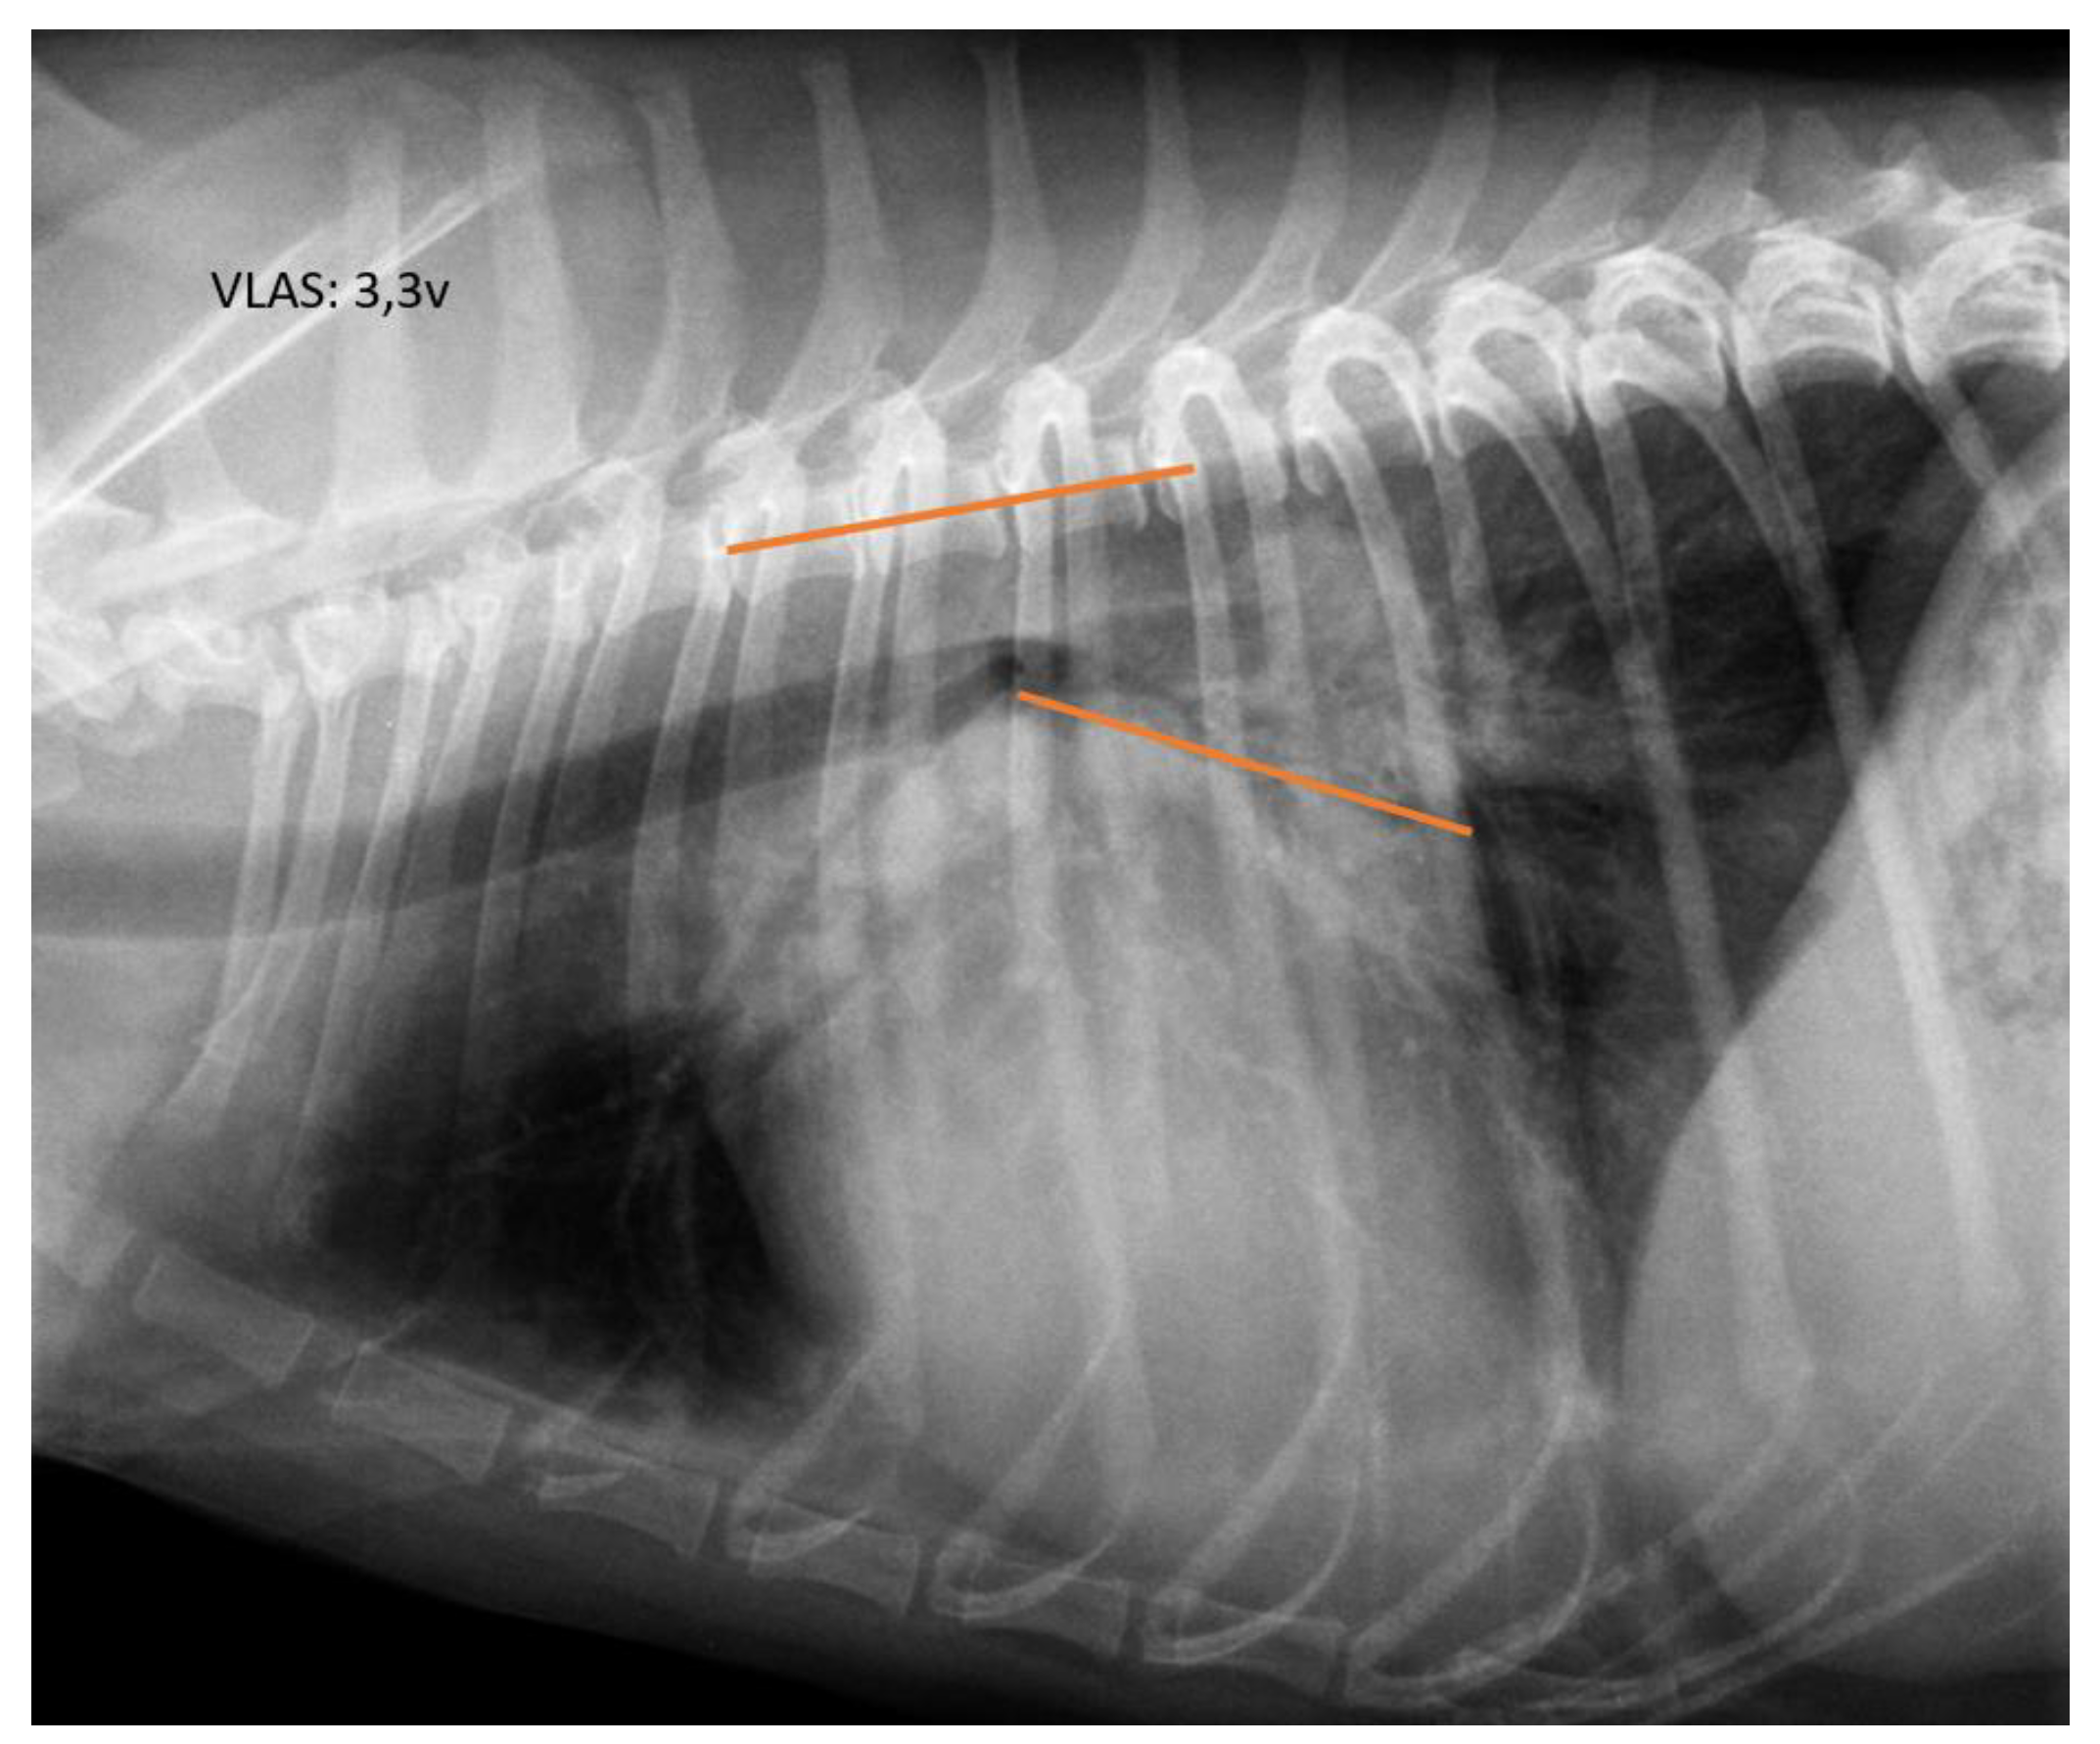
Figure 3.
ROC curve for VHS (A), RLAD (B), and VLAS (C) obtained in this study. The cut-off values providing the highest sensitivity and specificity for VHS, RLAD, and VLAS were 11.1v, 2, and 2.2v, respectively.
Figure 3.
ROC curve for VHS (A), RLAD (B), and VLAS (C) obtained in this study. The cut-off values providing the highest sensitivity and specificity for VHS, RLAD, and VLAS were 11.1v, 2, and 2.2v, respectively.
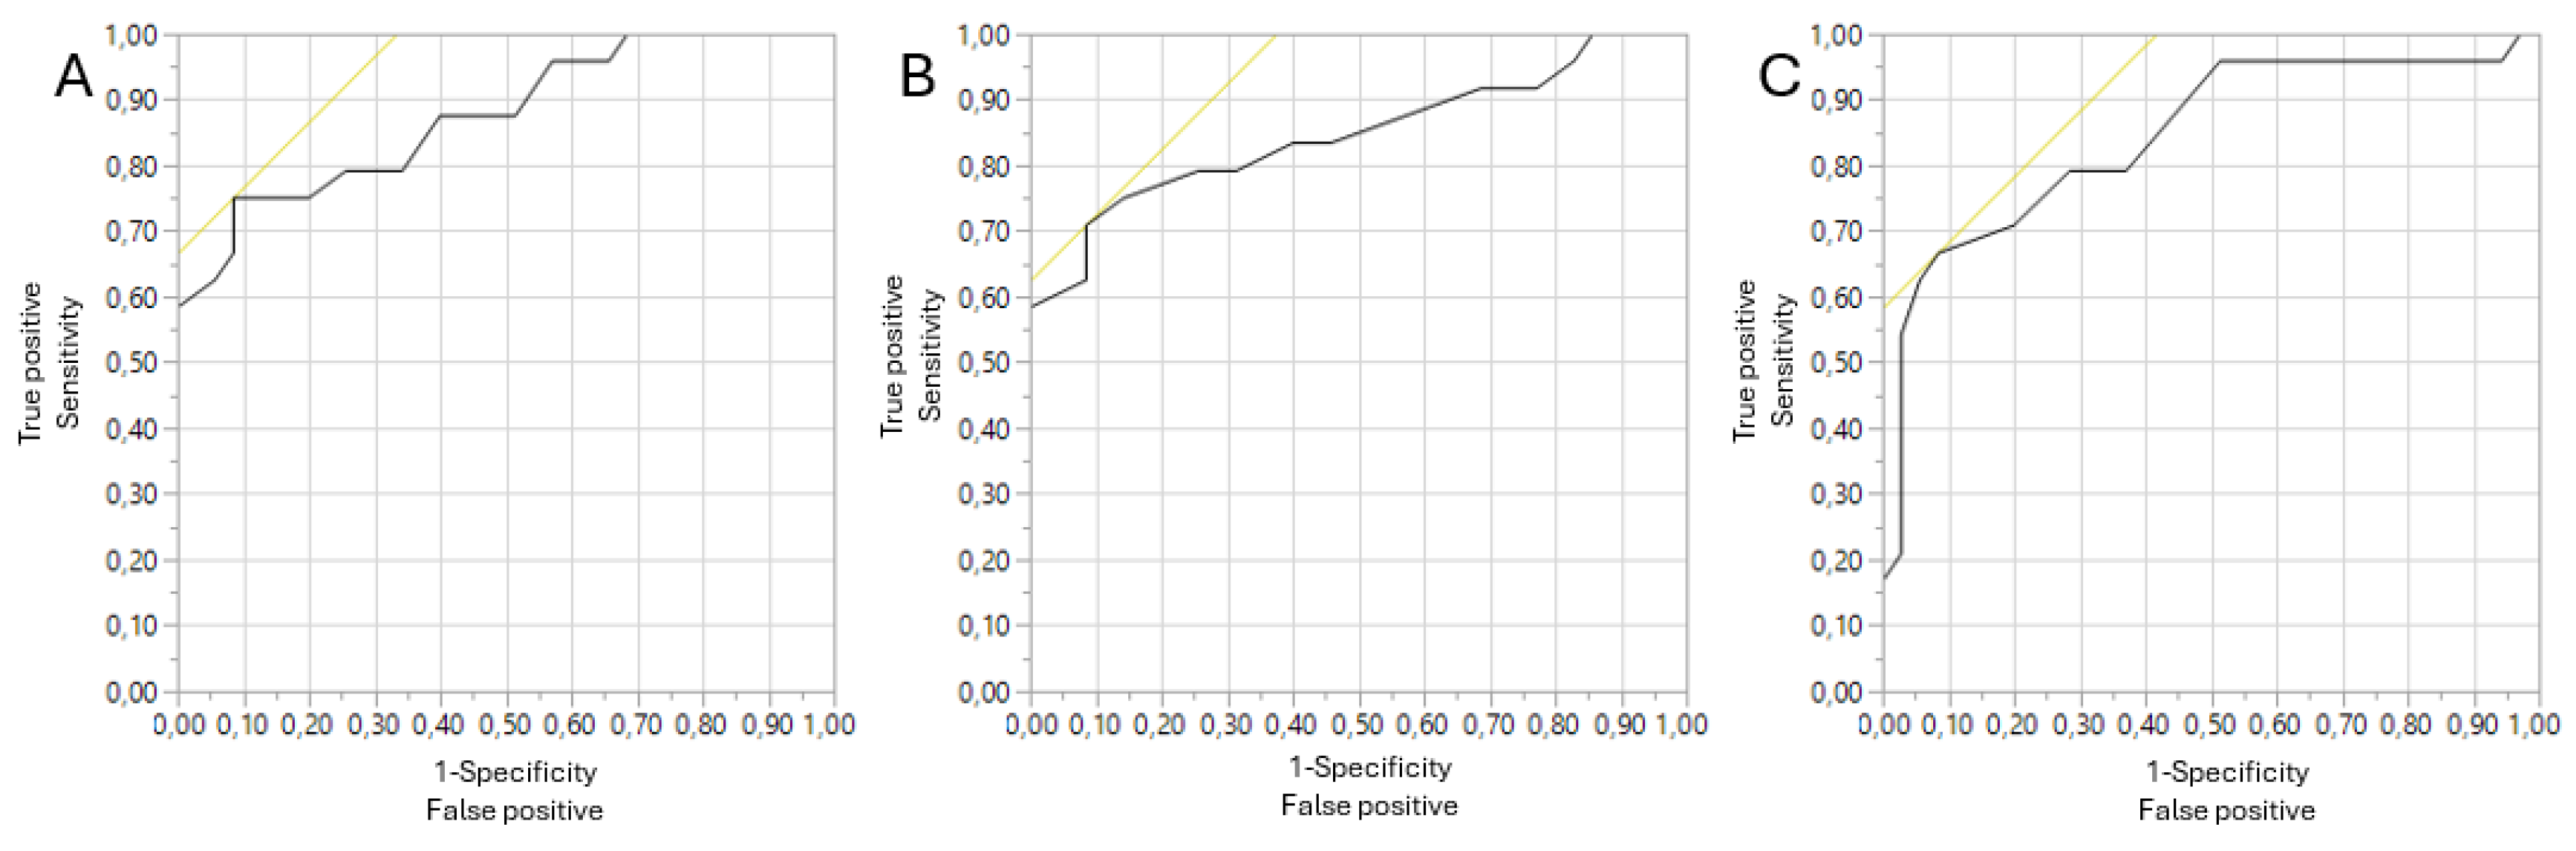
Figure 4.
Scatterplot matrix of the variables LA/Ao ratio, VHS, RLAD, and VLAS.
Disclaimer/Publisher’s Note: The statements, opinions and data contained in all publications are solely those of the individual author(s) and contributor(s) and not of MDPI and/or the editor(s). MDPI and/or the editor(s) disclaim responsibility for any injury to people or property resulting from any ideas, methods, instructions or products referred to in the content. |
© 2025 by the authors. Licensee MDPI, Basel, Switzerland. This article is an open access article distributed under the terms and conditions of the Creative Commons Attribution (CC BY) license (http://creativecommons.org/licenses/by/4.0/).
Copyright: This open access article is published under a Creative Commons CC BY 4.0 license, which permit the free download, distribution, and reuse, provided that the author and preprint are cited in any reuse.


