
Submitted:
14 May 2025
Posted:
14 May 2025
You are already at the latest version
Abstract
The common bean (Phaseolus vulgaris L.) is a vital food crop worldwide, especially in Latin America, Asia, and Sub-Saharan Africa, due to its high levels of protein, fiber, and essential nutrients. However, it is vulnerable to viral infections, particularly from the Bean Common Mosaic Virus and Bean Common Mosaic Necrosis Virus. While previous research has largely focused on specific resistance genes, a broader understanding of the plant’s complete immune response remains limited. To investigate this, a study was conducted involving 51 infected leaf samples. RNA was extracted, and deep metatranscriptomic sequencing was performed using the Illumina MiSeq platform. The results indicated that several genes related to stress response, nitrogen metabolism, and biosynthesis pathways were activated during infection. Significant defense mechanisms included pathogen recognition, production of antimicrobial peptides, and alterations in metabolic activity. The Mitogen-Activated Protein Kinase (MAPK) signaling pathway and enzymes like glycosyl transferases, which help build protective structures, played a critical role. These findings suggest that the bean’s defense system is complex and involves not only direct attacks on pathogens but also metabolic shifts and microbial interactions. Understanding these processes provides valuable insights for breeding stronger, disease-resistant, and climate-resilient bean varieties.
Keywords:
metatranscriptomic
; common beans (Phaseolus vulgaris L)
; metabolic pathways
1. Introduction
The common bean (Phaseolus vulgaris L), is a major agronomic crop produced globally, with a significant value as a source of basic proteins, dietary fiber, and major micronutrients, particularly in nations like Latin America, regions of Asia, and Sub-Saharan Africa (Blair ., 2023; Islam ., 2024). Though nutritionally valuable, the crop is vulnerable to a broad spectrum of diseases induced by various pathogens, including viruses (Mtonga & Maruthi, 2024). These disease infections substantially reduce the yield, quality, and nutritional value of the beans, causing immense economic loss to the producers and severe risk to food security in most developing countries (Savary, 2012). Among the most devastating diseases infecting common beans are Bean Common Mosaic Virus (BCMV) and Bean Common Mosaic Necrosis Virus (BCMNV) (Wani, 2023; Mtonga & Maruthi, 2024).
Plant genera, such as Phaseolus vulgaris, have developed elaborate defense systems against these biotic stresses. Defense responses are established on intricate signal transduction processes, encompassing perception of pathogen-associated molecular patterns (PAMPs), activation of the specific immune responses, and formation of defensive compounds such as Reactive Oxygen Species (ROS) and phytoalexins, that promote resistance against pathogen attack (Khoshru, 2023). However, conventional research has concentrated on disconnected parts of plant immunity, such as single resistance genes, and does not elucidate the higher set of interactions during a pathogenic invasion. A substantial void exists in how plant defense mechanisms are integrated among an extensive group of metabolic pathways and regulatory circuits during infection and multiple pathogen invasions.
Recent advances in genomic technologies, including high-throughput RNA sequencing, have revolutionized our ability to examine gene expression throughout genomes. This shift has provided increasingly comprehensive views of how plants interact with stressors at the molecular level (Yang, 2020; Bharti ., 2024). While traditional transcriptomic analyses have primarily centered on the plant’s intrinsic genes, a novel method known as metatranscriptomics records the entire range of gene expression, both from the plant and its related microbial communities (Tamchek & Lee, 2024). This approach enables a more extensive investigation of plant-pathogen interactions by acknowledging the functions microbial consortia, beneficial and pathogenic, have in modulating plant immune responses.
This study sought to apply genome-wide metatranscriptomics to diseases caused by BCMV and BCMNV on common beans to identify the key metabolic pathways that play a crucial role in plant defense processes. Through the analysis of the gene expression pattern in the plant and the transcriptome of associated microbial communities/multiple pathogens, we aimed to identify the intricate network of metabolic and molecular interactions underlying plant immunity. This holistic strategy serves to define key pathways that are activated during pathogen infections
The primary goal of this study was to characterize the expression of common beans in response to infection by the dual pathogens and determine the primary metabolic pathways involved in defense against pathogens. This approach reveals plant immunity at a deeper level by uncovering the complex relationship between the plant and pathogen stress. The findings in this research can be used to breed more disease-resistant common bean varieties that are better able of fighting diseases better. Knowledge of plant defense mechanisms and pathogens and microbial effects could also lead to novel strategies for sustainable agriculture, reducing the application of chemical pesticides and encouraging more environmentally friendly crop management practices.
Through the disclosure of the critical metabolic and molecular mechanisms that drive plant defense, we can enhance the resistance of common beans against the growing number of diseases targeting its production, thus offering a secure and nutritious source of food for millions of individuals worldwide.
2. Research Methods
Common bean (Rosecoco) disease diagnostic surveys were conducted in April and May 2024 in Kenya’s Western region, which borders Uganda. Kakamega, Busia, Vihiga, Bungoma, and Nandi counties were sampled (Figure 1A). Fifty-one (51) common bean leaf samples exhibiting disease-like symptoms, such as severe or mild mosaic, vein banding, leaf curling, yellowing, and necrosis typical of viral pathogens (Figure 1 and Table 1), were collected in falcon tubes and promptly placed in a container with liquid nitrogen. The samples were preserved in a -80°C cryogenic freezer to maintain their structural integrity until preparation for Enzyme-Linked Immunosorbent Assay (ELISA) analysis, and total RNA extraction was done. Prior to this process, all samples were screened for the occurrence of Bean Common Mosaic Virus (BCMV) and Bean Common Mosaic Necrosis Virus (BCMNV) through the Double Antibody Sandwich Enzyme-Linked Immunosorbent Assay (DAS ELISA) technique. The antibodies utilized for the study were procured from the Leibniz Institute (DSMZ) (German Collection of Microorganisms and Cell Cultures GmbH). Only those samples that were positive for BCMV and BCMNV were then chosen for total RNA isolation.
3. RNA Extraction
Of the 51 samples collected, 15 were the only ones that had mixed infections for BCMV and BCMNV (Kakamega-3, Nandi 3, Bungoma 4, Vihiga 4, and Nandi 1), which were used for RNA extraction with the RNeasy Kit following the manufacturer's instructions. The tubes containing the common beans that were stored in RNAlater were vortexed for 30 seconds. The beans were then extracted from the tubes with sterilized forceps that had been treated with RNAter (Sigma-Aldrich). The suspensions remaining were centrifuged at 6,000 × g for 30 minutes. From the step of washing the pellets to incubation in proteinase K, the pellets were treated as described in the above RNA extraction protocol. After centrifugation at 6,000 × g for 10 minutes, the supernatants were poured into a fresh 15 mL centrifuge tube. To it, 3.5 volumes of RLT buffer (Qiagen) with β-mercaptoethanol and 2.5 volumes of absolute ethanol were added. The resulting mixture was subsequently added to RNeasy Mini columns in 650 μL aliquots until all of the mixture had been added and RNA was then purified following the manufacturer's guidelines using the RNeasy Mini Kit with on-column DNase treatment (Qiagen). The purity, quality, and integrity of the purified RNA were evaluated using bleach-agarose gel electrophoresis (Aranda ., 2012), spectrophotometry (NanoDrop; Thermo Fisher Scientific), and capillary electrophoresis (Bioanalyzer 2100; Agilent Technologies, Santa Clara, CA, United States). The Kakamega, Nandi, and Vihiga samples were merged to form a single composite sample referred to as RVK1. Likewise, all samples from Bungoma were pooled into a single combined sample referred to as RBGM1, and samples from Busia were pooled to make up RBU1. The pooled samples were then submitted to Novogene Limited Company in Singapore for metatranscriptomic analysis and sequencing.
4. Library Construction, Quality Control & Sequencing
First, the prokaryotic and eukaryotic ribosomal RNAs were removed from the total RNA samples. The remaining RNA was broken into fragments of approximately 250–300 base pairs and reverse-transcribed to double-stranded cDNA. The fragments of cDNA were treated with end repair, A-tailing, and adapter ligation. Adapter primers P5 and P7—complementary sequences on the flow cell—were introduced following size selection and PCR amplification. Sequencing primers Rd1 and Rd2 SP were utilized for Read1 and Read2, respectively, and indices were appended to recognize between different libraries. The resultant metatranscriptome library was then sequenced and quality-controlled. The quality of libraries was established by Qubit, real-time PCR quantification, and verification of size distribution by bioanalyzer. Libraries were pooled by effective concentration and required output data, followed by sequencing. Bioinformatics analysis followed, with the workflow as shown in (Figure 2).
5. Data Quality Control
Raw sequencing reads were pre-processed using Fastp (https://github.com/OpenGene/fastp) to provide high-quality clean reads for downstream analysis. Paired-end reads were excluded if either read was adapter-contaminated; if either read had a high ratio (>10%) of ambiguous bases; or when >50% of the bases in either read were low-quality bases (Phred score < 5). To eliminate potential host-derived sequences, clean reads were mapped to a host reference database and any reads matching the host genome were discarded. This was performed using Bowtie2 (http://bowtie-bio.sourceforge.net/bowtie2/index.shtml) with default parameters, i.e.: --end-to-end, --sensitive, -I 200, and 400 (Karlsson ., 2012, 2013; Scher ., 2013)
6. Transcriptome Assembly and Analysis
The central processing strategy was to cluster transcript sequences by length, starting with the longest. Processing began with the longest transcript. If a new transcript was determined to be similar over some threshold to the representative transcript of an existing cluster, it was added to that cluster. Otherwise, a new cluster was formed to accommodate the transcript. This clustering process adhered to the method outlined by the CORSET tool (https://github.com/Oshlack/Corset/wiki). Functional annotation was conducted using DIAMOND (https://github.com/bbuchfink/diamond/), referencing unigenes against various functional databases using blastp and an e-value cut-off of 1e-5 (Li et al., 2014; Feng et al., 2015). Reference databases were KEGG (http://www.kegg.jp/kegg/)(Kanehisa et al., 2006, 2017), eggNOG (http://eggnogdb.embl.de/#/app/home) (Huerta-Cepas et al., 2016), CAZy (http://www.cazy.org/) (Cantarel et al., 2009) and GO (https://geneontology.org/docs/ontology-documentation/). For each sequence, the highest BLAST hit was used for downstream analysis (Qin et al., 2012; Qin et al., 2014; Backhed et al., 2015; Li et al., 2014). Based on these alignments, the relative abundance of sequences at different functional levels was quantified. Relative abundance at a given level was termed the total relative abundance of all genes annotated to that level (Karlsson et al., 2012; Li et al., 2014). From the gene abundance and functional annotations, a table of gene counts per sample at each taxonomic level was computed. The number of genes associated with a given function in a sample was the same as the number of non-zero-abundance genes annotated to that function. Summary statistics, relative abundance profiles, and clustering heatmaps were derived from these abundance tables, along with PCA and NMDS analyses for dimensionality reduction. Clean reads from all samples were mapped to a Trinity-assembled reference transcriptome. Reads with mapping quality < 10, mispaired reads, or reads mapping to more than one position were discarded. Mapping was done using RSEM, with Bowtie2 configured to allow zero mismatches (default setting). For biological replicate group-wise differential expression analysis, the DESeq2 R package (version 1.20.0) was used. DESeq2 applies a negative binomial model to quantify differences in expression. The p-values were adjusted by Benjamini-Hochberg for false discovery rate control. Genes with adjusted p-values < 0.05 were considered as differentially expressed (Koner et al., 2024). Gene Ontology (GO) enrichment of the differently expressed genes was performed using the clusterProfiler R package, which has adjusted for the length bias of the gene. GO terms with adjusted p-values < 0.05 were used (Saif et al., 2022). For KEGG pathway enrichment, the clusterProfiler package (Xu et al., 2024) was utilized. KEGG provides insights into high-level biological functions in cellular, organismal, and ecosystem levels by using data taken from genome sequences and other HT technologies (http://www.genome.jp/kegg/). For predicting Plant-Pathogen Interaction (PPI) for differentially expressed genes, the STRING database (ul Qamar et al., 2024) was employed. For the species that were available in the database, networks were built by retrieving the interaction directly for the given list of genes. For uncovered species, DIAMOND (version 0.9.13) was employed to align gene sequences against protein references from a selected model organism and predict networks from known interactions within that reference.
7. Data Availability and Accession
The raw metagenomic reads were deposited in the NCBI Sequence Read Archive (SRA), where BioSample and SRA accession numbers were subsequently obtained and available for reference (https://www.ncbi.nlm.nih.gov/sra/PRJNA1226238).
8. Results
8.1. Quality Check (QC) of the Transcriptome
The sequenced or raw reads often include low-quality sequences and reads with adapters, which can compromise the quality and reliability of the analysis. To address this, the raw reads were filtered to obtain clean reads. The filtering process involved: Removing reads with adapter sequences, Excluding reads with more than 0.1% ambiguous bases (N). and Discarding low-quality reads, specifically those where over 50% of the bases had a quality score (Qscore) of 5 or lower. The Quality Check results were tabulated as in the (Table 2). RVKI, RBU1, and RBGM1 had raw reads of 37,047.327, 35,629,275, and 44,49699 respectively. The sequences were cleaned as RVK1, RBU1, and RBGM1 to 35,716,390, 34,974,467, and 44,004,580 respectively. The RVK1, RBU1, and RBGM1 error rates were 0.03, 0.02, and 0.02, respectively. From this output, the three samples had high-quality reads (S1), which gave way to subsequent gene expression processing and analysis.
The transcripts and unigenes were classified into four distinct categories: 200bp-500bp, 500bp-1kb, 1kb-2kb, and >2kb. The category exhibiting the highest quantity of transcripts was the range of 200bp-500bp, which comprised 737,712 transcripts, whereas the category with the lowest quantity was that exceeding 2kb, containing 50,538 transcripts. In terms of unigenes, the category with the highest count was again in the range of 200bp-500bp, comprising 290,828 unigenes, while the category with the lowest count was that exceeding 2kb, which included 29,752 unigenes. (Table 3)
The longest transcripts of each cluster were selected as unigenes. Length distribution information of transcripts and unigenes
The minimal length established for both the transcript and gene was 251 base pairs, whereas the maximal length reached 37,763 base pairs. The cumulative number of nucleotides for the transcript and gene amounted to 722,372,701 and 387,683,453, respectively. (Table 4)
The relative abundance of various functional levels was calculated from the alignment results. This was determined by summing the relative abundances of the genes annotated to each specific functional level. The KEGG database is categorized into five levels, the eggNOG database into three levels, and the CAZy database into three levels. (Table 5)
Gene Ontology (GO) is a widely recognized classification system in the field of bioinformatics (see http://www.geneontology.org/). Through GO annotation, genes that are successfully annotated are categorized into three primary GO domains: Biological Process (BP), Cellular Component (CC), and Molecular Function (MF). Each of these domains contains multiple levels, with higher levels providing more detailed annotations (level 1 being the top level). Gene Ontology annotation plays a fundamental role in interpreting the biological significance of genes.
A total of 169,583 genes were annotated in this database. In the Biological Processes category, the largest number of genes were annotated to cellular processes (96,305) and metabolic processes (83,414), while the least was annotated to growth (14) and detoxification (214). In the Cellular Component category, the highest number of genes were annotated to cellular anatomical entities (47,255), while the least were annotated to virion components (2,620). Lastly, in the Molecular Function category, most genes were annotated to binding (74,294) and catalytic activity (80,314), while the least were annotated to cytoskeletal activity (139). Figure 3
8.2. Kyoto Encyclopedia of Genes and Genomes (KEGG)
After mapping the unigenes to the KEGG database within the Cellular Processes category, the largest number of genes were assigned to cellular community prokaryotes (5439), while the fewest were assigned to cellular community eukaryotes (104). In the Environmental Information Processing category, most genes were linked to signaling transduction (7320), while the fewest were linked to signaling molecules and interactions (45). For Genetic Information Processing, the greatest number of genes were associated with drug resistance-antimicrobial (1764). In the Metabolism category, the highest number of genes were related to carbohydrate metabolism (12970), while the fewest were associated with the metabolism of terpenoids and polyketides. Under Organismal Systems, most genes were annotated to the endocrine system (2134). In the Environmental Adaptation category, the largest number of genes were assigned to environmental adaptation (1185), with the fewest assigned to the sensory system (24). (Figure 4).
Most genes across the samples (RVK1, RBU1, and RGBM1) were annotated with metabolism functions at the KEGG level, while the fewest were linked to organismal systems (Figure 5A). In the KEGG-EC category, the highest number of genes were annotated to Histidine kinase (2.7.13.3), with fewer annotations for the remaining categories across all samples (Figure 5B). At the KEGG Module level, the majority of genes were annotated to the Citrate cycle (TCA cycle, Krebs cycle) M00009 in all samples (Figure 5C). At KEGG Level 2, most genes were categorized as "Other (Not assigned)" (Figure 5D). At KEGG Level 3, the largest number of genes were associated with environmental information processing, particularly membrane transport, ABC transporters, and signal transduction systems such as two-component systems (Figure 5E).
For KEGG Pathway Maps, all samples (RVK1, RBU1, and RBGM1) were annotated to pathways such as the Biosynthesis of secondary metabolites (ID Map 01110), 2-Oxocarboxylic acid metabolism (Map 01210), and Biosynthesis of amino acids (Map 01230), which are involved in pathway-level metabolism and biochemical processes (S2).
In the KEGG mPath analysis, all samples were annotated at Level 1 to pathways like Aminoacyl-tRNA biosynthesis (Map 00970), PD-L1 expression, and PD-1 checkpoint pathway in cancer (Map 05235), and Human immunodeficiency virus 1 infection (Map 05170), corresponding to categories like Genetic Information Processing, human diseases, and human diseases, respectively. At Level 2, these pathways were linked to Translation, Cancer Overview, and Infectious Disease: Viral. At Level 3, annotations remained consistent with Aminoacyl-tRNA biosynthesis, PD-L1 expression, PD-1 checkpoint pathway in cancer, and Human Immunodeficiency Virus 1 infection (S2).
Principal Component Analysis (PCA) was performed based on the functional abundance from various databases at different classification levels. In the PCA plot, samples that have more similar functional components were positioned closer to each other. The results of the PCA analysis, based on the functional abundance at KEGG Level 2, Level 3, and KO levels, indicate that the samples were significantly different: (Figure 6).
Evolutionary genealogy of genes: Non-supervised Orthologous Groups (EggNOG) is a comprehensive database of orthologous gene groups. These groups are annotated based on the Smith-Waterman alignment algorithm, which enables the identification and classification of genes that share an evolutionary history. Currently, EggNOG includes approximately 721,801 orthologous groups across 1,133 species. Notably, 62.5% of these groups are associated with detailed annotation information that can be utilized for further EggNOG annotations.
The annotation process involves mapping gene sequences to the EggNOG database using a BLAST alignment approach, with an expected e-value threshold of 1e-5. Once the gene sequence is mapped, the corresponding COG (Clusters of Orthologous Groups of Proteins) is identified, linking the gene to a specific functional group. To quantify the prevalence of a particular COG, the abundance of genes associated with that COG is summed, providing a measure of its relative abundance
At the EggNOG level one, the samples showed the highest number of annotated genes across various functions: RVK1 had 52,146 genes, RBU1 had 51,672 genes, and RBGM1 had 52,491 genes. The functions with the most annotated genes were replication, recombination, and repair, which accounted for 39,003 genes, followed by amino acid transport and metabolism with 27,462 genes, and carbohydrate transport and metabolism with 16,110 genes. In contrast, the fewest genes were annotated to nuclear structure, with only 76 genes, and extracellular structures, which had 161 genes. (Figure 7A)
At EggNog level 2, the functions with the highest number of genes were Transposition, RNA mediated, Transposition, Transposase, and inactivated derivatives, and Uncharacterized protein K02A2.6-like with 25154, 25300, 25271, and 6726 genes respectively. (Figure 7B). At Egg Nog level 3, the highest annotation was gene Transposase InsO of transposable element IS3, Rve (retroviral integrase) family (COG2801) and encompasses genes linked to translation processes, particularly rRNA maturation and tRNA modification (ENOG50KOG0017) with 25257 and 25135 unigenes (Figure 7C)
The CAZy database catalogues families of enzymes that share structural similarities in their catalytic and carbohydrate-binding modules (or functional domains) involved in the degradation, modification, or creation of glycosidic bonds. The enzyme classes currently included are Glycoside Hydrolases (GHs), Glycosyl Transferases (GTs), Polysaccharide Lyases (PLs), Carbohydrate Esterases (CEs), Auxiliary Activities (AAs), and Carbohydrate-Binding Modules (CBMs). Gene clusters were mapped to the CAZy database using the hmmsean tool, with an expected e-value of 1e-5. Once the carbohydrate enzyme annotations were obtained, the abundance of carbohydrate enzymes was calculated by summing the gene abundances associated with each enzyme.
The genes were assigned to the following categories: Glycosyl Transferases (GT) with 10,686 genes, Glycoside Hydrolases (GH) with 8,427 genes, Carbohydrate-Binding Modules (CBM) with 2,274 genes, Carbohydrate Esterases (CE) with 1,003 genes, Auxiliary Activities (AA) with 440 genes, and Polysaccharide Lyases (PL) with 263 genes. (Figure 8A)
At CAZy level 2, the genes were classified into the following subfamilies: GT2 with 1,953 genes, GT4 with 1,839 genes, GT32 with 1,754 genes, GT1 with 1,675 genes, GT48 with 1,434 genes, GH38 with 925 genes, GH13 with 878 genes, and CE8 with 483 genes. (Figure 8B)
At CAZy level 2, the genes were classified into the following categories: N-acetylglucosaminyltransferase (EC 2.4.1.-) with 1,953 genes, N-acetylgalactosaminyltransferase (EC 2.4.1.-) with 1,953 genes, UDP-Galf: galactofuranosyl-galactofuranosyl-rhamnosyl-N-acetylglucosam. (1,953 genes), UDP-Galf: rhamnopyranosyl-N-acetylglucosaminyl-PP-decaprenol beta-1,4... (1,953 genes), [inverting] UDP-Glc: glycocin S-beta-glucosyltransferase (EC 2.4.1.-) with 1,953 genes, and [inverting] UDP-Glc: protein O-beta-glucosyltransferase (EC 2.4.1.-) with 1,953 genes, among others. (Figure 8C)
8.3. Differentially Expressed Genes
For RBGM1 vs RBU1, a total of 21,644 genes were differentially expressed, with 13,774 being upregulated and 7,870 downregulated. For RVK1 vs RBU1, there were 20,858 differentially expressed genes, with 12,238 upregulated and 8,620 downregulated (Figure 9)
Cluster analysis was employed to identify genes with similar expression patterns across various experimental conditions. By grouping genes with comparable expression profiles, it becomes possible to uncover the functions of previously characterized genes or to predict the functions of uncharacterized genes. In hierarchical clustering, different colour zones represent distinct gene clusters, with genes within the same cluster potentially having related functions or participating in the same biological processes. Alongside the FPKM cluster, the H-cluster was used to group the log2 ratios. Genes within each cluster displayed consistent trends in their expression levels across different conditions. (Figure 10)
Through comprehensive analysis of differentially expressed genes, it is possible to identify the biological functions or pathways that exhibit significant associations with these genes. A prevalent approach for identifying common functions among genes involves utilizing the biological knowledge encompassed within various biological ontologies. The Gene Ontology (GO) framework categorizes genes according to biological processes, molecular functions, and cellular components within a directed acyclic graph format. In contrast, the Kyoto Encyclopedia of Genes and Genomes (KEGG) annotates genes at the pathway level.
Comparing Bungoma ( RBGM1) and Busia (RBU1) samples, the upregulated genes, according to Gene Ontology, were primarily associated with the following functions, listed from highest to lowest: DNA binding transcription factor activity, DNA binding, cellular nitrogen compound metabolic processing, biosynthetic processes, oxidoreductase activity, and transposition, cofactor metabolic process, DNA metabolic process, methyl transferase activity, lipid metabolic process, small molecule metabolic process, ATPase activity, lyase activity signal transduction, Sulphur compound metabolic process, transmembrane transport, plasma membrane, transferase activity, transferring acyl g, cellular amino acid metabolic process, and peptidase activity. (Figure 11 A & B). To compare Vihiga/Kakamega (RVK1) and Busia (RBU1), the upregulated genes, based on Gene Ontology, were linked to the following functions in descending order: DNA binding transcription factor activity, oxidoreductase activity, DNA binding, biosynthetic processes, transposition, cellular nitrogen compound metabolic processing, small molecule metabolic process, lyase activity, transmembrane transport, methyl transferase activity, DNA metabolic process, lipid metabolic process, cofactor metabolic process, transferase activity, transferring acyl g, peptidase activity, transport, transmembrane transporter activity, hydrolase activity, acting on glycosyl, signal transduction and transferase activity acting on glycos Gene ontology enrichment analysis identified significant genes associated with the Metabolic Process, particularly the biosynthetic process (GO: 0009058) and the cellular nitrogen compound metabolic process (GO:0034641). Under the Cellular Component, notable genes were annotated to the plasma membrane (GO:0005886), external encapsulation (GO:0030312), plastid (GO:0009536), and lipid droplet (GO:0005811). In terms of Molecular Functions, significant genes were linked to oxidoreductase activity (GO:0016491) and DNA-binding transcription (GO:0003700) (Figure 11 C D E F & G).
In the enrichment analysis in KEGG for RBGM1 vs RBU1, the pathways were annotated in the following order, from highest to lowest: ABC transporters, two-component system, bacterial chemotaxis, cationic antimicrobial peptide (CAMP), flagellar assembly, biofilm formation in Vibrio cholera, biofilm formation in Escherichia coli, drug metabolism-P450, atrazine degradation, arginine and proline metabolism, and hepatocellular carcinoma. (Figure 12 A)
In the enrichment analysis in KEGG for RVK1 vs RBU1, the functions were annotated in the following order, from highest to lowest: Two-component system, Flagellar assembly, Bacterial secretion system, and Quorum sensing were the most significant (Figures 12 B)
The KEGG pathway annotation identified the following pathways: the biosynthetic pathway of ansamycins, the biosynthetic pathway of siderophore group non-ribosomal peptides, the biosynthetic pathway of vancomycin group antibiotics, the biosynthetic pathway of enediyne antibiotics, the metabolic pathway of 2-oxocarboxylic acids, the degradation pathway of aromatic compounds, the biosynthetic pathways of amino acids, the mechanisms underlying beta-lactam resistance, the mechanisms of cationic antimicrobial peptide (CAMP) resistance, the mechanisms of antifolate resistance, and the mechanisms of platinum drug resistance.
In KEGG Scatter results, the most prominent system in the comparison of Bungoma and Busia samples was the two-component system, which had a gene count of 400, along with the ABC transporters. Additionally, the bacterial taxis system, with 200 gene counts, was also noteworthy Figure 13. In the comparison of Vihiga/Kakamega samples, the two-component system again emerged as the most significant, with 400 genes. Other notable systems included bacterial chemotaxis, bacterial secretion systems, and flagellar assembly (Figure 13).
9. Discussion
The study of plant defense mechanisms has gathered significant attention in recent years, particularly regarding crop resilience against diseases. Common beans (Phaseolus vulgaris L.), a staple food source worldwide, are particularly susceptible to pathogens including viruses that can severely influence yield and quality (Uebersax ., 2023). Comprehending the fundamental metabolic pathways that govern these defense responses is essential for developing effective strategies for disease management. In this investigation, common bean, gene, and protein sequence comparisons with functional databases such as KEGG, GO, CAZy, and EggNOG were viewed as part of the necessity for large-scale functional annotation. KEGG was utilized to determine host pathways affected by viral infection, such as plant defense response pathways and metabolic regulation pathways. GO annotations unraveled the biological processes, cellular components, and molecular functions involved as they relate to viral and host genes, most notably of relevance to viral replication mechanism and immune response. Even though CAZy is largely linked with carbohydrate-active enzymes, its usage in viral work has unveiled modifications to host cell walls that might affect virus dissemination and symptomatology. Additionally, EggNOG has enabled gene function prediction via the analysis of orthologous relationships that support the characterization of new or poorly annotated sequences (McCartney et al., 2024). Overall, the combination of these databases has been claimed’
The top annotated biological processes in the Gene Ontology (GO) database were cellular components and metabolic processes which are essential in preserving cellular organization and responding to stressors such as pathogenic invasions (Marmion et al., 2022). For instance, cellular processes including signaling pathways enable the pathogen to detect and respond to pathogens (Wang ., 2022), however, metabolic processes involving the synthesis of secondary metabolites might function as metabolites with antimicrobial properties (Kumar, Korra, ., 2023). Biological Processes (BP), Cellular Components (CC), and Molecular Functions (MF) may further reveal the genetic basis of the mechanism of resistance/susceptibility of beans against these viral diseases. Common Beans, like many plants, produce specialized metabolites (especially flavonoids, and alkaloids) as a part of their defense system against microbial invaders (Saini ., 2024). The fact that so many genes were assigned to these categories might indicate that common beans depend on these processes to effectively defend against diseases. By contrast, processes like growth and detoxification are understated. Growth is frequently regulated during infection (Zhao & Li, 2021); the plant may redirect its energy to defense rather than growth. Detoxification pathways, which are involved in deactivating toxins produced by pathogens or generated by stress, are critical in resisting pathogen-induced damage (Nadarajah, 2024; Sahu ., 2022). The low number of genes assigned to detoxification function may point to a specialized response elicited in specific circumstances, rather than a common feature in the defense strategy of common beans. In the Cellular Component category, the largest group of genes were assigned to cellular anatomical entities, which included structures such as the plasma membrane, cytoplasm, and nucleus (Jha & Mohamed, 2022; Singh et al., 2024). These cellular structures are directly involved in plant defense mechanisms. For example, the plasma membrane is the first line of defense against pathogens and contains receptors that recognize pathogen-associated molecular patterns (PAMPs) (Alghsham ., 2022). Pathogen attack frequently leads to speedy changes in cellular structures to stop the spread of the infection (Kaur, 2022).
The small number of genes annotated to virion components shows a relatively minor role that viral components play, which is interesting in the context of viral diseases in beans, such as the BCMNV or BCMV. These annotations may seem to indicate while viral diseases are a concern, the gene pool studied may not be heavily dedicated to viral resistance. Nonetheless, the occurrence of viral-related genes still offers important insights into the molecular basis of resistance mechanisms, such as RNA silencing and defense against viral reproduction. In the Molecular Function category, binding and catalytic activity were the most annotated functions. These are critical for plant immunity, as they are involved in signaling, enzymatic reactions, and the activation of defense pathways (Appu et al., 2021; Dos Santos & Franco, 2023). For instance, binding proteins may recognize pathogen molecules, while enzymes can catalyze reactions that produce defense-related compounds, such as reactive oxygen species (ROS), that inhibit pathogen growth (Akbar ., 2023). The abundance of genes assigned to these functions emphasizes the importance of these molecular activities in the plant's ability to battle a variety of pathogens.
Equally, the small number of genes annotated to cytoskeletal activity may indicate that although the cytoskeleton is important for maintaining cellular structure and facilitating the movement of signaling molecules (Lian ., 2021), it plays a more indirect role in disease resistance. Cytoskeletal reorganization is often a stress response (Kumar, Jeevaraj, ., 2023), but the relatively low annotation count shows that its role in disease defense may not be as central as other molecular functions, such as binding and catalysis. The distribution of gene functions suggests numerous possibilities for improving disease management in common beans. Studying the genes involved in cellular processes, metabolic pathways, and defense-related functions can guide the improvement of bean cultivars with enhanced resistance to pathogens. Similarly, genes annotated to cellular components like the plasma membrane might be leveraged to improve resistance to viral infections, which is a major constraint to common bean production. Moreover, understanding the lower occurrence of detoxification and growth-related genes might offer new approaches to handling stress responses. For example, regulating growth pathways during infection may help redirect resources toward defense rather than growth, potentially improving plant survival and productivity during disease eruptions.
In the Cellular Processes class, the highest number of genes were assigned to "cellular community prokaryotes," reflecting the importance of microbial or prokaryotic-like processes in cellular activities. This may illustrate that these genes participate in symbiotic or associative interactions with prokaryotes, or that certain cellular methods in the organism have characteristics like those of prokaryotes (Spitzer, 2024). In contrast, only a few genes were assigned to "cellular community eukaryotes, indicating that these processes are less prominent or less relevant to the organism's biology compared to prokaryotic cellular activities.
In the Environmental Information Processing class, the highest number of genes were attributed to "signaling transduction, proving that these genes may be involved in the mechanisms that transmit information inside the cell and enable organisms to respond to various ecological stimuli. Signaling transduction plays an important role in such processes as stress response, immune responses, and developmental regulation (Su ., 2024). In contrast, only 45 genes were annotated to "signaling molecules and interactions," indicating that fewer genes may be involved in the manufacture or direct interaction with signaling molecules themselves rather than the transduction of their signals within the cell. Within the Genetic Information Processing class, the largest annotation was to "drug resistance-antimicrobial. This shows that organisms have developed a vigorous set of genes involved in resistance mechanisms against viral pressures, which are particularly relevant in agricultural settings where pathogens may affect crop health (Solanki & Das, 2024). This could also reflect the organism's ability to tolerate environmental stressors like pesticides or fungicides.
The Metabolism category demonstrated that the highest number of genes were associated with "carbohydrate metabolism," emphasizing the central role of carbohydrate breakdown and synthesis in the organism’s energy production and storage. Carbohydrate metabolism is necessary for plant development and stress tolerance (Krasavina ., 2014), and these findings may indicate the organism's competence in using available sugars and starches. On the other hand, the least genes were linked with the "metabolism of terpenoids and polyketides," processes linked to the production of specialized metabolites, often involved in plant defense mechanisms (Weng ., 2021; Al-Khayri ., 2023; Ahmad ., 2024). The low occurrence of these genes suggests that terpenoid and polyketide production is less central or specialized in this particular organism matched to carbohydrate metabolism. Under Organismal Systems, the highest number of genes were assigned to the "endocrine system". Seemingly this shows that hormonal signaling and regulation are critical for the organism’s overall health and development. The endocrine system plays a significant role in controlling development, stress responses, and reproductive practices in plants (EL Sabagh ., 2022). On the other hand, the Environmental Adaptation category showed the most annotated genes. were associated with general "environmental adaptation," which could involve reactions to abiotic stresses like drought, temperature extremes, or nutrient availability (Chang et al., 2024). The fewer genes assigned to the "sensory system," indicate that sensory functions, which may relate to identifying light, gravity, or chemical signals, are not as common.
Kyoto Encylopaedia of Genes and Genomes pathway analysis further overemphasized the fact that a majority of genes across all the samples were from RVK1, RBU1, and RBGM1, anointed to metabolic functions. This underlines the fact that metabolism forms the core aspect of the studied organism's biology. Thus, remarkably, the fewest genes were related to "organismal systems," suggesting that though the metabolism is well represented in the organism, its physiological systems are less. The KEGG-EC level was dominated by the enzyme classification histidine kinase (EC "2.7.13.3,") participating mostly in kinases, basically phosphorylation processes; this expresses the role of protein adjustment in executing cellular activities inclusive of signaling and stress responses (Abulfaraj et al., 2024). Other annotations had fewer gene representations, emphasizing the specificity of kinase activity within the biology of the organism.
In the KEGG Module analysis, most of the genes were associated with the Citrate cycle (TCA cycle, Krebs cycle) pathway module ("M00009,") which might point out some sort of metabolic pathway common among the samples. The Citric Acid Cycle (TCA cycle or Krebs cycle) is a crucial metabolic pathway that serves as the final common pathway for the oxidation of carbohydrates, fats, and proteins, generating energy in the form of ATP through the electron transport chain(Yanamadala, 2024). It also provides essential building blocks for biosynthesis. At KEGG Level 2, many genes were shown in the category "Other (Not assigned)," reflecting the possible gaps in the current knowledge of gene functions and their annotations. At KEGG Level 3, most of the genes were involved in "environmental information processing," with the majority found in "membrane transport" (ABC transporters) and "signal transduction-two-component systems." These results have thus indicated that the ability of the organism to react against its environment is mainly controlled by transport systems and signaling pathways, important for adaptation to external factors such as nutrients, toxins, or pathogens (Zhu et al., 2024).
The different levels of the EggNOG annotation for genes have given insight into how molecular functions may underpin resistance or susceptibility in common bean plants against viral diseases. Hence, studying the functions with the highest and lowest number of annotated genes allows some inferences about the immune mechanisms of the plant regarding its response toward a suite of pathogens. The most annotated functions at EggNOG level 1 were "replication, recombination, and repair" with genes, followed by "amino acid transport and metabolism", and "carbohydrate transport and metabolism". These processes are important for plant health because they maintain the integrity of the genome and support energy production, both in high demand during a viral outbreak. For example, "replication, recombination, and repair" have a vital role in the stability of the genome under stress conditions, such as viral, bacterial, or fungal infections, as stated by Masnovo . (2022). The disruption in these pathways would result in an increase in the susceptibility to diseases within the plant. Strong representation of these functions hints that the maintenance of genomic integrity and repair of damage induced by pathogens is one of the key defenses in common beans. Similarly, the annotation of genes involved in "amino acid transport and metabolism" gave the plant's capabilities of synthesizing and transporting building blocks for the proteins critical for immune responses, such as defense-related enzymes or signaling molecules. Carbohydrates are critical in providing energy that supports all immune responses and other metabolic reactions (Lika & Fan, 2024); therefore, the large number of genes functioning in "carbohydrate transport and metabolism" further underlines their importance to the plant's overall ability to resist disease. Only a few genes were involved in "nuclear structure" and "extracellular structures". Such categories may have some implications for maintaining cellular architecture in the plant or communicating to the surrounding tissues; they are less directly involved with the plant response against pathogen attack. Be that as it may, the physical integrity of such structures as a cell wall is still important in defense against infections, especially those originating from fungi or bacteria targeting plant cells (Munzert & Engelsdorf, 2025). At EggNOG level 2, the functions with the most annotated genes were "Transposition, RNA mediated" genes, "Transposase, and inactivated derivatives", and "Uncharacterized protein K02A2.6-like". Transposable elements (TE) are those that, though being genetic, can change places within the genome. These are often associated with genetic adaptation. In the event of a pathogen attack, plants may mobilize TEs to introduce genetic variation in response to such new threats. Such shuffling of genes may result in the appearance of beneficial mutations, enhancing resistance against diseases (King, 2024). The abundance of the transposon-related genes in the dataset makes it likely that mobility plays a serious role in how common beans behave against these diseases. It gives, in other words, the frequency of genes that are annotated as "Uncharacterized protein K02A2.6-like", thus indicating a huge area within plant biology for which not enough knowledge exists. On EggNOG level 3, the greatest numbers of genes were annotated at Transposase InsO of transposable element IS3 ("COG2801") and encompasses genes linked to translation processes, particularly rRNA maturation and tRNA modification ("ENOG50KOG0017"); these probably stand for essential features of cellular functioning either under metabolism or because of stress conditions. With such a high representation of these genes, they can be related to basic processes involved in their maintenance of cell functions, enabling the development of the ability to resist or combat disease effectively by the rapid initiation of a defense-related expression. That being the case, common beans perhaps heavily rely on more basic aspects like replication, repair, and metabolism for disease resistance, while also relying on genetic variation mechanisms like transposition to adapt to new or evolving pathogens (Baduel & Quadrana, 2021). Although the few annotated genes relating to nuclear and extracellular structures may be indicative of their less central role in immune defense, these structures do contribute to the general health of the plant in their own way and the physical prevention of pathogen entry. The results of gene annotation underline metabolic processes, mechanisms of DNA repair, and genetic adaptability as playing a central role in the disease resistance of common beans. While most genes related to basic functions of replication, recombination, and metabolism are integrated into the host's defense mechanism, other genes in the genome about transposition and uncharacterized proteins may offer the prospect of discovering novel pathways toward broadened disease resistance in the future. This might enable further research in these aspects to identify new targets, enhancing disease resistance in common beans by making them more vigorous and resilient.
The classification of carbohydrate-active enzymes, otherwise known as CAZymes, is important in understanding how such enzymes participate in the plant's response to stress and pathogens or diseases. These enzymes in CAZy represent the central node in carbohydrate metabolic pathways, which play a vital role in both the plant defense mechanism and the degradation of the pathogen (Alshareef, 2024). Glycosyl Transferases represent the most abundant family and are responsible for complex carbohydrate biosynthesis like cell wall components, which provide integrity and play critical roles in the plant defense machinery.(Marcianò ., 2024; Molina ., 2024). For diseased common beans, the synthesis of cell wall polysaccharides, such as pectin and cellulose, plays an important role in fortifying the plant's physical barriers against pathogen invasion (Lu ., 2024; Swaminathan ., 2022). The occurrence of glycosyltransferases, such as N-acetylglucosaminyltransferase and N-acetylgalactosaminyltransferase, could be linked to the production of complex carbohydrates involved in these defense responses (Majeed ., 2024), influencing the plant’s resistance to diseases.
Glycoside Hydrolases (GHs), are enzymes that break down complex carbohydrates into simpler sugars, a process that can be utilized by the plant to release stored energy during stress (Buckeridge, 2023). In the case of diseased beans, this breakdown could be essential for providing the plant with the necessary metabolic resources to combat pathogen-induced damage. Moreover, GHs are often involved in the plant’s response to pathogen-associated molecular patterns (PAMPs), which activate the immune response. For instance, GHs like GH38 and GH13 (involved in the degradation of cellulose and other polysaccharides) could contribute to the plant’s ability to degrade fungal cell walls or other pathogen structures (Gharechahi ., 2023).
Carbohydrate-binding modules (CBMs) were present in 2,274 genes, and these modules are typically involved in the interaction with polysaccharides. They help enzymes localize to substrates, making them more efficient in degrading or modifying carbohydrate structures (Forsberg & Courtade, 2023). In diseased common beans, CBMs may play a role in the plant’s ability to detect and bind to invading pathogens and their products, contributing to the stimulation of defense mechanisms. Carbohydrate Esterases (CEs) are possibly involved in modifying carbohydrate structures by removing ester groups. These enzymes might contribute to the modification of cell wall components, which could influence the plant's ability to defend against pathogen invasion (Molina ., 2024). For example, modification of pectin could affect the rigidity and permeability of the cell wall, impacting the plant’s resistance to pathogenic organisms (Basak & Annapure, 2022).
Auxiliary Activities (AAs) and Polysaccharide Lyases (PLs) are similarly involved in carbohydrate metabolism, though they play more specialized roles. Auxiliary Activities may help oxidize carbohydrate structures, potentially assisting in the breakdown of complex carbohydrates during a pathogen attack (Cerutti ., 2021). Polysaccharide Lyases, on the other hand, can break down the polysaccharides found in bacterial or fungal cell walls, potentially playing a role in defense against specific types of pathogens (Balducci ., 2023).
The high number of genes classified into subfamilies at CAZy level 2, such as GT2, GT4, GT32, and GT1, indicates the presence of a complex system of enzymes that may be involved in the plant’s adaptive responses to disease. N-acetylglucosaminyltransferase and N-acetylgalactosaminyltransferase play an important role in the development, of immune function (Kadirvelraj ., 2021), and modification of plant cell walls or the synthesis of defense-related carbohydrates like chitin or galactomannan, which can influence pathogen recognition and resistance (Munzert & Engelsdorf, 2025).
Differentially expressed genes (DEGs) analysis has been reported as a key method for identifying genes that undergo significant changes in expression across various biological conditions. In this study of common bean virus research, DEG analysis facilitated the detection of host genes that are either upregulated or downregulated as a result of viral infection. These genes have often been associated with defense mechanisms, hormone signaling, stress response regulation, and other vital physiological processes. DEG analysis provides essential insights into the molecular basis of host-pathogen interactions and enhances the understanding of critical elements involved in plant immune responses (Yadav et al., 2023). Additionally, the identification of DEGs has been instrumental in pinpointing potential resistance genes and has significantly contributed to the development of targeted disease management and crop improvement strategies.
The investigation and analysis of differential gene expression observed between RBGM1 vs RBU1 and RVK1 vs RBU1 offers valuable insights into the molecular reactions of beans under biotic stress conditions. The large number of differentially expressed genes observed in RBGM1 vs RBU1 and RVK1 vs RBU1—demonstrated that biotic stressors contributed to significant changes in gene activity, potentially related to disease resistance or vulnerability. Common bean viruses, BCMV and BCMV can provoke substantial changes in gene expression as the plant responds to pathogenic threats (Mtonga & Maruthi, 2024). For example, genes that are upregulated could be involved in defense mechanisms, such as the activation of hypersensitive response (HR), which includes programmed cell death at the site of infection to limit pathogen spread. Alternatively, upregulated genes may be involved in the production of secondary metabolites like phytoalexins, which have antimicrobial properties that help the plant resist infection (Saini et al., 2024). The specific variation between RBGM1 and RVK1 conditions could indicate differences in either disease resistance mechanisms or responses to different types of pathogens. For instance, RBGM1 may be associated with a particular resistance trait that activates more vigorous or diverse defense pathways, while RVK1 may respond differently based on the nature of the pathogen or the environmental conditions under which the plants were grown. The overlap in upregulated and downregulated genes across these conditions points to common stress response pathways, but the differences could reveal unique features of resistance or susceptibility that warrant further investigation. In the RBGM1 vs RBU1 comparison, the most highly upregulated functions were related to DNA binding transcription factor activity and DNA binding, both of which are critical for the regulation of gene expression. When attacked by pathogens, plants often activate a broad network of transcription factors to regulate the expression of defense-related genes. This suggests that in the RBGM1 condition, likely linked to a disease-resistant variety or a specific pathogen response, the plant may be orchestrating a synchronized defense response involving complex regulation of gene expression. Transcription factors are typically involved in activating or repressing the expression of genes involved in pathogen recognition, hypersensitive response, and the production of antimicrobial compounds (Campos ., 2022; S. H. Wani ., 2021).
The upregulation of genes involved in cellular nitrogen compound metabolic processing in RBGM1 shows a shift in nitrogen metabolism, which may be related to enhanced synthesis of amino acids, proteins, and secondary metabolites required for immune responses. Nitrogen is an essential element for the synthesis of many molecules involved in plant defense, including proteins, enzymes, and phytoalexins (Sun ., 2020). Phytoalexins are antimicrobial compounds that plants produce in response to pathogen infection (Tiku, 2020), which suggests that the upregulation of nitrogen metabolism may be part of a wider effort to activate these defensive mechanisms. Additionally, the increase in oxidoreductase activity indicates an intensified response to oxidative stress, a common result of pathogen attack. Pathogens often trigger the production of reactive oxygen species (ROS), which can damage cellular structures (Shetty ., 2008; Sahu ., 2022). By upregulating oxidoreductase enzymes, the plant may be enhancing its ability to decontaminate ROS and alleviate the damaging effects of oxidative stress. In contrast, the upregulation of transposition-related genes suggests that the plant might also be activating transposable elements in response to disease. While the role of transposition in disease response is not fully understood, some studies suggest that transposable elements may facilitate genomic rearrangements or the activation of defense-related genes (Aller ., 2023), potentially providing the plant with a more rapid or flexible response to changing pathogen pressures.
The comparison of RVK1 versus RBU1 revealed that many of the functional categories were similarly represented among the upregulated genes, though their relative prominence varied significantly. The higher ranking of oxidoreductase activity in RVK1 compared to RBGM1 suggested that the plant under RVK1 was exposed to a stronger oxidative challenge, possibly due to a different type of disease severity. This observation implies that the plant may have prioritized oxidative stress management over a traditional immune response, focusing more on detoxifying Reactive Oxygen Species (ROS) and maintaining cellular integrity rather than engaging other defense processes. Both comparisons showed upregulation of genes associated with biosynthetic processes, transposition, and nitrogen compound metabolism, but the rankings hinted at some degree of fine-tuning in the plants' responses. Specifically, RVK1 appeared to prioritize managing oxidative stress, while RBGM1 may have focused more on transcriptional regulation and nitrogen metabolism as part of its immune strategy. In both RBGM1 versus RBU1 and RVK1 versus RBU1, the upregulation of genes reflected a wide range of biological responses aimed at managing stress caused by infection, with Gene Ontology (GO) functional annotation revealing key functions critical for plant defense (Upadhyay et al., 2024).
For the RBGM1 versus RBU1 comparison, the most enriched functions included DNA binding transcription factor activity and DNA binding, indicating a strong regulatory response at the genetic level. Transcription factors play a key role in turning genes on or off to enable the plant to respond to stress (Abdel-Hameed ., 2024). Cellular nitrogen compound metabolism was also notably upregulated, signifying an increased demand for nitrogen to support protein synthesis and other nitrogen-containing molecules crucial for plant resistance. Additionally, the upregulation of biosynthetic processes pointed to the production of secondary metabolites or compounds involved in plant immune responses. Oxidoreductase activity, involved in managing oxidative stress, was also prevalent, as pathogen infection often leads to increased ROS, and oxidoreductases help neutralize such damage (Alves ., 2025; Songire & Patil, 2025). Transposition and DNA metabolic processes were upregulated, indicating a genomic response to stress that may facilitate adaptation or repair mechanisms. Other upregulated processes included lipid metabolism, small molecule metabolism, and ATPase activity, all of which are essential for maintaining cell integrity, survival under stress, and energy production critical to defense signaling (Samsami & Maali-Amiri, 2024; Thiruvengadam ., 2024).
In the case of RVK1 versus RBU1, the upregulated genes highlighted the importance of DNA-binding transcription factor activity and oxidoreductase activity, which were also seen in RBGM1, reflecting similar stress responses. RVK1, however, was more involved in processes related to transmembrane transport, which emphasized the importance of nutrient and signal exchange across membranes during disease. Additionally, the induction of methyl transferase activity and DNA metabolic processes indicated active adjustments in epigenetic regulation and genomic stability under viral stress (Olmo-Uceda et al., 2024). Both comparisons revealed upregulation of peptidase activity, related to protein turnover and removal of damaged proteins, and lyase activity, involved in breaking chemical bonds relevant for stress adaptation. Signal transduction processes, which coordinate the plant's response to external stimuli, were upregulated in both comparisons as well.
Pathway enrichment analyses from the Kyoto Encyclopedia of Genes and Genomes (KEGG) for RBGM1 versus RBU1 and RVK1 versus RBU1 provided an overview of the plant’s molecular response to infection and stress. In the RBGM1 versus RBU1 comparison, certain pathways were notably enriched. The upregulation of ABC transporters suggested the active involvement of the plant in transporting molecules, possibly antimicrobial compounds or signaling molecules, to combat infection (Asif ., 2024). Activation of the two-component system pathway indicated the plant's response to external signals, likely from pathogens, adjusting its defense strategies accordingly. The bacterial chemotaxis pathway reflected the plant's ability to monitor bacterial movement and presence, enhancing its defensive response. Another key observation was the upregulation of pathways related to cationic antimicrobial peptides, which are crucial for direct defense through membrane disruption. The plant also appeared to engage in drug metabolism via a P450 pathway, likely linked to detoxification processes against noxious compounds produced by pathogens or abiotic stresses. Other pathways, such as the degradation of atrazine, pointed to the plant's ability to cope with environmental stress, while the upregulation of arginine and proline metabolism reflected the need for these amino acids to manage cellular stress and osmoregulation during infection (Deng et al., 2024). Interestingly, the hepatocellular carcinoma pathway was upregulated, suggesting that stress responses within the plant could resemble those in animals, contributing to cellular repair and resilience during pathogen attack (Khan ., 2024; Liu ., 2024).
For the RVK1 versus RBU1 comparison, a different set of enriched pathways emerged. The two-component system remained a crucial pathway, again highlighting its central role in responding to pathogen signals. In addition, pathways related to flagellar assembly and bacterial secretion systems pointed toward bacterial motility and the secretion of virulence factors by pathogens, indicating an active response by the plant to prevent further infection (Asif et al., 2024). Other significant pathways upregulated in RVK1 included those associated with quorum sensing, which involves the plant responding not just to the presence but also the density of bacteria, likely modulating its defense response accordingly. Additionally, various biosynthetic pathways related to antibiotic production, such as ansamycins, siderophores, vancomycin, and enediyne antibiotics, were enriched in RVK1, suggesting that the plant was producing compounds to counter the pathogen. Pathways associated with antibiotic resistance mechanisms, such as beta-lactam and CAMP resistance, were also activated, indicating the plant's ability to neutralize bacterial resistance strategies (Belay et al., 2024). Upregulation of metabolic pathways involved in the metabolism of 2-oxo carboxylic acids, aromatic compound degradation, and amino acid biosynthesis pointed to metabolic changes supporting the plant's defense response.
The KEGG scatter analysis comparing Bungoma and Busia samples indicated that the two-component system was the primary biochemical pathway. This system, central to how bacteria react to environmental changes, was especially relevant in the context of infections from the Bean Common Mosaic Virus (BCMV) and Bean Common Mosaic Necrosis Virus (BCMNV). The higher number of genes associated with the two-component system suggested that bacterial responses are crucial in the plant’s defense against these viral threats. The bacterial taxis system found in these samples might explain how bacteria move in response to environmental triggers, such as immune responses or infection sites, and may influence microbial community composition during BCMV and BCMNV infections. In the Vihiga and Kakamega samples, the two-component system again featured prominently, emphasizing its importance in viral pathogen responses. Other pathways noted included bacterial chemotaxis, secretion systems, and flagellar assembly, which play significant roles in how bacteria interact with the plant and its immune system. These pathways suggest that bacterial motility and secretion of virulence factors could impact infection severity, while flagellar assembly affects bacterial movement and invasion. Overall, the KEGG scatter analysis highlighted that several bacterial systems, particularly the two-component system, bacterial chemotaxis, and secretion systems, are key to the plant’s defense against BCMV and BCMNV. These pathways suggest that microbial communities play a critical role in shaping the plant's immune responses, which could influence the severity of viral infections. The overlap of plant defense mechanisms against viral and microbial pathogens underscores the complexity of the plant immune system and its ability to respond to diverse threats.
10. Conclusions
This study highlights the intricate and multi-layered plant defense mechanisms in Phaseolus vulgaris (common beans), with a particular focus on viral resistance and overall disease resilience. The gene annotation and pathway analyses reveal that common beans rely heavily on metabolic processes, cellular responses, and genetic adaptability for defending against pathogens, especially viruses such as BCMNV and BCMV. The predominant involvement of genes in cellular processes, metabolic pathways, and defense-related molecular functions underscores the importance of these pathways in ensuring survival and productivity in the face of biotic stress.
Common beans exhibit a strong reliance on carbohydrate metabolism and cellular processes, such as signaling pathways and secondary metabolite production, to defend against microbial and viral invaders. This suggests that enhancing these pathways in crop breeding could improve disease resistance. The involvement of specialized metabolites, such as flavonoids and alkaloids, further supports the role of metabolic responses in pathogen defense.
The plasma membrane, cytoplasm, and nucleus emerge as central cellular structures involved in pathogen recognition and immune response. The gene annotations suggest that the plasma membrane, as the first line of defense, plays a critical role in pathogen detection and triggering defense mechanisms, such as the hypersensitive response.
The study highlights the role of transposable elements (TEs) in genetic adaptation to pathogens, which could potentially lead to the rapid emergence of beneficial mutations. The activation of TEs in response to disease is an intriguing finding that warrants further investigation, as it could provide a mechanism for faster adaptation to evolving viral threats.
Specific genes involved in DNA binding, transcription factor activity, nitrogen metabolism, and oxidoreductase activity were upregulated in response to biotic stress, indicating a coordinated defense response. The upregulation of these genes suggests that common beans activate complex networks of defense-related genes during pathogen attacks, focusing on genome stability, secondary metabolite production, and oxidative stress management.
Interestingly, detoxification pathways were underrepresented, suggesting that they may only play a specialized role in certain circumstances rather than forming a central component of the general defense strategy. Additionally, the downregulation of growth-related pathways during infection may reflect the plant’s prioritization of defense over growth, a common response during pathogen-induced stress.
Understanding the differential gene expression across different bean varieties (e.g., RBGM1, RBU1, and RVK1) under stress conditions offers valuable insights for improving disease resistance. The variation in gene expression could be leveraged to breed bean varieties with enhanced resistance to viral diseases, ensuring better resilience in agricultural settings.
CAZymes, such as Glycosyl Transferases (GTs), Glycoside Hydrolases (GHs), Carbohydrate-binding modules (CBMs), and Carbohydrate Esterases (CEs), play vital roles in carbohydrate metabolism during plant defense responses. These enzymes contribute to both the synthesis of cell wall components for structural integrity and the degradation of pathogen-associated carbohydrates, thereby assisting in the plant's immune response.
The differential gene expression between RBGM1, RVK1, and RBU1 under biotic stress conditions indicates that plants upregulate a range of defense-related genes, such as those involved in DNA binding, transcription factors, oxidoreductase activity, and nitrogen metabolism. These upregulated genes are crucial for managing oxidative stress, activating immune responses, and synthesizing secondary metabolites like phytoalexins that contribute to pathogen resistance.
Kyoto Enclyclopaedia of Genes and Genomes pathway analysis revealed that the two-component system, bacterial chemotaxis, and secretion systems play crucial roles in the plant's response to pathogen signals, particularly during BCMV and BCMNV infections. These pathways indicate the plant’s ability to sense and respond to microbial activity, enhancing its defense mechanisms. The upregulation of pathways involved in antimicrobial peptide production, detoxification, and antibiotic resistance further emphasizes the plant's multifaceted immune response.
The analysis suggests that the plant’s response to different pathogens may vary, with specific pathways activated depending on the pathogen type and severity. The presence of bacterial defense mechanisms, such as quorum sensing and antibiotic production, indicates that the plant not only recognizes pathogens but actively works to counteract microbial and viral infections.
11. Recommendations
The findings of this research highlight areas where further investigation is necessary to address gaps in our current understanding, particularly concerning specialized metabolic pathways and organism systems. These conclusions emphasize the complexity of the plant immune system and suggest that a deeper understanding of these molecular pathways could aid in the breeding or development of common bean varieties with stronger resistance to diseases like BCMV and BCMNV.
Additionally, the study revealed a significant number of uncharacterized proteins, suggesting that plant defense mechanisms may interact with pathogen effectors in ways yet to be fully understood. As a result, these uncharacterized genes present an opportunity for future research aimed at uncovering new potential resistance mechanisms or identifying promising resistance gene candidates
Author Contributions
Aggrey Osogo, Patrick Okoth, and Shrabana Sarkar conceived, performed, and designed the research, analyzed data, and wrote the paper; Francis Muyekho and Hassan Were supervised, edited, and approved the manuscript. All authors have read and agreed to the published version of the manuscript.
Acknowledgments
The authors are thankful to FOVI240049, ANID (Chile International Consortium of Microbean Project between Chile, Kenya & Mexico) for expertise and technical support.
Conflicts of Interest
The authors declare that they have no known competing financial interests or personal relationships that could have appeared to influence the work reported in this paper.
References
- Abdel-Hameed, A. A. , Liao, W., Prasad, K. V., & Reddy, A. S. CAMTAs, a family of calmodulin-binding transcription factors, are versatile regulators of biotic and abiotic stress responses in plants. Critical Reviews in Plant Sciences 2024, 43, 171–210. [Google Scholar]
- Abulfaraj, A. A. Abulfaraj, A. A., Shami, A. Y., Alotaibi, N. M., Alomran, M. M., Aloufi, A. S., Al-Andal, A., AlHamdan, N. R., Alshehrei, F. M., Sefrji, F. O., & Alsaadi, K. H. (2024). Exploration of genes encoding KEGG pathway enzymes in rhizospheric microbiome of the wild plant Abutilon fruticosum. AMB Express, 14(1), 27.
- Ahmad, N. , Hussain, H., Naeem, M., Rahman, S. U., Khan, K. A., Iqbal, B., & Umar, A. W. (2024). Metabolites-induced co-evolutionary warfare between plants, viruses, and their associated vectors: So close yet so far away. Plant Science 2024, 112165. [Google Scholar]
- Akbar, M. U. , Aqeel, M., Shah, M. S., Jeelani, G., Iqbal, N., Latif, A., Elnour, R. O., Hashem, M., Alzoubi, O. M., & Habeeb, T. (2023). Molecular regulation of antioxidants and secondary metabolites act in conjunction to defend plants against pathogenic infection. South African Journal of Botany 2023, 161, 247–257. [Google Scholar]
- Alghsham, R. , Rasheed, Z., Shariq, A., Alkhamiss, A. S., Alhumaydhi, F. A., Aljohani, A. S., Althwab, S. A., Alshomar, A., Alhomaidan, H. T., & Hamad, E. M. (2022). Recognition of pathogens and their inflammatory signaling events. Open Access Macedonian Journal of Medical Sciences 2022, 10, 462–467. [Google Scholar]
- Al-Khayri, J. M., Rashmi, R., Toppo, V., Chole, P. B., Banadka, A., Sudheer, W. N., Nagella, P., Shehata, W. F., Al-Mssallem, M. Q., & Alessa, F. M. (2023). Plant secondary metabolites: The weapons for biotic stress management. Metabolites, 13(6), 716.
- Aller, E. S., Kanstrup, C., Hunziker, P., Kliebenstein, D. J., & Burow, M. (2023). Altered defense patterns upon retrotransposition highlights the potential for rapid adaptation by transposable elements. bioRxiv, 2023.12. 20.572632.
- Alshareef, S. A. (2024). Metabolic analysis of the CAZy class glycosyltransferases in rhizospheric soil fungiome of the plant species Moringa oleifera. Saudi Journal of Biological Sciences, 31(4), 103956.
- Alves, F., Lane, D., Nguyen, T. P. M., Bush, A. I., & Ayton, S. (2025). In defence of ferroptosis. Signal Transduction and Targeted Therapy, 10(1), 2.
- Appu, M., Ramalingam, P., Sathiyanarayanan, A., & Huang, J. (2021). An overview of plant defense-related enzymes responses to biotic stresses. Plant Gene, 27, 100302.
- Aranda, P. S., LaJoie, D. M., & Jorcyk, C. L. (2012). Bleach gel: A simple agarose gel for analyzing RNA quality. ELECTROPHORESIS, 33(2), 366–369. [CrossRef]
- Asif, M., Xie, X., & Zhao, Z. (2024). Virulence regulation in plant-pathogenic bacteria by host-secreted signals. Microbiological Research, 127883.
- Backhed, F., Roswall, J., Peng, Y., Feng, Q., Jia, H., Kovatcheva-Datchary, P., Li, Y., Xia, Y., Xie, H., Zhong, H., Khan, M. T., Zhang, J., Li, J., Xiao, L., Al-Aama, J., Zhang, D., Lee, Y. S., Kotowska, D., Colding, C., … Wang, J. (2015). Dynamics and Stabilization of the Human Gut Microbiome during the First Year of Life. Cell Host Microbe, 17(6), 852. [CrossRef]
- Baduel, P., & Quadrana, L. (2021). Jumpstarting evolution: How transposition can facilitate adaptation to rapid environmental changes. Current Opinion in Plant Biology, 61, 102043.
- Balducci, E., Papi, F., Capialbi, D. E., & Del Bino, L. (2023). Polysaccharides’ structures and functions in biofilm architecture of antimicrobial-resistant (AMR) pathogens. International Journal of Molecular Sciences, 24(4), 4030.
- Basak, S., & Annapure, U. S. (2022). Trends in “green” and novel methods of pectin modification-A review. Carbohydrate Polymers, 278, 118967.
- Belay, W. Y., Getachew, M., Tegegne, B. A., Teffera, Z. H., Dagne, A., Zeleke, T. K., Abebe, R. B., Gedif, A. A., Fenta, A., & Yirdaw, G. (2024). Mechanism of antibacterial resistance, strategies and next-generation antimicrobials to contain antimicrobial resistance: A review. Frontiers in Pharmacology, 15, 1444781.
- Bharti, M. K., Chandra, D., Siddique, R. A., Ranjan, K., & Kumar, P. (2024). Recent advancement in high-throughput “omics” technologies. In Current omics advancement in plant abiotic stress biology (pp. 343–355). Elsevier.
- Blair, M. W., Li, H., Nekkalapudi, L., Becerra, V., & Paredes, M. (2023). Nutritional Traits of Beans (Phaseolus vulgaris): Nutraceutical Characterization and Genomics. In C. Kole (Ed.), Compendium of Crop Genome Designing for Nutraceuticals (pp. 611–638). Springer Nature Singapore. [CrossRef]
- Buckeridge, M. S. (2023). The diversity of plant carbohydrate hydrolysis in nature and technology. Polysaccharide-Degrading Biocatalysts, 55–74.
- Campos, M. D., Felix, M. do R., Patanita, M., Materatski, P., Albuquerque, A., Ribeiro, J. A., & Varanda, C. (2022). Defense strategies: The role of transcription factors in tomato–pathogen interaction. Biology, 11(2), 235.
- Cantarel, B. L., Coutinho, P. M., Rancurel, C., Bernard, T., Lombard, V., & Henrissat, B. (2009). The Carbohydrate-Active EnZymes database (CAZy): An expert resource for Glycogenomics. Nucleic Acids Research, 37(Database), D233–D238. [CrossRef]
- Cerutti, G., Gugole, E., Montemiglio, L. C., Turbé-Doan, A., Chena, D., Navarro, D., Lomascolo, A., Piumi, F., Exertier, C., & Freda, I. (2021). Crystal structure and functional characterization of an oligosaccharide dehydrogenase from Pycnoporus cinnabarinus provides insights into fungal breakdown of lignocellulose. Biotechnology for Biofuels, 14, 1–18.
- Chang, H., Ma, M., Gu, M., Li, S., Li, M., Guo, G., & Xing, G. (2024). Acyl-CoA-binding protein (ACBP) genes involvement in response to abiotic stress and exogenous hormone application in barley (Hordeum vulgare L.). BMC Plant Biology, 24(1), 236.
- Deng, S., Chen, C., Wang, Y., Liu, S., Zhao, J., Cao, B., Jiang, D., Jiang, Z., & Zhang, Y. (2024). Advances in understanding and mitigating Atrazine’s environmental and health impact: A comprehensive review. Journal of Environmental Management, 365, 121530.
- Dos Santos, C., & Franco, O. L. (2023). Pathogenesis-related proteins (PRs) with enzyme activity activating plant defense responses. Plants, 12(11), 2226.
- EL Sabagh, A., Islam, M. S., Hossain, A., Iqbal, M. A., Mubeen, M., Waleed, M., Reginato, M., Battaglia, M., Ahmed, S., & Rehman, A. (2022). Phytohormones as growth regulators during abiotic stress tolerance in plants. Frontiers in Agronomy, 4, 765068.
- Feng, Q., Liang, S., Jia, H., Stadlmayr, A., Tang, L., Lan, Z., Zhang, D., Xia, H., Xu, X., & Jie, Z. (2015). Gut microbiome development along the colorectal adenoma-carcinoma sequence. Nature Communications, 6(1), 6528.
- Forsberg, Z., & Courtade, G. (2023). On the impact of carbohydrate-binding modules (CBMs) in lytic polysaccharide monooxygenases (LPMOs). Essays in Biochemistry, 67(3), 561–574.
- Gharechahi, J., Vahidi, M. F., Sharifi, G., Ariaeenejad, S., Ding, X.-Z., Han, J.-L., & Salekdeh, G. H. (2023). Lignocellulose degradation by rumen bacterial communities: New insights from metagenome analyses. Environmental Research, 229, 115925.
- Huerta-Cepas, J., Szklarczyk, D., Forslund, K., Cook, H., Heller, D., Walter, M. C., Rattei, T., Mende, D. R., Sunagawa, S., & Kuhn, M. (2016). eggNOG 4.5: A hierarchical orthology framework with improved functional annotations for eukaryotic, prokaryotic and viral sequences. Nucleic Acids Research, 44(D1), D286–D293.
- Islam, S. S., Adhikary, S., Mostafa, M., & Hossain, M. M. (2024). Vegetable beans: Comprehensive insights into diversity, production, nutritional benefits, sustainable cultivation and future prospects. OnLine J. Biol. Sci, 24, 477–494.
- Jha, Y., & Mohamed, H. I. (2022). Plant secondary metabolites as a tool to investigate biotic stress tolerance in plants: A review. Gesunde Pflanzen, 74(4), 771–790.
- Kadirvelraj, R., Yang, J.-Y., Kim, H. W., Sanders, J. H., Moremen, K. W., & Wood, Z. A. (2021). Comparison of human poly-N-acetyl-lactosamine synthase structure with GT-A fold glycosyltransferases supports a modular assembly of catalytic subsites. Journal of Biological Chemistry, 296.
- Kanehisa, M., Furumichi, M., Tanabe, M., Sato, Y., & Morishima, K. (2017). KEGG: new perspectives on genomes, pathways, diseases and drugs. Nucleic Acids Research, 45(D1), D353–D361.
- Kanehisa, M., Goto, S., Hattori, M., Aoki-Kinoshita, K. F., Itoh, M., Kawashima, S., Katayama, T., Araki, M., & Hirakawa, M. (2006). From genomics to chemical genomics: New developments in KEGG. Nucleic Acids Research, 34(suppl_1), D354–D357.
- Karlsson, F. H., Fåk, F., Nookaew, I., Tremaroli, V., Fagerberg, B., Petranovic, D., Bäckhed, F., & Nielsen, J. (2012). Symptomatic atherosclerosis is associated with an altered gut metagenome. Nature Communications, 3(1), 1245.
- Karlsson, F. H., Tremaroli, V., Nookaew, I., Bergström, G., Behre, C. J., Fagerberg, B., Nielsen, J., & Bäckhed, F. (2013). Gut metagenome in European women with normal, impaired and diabetic glucose control. Nature, 498(7452), 99–103.
- Kaur, S., Samota, M. K., Choudhary, M., Choudhary, M., Pandey, A. K., Sharma, A., & Thakur, J. (2022). How do plants defend themselves against pathogens-Biochemical mechanisms and genetic interventions. Physiology and Molecular Biology of Plants, 28(2), 485–504.
- Khan, K. A., Saleem, M. H., Afzal, S., Hussain, I., Ameen, F., & Fahad, S. (2024). Ferulic acid: Therapeutic potential due to its antioxidant properties, role in plant growth, and stress tolerance. Plant Growth Regulation, 1–25.
- Khoshru, B., Mitra, D., Joshi, K., Adhikari, P., Rion, M. S. I., Fadiji, A. E., Alizadeh, M., Priyadarshini, A., Senapati, A., & Sarikhani, M. R. (2023). RETRACTED: Decrypting the multi-functional biological activators and inducers of defense responses against biotic stresses in plants. Heliyon, 9(3).
- King, D. G. (2024). Mutation protocols share with sexual reproduction the physiological role of producing genetic variation within ‘constraints that deconstrain’. The Journal of Physiology, 602(11), 2615–2626.
- Koner, S., De Sarkar, N., & Laha, N. (2024). False discovery rate control: Moving beyond the Benjamini–Hochberg method. bioRxiv, 2024.01. 13.575531.
- Krasavina, M. S., Burmistrova, N. A., & Raldugina, G. N. (2014). The role of carbohydrates in plant resistance to abiotic stresses. In Emerging technologies and management of crop stress tolerance (pp. 229–270). Elsevier.
- Kumar, S., Jeevaraj, T., Yunus, M. H., Chakraborty, S., & Chakraborty, N. (2023). The plant cytoskeleton takes center stage in abiotic stress responses and resilience. Plant, Cell & Environment, 46(1), 5–22.
- Kumar, S., Korra, T., Thakur, R., Arutselvan, R., Kashyap, A. S., Nehela, Y., Chaplygin, V., Minkina, T., & Keswani, C. (2023). Role of plant secondary metabolites in defence and transcriptional regulation in response to biotic stress. Plant Stress, 8, 100154.
- Li, J., Jia, H., Cai, X., Zhong, H., Feng, Q., Sunagawa, S., Arumugam, M., Kultima, J. R., Prifti, E., & Nielsen, T. (2014). An integrated catalog of reference genes in the human gut microbiome. Nature Biotechnology, 32(8), 834–841.
- Lian, N., Wang, X., Jing, Y., & Lin, J. (2021). Regulation of cytoskeleton-associated protein activities: Linking cellular signals to plant cytoskeletal function. Journal of Integrative Plant Biology, 63(1), 241–250.
- Lika, J., & Fan, J. (2024). Carbohydrate metabolism in supporting and regulating neutrophil effector functions. Current Opinion in Immunology, 91, 102497.
- Liu, B., Liu, L., & Liu, Y. (2024). Targeting cell death mechanisms: The potential of autophagy and ferroptosis in hepatocellular carcinoma therapy. Frontiers in Immunology, 15, 1450487.
- Lu, D., Ren, Y., Yan, T., Jia, X., Xu, H., Yang, B., Zhang, X., & He, J. (2024). Melatonin improves the postharvest anthracnose resistance of mango fruit by regulating antioxidant activity, the phenylpropane pathway and cell wall metabolism. European Journal of Plant Pathology, 1–20.
- Majeed, H. N., Shaheen, S., & Kashif, M. (2024). Glycosyltransferases: Unraveling Molecular Insights and Biotechnological Implications. Science Reviews. Biology, 3(1), 16.
- Marcianò, D., Kappel, L., Ullah, S. F., & Srivastava, V. (2024). From glycans to green biotechnology: Exploring cell wall dynamics and phytobiota impact in plant glycopathology. Critical Reviews in Biotechnology, 1–19.
- Marmion, M., Macori, G., Ferone, M., Whyte, P., & Scannell, A. G. M. (2022). Survive and thrive: Control mechanisms that facilitate bacterial adaptation to survive manufacturing-related stress. International Journal of Food Microbiology, 368, 109612.
- McCartney, N., Kondakath, G., Tai, A., & Trimmer, B. A. (2024). Functional annotation of insecta transcriptomes: A cautionary tale from Lepidoptera. Insect Biochemistry and Molecular Biology, 165, 104038.
- Molina, A., Sánchez-Vallet, A., Jordá, L., Carrasco-López, C., Rodríguez-Herva, J. J., & López-Solanilla, E. (2024). Plant cell walls: Source of carbohydrate-based signals in plant-pathogen interactions. Current Opinion in Plant Biology, 82, 102630.
- Mtonga, A., & Maruthi, M. N. (2024). Diseases of common bean. In Handbook of Vegetable and Herb Diseases (pp. 1–52). Springer.
- Munzert, K. S., & Engelsdorf, T. (2025). Plant cell wall structure and dynamics in plant–pathogen interactions and pathogen defence. Journal of Experimental Botany, 76(2), 228–242.
- Nadarajah, K. K. (2024). Defensive Strategies of ROS in Plant–Pathogen Interactions. In Plant Pathogen Interaction (pp. 163–183). Springer.
- Olmo-Uceda, M. J., Ambrós, S., Corrêa, R. L., & Elena, S. F. (2024). Transcriptomic insights into the epigenetic modulation of turnip mosaic virus evolution in Arabidopsis thaliana. BMC Genomics, 25(1), 897.
- Qin, J., Li, Y., Cai, Z., Li, S., Zhu, J., Zhang, F., Liang, S., Zhang, W., Guan, Y., & Shen, D. (2012). A metagenome-wide association study of gut microbiota in type 2 diabetes. Nature, 490(7418), 55–60.
- Qin, N., Yang, F., Li, A., Prifti, E., Chen, Y., Shao, L., Guo, J., Le Chatelier, E., Yao, J., & Wu, L. (2014). Alterations of the human gut microbiome in liver cirrhosis. Nature, 513(7516), 59–64.
- Sahakyan, G., & Sahakyan, N. (n.d.). ABC Proteins as Regulators of Plant Tolerance to Biotic and Abiotic Stresses. Plant Stress Tolerance, 203–222.
- Sahu, P. K. , Jayalakshmi, K., Tilgam, J., Gupta, A., Nagaraju, Y., Kumar, A., Hamid, S., Singh, H. V., Minkina, T., & Rajput, V. D. (2022). ROS generated from biotic stress: Effects on plants and alleviation by endophytic microbes. Frontiers in Plant Science 2022, 13, 1042936. [Google Scholar] [PubMed]
- Saif, R. , Mahmood, T., Ejaz, A., & Zia, S. (2022). Pathway enrichment and network analysis of differentially expressed genes in pashmina goat. Gene Reports 2022, 27, 101606. [Google Scholar]
- Saini, N., Anmol, A., Kumar, S., Bakshi, M., & Dhiman, Z. (2024). Exploring phenolic compounds as natural stress alleviators in plants-a comprehensive review. Physiological and Molecular Plant Pathology, 102383.
- Samsami, H., & Maali-Amiri, R. (2024). Global insights into intermediate metabolites: Signaling, metabolic divergence and stress response modulation in plants. Plant Physiology and Biochemistry, 108862.
- Savary, S. , Ficke, A., Aubertot, J.-N., & Hollier, C. (2012). Crop losses due to diseases and their implications for global food production losses and food security. Food Security 2012, 4, 519–537. [Google Scholar] [CrossRef]
- Scher, J. U. , Sczesnak, A., Longman, R. S., Segata, N., Ubeda, C., Bielski, C., Rostron, T., Cerundolo, V., Pamer, E. G., & Abramson, S. B. (2013). Expansion of intestinal Prevotella copri correlates with enhanced susceptibility to arthritis. Elife 2013, 2, e01202. [Google Scholar]
- Shetty, N. P. , Jørgensen, H. J. L., Jensen, J. D., Collinge, D. B., & Shetty, H. S. (2008). Roles of reactive oxygen species in interactions between plants and pathogens. European Journal of Plant Pathology 2008, 121(3), 267–280. [Google Scholar]
- Singh, R., Choudhary, P., Kumar, S., & Daima, H. K. (2024). Mechanistic approaches for crosstalk between nanomaterials and plants: Plant immunomodulation, defense mechanisms, stress resilience, toxicity, and perspectives. Environmental Science: Nano.
- Solanki, S., & Das, H. K. (2024). Antimicrobial resistance: Molecular drivers and underlying mechanisms. Journal of Medicine, Surgery, and Public Health, 3, 100122.
- Songire, V. M., & Patil, R. H. (2025). Microbial Antioxidative Enzymes: Biotechnological Production and Environmental and Biomedical Applications. Applied Biochemistry and Microbiology, 1–26.
- Spitzer, J. (2024). Physicochemical origins of prokaryotic and eukaryotic organisms. The Journal of Physiology, 602(11), 2383–2394.
- Su, J., Song, Y., Zhu, Z., Huang, X., Fan, J., Qiao, J., & Mao, F. (2024). Cell–cell communication: New insights and clinical implications. Signal Transduction and Targeted Therapy, 9(1), 196.
- Sun, Y., Wang, M., Mur, L. A. J., Shen, Q., & Guo, S. (2020). Unravelling the roles of nitrogen nutrition in plant disease defences. International Journal of Molecular Sciences, 21(2), 572.
- Swaminathan, S. , Lionetti, V., & Zabotina, O. A. (2022). Plant cell wall integrity perturbations and priming for defense. Plants 2022, 11(24), 3539. [Google Scholar] [PubMed]
- Tamchek, N., & Lee, P.-C. (2024). Comparative Metatranscriptomics of Rhizosphere Microbiomes in Survived and Dead Cocoa Plants Under Drought Condition. Agricultural Research. [CrossRef]
- Thiruvengadam, R., Venkidasamy, B., Easwaran, M., Chi, H. Y., Thiruvengadam, M., & Kim, S.-H. (2024). Dynamic interplay of reactive oxygen and nitrogen species (ROS and RNS) in plant resilience: Unveiling the signaling pathways and metabolic responses to biotic and abiotic stresses. Plant Cell Reports, 43(8), 198.
- Tiku, A. R. (2020). Antimicrobial compounds (phytoanticipins and phytoalexins) and their role in plant defense. Co-Evolution of Secondary Metabolites, 845–868.
- Uebersax, M. A., Cichy, K. A., Gomez, F. E., Porch, T. G., Heitholt, J., Osorno, J. M., Kamfwa, K., Snapp, S. S., & Bales, S. (2023). Dry beans ( L.) as a vital component of sustainable agriculture and food security—A review. Legume Science, 5(1), e155. [CrossRef]
- ul Qamar, M. T., Noor, F., Guo, Y.-X., Zhu, X.-T., & Chen, L.-L. (2024). Deep-HPI-pred: An R-Shiny applet for network-based classification and prediction of Host-Pathogen protein-protein interactions. Computational and Structural Biotechnology Journal, 23, 316–329.
- Upadhyay, R., Saini, R., Shukla, P. K., & Tiwari, K. N. (2024). Role of secondary metabolites in plant defense mechanisms: A molecular and biotechnological insights. Phytochemistry Reviews, 1–31.
- Wang, Y. , Pruitt, R. N., Nuernberger, T., & Wang, Y. (2022). Evasion of plant immunity by microbial pathogens. Nature Reviews Microbiology 2022, 20(8), 449–464. [Google Scholar] [PubMed]
- Wani, S. H., Anand, S., Singh, B., Bohra, A., & Joshi, R. (2021). WRKY transcription factors and plant defense responses: Latest discoveries and future prospects. Plant Cell Reports, 40, 1071–1085.
- Wani, S. , Nisa, Q., Fayaz, T., Naziya Nabi, Aasiya Nabi, Lateef, I., Bashir, A., Rashid, R. J., Rashid, Z., Gulzar, G., Shafi, U., Dar, Z. A., Lone, A. A., Jha, U. C., & Padder, B. A. (2023). An Overview of Major Bean Diseases and Current Scenario of Common Bean Resistance. In U. C. Jha, H. Nayyar, K. D. Sharma, E. J. B. Von Wettberg, P. Singh, & K. H. M. Siddique (Eds.), Diseases in Legume Crops (pp. 99–123). Springer Nature Singapore. [CrossRef]
- Weng, J.-K. , Lynch, J. H., Matos, J. O., & Dudareva, N. (2021). Adaptive mechanisms of plant specialized metabolism connecting chemistry to function. Nature Chemical Biology 2021, 17(10), 1037–1045. [Google Scholar] [PubMed]
- Xu, S. , Hu, E., Cai, Y., Xie, Z., Luo, X., Zhan, L., Tang, W., Wang, Q., Liu, B., & Wang, R. (2024). Using clusterProfiler to characterize multiomics data. Nature Protocols 2024, 19(11), 3292–3320. [Google Scholar]
- Yadav, A., Yadav, K., Ahmad, R., & Abd-Elsalam, K. A. (2023). Emerging frontiers in nanotechnology for precision agriculture: Advancements, hurdles and prospects. Agrochemicals, 2(2), 220–256.
- Yanamadala, V. (2024). Carbohydrate Metabolism. In Essential Medical Biochemistry and Metabolic Disease: A Pocket Guide for Medical Students and Residents (pp. 1–34). Springer.
- Yang, W., Feng, H., Zhang, X., Zhang, J., Doonan, J. H., Batchelor, W. D., Xiong, L., & Yan, J. (2020). Crop phenomics and high-throughput phenotyping: Past decades, current challenges, and future perspectives. Molecular Plant, 13(2), 187–214.
- Zhao, S. , & Li, Y. (2021). Current understanding of the interplays between host hormones and plant viral infections. PLoS Pathogens 2021, 17(2), e1009242. [Google Scholar]
- Zhu, X., Tian, H., Li, X., Yan, H., Yang, S., & He, G. (2024). Transcriptome analysis of cadmium accumulation characteristics and fruit response to cadmium stress in Zunla 1 chili pepper. Cogent Food & Agriculture, 10(1), 2437136.
Figure 1.
A- Map of the sampled areas. Panel B shows extensive necrosis, leaf curling, and tissue signifying invasion by common bacterial blight Panel C highlights the widespread yellowing of the leaves as in Bean Common Mosaic Virus/Bean Common Mosaic Necrotic Virus. Panel D depicts a yellow mosaic pattern on the leaves as in Bean Common Mosaic Virus/Bean Common Mosaic Necrotic Virus, while Panel E illustrates necrosis, leaf mottling, and distortion Symptomatic of viral and bacterial pathogens.
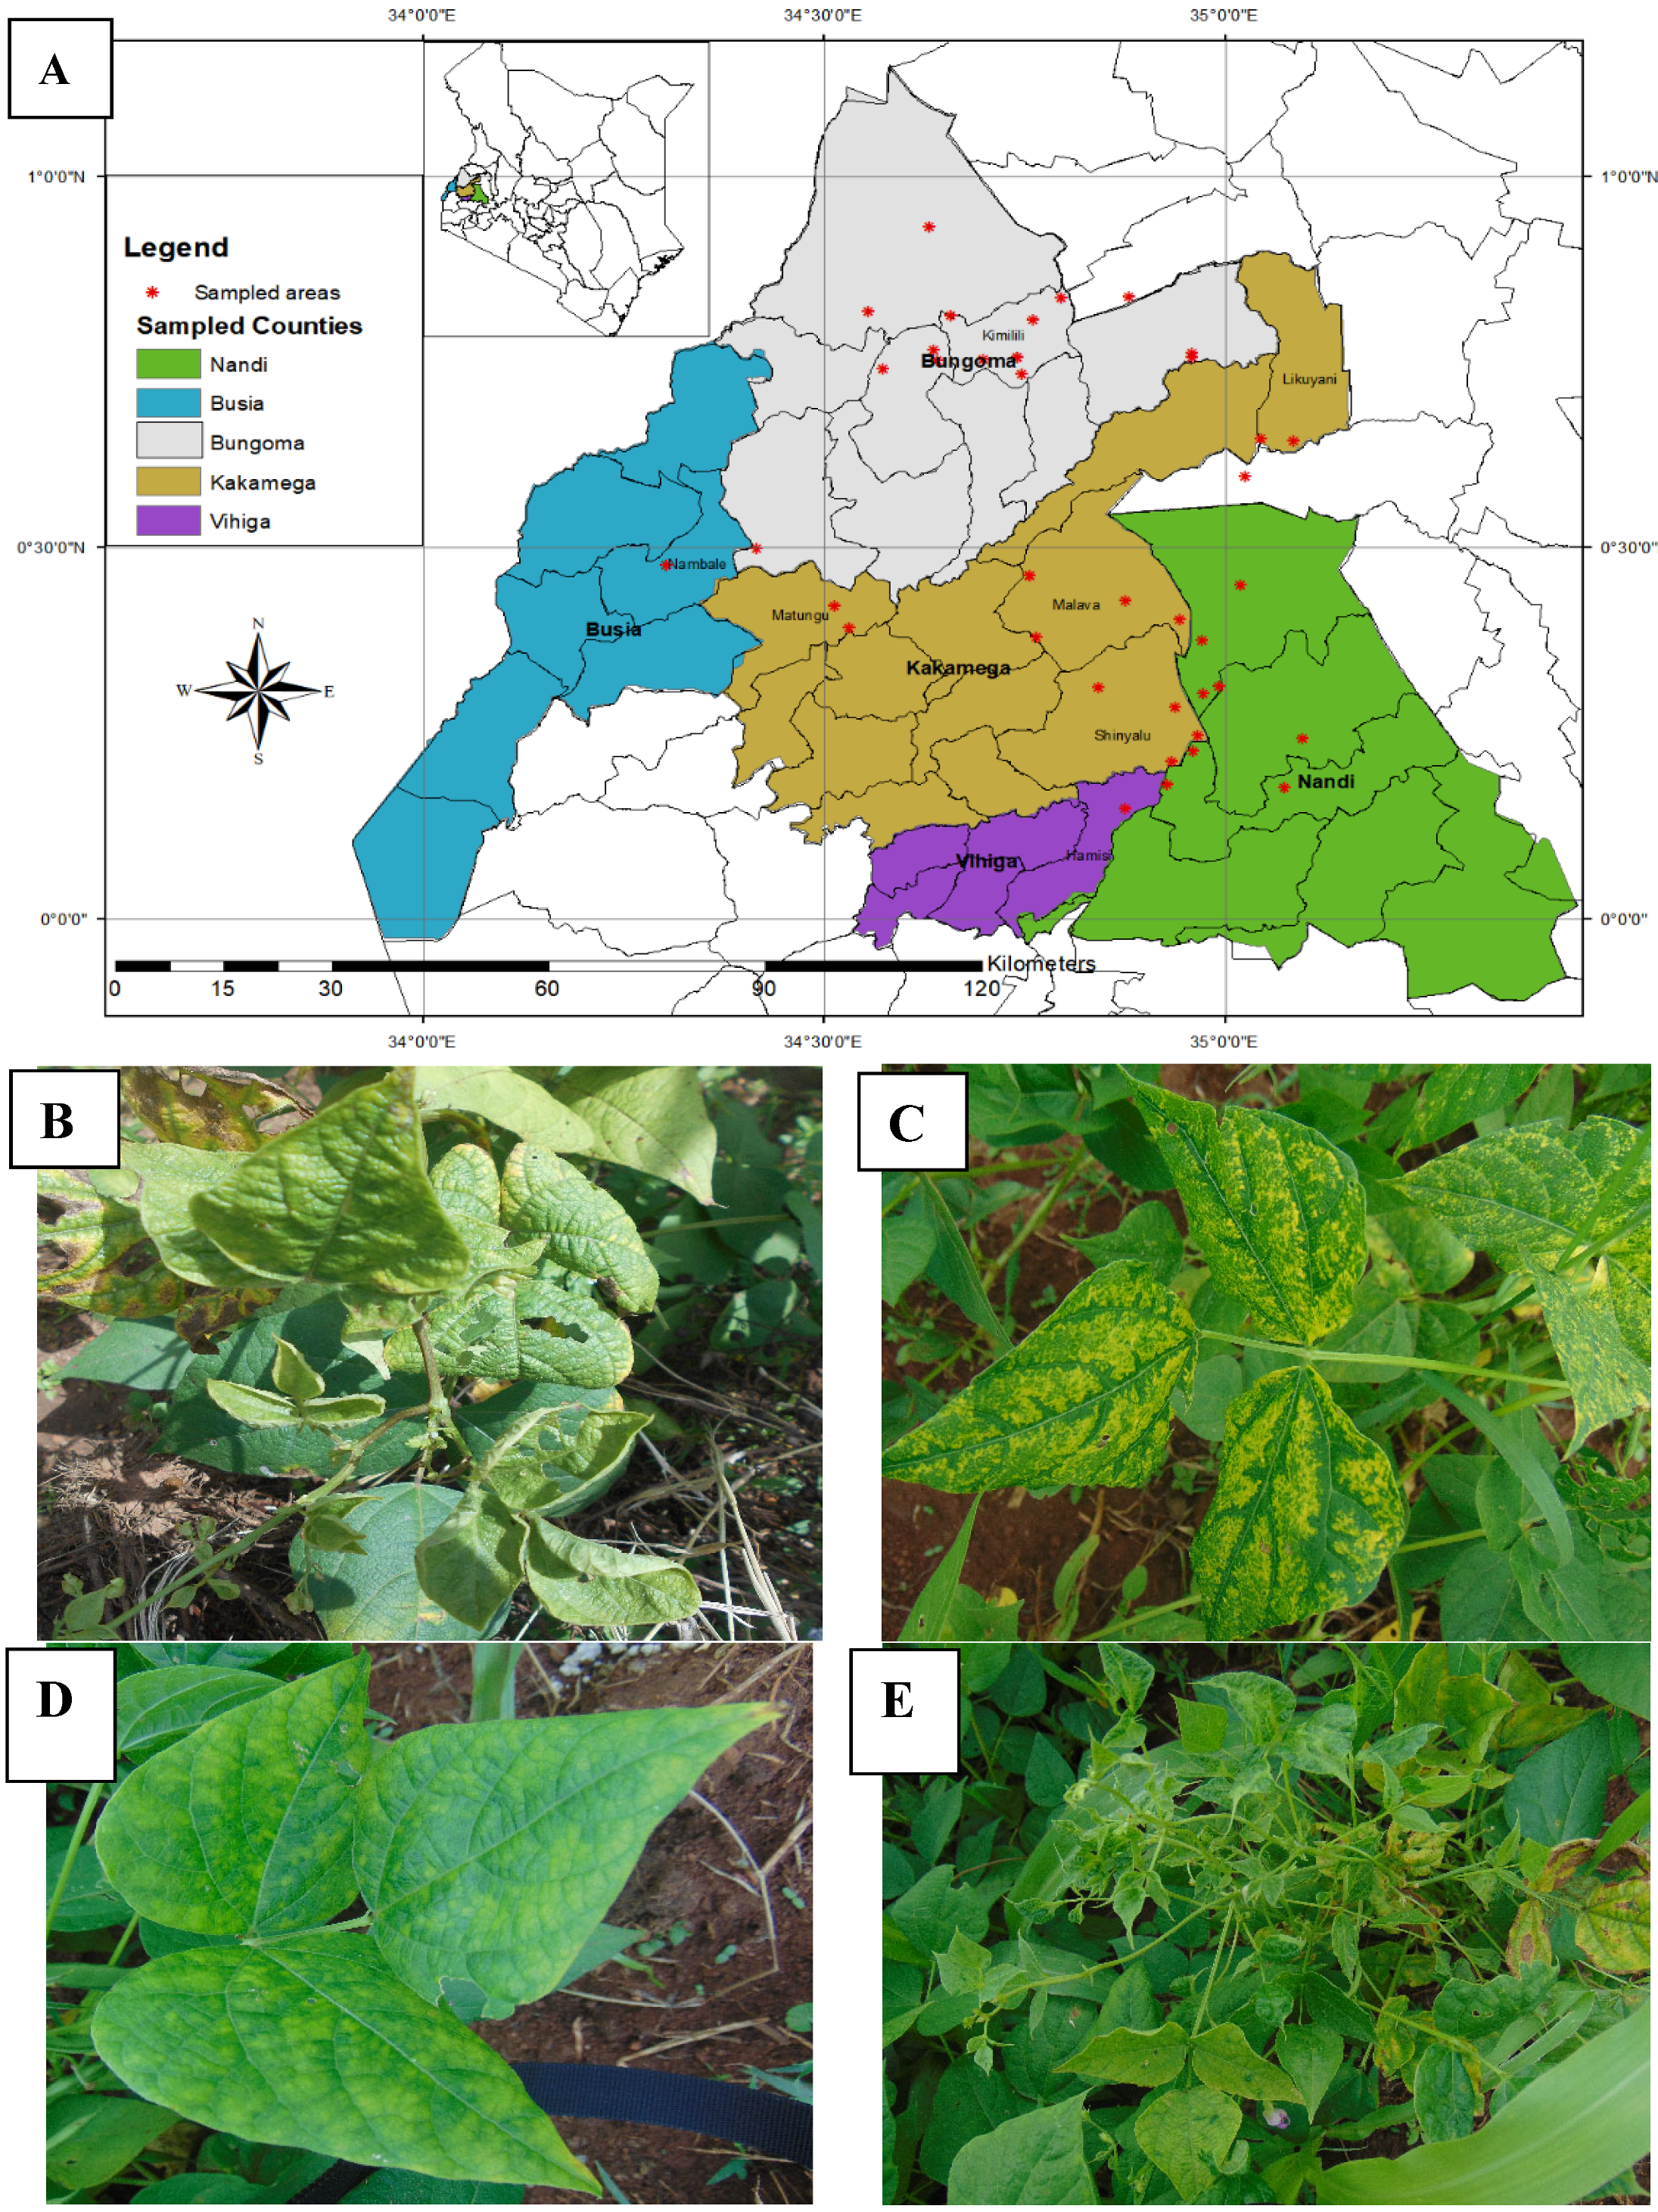
Figure 2.
The pipeline illustrates step-by-step processing of the reads to obtain cleaned data, followed by subsequent analyses such as gene functional annotation, gene expression, and enrichment analysis. Courtesy of Novogene Limited Company.
Figure 2.
The pipeline illustrates step-by-step processing of the reads to obtain cleaned data, followed by subsequent analyses such as gene functional annotation, gene expression, and enrichment analysis. Courtesy of Novogene Limited Company.
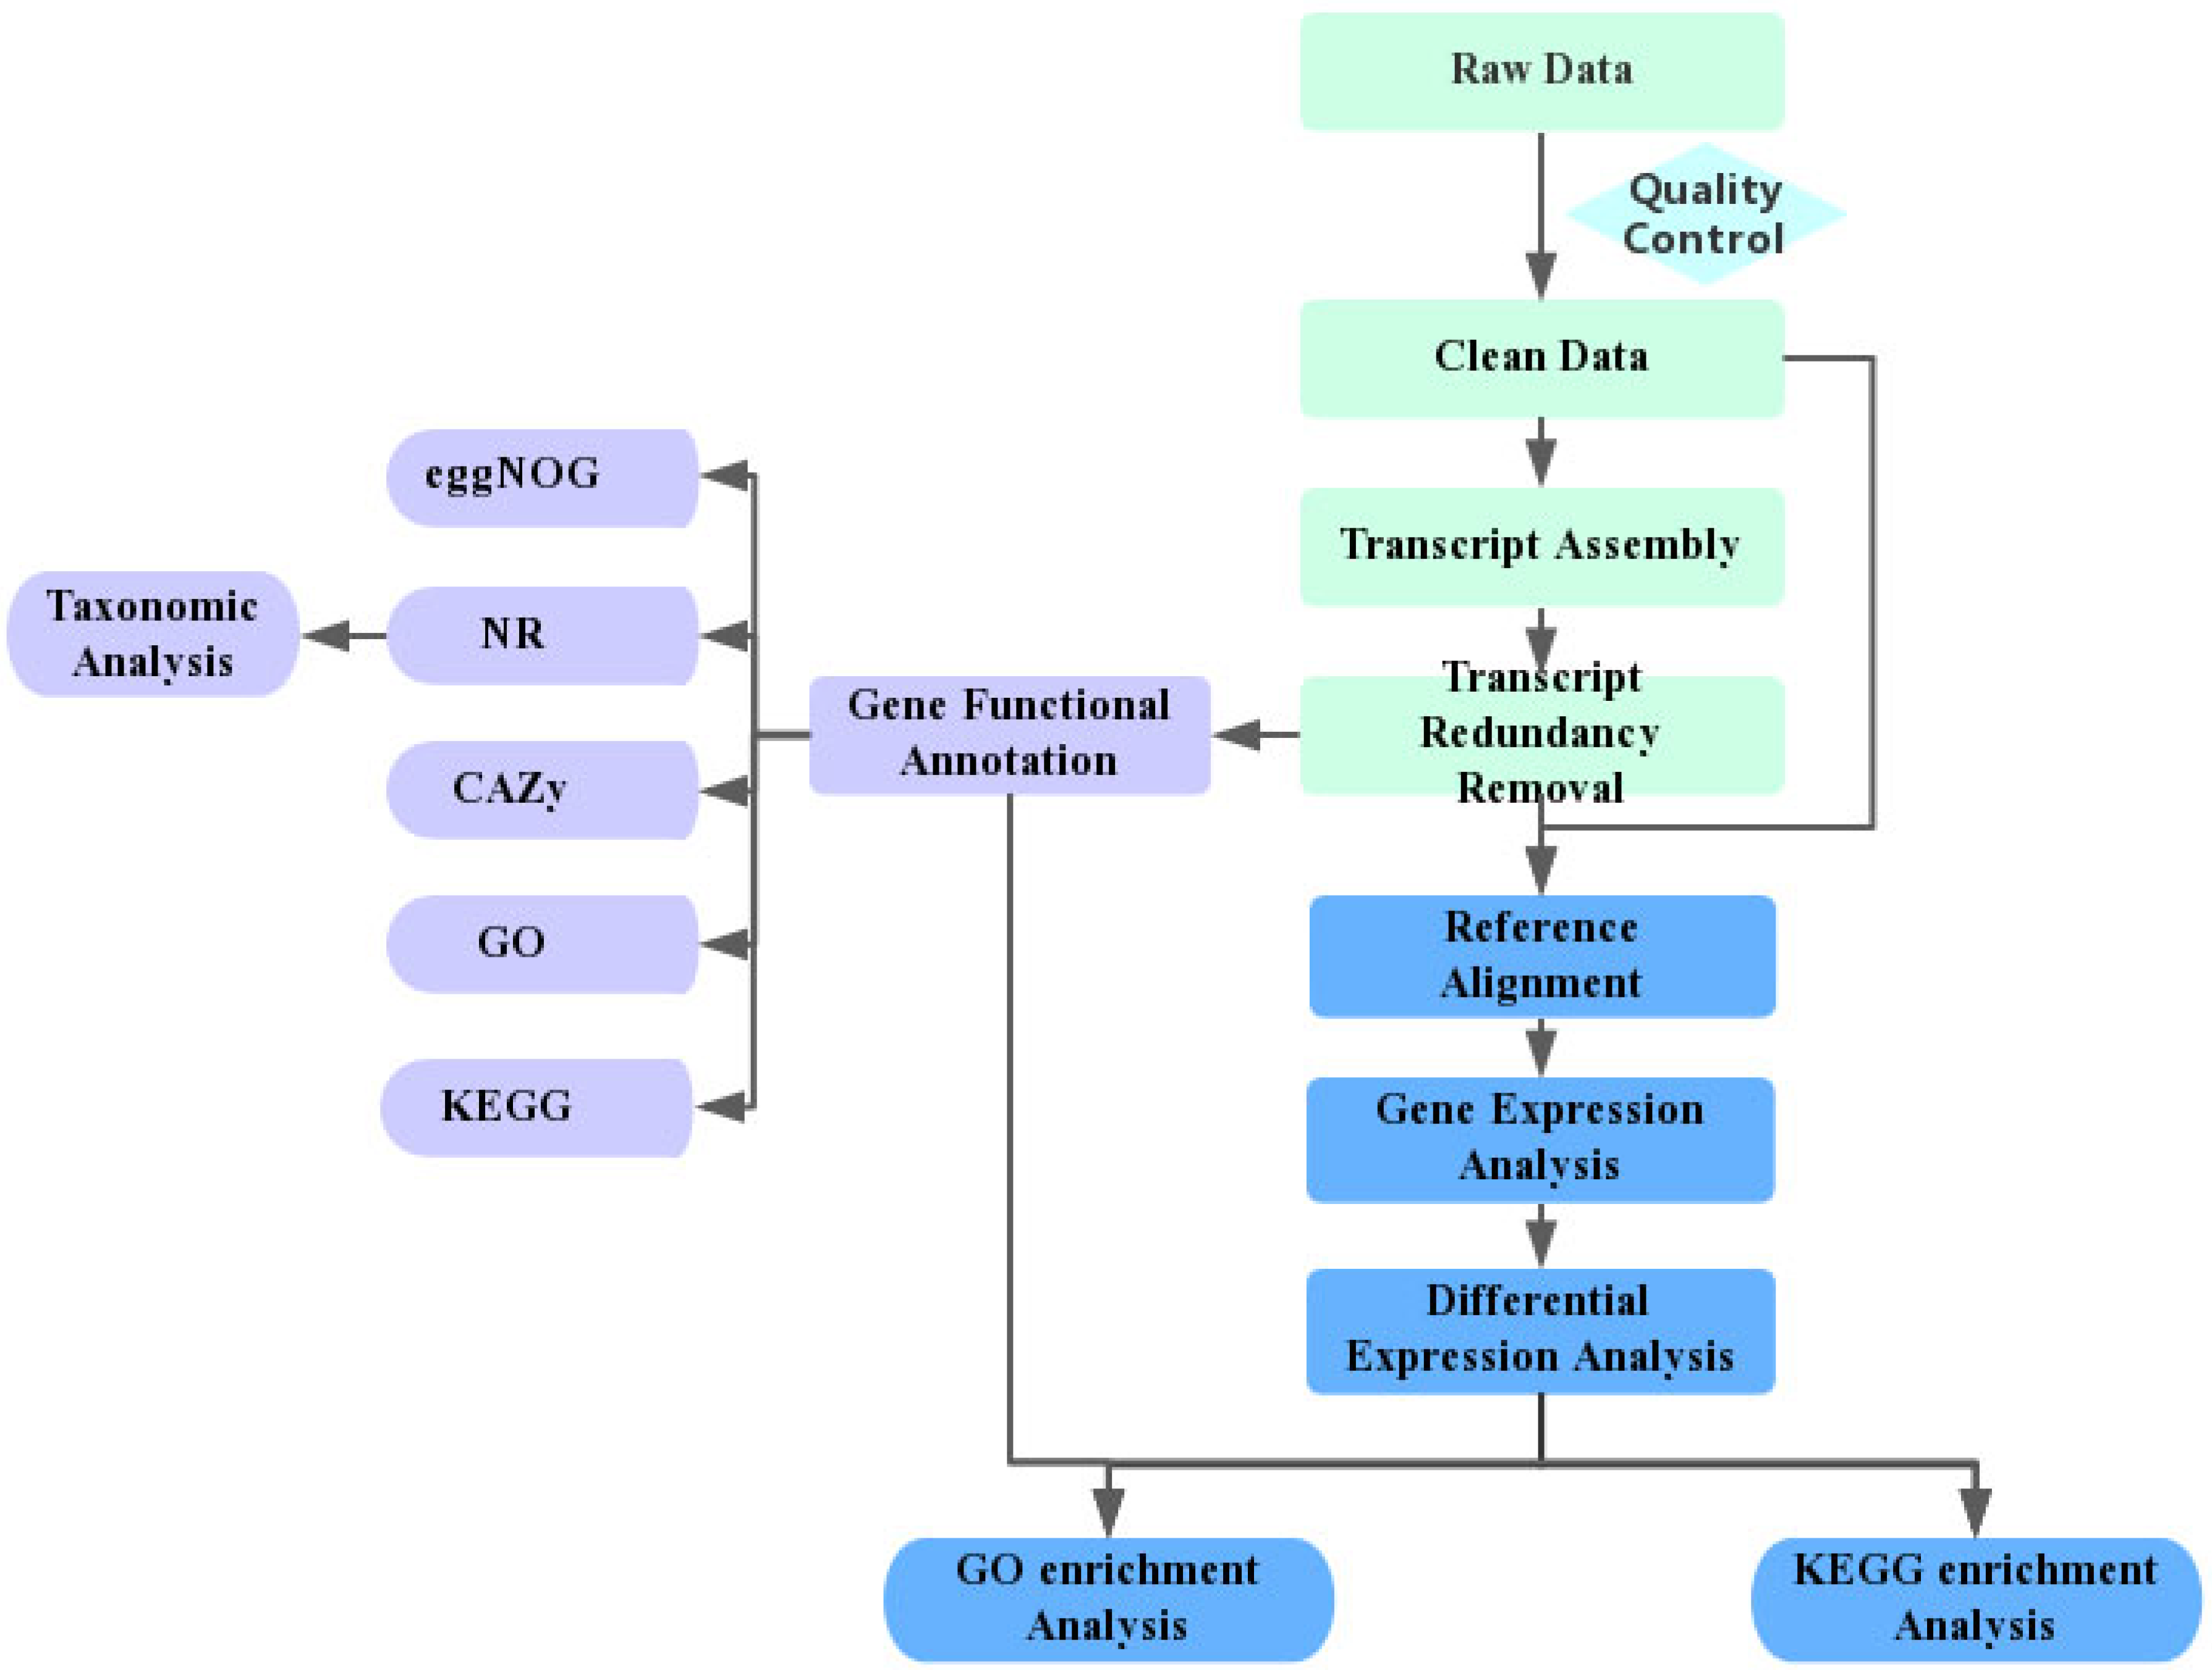
Figure 3.
Illustrating Gene Ontology categories on the X-axis, including Biological Processes, Cellular Components, and Molecular Function, along with the corresponding functional annotations and the number of matched genes on the Y-axis.
Figure 3.
Illustrating Gene Ontology categories on the X-axis, including Biological Processes, Cellular Components, and Molecular Function, along with the corresponding functional annotations and the number of matched genes on the Y-axis.
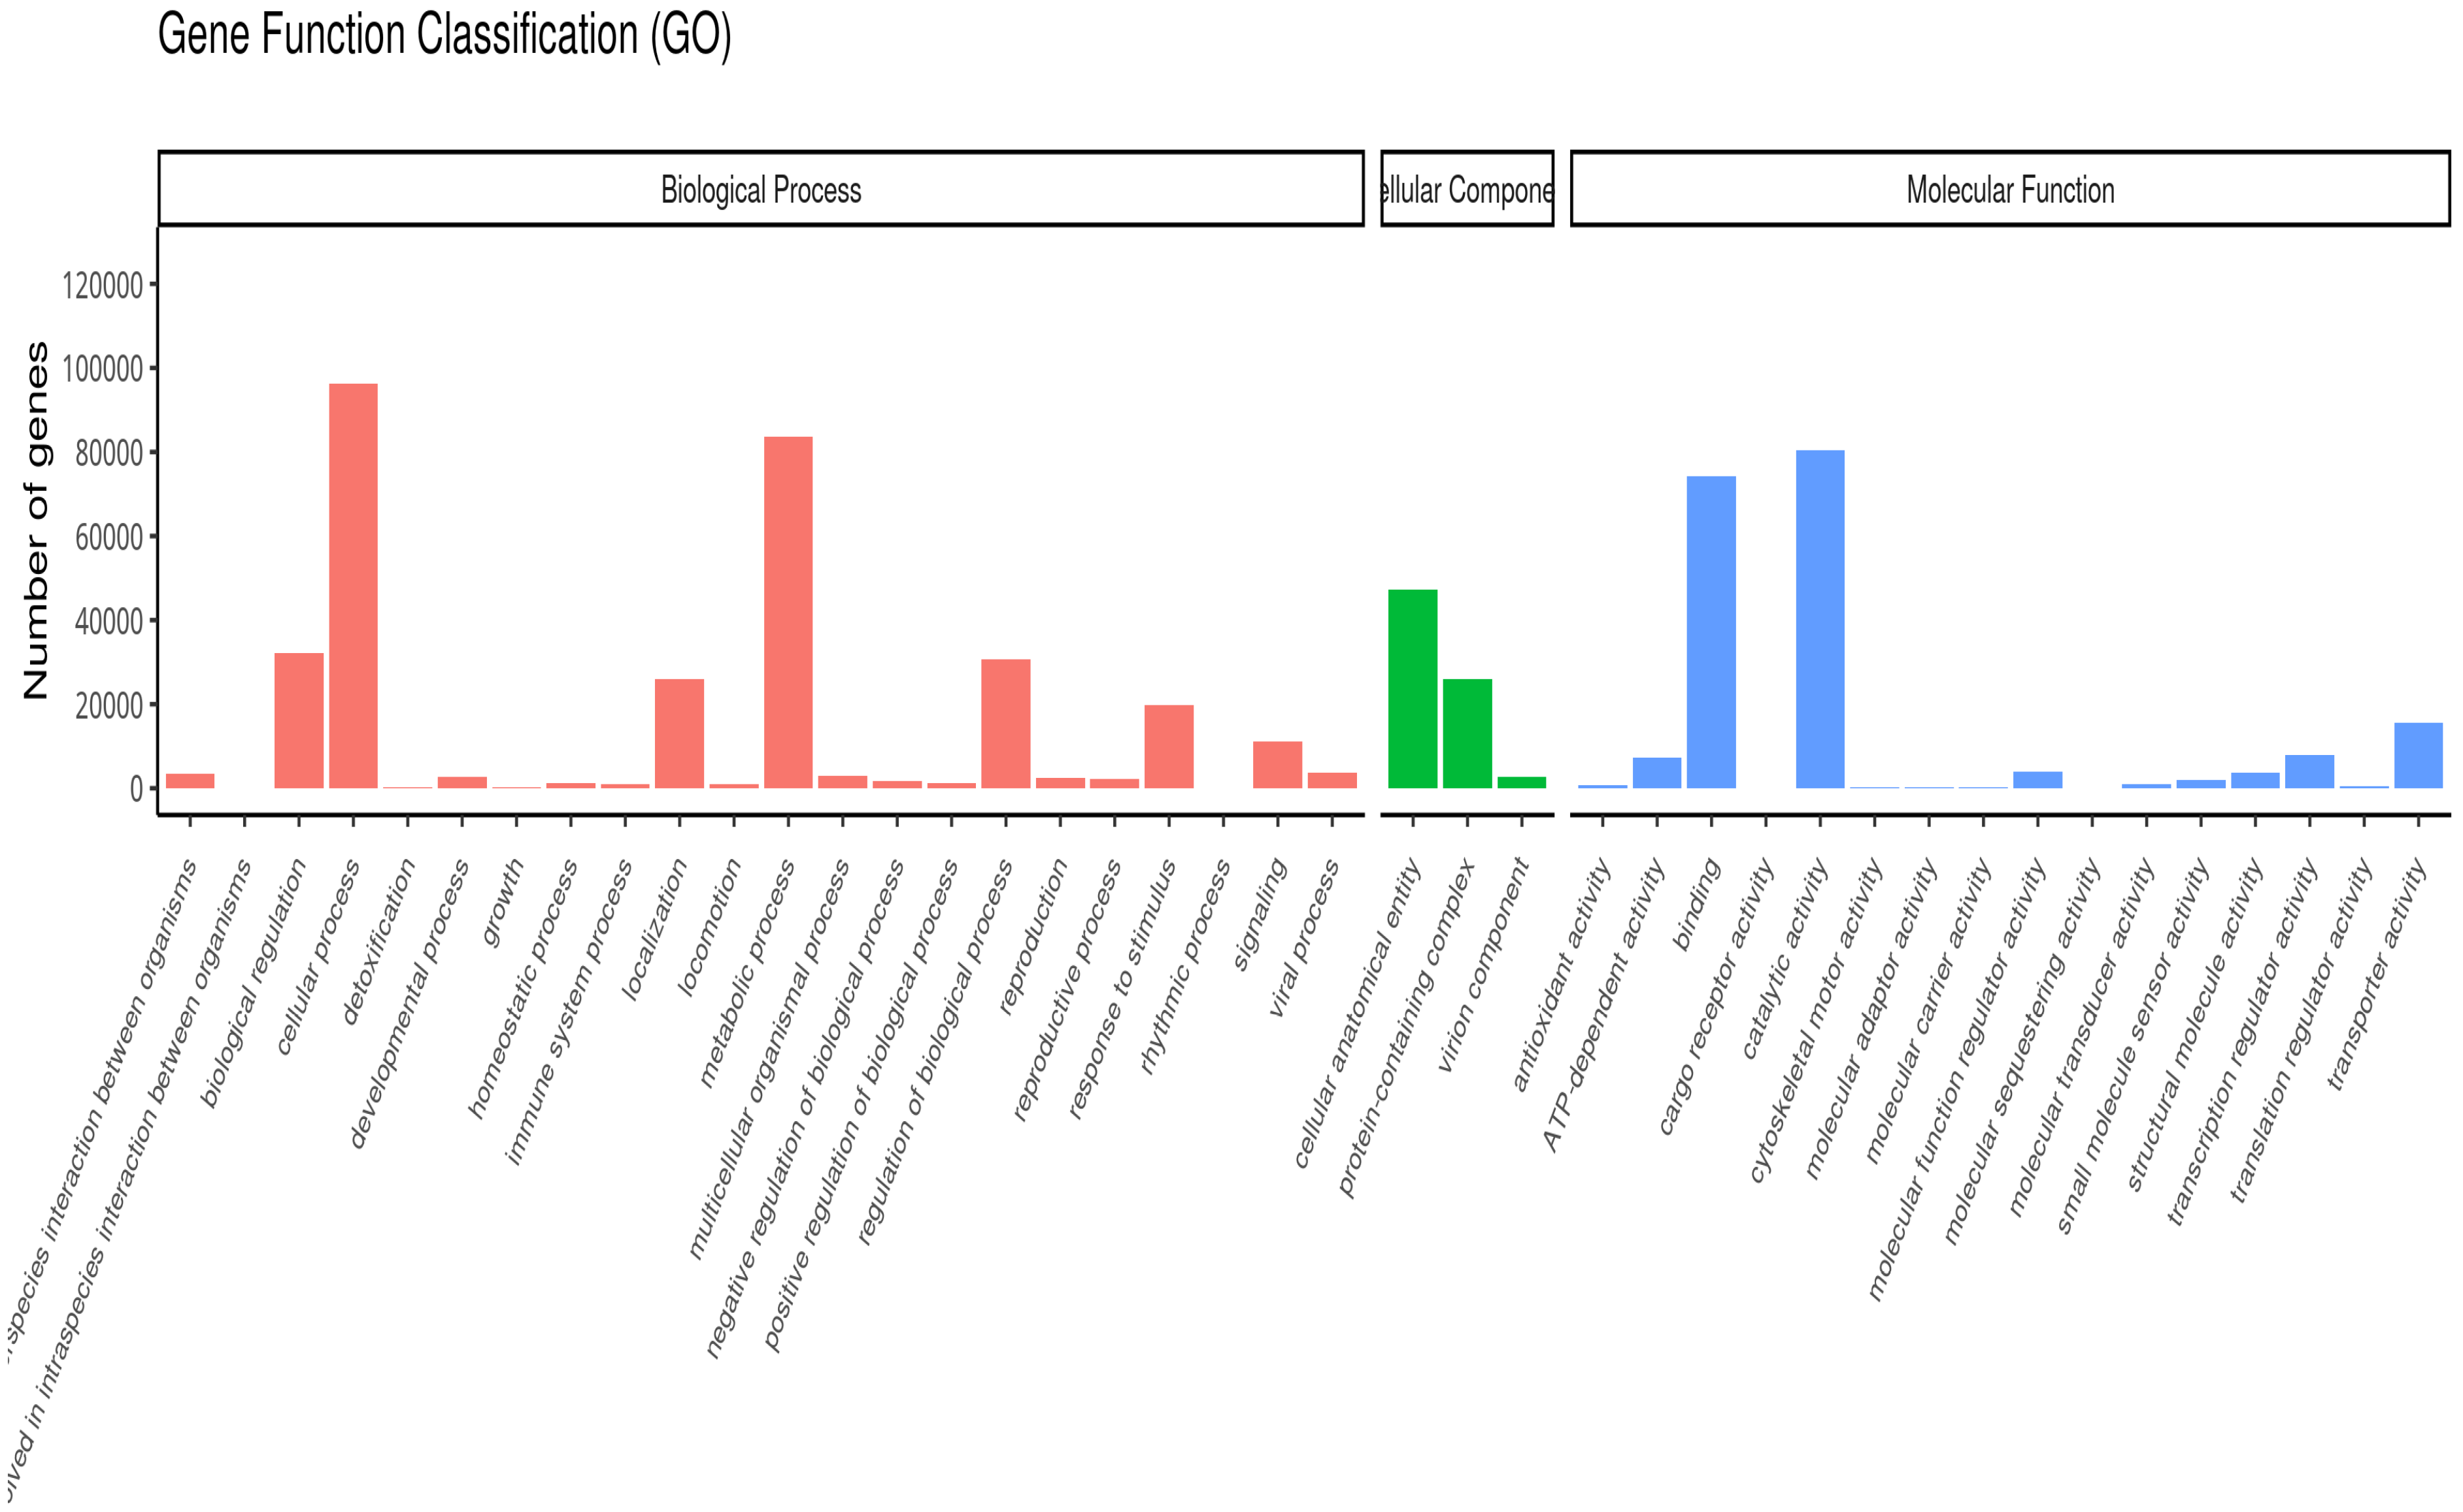
Figure 4.
The Y-axis is the names of KEGG pathways; the X-axis is the number of the genes annotated in the pathway and the total number of annotated genes. The KEGG metabolic pathways are divided into 5 branches: Cellular Processes, Environmental Information Processing, Genetic Information Processing, Metabolism, and Organismal Systems.
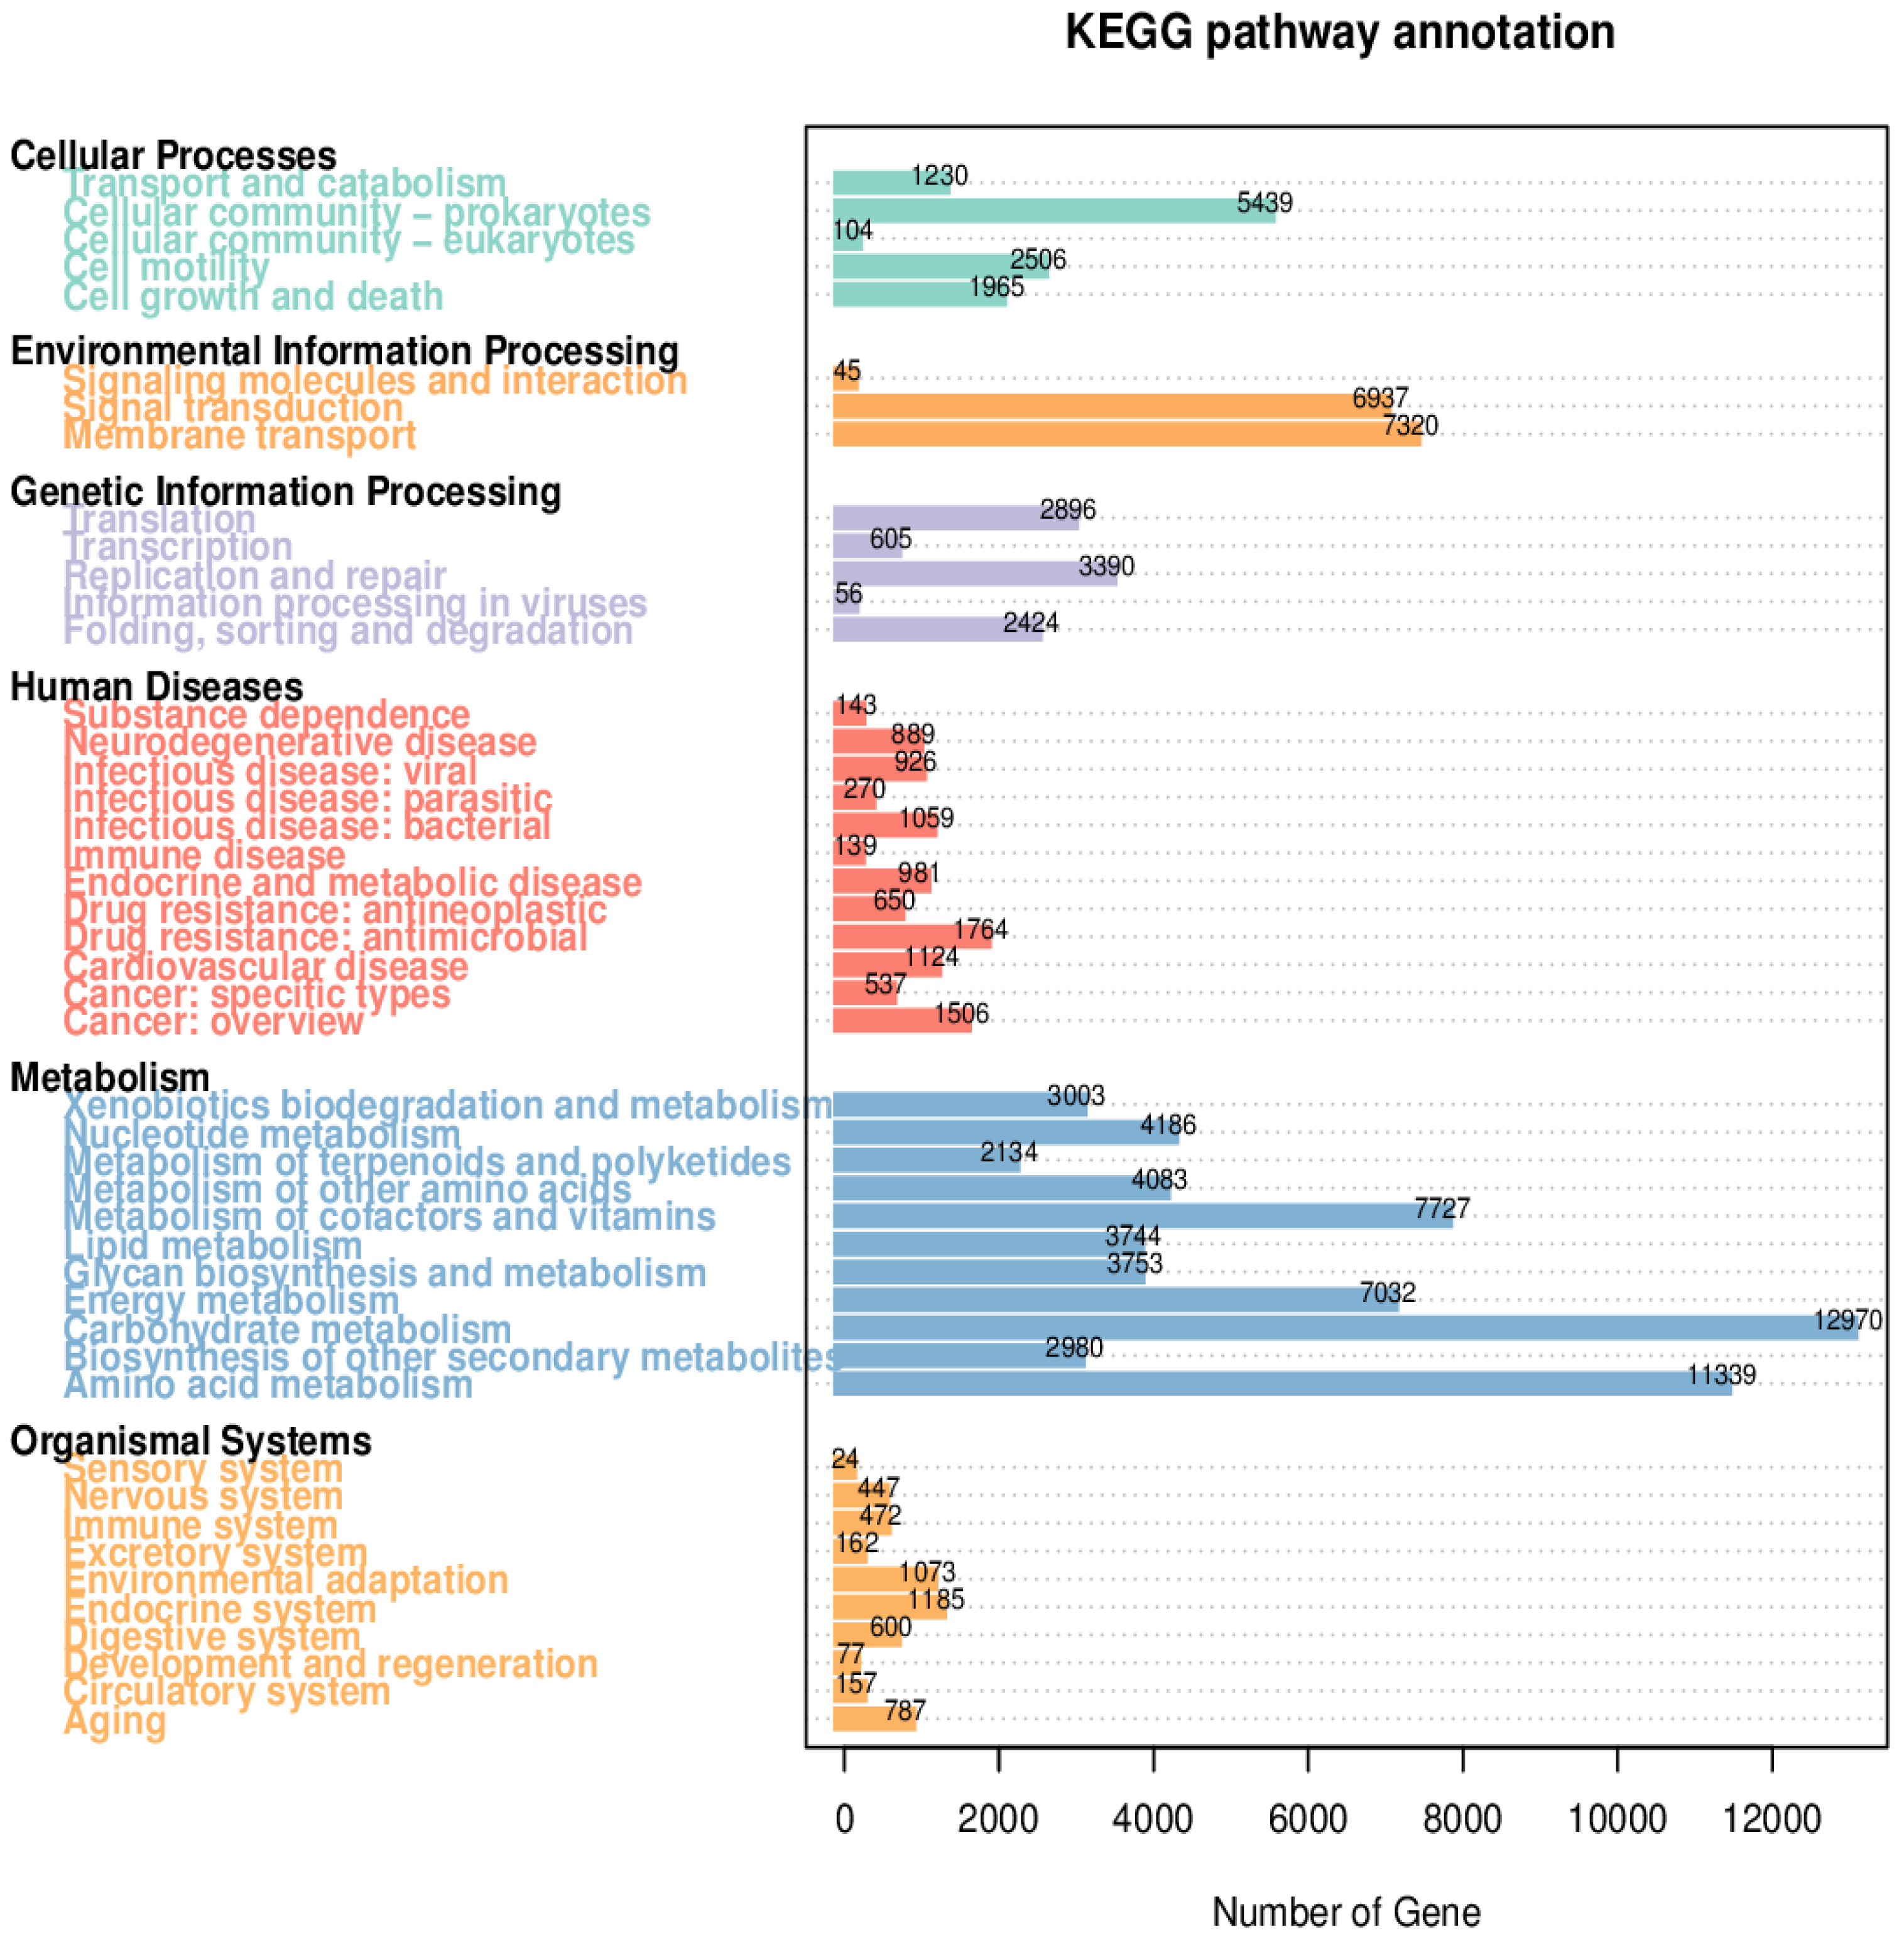
Figure 5.
Illustrating KEGG pathway cluster heat maps: A) Metabolic functions at Level 1, B) Gene codes at the EC Genenum level, C) Module codes at the Genenum level, D) Subcellular functions at Level 2, and E) Subcellular functions at Level 3.
Figure 5.
Illustrating KEGG pathway cluster heat maps: A) Metabolic functions at Level 1, B) Gene codes at the EC Genenum level, C) Module codes at the Genenum level, D) Subcellular functions at Level 2, and E) Subcellular functions at Level 3.
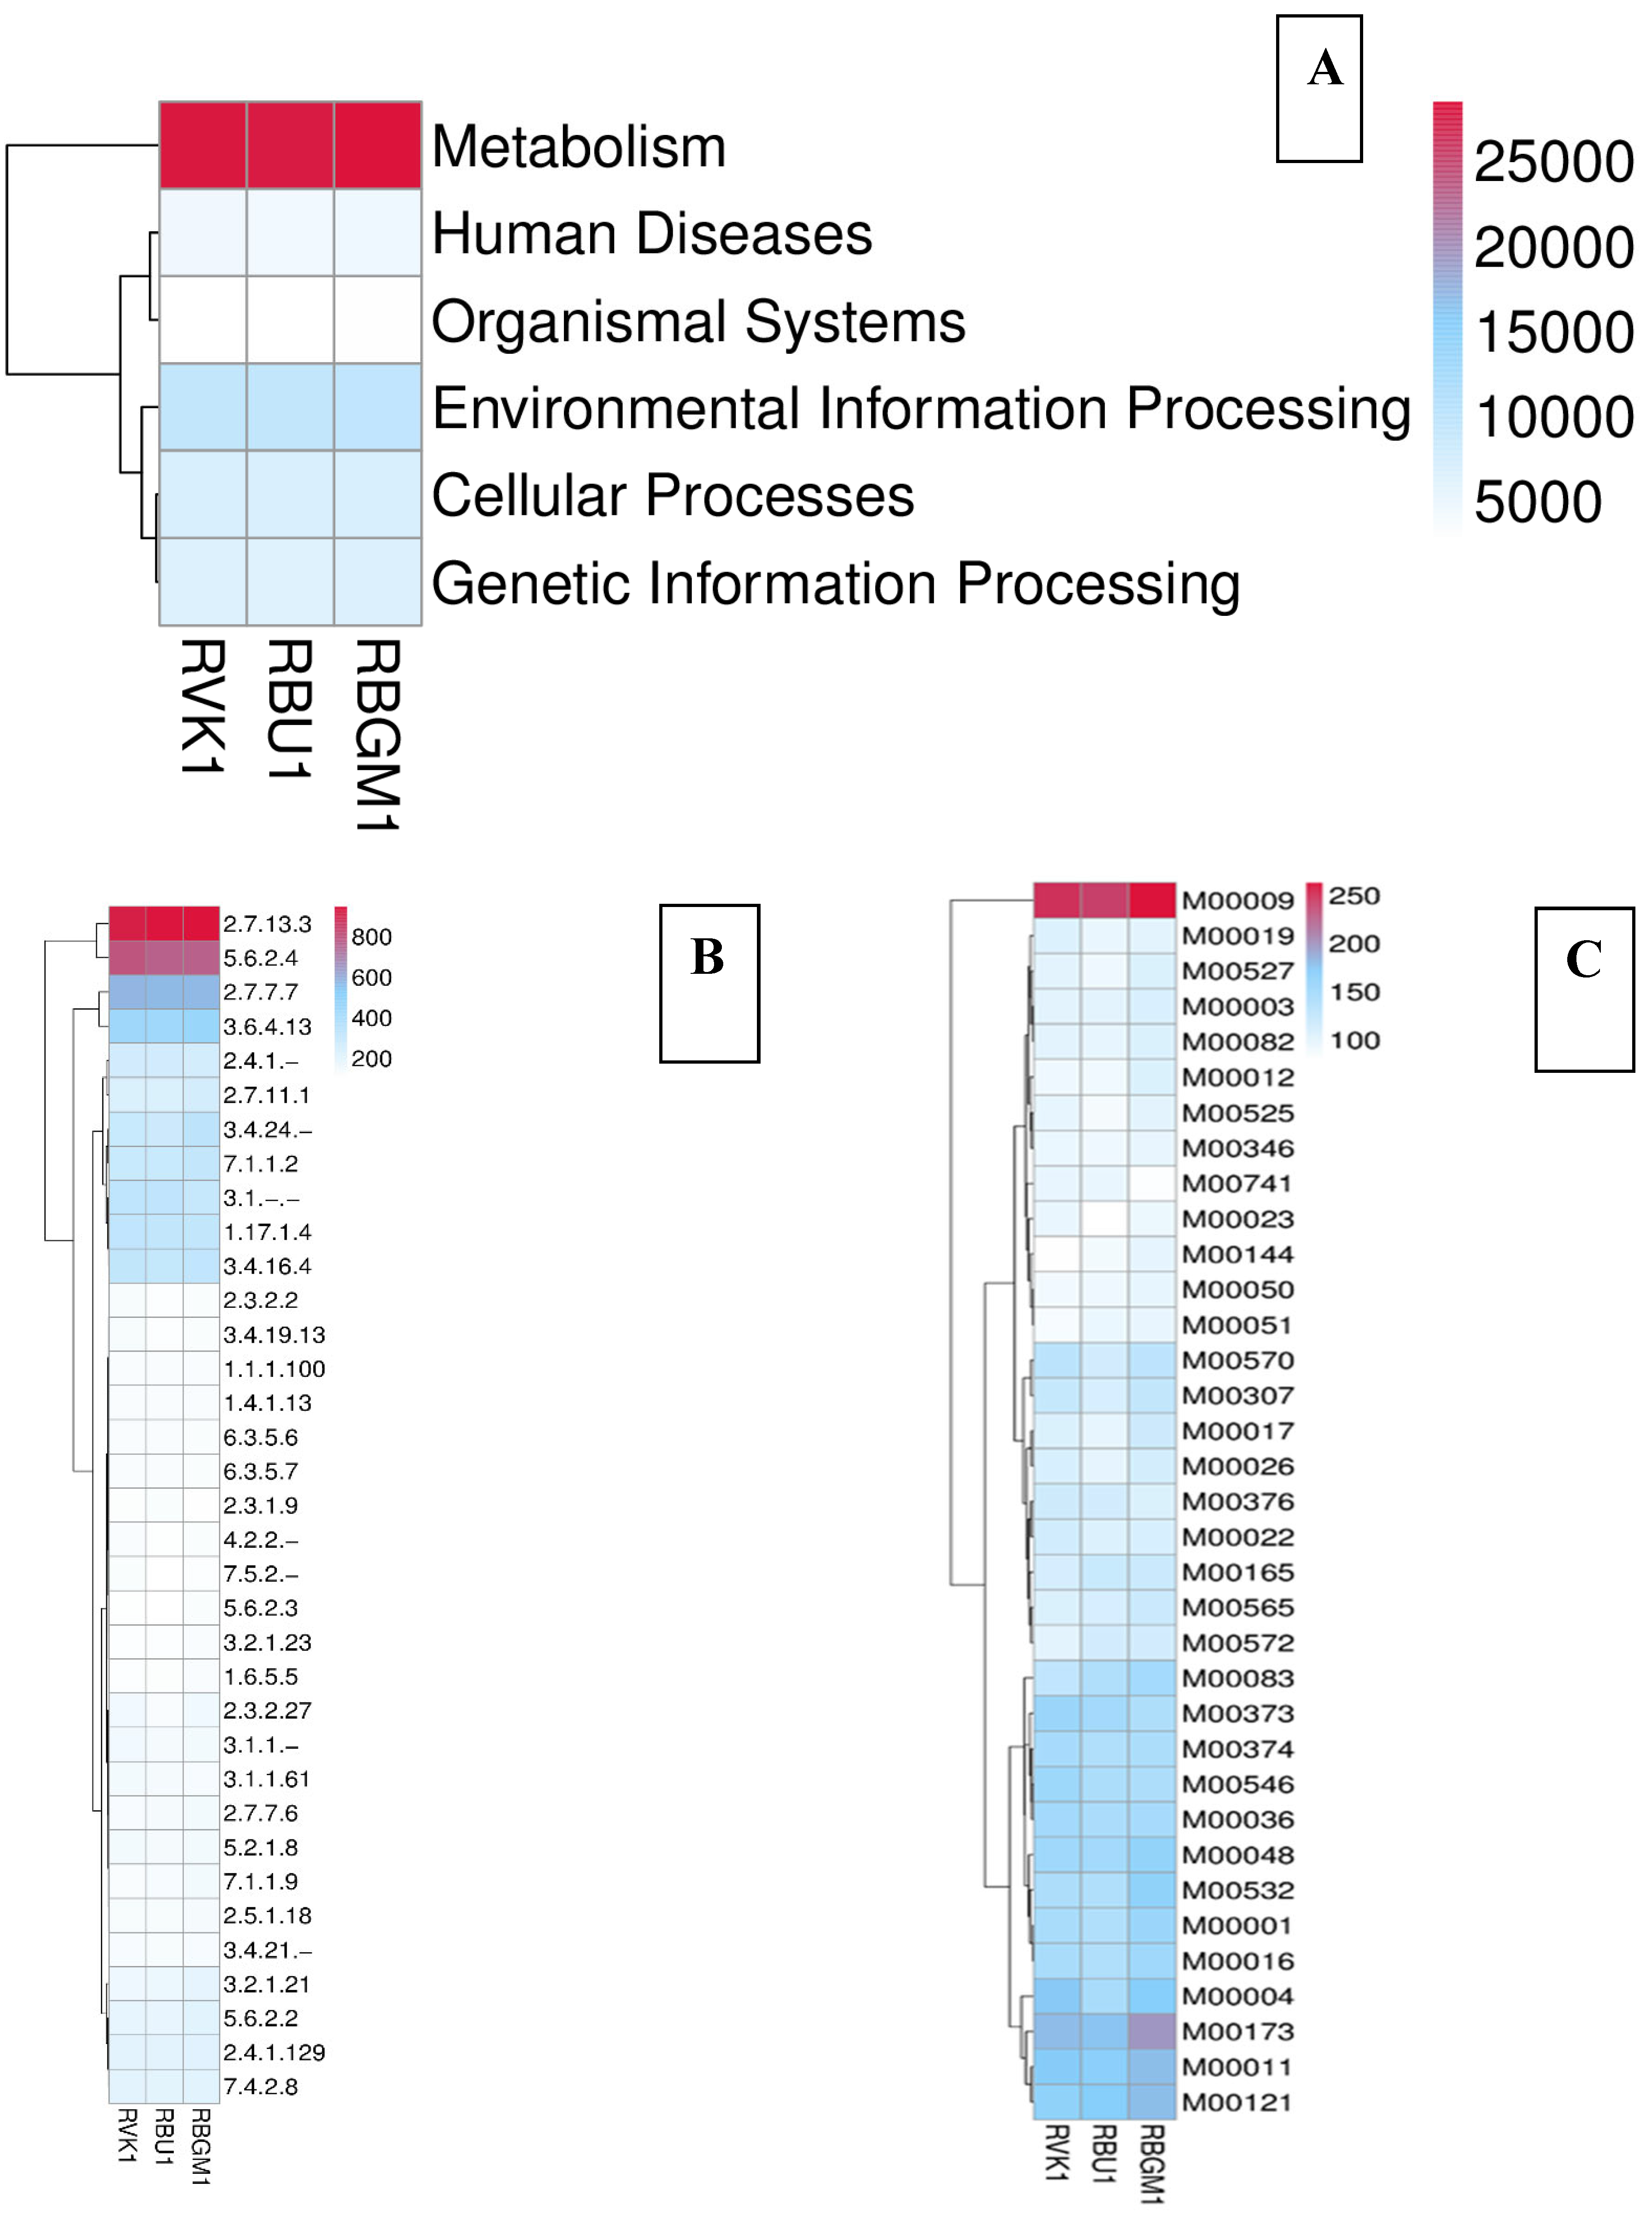
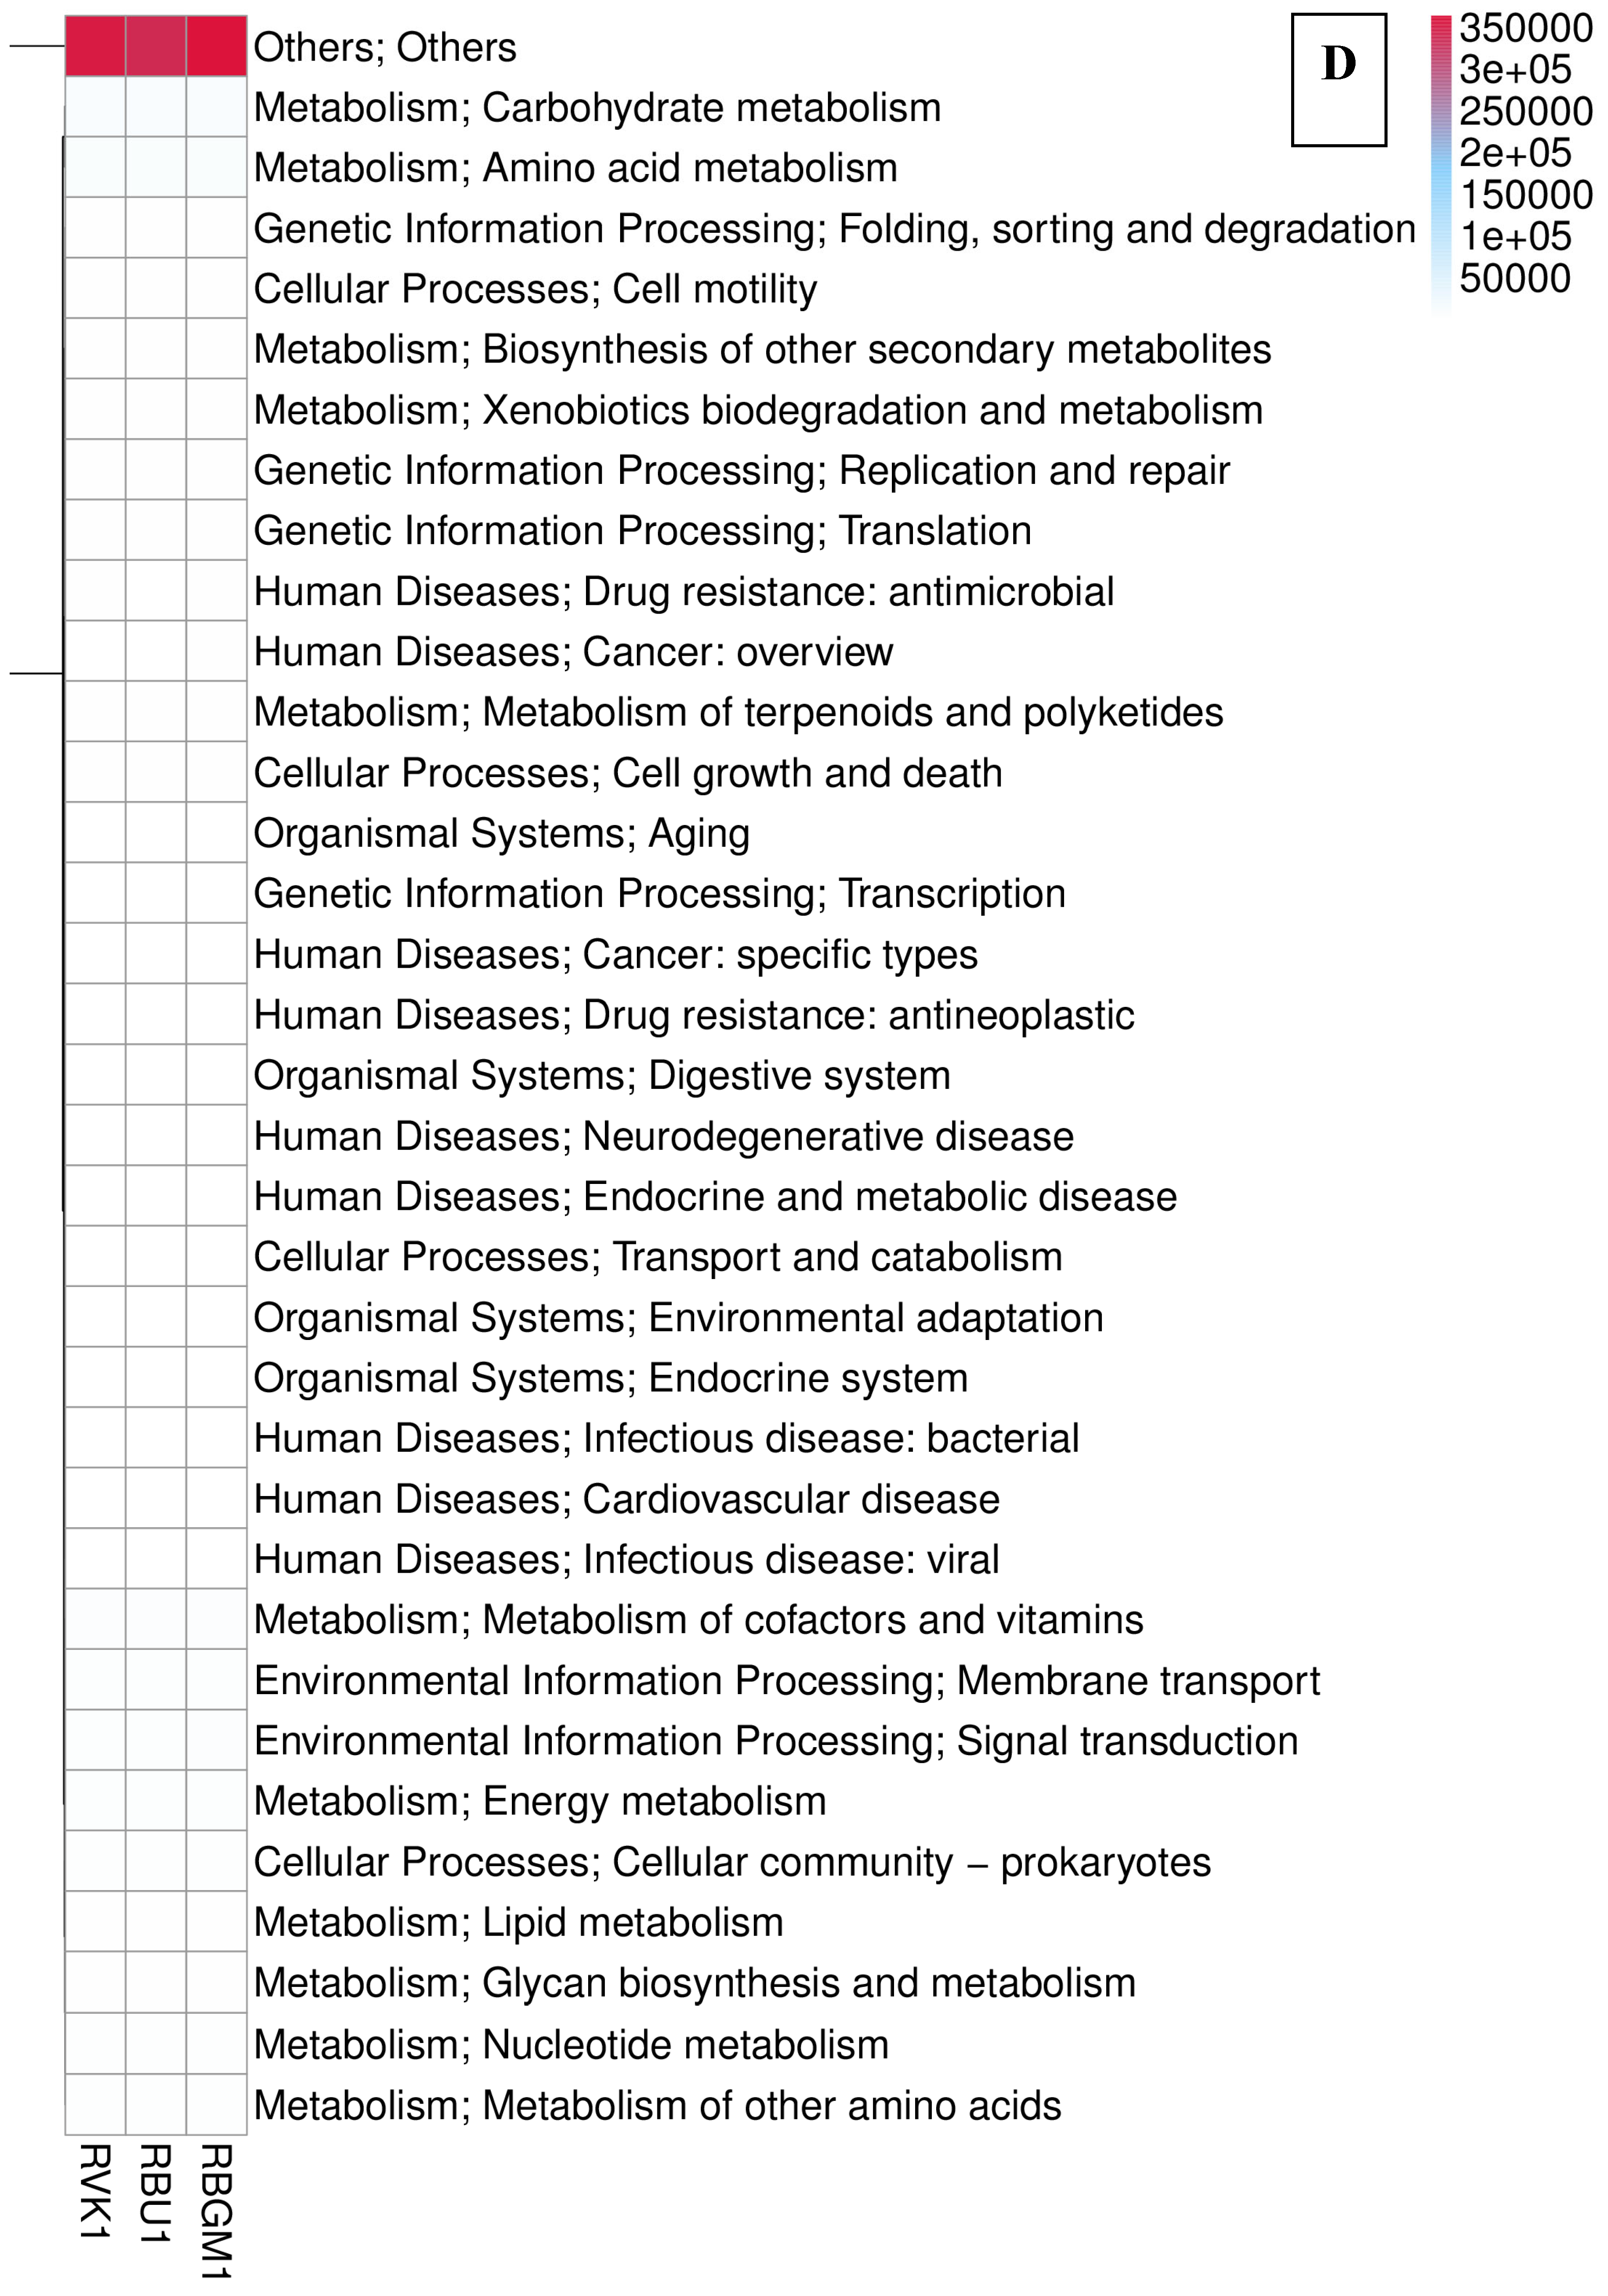
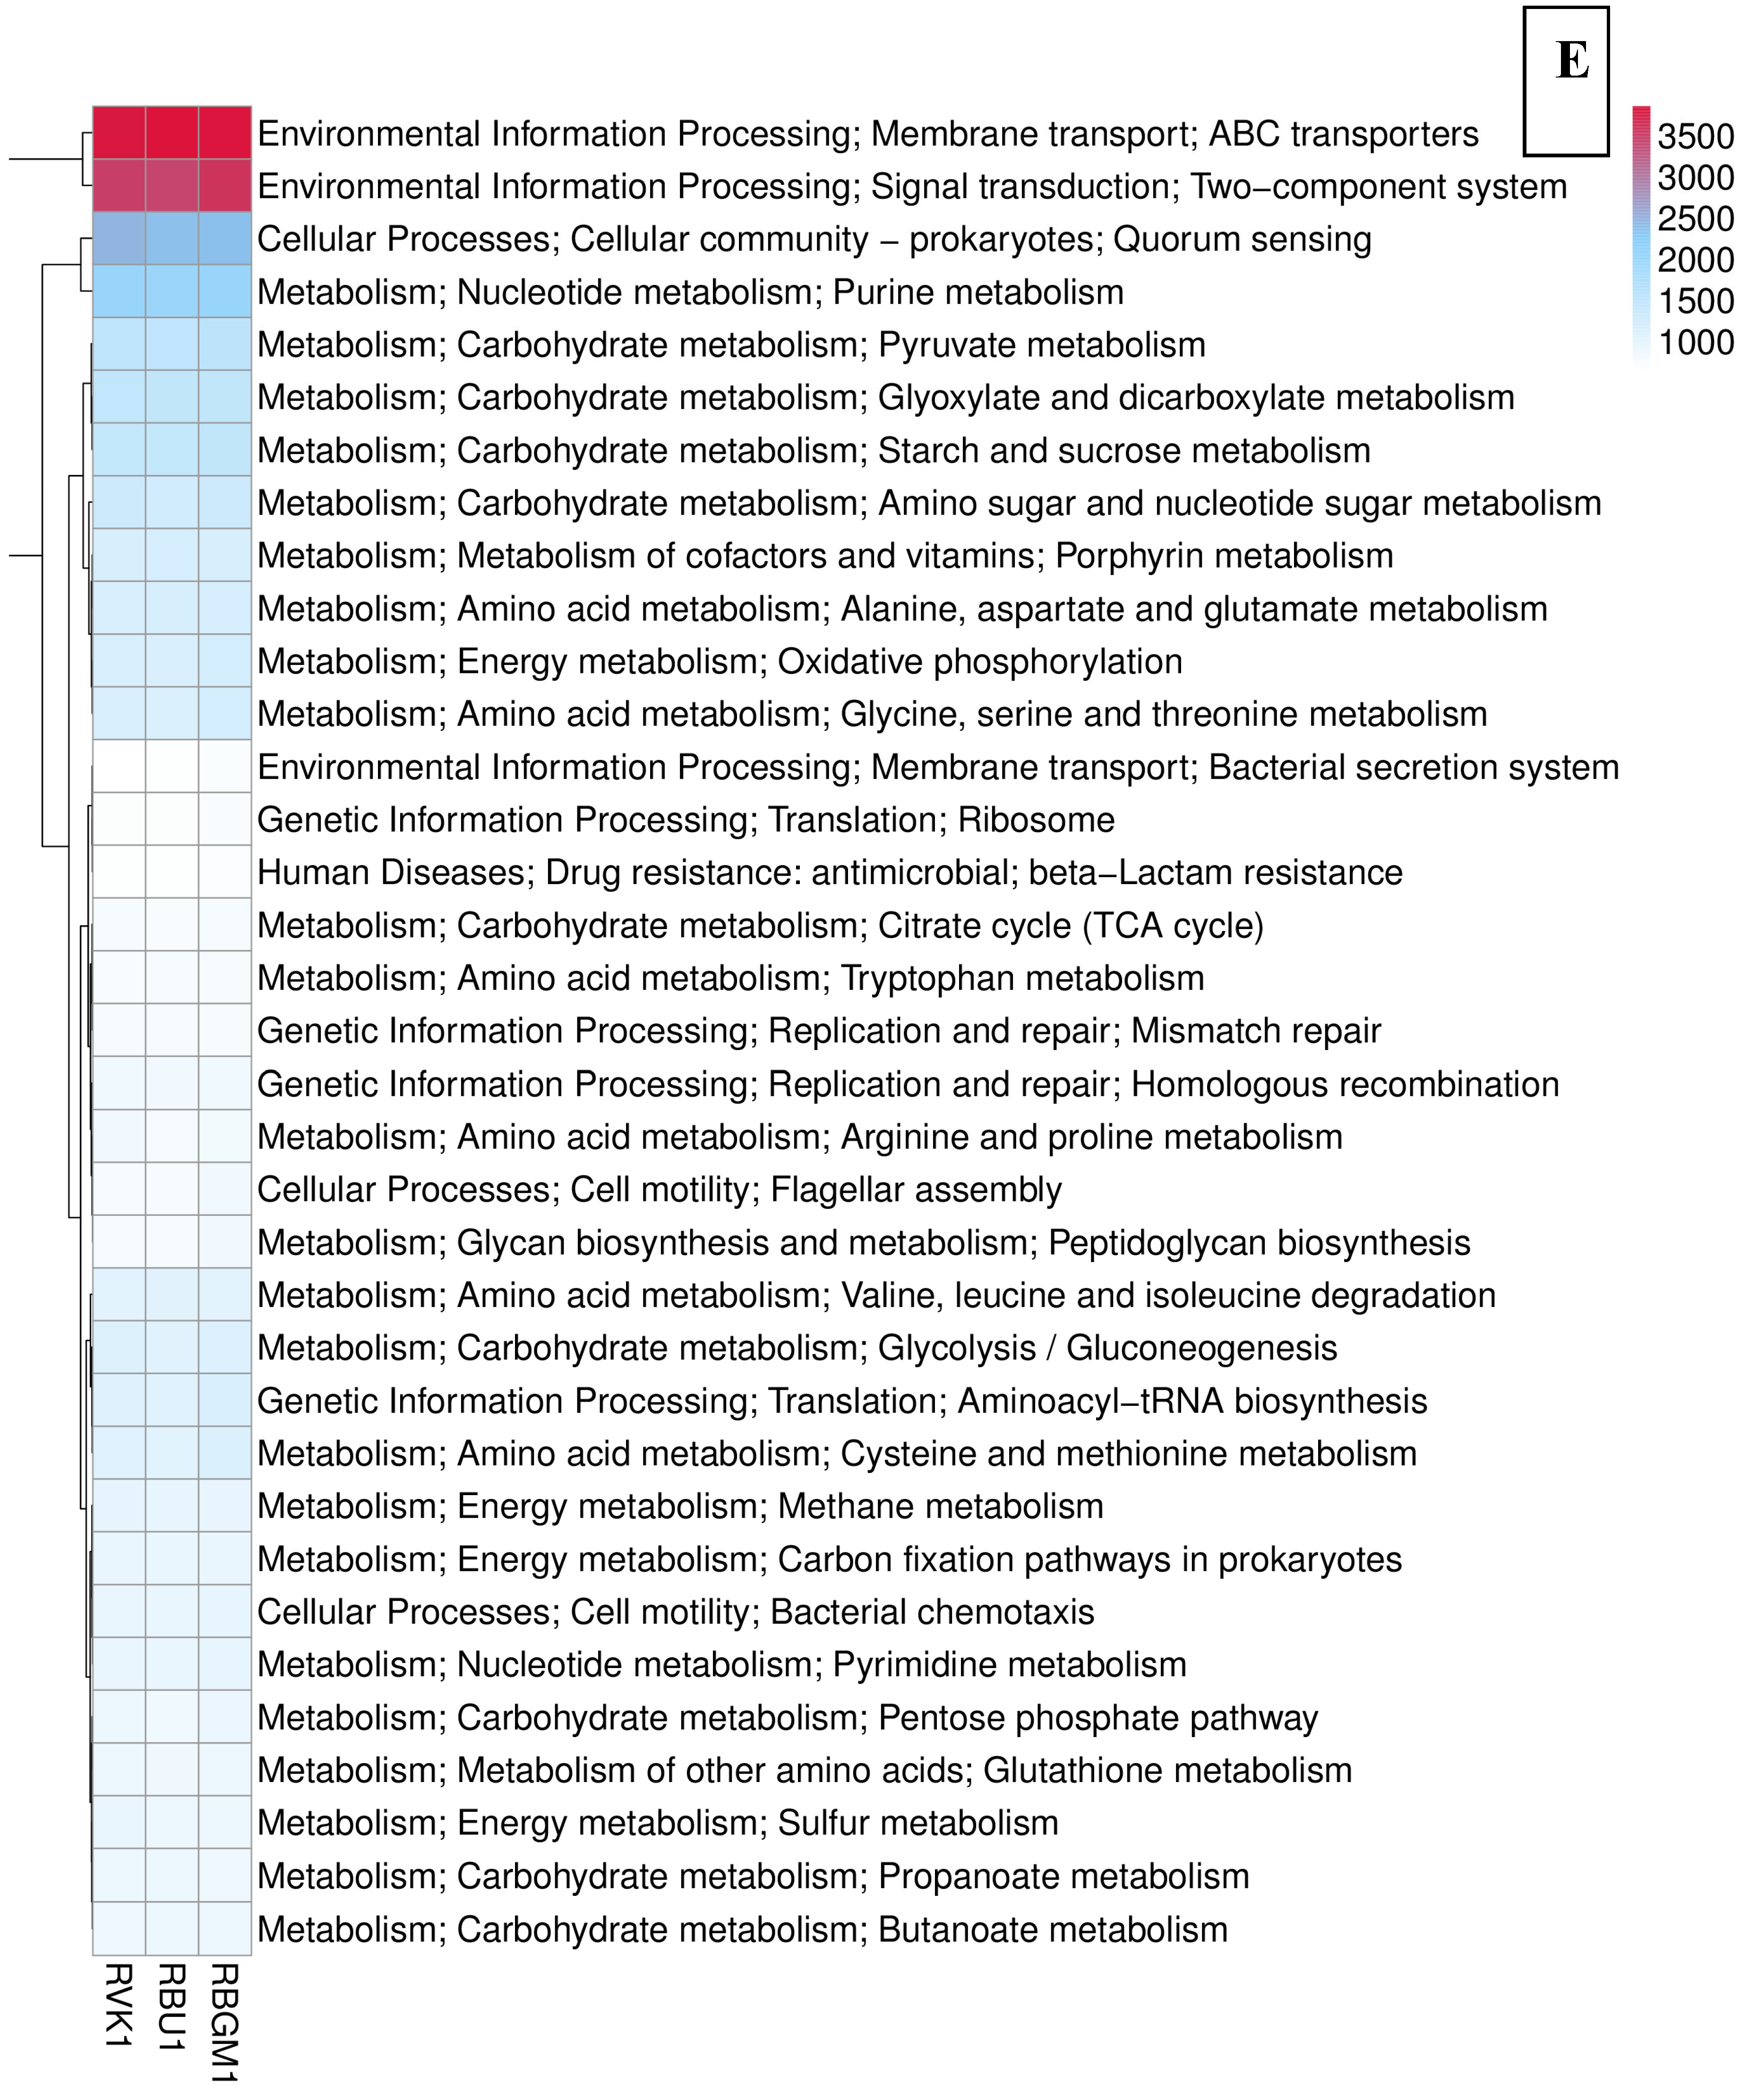
Figure 6.
Illustrating the spatial distribution of the samples RBU1, RBGM1, and RVK1 after Principal Component Analysis (PCA).
Figure 6.
Illustrating the spatial distribution of the samples RBU1, RBGM1, and RVK1 after Principal Component Analysis (PCA).
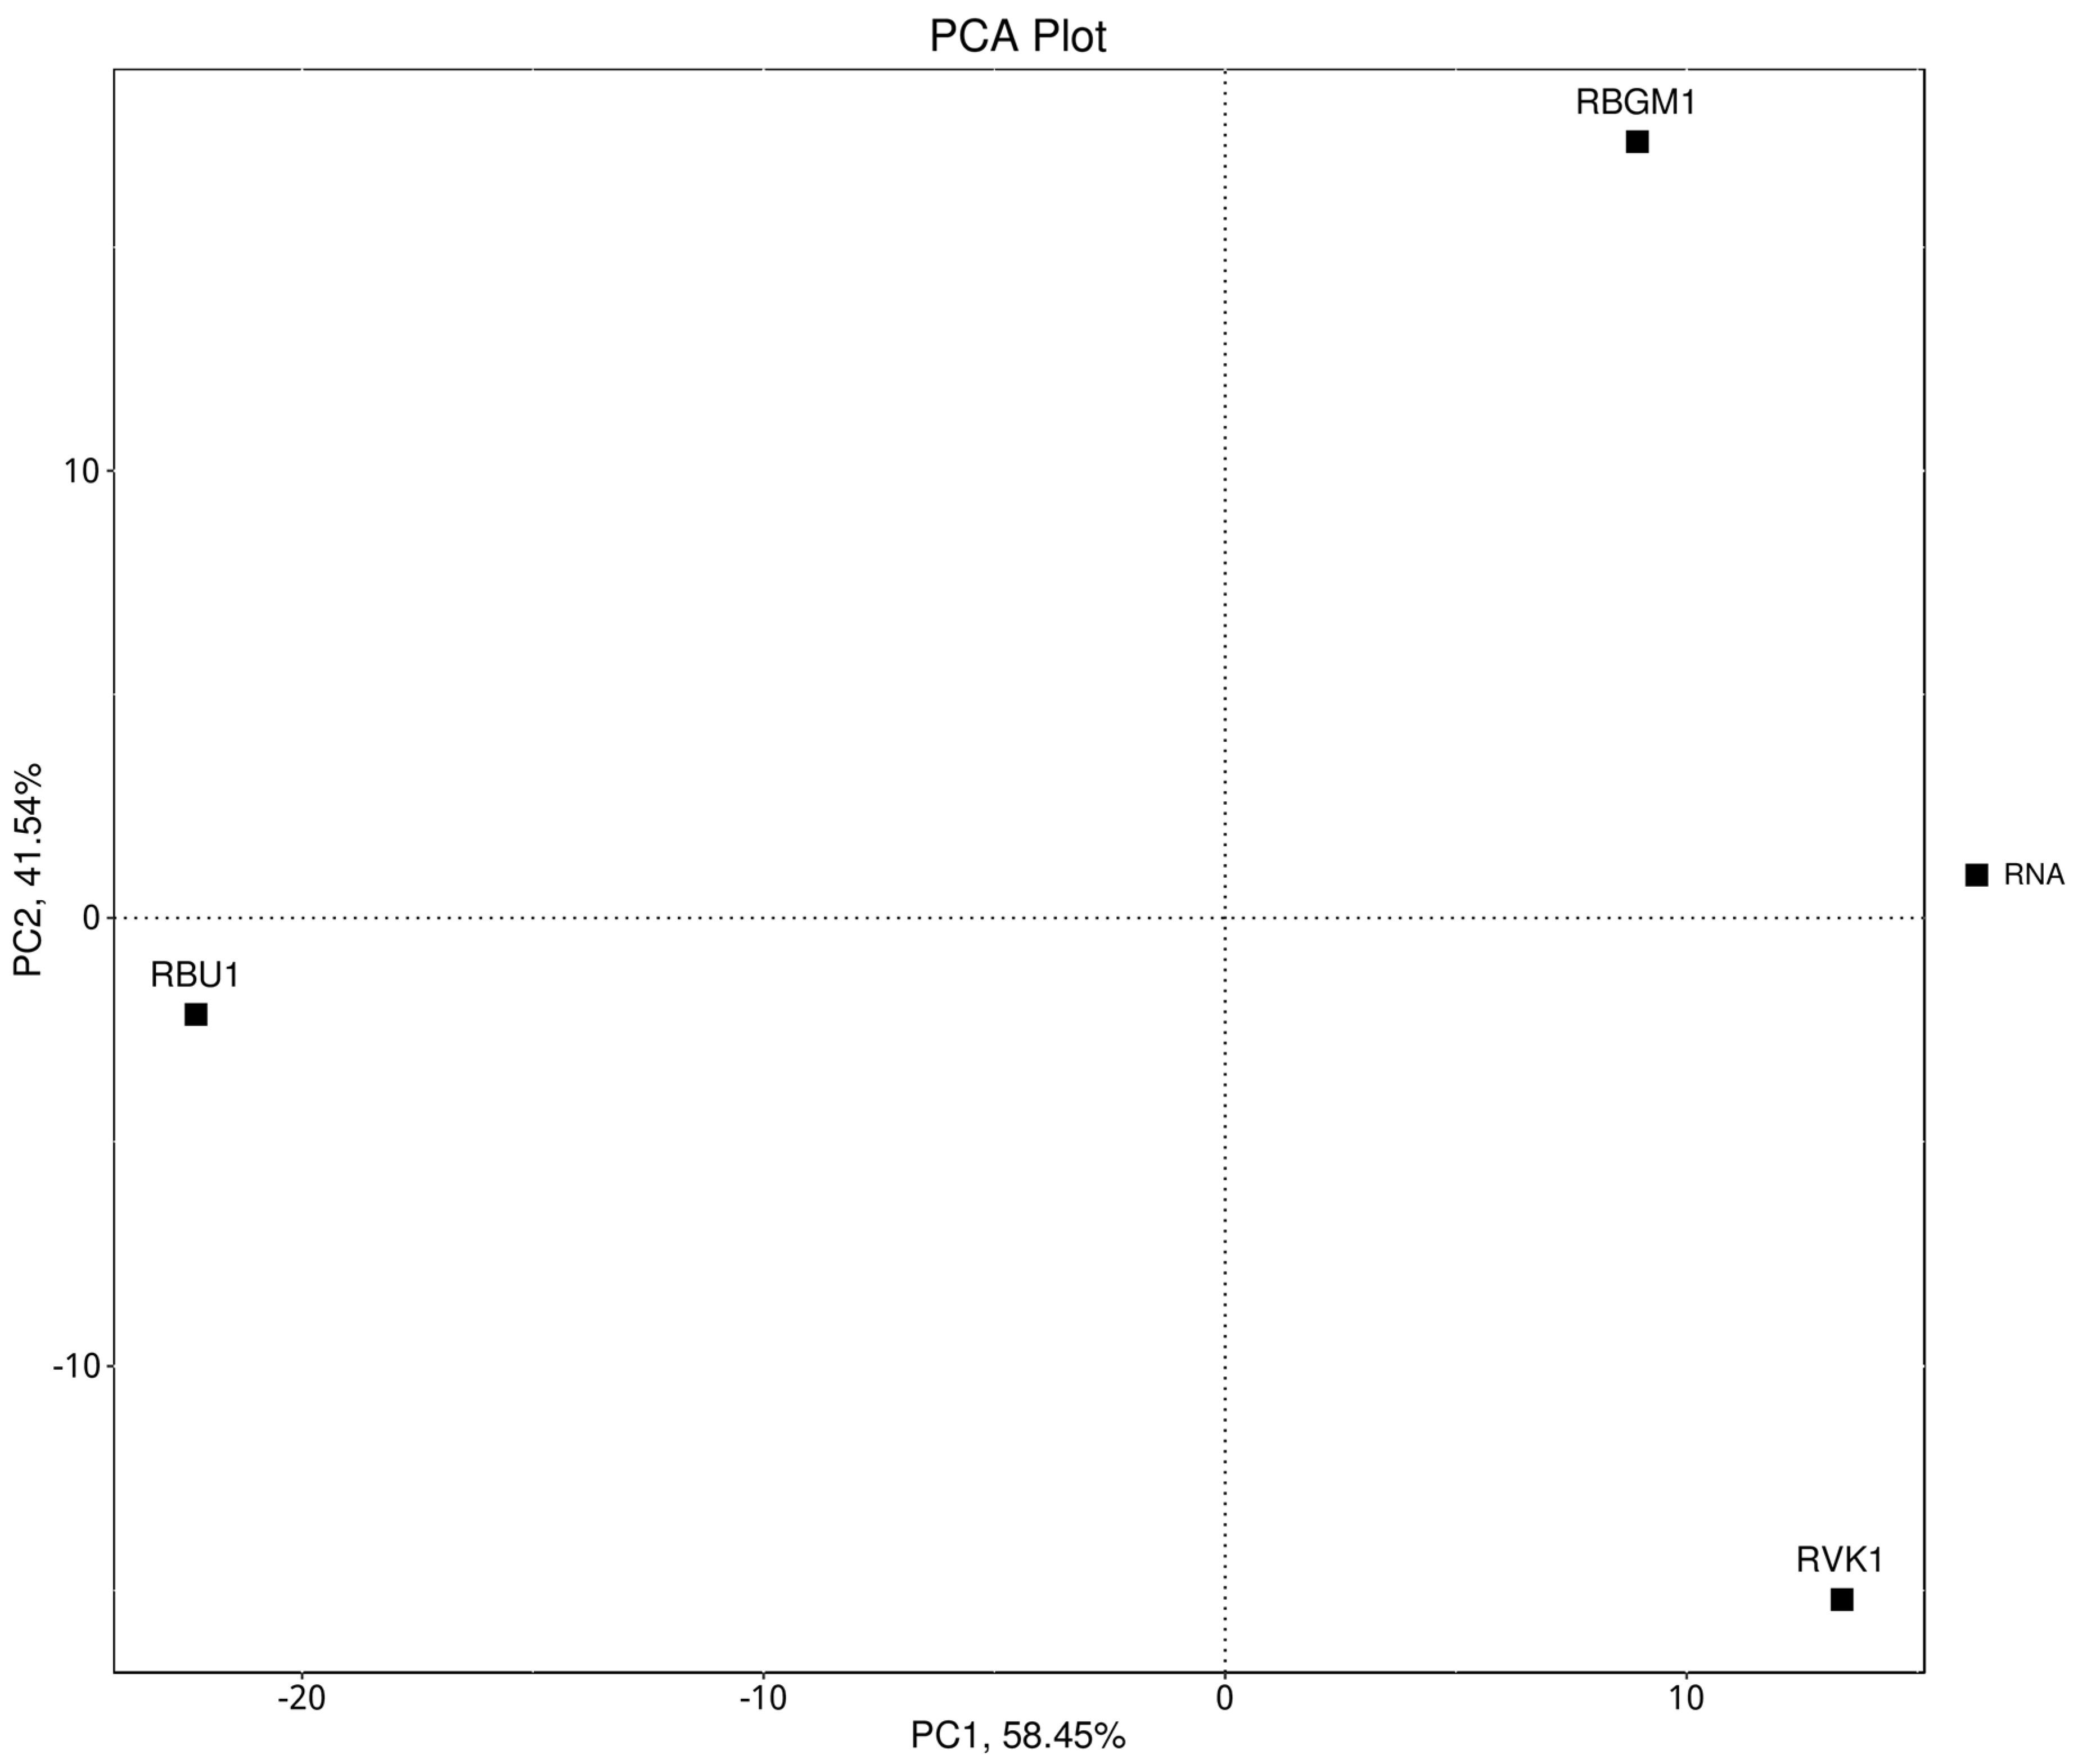
Figure 7.
Illustrating heat maps for EggNog functional annotations: A) Level one functional annotation and the corresponding matched genes, B) Level two functional annotation and the corresponding matched genes, C) Orthologs functional annotation and the corresponding genes.
Figure 7.
Illustrating heat maps for EggNog functional annotations: A) Level one functional annotation and the corresponding matched genes, B) Level two functional annotation and the corresponding matched genes, C) Orthologs functional annotation and the corresponding genes.
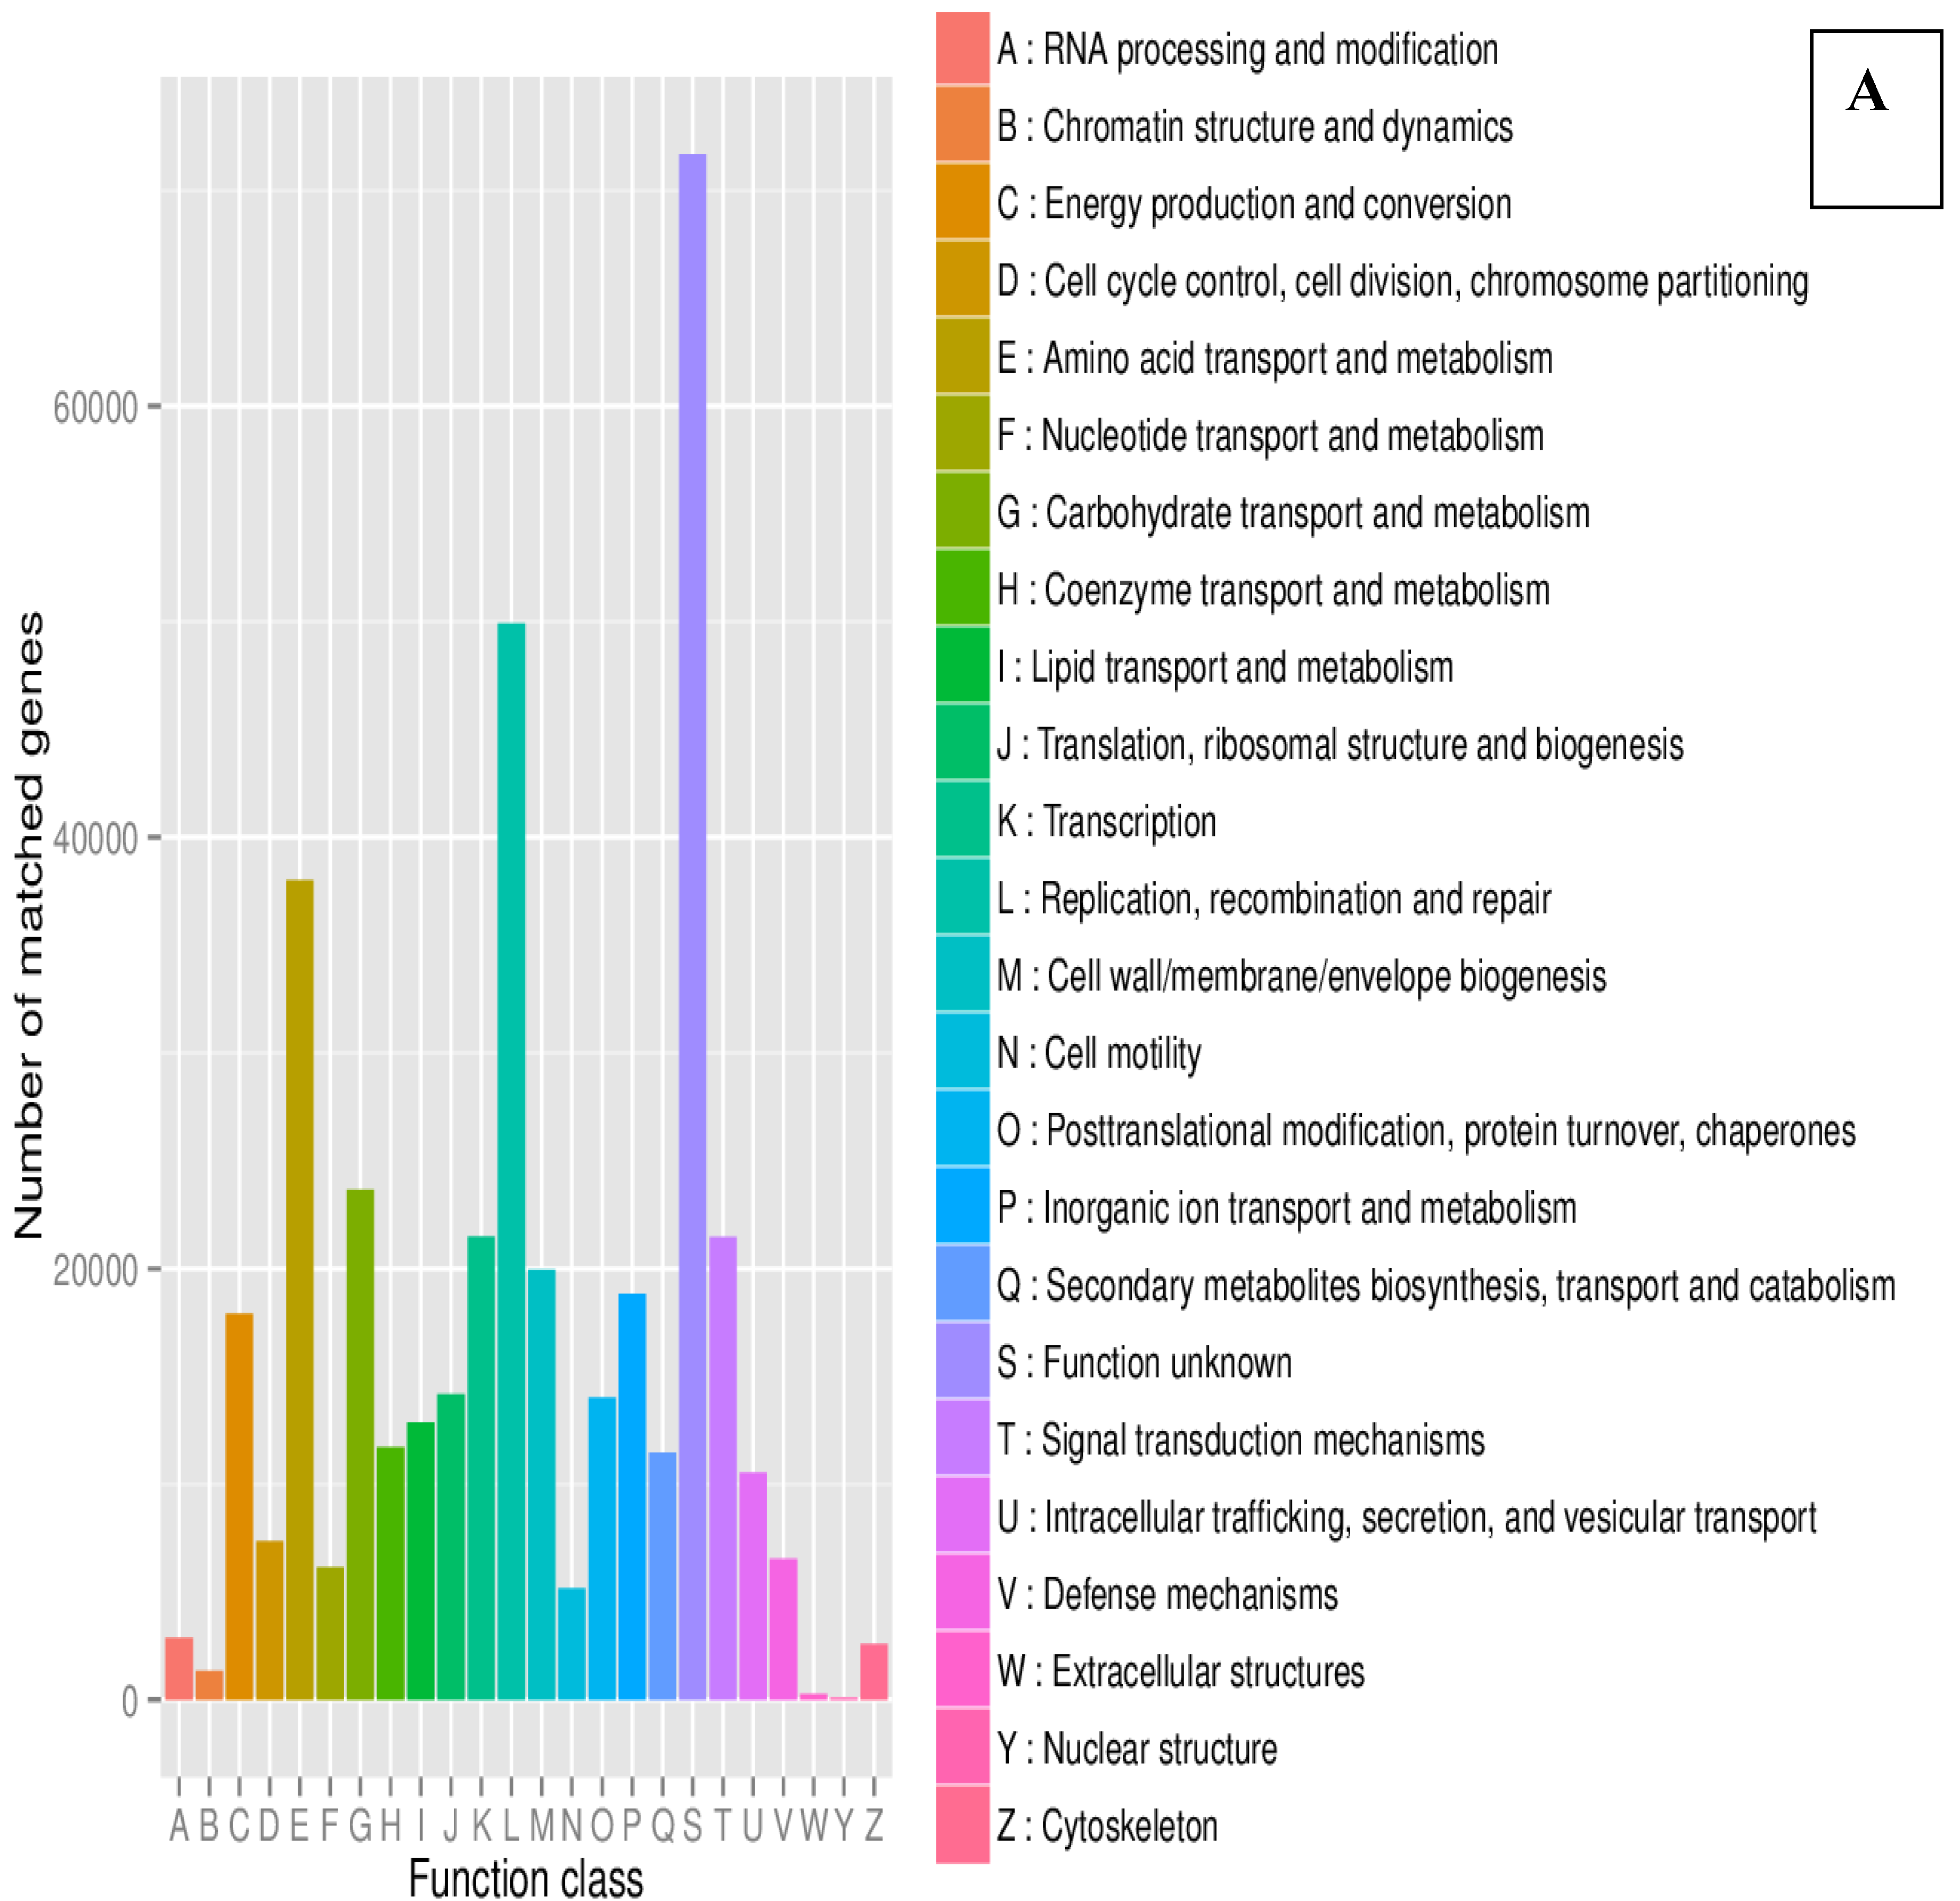
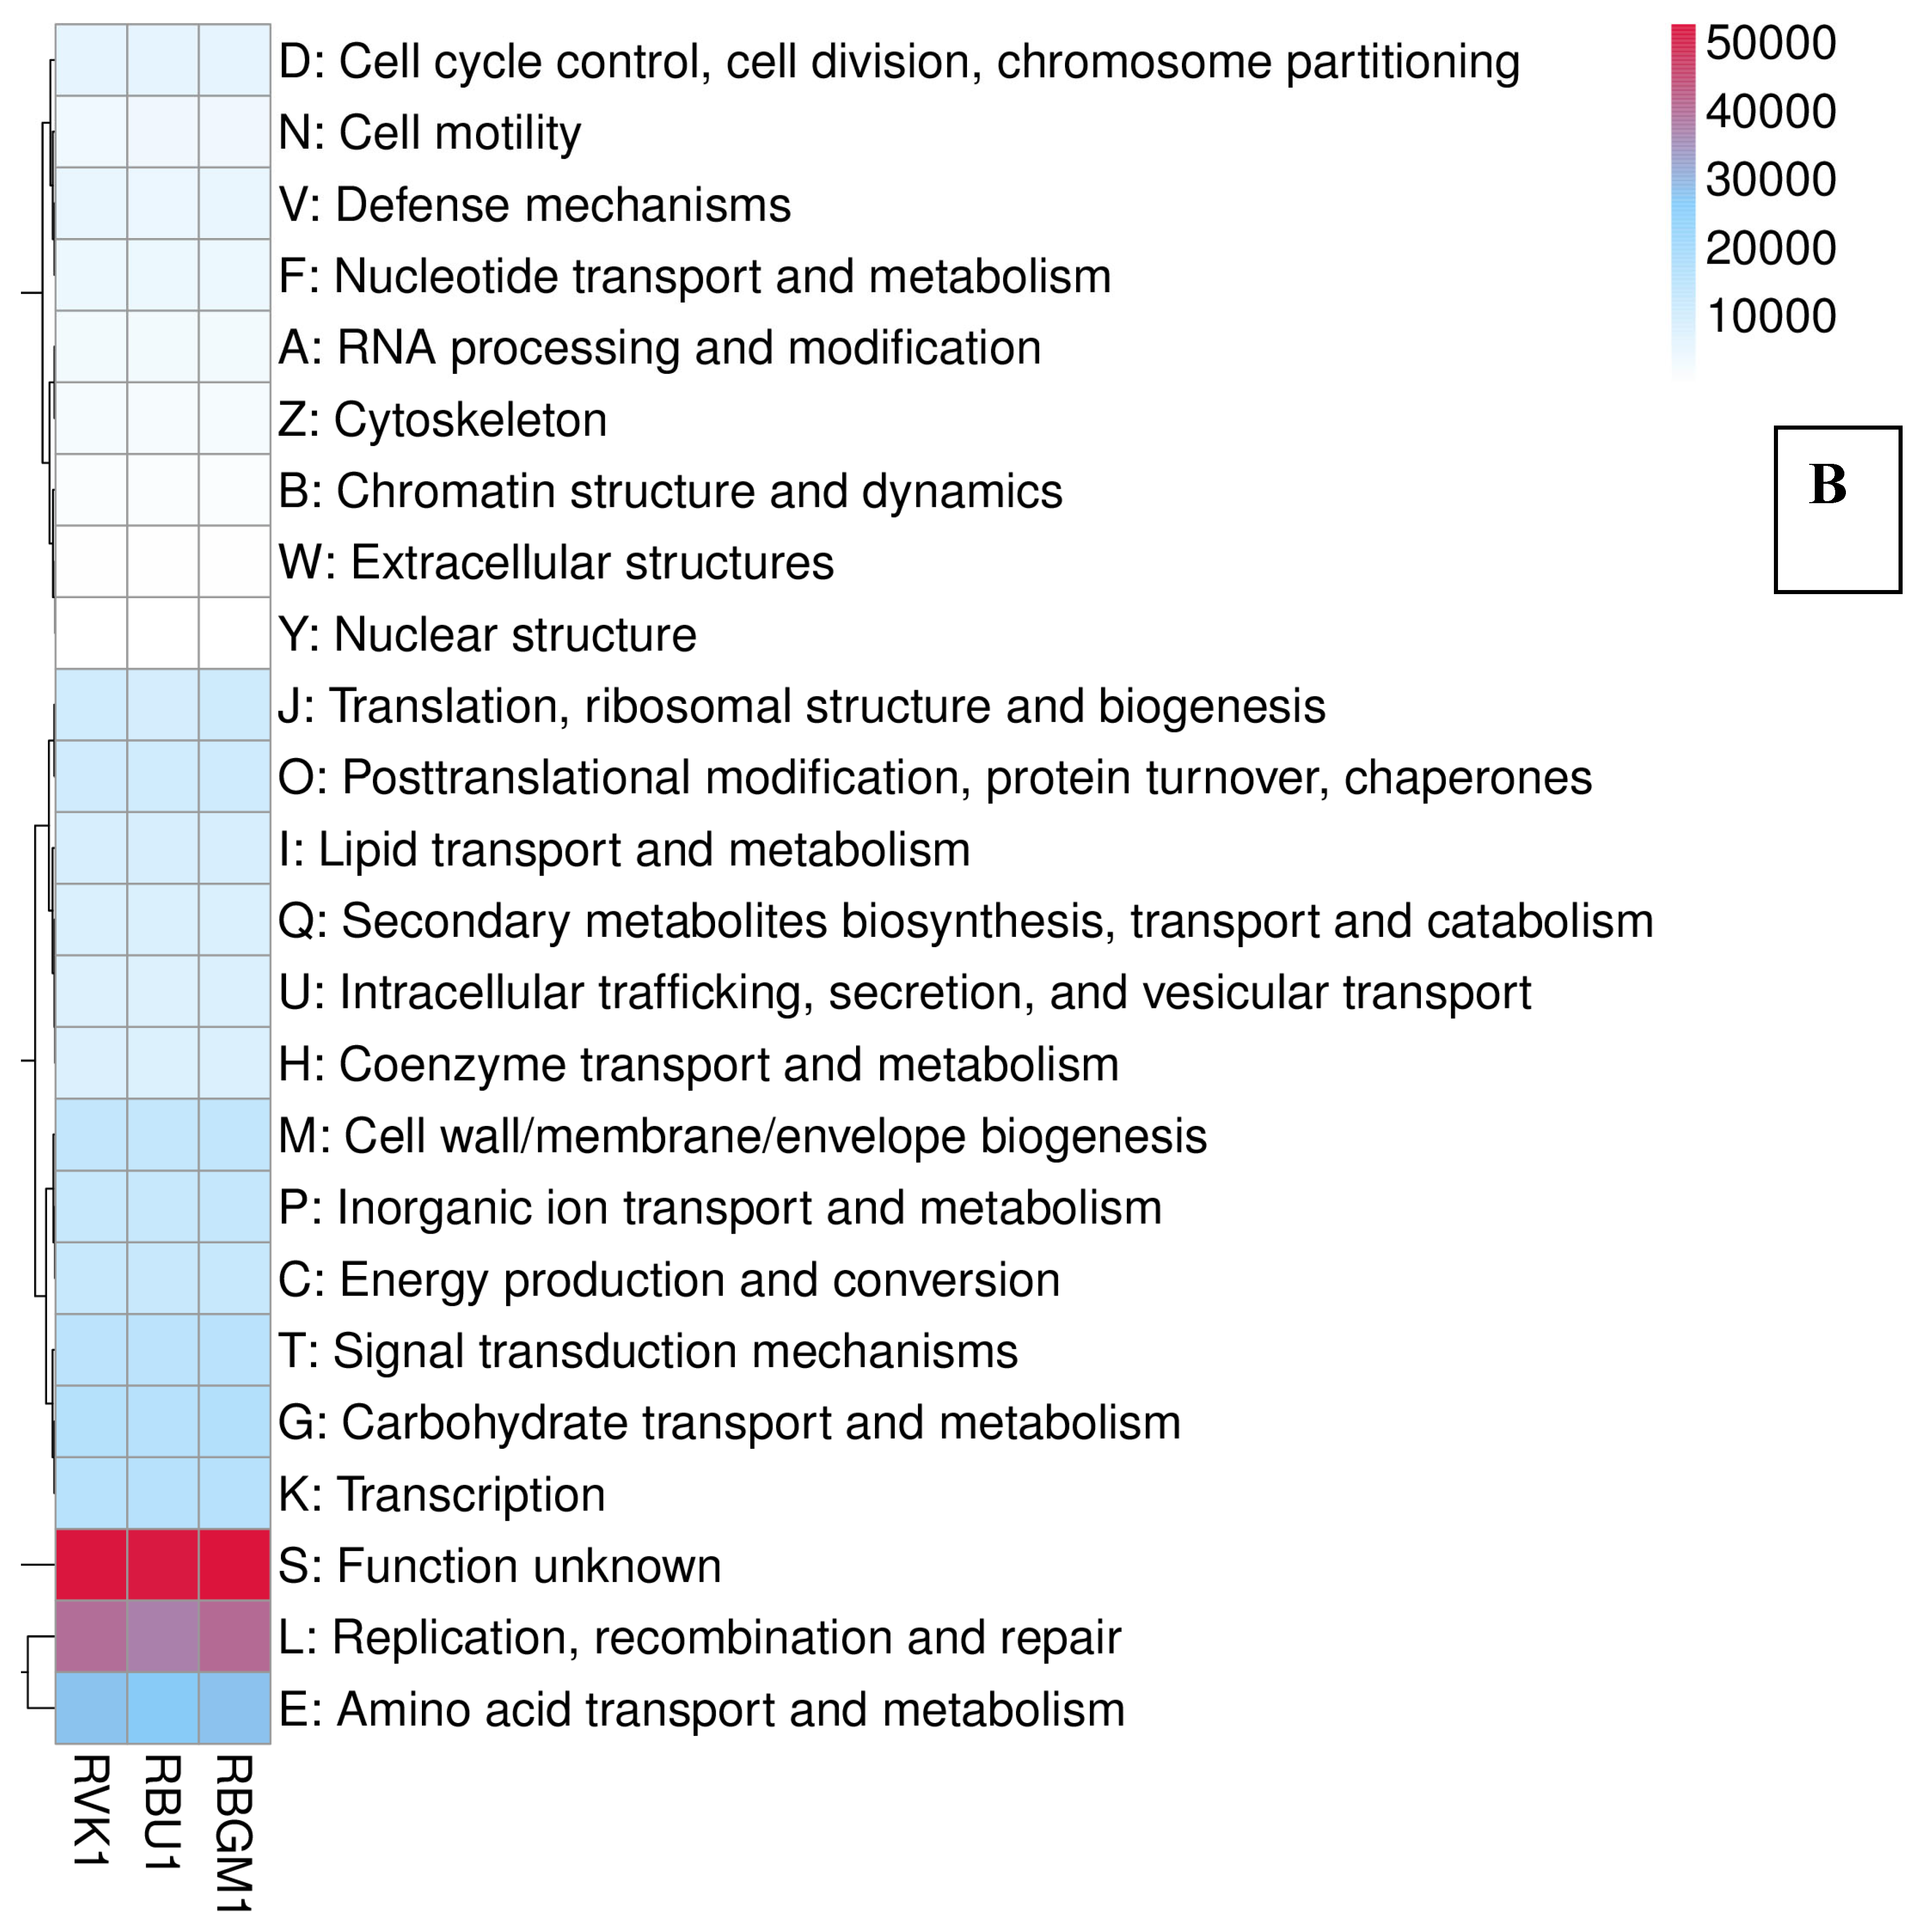
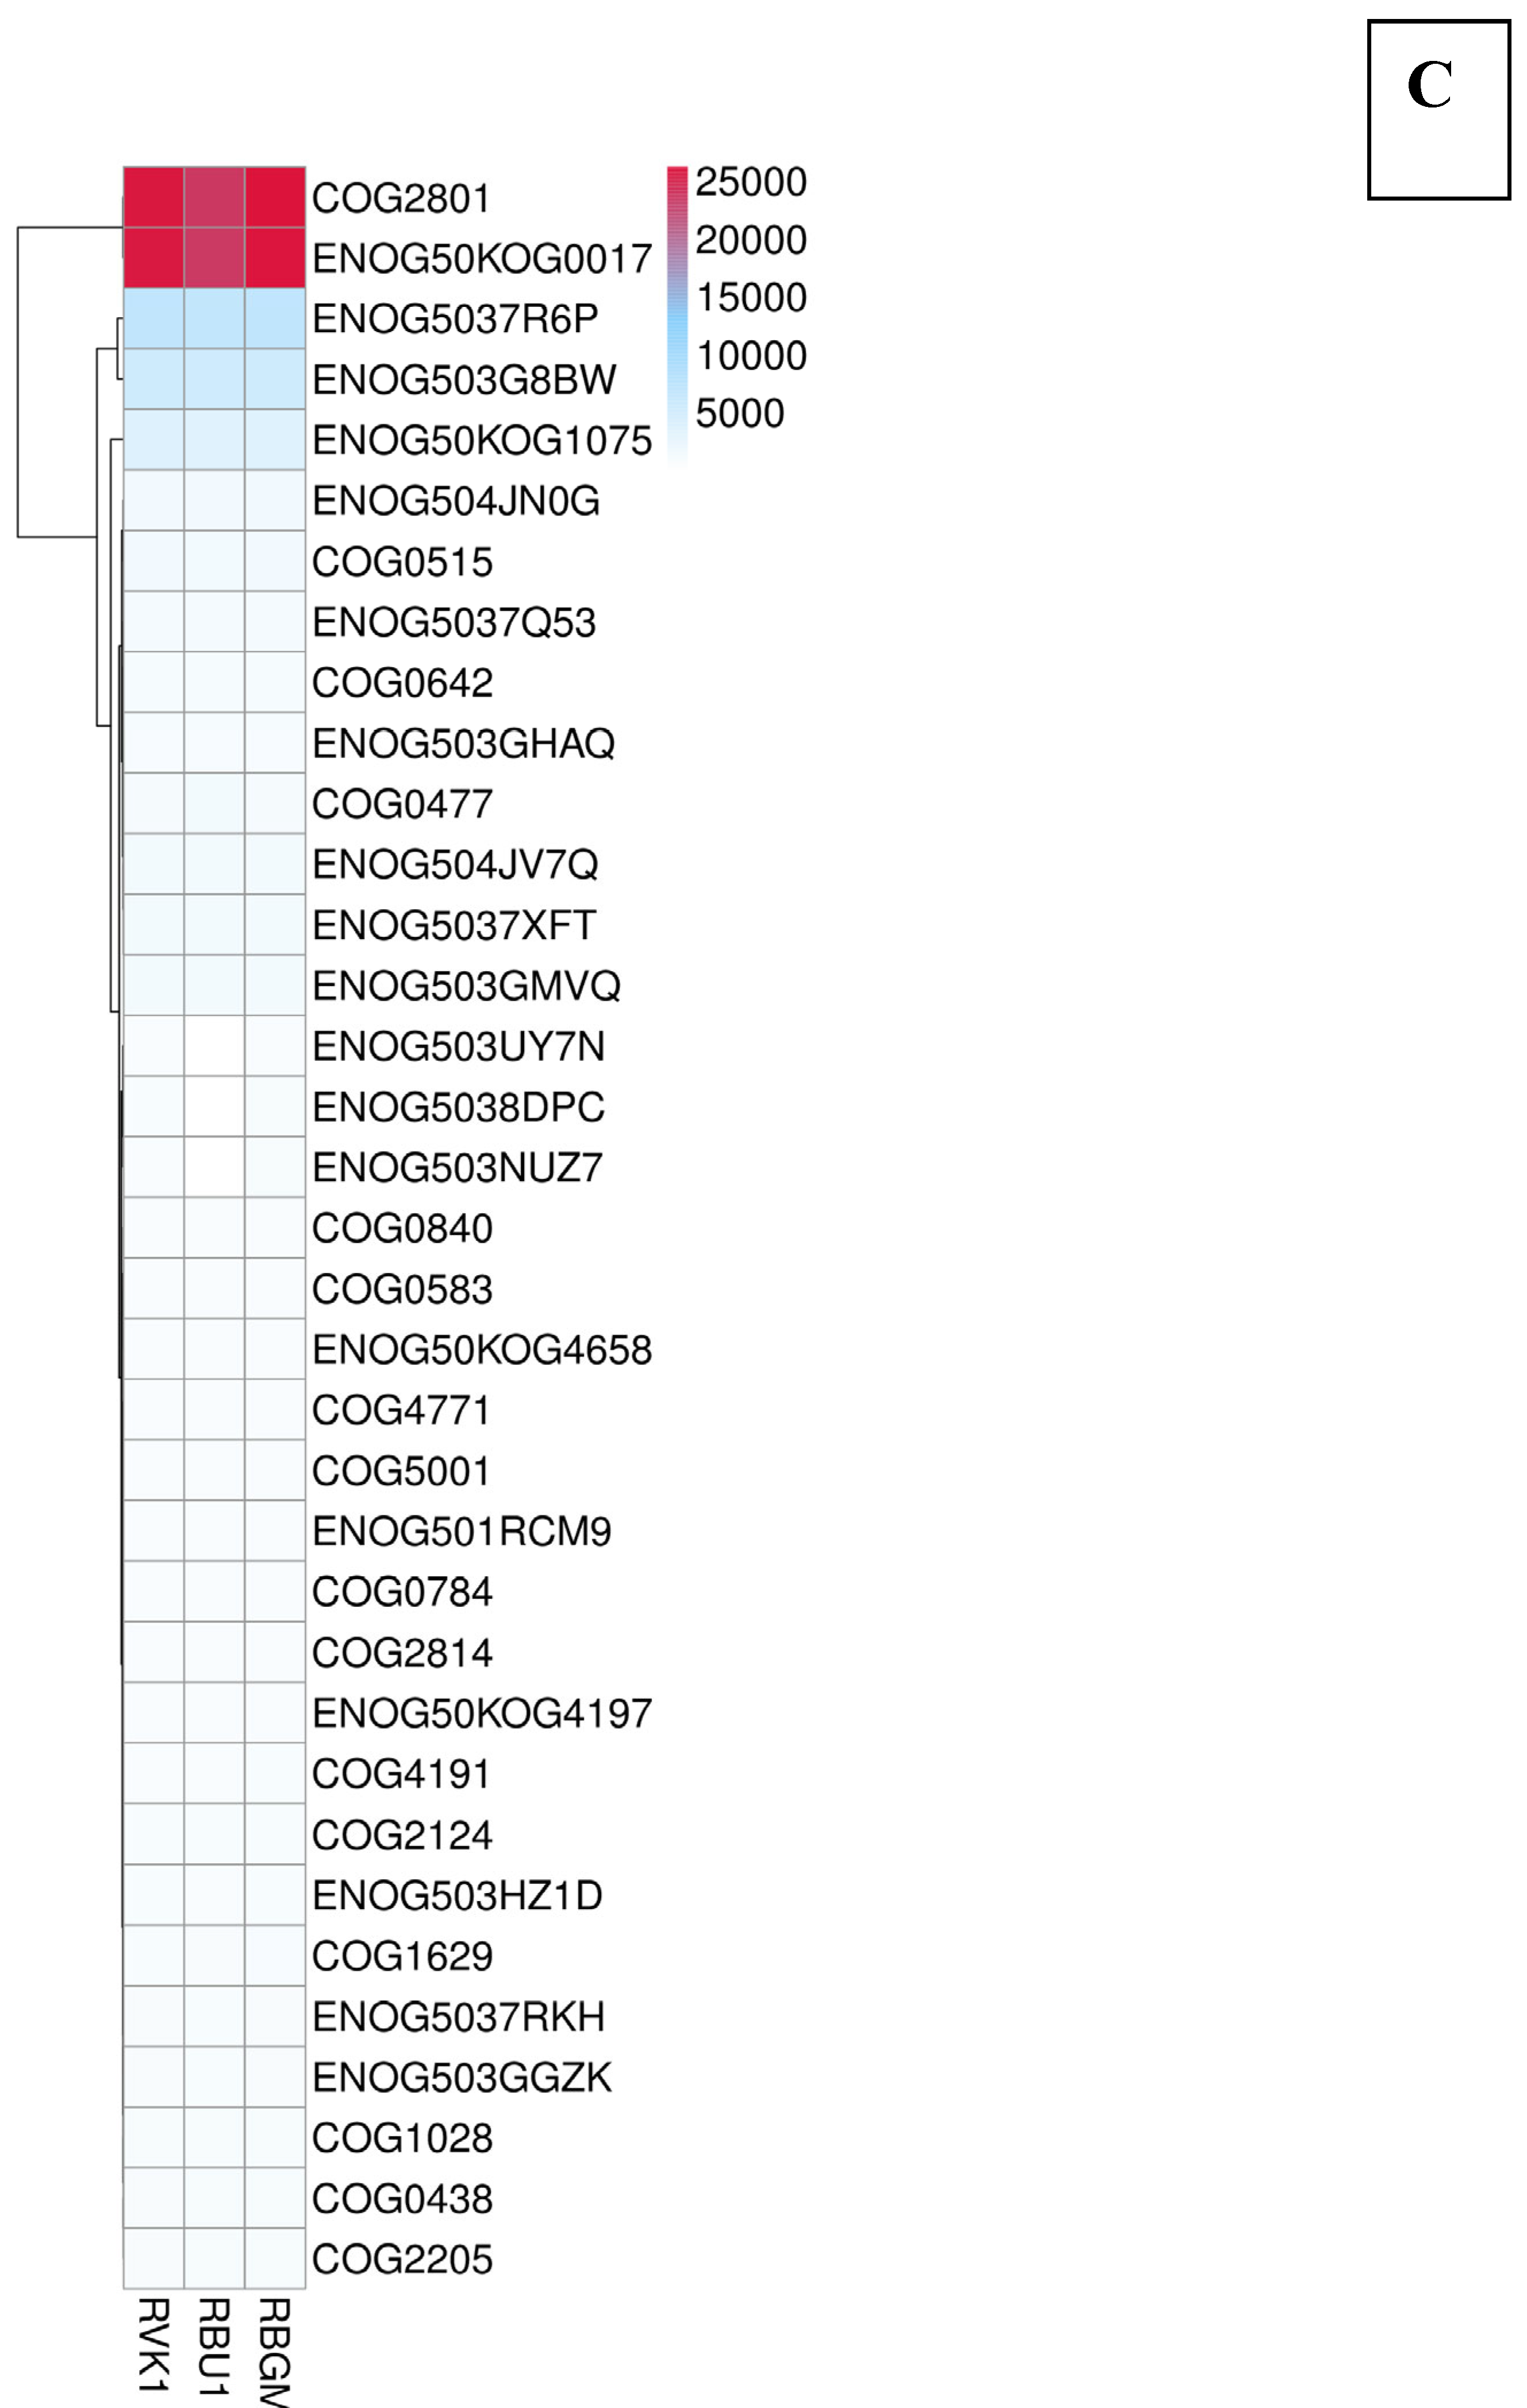
Figure 8.
Displaying A) CAZy level one functional annotation with matched genes, B) Heat map of level two carbohydrate-degrading enzymes with corresponding matched genes, and C) Heat map of EC carbohydrate-degrading enzymes with corresponding matched genes.
Figure 8.
Displaying A) CAZy level one functional annotation with matched genes, B) Heat map of level two carbohydrate-degrading enzymes with corresponding matched genes, and C) Heat map of EC carbohydrate-degrading enzymes with corresponding matched genes.
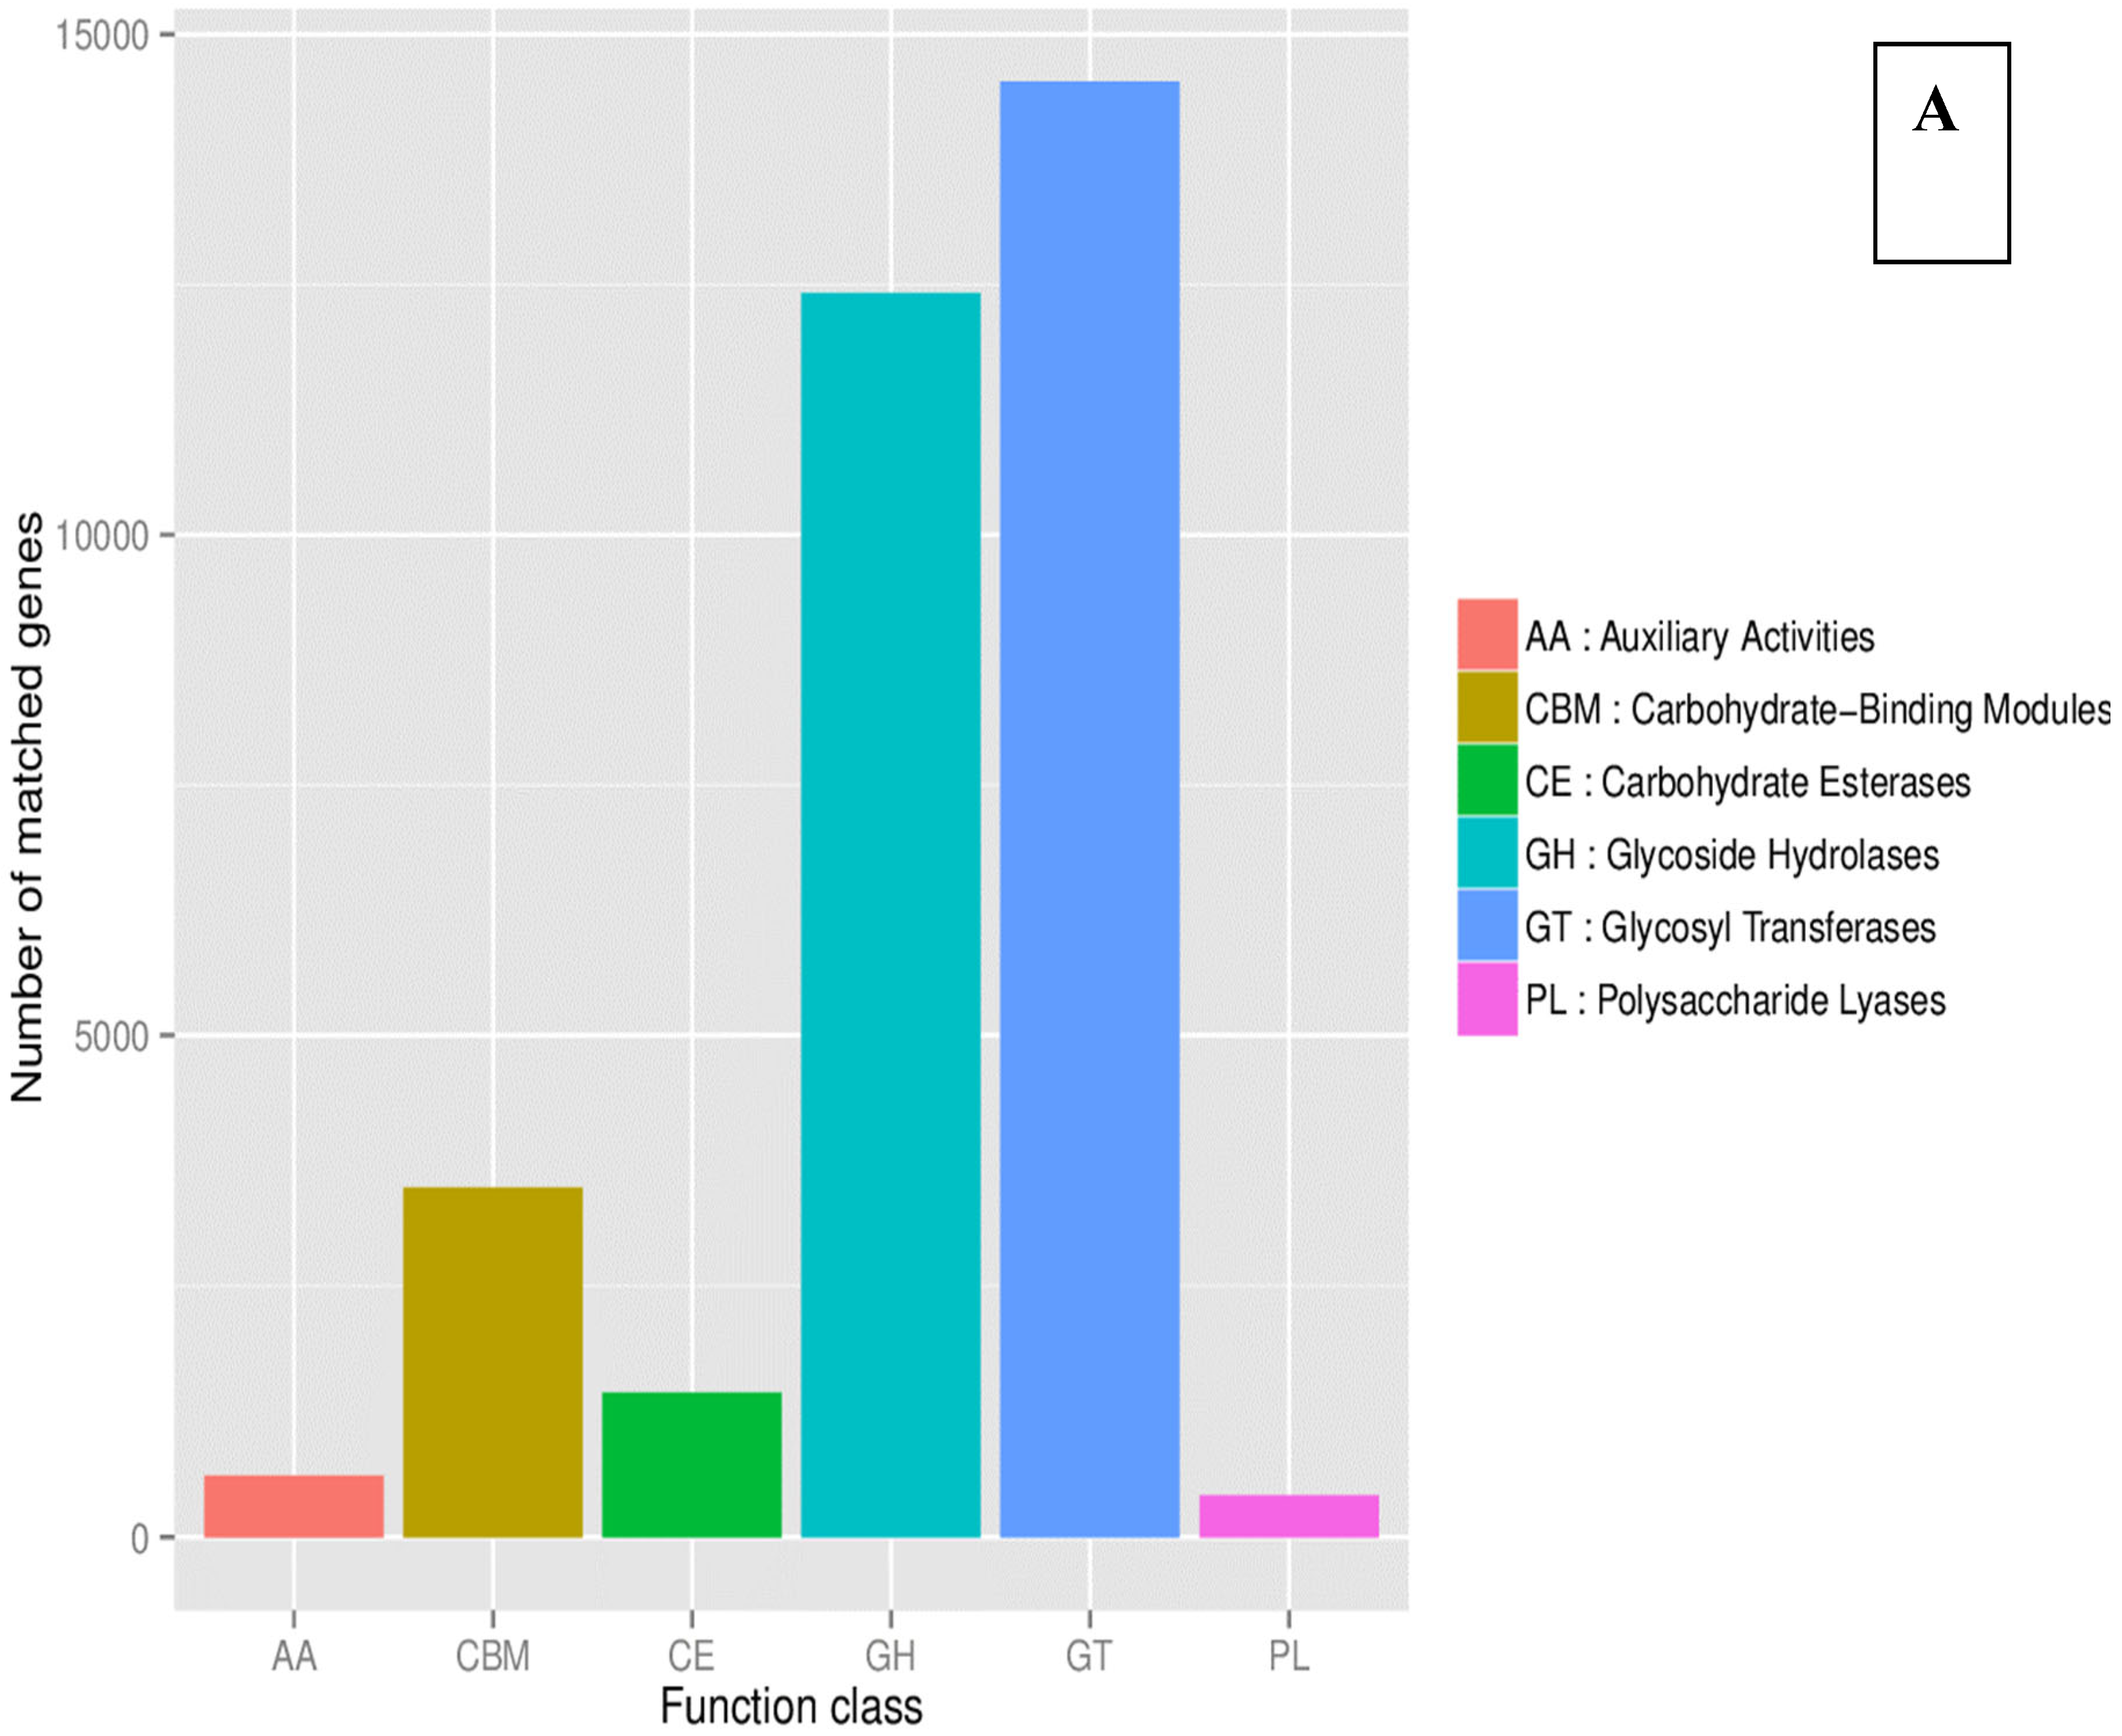
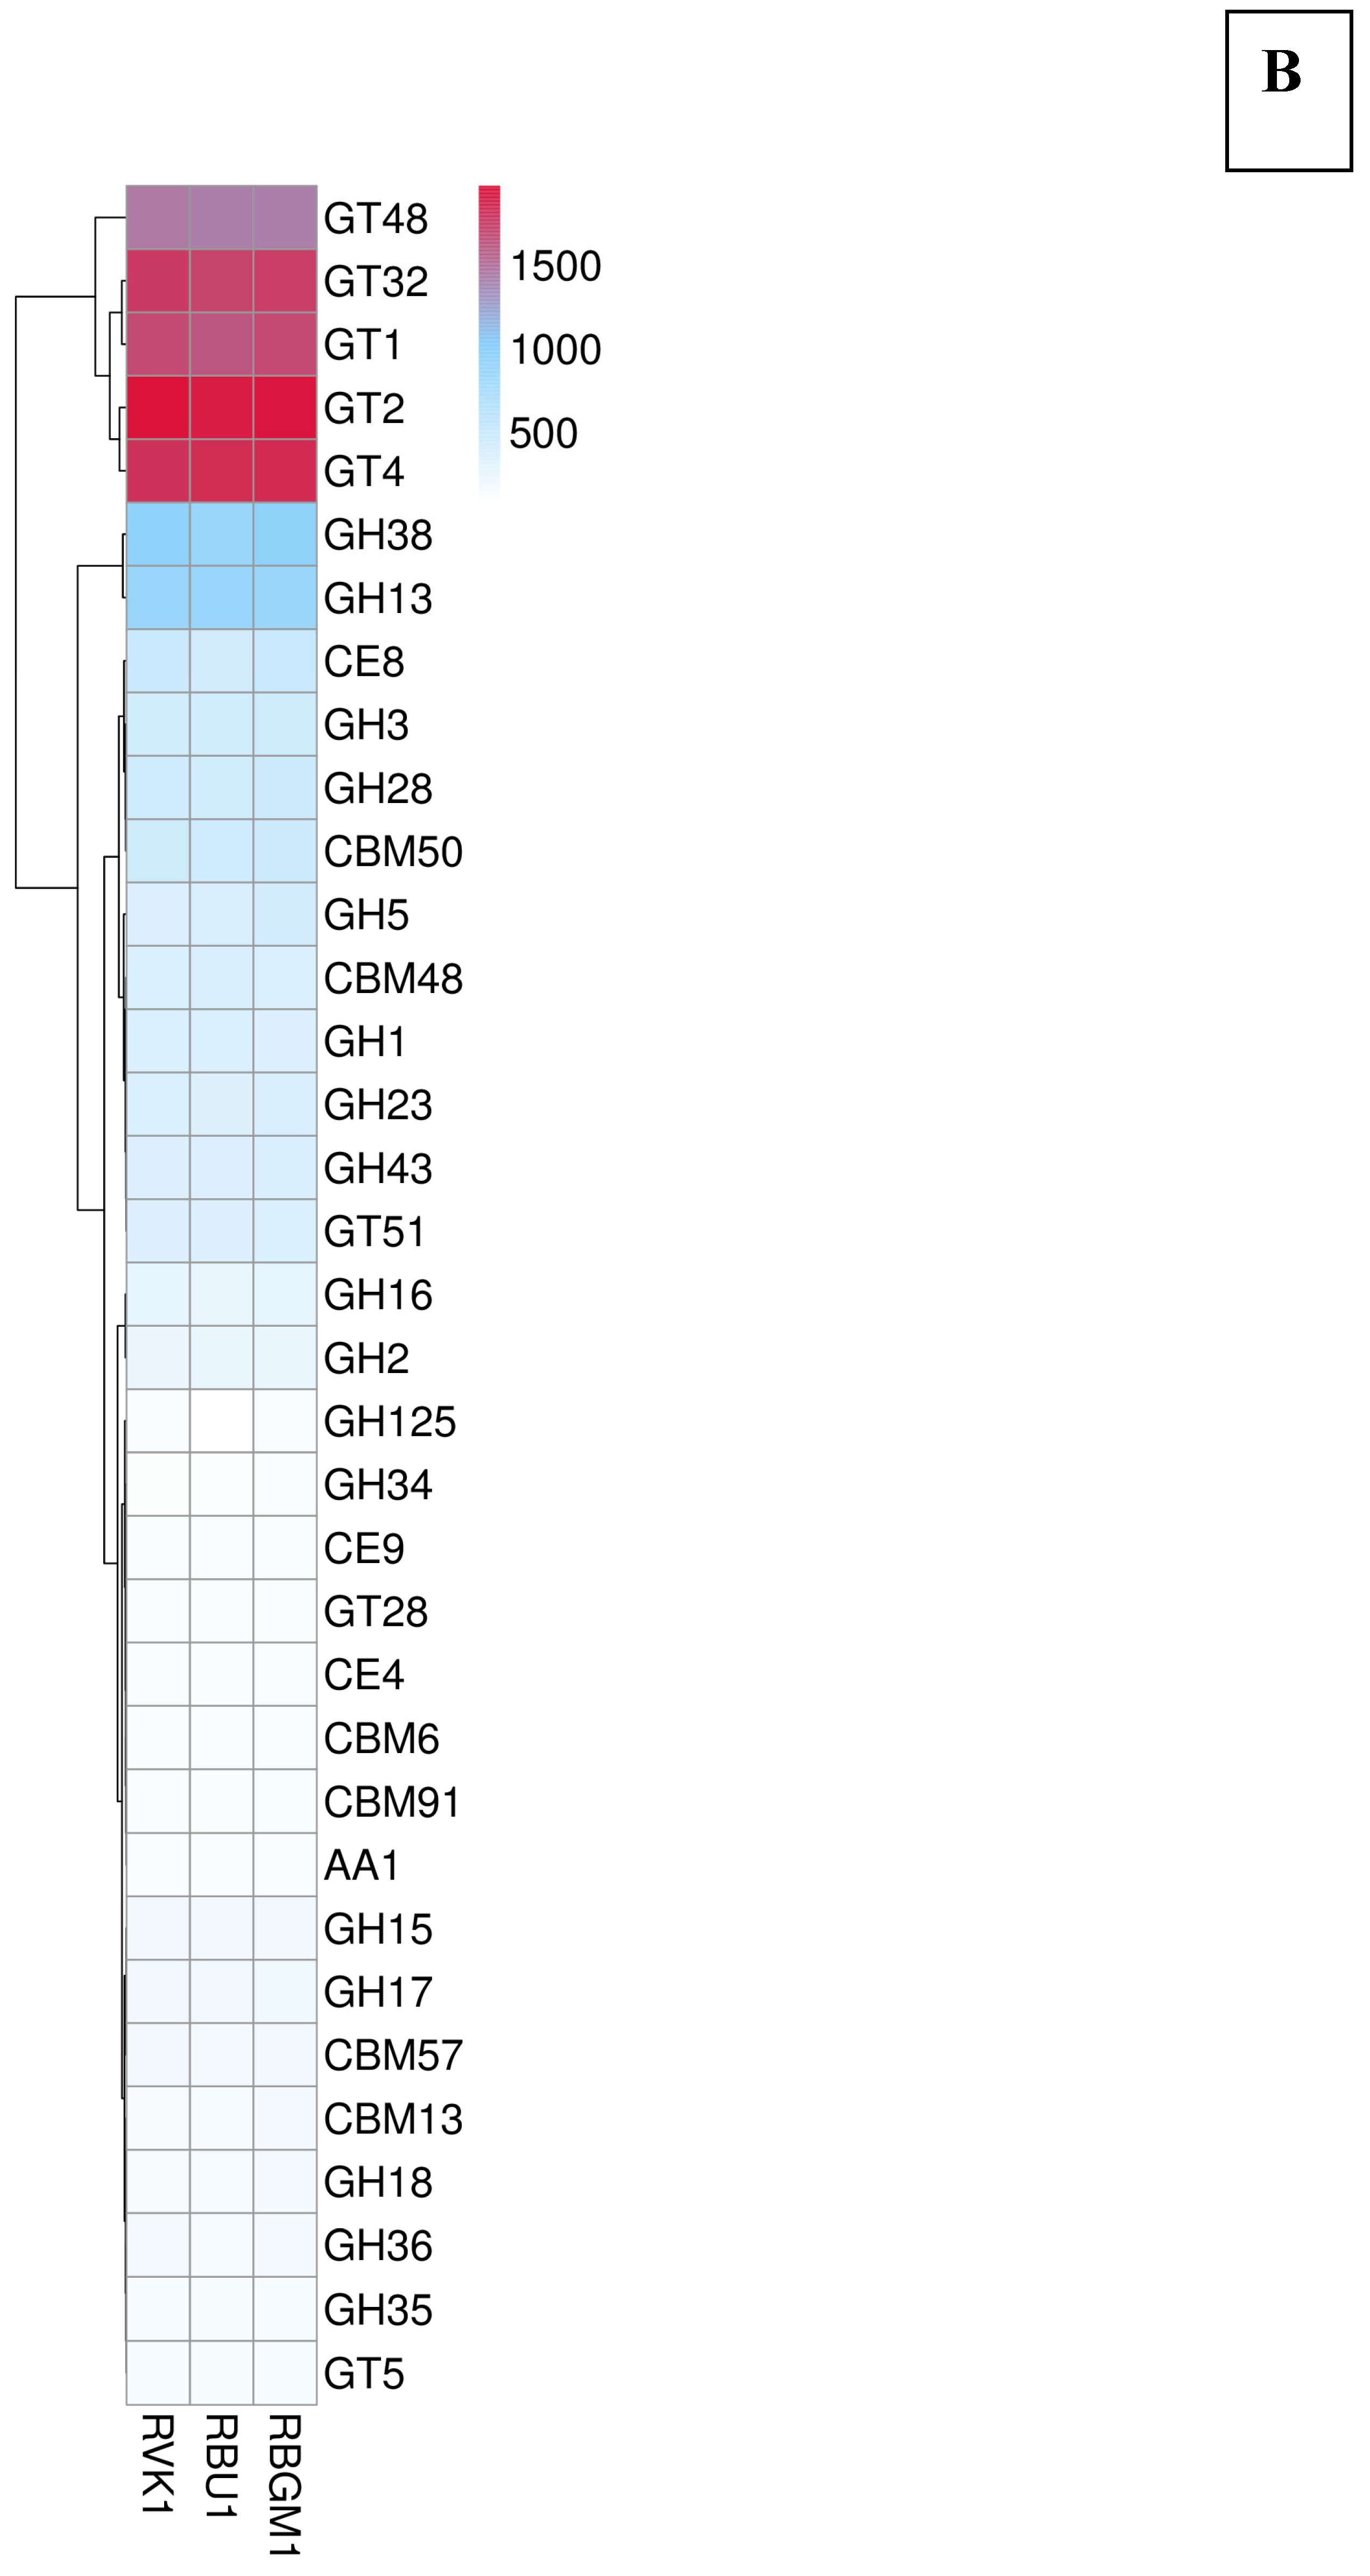
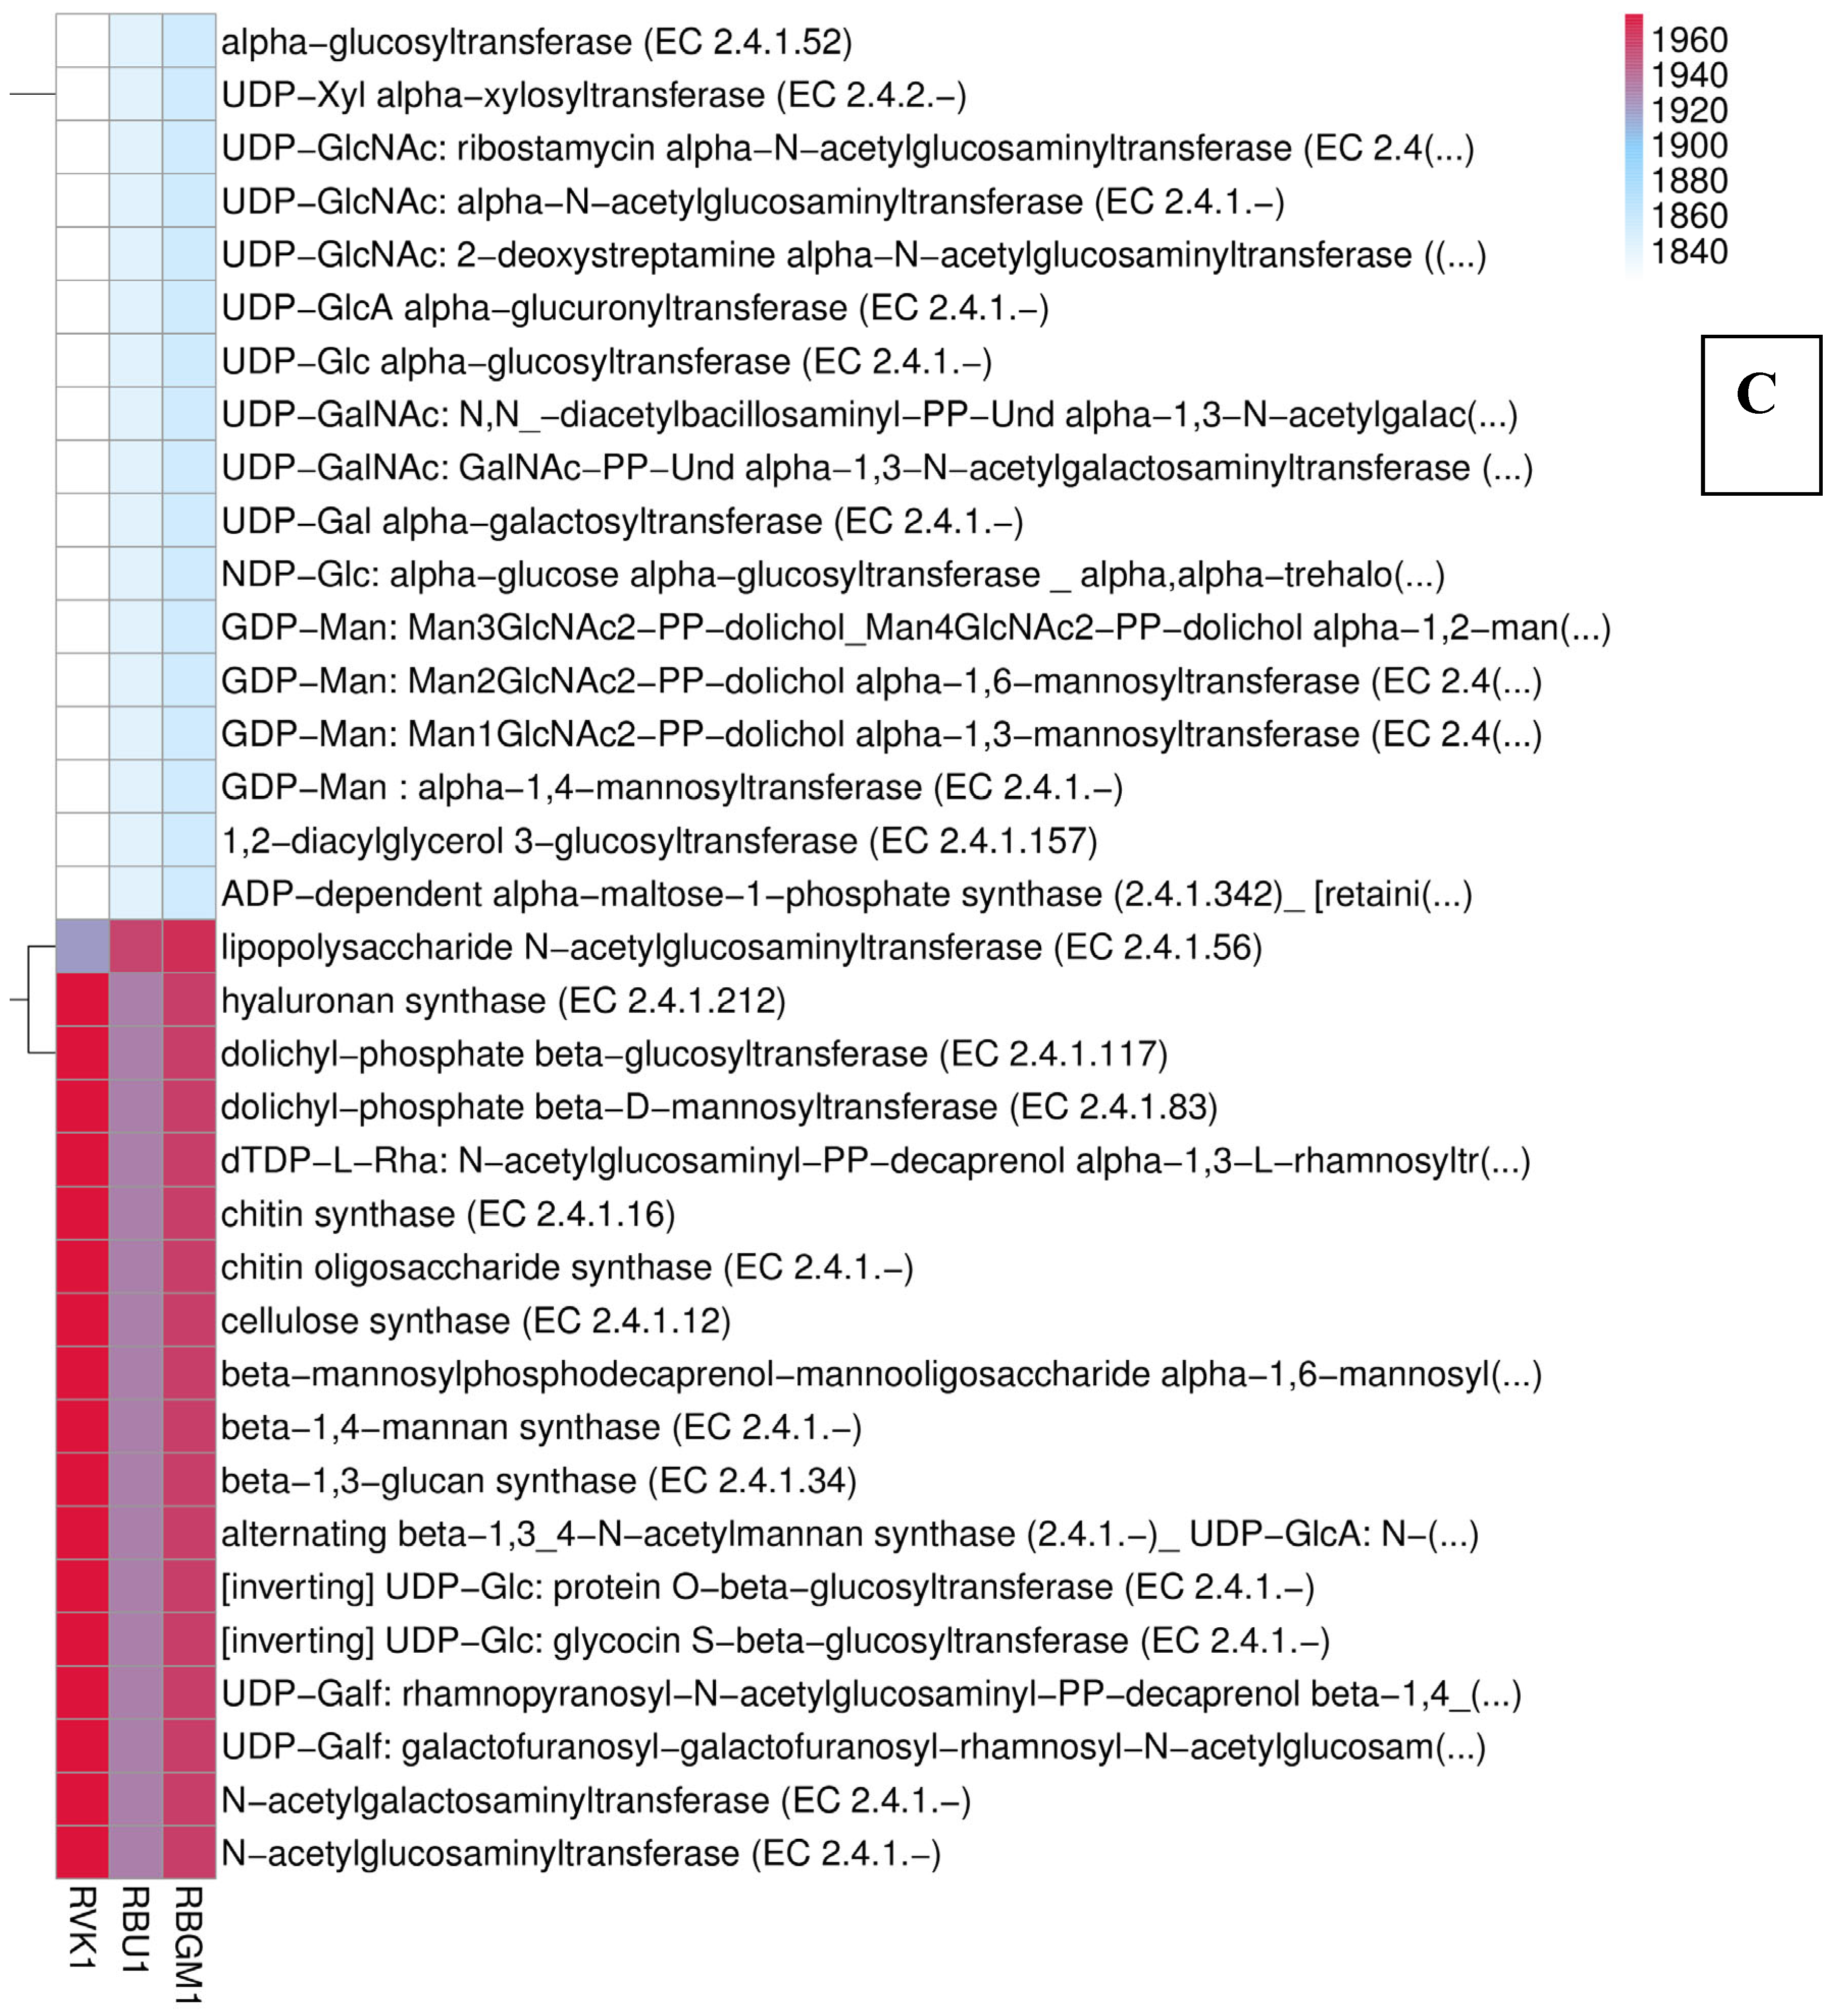
Figure 9.
Showing A) A bar graph of all up-and down-regulated genes across the combination of samples, B) A volcano plot of up-and down-regulated genes in RBGM1 vs. RBU1, and C) a volcano plot of up-and down-regulated genes in RVK1 vs. RBU1.
Figure 9.
Showing A) A bar graph of all up-and down-regulated genes across the combination of samples, B) A volcano plot of up-and down-regulated genes in RBGM1 vs. RBU1, and C) a volcano plot of up-and down-regulated genes in RVK1 vs. RBU1.
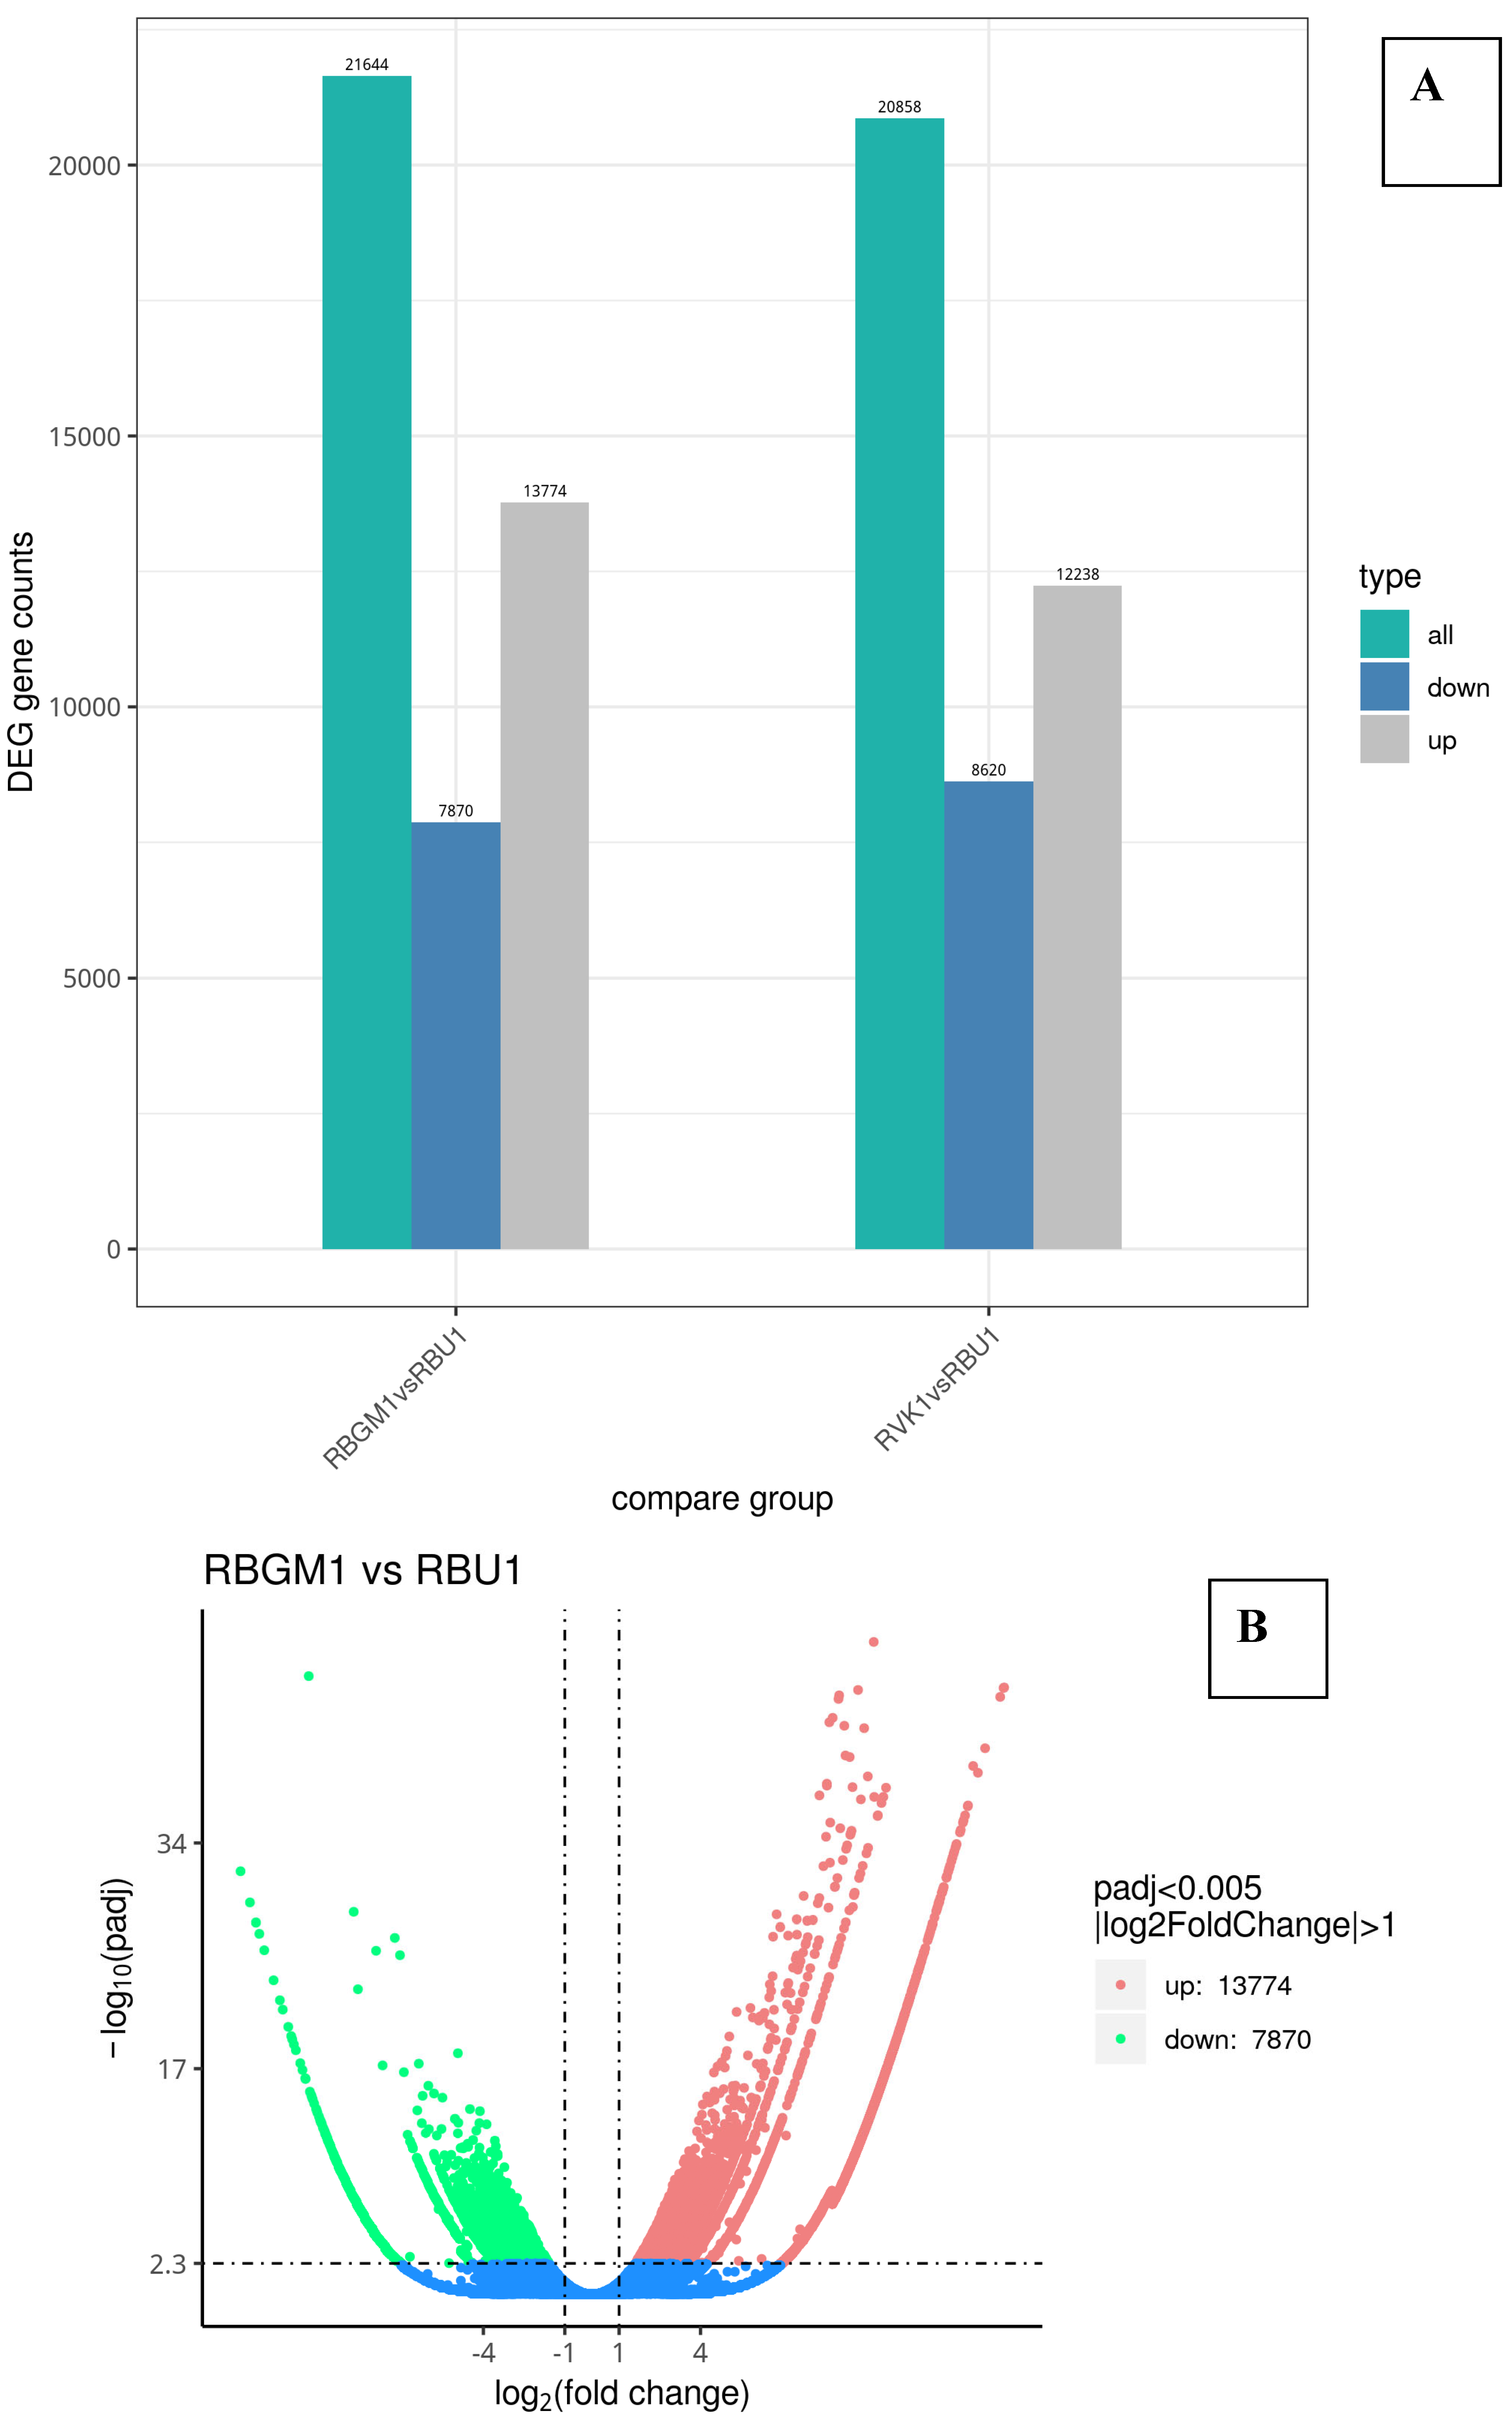
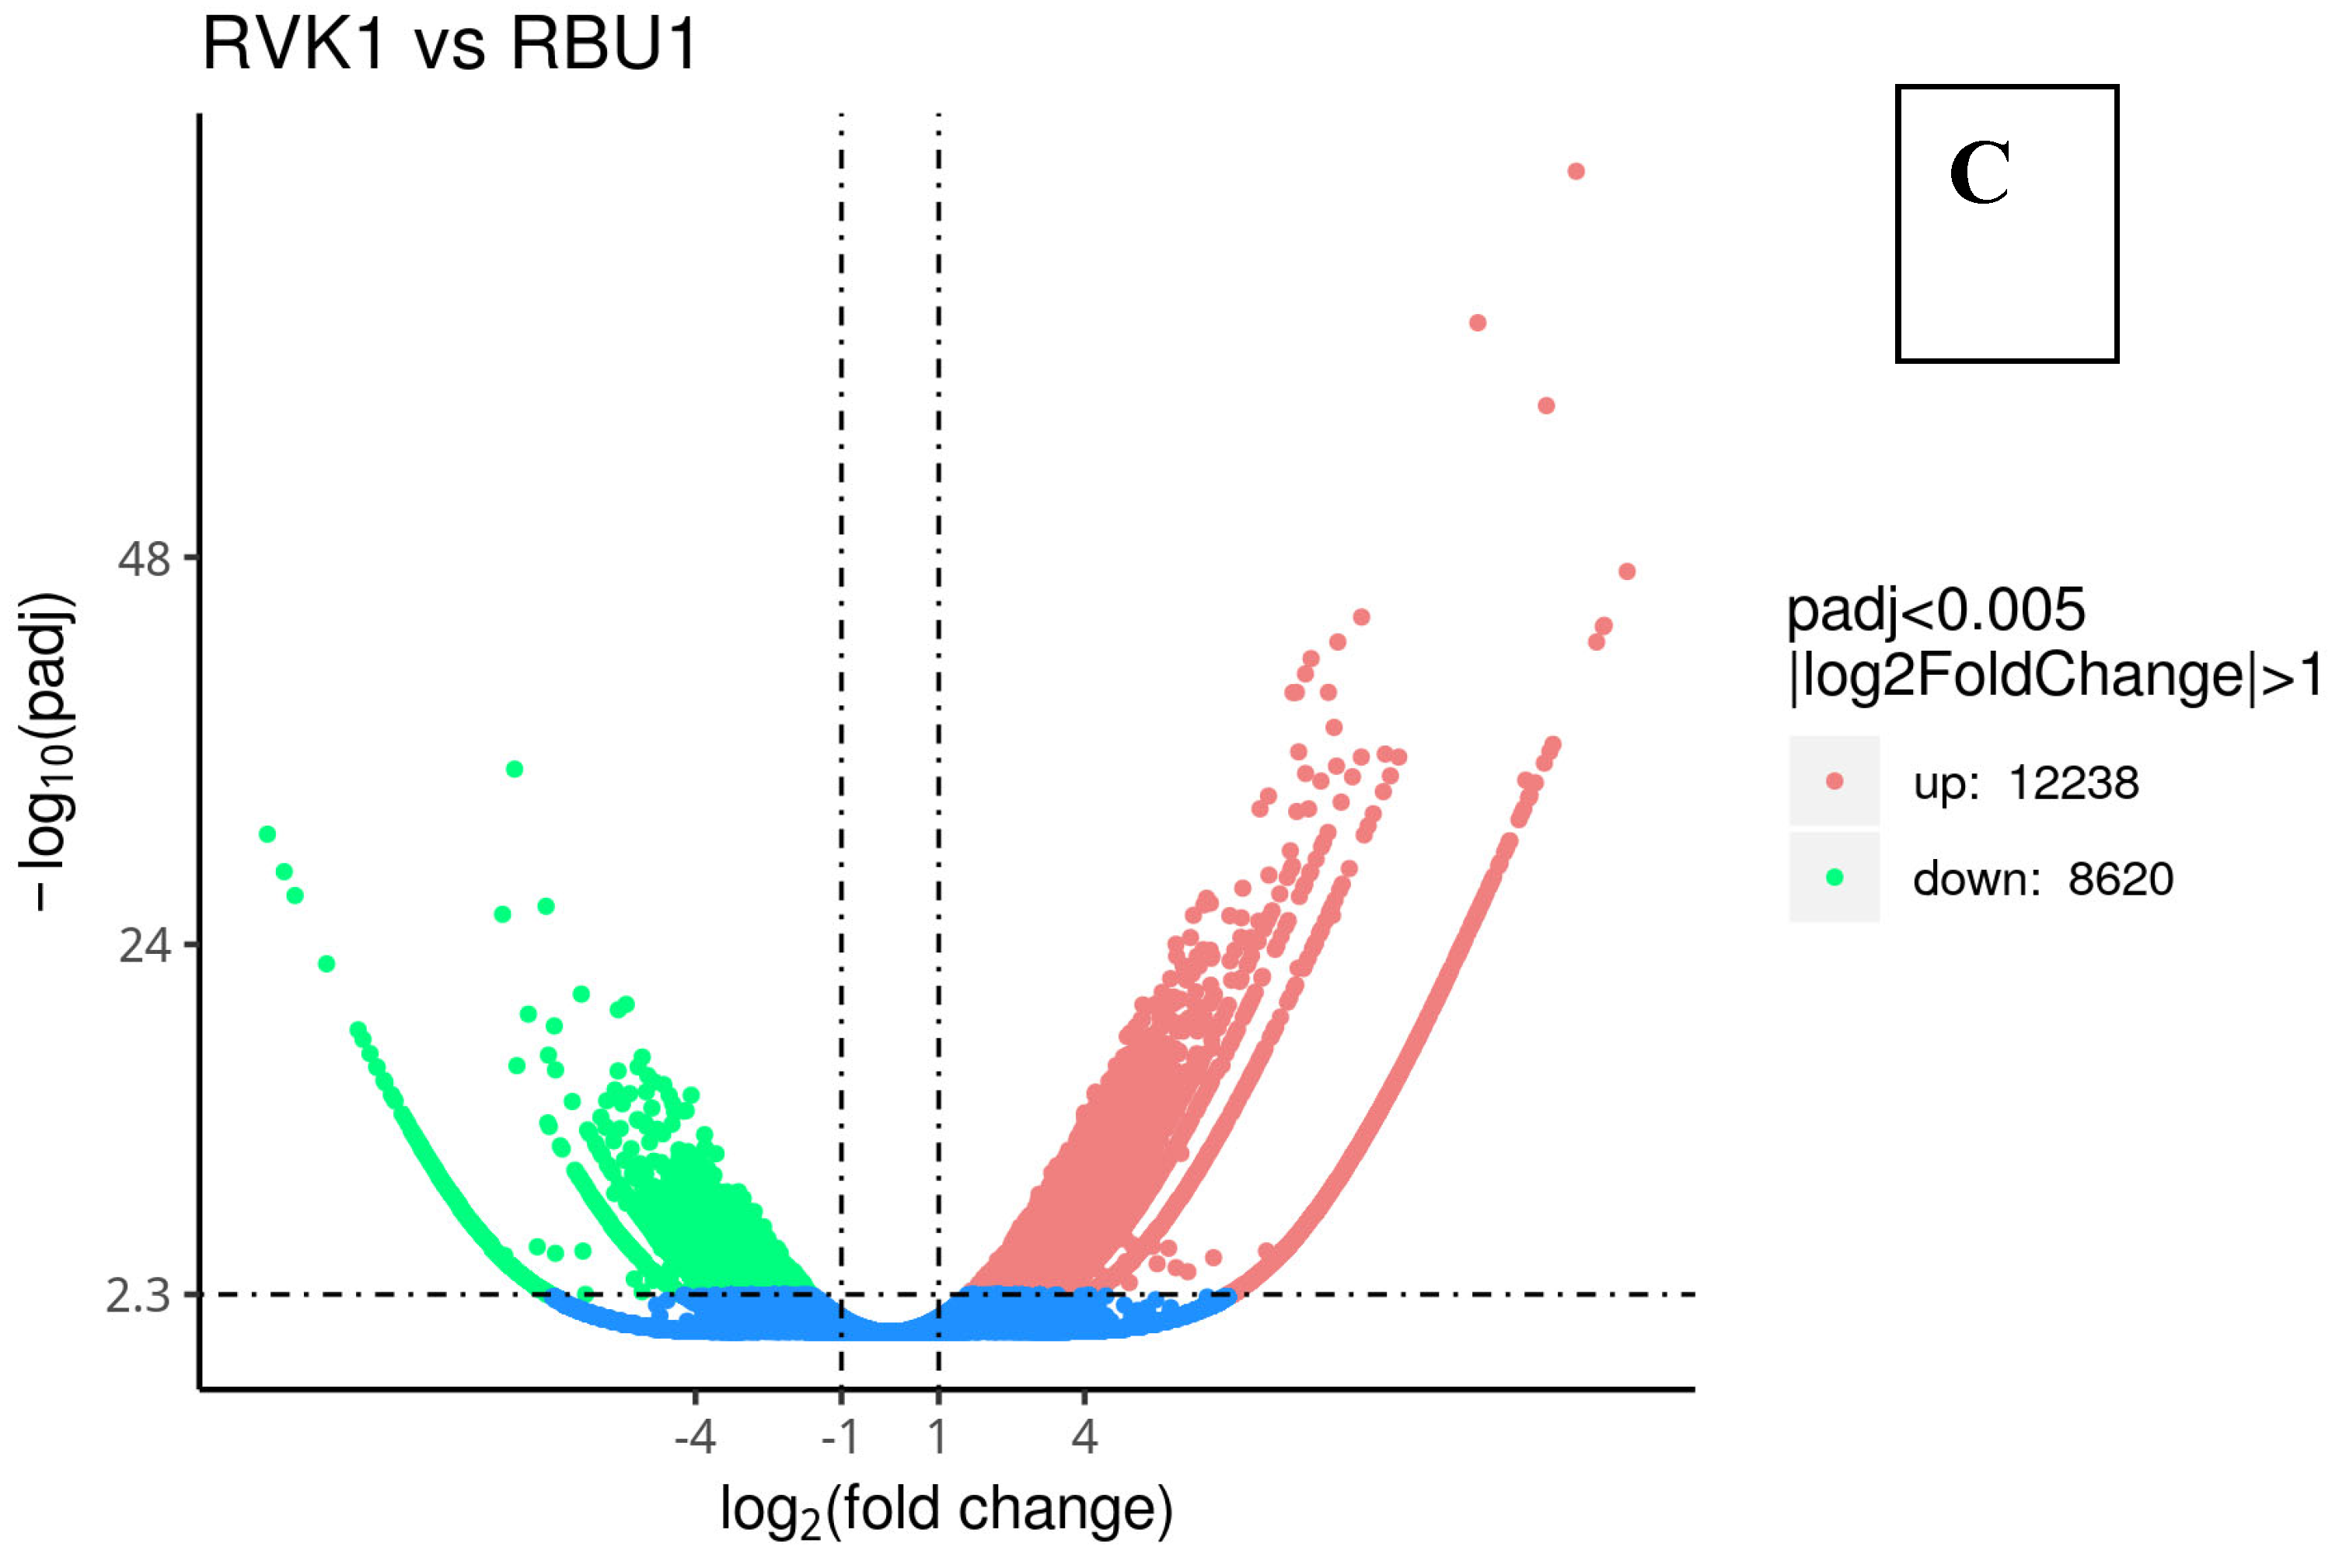
Figure 10.
Displaying A) A cluster heat map showing gene clusters, with different colours indicating similar functional annotations across all samples, B) H-cluster showing 6 sub-clusters for all samples, and C) K-Cluster Showing 4 sub-clusters for all samples.
Figure 10.
Displaying A) A cluster heat map showing gene clusters, with different colours indicating similar functional annotations across all samples, B) H-cluster showing 6 sub-clusters for all samples, and C) K-Cluster Showing 4 sub-clusters for all samples.
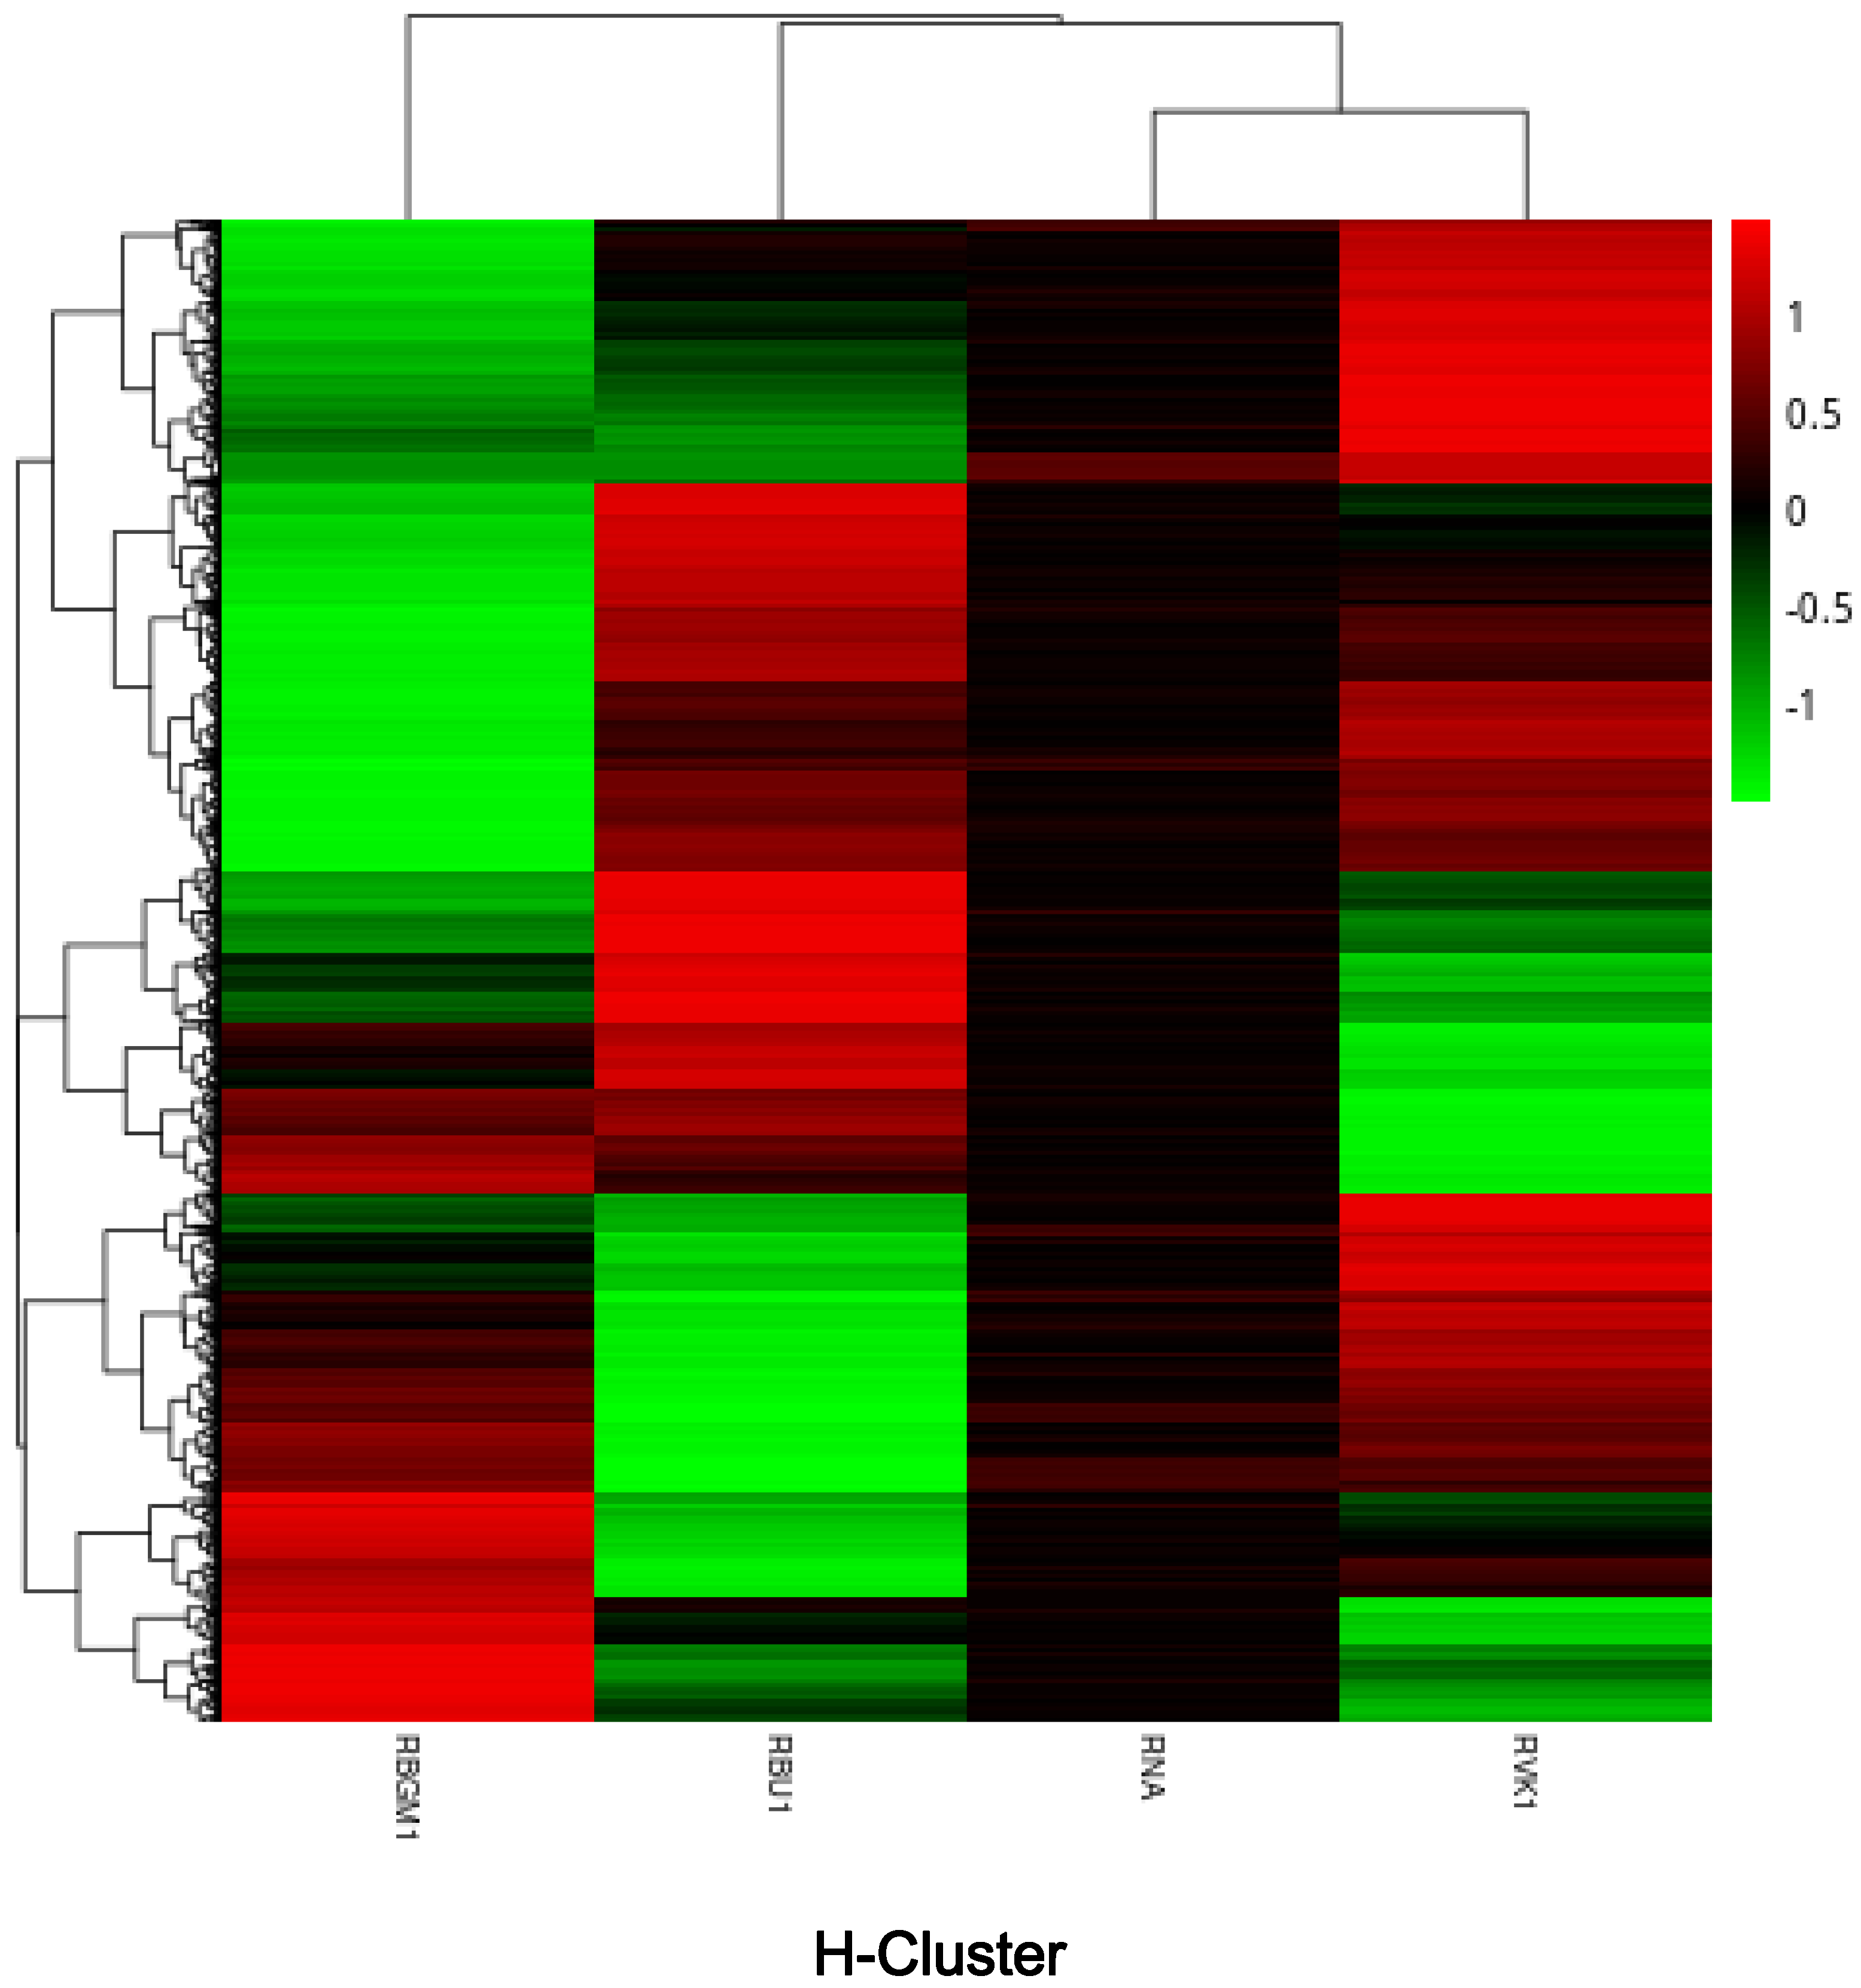
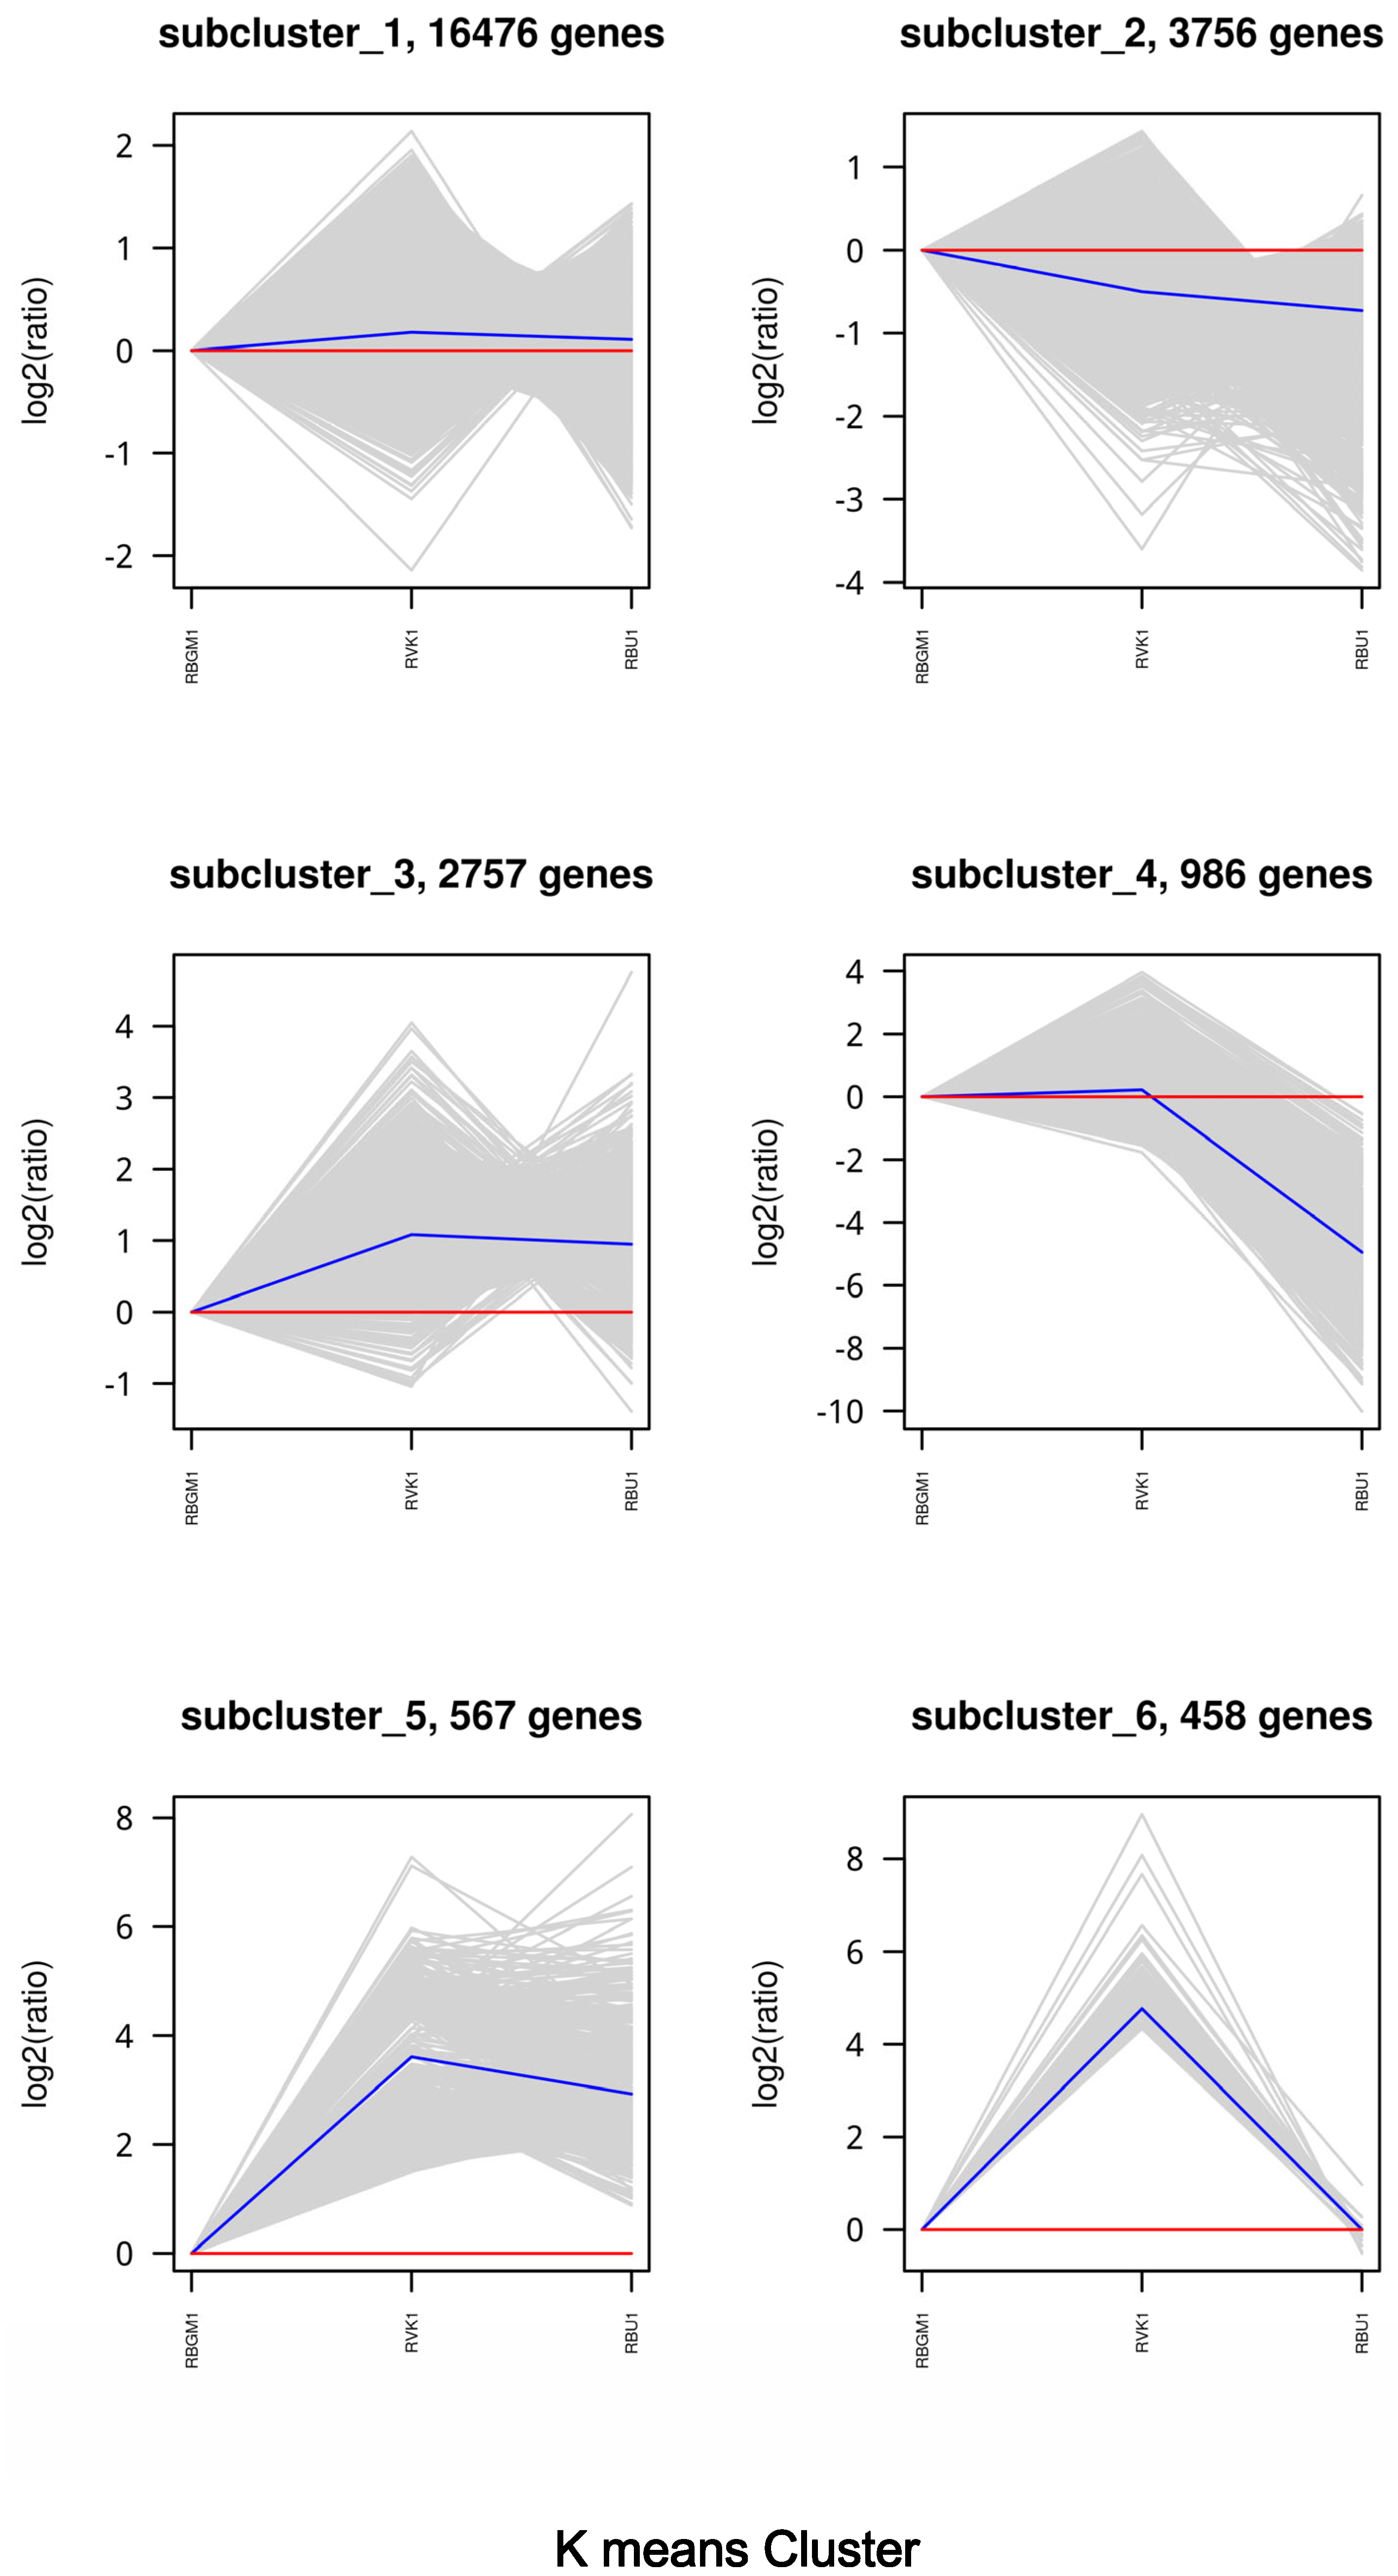
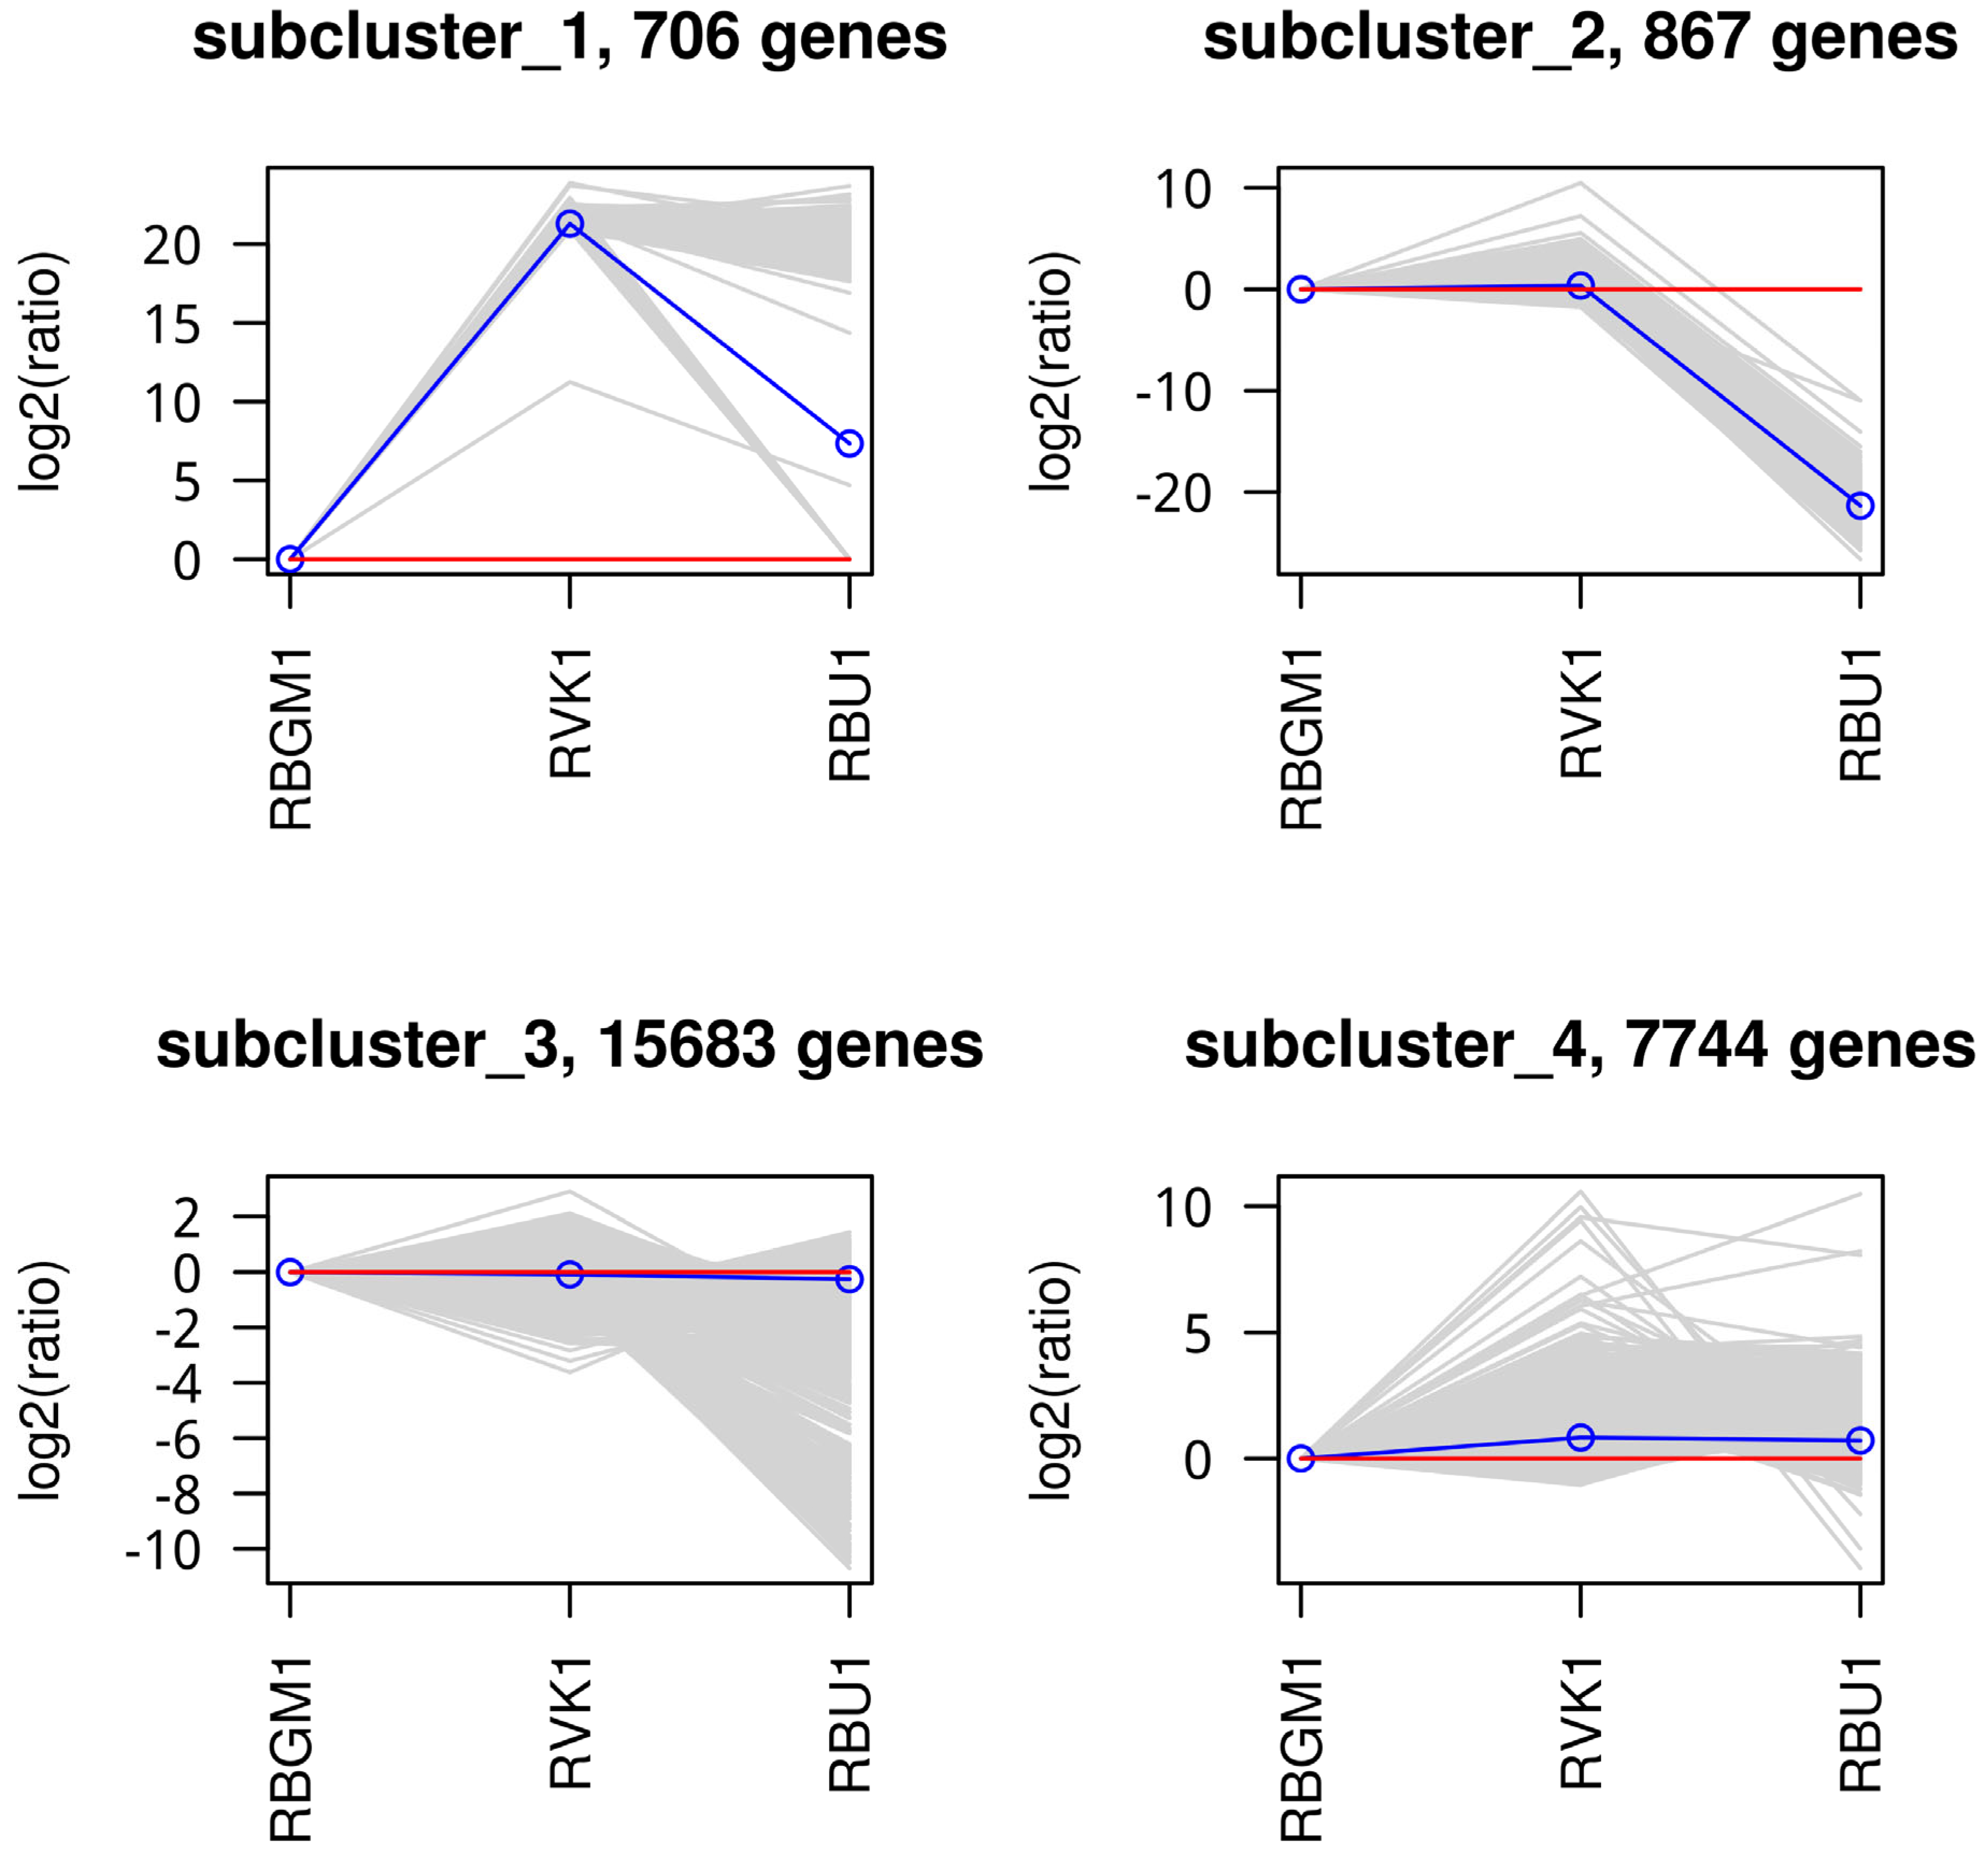
Figure 11.
presents various visualizations of gene expression data across different groups. Panel A shows a bar graph illustrating the upregulated genes and their assigned functions in the RBGM1 versus RBU1 group. Panel B presents a similar bar graph for the upregulated genes and their functions in the RVK1 versus RBU1 group. Panel C features a Directed Acyclic Graph (DAG) that displays the interconnections of genes with Biological Processes (BP) in the RBGM1 versus RBU1 group. Panel D shows a DAG depicting the relationships between genes and Cellular Components (CC) in the RBGM1 versus RBU1 group. Panel E presents a DAG illustrating the interactions of genes with Molecular Function (MF) in the RBGM1 versus RBU1 group. Panel F provides a DAG displaying the interconnections of genes with Biological Processes (BP) in the RVK1 versus RBU1 group. Panel G shows a DAG for the interactions of genes with Molecular Function (MF) in the RVK1 versus RBU1 group. Finally, Panel H presents a DAG illustrating the interconnections of genes with Cellular Components (CC) in the RVK1 versus RBU1 group. The GO and CC annotations are represented using Directed Acyclic Graphs (DAGs).
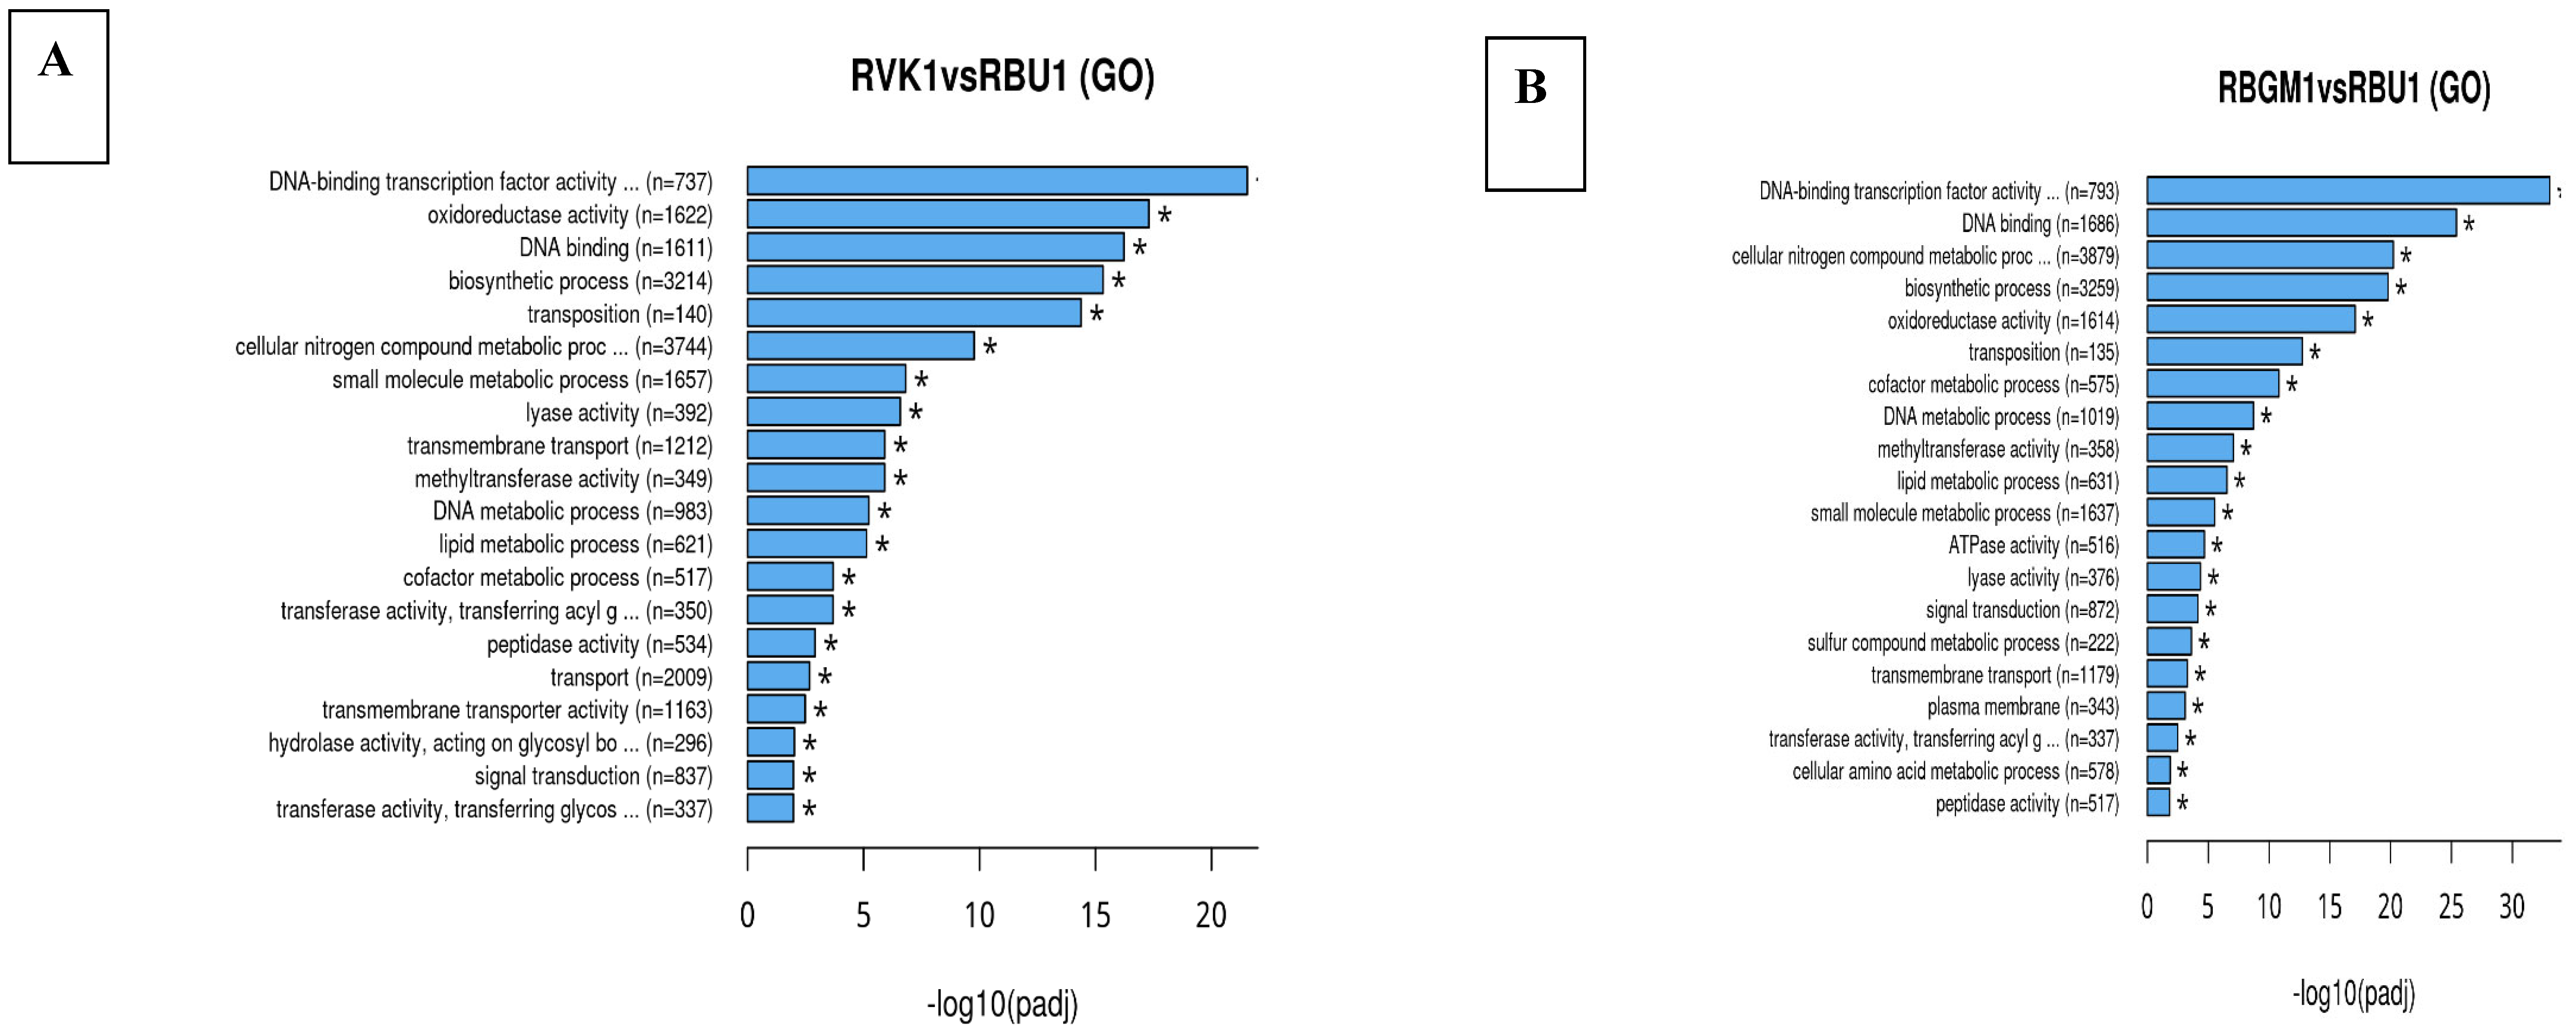
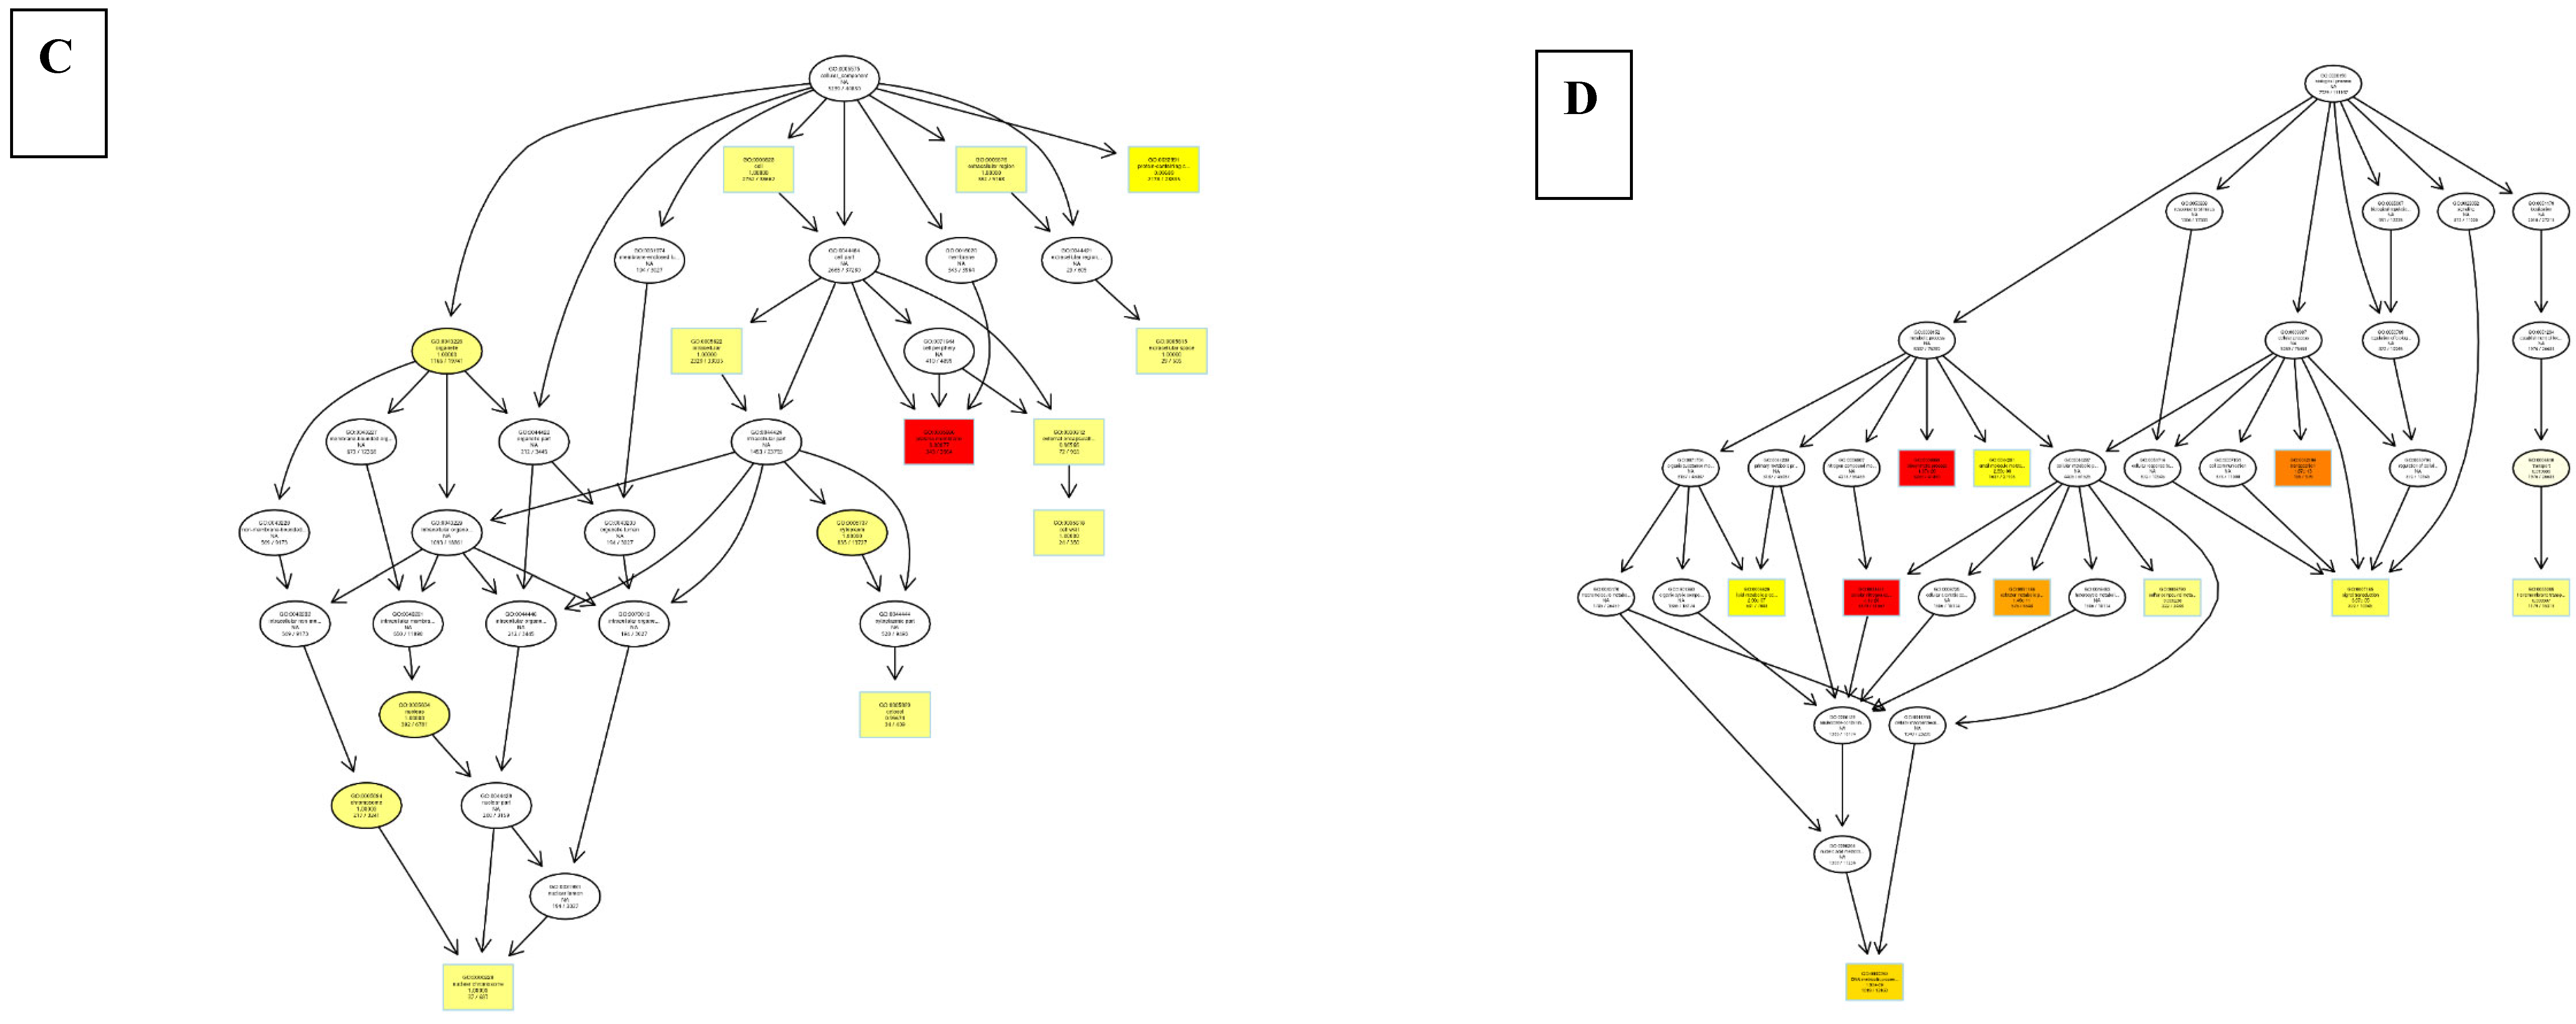
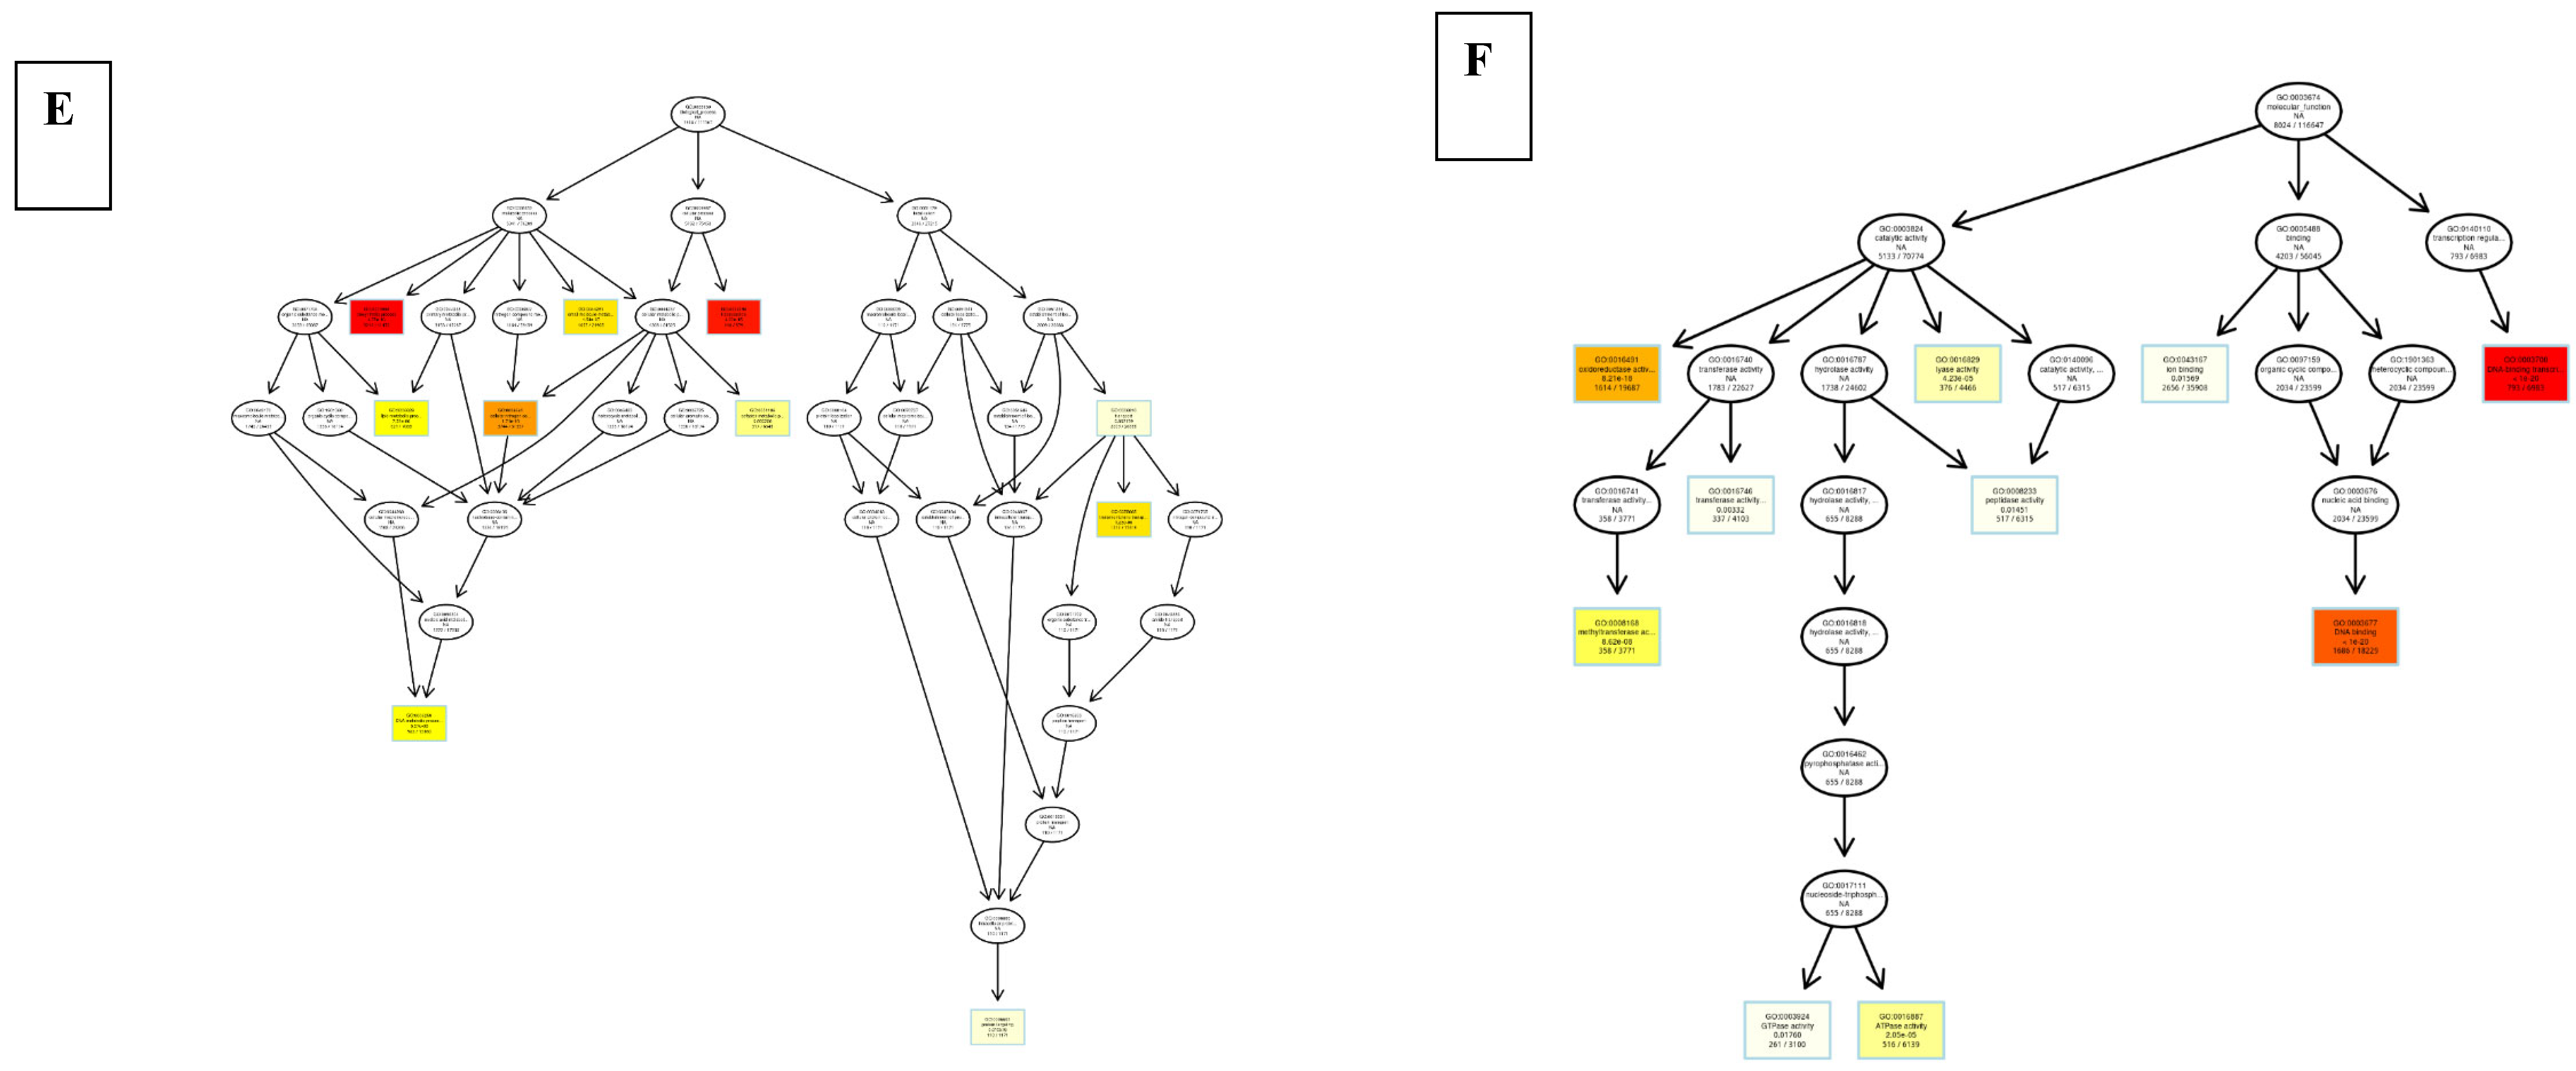
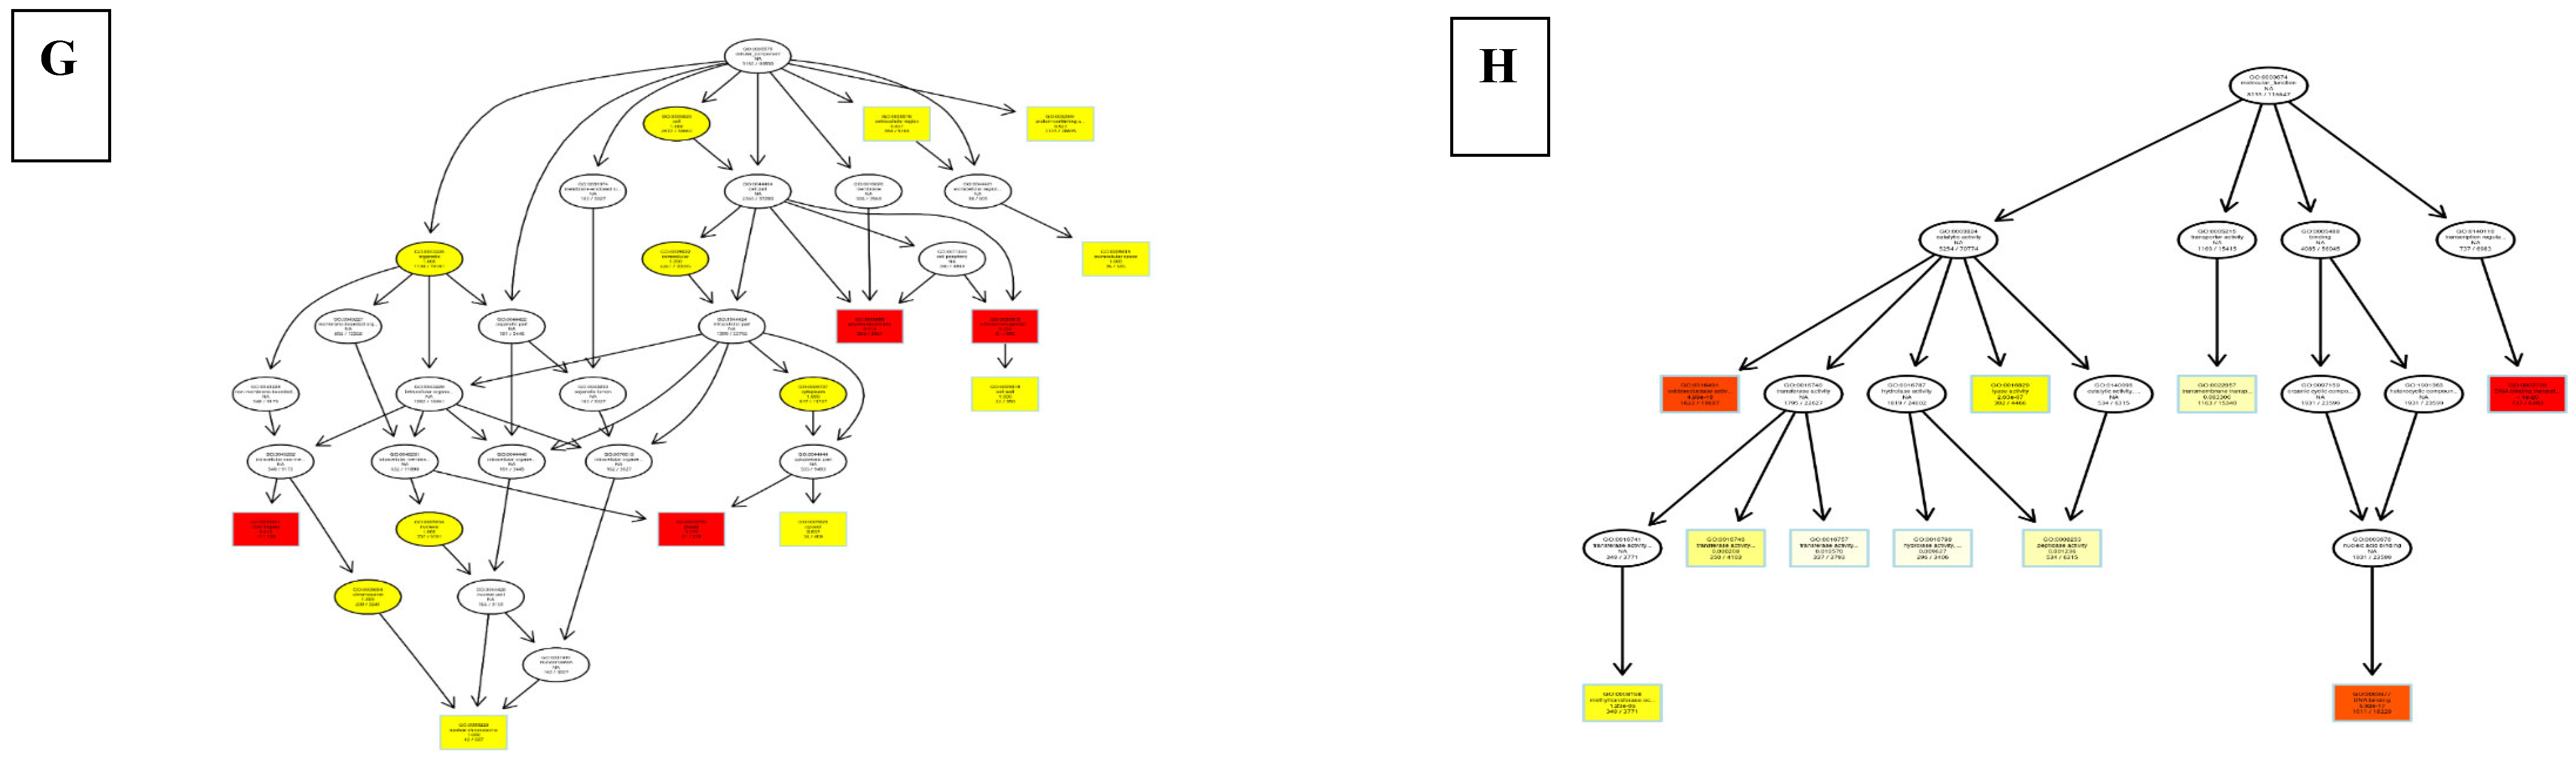
Figure 12.
Displaying A) A bar graph of pathway enrichment analysis in the Kyoto Encyclopedia of Genes and Genomes (KEGG) for RBGM1 vs. RBU1, and B) A bar graph of pathway enrichment analysis in the Kyoto Encyclopedia of Genes and Genomes (KEGG) for RVK1 vs. RBU1.
Figure 12.
Displaying A) A bar graph of pathway enrichment analysis in the Kyoto Encyclopedia of Genes and Genomes (KEGG) for RBGM1 vs. RBU1, and B) A bar graph of pathway enrichment analysis in the Kyoto Encyclopedia of Genes and Genomes (KEGG) for RVK1 vs. RBU1.
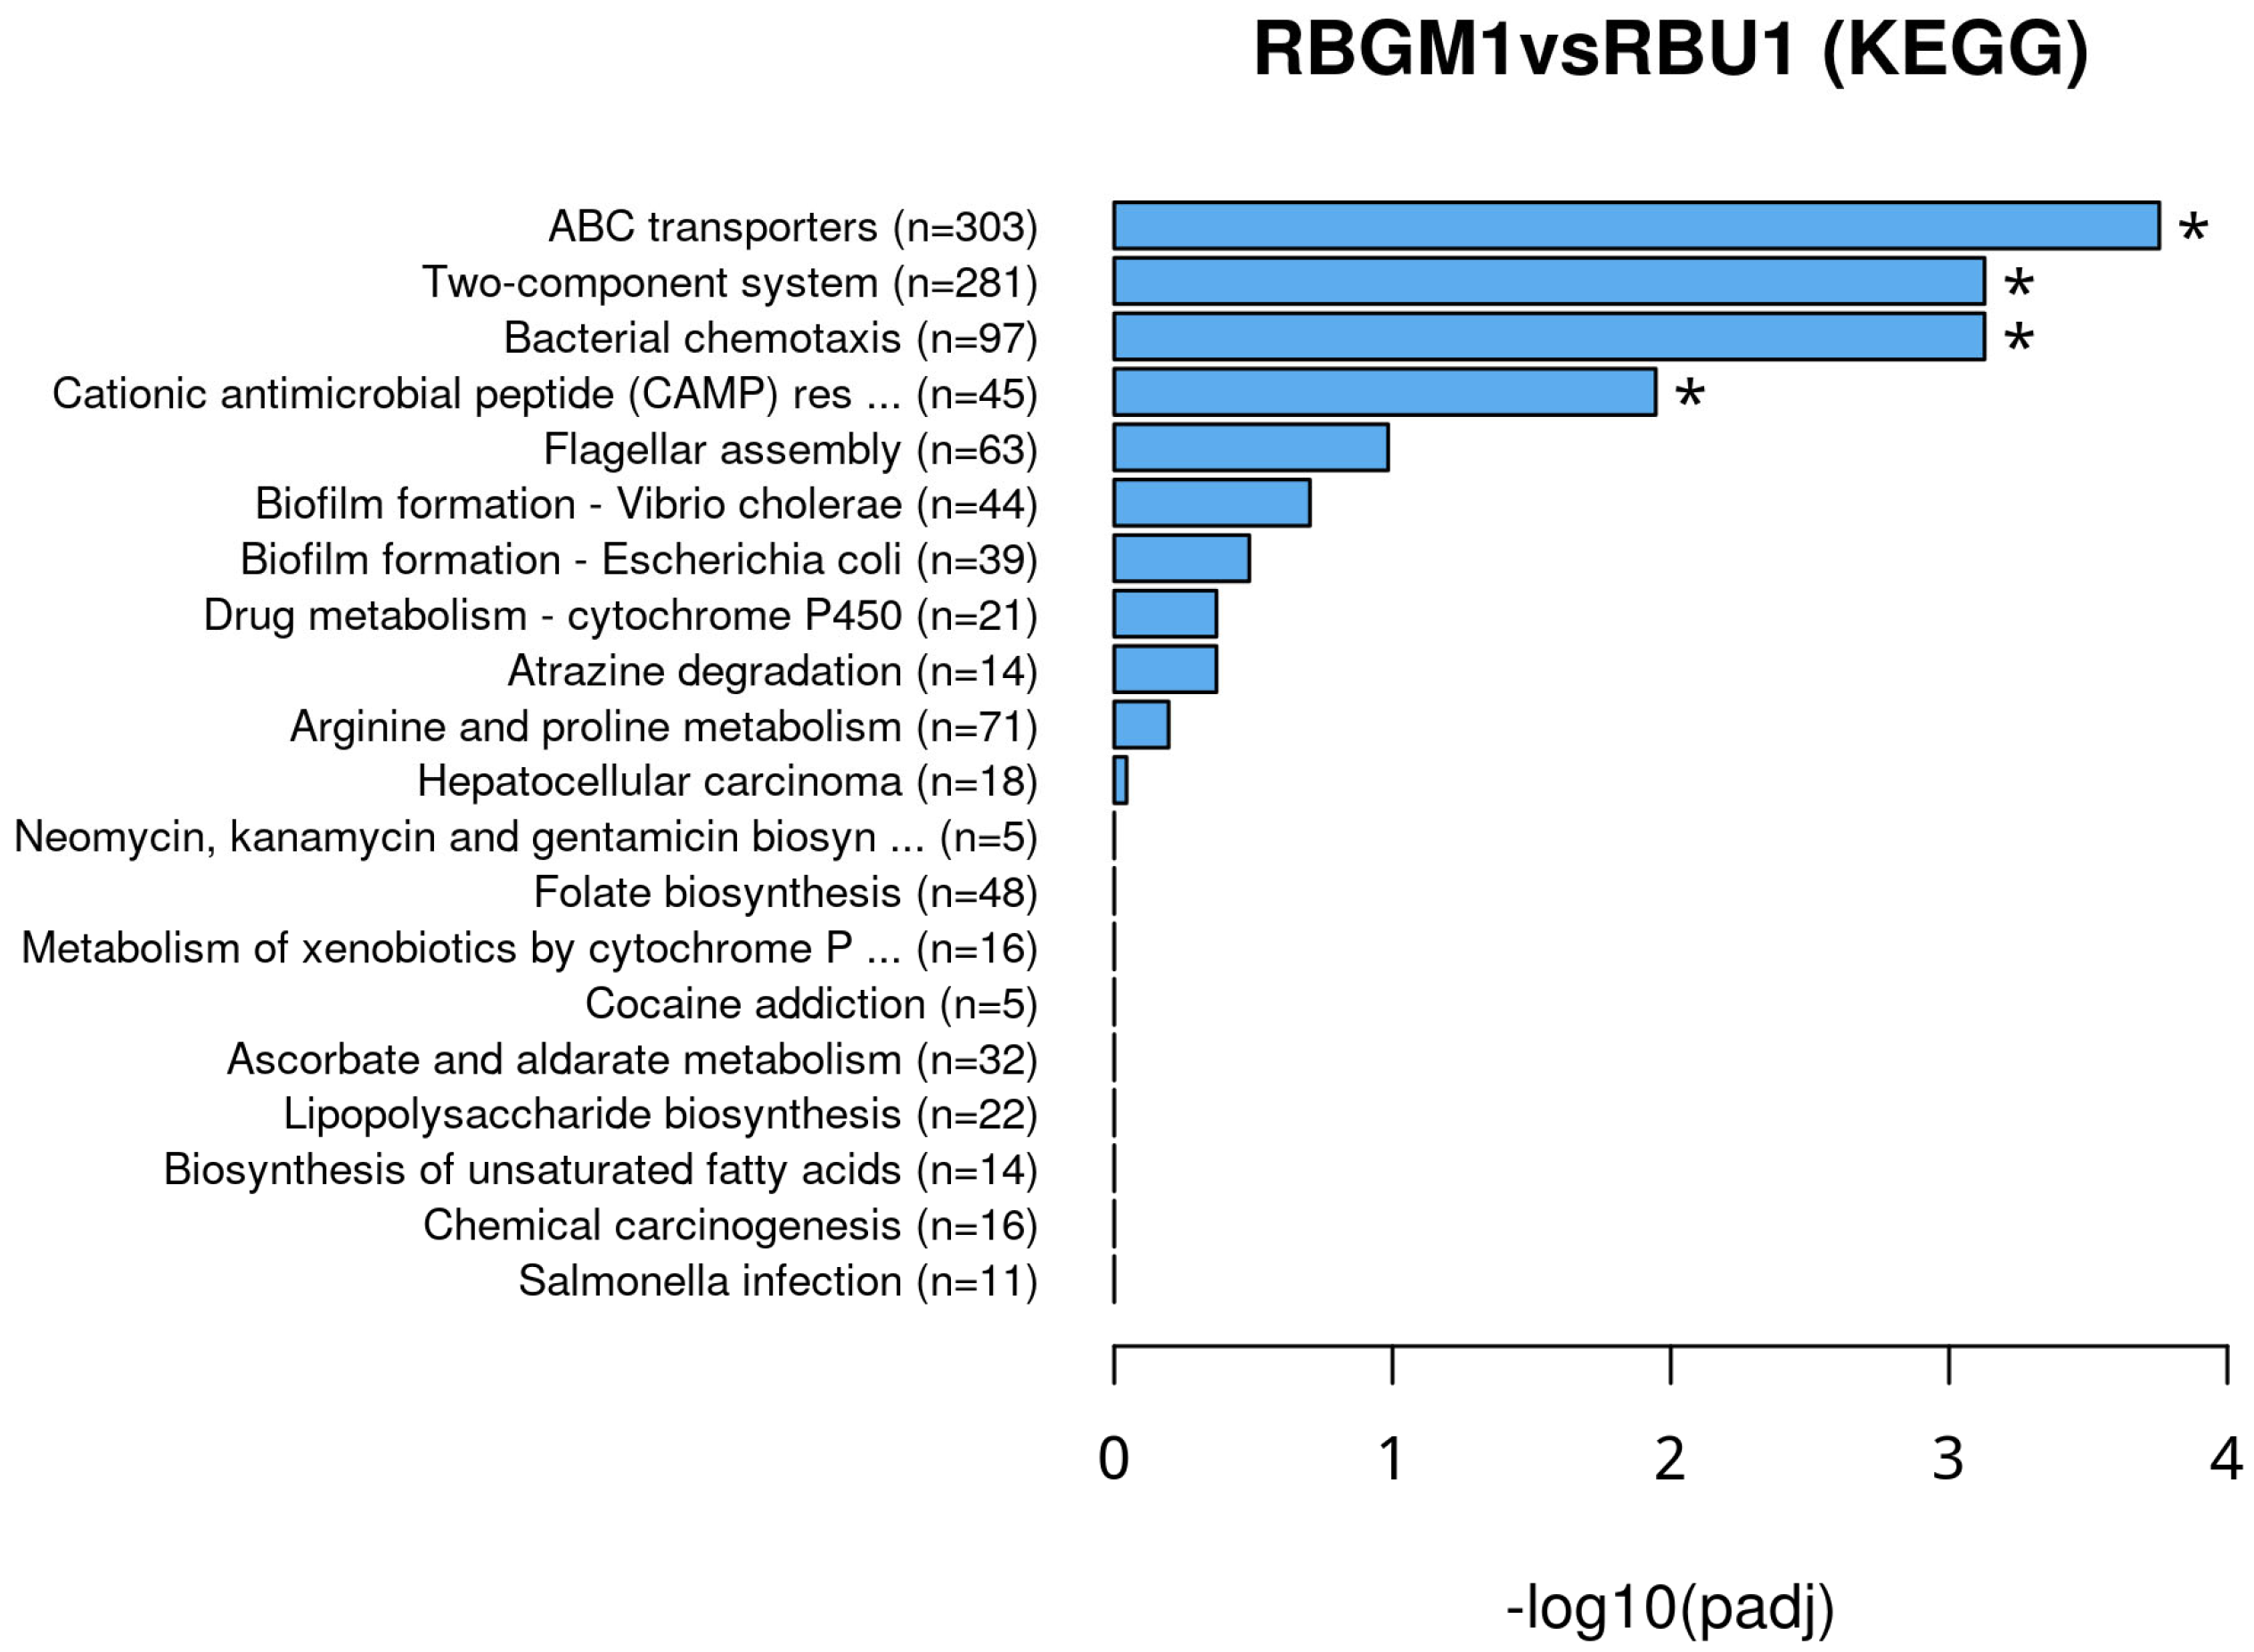
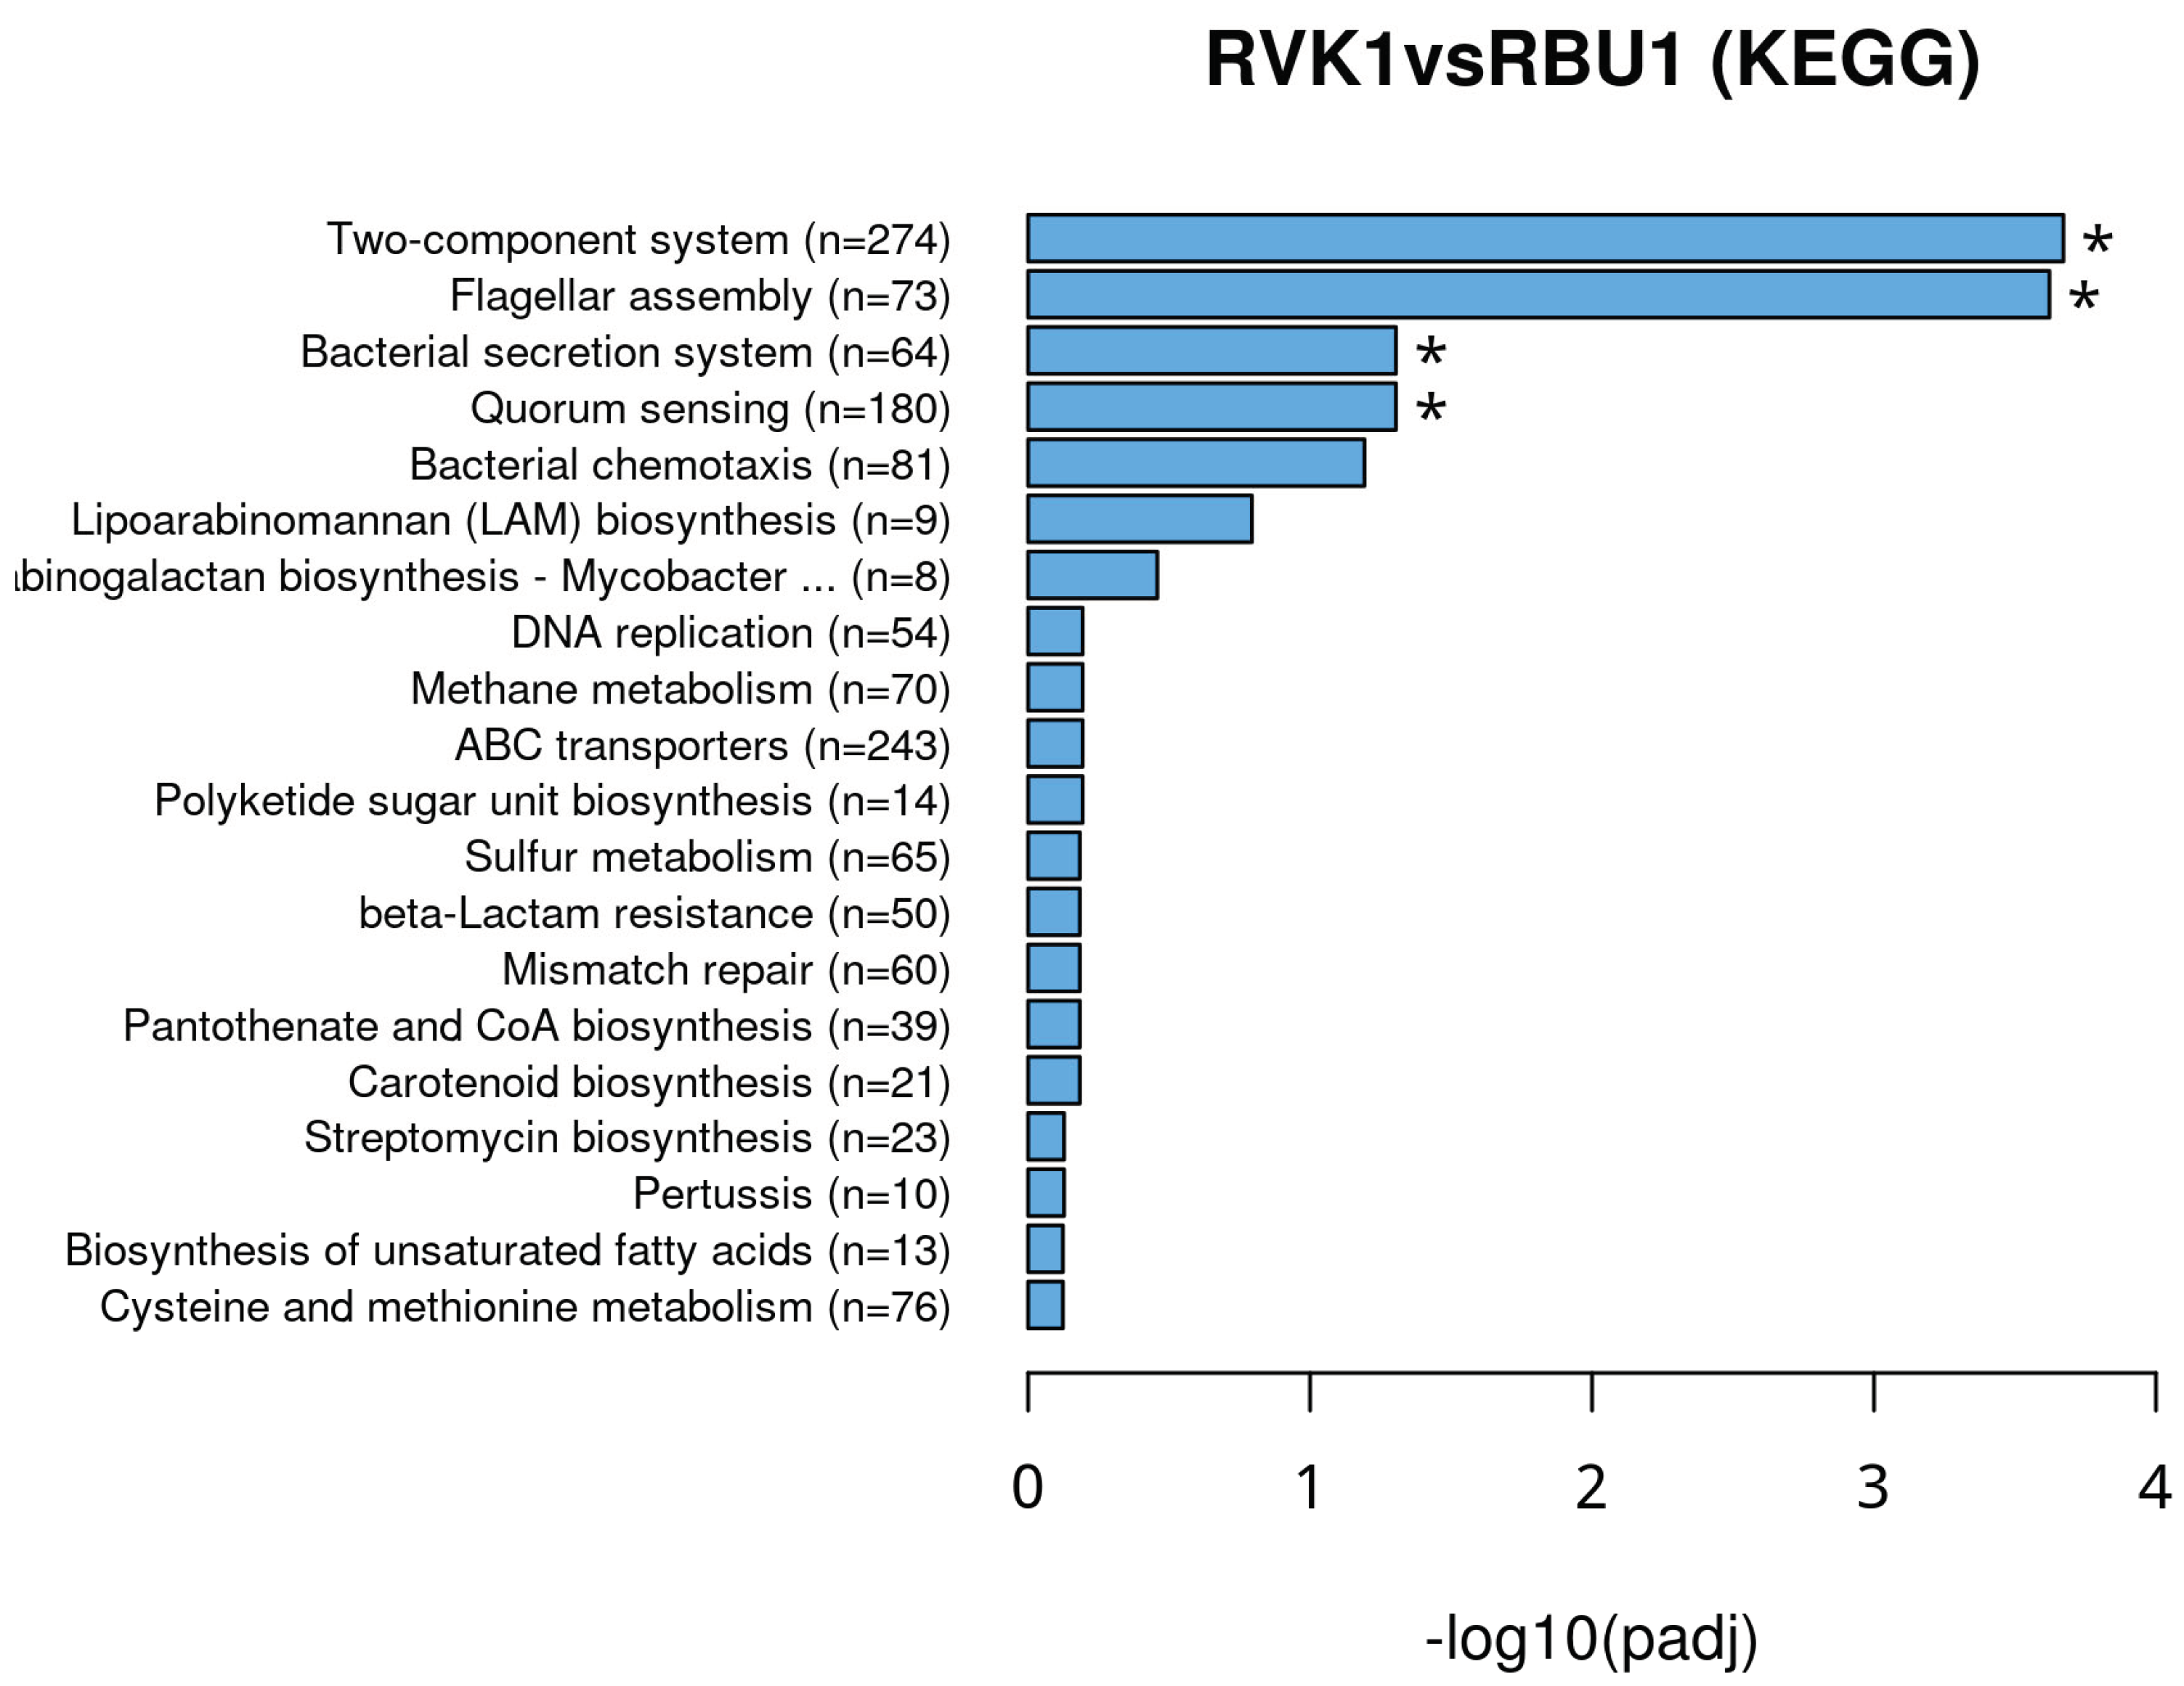
Figure 13.
A scatter diagram displaying: A) Significant metabolic pathways along with the corresponding number of genes in Bungoma and Busia samples, and B) Significant metabolic pathways with the corresponding number of genes in Vihiga/Kakamega and Busia samples.
Figure 13.
A scatter diagram displaying: A) Significant metabolic pathways along with the corresponding number of genes in Bungoma and Busia samples, and B) Significant metabolic pathways with the corresponding number of genes in Vihiga/Kakamega and Busia samples.
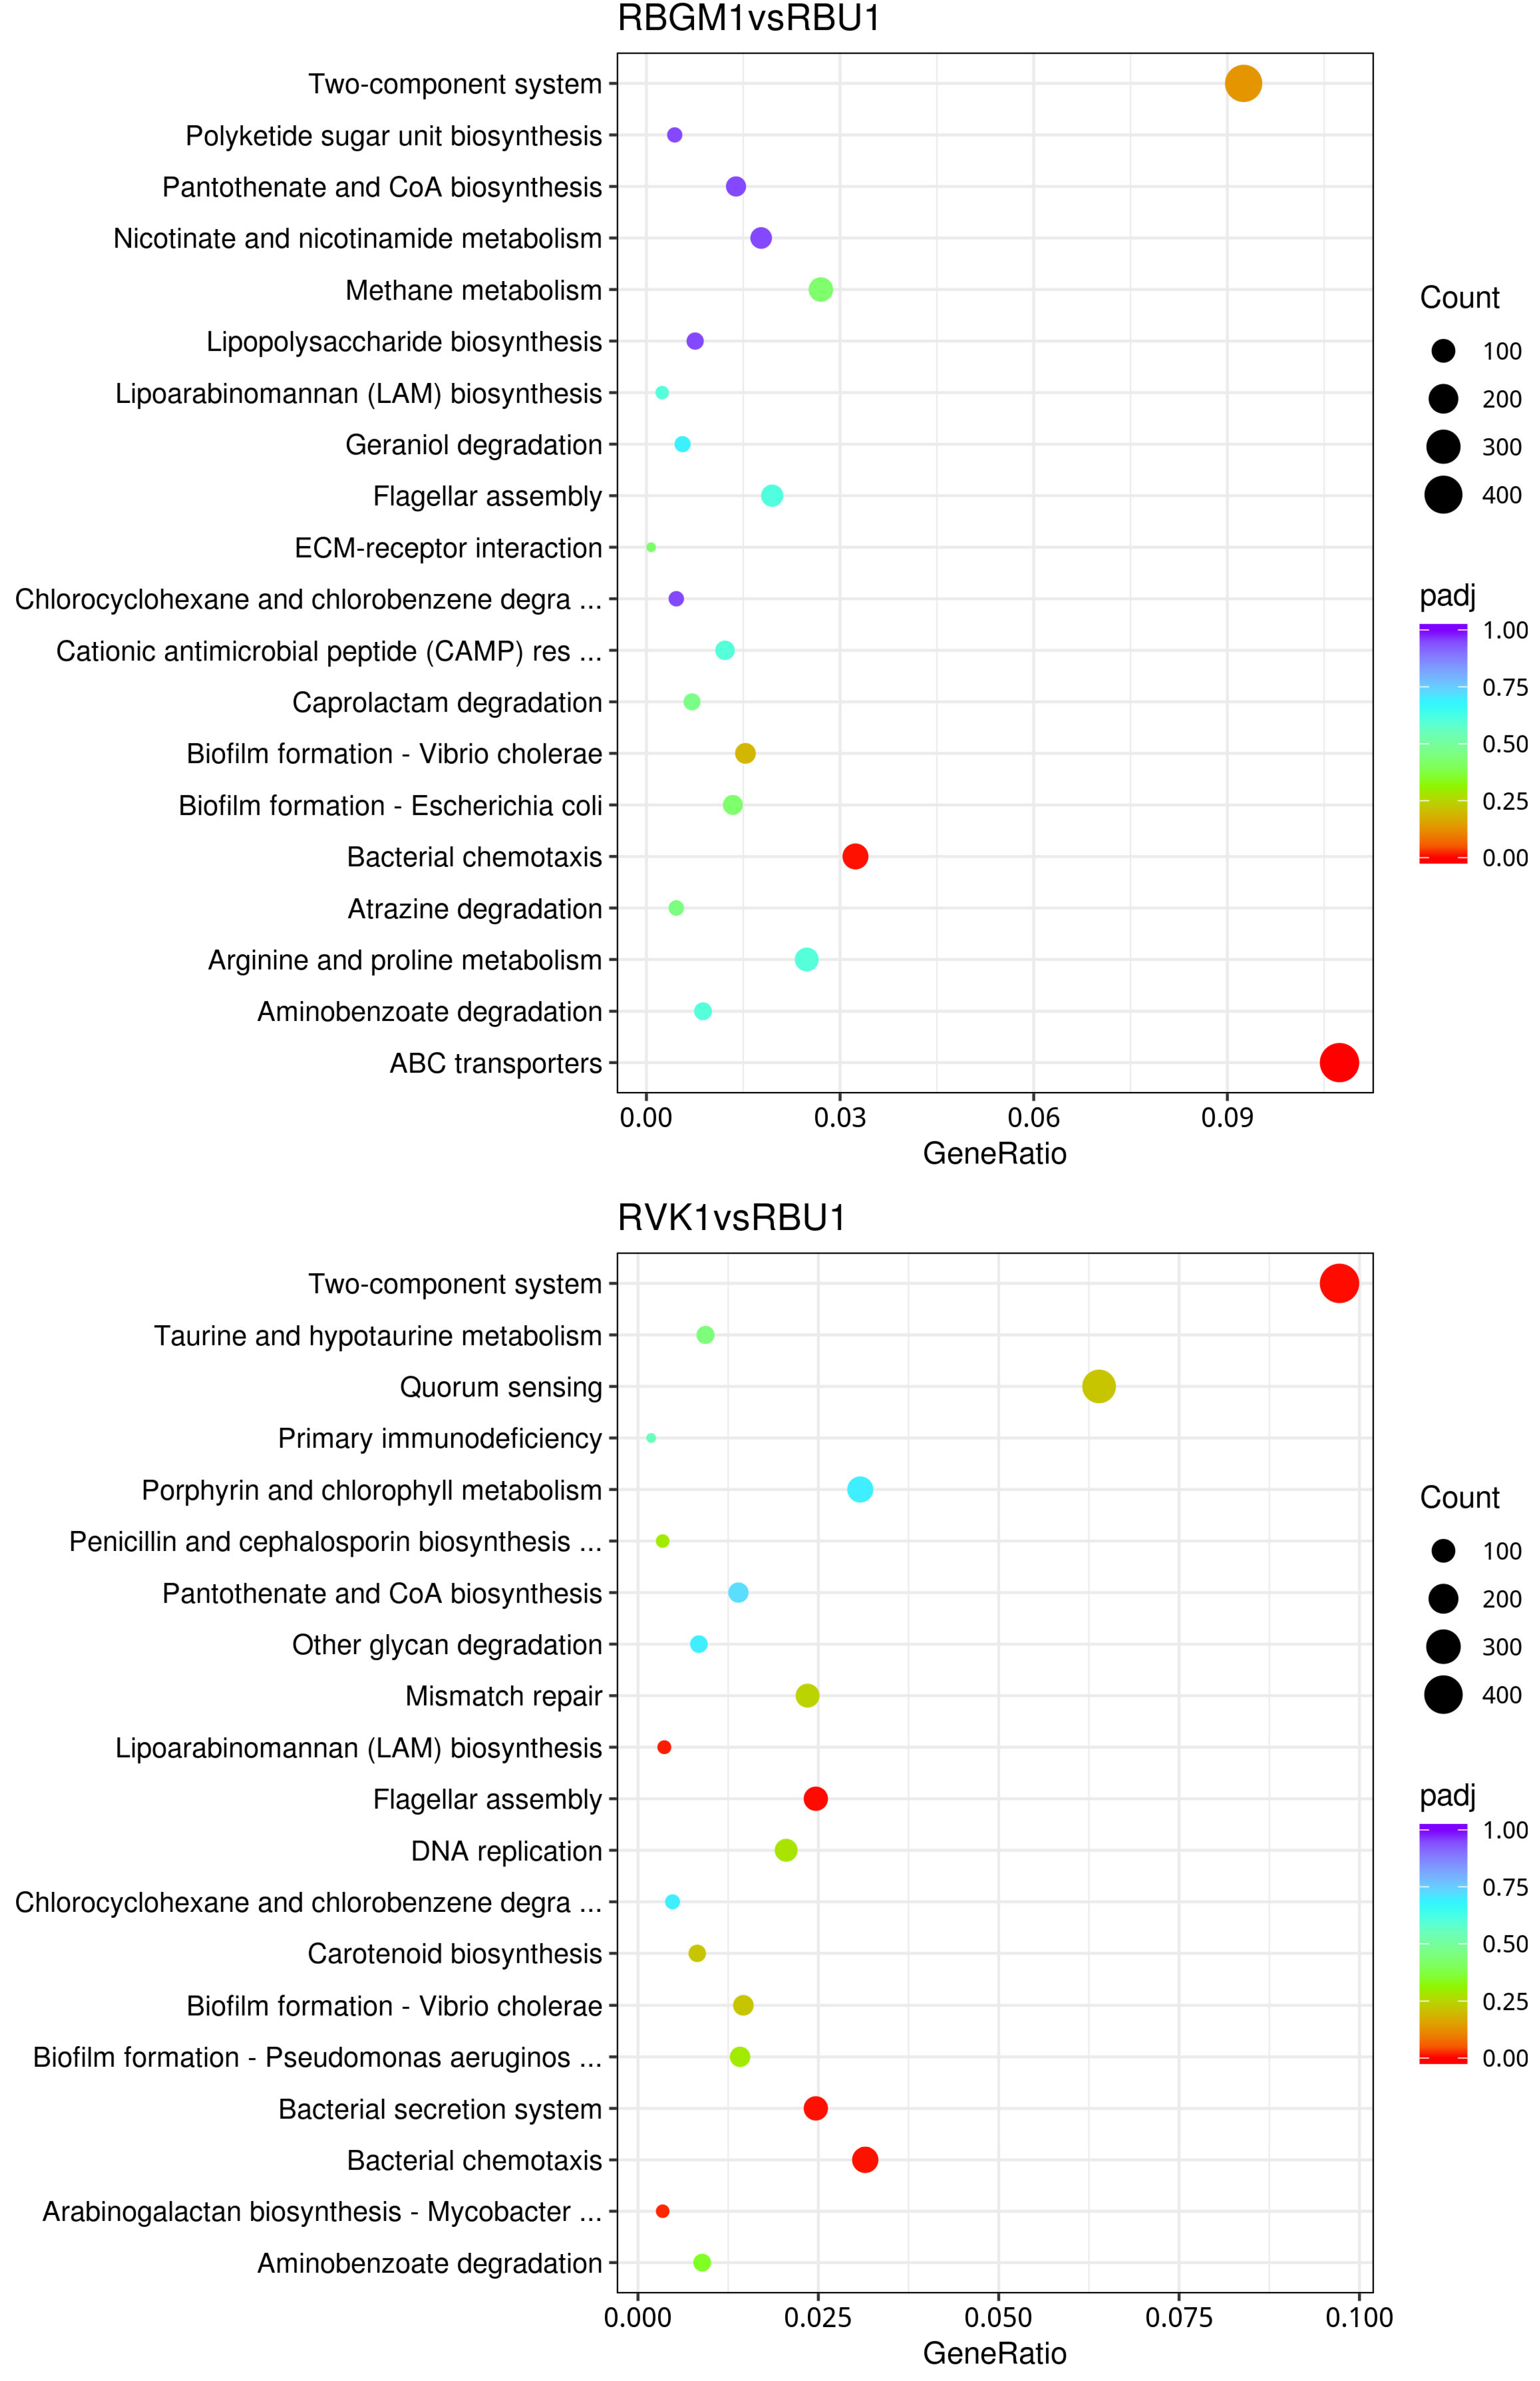

Table 1.
Number and areas where common bean samples were collected.
| County | Bean Phenotype | Sub-County | Number of leaf samples |
|---|---|---|---|
| Bungoma | Rosecoco | Bungoma town | 2 |
| Rosecoco | Bungoma Central | 2 | |
| Rosecoco | Bungoma N/S | 2 | |
| Rosecoco | Bungoma West | 2 | |
| Rosecoco | Kanduyi -kibuke | 3 | |
| Subtotal | 11 | ||
| Busia | Rosecoco | Butula | 5 |
| Rosecoco | Matayos | 5 | |
| Subtotal | 10 | ||
| Kakamega | Rosecoco | Kakamega East | 3 |
| Rosecoco | Kakamega South | 3 | |
| Rosecoco | Kakamega West | 2 | |
| Rosecoco | Lugari | 2 | |
| Subtotal | 10 | ||
| Nandi | Rosecoco | Nandi South (Aldai) | 10 |
| Rosecoco | Subtotal | 10 | |
| Vihiga | Rosecoco | Hamisi | 5 |
| Rosecoco | Sabatia | 5 | |
| Subtotal | 10 | ||
| Total | 51 |
Table 2.
Displaying the number of raw and clean reads, clean base sizes, error rates, and guanine-cytosine ratios for the samples.
Table 2.
Displaying the number of raw and clean reads, clean base sizes, error rates, and guanine-cytosine ratios for the samples.
| sample | raw_reads | clean_reads | clean_bases | error_rate | Q20 | Q30 | GC_pct |
|---|---|---|---|---|---|---|---|
| RVK1 | 37064327 | 35716390 | 10.71G | 0.03 | 97.95 | 94.09 | 48.51 |
| RBU1 | 35629275 | 34974467 | 10.49G | 0.02 | 98.01 | 94.22 | 47.59 |
| RBGM1 | 44496998 | 44004580 | 13.2G | 0.02 | 98.05 | 94.43 | 47.32 |
(1)Sample: the names of samples ;(2)raw.Reads: the original sequencing reads counts;(3)clean.Reads: number of reads after filtering;(4)clean.Bases: clean reads number multiply read length, saved in G unit;(5)error.rate: average sequencing error rate, which is calculated by Qphred=-10log10(e);(6)Q20: percentages of bases whose correct base recognition rates are greater than 99% in total bases;(7)Q30: percentages of bases whose correct base recognition rates are greater than 99.9% in total bases;(8)GC.pct: percentages of G and C in total bases.
Table 3.
Showing an overview of the number of transcripts and unigenes across various length intervals.
Table 3.
Showing an overview of the number of transcripts and unigenes across various length intervals.
| Length interval | 200bp-500bp | 500bp-1kbp | 1kb-2kbp | >2kbp | Total |
|---|---|---|---|---|---|
| Number of transcripts | 737712 | 253527 | 94250 | 50538 | 1136027 |
| Number of Unigenes | 290828 | 157122 | 55200 | 29752 | 532902 |
Table 4.
Overview of the length distribution of transcripts and unigenes:.
| Min_length | Mean_length | Median_length | Max_length | N50 | N90 | Total_nucleotides | |
|---|---|---|---|---|---|---|---|
| Transcript | 251 | 636 | 396 | 37763 | 762 | 293 | 722372701 |
| Genes | 251 | 727 | 470 | 37763 | 873 | 344 | 387683453 |
Table 5.
Display of the referenced databases along with the corresponding category levels and pathway descriptions.
Table 5.
Display of the referenced databases along with the corresponding category levels and pathway descriptions.
| Database Name | Level | Description Of Level |
|---|---|---|
| KEGG | level1 | KEGG pathway level1 include 6 pathway database; |
| KEGG | level2 | KEGG pathway level2 43 sub-pathway database; |
| KEGG | level3 | KEGG pathway id(e.g. map00010); |
| KEGG | KO | KEGG ortholog group (e.g. K00010); |
| KEGG | EC | KEGG EC Number(e.g. EC 3.4.1.1); |
| eggNOG | level1 | 24 function taxa; |
| eggNOG | level2 | ortholog group description; |
| eggNOG | og | ortholog group ID(e.g. ENOG410YU5S); |
| CAZy | level1 | 6 major function classes; |
| CAZy | level2 | CAZy family(e.g. GT51); |
| CAZy | EC | EC number(e.g. murein polymerase (EC 2.4.1.129) |
Disclaimer/Publisher’s Note: The statements, opinions and data contained in all publications are solely those of the individual author(s) and contributor(s) and not of MDPI and/or the editor(s). MDPI and/or the editor(s) disclaim responsibility for any injury to people or property resulting from any ideas, methods, instructions or products referred to in the content. |
© 2025 by the authors. Licensee MDPI, Basel, Switzerland. This article is an open access article distributed under the terms and conditions of the Creative Commons Attribution (CC BY) license (http://creativecommons.org/licenses/by/4.0/).
Copyright: This open access article is published under a Creative Commons CC BY 4.0 license, which permit the free download, distribution, and reuse, provided that the author and preprint are cited in any reuse.


